Abstract
The significance of the micro-geometries on the cutting edge is known from numerous studies conducted in the past. However, the effect of micro-geometry on the wiper facet (also called the wiper edge) is not known. Hence, this paper investigates the effect of different micro-geometries with a focus on geometry variation on the wiper edge of a milling insert on surface roughness and forces in face milling of SAE1070 high-carbon steel. Milling inserts with sharp, rounded, chamfered edges and their combinations were manufactured on the cutting edge and wiper edge for the study. Critical surface quality parameters such as the average surface roughness (Ra), mean depth of surface roughness (Rz), and force components such as radial force (Fx), cutting force (Fy), and axial force (Fz) were evaluated. Metal cutting tests were performed at three different cutting speeds and three different feed rates to study the influence of cutting parameters and the effect of edge geometries on surface roughness. The results were correlated with the force values to understand the machining dynamics. Finite element analysis was performed to evaluate the high and low-stress zones on the insert, workpiece, and chip to understand the metal cutting mechanism of different micro-geometries. The novel finding from the study is that having identical micro-geometries on the cutting and wiper edge is the preferred combination, whereas dissimilar micro-geometries result in reduced surface quality, increased forces, and high stress on the workpiece and chip.
1. Introduction
The surface roughness of materials formed in machining is determined by the micro-geometry of the tool, nose radius, cutting parameters, tool wear, and thermal properties of the work material. The knowledge of these variables and understanding of their interactions is imperative to get a superior finish on the final product. Among these variables, the micro-geometry of the tool plays a major role in determining the stress distribution and tool wear [1]. In terms of cutting parameters, increasing the cutting speed improves the surface finish and decreases the forces, whereas increasing the feed rate reduces surface quality and increases the force [2,3].
Sharp, round (also called ‘honed’ or ‘radiused’), and chamfer (also called ‘T-land’) are the three edge preparation techniques that are used to improve the edge stability, avoid stress concentration on the tool, and divert forces in the desired direction [4]. The combination of tool nose radius and cutting-edge micro-geometry improves the strength of the tool. However, increasing the tool nose radius [5] and cutting-edge radius [6] increases the forces. Other factors such as tool wear, built-up edge, and high temperature generated in machining also affect surface roughness [7,8]. Especially, high temperature could lead to the formation of a white layer, microscopic cracks, and material warpage, which affects the fatigue life of the machined component [8].
Zhao et al. [9,10] compared the performance of a CBN insert with an edge round of 20, 30, and 40 μm in machining AISI52100 steel. From the experimental investigation, they have proven that inserts with a 30 μm edge radius gave better surface finish and reduction in forces, whereas an increase in edge radius increased the tool life. The increase in edge radius also showed a linear increase in the depth of subsurface plastic strain. A similar increase in tool life was also reported by Fulemova and Janda [11] in the milling test performed on ferrite–martensite steel. They have reported that tools with a 15 μm cutting edge radius gave superior surface finish and lowest tool wear when compared to the tools with 5 and 10 μm edge radius. An increase in cutting force and axial forces is seen for tools with larger cutting-edge radius in dry, minimum quantity lubricant (MQL), and cryogenic coolant conditions in machining titanium alloys [12]. In the case of tools with a chamfer and rounded cutting edge, the inserts with a chamfered edge showed significantly higher axial forces and stress on the machined surface [13].
Surface roughness analysis is also vital as it is one of the critical factors responsible for the tool wear behavior and affects the fatigue life of workpiece [14]. The symmetricity of the cutting edge radius is defined by the term K-factor [15]. Shiva Pradeep et al. [16,17] have proven that apart from the size of the cutting-edge radius, the K-factor also plays a key role in determining the surface finish. They have reported that inserts with K > 1 (reverse-waterfall or trumpet honed edge) gave lesser and stable Ra and Rz values when compared to inserts with symmetric edge hone (K = 1). However, Ventura et al. [18] have found that micro-geometry affects only the feed force and passive force, whereas the specific cutting energy, temperature, and tangential force are not affected. In the turning study conducted using inserts manufactured with different K-factors, they have also reported that surface roughness is not affected by the variation in edge symmetricity.
The detailed literature study shows that up to now, the effect of micro-geometry on the cutting edge was studied by many researchers, whereas the geometry variation on the wiper edge (or wiper facet) was not investigated in detail. Hence, the novelty of the present study is to focus on analyzing the combined effect of different micro-geometries on the cutting edge and wiper edge. Uncoated face milling inserts with different micro-geometries were designed and manufactured for the study and the average surface roughness (Ra), mean depth of surface roughness (Rz), and its interaction with the radial, tangential, and axial forces are the phenomena that are investigated. As it is highly challenging to predict the effect of cutting parameters and micro-geometry on the surface integrity, microstructure, and their reaction on various point of the tool, a combination of experimental and numerical techniques was used to understand the mechanism [19]. Hence, the third wave systems’ AdvantEdge 7.4 finite element analysis software was used to evaluate the high and low-stress zones on the insert, workpiece, and chip to understand the metal cutting mechanism of different micro-geometries. The software helps to simulate the metal cutting operation and understand the machining mechanism in a better way [20]. The study gives an insight into the reactions that the tool experiences due to the variation in micro-geometries in cutting and wiper edges, which would help in optimizing the micro-geometry for improved performance.
This paper is organized as follows. Section 1 introduces the background of the subject, literature review, and objective of the investigation. Section 2 describes the selection of work material and its properties, details of the tools with different micro-geometries on the cutting and wiper edge, and the machining parameters used for the investigation. Section 3 is divided into two subsections. The first part elaborates the experimental results showing the effect of different micro-geometries on surface roughness, ANOVA study, and numerical simulations to understand the mechanism that is responsible for the variation in surface roughness. The second part explains the effect of different micro-geometries on forces, ANOVA study to evaluate the main effect and interaction effect for forces, and numerical simulations to comprehend the mechanism that is responsible for the variation in forces. Finally, Section 4 presents the conclusions.
2. Materials and Methods
2.1. Work Material
SAE1070 is a high-carbon steel with very good wear resistance, which makes it suitable for railways and machine tool applications. The wear property of the material makes it a preferred candidate in the manufacturing of railroad rails, rail wheels, agricultural equipment, hand tools, and heavy machine parts. A rectangular 1070 steel block of dimension 300 × 150 × 65 mm3 and hardness of around 90 HB was used for the study, and its chemical composition as analyzed before the testing is shown in Table 1.

Table 1.
Composition of SAE1070 steel used for testing.
2.2. Tool Sample Preparation
The single-sided face milling inserts with ISO nomenclature SPAN1203 were manufactured in WC-11%Co tungsten carbide substrate. After the inserts are pressed and sintered, the cutting edge was ground to get the desired micro-geometry. The details of the inserts and their micro-geometry details are shown in Table 2 and Figure 1.
Table 2.
Micro-geometry detail of the inserts.
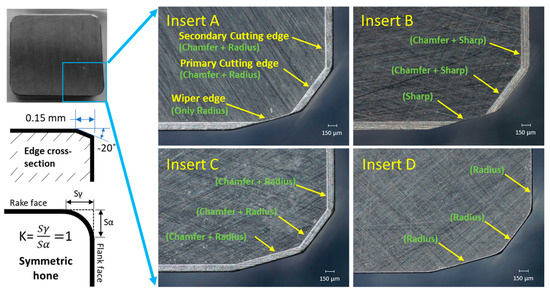
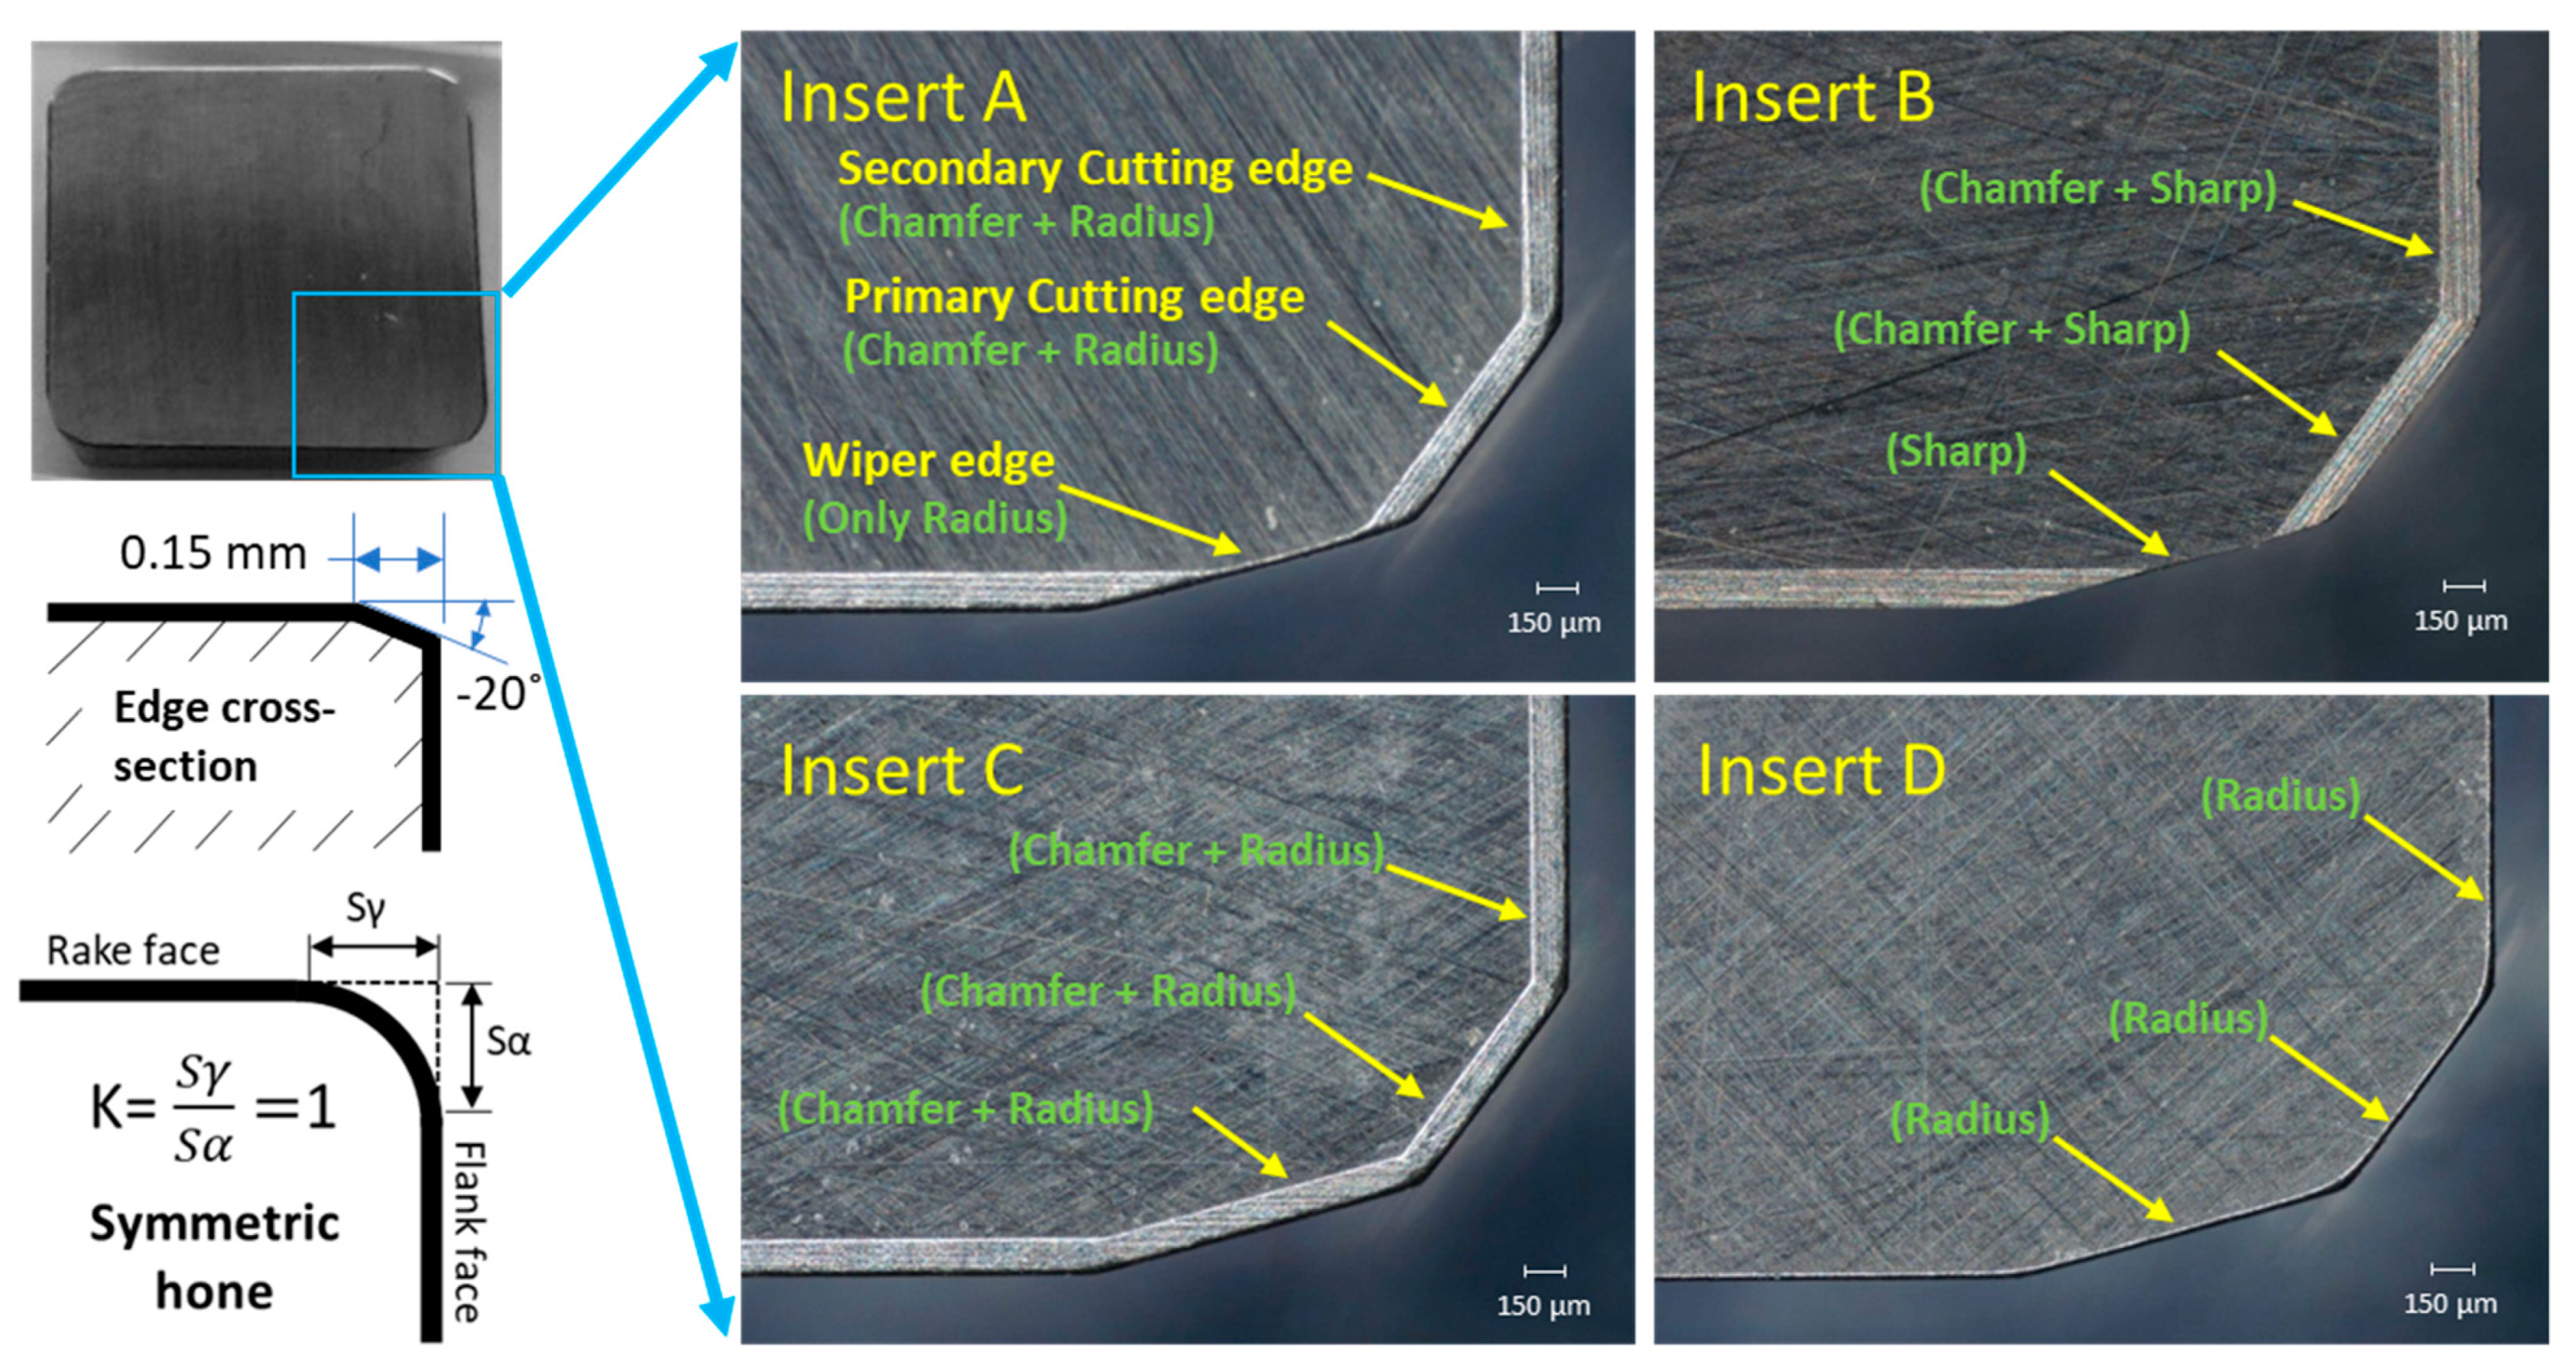
Figure 1.
Microscopic pictures of the inserts with different micro-geometry.
The chamfer was machined on the cutting edge with a computer-controlled grinding wheel, and an edge round (edge hone radius) was made by the brush-honing process using a silicon carbide brush. The edge round value was maintained at around 40 µm for Inserts A, C, and D, and the chamfer was ground with −20° inclination angle and 0.15 mm width for Inserts A, B, and C. The symmetricity of the edge-hone (also called as K-factor) was maintained at around 1.0. After the top, bottom, and periphery were ground, no additional edge round operation was performed on Insert B, so that the cutting edge remains sharp. However, even a “sharp” edge cannot be perfectly sharp, as it has a natural roundness to it. So, the typical edge hone radius on the sharp edge was around 5 µm. The wiper facet length was maintained as 1.4 mm for all the four insert styles. For the experimental purpose, the insert with a radiused chamfer on the cutting edge and only radius on the wiper edge is named as Insert A. The insert with chamfer on the cutting edge and a sharp profile on the wiper edge is named as Insert B. The insert C has a radiused chamfer on both the cutting edge and wiper edge, whereas insert D has only a radius on both cutting and wiper edges. This various combination of edge geometries selected for the study ensures that all the possible combinations of micro-geometries were tested and compared to understand the working principle of each design.
2.3. Machining Condition
Face milling tests were performed at three different cutting speeds of 70, 90, and 110 m/min and three different feed rates of 0.10, 0.15, and 0.20 mm/tooth without coolant as recommended in the tool manufacturer’s catalog. A constant axial depth of cut of 2 mm and radial engagement of 50 mm was maintained for all the speed and feed combinations. The depth of cut was selected as 2 mm so that both primary and secondary cutting edges are in engagement during cut.
A face milling cutter with a diameter of 80 mm was used for the testing on a Mazak-200 machining center. The down milling strategy was used for the study, and the orientation of the insert in the milling cutter is shown in Figure 2. The fly cutting technique was used to avoid the influence of axial run out on surface roughness. The other machining variables and cutting parameters used for the testing are shown in Table 3.

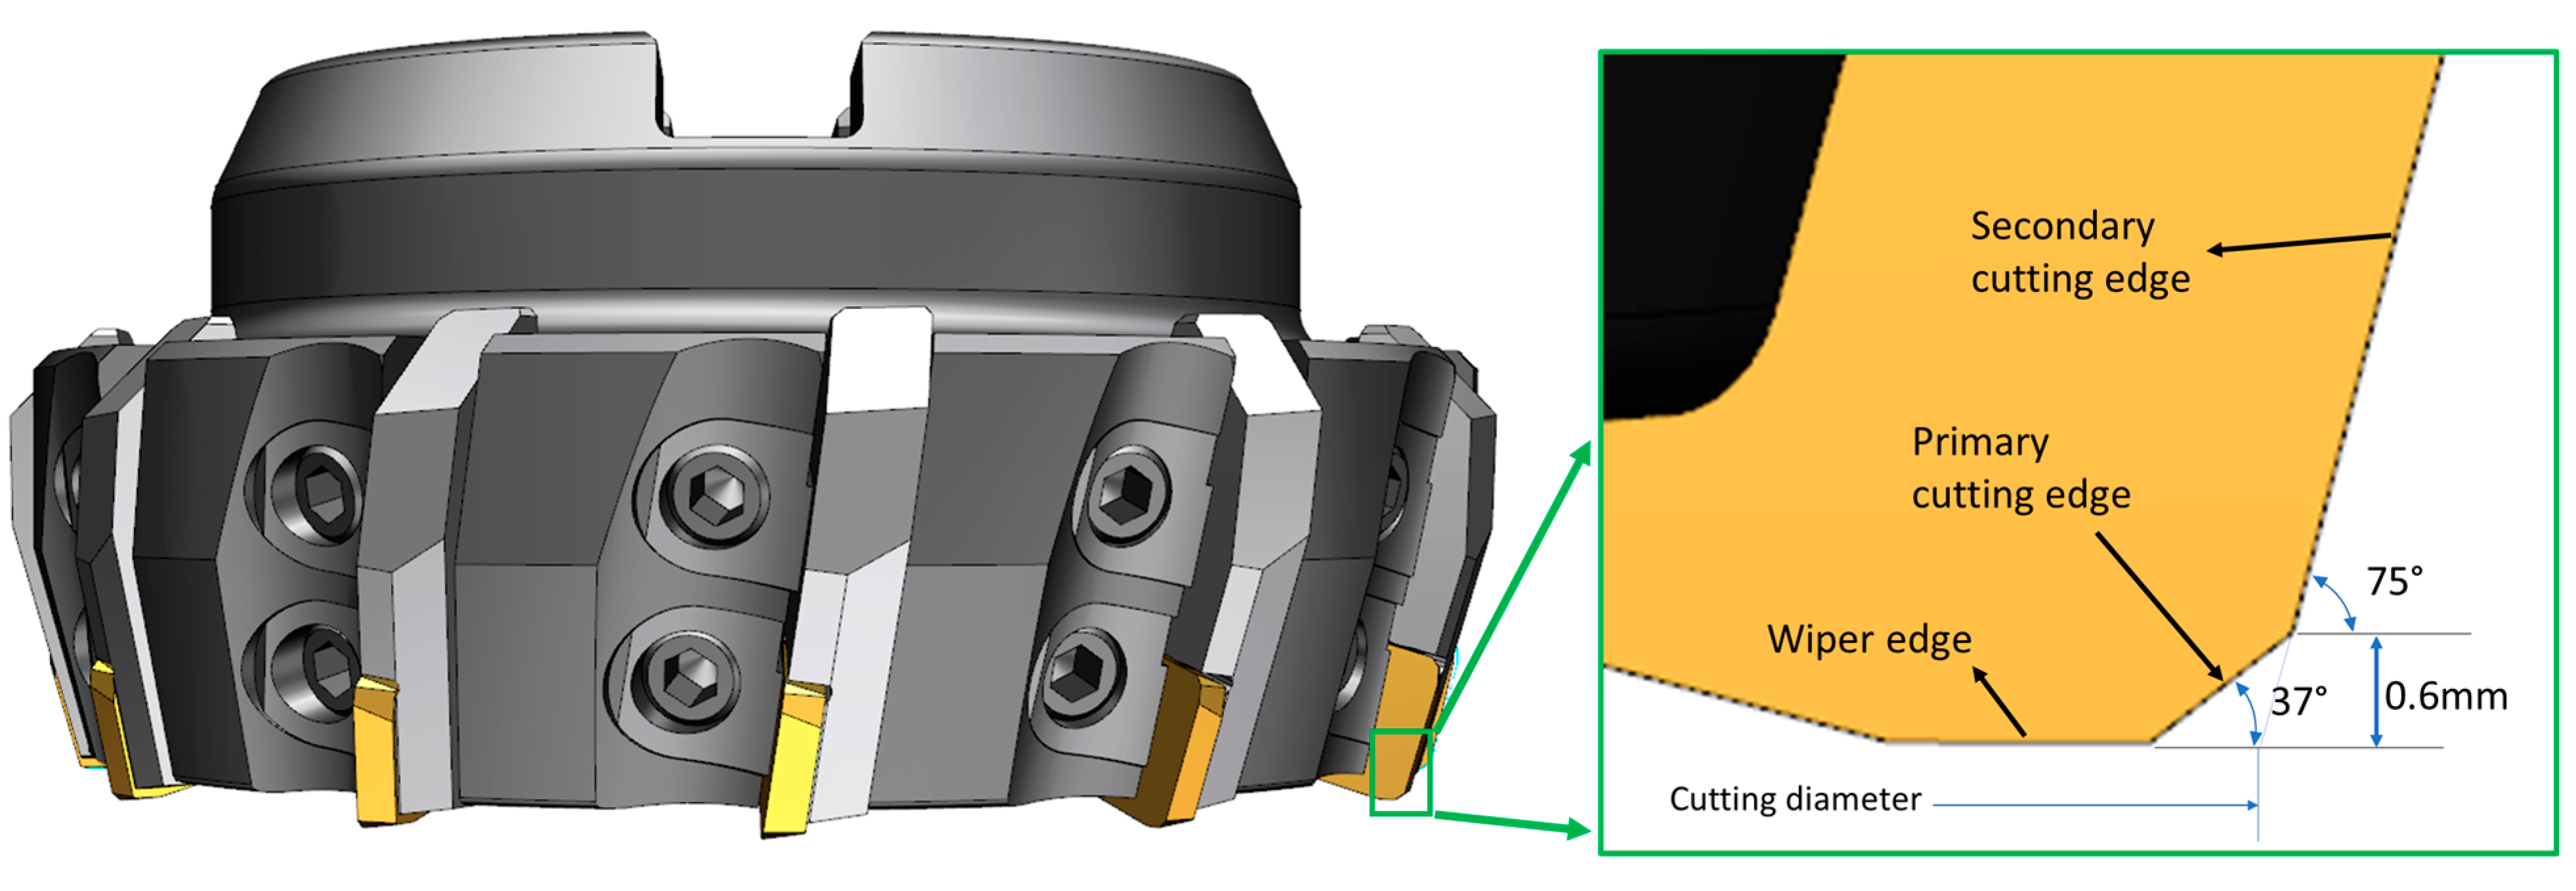
Figure 2.
CAD model showing the orientation of insert in the milling cutter used for the study.
Table 3.
Machining condition.
The thickness of the chip formed in milling depends on the lead angle (KAPR) and radial engagement of the cutter with workpiece. The chip gets thinner at higher lead angles, as it is distributed over a greater length of the cutting edge. As the insert used for the study has primary and secondary cutting edges, there is a variation in the maximum chip thickness (hex), which is theoretically calculated using the formula,
So, for a face milling cutter with a 37-degree lead angle and feed of 0.1 mm/z, it is calculated as,
Hence, the calculated chip thickness for the test inserts for the selected depth of cut is shown in Table 4.
Table 4.
Chip thickness as a function of lead angle.
The average surface roughness (Ra) and the mean depth of surface roughness (Rz) values were measured on the workpiece at the entry, middle, and exit, using a Mitutoyo Surftest SJ-210 portable surface roughness tester, and the average of three values was taken for further evaluation. A Kistler 9255C 3-axis stationary dynamometer was used for the force measurement, and a Type 5697A1 DAQ system and DynoWare software were used for data acquisition and data processing.
3. Results and Discussion
3.1. Surface Roughness
The Ra and Rz values measured after each experiment at different machining parameters for all the four varieties of inserts are tabulated together in Table 5.
Table 5.
Surface roughness for varied cutting speed and feed.
The measured surface roughness values are shown in graphical form in Figure 3 and Figure 4 to compare and understand the behavior of each insert.
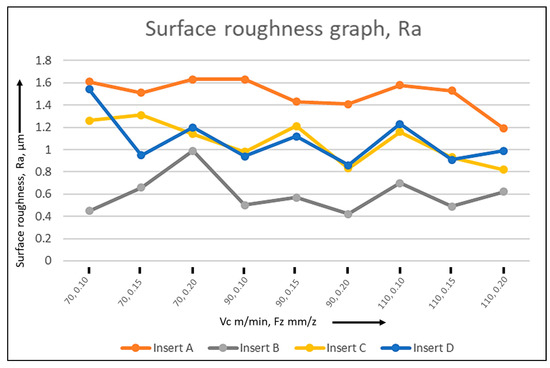
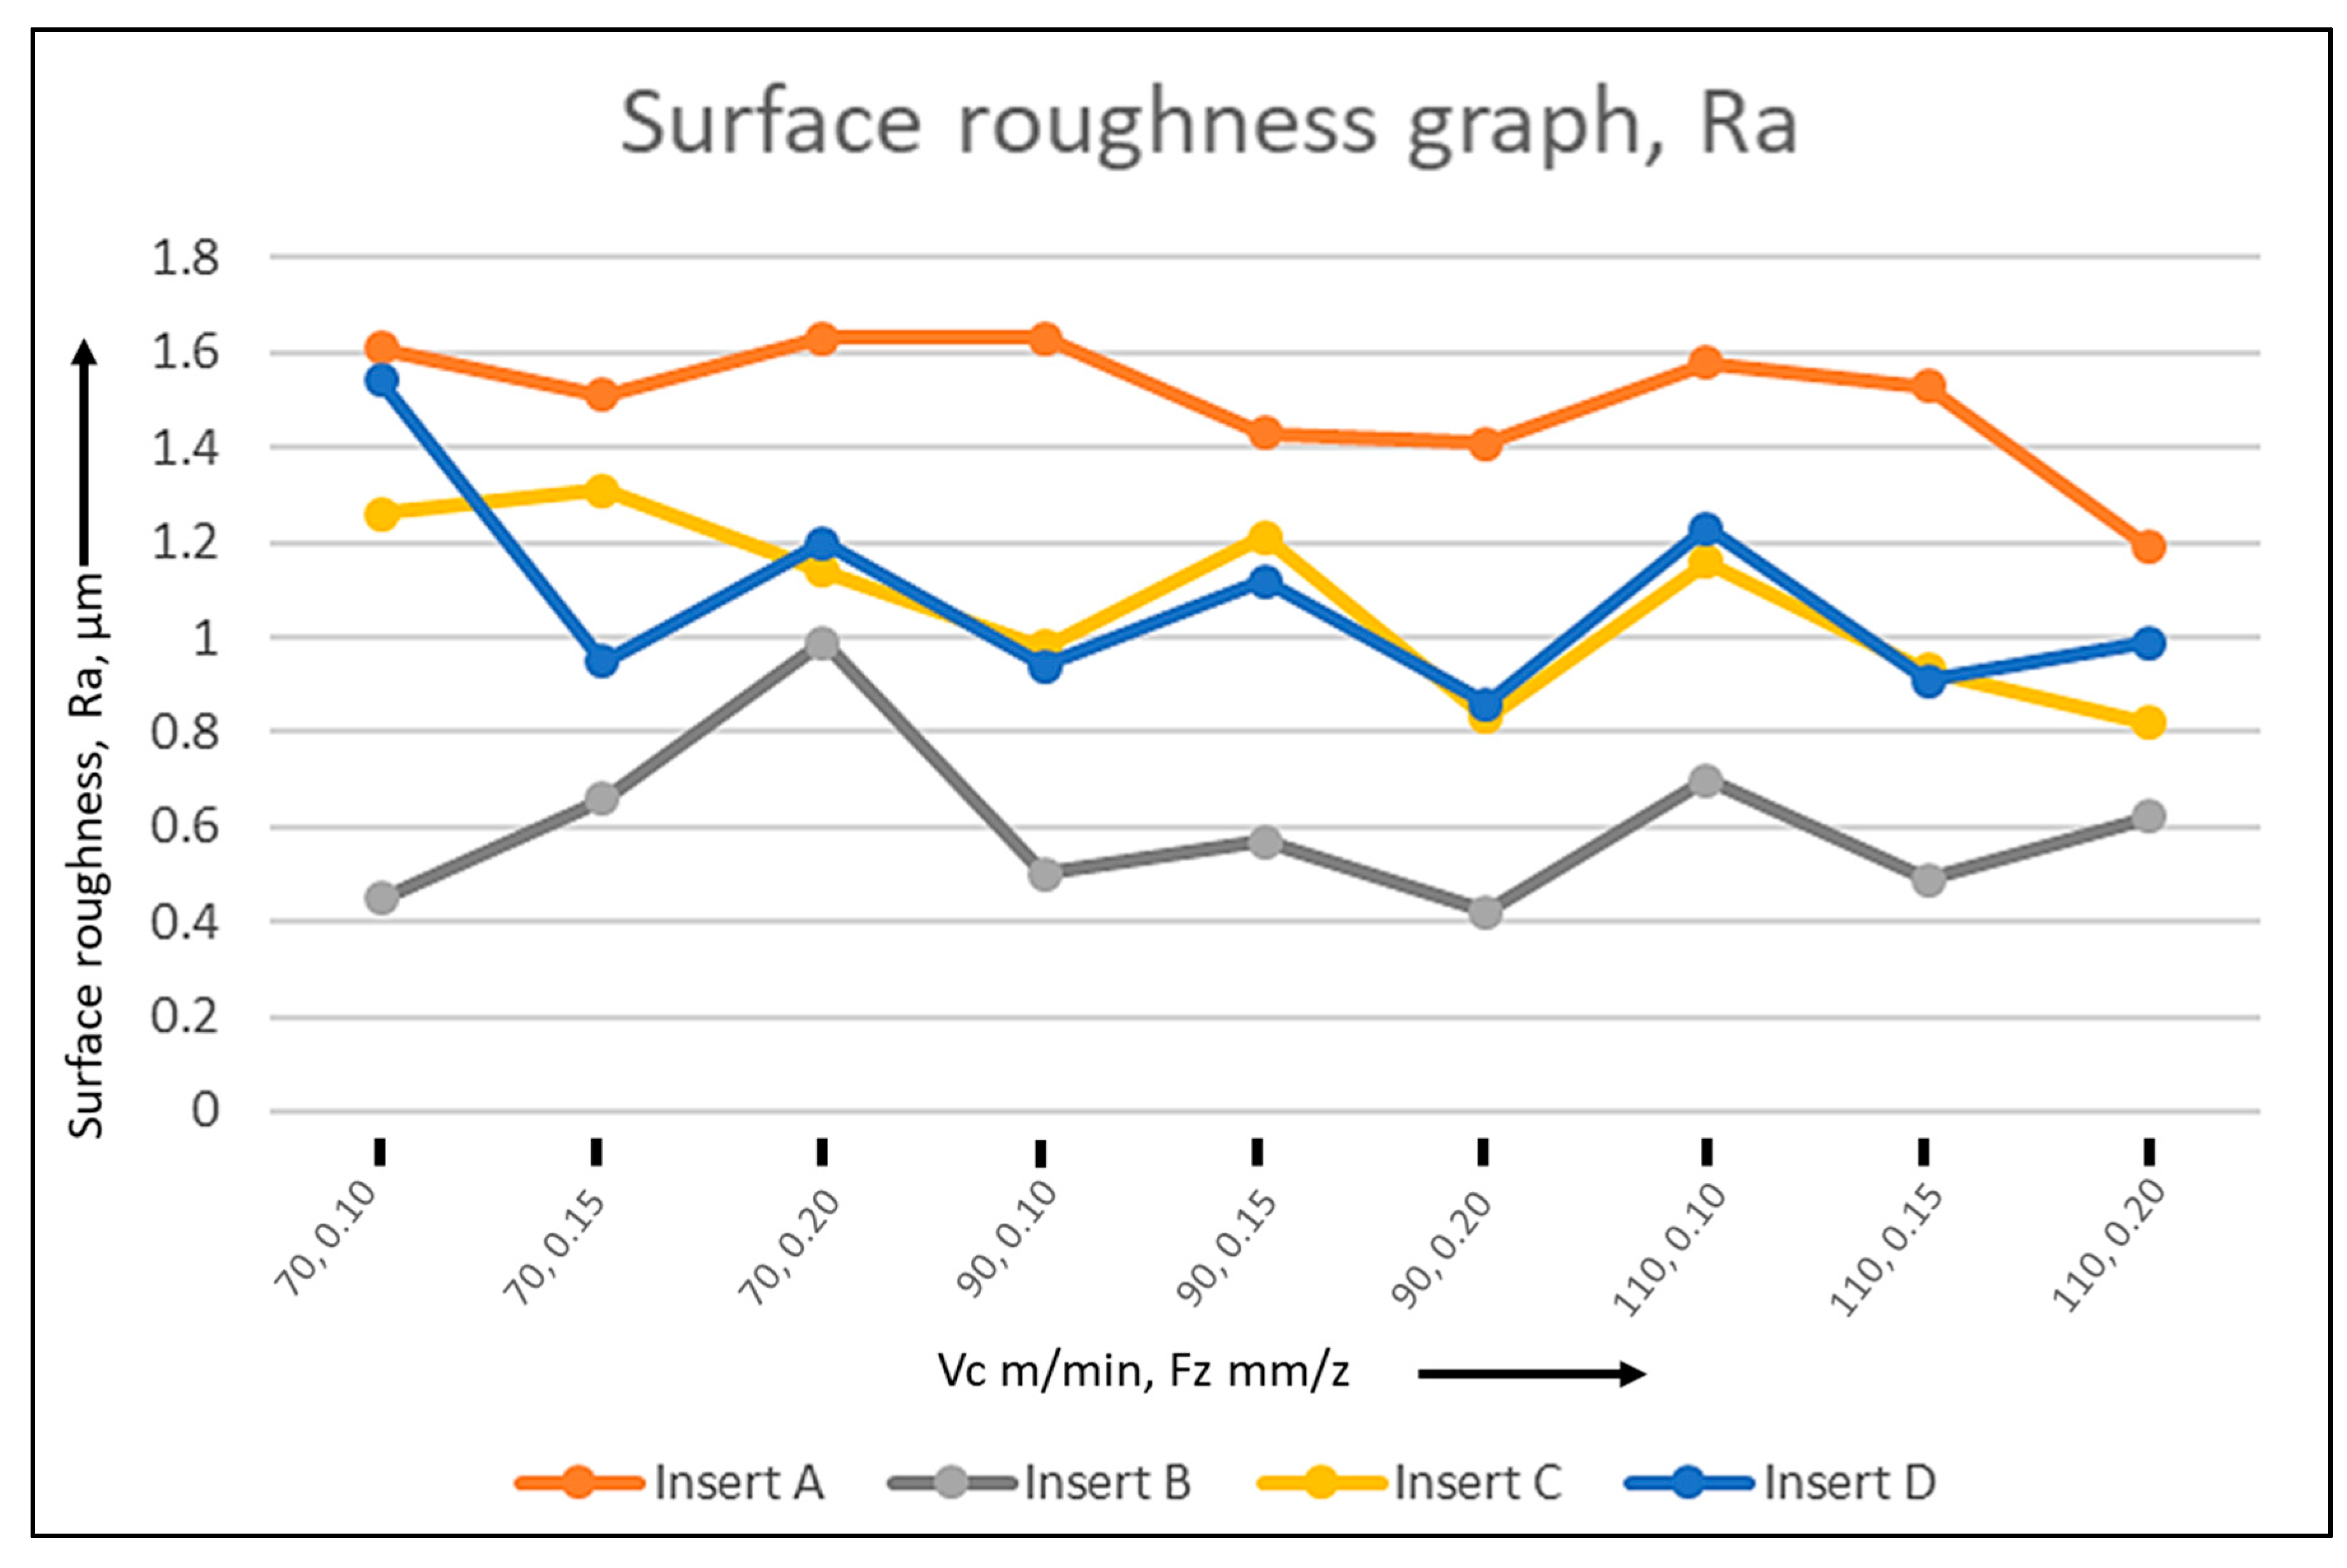
Figure 3.
Average surface roughness (Ra) of the tested inserts.
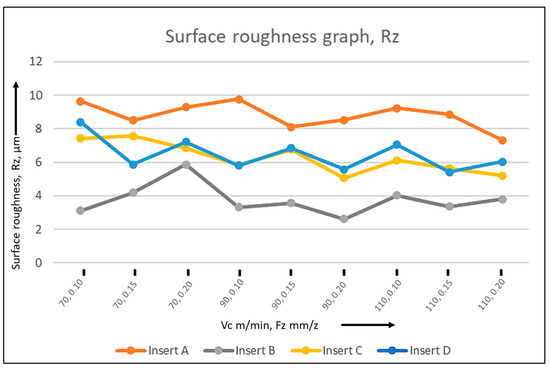
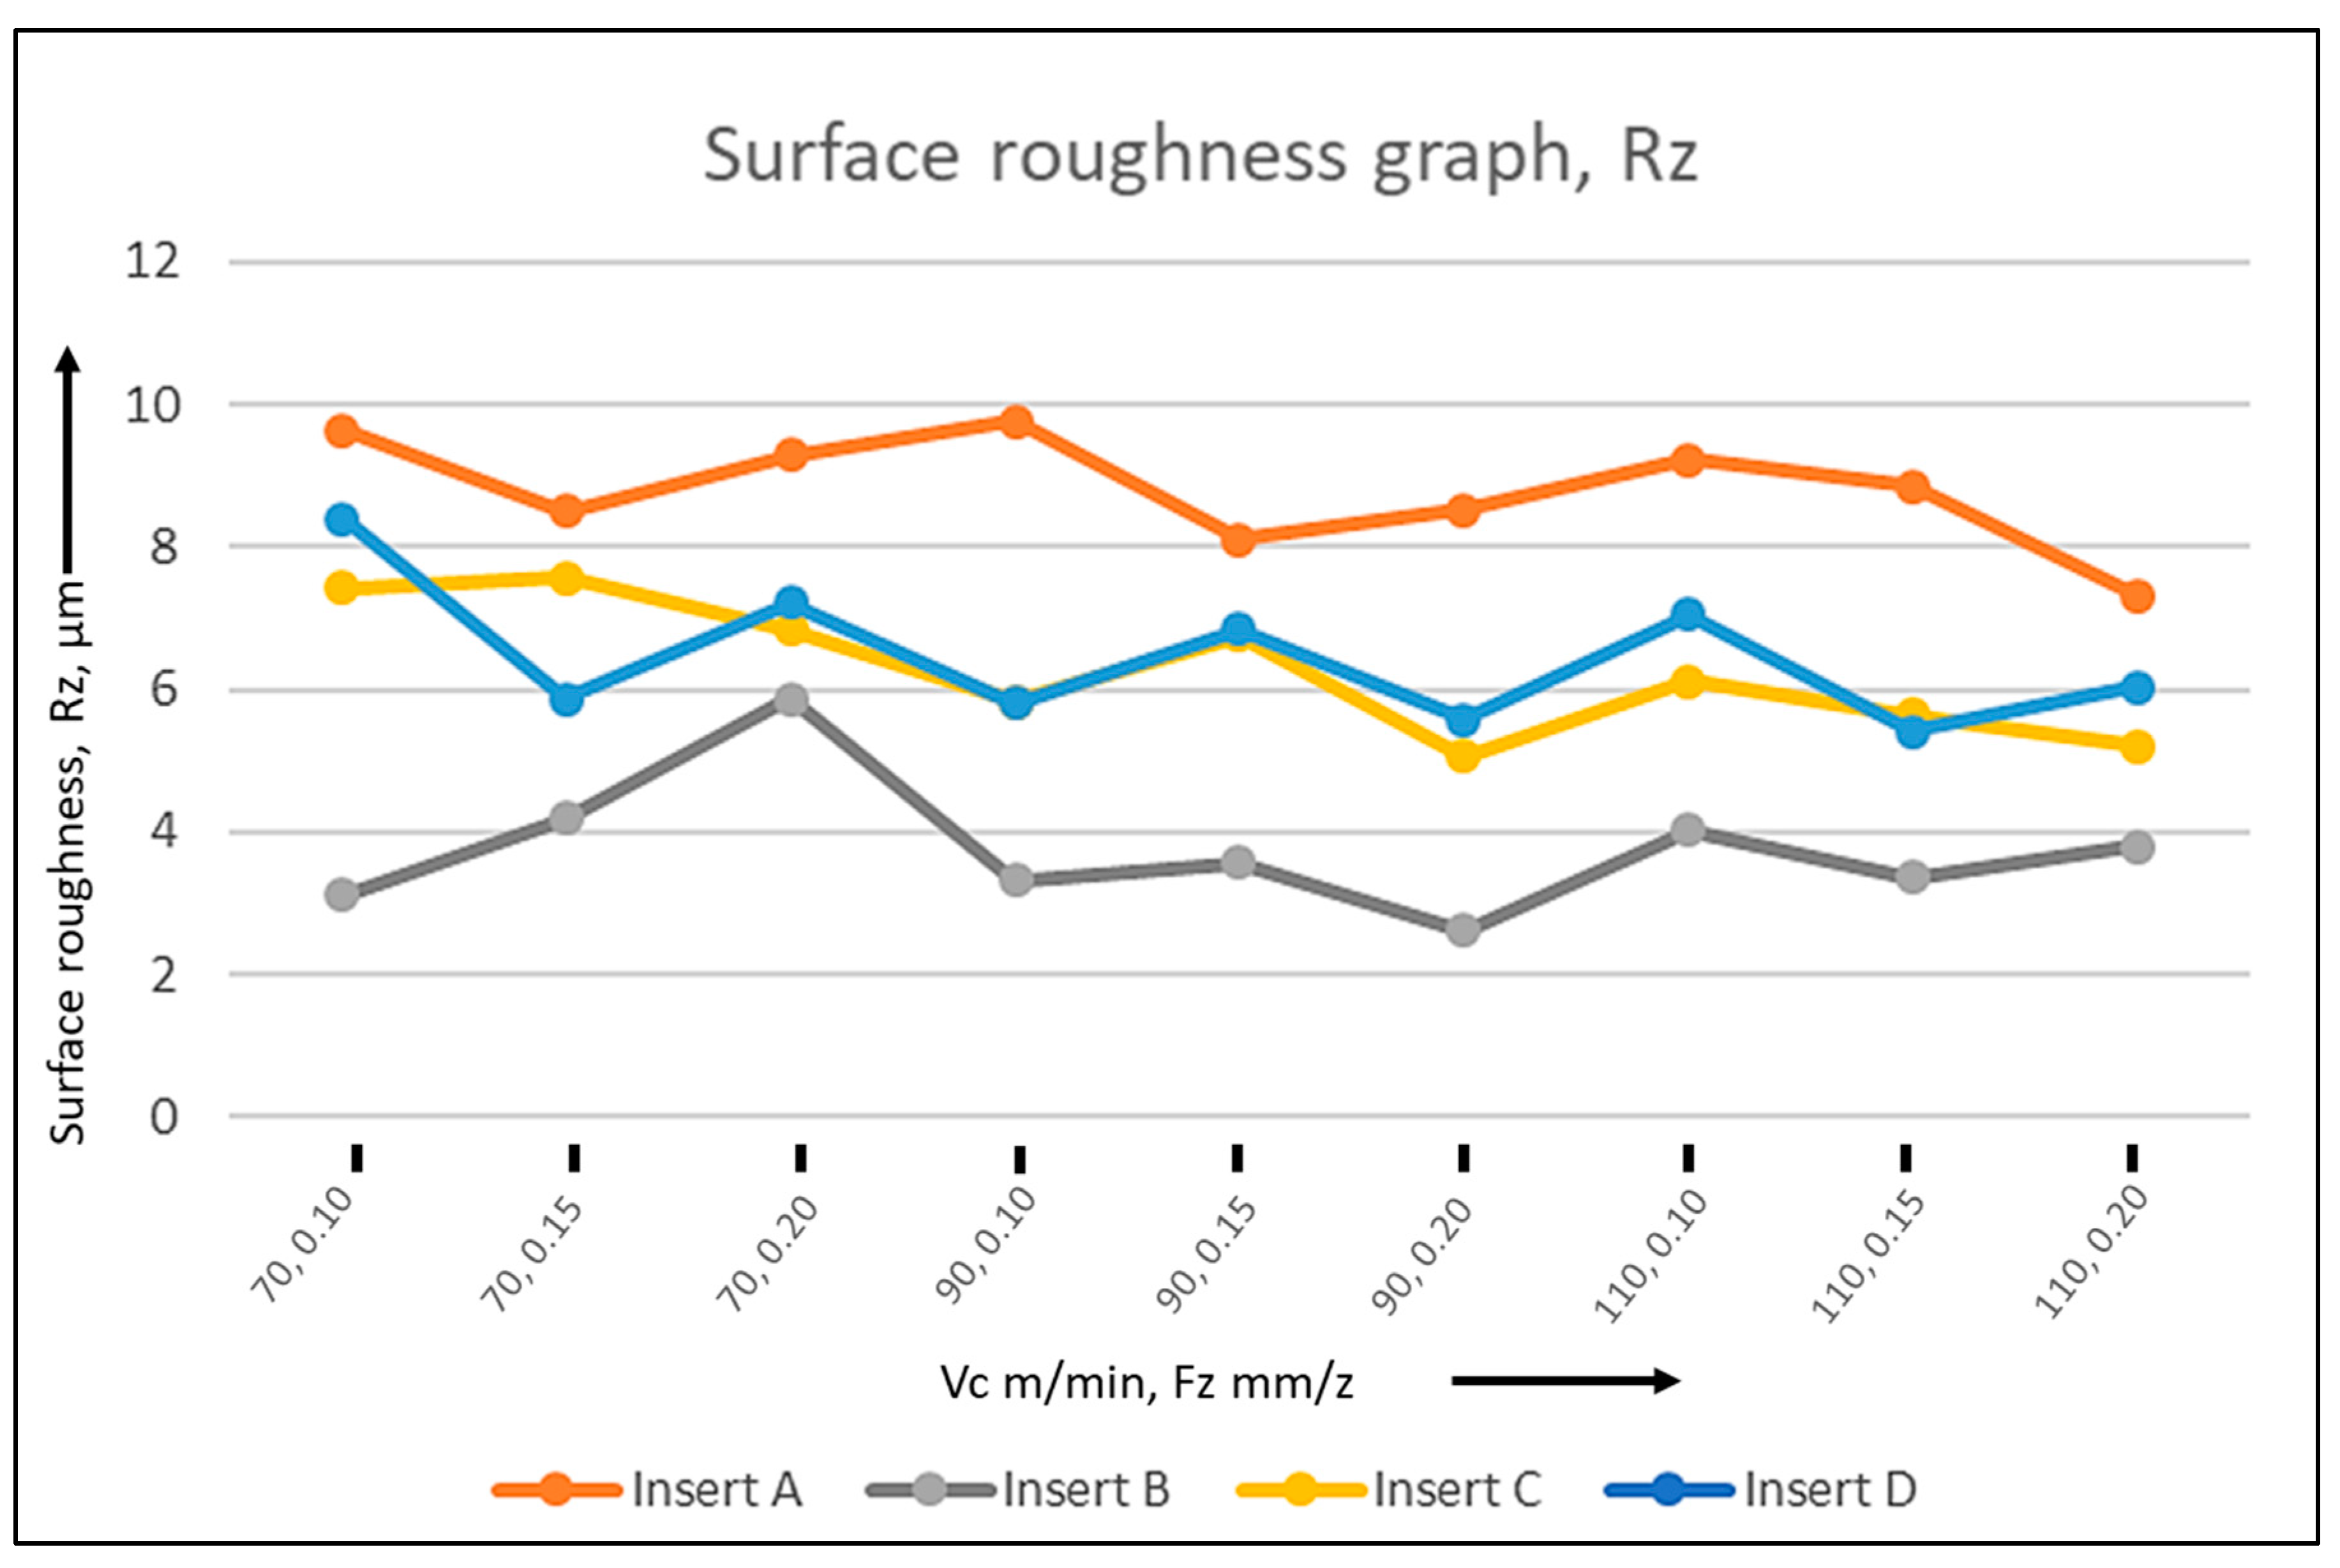
Figure 4.
Mean depth of surface roughness (Rz) of the tested inserts.
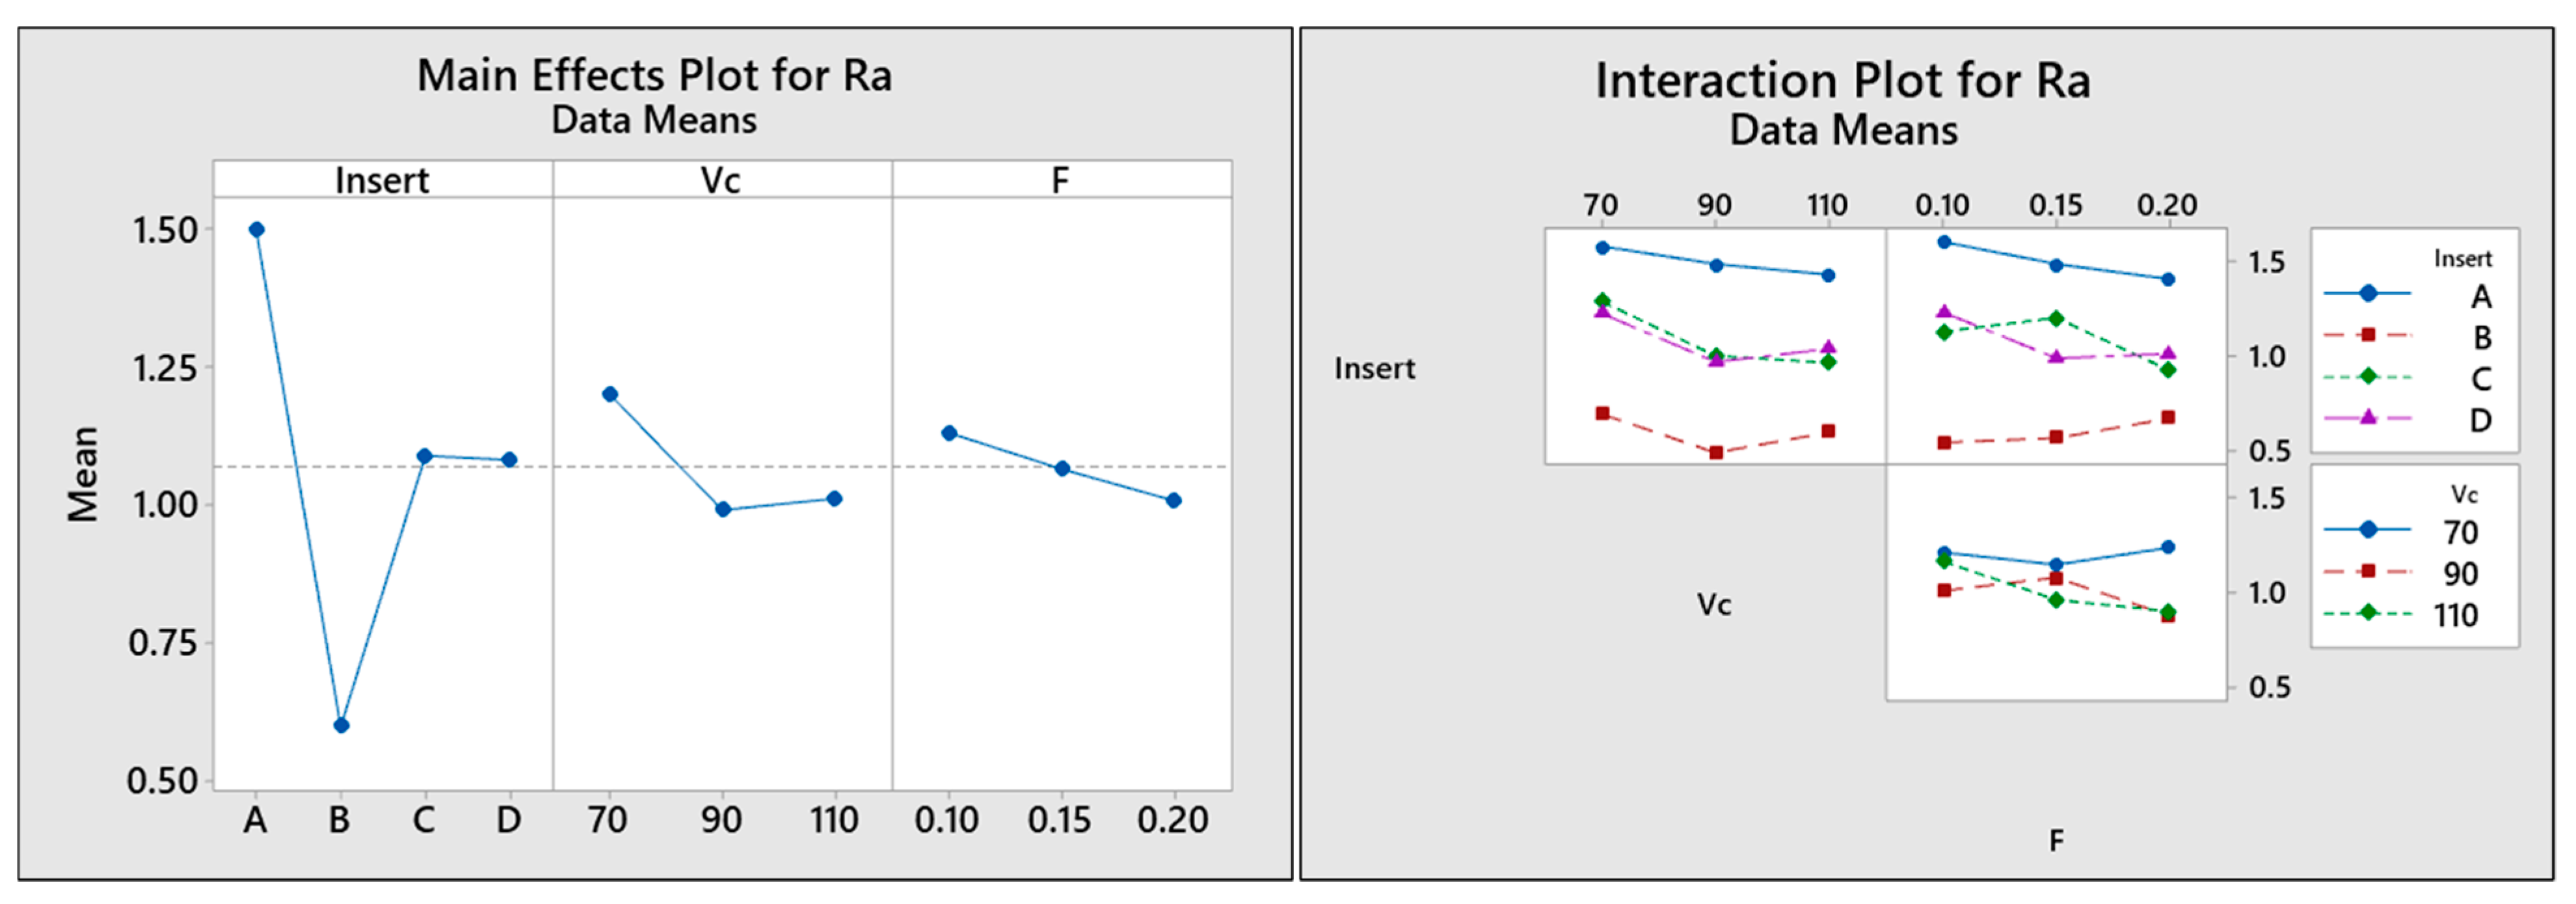
From the graphs (Figure 3 and Figure 4), it is evident that Insert B (sharp chamfer on the cutting edge and sharp on the wiper edge) gives the lowest Ra and Rz values (lower the better), whereas Insert A (radiused chamfer on the cutting edge and radius on the wiper edge) gives the highest Ra and Rz values. There is a very less or negligible difference in the surface roughness values produced by both Insert C and Insert D. Minitab 19 software was used to perform full factorial general linear model Analysis of Variance (ANOVA) study and to understand the significance of each variable on the surface roughness. The main effect and interaction plot of Ra and Rz are shown in Figure 5 and Figure 6, respectively. ANOVA analysis for Ra and Rz are shown in Table 6 and Table 7, respectively.
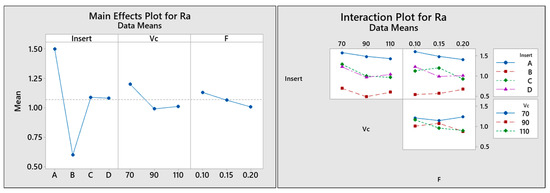
Figure 5.
Main effect and interaction plot for Ra.
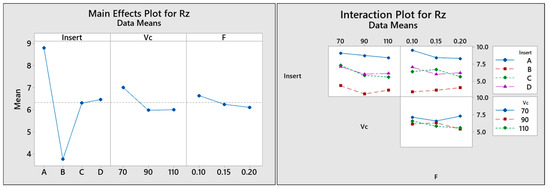
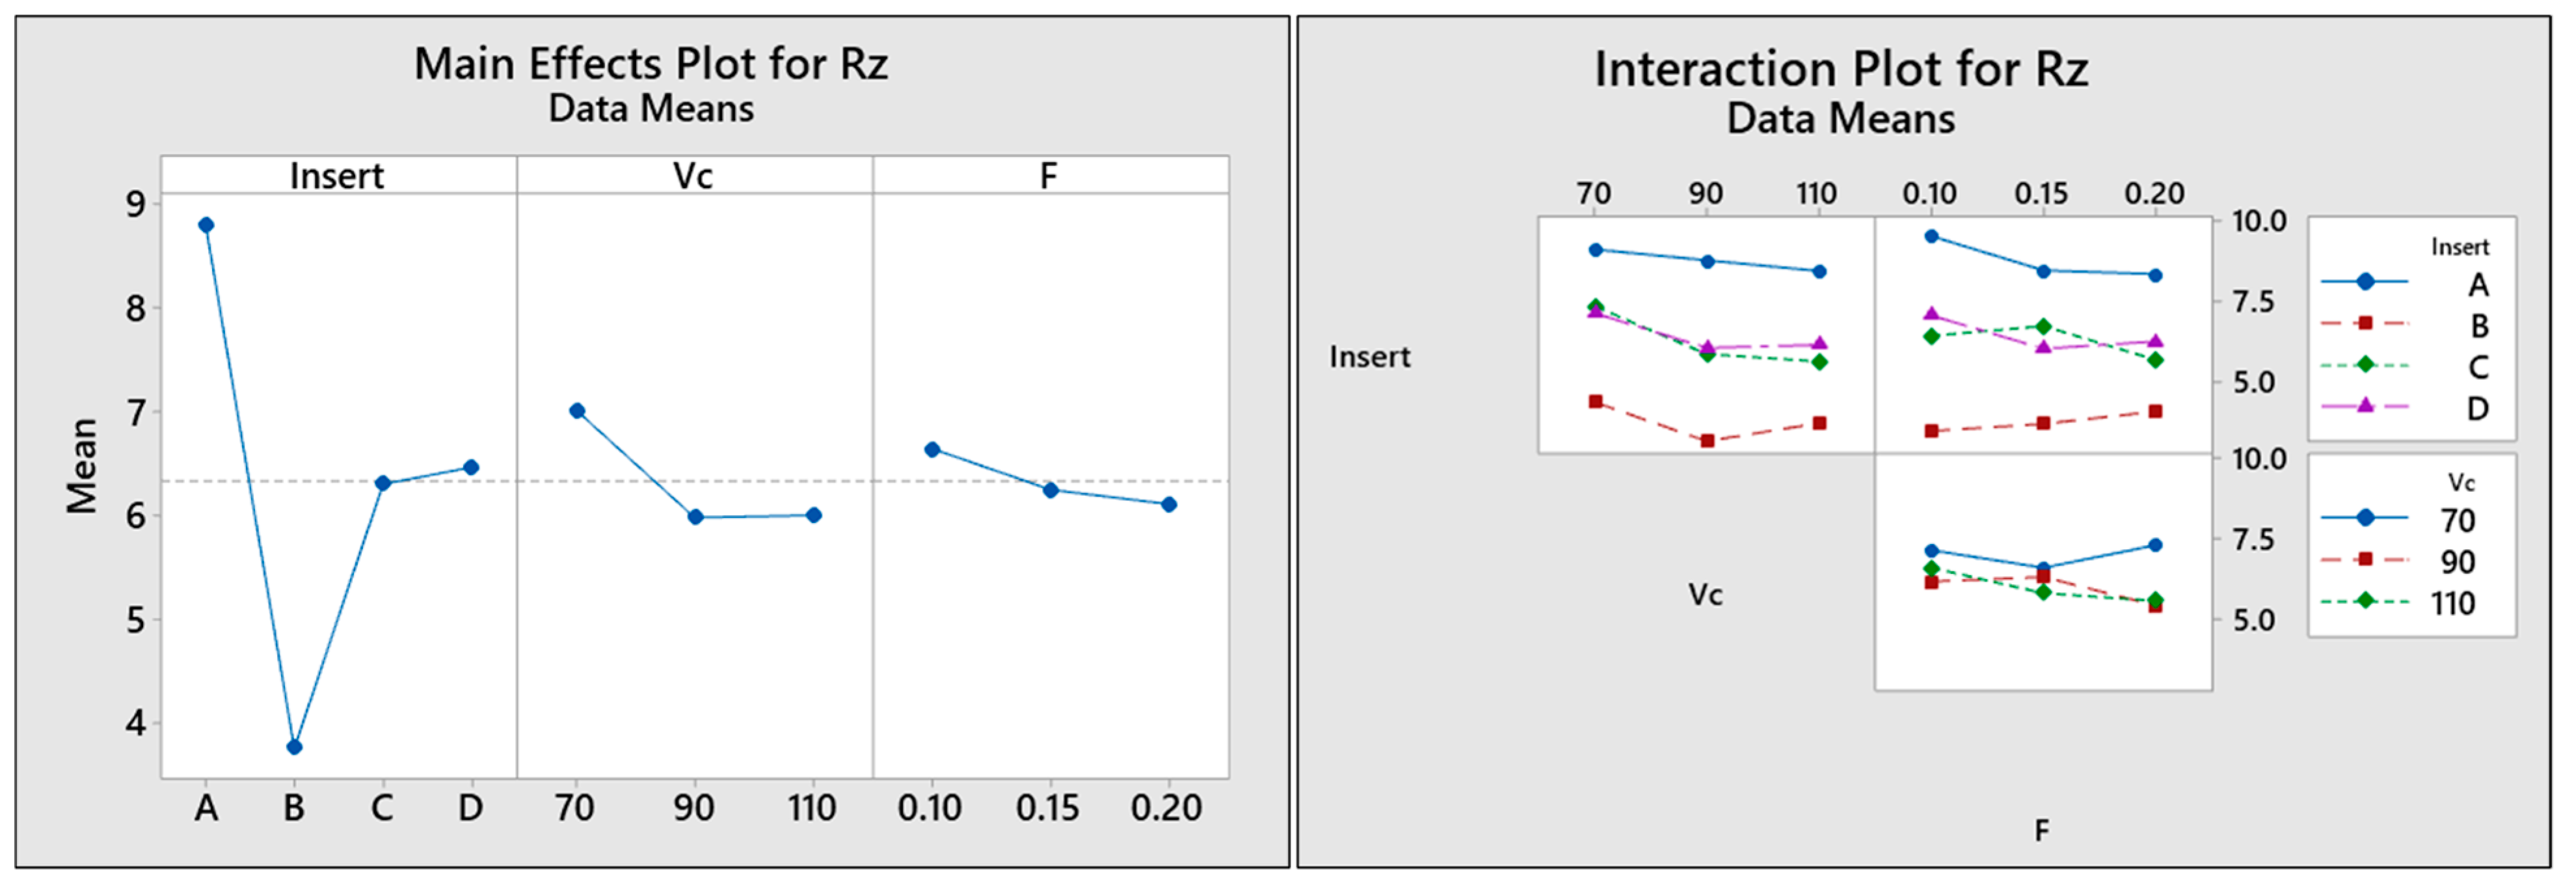
Figure 6.
Main effect and interaction plot for Rz.
Table 6.
ANOVA and significance for Ra.
Table 7.
ANOVA and significance for Rz.
From the main effect and interaction plots (Figure 5 and Figure 6), it can be interpreted that Insert B gives the superior surface finish values, whereas Insert A produces the least quality surface, which is in line with the trend seen in the Figure 3 and Figure 4. The ANOVA table (Table 7) also confirms that the micro-geometry on the cutting and wiper edge has the highest significance of around 76% and 80.9% in determining the Ra and Rz values respectively followed by cutting speed with a significance of 6.65% and 5.95% respectively. Theoretically, the feed rate has a higher impact on the surface roughness rather than the cutting speed [21]. However, surprisingly, feed is seen as the third significant factor, which could be due to the presence of the wiper edge on all the four inserts, which tends to flatten the feed lines or peaks formed during cutting. The presence of a wiper facet on all the inserts and identical cutting condition used for the tests reconfirms that the variation in surface roughness is due to the variation in micro-geometry.
Based on the size and shape of the micro-geometry, three principal mechanisms occur on the tool–workpiece contact area. They are chip formation, elastic deformation, and compression of work material on the machined surface (also called as ploughing). Shearing results in a major portion of material getting separated from the workpiece and moving upward as the chip, while the rest of the material either undergoes elastic deformation or gets compressed onto the surface [22]. Based on the micro-geometry on the cutting edge, sometimes, both elastic deformation and compression happen simultaneously. For a tool with sharp edges, the shearing mechanism becomes the dominant factor that results in smooth cutting, which improves the surface finish. An increase in the cutting-edge radius or chamfer angle increases the tendency of the material to get compressed, which results in the poor-quality surface. Reducing the feed rate or increasing the edge radius results in chip thinning, which generally results in surface with superior finish. However, a very thin chip results in the ploughing component dominating the shearing effect, which would compress the material around the tool rather than shearing it [23]. Zhang and Zhuang [24] have proved that increasing the chamfer width improves the surface finish and increases the thickness of white layer formation. It was also proved that the tool edge radius influences the surface hardness and microstructure of the machined surface [19].
To validate the hypothesis and further evaluate the mechanism responsible for the observed phenomena, numerical simulations were performed using Third wave systems’ AdvantEdge 7.4 finite element analysis software. The 3D CAD model of the cutter and inserts were imported to the software, which avoids the need to input boundary conditions manually. The default material model available in the software for the SAE1070 material was used for the workpiece, and cutting parameters of 110 m/min, 0.2 mm/tooth, 2 mm depth of cut, and 50 mm radial engagement were used for the simulation. A mesh size of 0.005 mm was given to the cutting edge so that the edge form was not distorted by the mesh elements, and the dynamic meshing option was selected.
Figure 7 shows the stress concentration on the workpiece when the tool is in the cut. From the analysis, it is clear that a very high stress and hence high deformation on the machined surface are seen for Inserts A and C, whereas the stress concentration and deformation are comparatively lower on the surface formed by Inserts B and D. The FE analysis proves that Insert B generates lower stress and deformation zone on the workpiece followed by Insert D, which is the favorable micro-geometry to get a superior surface finish that is in line with the low Ra and Rz values seen in Figure 3 and Figure 4, respectively. This depicts the correlation between surface roughness and stress on the workpiece. It is also evident that the deformation and stress concentration on the surface formed by the wiper edge shows a distinct difference for all the four micro-geometries. In addition, the deformation on the trailing machined surface in Figure 7 shows the amount of stress on the workpiece.
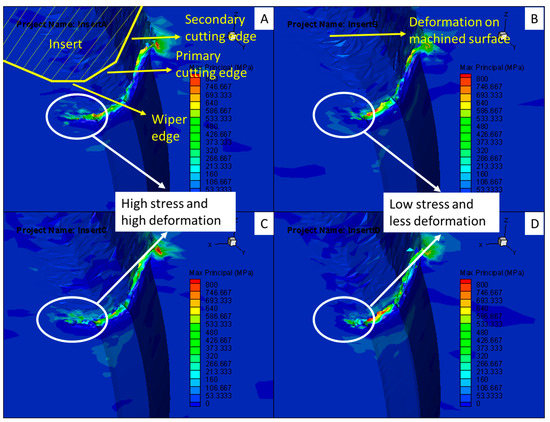
Figure 7.
Stress concentration and deformation of workpiece produced by (A) Insert A (B) Insert B (C) Insert C and (D) Insert D.
An increase in Ra and Rz values for tools with a larger cutting-edge radius was also seen by Thiele and Melkote [25]. When shearing dominates the ploughing action, it results in improved surface finish and vice versa [16,17]. This is true for Insert B in which shearing dominates due to the presence of sharp edges. However, the stability and chip formation mechanism of Insert C and Insert D with similar micro-geometries on the cutting and wiper edge seems to be creating the favorable condition for improving the surface finish when compared to Insert A. Insert A (despite having a radius on the wiper edge) creates a poor surface finish due to an unfavorable cutting condition arising out of dissimilar micro-geometries on cutting and wiper edges. The forces and chip form mechanism (ploughing and shearing) are different for different micro-geometries. Hence, having a radiused chamfer on the cutting edge and only the radius on the wiper edge (dissimilar micro-geometries) could have negatively influenced the cutting mechanism of Insert A.
It is also evident that when the cutting speed was increased from 70 to 90 m/min, there is a significant reduction in the Ra and Rz values; however, the difference becomes negligible when the speed was increased further to 110 m/min. Due to the difference in the rate of heat transfer, tensile stress is formed on the workpiece surface at lower cutting speeds, whereas compressive stress is formed at higher cutting speeds [26]. Higher compressive stress smoothens the peaks formed during machining, which results in reduced Ra and Rz values. This is in line with the observation seen by other researchers [27,28].
Feed rate is the third significant factor with 1.89% and 1.3% respectively. In addition, an increase in feed gives a linear decrease in Ra and Rz values, which proves that increasing the feed rate decreases the surface quality. Theoretically, surface roughness is a function of the square of feed, which shows that an increase in feed rate increases the surface roughness and vice versa. As the feed increases, the peaks and valleys formed by the tool nose radius become wider and deeper, which results in increased surface roughness. Apart from the feed rate, the nose radius and/or wiper facet also plays a key role in determining the surface roughness. Especially, at lower feed rates, it becomes a function of the size of the nose radius or wiper facet, whereas at higher feed rates and smaller nose radius, the feed becomes the dominant factor. In addition, the ploughing mechanism dominates at lower feed rates, whereas shearing dominates at higher feed rates, which results in better surface finish [14].
3.2. Forces
To further understand the mechanism involved in the tools with different micro-geometries the radial (Fx-Force measured in X direction), tangential/cutting (Fy-Force measured in Y direction), and axial (Fz-Force measured in Z direction) forces were measured along the 3-axis of the stationary dynamometer and are tabulated in Table 8.
Table 8.
Forces for varied cutting speed and feed.
The main effect and interaction plot of all the three force components for the variations in micro-geometry, cutting speed, and feed are shown in Figure 8, Figure 9 and Figure 10 and ANOVA analyses are shown in Table 9, Table 10 and Table 11.

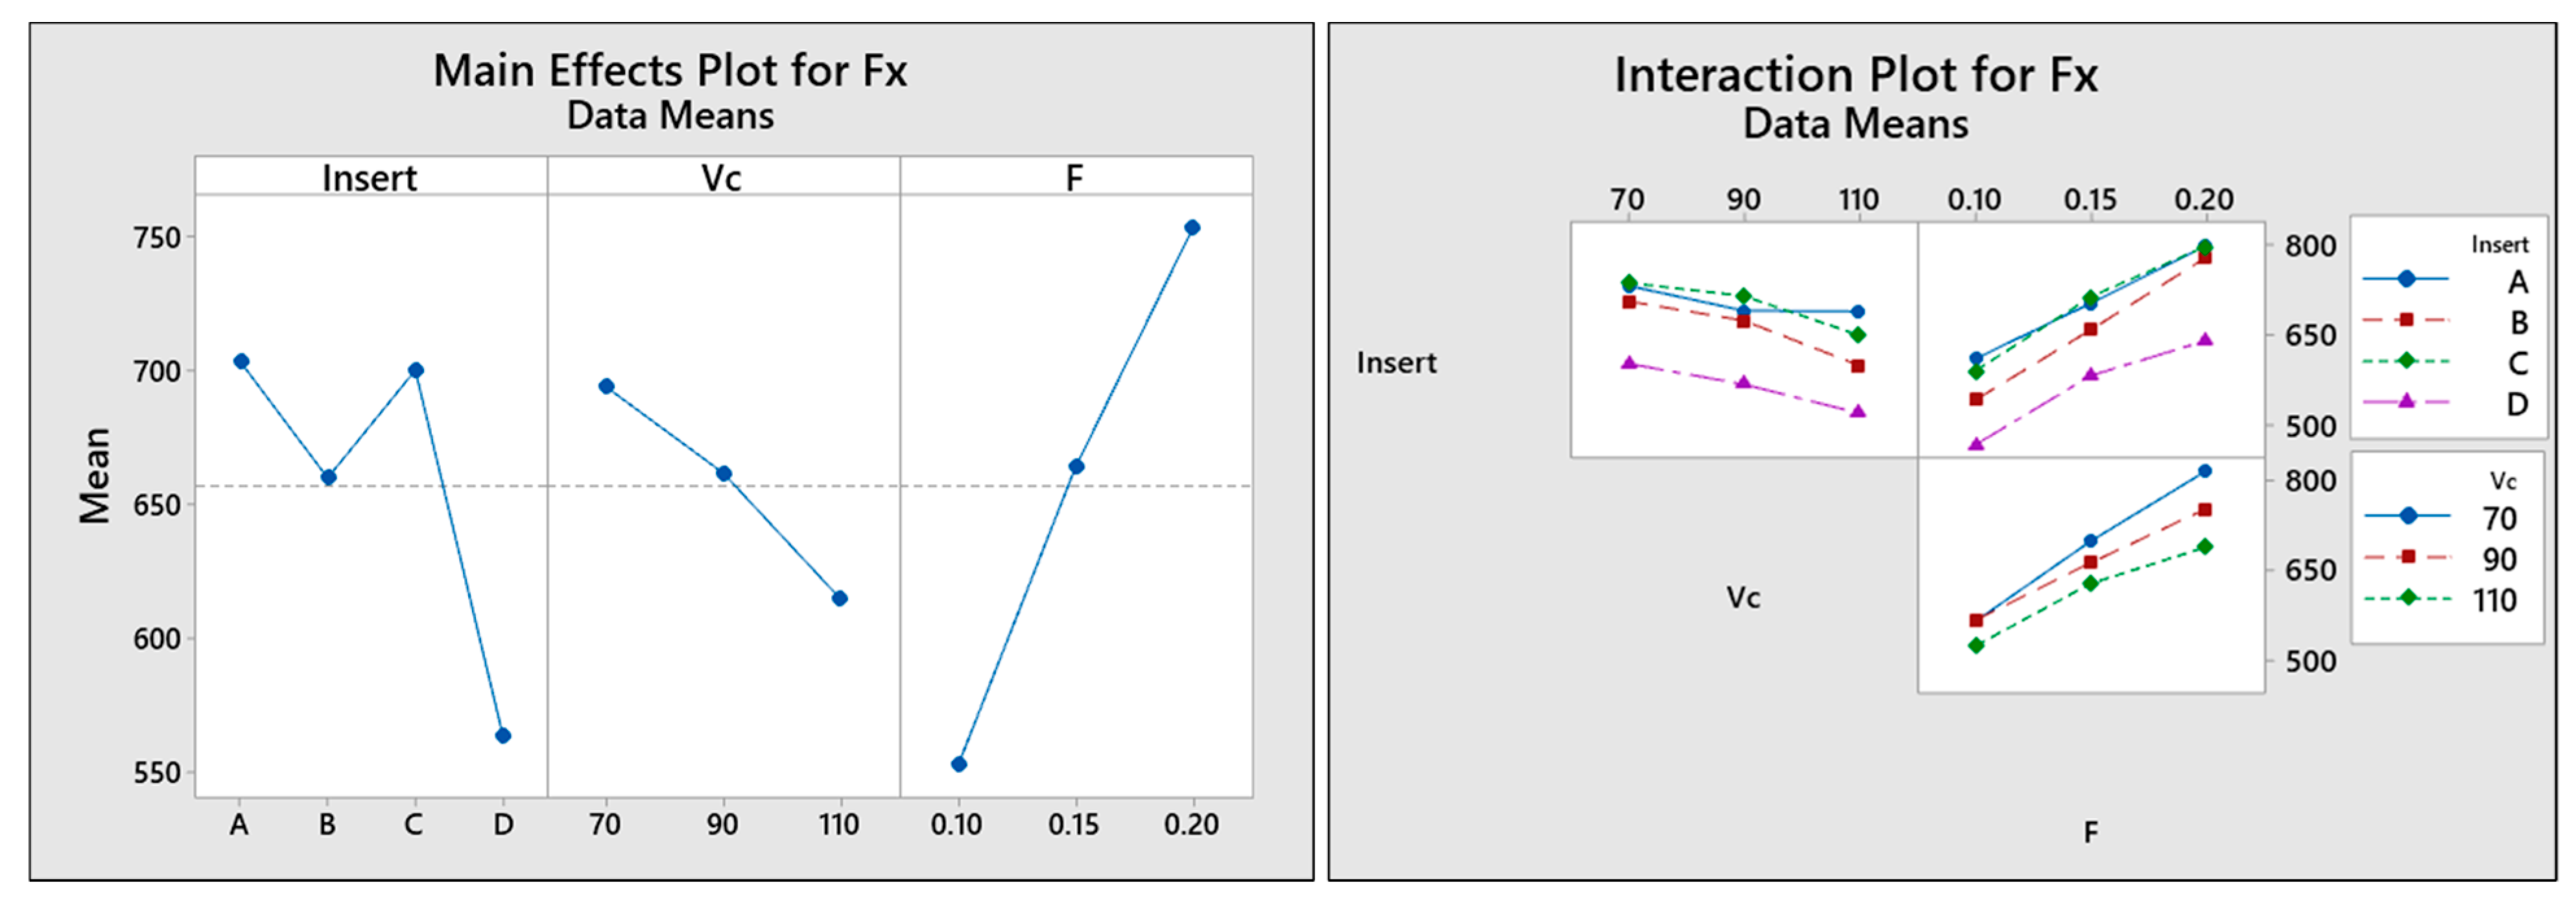
Figure 8.
Main effect and interaction plot for Fx force.
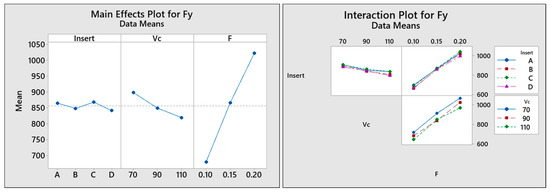
Figure 9.
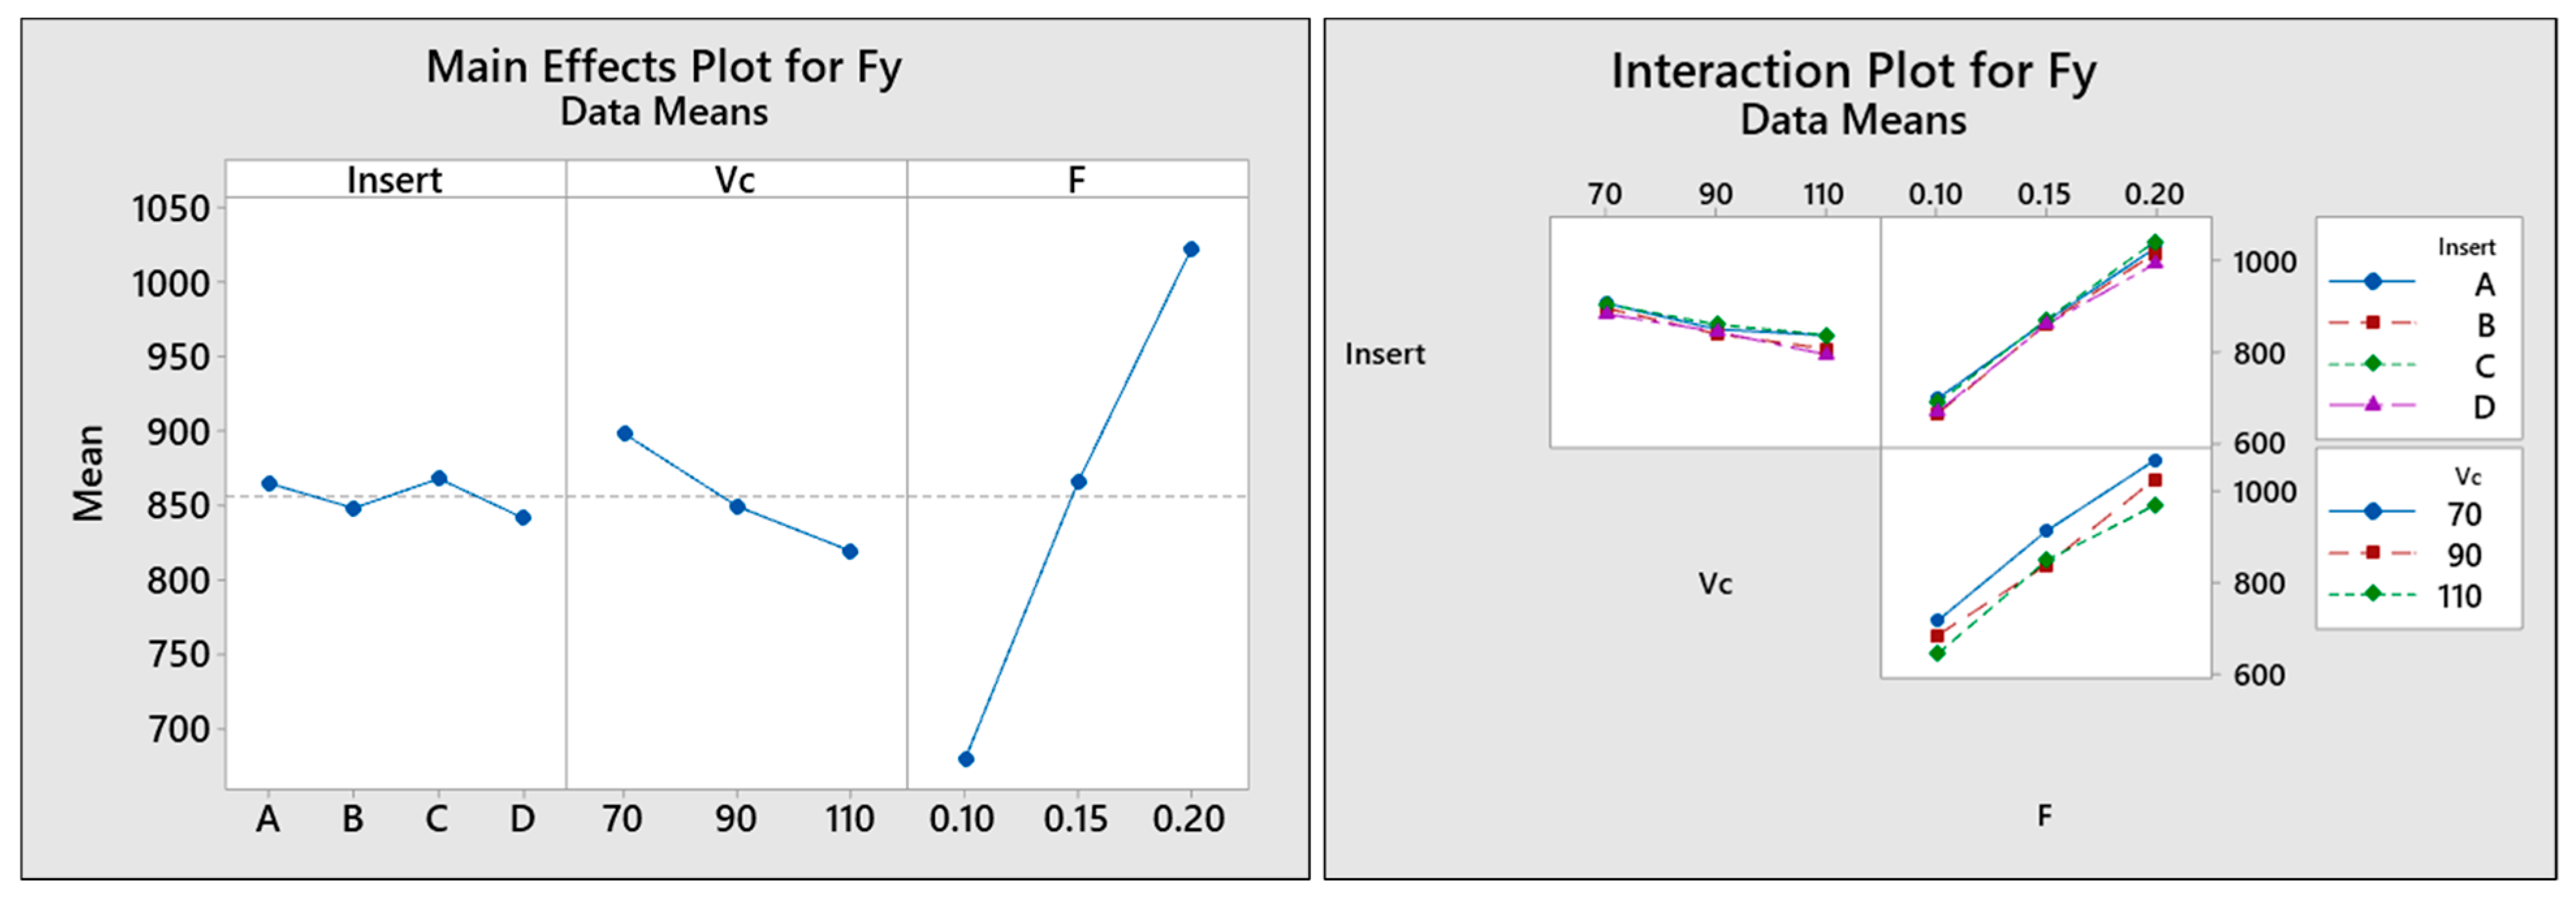
Main effect and interaction plot for Fy force.
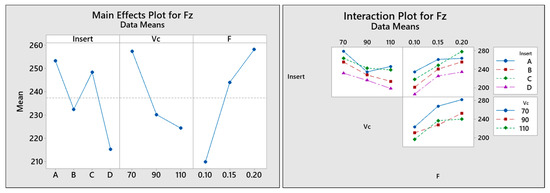
Figure 10.
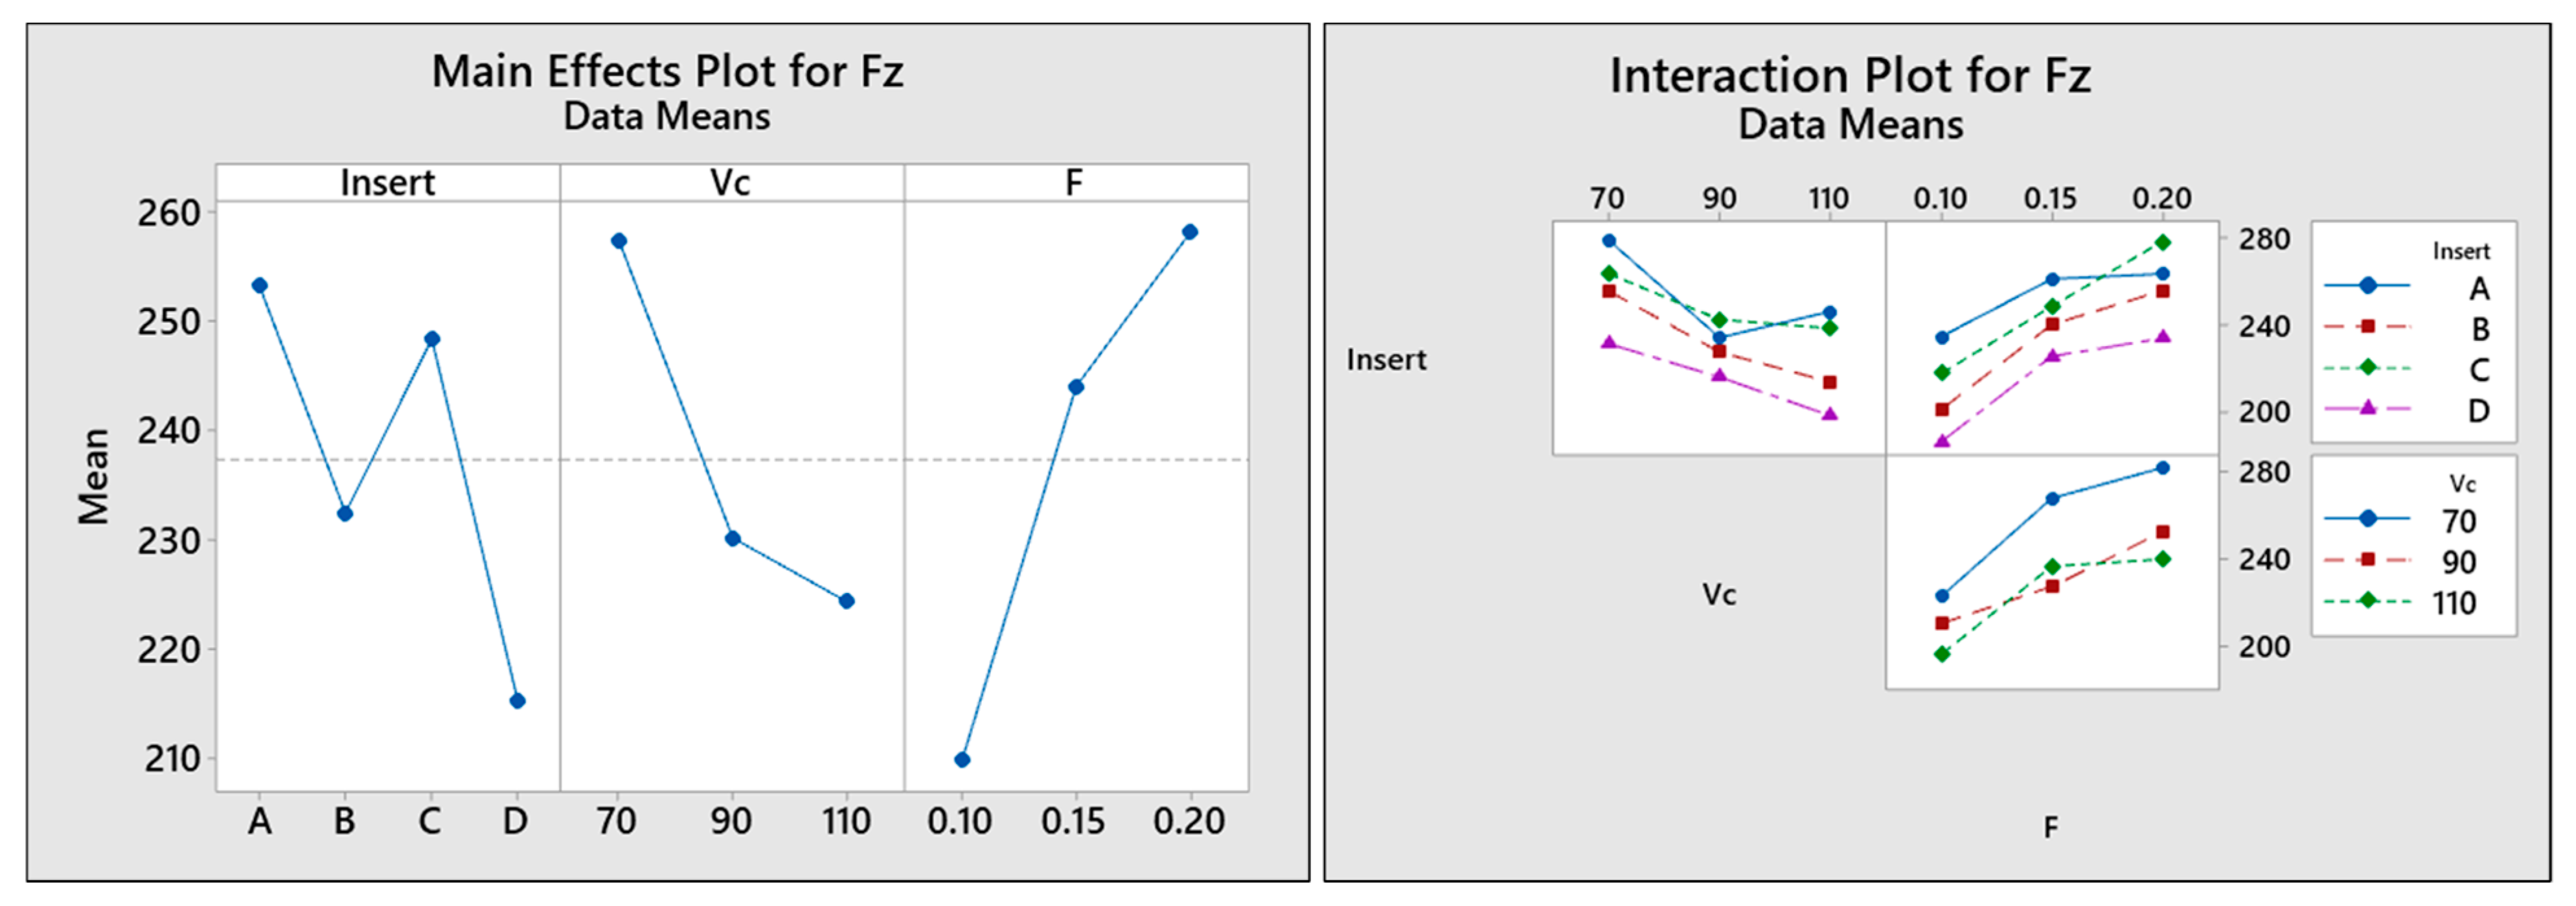
Main effect and interaction plot for Fz force.
Table 9.
ANOVA and significance for Fx force.
Table 10.
ANOVA and significance for Fy force.
Table 11.
ANOVA and significance for Fz force.
The main effect plots (Figure 8, Figure 9 and Figure 10) and ANOVA tables (Table 9, Table 10 and Table 11) show that the feed rate is the single most significant factor for the variation in forces. With the increase in feed rate, all the three force components increase linearly as the amount of material removed (MRR) increases. However, for the Fx and Fz forces, the micro-geometry is the second most significant factor, which shows the importance of the edge geometry on forces. Among all the four insert geometries, Insert D generated the least Fx force followed by Insert B. This is obvious, as the insert D without chamfer penetrates and shears the material easily and creates lesser resistance to the cut when compared to Insert B, which has a chamfer. Similarly, Insert A and Insert C with identical micro-geometry on the cutting edges gave higher but negligible differences in the force values, as seen in Figure 10. A similar trend was seen for the Fz forces as well. It can also be seen that increasing the cutting speed decreases all the three force components linearly, which is due to the thermal softening of work material at higher cutting speeds that make the tool easier to penetrate and shear [21]. Researchers have reported that cutting speed has the highest impact on the tool–chip interface temperature when compared to feed rate, which results in the softening of work material at the cutting zone. However, increasing the feed rate also results in increased chip thickness, which tends to carry more heat away from the cutting zone [29].
ANOVA for Fz force shows that the three significant factors are feed rate (41.45%), insert geometry (22.38%), and cutting speed (21%) in that order, whereas for the Fy force (tangential or cutting force), the contribution of feed is around 92.62%, and the insert geometry is least significant with 0.59%. This shows the importance of the micro-geometry of the wiper edge on the Fz force. From the main effect plot for Fz force (Figure 10), it can be interpreted that Insert D gives the lowest axial force followed by Insert B, Insert C, and Insert A. The Insert D without chamfer is supposed to penetrate and shear the workpiece with more ease than the other inserts. Among the other three inserts, as Insert B has a sharp chamfer, it gives the least force, whereas there is very little difference in the force values of Insert C and Insert A. Denkena et al. [30] have shown that increasing the cutting-edge radius increases the passive forces, which results in higher mechanical load on the machined surface. It also induces a high compressive residual stress. A similar effect can be seen in the edge with a chamfer. Choi [31] has proved that apart from chamfer width, the angle of chamfer also influences the microhardness and residual stress on the machined surface. The higher the angle, the higher the stress and surface hardness.
To validate the hypothesis and to understand the effect of micro-geometry on forces, FE analysis was performed with the same boundary condition and meshing to simulate chip formation and study the stress-affected zones on the chips. Figure 11 shows the finite element analysis of stress formation on the chips formed by inserts with different micro-geometries.

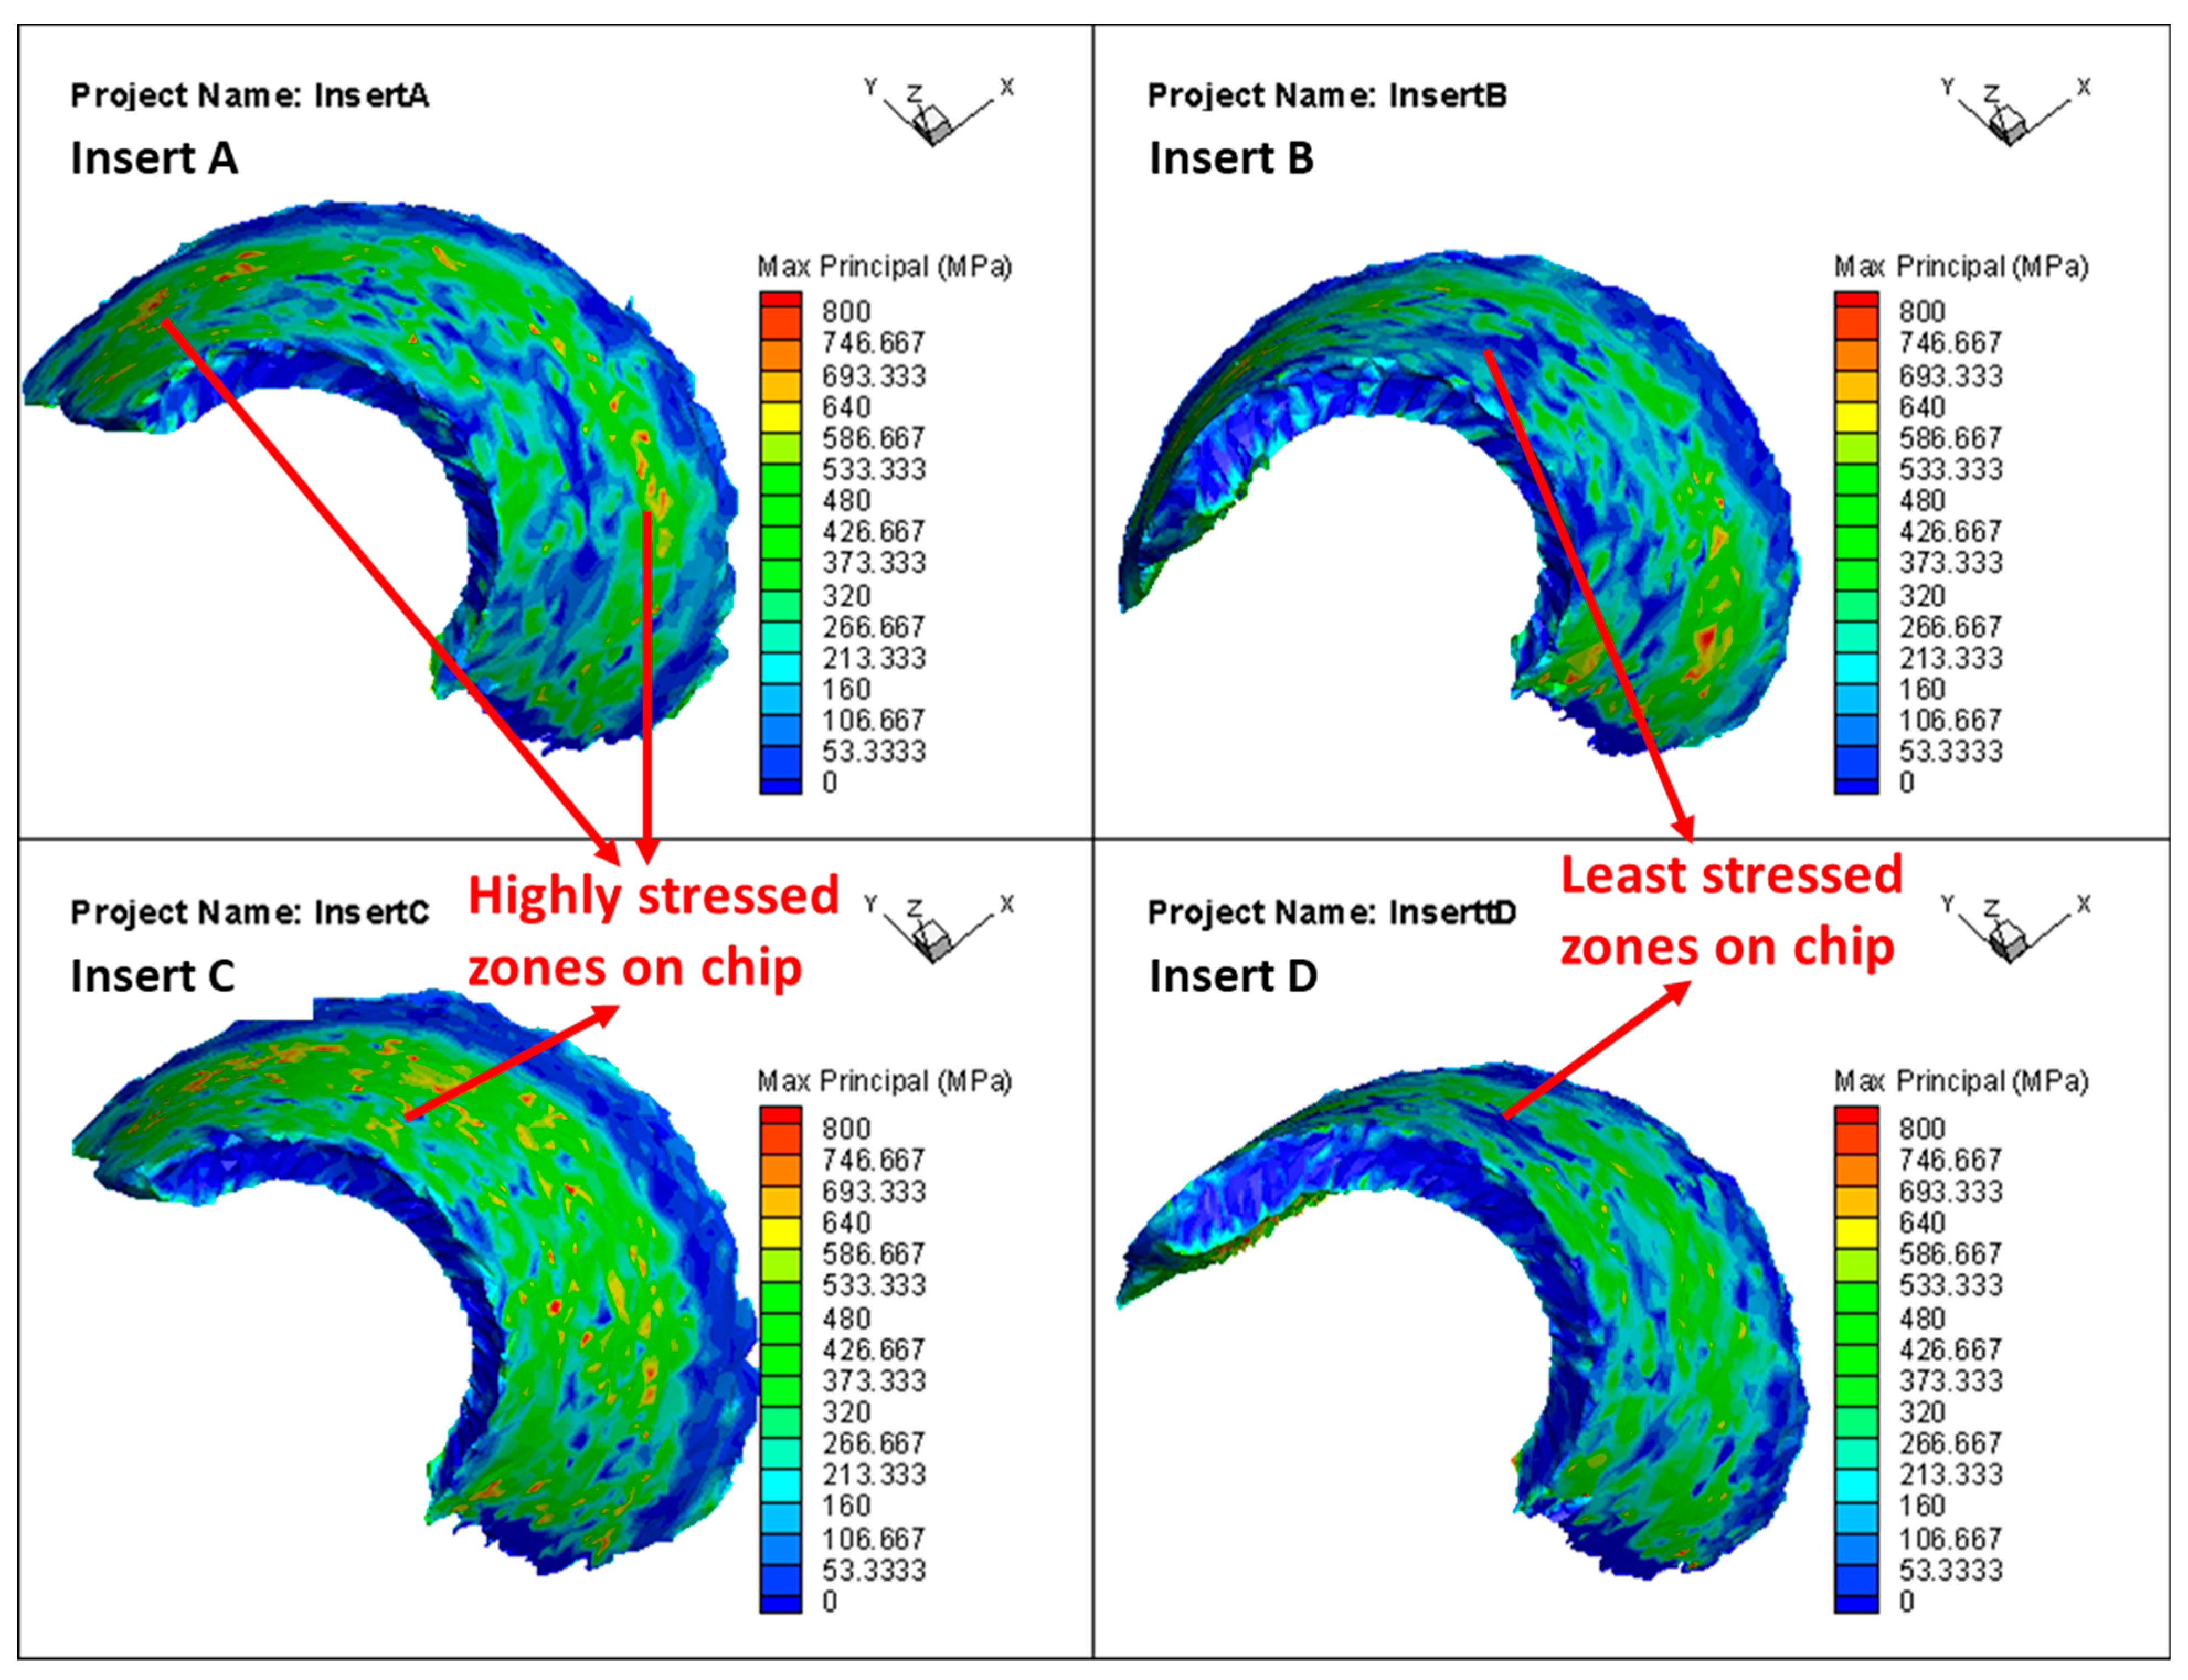
Figure 11.
Stress zones on the chip formed by different micro-geometries.
By analyzing the chip formed by inserts with different micro-geometries (Figure 11), it can be concluded that the chips created by Insert C are highly stressed which is seen as dark green and yellowish red patches on the entire surface of the chip followed by Insert A. The higher stress on Insert C and Insert A (large number of red and yellow zones in Figure 11) is in line with the high forces as seen in the main effect plot of forces (Figure 8, Figure 9 and Figure 10). The chip formed by Insert B and Insert D shows comparatively lower-stress regions (chips are mostly blue and green), which show the effect of micro-geometry on the ease with which the material is sheared. This also correlates with the stress zones seen on the workpiece in Figure 7.
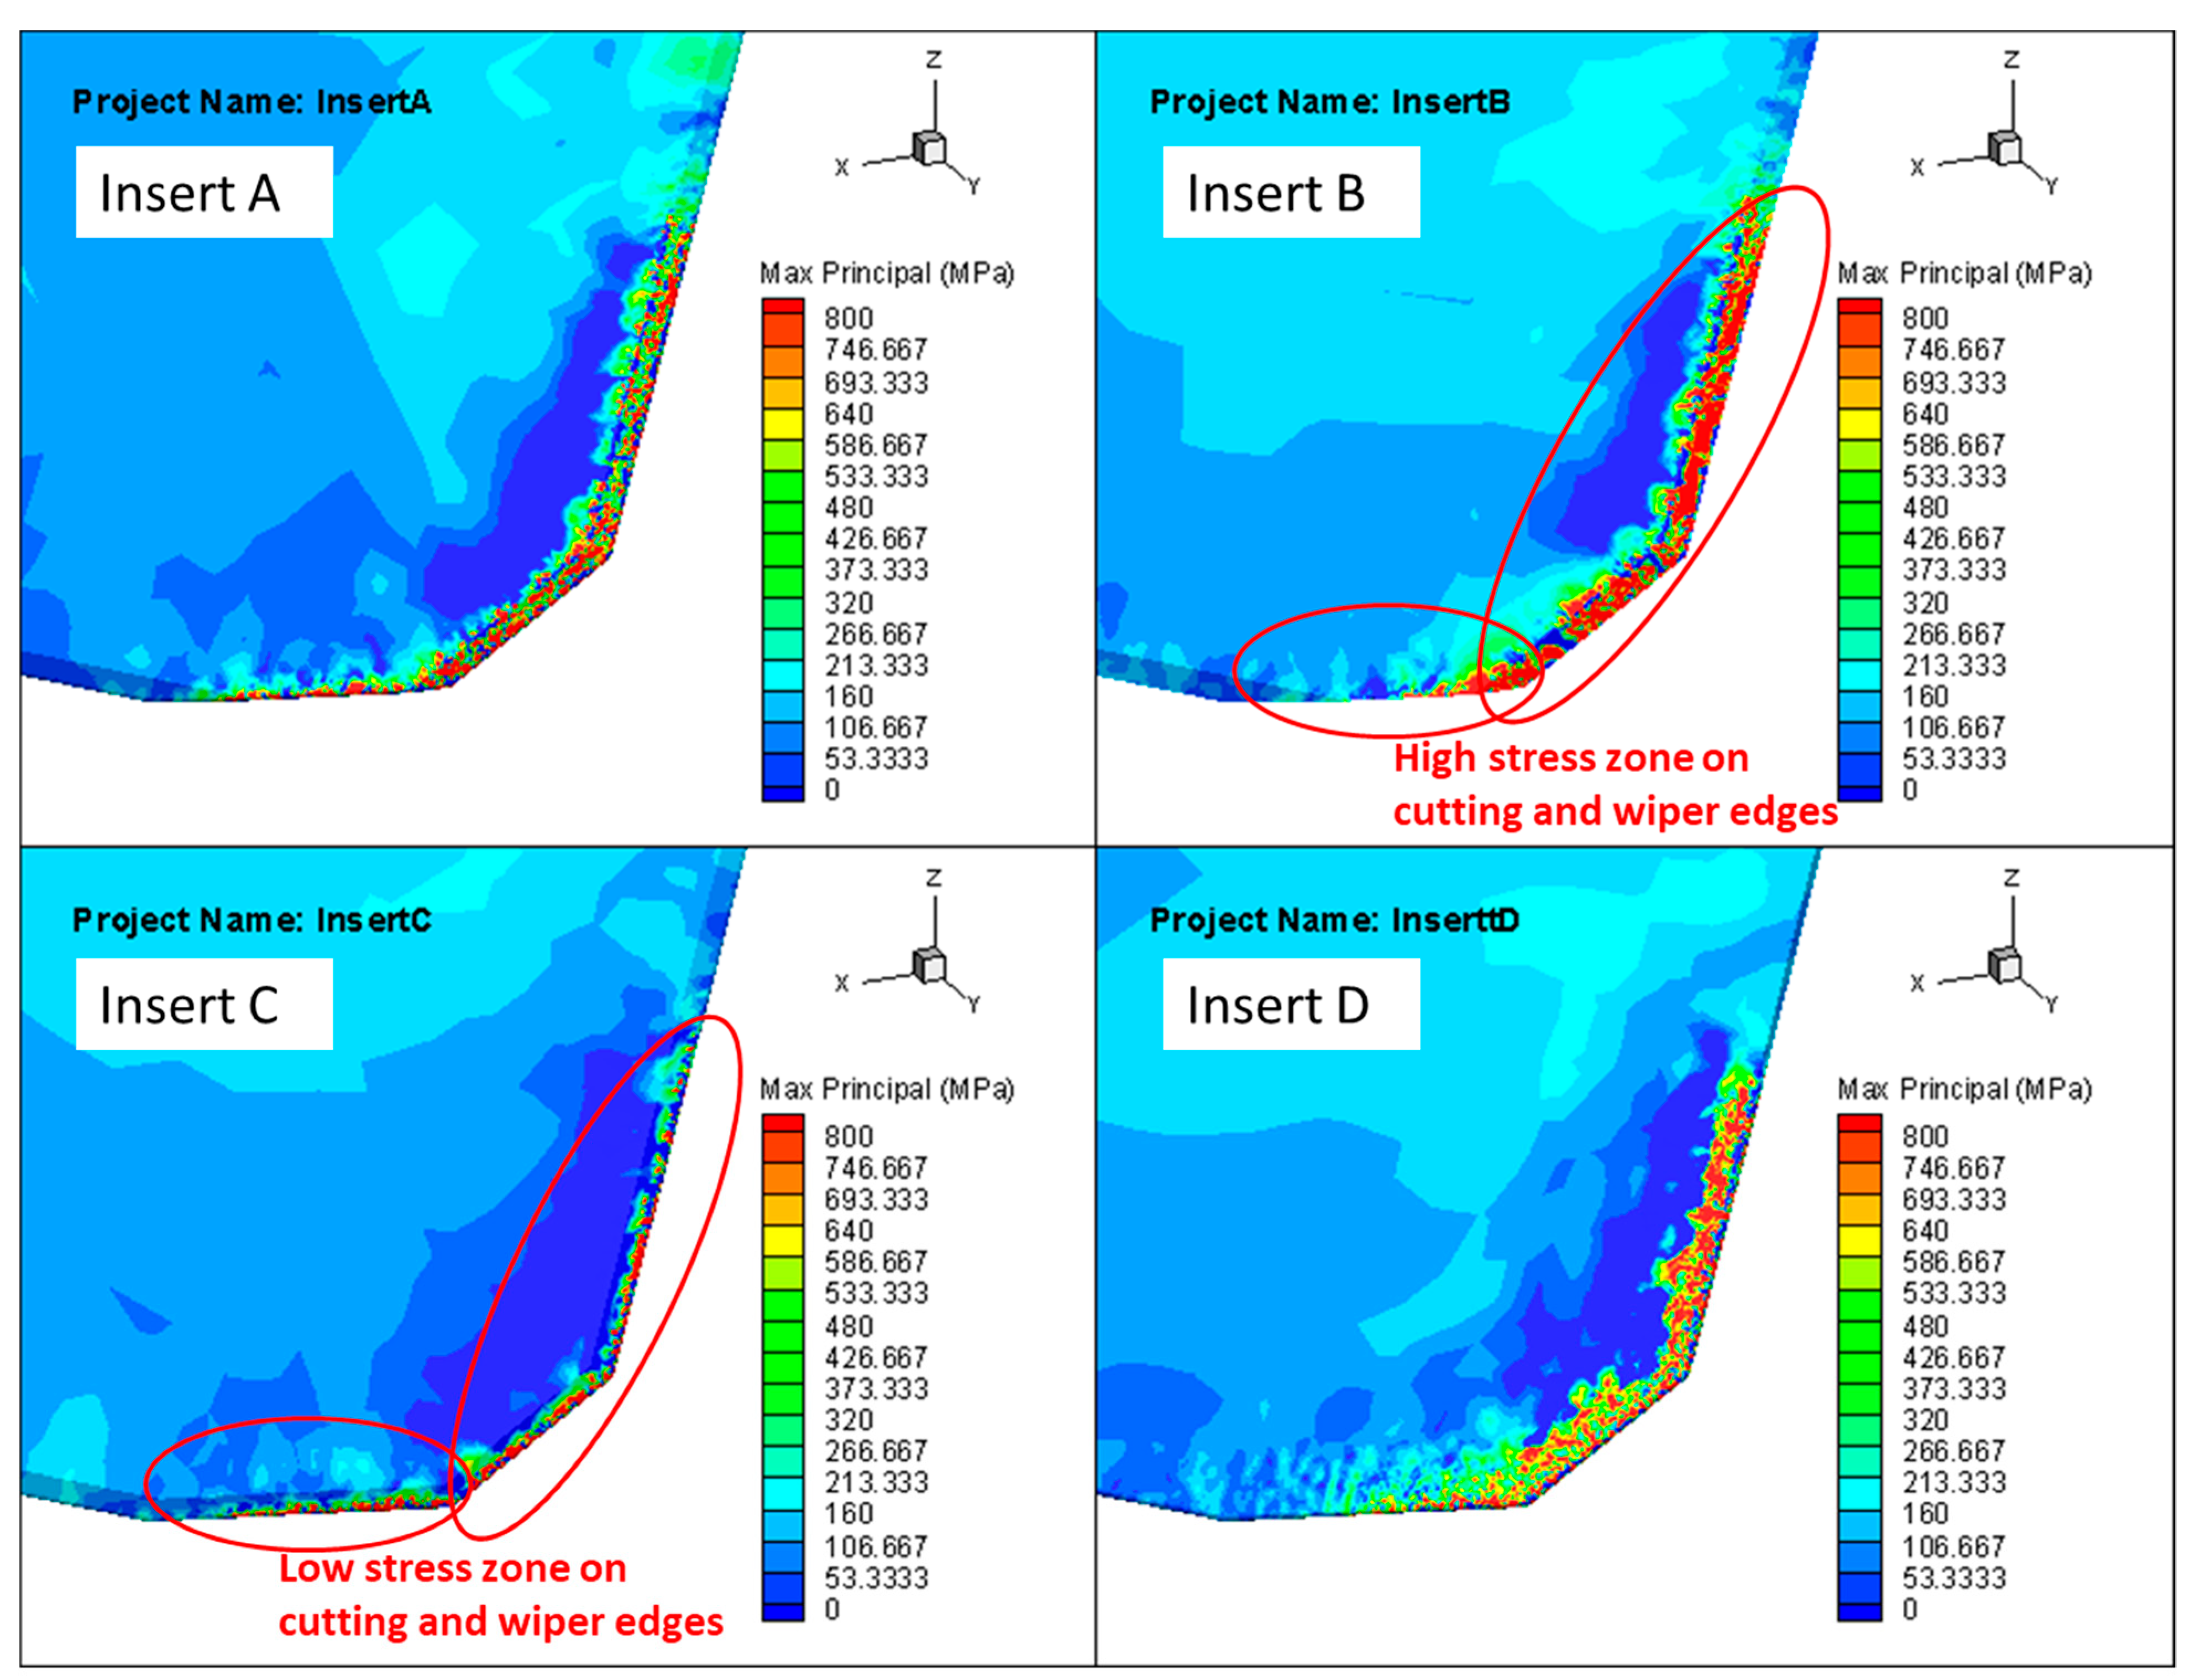
Apart from producing superior surface finish and the lowest forces, the primary objective of the micro-geometry is to maintain superior edge stability even during unfavorably machining conditions, so that the sudden breakage or chip-off can be prevented, which could make the tool unusable. So, finite element analysis was performed on all the four inserts (Figure 12) to study the stress concentration on the inserts. Generally, it is preferred to have the lowest possible maximum principal stress on the cutting edge to improve the stability of the cutting edge [32]. The higher stress concentration means that the edge is highly prone to breakage.
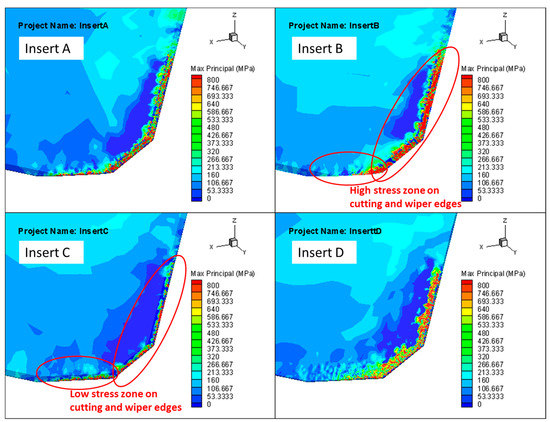
Figure 12.
Stress zones on the edges of different inserts.
The analysis shows that the stress concentration on Insert B with a sharp chamfer on the cutting and wiper edge is high followed by Insert D with an edge radius, whereas Insert C with a radiused chamfer on the cutting and wiper edge shows the least stress concentration, which is a sign of superior edge stability. The simulation results show that to avoid stress concentration on the edges, it is imperative to have a radius or chamfer based on other machining variables. Despite having a chamfer, Insert B with a sharp edge is highly prone to breakage or chip-off. A tool life test would be conducted in the future to validate it.
The force values when interpreted together with the surface roughness values and finite element analysis show that apart from the micro-geometry on the wiper edge, the cutting-edge geometry also plays a role in the axial forces. However, based on the comprehensive investigation, it can be concluded that for the metal cutting applications that demand lower forces, higher surface finish, and superior edge stability, both Insert C and Insert D (identical micro-geometries on the cutting and wiper edges) are the most suitable candidates. Despite having a radius on the wiper edge, Insert A produced a poor surface finish, high forces, and high stress on the workpiece and chip, which shows that having different micro-geometries on the cutting and wiper edge is unfavorable.
4. Conclusions
The detailed investigation evaluated the effect of having different micro-geometries on the cutting edge and wiper edge at different cutting parameters and revealed that a chamfer on the cutting edge and a sharp wiper edge with no edge rounding (Insert B) gave superior surface finish followed by Insert C and Insert D, whereas the insert with a radiused chamfer on the cutting edge and radius on the wiper edge (Insert A) produced the least quality surface.
However, in most metal cutting applications, as it is impossible to use a tool with a sharp cutting edge as it is highly prone to chip-off or sudden breakage, it is suggested that having the same micro-geometry on the cutting edge and wiper edge (Insert C or Insert D) is the most favorable design for getting higher surface quality.
While Insert D is recommended for the application that demands lower forces, Insert C could be suitable for application that demands superior edge stability. ANOVA analysis revealed that micro-geometry is the most significant factor for surface roughness (both Ra and Rz), which is followed by cutting speed and feed. ANOVA analysis for forces shows that the feed rate has the highest significance on all the three force components followed by the micro-geometry of the tool. Insert D gave the least radial, tangential, and axial forces followed by Insert B. Insert A and Insert C showed the highest forces with very little difference in the force values between them.
The variation in the lead angle of the primary and secondary cutting edges would result in variation in the chip thickness along the cutting edge, direction of local forces, and stress on the workpiece, which could affect the machining dynamics. Hence, the investigation would be extended in the future to study the combined effect of variation in micro-geometry and insert lead angles on the performance of tool.
Author Contributions
Conceptualization, P.M. and S.K.N.; methodology, P.M.; software, P.M.; validation, P.M.; formal analysis, P.M.; investigation, P.M.; resources, P.M. and S.K.N.; data curation, P.M.; writing—original draft preparation, P.M.; writing—review and editing, P.M.; visualization, P.M. and S.K.N.; supervision, P.M. and S.K.N.; project administration, P.M. and S.K.N.; funding acquisition, P.M. and S.K.N. All authors have read and agreed to the published version of the manuscript.
Funding
The author received no specific funding for the research.
Institutional Review Board Statement
Not applicable.
Informed Consent Statement
Not applicable.
Data Availability Statement
The datasets supporting the conclusions of this article are included within the article.
Acknowledgments
The author sincerely acknowledges the support rendered by the staffs of Kennametal India Ltd., Bangalore, India for conducting the experiments.
Conflicts of Interest
The authors declare no conflict of interest.
Disclaimer
This disclaimer informs readers that the views, thoughts, and opinions expressed in the text belong solely to the author, and not necessarily to the author’s employer, organization, committee, or other group or individual.
References
- Agmell, M.; Ahadi, A.; Gutnichenko, O.; Ståhl, J.-E. The influence of tool micro-geometry on stress distribution in turning operations of AISI 4140 by FE analysis. Int. J. Adv. Manuf. Technol. 2017, 89, 3109–3122. [Google Scholar] [CrossRef] [Green Version]
- Chandra, P.; Rao, C.P.; Kiran, R.; Kumar, V.R. Influence Of Machining Parameter On Cutting Force And Surface Roughness While Turning Alloy Steel. Mater. Today Proc. 2018, 5 Pt 2, 11794–11801. [Google Scholar] [CrossRef]
- Shree, M.S.; Velan, M.V.G.; Padmakumar, M. Experimental Investigation on Effect of High Pressure Coolant with Various Cutting Speed and Feed on Surface Roughness in Cylindrical Turning of AISI 1060 Steel Using Carbide Insert. Adv. Mater. Res. 2014, 984–985, 3–8. [Google Scholar] [CrossRef]
- Rech, J.; Yen, Y.-C.; Schaff, M.; Hamdi, H.; Altan, T.; Bouzakis, K. Influence of cutting edge radius on the wear resistance of PM-HSS milling inserts. Wear 2005, 259, 1168–1176. [Google Scholar] [CrossRef]
- Tzotzis, A.; García-Hernández, C.; Huertas-Talón, J.-L.; Kyratsis, P. Influence of the Nose Radius on the Machining Forces Induced during AISI-4140 Hard Turning: A CAD-Based and 3D FEM Approach. Micromachines 2020, 11, 798. [Google Scholar] [CrossRef] [PubMed]
- Endres, W.J.; Kountanya, R.K. The Effects of Corner Radius and Edge Radius on Tool Flank Wear. J. Manuf. Process. 2002, 4, 89–96. [Google Scholar] [CrossRef]
- Wang, R.; Wang, B.; Barber, G.C.; Gu, J.; Schall, J. Models for Prediction of Surface Roughness in a Face Milling Process Using Triangular Inserts. Lubricants 2019, 7, 9. [Google Scholar] [CrossRef] [Green Version]
- Sales, W.F.; Schoop, J.; da Silva, L.R.; Machado, Á.R.; Jawahir, I. A review of surface integrity in machining of hardened steels. J. Manuf. Process. 2020, 58, 136–162. [Google Scholar] [CrossRef]
- Zhao, T.; Zhou, J.M.; Bushlya, V.; Ståhl, J.E. Effect of cutting edge radius on surface roughness and tool wear in hard turning of AISI 52100 steel. Int. J. Adv. Manuf. Technol. 2017, 91, 3611–3618. [Google Scholar] [CrossRef] [Green Version]
- Zhao, T.; Agmell, M.; Persson, J.; Bushlya, V.; Ståhl, J.E.; Zhou, J.M. Correlation between edge radius of the cBN cutting tool and surface quality in hard turning. J. Superhard Mater. 2017, 39, 251–258. [Google Scholar] [CrossRef]
- Fulemova, J.; Janda, Z. Influence of the Cutting Edge Radius and the Cutting Edge Preparation on Tool Life and Cutting Forces at Inserts with Wiper Geometry. Procedia Eng. 2014, 69, 565–573. [Google Scholar] [CrossRef] [Green Version]
- Chen, G.; Chen, S.; Caudill, J.; Jawahir, I. Effect of cutting edge radius and cooling strategies on surface integrity in orthogonal machining of Ti-6Al-4V alloy. Procedia CIRP 2019, 82, 148–153. [Google Scholar] [CrossRef]
- Mayer, P.; Kirsch, B.; Müller, R.; Becker, S.; Harbou, E.V.; Aurich, J.C. Influence of Cutting Edge Geometry on Deformation Induced Hardening when Cryogenic Turning of Metastable Austenitic Stainless Steel AISI 347. Procedia CIRP 2016, 45, 59–62. [Google Scholar] [CrossRef] [Green Version]
- Hosseini, S.B.; Beno, T.; Klement, U.; Kaminski, J.; Ryttberg, K. Cutting temperatures during hard turning—Measurements and effects on white layer formation in AISI 52100. J. Mater. Process. Technol. 2014, 214, 1293–1300. [Google Scholar] [CrossRef]
- Hronek, O.; Zetek, M.; Baksa, T.; Adámek, P. Surface Quality Analysis of Cutting Tool Microgeometry to Achieve Higher Durability. Manuf. Technol. 2018, 18, 39–46. [Google Scholar] [CrossRef]
- Shiva, P.N.; Padmakumar, M.; Sarada, B. Experimental investigation to assess the effects of trumpet hone on tool life and surface quality in milling of AISI4140 steel. FME Trans. 2019, 47, 437–441. [Google Scholar] [CrossRef] [Green Version]
- Padmakumar, M.; Shiva Pradeep, N. Effect of cutting edge form factor (K-factor) on the performance of a face milling tool. CIRP J. Manuf. Sci. Technol. 2020, 31, 305–313. [Google Scholar] [CrossRef]
- Ventura, C.; Chaves, H.S.; Rubio, J.C.C.; Abrão, A.M.; Denkena, B.; Breidenstein, B. The influence of the cutting tool microgeometry on the machinability of hardened AISI 4140 steel. Int. J. Adv. Manuf. Technol. 2017, 90, 2557–2565. [Google Scholar] [CrossRef]
- Arısoy, Y.M.; Özel, T. Prediction of machining induced microstructure in Ti–6Al–4V alloy using 3-D FE-based simulations: Effects of tool micro-geometry, coating and cutting conditions. J. Mater. Process. Technol. 2015, 220, 1–26. [Google Scholar] [CrossRef]
- Filho, A.F.; Da Silva, L.R.R.; Ruzzi, R.; Costa, E.S.; Sales, W.; Jackson, M.J.; Machado, Á.R. Influence of milling direction in the machinability of Inconel 718 with submicron grain cemented carbide tools. Int. J. Adv. Manuf. Technol. 2019, 105, 1343–1355. [Google Scholar] [CrossRef]
- Muthuswamy, P.; Arunachalam, M. Analyzing the effect of cutting parameters and tool nose radius on forces, machining power and tool life in face milling of ductile iron and validation using finite element analysis. Eng. Res. Express 2020, 2, 035003. [Google Scholar] [CrossRef]
- Xie, W.; Fang, F. Effect of tool edge radius on material removal mechanism in atomic and close-to-atomic scale cutting. Appl. Surf. Sci. 2020, 504, 144451. [Google Scholar] [CrossRef]
- Brown, I.; Schoop, J. The effect of cutting edge geometry, nose radius and feed on surface integrity in finish turning of Ti-6Al4V. Procedia CIRP 2020, 87, 142–147. [Google Scholar] [CrossRef]
- Zhang, W.; Zhuang, K. Effect of cutting edge microgeometry on surface roughness and white layer in turning AISI 52100 steel. Procedia CIRP 2020, 87, 53–58. [Google Scholar] [CrossRef]
- Thiele, J.D.; Melkote, S.N. Effect of cutting edge geometry and workpiece hardness on surface generation in the finish hard turning of AISI 52100 steel. J. Mater. Process. Technol. 1999, 94, 216–226. [Google Scholar] [CrossRef]
- Pawade, R.; Joshi, S.S.; Brahmankar, P. Effect of machining parameters and cutting edge geometry on surface integrity of high-speed turned Inconel 718. Int. J. Mach. Tools Manuf. 2008, 48, 15–28. [Google Scholar] [CrossRef]
- Kumar, N.S.; Shetty, A.; Shetty, A.; Ananth, K.; Shetty, H. Effect of Spindle Speed and Feed Rate on Surface Roughness of Carbon Steels in CNC Turning. Procedia Eng. 2012, 38, 691–697. [Google Scholar] [CrossRef] [Green Version]
- Nurhaniza, M.; Ariffin, M.K.A.M.; Mustapha, F.; Baharudin, B.T.H.T. Analyzing the Effect of Machining Parameters Setting to the Surface Roughness during End Milling of CFRP-Aluminium Composite Laminates. Int. J. Manuf. Eng. 2016, 2016, 1–9. [Google Scholar] [CrossRef]
- Da Silva, L.R.R.; Filho, A.F.; Costa, E.S.; Pico, D.F.M.; Sales, W.; Guesser, W.L.; Machado, A.R. Cutting Temperatures in End Milling of Compacted Graphite Irons. Procedia Manuf. 2018, 26, 474–484. [Google Scholar] [CrossRef]
- Denkena, B.; Grove, T.; Maiss, O. Influence of the cutting edge radius on surface integrity in hard turning of roller bearing inner rings. Prod. Eng. 2015, 9, 299–305. [Google Scholar] [CrossRef]
- Choi, Y. Influence of rake angle on surface integrity and fatigue performance of machined surfaces. Int. J. Fatigue 2017, 94, 81–88. [Google Scholar] [CrossRef]
- Zhou, J.; Walter, H.; Andersson, M.; Stahl, J. Effect of chamfer angle on wear of PCBN cutting tool. Int. J. Mach. Tools Manuf. 2003, 43, 301–305. [Google Scholar] [CrossRef]

Publisher’s Note: MDPI stays neutral with regard to jurisdictional claims in published maps and institutional affiliations. |
© 2021 by the authors. Licensee MDPI, Basel, Switzerland. This article is an open access article distributed under the terms and conditions of the Creative Commons Attribution (CC BY) license (https://creativecommons.org/licenses/by/4.0/).