Abstract
This study examined patterns of responses for physiological and perceptual variables during cycle ergometry at a constant rate of perceived exertion (RPE) within the moderate and heavy exercise intensity domains. Nineteen (mean age 21.3 ± 0.5 years; 43.4 ± 2.0 mL·kg−1·min−1 ) moderately trained cyclists performed an incremental test to exhaustion and two 60 min constant RPE rides at the RPE corresponding to the gas exchange threshold (RPEGET) and 15% above the GET (RPEGET+15%). Oxygen consumption (O2), respiratory exchange ratio (RER), heart rate (HR), minute ventilation (), breathing frequency (), and power output (PO) were monitored throughout the rides. Polynomial regression analyses showed O2, RER, HR, and (correlation = −0.85 to −0.98) tracked the decreases in PO required to maintain a constant RPE. Only tracked RPE during the moderate and heavy intensity rides. Repeated measures ANOVAs indicated that O2 during the 60 min rides at RPEGET was not different (p > 0.05) from O2 at GET from the incremental test to exhaustion. Thus, monitoring intensity using an RPE associated with the GET is sustainable for up to 60 min of cycling exercise and a common mechanism may mediate and the perception of effort during moderate and heavy intensity cycle ergometry.
1. Introduction
The gas exchange threshold (GET) and respiratory compensation point (RCP) have been used to demarcate the exercise intensity domains (moderate, heavy, or severe) [1,2,3]. It has been suggested that the GET demarcates the moderate from heavy domains [1,3], while the RCP demarcates the heavy from severe domains [2]. During constant power output (PO), cycle ergometry within the moderate domain, oxygen consumption (O2), heart rate (HR), and blood lactate concentration ((La−)b) reach steady state within 3 min [1,3]. In the heavy domain, however, (La−)b appearance exceeds its rate of removal for the first 10–20 min then reaches a steady state [1]. Thus, each domain is characterized by unique patterns of physiological responses.
A number of studies have examined the physiological and perceptual responses during continuous, constant PO cycle ergometry [1,2,4,5] within both moderate and heavy exercise intensity domains. During fatiguing constant PO exercise there are predictable time-dependent patterns of responses for O2, HR, rating of perceived exertion (RPE), breathing frequency (), and minute ventilation () that are, in part, dependent upon the exercise intensity associated with the task. There are, however, different patterns of responses for various physiological variables when continuous exercise is maintained at a constant physiological or perceptual parameter instead of PO [6,7,8,9,10]. For example, Stoudemire et al. [8] reported increases in (La−)b and HR, but decreases in O2 and velocity during treadmill running at RPE levels within the moderate and heavy domains. In addition, Lajoie et al. [7] reported increases in O2, HR, and RPE during 60 min of cycling exercise while maintaining maximal lactate steady-state, which is related to the anaerobic threshold. More recently, Cochrane et al. [6] reported dissociations among RPE, O2, HR, , and respiratory exchange ratio (RER) during cycle ergometry at a constant RPE, 20% below the GET (within the moderate domain). To explain these patterns of fatigue-related responses, Cochrane et al. [6] made some hypotheses regarding the applicability of fatigue models [11,12,13,14,15]. It was hypothesized [6] that small nerve afferents associated with respiratory muscles responsible for mediating were the likely mediators of the perception of effort during constant RPE cycle ergometry within the moderate domain. No previous study, however, has investigated whether the dissociations among physiological and perceptual variables are dependent upon the exercise intensity of the task, as seen during constant PO exercise. Intensity dependent dissociations may further explain mediators of perception during both moderate and heavy intensity exercise.
Although specific metabolic, cardiovascular, and respiratory responses have been documented during constant PO exercise, less is known regarding pacing strategies associated with these responses and how responses may differ during exercise at a constant perception of effort. It has been theorized [16,17] that there is some level of brain involvement in the perception and manifestation of fatigue, with some theories suggesting the brain is responsible for conscious and unconscious integration of feedback from the working muscles and external stimuli (environment and time) [15], those that suggest the brain performs regulation without peripheral feedback [13], and others advocating a greater influence of unconscious “reflexes” on responses during exercise [11,12,14]. However, there is still debate regarding which, if any, of these theories best explains pacing and the onset of fatigue during dynamic exercise. There may be a dual contribution from automatic “reflex” actions as well as large metabolic disturbances to the conscious integration of the perception of effort that helps form an individual’s pacing strategy. The mechanisms underlying this conscious awareness of physiological responses are not fully understood. Thus, by controlling the sense of effort (RPE), dissociations among physiological and perceptual responses may point to potential mediators of both conscious and unconscious interpretations of effort and the awareness that determines pace.
It is hypothesized that the variable(s) that track RPE are associated with similar underlying mediators and/or mechanisms, and those that are experimentally uncoupled from perception (i.e., they do not follow the same pattern of responses as RPE), may not contribute to the perception of effort during moderate and/or heavy intensity cycle ergometry exercise. Based on the findings of previous studies [6,11], it is also hypothesized that variables related to respiration may be the most potent mediators of perception during prolonged cycling exercise. If specific variables can be identified which may mediate perception, a framework can be provided to athletes and coaches to improve pacing strategies, training programs, and athlete performance during prolonged, aerobic exercise. No previous study, has investigated the patterns of responses for these metabolic, cardiovascular, and respiratory variables during prolonged (>30 min) cycle ergometry maintained at a constant perceptual intensity within both the moderate and heavy domains. Like constant PO cycle ergometry, there may be an effect of intensity on the patterns of responses for identified variables, and therefore, there may be mediators of perception that are dependent upon the intensity at which exercise is performed. In addition, it is unclear how controlling perception affects pacing and the metabolic cost of exercise (O2) across an extended period of time (>30 min). Therefore, the purposes of this study were to (1) examine the metabolic (O2 and RER), cardiovascular (HR), respiratory ( and ), and work intensity (PO) responses during continuous, constant RPE cycle ergometry within the moderate and heavy domains; and (2) to determine the level of agreement and sustainability of two perceptually grounded exercise intensities (RPEGET and RPEGET+15%) to corresponding O2 values (GET and 15% above GET) from an incremental and continuous cycling test.
2. Methods
2.1. Participants
Ten women and nine men (mean ± SD age 21.3 ± 0.5 years; body mass 71.9 ± 2.6 kg; ) 43.4 ± 2.0 mL·kg−1·min−1) (Table 1) volunteered for this study and visited the laboratory on four occasions, with 24–48 h between visits. The participants were moderately trained cyclists who participated in cycling related exercise between 3 and 6 h per week for the past six months leading up to the study [18]. During the first visit, the participants signed a written informed consent and were familiarized with the Borg 6–20 perceptual scale according to standard instruction [19,20,21]. All subjects were read a standard script and given standard instructions for creating anchors. In addition, during familiarization, all subjects completed 3–4 short cycling bouts (<5 min) using the scale on the calibrated cycle ergometer to ensure their ratings matched the load at which they worked.
Borg 6–20 Instructions: “While performing physical activity, we want you to rate your perception of exertion. This feeling should reflect how heavy and strenuous the exercise feels to you, combining all sensations and feelings of physical stress, effort, and fatigue. Do not concern yourself with any one factor such as leg pain or shortness of breath, but try to focus on your total feeling of exertion. The rating scale below ranges from 6 to 20, where “6” means “no exertion at all” and 20 means “maximal exertion”. Choose the number below that best describes your level of exertion. This will give you a good idea of the intensity level of your activity, and you can use this information to provide feedback to the experimenter to either increase or decrease the workload at which you cycle to reach your goal intensity rating” [21].

Table 1.
Descriptive characteristics of the subjects (n = 19).
| Variable | Mean ± SD | Range |
|---|---|---|
| Age (y) | 21.3 ± 0.5 | 19.0–25.0 |
| Body Mass (kg) | 71.9 ± 2.6 | 56.8–92.7 |
| peak (mL·kg-1·min-1) | 43.4 ± 2.0 | 29.1–61.8 |
| GET (mL·kg-1·min-1) | 30.3 ± 1.5 | 21.3–47.1 |
| GET +15% (mL·kg-1·min-1) | 34.9 ± 1.7 | 24.4–54.2 |
| RCP (mL·kg-1·min-1) | 39.7 ± 1.7 | 28.6–52.6 |
| RPEGET (W) | 167 ± 10 | 102–300 |
| RPEGET + 15% (W) | 196 ± 12 | 125–349 |
| RPEGET | 14 ± 0.5 | 12–17 |
| RPEGET + 15% | 16 ± 0.5 | 14–19 |
| RPEGET (%peak) | 70.1 ± 1.6 | 57.4–83.8 |
| RPEGET + 15% (%peak) | 80.8 ± 1.9 | 66.1–98.1 |
Note: PE was based on the Borg 6–20 scale (Borg 1982).
This study was approved by the University’s Institutional Review Board for Human Participants and complied with the requirements stipulated in the Declaration of Helsinki.
2.2. Determination of GET, RCP, and Peak Values
At visit 2, each participant performed an incremental test to exhaustion on a calibrated Lode (Corval V3; Groningen, The Netherlands) electronically braked cycle ergometer at a pedal cadence of 75 rev·min–1. The ergometer seat height was adjusted so that the participant’s legs were near full extension at the bottom of the pedal revolution. Toe clips were used to maintain pedal contact throughout the test. Each participant wore a nose clip and breathed through a 2-way valve (Hans Rudolph 2700 breathing valve, Kansas City, MO, USA). Expired gas samples were collected and analyzed using a calibrated TrueMax 2400 metabolic cart (Parvo Medics, Sandy, UT, USA). The gas analyzers were calibrated with room air and gases of known concentration prior to all testing sessions. The O2, CO2, and ventilatory parameters were expressed as 20 s averages [22] and the participants were fitted with a Polar Heart Watch system (Polar Electro Inc., Lake Success, NY, USA). After 1 min of unloaded cycling, the test began at 50 W and the power was increased by 30 W every 2 min until voluntary exhaustion or when the participant’s pedal cadence decreased below 70 rev·min–1 for more than 10 s, despite strong, verbal encouragement. The was defined as the highest 20 s O2 value recorded during the test. The GET and RCP were determined using the V-slope method described by Beaver, Wasserman, & Whipp [23] from the O2 vs. O2 and vs. O2 relationships, respectively. In addition, peak values for heart rate (HRPeak), breathing frequency Peak), minute ventilation (), and respiratory exchange ratio (RERPeak) were defined as the highest 20 s averages during the incremental test, while POpeak and RPEpeak were defined as the highest PO and RPE from the last complete stage of the incremental test to exhaustion.
2.3. Determination of RPEGET and RPEGET+15%
The O2 values for each participant were plotted vs. PO from their incremental test and the O2 values corresponding with the GET and 15% above GET were used to determine the PO at both thresholds (Figure 1a). Ratings of perceived exertion values were then plotted vs. PO from the incremental test to estimate the RPEGET and RPEGET+15% (Figure 1b,c). The GET and GET + 15% thresholds were chosen because they represented exercise intensities associated with the moderate and heavy exercise intensity domains. Pilot work indicated that intensities greater than 15% above the GET resulted in work at or above RCP, and therefore, did not represent an intensity that could be maintained. Furthermore, intensities less than 15% above the GET (GET + 5% and GET + 10%) did not result in RPE ratings different from those ratings at GET, and therefore, represented a similar perceptual intensity.
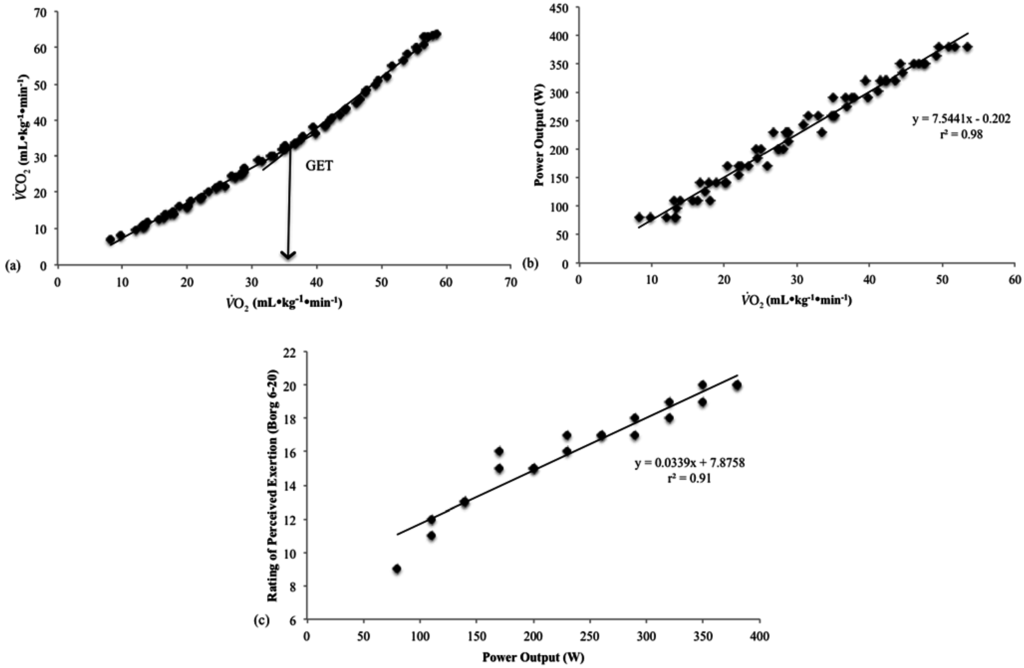
Figure 1.
An example of the linear regression method used to determine the rating of perceived exertion (RPE) at the gas exchange threshold (GET): (a) O2 vs. O2 relationship from the incremental test of participant 15; (b) Plot of the power output (PO) vs. O2 relationship from the incremental test of participant 15; and (c) Estimation of the RPE that corresponded to the PO associated with GET determined from the RPE vs. PO relationship from the incremental test of participant 15.

2.4. Continuous 60 Min Rides
During the third and fourth visit, the participants rode for 60 min at either the RPEGET or RPEGET+15% (randomized, one during each visit). During the rides, O2, HR, , and RER values were recorded as 20 s averages every two min. The RPE was assessed every 30 s and PO was adjusted, as needed, to ensure that the RPE that corresponded to either the RPEGET or RPEGET+15% was maintained for the duration of the 60 min ride. Participants were unaware of the “goal” RPE until they produced their specific number during the 60 min ride(s). Once the “goal” RPE was achieved, participants were told to “maintain that feeling of exertion throughout the duration of the ride”. The investigator controlled the change in PO necessary to maintain RPE. Pilot testing indicated that a change in 5 W was sufficient to elicit a change in RPE, however, during the rides at RPEGET+15% greater increments (10 W) were required at the beginning of the ride to maintain the higher intensity. In addition, participants were unable to see the PO at which they worked and were only given feedback regarding time to completion at the 30 min mark. All participants were unaware of the absolute time and distance of the test until its completion. Although RPE was formally collected every 30 s, participants were instructed to voluntarily produce an RPE rating if their perception changed before the set 30 s production time point.
2.5. Statistical Analysis
The first 6 min of data collected during the 60 min rides were omitted to account for the initial cardiac and metabolic adjustments to exercise as well as adjustments in PO required to attain the RPE that corresponded to RPEGET and RPEGET+15%. Each variable recorded during the constant RPE rides was normalized as a percentage of the value at (i.e., each value was divided by its value at and multiplied by 100 to be expressed as a percentage). The mean, normalized O2, HR, , , RER, and PO values were plotted at two min intervals from 7 to 60 min during the 60 min rides (Figure 2 and Figure 3). Polynomial regression analyses were used to determine whether the individual and mean, normalized O2, HR, , RER, and PO vs. time relationships were best fit by a linear, quadratic, or cubic model. Oxygen consumption values from each ride were averaged according to four time points (7–19 min, 21–33 min, 35–47 min, and 49–60 min) across the 60 min ride, and two separate 1 × 5 Repeated Measures (RM) ANOVAs (O2 incremental vs. O2 7–19 min vs. O2 21–33 min vs. O2 35–47 min vs. O2 49–60 min) were used to evaluate relative O2 during the 60 min rides at RPEGET and at RPEGET+15%, and how these values compared to the threshold value determined from the incremental test to exhaustion. Paired samples t-tests with Sidak-Bonferroni error correction were used to compare O2 at GET vs. O2 at GET + 15% at from the incremental test to that at 7–19 min, 21–33 min, 35–47 min, and 49–60 min of the 60 min rides. Partial eta squared () effect sizes were calculated for each RM ANOVA and Cohen d (d) effect sizes were calculated for each post hoc paired samples t-test. A type I error rate, set a priori at 5%, was considered statistically significant for all polynomial regression and RM ANOVAs analyses and an error rate of 1% was considered for all post hoc comparisons. The analyses were conducted using IBM SPSS Statistics v. 22 (Chicago, IL, USA).
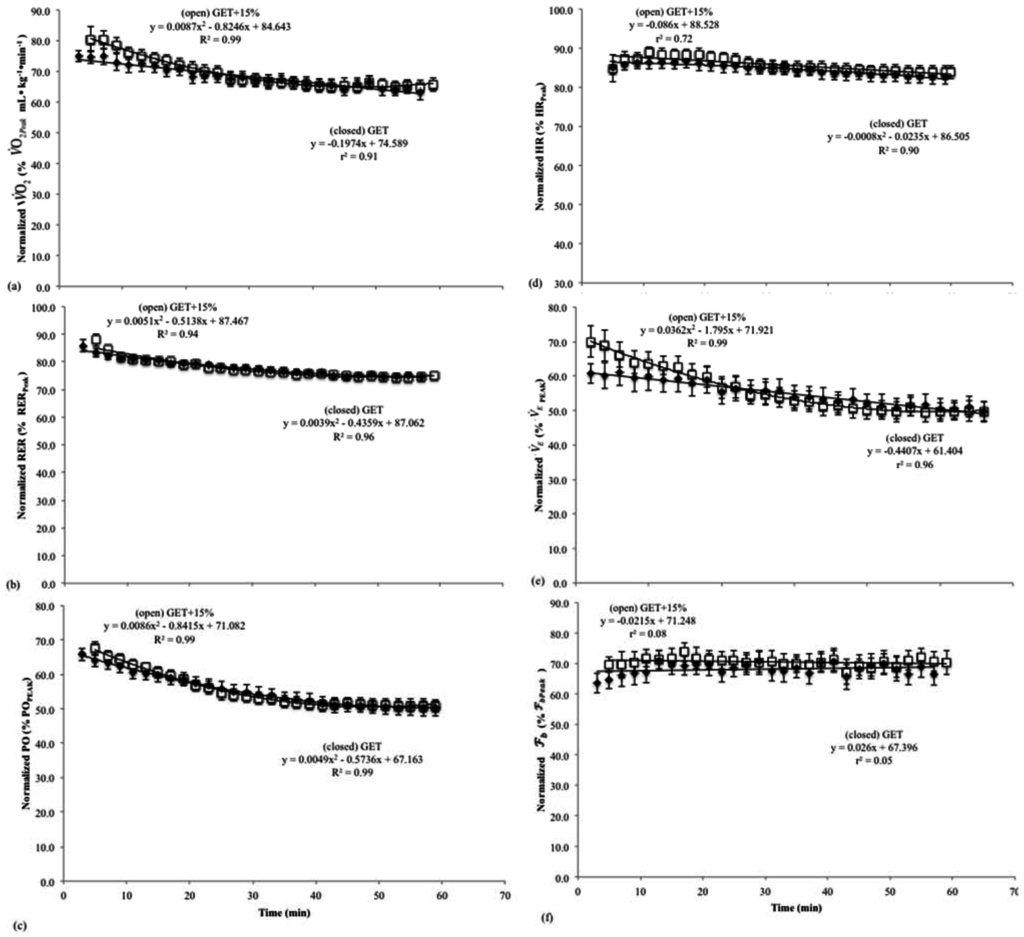
Figure 2.
Normalized mean (± SD) values for the (a) oxygen consumption (O2); (b) respiratory exchange ratio (RER); (c) power output (PO); (d) heart rate (HR); (e) minute ventilation (); and (f) breathing frequency () vs. time relationships during the 60 min continuous rides at the rating of perceived exertion (RPE) at the gas exchange threshold (RPEGET) and 15% above the GET (RPEGET+15%).


Figure 3.
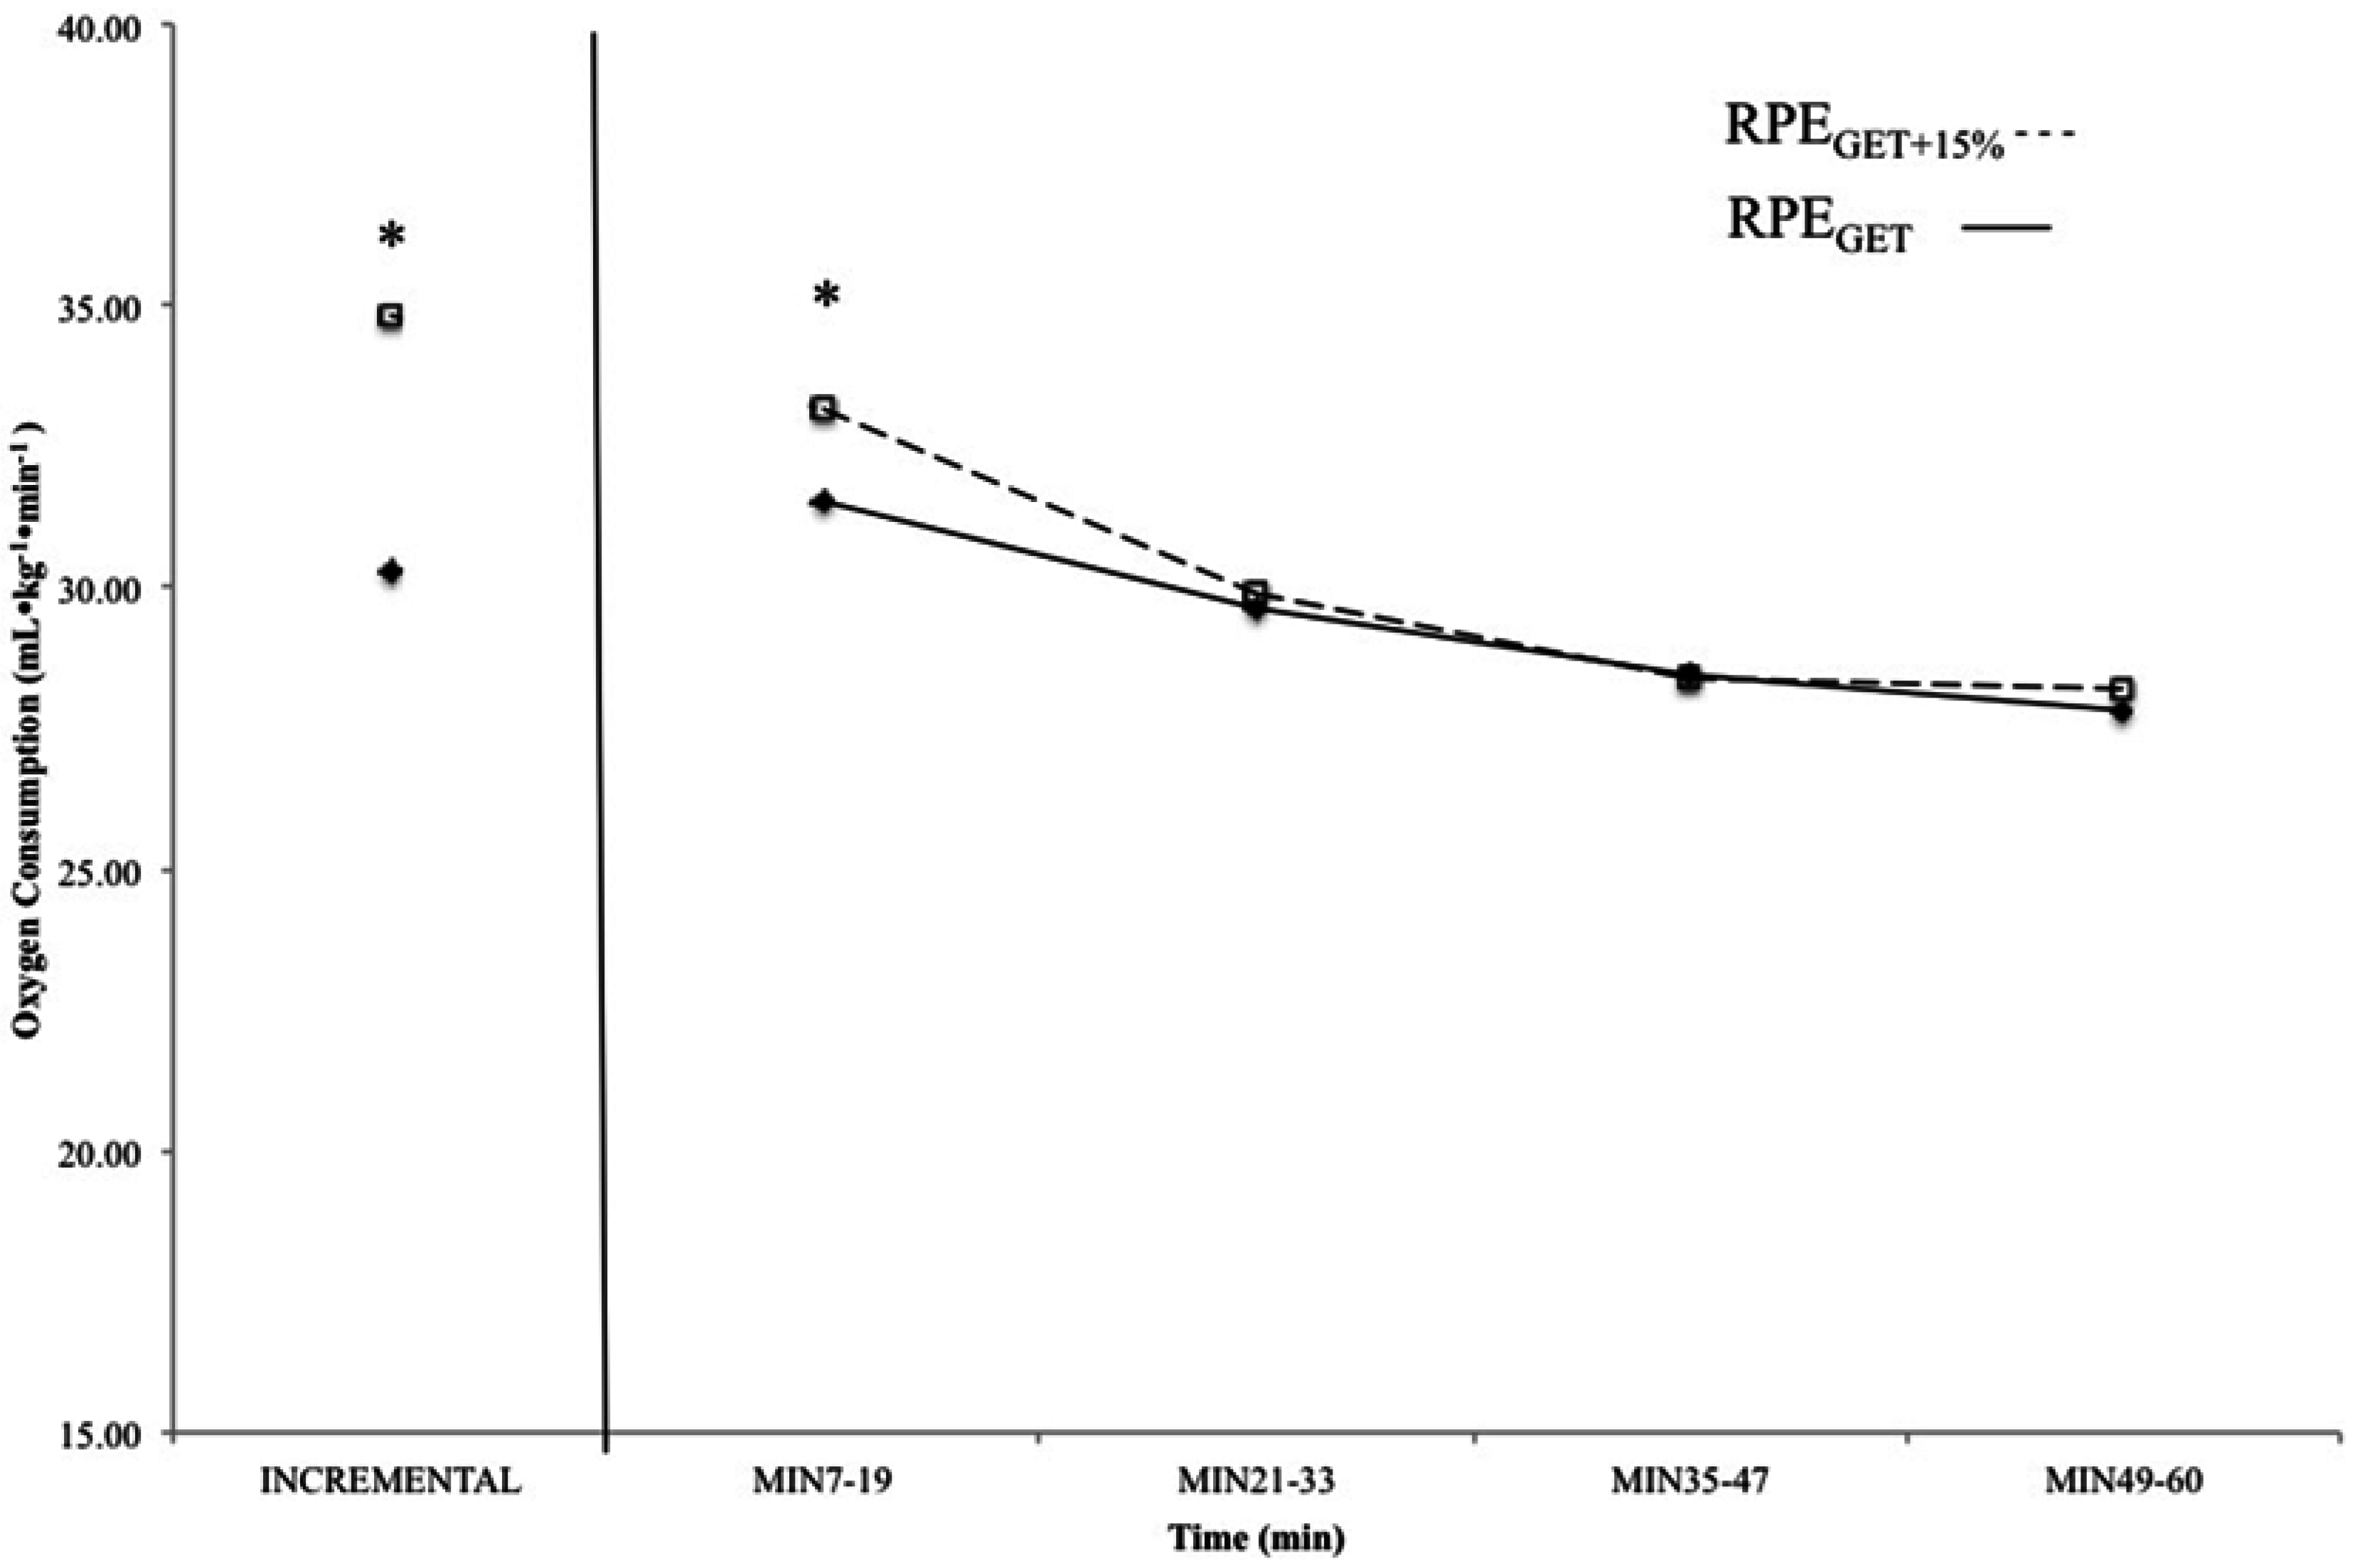
Mean, relative oxygen consumption values from the incremental test and 7–19 min, 21–33 min, 35–47 min, and 49–60 min from the 60 min continuous rides at the rating of perceived exertion (RPE) at the gas exchange threshold (RPEGET---) and 15% above the GET (RPEGET+15%---). Data from the rides at the RPE corresponding with GET are displayed with solid boxes, while those from the rides at GET + 15% are open boxes. * indicates that oxygen consumption (O2) was higher at the incremental test and 7–19 min in the RPEGET+15% than RPEGET condition (p < 0.05).
Figure 3.
Mean, relative oxygen consumption values from the incremental test and 7–19 min, 21–33 min, 35–47 min, and 49–60 min from the 60 min continuous rides at the rating of perceived exertion (RPE) at the gas exchange threshold (RPEGET---) and 15% above the GET (RPEGET+15%---). Data from the rides at the RPE corresponding with GET are displayed with solid boxes, while those from the rides at GET + 15% are open boxes. * indicates that oxygen consumption (O2) was higher at the incremental test and 7–19 min in the RPEGET+15% than RPEGET condition (p < 0.05).
3. Results
The mean O2 and PO values that corresponded to RPEGET (RPE = 14 ± 0.5) and RPEGET+15% (RPE = 16 ± 0.5) intensities were 30.3 ± 1.5 (167 ± 10 W) and 34.9 ± 1.7 mL·kg−1·min−1 (196 ± 12 W), respectively. The results of the polynomial regression analyses (Figure 2a–f) indicated that during the 60 min rides at RPEGET, there were significant, negative, linear relationships for mean, normalized O2 (r2 = 0.90) and (r2 = 0.96) vs. time; negative, quadratic relationships for mean, normalized HR (R2 = 0.90), RER (R2 = 0.96), and PO (R2 = 0.98) vs. time; and no significant change for mean, normalized (r2 = 0.04) vs. time relationship. In addition, the results of the polynomial regression analyses during the 60 min rides at RPEGET+15%, indicated that there was a significant, negative, linear relationship for mean, normalized HR (r2 = 0.72) vs. time; negative, quadratic relationships for mean, normalized O2 (R2 = 0.82), RER (R2 = 0.92), (R2 = 0.98), and PO (R2 = 0.98) vs. time, and no significant change for the mean, normalized (r2 = 0.001) vs. time relationship.
The results of the RM ANOVA indicated that there was a significant main effect for O2 during rides at RPEGET (p<0.05 = 0.40). Follow-up pairwise comparisons revealed O2 at 7–19 min was significantly (p<0.01) greater than O2 at min 35–47 and at min 49–50. In addition, O2 at 21–33 min was significantly (p<0.01) greater than that at min 35–47 and min 49–60. However, O2 corresponding to GET from the incremental test to exhaustion was not significantly different from measured O2 across the 60 min ride at RPEGET. There was also a significant main effect for O2 during rides at RPEGET+15% (p < 0.05; = 0.67). Follow-up pairwise comparisons revealed that O2 at min 7–19 was significantly greater than O2 at all other time points (21–33 min, 35–47 min, and 49–60 min) during the 60 min ride at RPEGET+15%. Furthermore, there was no difference between O2 at 35–47 min and 49–60 min, but O2 during the last 25 min of the 60 min ride was significantly different (p < 0.01) from that collected during 7–19 min and 21–33 min. However, O2 corresponding to 15% above GET from the incremental test to exhaustion was not significantly different from O2 at 7–19 min, but differed from all other time points (21–33 min, 35–47 min, and 49–60 min).
The results of the paired samples t-tests indicated that the O2 associated with the perceptual intensities, as calculated from the incremental test to exhaustion (GET and GET + 15%), were significantly different (p < 0.01; d = 0.55). In addition, comparison of the O2 associated with the initial stage of each constant RPE ride indicated that subjects maintained a higher O2 cost (p < 0.01; d = 0.67) during the first 20 min of rides at RPEGET+15% than those at RPEGET. There was no significant difference between RPEGET and RPEGET+15% for O2 at min 21–33 (p < 0.01; d = 0.10), 35–47 min (p < 0.01; d = 0.03), or min 49–60 (p < 0.01; d = 0.14) (Figure 3).
4. Discussion
In the present study, RPEGET and RPEGET+15% were 70.1% ± 1.6% and 80.8% ± 1.9% of , respectively (Table 1). The GET typically occurs at between 70% and 80% of in endurance-trained individuals [24], but at between 50% and 60% of for those who are untrained [25]. The RCP, however, typically occurs at about 50% of the difference between and GET (i.e., 85%–90% of ) in endurance-trained individuals [1]. Thus, in the present study, the RPEGET and RPEGET+15% corresponded to relative intensities similar to those of previous studies [1,6,24,25] and represented the demarcation of the moderate and heavy exercise intensity domain (RPEGET), and an intensity within the heavy domain (RPEGET+15%).
During exercise at a constant perception of effort, there are dissociations among the patterns of responses for physiological and perceptual variables typical of constant PO exercise [6,8,9]. For example, Stoudemire et al. [8] reported that during treadmill running at a constant RPE corresponding with 2.5 mmol (La−)b and 4.0 mmol (La−)b, there were dissociations among RPE, (La−)b, O2, and velocity. To maintain RPE, velocity was reduced which resulted in a decreased metabolic cost and O2 across time [8]. More recently, Cochrane et al. [6] reported dissociations among RPE, O2, HR, E, RER, and PO during continuous cycle ergometry at a constant RPE in the moderate domain. During the constant RPE rides, O2, HR, E, and RER tracked the time-dependent decreases in PO [6]. In the present study, there were similar dissociations among RPE vs. O2, HR, E, RER, and PO during continuous cycle ergometry at RPEGET and RPEGET+15%. For example, O2, HR, RER, E, and PO decreased across time during both 60 min rides. Thus, the dissociations among RPE vs. O2, HR, E, RER, and PO in the present study were similar to those of previous studies [6,8] and further supported the hypothesis that metabolic, cardiovascular, and intensity related variables do not solely mediate the perception of effort during cycle ergometry at a constant RPE within the moderate or heavy exercise intensity domains.
The pattern of responses for both the mean, normalized HR and E differed between the rides at RPEGET and RPEGET+15%. At RPEGET, the mean, normalized HR and E responses exhibited quadratic and linear decreases, respectively, while at RPEGET+15% the mean, normalized HR and E exhibited linear and quadratic decreases across the 60 min rides. Although the patterns for HR decline over time were different between the two rides, the mean, normalized HRs across the 60 min rides were similar (85.7% vs. 84.7% HRpeak). In addition, HR did not change proportionately with reductions in PO during the constant RPE rides. For example, at RPEGET+15%, greater reductions in PO were required at the initiation and throughout the 60 min rides, which likely explained the lack of a plateau and linear decline for HR during the more intense rides (Figure 2d). The participants, therefore, spent more time at their initial %HRpeak during the moderate intensity rides than during rides in the heavy domain. It has been reported [26] that during sustained, moderate intensity exercise (50%–75% ), HR “drifts” upward as the intensity of exercise is maintained. This drift in HR has been attributed to increases in cutaneous blood flow due to increases in core temperature [26]. When riding at a constant RPE within the moderate exercise intensity domain, HR initially drifted up across time, but to a lesser degree than would be expected during constant PO cycle ergometry, due to reductions in PO, which resulted in an overall quadratic decrease across time. In the heavy domain (RPEGET+15%), however, HR exhibited a linear decrease across time, which was attributed to a more rapid initial reduction in PO. The patterns of response for HR in the present study differed from those of Stoudemire et al. [8] who reported a continuous rise in HR throughout two, 30 min runs at a constant RPE. Although the mechanisms responsible for the rise in HR over time during the constant RPE runs were not discussed [8], the dissociations for RPE and HR were consistent with the findings of the present study. That is, the uncoupling of HR and RPE indicates that HR did not mediate the perception of effort during constant RPE exercise within the moderate and heavy exercise intensity domains [8,27].
In the present study, the mean, normalized E exhibited a linear decrease across time during the constant RPE rides within the moderate intensity domain. During the rides within the heavy domain (RPEGET+15%), however, the mean, normalized E exhibited a quadratic decrease across time. Previous studies [4,28] have reported different time-dependent patterns of responses for E that are, in part, dependent upon the intensity of exercise as well as the parameter being held constant. For example, Dempsey [4] reported that during moderate intensity exercise at a constant PO, E typically increases as a function of tidal volume, whereas increases at higher intensities are mediated by increases in [4]. When cycling at a constant E within the moderate domain (50%–60% O2Peak), however, tidal volume has been shown to decrease, while , core temperature, and RPE responses increased across time [28]. In the current study, both 60 min rides at RPEGET and RPEGET+15% resulted in decreases for metabolic (O2 and RER) and work intensity (PO) related variables, which indicated a decrease in the metabolic cost of the exercise. Furthermore, RPE and remained constant across time during the rides in the moderate and heavy exercise intensity domains. Thus, changes for the patterns of responses for E were not consistent with those of or the perception of effort, but they tracked decreases in metabolic cost during the 60 min rides at a constant RPE.
During both moderate and heavy intensity rides, only tracked RPE across time. The mean, normalized response did not change across time during the rides at RPEGET and RPEGET+15%. These findings were consistent with those of Cochrane et al. [6] who reported a close agreement between RPE and , but dissociations for both RPE and vs. metabolic O2 and RER), cardiovascular (HR), and ventilatory (E) responses during constant RPE cycle ergometry within the moderate intensity domain. It was hypothesized [6] that reflex actions associated with the exercise pressor reflex model of fatigue [12,29,30,31] best explained the similarity for RPE and during the constant RPE rides. According to the exercise pressor reflex model [12,29,30,31], afferent signals from small group III (mechanical changes) and IV afferents (metabolic changes) from working thigh and respiratory muscles mediate the ventilatory, cardiovascular, and RPE responses during moderate and heavy intensity exercise [2,12,32,33]. It has also been suggested [11] that in addition to mediating cardioventilatory responses, group III and IV afferents may have a “critical role” in the regulation of the perception of effort during dynamic exercise. For example, a lower perception of effort was reported during exercise with an intact somatosensory feedback system, which incorporated both group III and IV afferents, than during exercise with blocked spinal receptors [11]. In the present study, it is unlikely that there was a continuous build-up of metabolic byproducts during either of the constant RPE rides, because of the decreases in metabolic cost O2 and RER) and work intensity (PO). For the rides beginning in the heavy exercise intensity domain, there may have been an increase in (La−)b typical of heavy intensity exercise during the first 20 min of the rides, however, all participants ended the 60-min RPEGET+15% rides below the GET (65.7% ± 2.2% ) in the moderate domain. These findings did not support an increase in metabolic byproducts ((La−)b, H+, K+) or inadequate supplies of ATP [1,34,35]. In addition, there was likely a reduction in required central command due to the decreases in PO, which was tracked by reductions in HR and E across the 60 min rides. Previous studies [11,32,36] have suggested that group IV afferents may be linked to changes in central command and the cardiovascular system. It has been reported [11] that an increased rate of discharge from group IV afferents tracked increases in E, HR, and central command during continuous, constant PO cycle ergometry. In the current study, there were reductions in HR, E, and, potentially, a reduction in central command during the 60 min constant RPE rides, and therefore, group IV afferents may not have the same patterns of discharge during exercise at a constant RPE as those reported during constant PO exercise [11,28].
The results of the present study also have implications for the regulation of exercise intensity during prolonged cycling exercise. For example, there was no significant difference between the O2 throughout the 60 min constant RPE rides at RPEGET (Figure 3). There were differences, however, between the O2 at 15% above the GET, as determined from the incremental test, and the O2 during the last 40 min of the 60 min constant RPE ride at RPEGET+15% (Figure 3). These findings indicated that the use of a perceptual intensity (RPEGET) may be used for training at the gas exchange threshold, in place of more expensive monitoring methods such as (La−)b, heart rate, and oxygen consumption, during cycle ergometry exercise. However, cycling at a higher perceptual intensity (GET + 15%), such as that associated with the heavy exercise intensity domain, did not result in the same starting intensity (O2) after 20 min, and therefore, prescribing exercise associated with a higher RPE may only be useful for the first 20 min of cycling exercise. Future studies should compare the effects of multiple training visits at a percentage of O2 (GET and GET + 15%) and a perceptual intensity (RPE) on markers of aerobic performance.
The patterns of responses for physiological variables during exercise at a constant perceptual rating (RPE) within the moderate and heavy exercise intensity domains differ from those typically observed during constant power output exercise [1]. Given that it is not uncommon for cyclists to perform rides at varying workloads across time, these findings may provide applications for the prescription and tracking of performance. The finding that the O2 corresponding with the GET, a commonly used threshold for tempo training exercises, was maintained by controlling perception during a 60 min cycling test also speaks to the ability of cyclists to maintain work at the demarcation point of the moderate and heavy exercise intensity domains. There is, however, a need to extend the findings of the present study on the effect of training at a constant RPE (RPEGET) vs. a more traditional prescription (%HRpeak or % O2peak) on outcome variables associated with aerobic performance (onset of blood lactate, occurrence of GET, substrate utilization (RER), and O2peak). Our study demonstrates that there may be a relationship between how one perceives exercise and the underlying mechanisms associated with breathing patterns and that the ability to regulate, or pace, cycling exercise at a constant RPE may be tied to the exercise intensity corresponding to the work bout.
In summary, the patterns of response for , which did not change across time but tracked RPE, were similar during both moderate and heavy intensity cycle ergometry exercise. In addition, the O2 associated with an RPE grounded threshold corresponding to the GET appeared to be sustainable for up to 60 min of cycling exercise, while that above the GET could only be maintained for the first 20 min of exercise. The findings of the current study, as well as those of previous studies [6,10,15,18] supported the hypothesis that small group III afferents associated with mechanical distortions within the working thigh and respiratory muscles may influence both perceptual and respiratory responses associated with the frequency of breathing that were independent of changes in metabolic cost, cardiovascular, and ventilation responses. In addition, exercising at the RPE corresponding to the GET may be useful as a pacing or training tool.
Author Contributions
Kristen C. Cochrane was the primary manuscript writer, and carried out data acquisition, data analysis, and data interpretation. Ethan C. Hill, Cory M. Smith, and Nathaniel D.M. Jenkins were significant contributors to data acquisition, read and approved the final manuscript, and were manuscript reviewers/revisers. Joel T. Cramer, Glen O. Johnson, and Richard J. Schmidt were significant manuscript reviewers/revisers. Terry J. Housh was the primary manuscript reviewer/reviser, a substantial contributor to concept and design, and contributed to data interpretation.
Conflicts of Interest
The authors declare no conflict of interest.
References
- Gaesser, G.A.; Poole, D.C. The slow component of oxygen uptake kinetics in humans. Exerc. Sport Sci. Rev. 1996, 24, 35–71. [Google Scholar] [CrossRef] [PubMed]
- Poole, D.C.; Ward, S.A.; Gardner, G.W.; Whipp, B.J. Metabolic and respiratory profile of the upper limit for prolonged exercise in man. Ergonomics 1988, 31, 1265–1279. [Google Scholar] [CrossRef] [PubMed]
- Whipp, B.J. Dynamics of pulmonary gas exchange. Circulation 1987, 76, 19–29. [Google Scholar]
- Dempsey, J.A. Is the lung built for exercise. Med. Sci. Sport Exerc. 1986, 18, 143–155. [Google Scholar] [CrossRef]
- Housh, T.J.; Perry, S.R.; Bull, A.J.; Johnson, G.O.; Ebersole, K.T.; Housh, D.J.; de Vries, H.A. Mechanomyographic and electromyographic responses during submaximal cycle ergometry. Eur. J. Appl. Physiol. 2000, 83, 381–387. [Google Scholar] [CrossRef] [PubMed]
- Cochrane, K.C.; Housh, T.J.; Bergstrom, H.C.; Jenkins, N.D.M.; Johnson, G.O.; Schmidt, R.J.; Cramer, J.T. Physiological responses during cycle ergometry at a constant perception of effort. Int. J. Sports Med. 2015, 36, 466–473. [Google Scholar] [CrossRef] [PubMed]
- Lajoie, C.; Laurencelle, L.; Trudeau, F. Physiological responses to cycling for 60 min at maximal lactate steady state. Can. J. Appl. Physiol. 2000, 25, 250–261. [Google Scholar] [CrossRef] [PubMed]
- Stoudemire, N.M.; Wideman, L.; Pass, K.A.; McGinnes, C.L.; Gaesser, G.A.; Weltman, A. The validity of regulating blood lactate concentration during running by ratings of perceived exertion. Med. Sci. Sport. Exerc. 1996, 28, 490–495. [Google Scholar] [CrossRef]
- Lander, P.J.; Butterly, R.J.; Edwards, A.M. Self-paced exercise is less physically challenging than enforced constant pace exercise of the same intensity: Influence of complex central metabolic control. Br. J. Sports Med. 2009, 43, 789–795. [Google Scholar] [CrossRef] [PubMed]
- Ribeiro, J.P.; Hughes, V.; Fielding, R.A.; Holden, W.; Evans, W.; Knuttgen, H.G. Metabolic and ventilatory responses to steady state exercise relative to lactate threshold. Eur. J. Appl. Physiol. 1986, 55, 215–221. [Google Scholar] [CrossRef]
- Amann, M.; Blain, G.M.; Proctor, L.T.; Sebranek, J.J.; Pegelow, D.F.; Demsey, J.A. Group III and IV afferents contribute to ventilatory and cardiovascular responses to rhythmic exercise in humans. J. Appl. Physiol. 2010, 109, 966–976. [Google Scholar] [CrossRef] [PubMed]
- Kaufman, M.P.; Hayes, S.G. The exercise pressor reflex. Clin. Auton. Res. 2002, 12, 429–439. [Google Scholar] [CrossRef] [PubMed]
- Marcora, S.M. Do we really need a central governor to explain brain regulation of exercise performance. Eur. J. Appl. Physiol. 2008, 104, 929–931. [Google Scholar] [CrossRef] [PubMed]
- Mitchell, J.H.; Kaufman, M.F.; Iwamoto, G.A. The exercise pressor reflex: Its cardiovascular effects, afferent mechanisms, and central pathways. Ann. Rev. Physiol. 1983, 45, 229–242. [Google Scholar] [CrossRef] [PubMed]
- St. Clair Gibson, A.; Schabort, E.J.; Noakes, T.D. Reduced neuromuscular activity and force generation during prolonged cycling. Am. J. Regul. Integr. Comp. Physiol. 2001, 281, R187–R196. [Google Scholar]
- Edwards, A.M.; Polman, R.C.J. Pacing and awareness: Brain regulation of physical activity. Sport Med. 2013, 43, 1057–1064. [Google Scholar] [CrossRef] [PubMed]
- Abbiss, C.R.; Laursen, P. Models to explain fatigue during prolonged endurance cycling. Sport Med. 2005, 35, 866–898. [Google Scholar] [CrossRef]
- Pescatello, L.S.; Arena, R.; Riebe, D.; Thompson, P.D. ACSM's Guidelines for Exercise Testing and Prescription; Lippincott Williams & Wilkins: Philadelphia, PA, USA, 2014. [Google Scholar]
- Borg, G.A. Perceived exertion as an indicator of somatic stress. Scan. J. Rehab. Med. 1970, 2, 92–98. [Google Scholar]
- Borg, G.A. Psychophysical bases of perceived exertion. Med. Sci. Sport. Exerc. 1982, 14, 377–381. [Google Scholar] [CrossRef]
- Borg, G. Borg’s Perceived Exertion and Pain Scales; APA PsycNET: Champaign, IL, USA, 1998. [Google Scholar]
- Robergs, R.A.; Dwyer, D.; Astorino, T. Recommendations for improved data processing from expired gas analysis indirect calorimetry. Sport Med. 2010, 49, 95–111. [Google Scholar] [CrossRef] [PubMed]
- Beaver, W.L.; Wasserman, K.; Whipp, B.J. A new method for detecting anaerobic threshold by gas exchange. J. Appl. Physiol. 1986, 60, 2020–2027. [Google Scholar] [PubMed]
- Davis, J.A. Anaerobic threshold: Review of the concept and directions for future research. Med. Sci. Sport Exerc. 1985, 17, 6–18. [Google Scholar] [CrossRef]
- Davis, J.A.; Frank, M.H.; Whipp, B.J.; Wasserman, K. Anaerobic threshold alterations caused by endurance training in middle-aged men. J. Appl. Physiol. 1979, 46, 1039–1046. [Google Scholar] [PubMed]
- Coyle, E.F.; Gonzalez-Alonso, J. Cardiovascular drift during prolonged exercise: New perspectives. Exerc. Sport. Sci. Rev. 2001, 29, 88–92. [Google Scholar] [CrossRef] [PubMed]
- Mihevic, P.M. Sensory cues for perceived exertion: A review. Med. Sci. Sports Exerc. 1981, 13, 150–163. [Google Scholar] [CrossRef] [PubMed]
- Martin, B.J.; Morgan, E.J.; Zwillich, C.W.; Weil, J.V. Influence of exercise hyperthermia on exercise breathing pattern. J. Appl. Physiol. 1979, 47, 1039–1042. [Google Scholar] [PubMed]
- Amann, M.; Proctor, L.T.; Sebranek, J.J.; Eldridge, M.W.; Pegelow, D.F.; Dempsey, J.A. Somatosensory feedback from the limbs exerts inhibitory influences on central neural drive during whole body endurance exercise. J. Appl. Physiol. 2008, 105, 1714–1724. [Google Scholar] [CrossRef] [PubMed]
- Amann, M.; Blain, G.M.; Proctor, L.T.; Sebranek, J.J.; Pegelow, D.F.; Dempsey, J.A. Implications of group III and IV muscle afferents for high-intensity endurance exercise performance in humans. J. Appl. Physiol. 2011, 589, 5299–5309. [Google Scholar] [CrossRef] [PubMed]
- Hayes, S.G.; Kaufman, M.P. Gadolinium attenuates exercise pressor reflex in cats. Am. J. Physiol. Heart Circ. Physiol. 2001, 280, H2153–H2161. [Google Scholar] [PubMed]
- McCord, J.L.; Kaufman, M.P. Reflex Autonomic Responses Evoked by Group III and IV Muscle Afferents. In Translational Pain Research: From Mouse to Man; Kruger, L., Light, A.R., Eds.; CRC Press: Boca Raton, FL, USA, 2009. [Google Scholar]
- Garland, S.J.; Kaufman, M.P. Role of muscle afferents in the inhibition of motoneurons during fatigue. Adv. Exp. Med. Biol. 1995, 384, 271–278. [Google Scholar] [PubMed]
- Hug, F.; Faucher, M.; Kipson, N.; Jammes, Y. EMG signs of neuromuscular fatigue related to the ventilatory threshold during cycling exercise. Clin. Physiol. Funct. Imag. 2003, 23, 208–214. [Google Scholar] [CrossRef]
- Enoka, R.M.; Stuart, D.G. Neurobiology of muscle fatigue. J. Appl. Physiol. 1992, 72, 1631–1648. [Google Scholar] [PubMed]
- Goodwin, G.M.; McCloskey, D.I.; Mitchel, J.H. Cardiovascular and respiratory responses to changes in central command during isometric exercise at constant muscle tension. J. Physiol. 1972, 226, 173–190. [Google Scholar] [CrossRef] [PubMed]
© 2015 by the authors; licensee MDPI, Basel, Switzerland. This article is an open access article distributed under the terms and conditions of the Creative Commons Attribution license (http://creativecommons.org/licenses/by/4.0/).