Article

Laser Polishing of Ti6Al4V Fabricated by Selective Laser Melting

1
School of Materials Science and Engineering, Hebei University of Technology, Tianjin 300130, China
2
Tianjin Key Laboratory of Laminating Fabrication and Interface Control Technology for Advanced Materials, Hebei University of Technology, Tianjin 300130, China
3
College of Applied Sciences, Beijing University of Technology, Bejing 100124, China
*
Authors to whom correspondence should be addressed.
Metals 2020, 10(2), 191; https://doi.org/10.3390/met10020191
Submission received: 17 December 2019 / Revised: 23 January 2020 / Accepted: 24 January 2020 / Published: 28 January 2020

Abstract

:
Selective laser melting (SLM) is emerging as a promising 3D printing method for orthopedic and dental applications. However, SLM-based Ti6Al4V components frequently exhibit high roughness values and partial surface defects. Laser polishing (LP) is a newly developed technology to improve the surface quality of metals. In this research, LP is applied to improve the surface finish of components. The results show that the laser beam can neatly ablate the aggregates of metallic globules and repair cracks and pores on the surface, resulting in a smooth surface with nanocomposites. Overall, the results indicate that using LP optimizes surface morphology to favor fatigue behavior and osteoblastic differentiation. These findings provide foundational data to improve the surface roughness of a laser-polished implant and pave the way for optimized mechanical behavior and biocompatibility via the laser process.

1. Introduction

Selective laser melting (SLM), as one of the most promising technologies for producing complex components, has elicited widespread attention due to its advantages of design freedom and efficient production, which break through the limitations of traditional processing technology. In short, SLM provides flexibility for the individualized design of implants in bone fusion applications [1,2]. Despite these advantages, the biomedical application of SLM remains limited due to the unacceptable surface finish. The high surface roughness of SLM components, typically ranging from Ra 5 µm to Ra 20 µm, can result in the stair–step effect, low-dimensional precision, increased friction, and, consequently, a low therapeutic effect [3,4,5]. Various conventional post-processing treatments, such as sandblasting, chemical polishing, electrolytic polishing, machining, ultrasonic polishing, and oxidation [6,7], have been used on metallic AM (Additive Manufacturing) components to reduce their surface roughness. However, several drawbacks, such as being time-consuming, it is difficult to obtain machine precision components, chemical risks, and low efficiency, limit the clinical application and development of these treatments.
Laser polishing (LP) technology provides a solution without affecting the geometric accuracy of SLM small parts. Compared to traditional mechanical methods, it has the ability of a high-speed polishing process and low labor costs. Considerable attention has been recently directed toward LP, which cannot only reduce surface roughness but can also improve mechanical properties, such as corrosion resistance, wettability, microhardness, and wear resistance [8,9]. Marimutuh et al. [10] used a continuous wave fiber laser with a high operating speed to improve the surface finish of components fabricated via laser AM from Ra 10.2 µm to approximately Ra 2.4 µm. Ma et al. [11] investigated the effect of LP on the surface finish of Ti6Al4V alloy using a local polishing method without causing damage to the substrate. Yung et al. [12] used a fiber laser in a pulse mode to reduce the surface roughness of CoCr alloy components with the capability to produce a localized surface treatment. Bhaduri et al. [13] also reduced the surface roughness of 316L stainless steel components produced via AM from more than Ra 17.71 µm to less than Ra 1.21 µm through LP, without affecting the geometrical accuracy of the native SLM samples. However, the study showed that LP treatment can change surface morphology and construct nanostructures [14,15]. In addition, few studies have reported on the changes in the biological properties of materials after LP treatment. A comprehensive analysis of the roughness, porosity, fatigue behavior, and biocompatibility, along with the relationships between them, of components after LP should be conducted prior to applying LP technology to implantable medical devices.
LP was adopted to improve the surface conditions and roughness of Ti6Al4V alloy built-up via SLM. The surface roughness and porosity of the components were studied, and the effect of surface finish improvement on the mechanical properties of the components was also investigated [16,17]. Moreover, the attachment behavior and proliferation behavior of osteoblast cells (MC3T3-E1) on polished samples were evaluated through in-vitro experiments [18]. The findings of this study can play a guiding role in other processes that involve biomedical materials.

2. Materials and Methods

2.1. Material Preparation

The commercial Ti6Al4V alloy was used, and its chemical composition is shown in Table 1. As shown in Figure 1a, the specimens of tensile and fatigue were manufactured through the SLM of Ti6Al4V powder supplied by EOS GmbH Electro Optical Systems Company (Munich, Germany) with a density of 4.41 g/cm3, whose roughness Ra was 10.2 µm. A schematic view of the LP experiment is shown in Figure 1b. The distances traveled by laser beam on the X and Y were 18 mm and 4 mm, respectively. Fiber laser, with the advantages of high energy and a large heat-affected area, is suitable for rapid cutting, melting, and other processing [19,20]. But it is not suitable for the fine surface processing of the additive manufacturing of small parts. Although the femtosecond laser source has the advantage of small heat-affected areas, it has a high cost, low stability, and a complex operation [21,22]. At present, it is not enough to realize the widely industrial applications. A nanosecond laser, with low costs, is easy to operate and the heat-affected area is smaller than a fiber laser. At present, it has been widely used in industry, so the nanosecond laser has better feasibility. A nanosecond pulsed fiber laser (1064 nm, 270 ns pulse duration, 50 kHz repetition rate, 150 µm spot size, 75 µm hatching pitch, and 3750 mm/s beam scanning speed) with a laser scanning galvanometer system was used to polish the samples. There are three parameters that could affect the laser polishing effect: The pulse overlap factor along X, the pulse overlap factor along Y%, and laser energy density. Previous studies [11,13] have shown that the overlap factor’s value of 50% was the optimal process parameter. Therefore, a different energy density was chosen to study the polishing effect. The polishing parameters are provided in Table 2. While the overlap factors along X and Y were ascertained using O P x = ( 1 p D ) × 100 % and O P y = ( 1 V D f ) × 100 % (v, beam scanning speed; f, repetition rate; D, beam spot diameter; p, hatching pitch). All the samples were polished in a rectangular cavity under an argon atmosphere to prevent oxidation. The argon gas was transported at 12 L/min and 6 bar pressure. After LP, all the samples underwent annealing at 800 °C on air for 4 h to relieve residual stresses.

2.2. Characterization

A scanning electron microscope (SEM, JSM-7100F, Tokyo, Japan) and a laser scanning confocal microscope (LSCM, VL2000DX-SVF18SP, Yokohama, Japan) were used to observe surface morphology. The LSCM system captured 2D project images of different heights and created the 3D surface topography image. Then, software (version 5.0, LSM Image Browser, Yokohama, Japan) processed the surface height data and determined Ra [23]. The polished area of the specimen was randomly chosen for to be examined via LSCM. The tests were conducted at least three times, and all values were reported as the mean and standard deviation. The surface roughness was measured using an LSCM at 20x with a wavelength cutoff of 100 μm. The wettability of the sample was assessed by measuring the contact angles of the surfaces using the sessile drop method [24]. The porosity of the samples was visualized and assessed with micro X-ray computed tomography (CT, nano voxel 4000, Tianjin, China) at 150 kV. The hardness of the sample surface was measured using a Vickers hardness tester with a loading force of 0.96 N. Three points were randomly set for each load, and the values were averaged as the microhardness of each data point with the standard deviation evaluation method. Tensile tests (n = 3/group) were performed using a tensile machine at a velocity of 1 mm/min at room temperature (RT). Fatigue tests were conducted for 4 types of specimens at five stress level via an Instron E10000 fatigue test system (Instron, Canton, MA, USA), the axial stress control was with R = 2 and the frequency was 20 Hz. The morphology of the fatigue fracture surface was analyzed via SEM.

2.3. Cell Culture and Morphology

MC3T3-E1 cells obtained from American Type Culture Collection (ATCC, Rockville, MD, USA) were selected as the cell line to investigate the osteoblastic cell response on surfaces. For each experiment, MC3T3-E1 cells were seeded (density: 10,000 cells/cm2) directly onto samples surfaces in a 48-well plate and were then cultured at 37 °C in a 5% CO2 incubator. The culture medium used was Dulbecco’s Modified Eagle Medium (DMEM, Honolulu, HI, USA). After culturing for 12 h, the morphology of the cells on the surface of the samples were visualized using a laser scanning confocal microscope (FV1000, Olympus, Tokyo, Japan). The procedure of cell staining could be found in the previous work [25].

2.4. Cell proliferation

A cell-count-kit8 (CCK-8, Solarbio, Tianjin, China) was used to further study the influence of LP on cell proliferation. After 1, 4, and 7 days of incubation, CCK-8 solutions were added to each well (100 µL/well) for 4 h of incubation. Lastly, 100 µL of supernatant was extracted to new 96-well culture plates from each well. The absorbance value of the supernatant was measured at 570 nm with a microplate reader (Model 680, Hercules, CA, USA). In total, 36 samples were conducted for 4 types of specimens for 1, 4, and 7 days. All the data were expressed as means ± standard deviations of three individual samples of each group. Analysis of Variance (ANOVA), with Tukey’s post-hoc test, was performed to determine the differences among the groups and the effect of LP on cell viability. A difference with the p values of ¢0.05 was considered statistically significant and indicated by an asterisk (*).

3. Results and Discussion

3.1. Surface Morphology

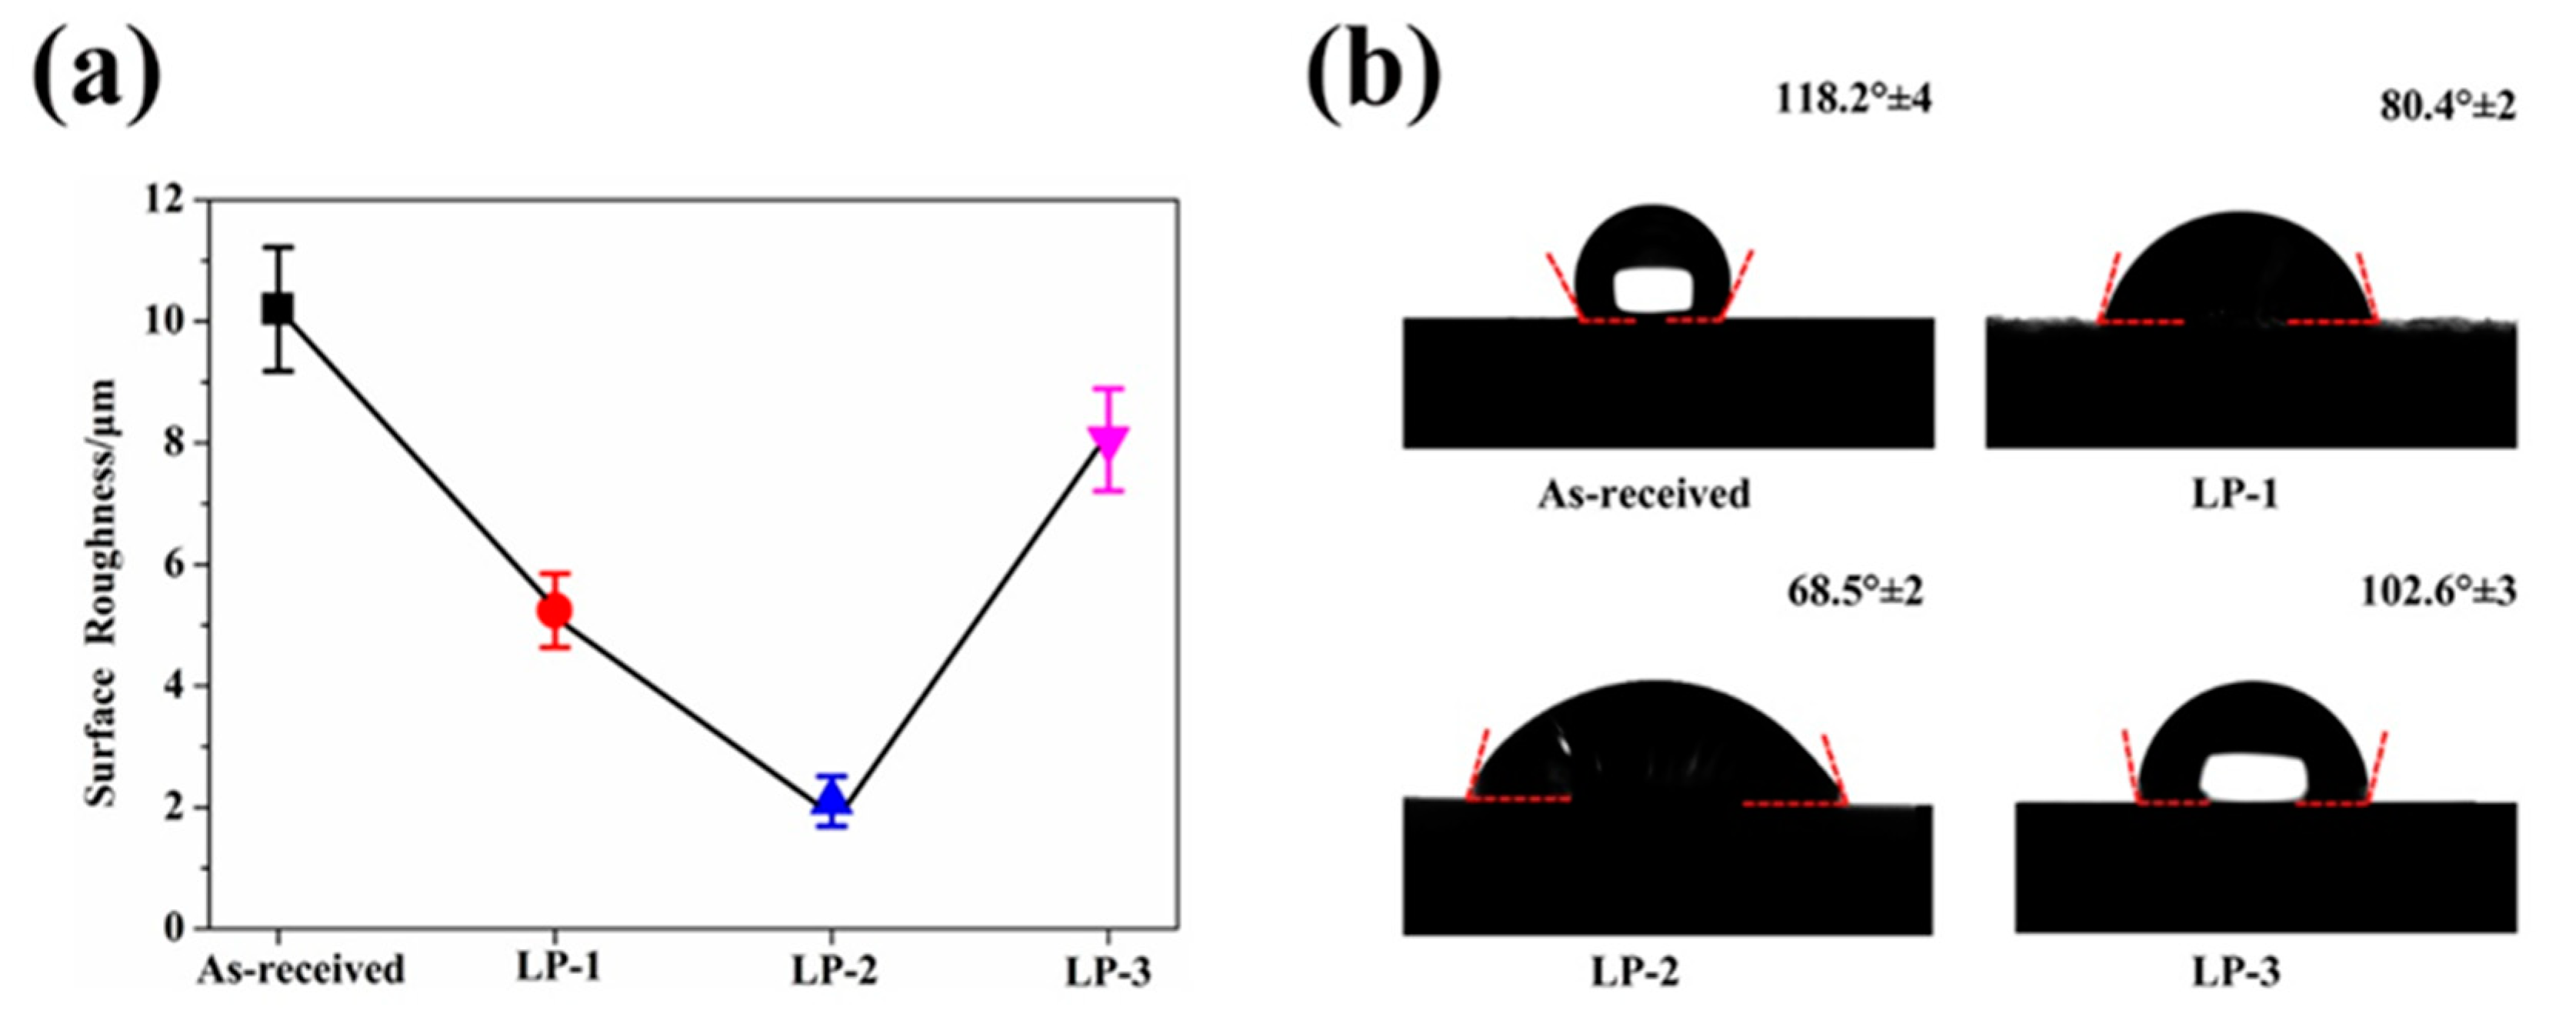
The SEM image in Figure 2a shows that the as-received sample retained aggregates of metallic globules that were only loosely bonded during AM. As shown in Figure 2b, some aggregated powders were melted and fused onto the surface, but some small particles and microcracks still existed on the surface of the LP-1 sample. Figure 2c shows that the LP-2 sample was polished well, and defects, such as micro-holes and cracks, were eliminated. By contrast, Figure 2d shows that several reconstructed islands and micro-holes were observed on the LP-3 sample. The peak-valley height of the as-received sample was 373 µm Figure 3a. The peak-valley value decreased with an increase in laser energy after LP treatment, which was 150 µm for the LP-1 sample (Figure 3b) and 30 µm for the LP-2 sample (Figure 3c). However, once the laser energy continued to increase, higher energy density resulted in ablation and surface over melting. Hence, the peak-valley height of the LP-3 sample (Figure 3d) increased to 215 µm. Surface roughness is one of the key geometric characteristic parameters of surface topography; it affects the biocompatibility characteristics of metallic implants. As shown in Figure 4a, the as-received sample had the highest Ra of 10.2 µm, and those of the LP-1 sample and LP-2 sample decreased to 8.05 µm and 2.1 µm, respectively. When the laser energy continued to increase, roughness rose to 5.24 µm.
Two surface process mechanisms are assumed to exist: surface shallow melting (SSM) and surface over melting (SOM) [26]. In the SSM regime (LP-1 laser parameters, LP-2 laser parameters), when the morphological apex of the surface is melted by a laser pulse, surface tension is produced by the gradients of temperature and the concentration distribution on the interface of two fluids [27]. The highest temperature is recorded in the molten pool center. However, the Ti6Al4V alloy has a negative temperature gradient of surface tension [28]. The edge of the Ti alloy melted pool has the highest surface tension. Then, the force is driven to the outer edge, smoothing the surface. In the SOM regime (LP-3 laser parameters), when the depth of energy density increases, the surface becomes completely molten. The movement of the laser beam causes the molten material under it to be pulled away toward the solidifying front, developing and relaxing the periodic structure of the surface with low frequency and high amplitude. Therefore, a ripple is formed and surface roughness is increased. This mass flow phenomenon can be attributed to the surface temperature difference between the melted pool and the solidifying zone, resulting from the motion of the laser beam.
Figure 4b shows the contact angle of the as-received sample and the LP samples. The as-received sample was relatively hydrophobic with a contact angle of 118.2°64. After LP, the contact angles of the LP-1 sample, LP-2 sample, and LP-3 sample decreased to 80.4°±2°, 68.5°±2° and 102.6°±3°, respectively. The laser treatment resulted in significant changes in surface morphology, which affected wettability. Several papers have reported a positive correlation between surface topography and wettability [29,30].

3.2. Surface Porosity

Figure 5a,b show the reconstructed false-color images of the as-received and LP-2 sample. The volume, position, dimensions, and surface can be determined for each defect. Compared with the as-received sample, the surface voids of the LP-2 sample were reduced after LP. The porosity volume of the as-received sample was relatively well-distributed. As shown in Figure 5c, the porosity volume of the LP-2 sample sharply decreased to 0.02% from 0.68% within the range of 0–10 µm from the top layer, and then gradually increased to 0.69% within the range of 60–70 µm. Then, no significant variation was observed between the as-received and LP-2 samples from 70–100µm and 100–200µm.
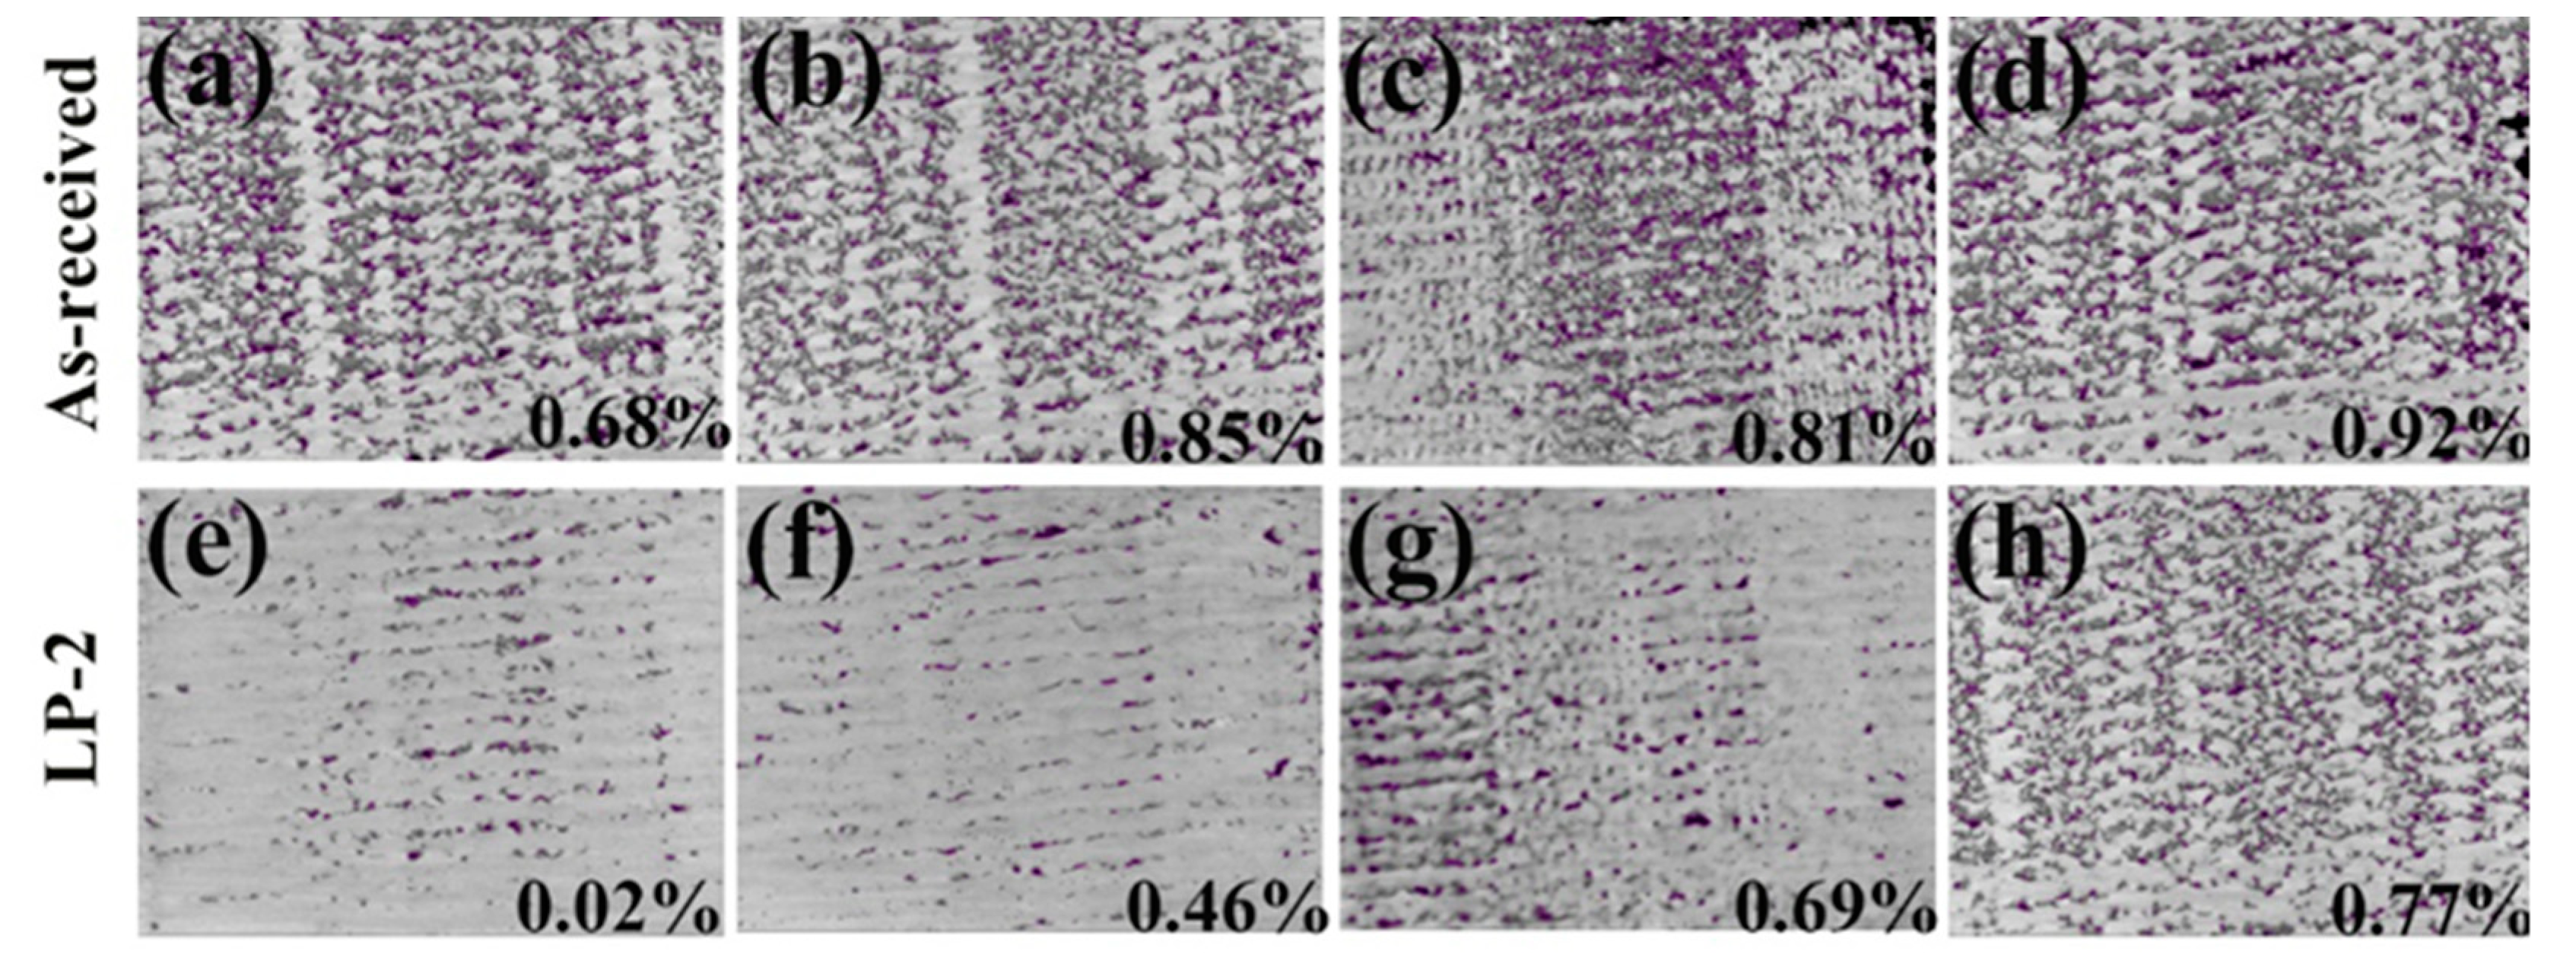
To qualitatively analyze pore distribution, the sample was sliced from different distances to the surface and the overlapping images of all the slices in the selected volumes are shown in Figure 6. All the defects in the selected volume are depicted in a single compressed image. The as-received sample (Figure 6a–d), in which many voids were uniformly distributed with a value of 0.68%, 0.85%, 0.81%, and 0.92% at different distances. The porosity of the LP-2 sample decreased significantly to 0.02% (Figure 6e) at the distance from the surface of 0–10 μm and then gradually increased to 0.46%, 0.69%, and 0.77% at different distances. In particular, the image at a distance range of 0–10 μm showed the lowest average porosity of the shallowest surface, due to LP reducing the surface porosity and forming a relatively denser subsurface layer. Meanwhile, the porosity at a distance range of 70–100 μm was similar to that of the as-received sample, indicating that the influence area of LP was about 100 μm.

3.3. Mechanical Properties

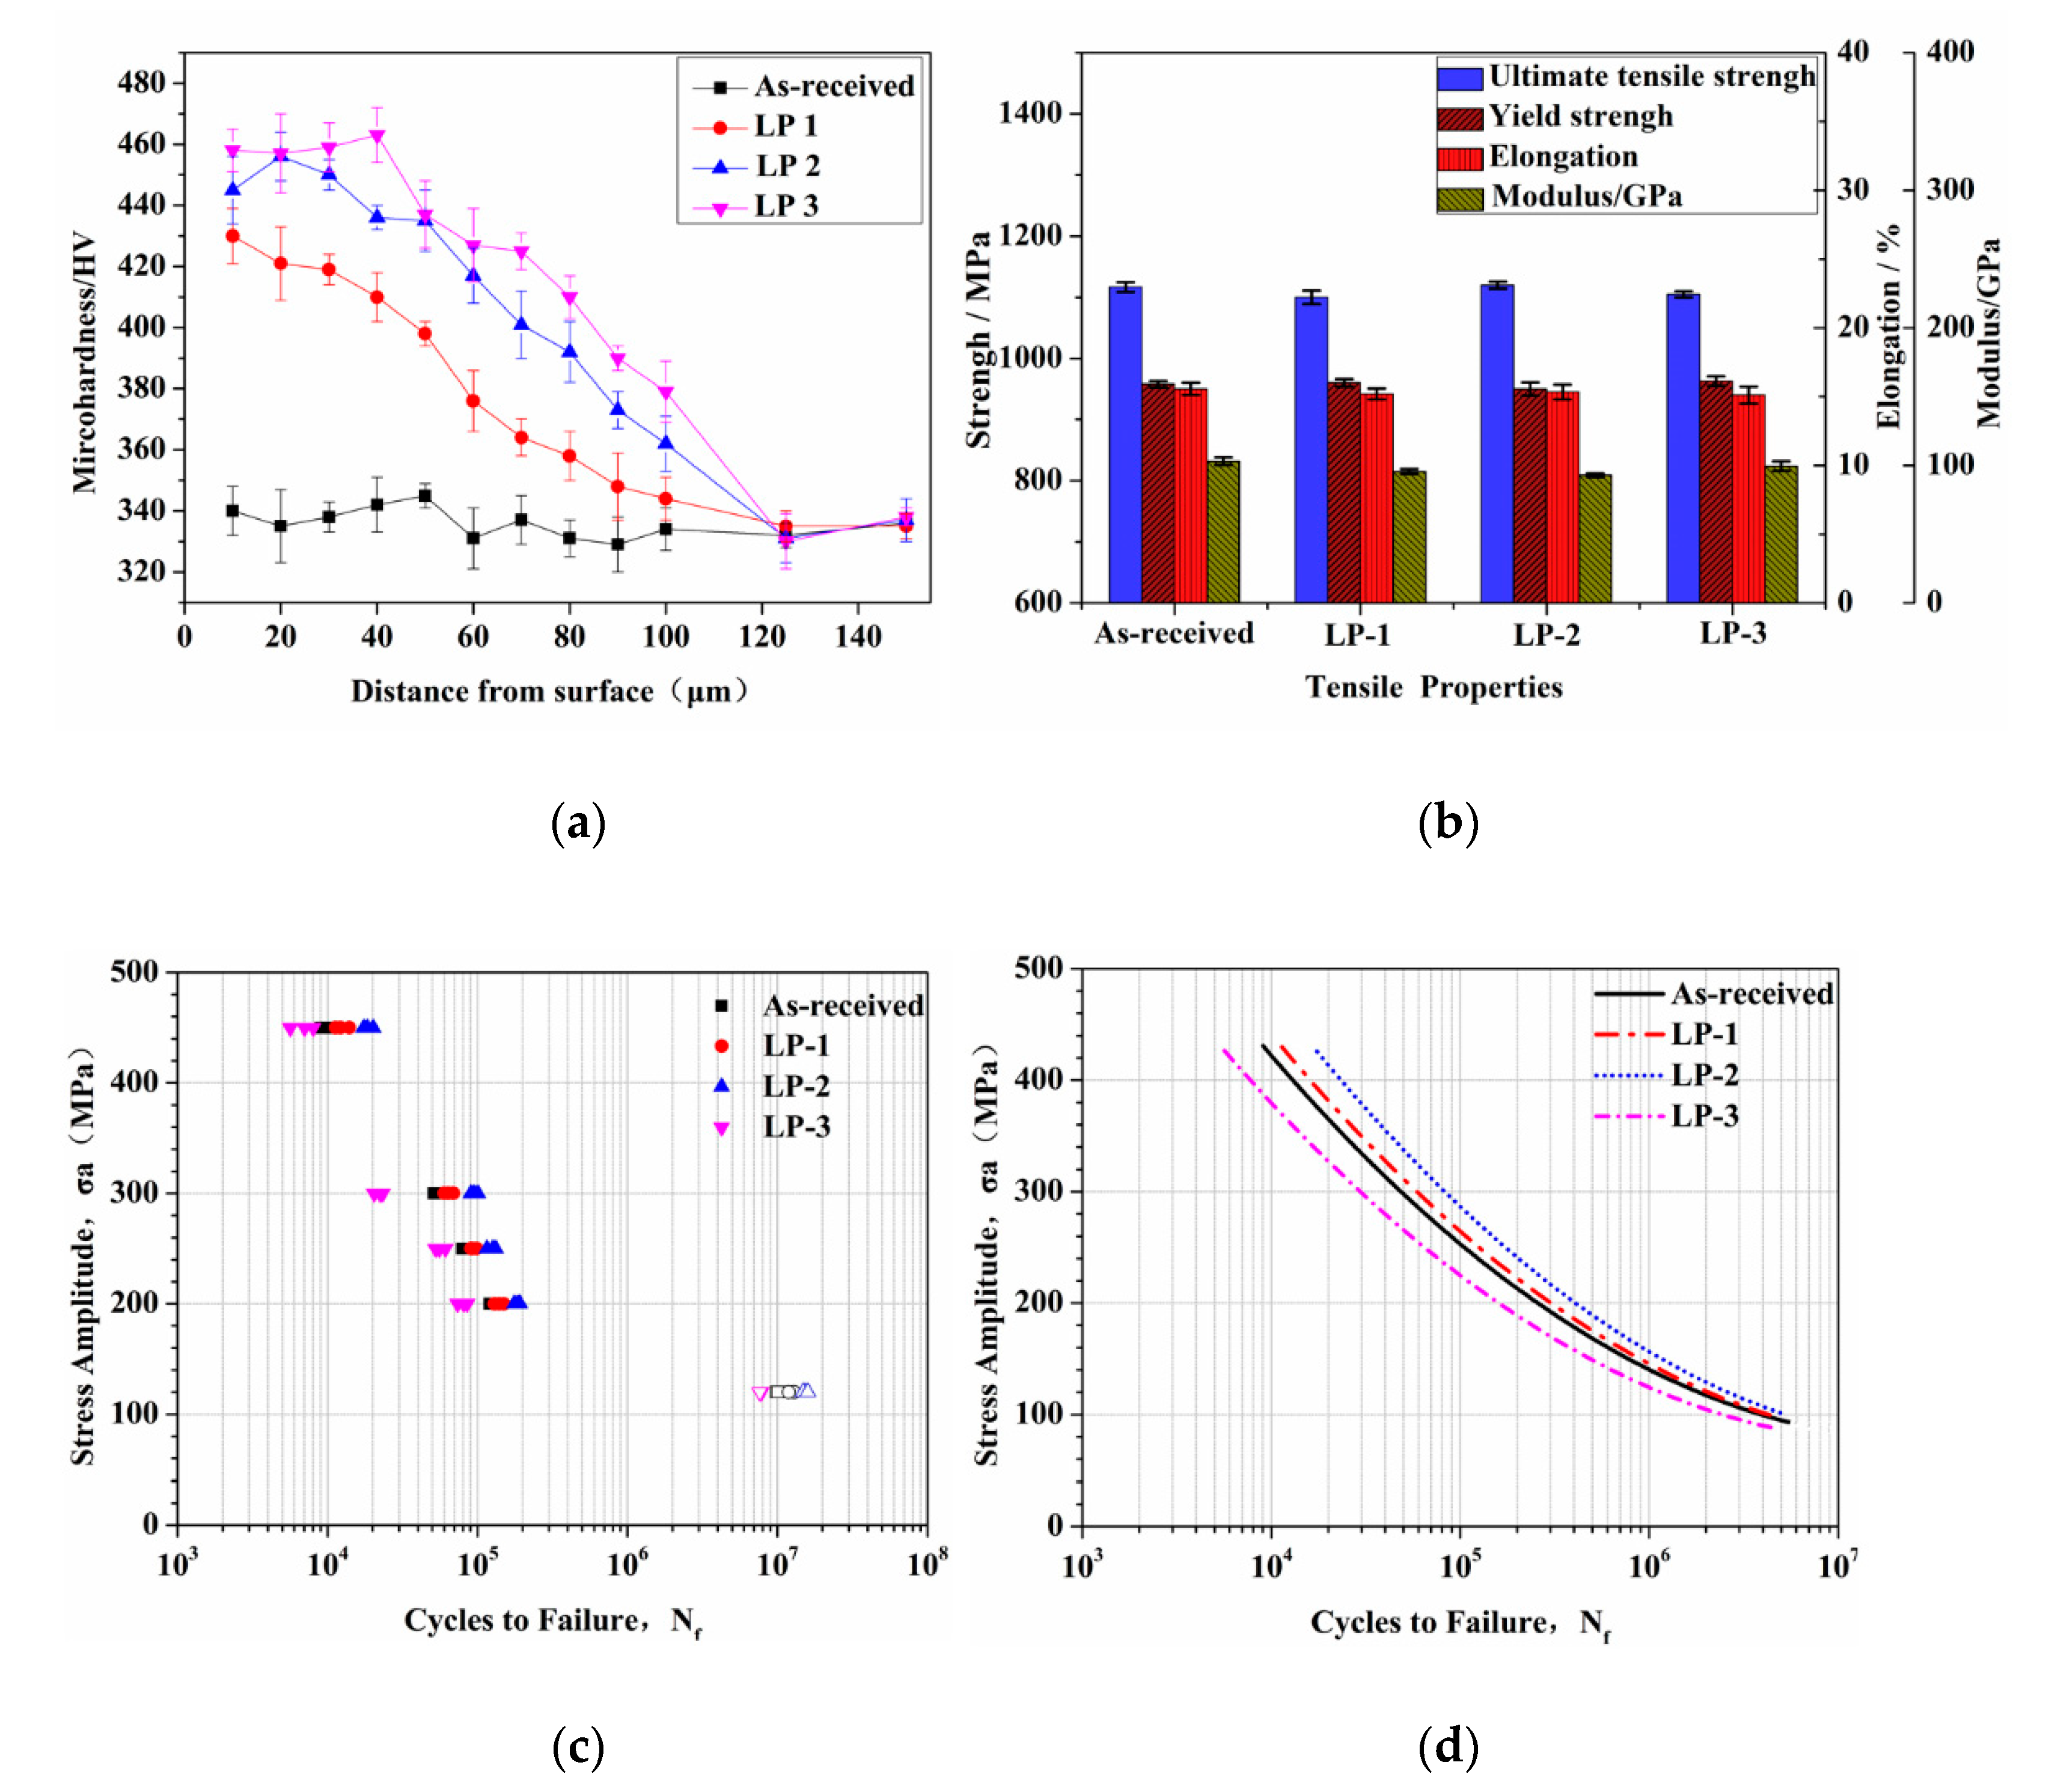
Figure 7a shows the average microhardness measured at various depths of the as-received and laser polished samples. For the as-received sample, the hardness remained constant from the surface to the center. After LP, the hardness exhibited a decreasing trend from the surface to the interior of all the polished samples. Microhardness was enhanced to a mean value of 445 HV near the top layer and decreased to a mean value of 330 HV within a depth of 120 μm, corresponding to the hardness value of the as-received sample. The LP-3 sample presented the highest microhardness among all the samples. This result can be ascribed to the greatest subsurface hardening effect caused by the high energy density. In addition, the decrease in porosity of the polished area increased hardness and densification during LP. LP eliminated any inherent pores and cracks in components produced via AM, leading to surface densification and proving that LP technology is useful in the post-processing of AM components.
The results of the tensile properties of the as-received and laser polished samples are presented in Figure 7b. All the samples exhibited similar overall mechanical properties, including ultimate tensile strength, followed by yield strength and elongation. Compared with the as-received sample, the variation in the ultimate tensile strength, yield strength, elastic modulus, and elongation of the laser polished samples was less than 3%. The polishing layer, which was only approximately 100 μm, was considerably thinner than the 4 mm thick samples; thus, LP exerted no evident effect on tensile properties.
The stress–life fatigue behavior of all the samples is shown in Figure 7c, where the solid and hollow symbols are used to represent the failure and no failure tests before 107 cycles, respectively. Fatigue strength, defined as the stress amplitude at which samples reached 107 cycles, will not fail. Fatigue behavior was similar among all the specimens, except for the high cycle fatigue test. The as-received, LP-1, and LP-2 samples reached fatigue limit at a nominal stress amplitude of 120 MPa, and LP-3 suffered from failure at this stress level. However, when the stress amplitude was close to 450 MPa, the data sets exhibited consistent overlaps among samples. The comparison of all the fatigue data, along with the stress–life curve, is presented in Figure 7d, which is defined by Basquin’s equation [31].
Fractography was conducted to determine fatigue crack initiation on the test samples to study potential differences in failure mechanisms. The result indicates that cracks initiated from the surface of all the test specimens and then moved along the down-skin surface. The images of the fracture surface are displayed in Figure 8a–d. The rough surface of the as-received sample (Figure 8a) promoted the initiation of multiple cracks, leading to crack propagation followed by shear fracture. A similar fracture behavior occurred in the LP-1 sample (Figure 8b), in which crack initiation appeared from the surface and propagated across the cross-section. The LP-2 sample (Figure 8c) failed due to the small defects near the surface instead of the surface defects. The fracture surface was rough and tortuous, suggesting ductile growth. Moreover, the analysis of the fracture surface of the LP-3 sample (Figure 8d) showed the nucleation of many major cracks in the effective notched region along the rough surface.
Fatigue behavior is highly dependent on the surface condition of the test sample [19,20,21]. In general, higher levels of roughness can lead to more stress concentration locations, resulting in earlier crack initiation and growth. The fracture surfaces illustrated that pores acted as potential crack initiation, but only surface crack initiation occurred in the samples without porosity. SSM can be used to seal micro-holes and cracks and remove insoluble powder on the surface. SOM resulted in polished surfaces with more porosity and crack initiation; it accelerated fatigue fracture and consequently worse fatigue behavior. Compared with the as-received samples, LP-2 laser parameters exhibited the best fatigue performance, followed by LP-1, and LP-3 exerted the worst effect. Therefore, SSM is recommended for AM components in LP. These results indicate that LP can remove the powder attached to the surface, eliminate external (open and closed) pores and cracks, and, consequently, reduce surface roughness and crack initiation. The aforementioned results prove that the laser-polished Ti6Al4V samples exhibited improved mechanical properties that satisfied the requirements for the implants intended for bone applications [32,33].

3.4. Cell Morphology and Proliferation Analysis

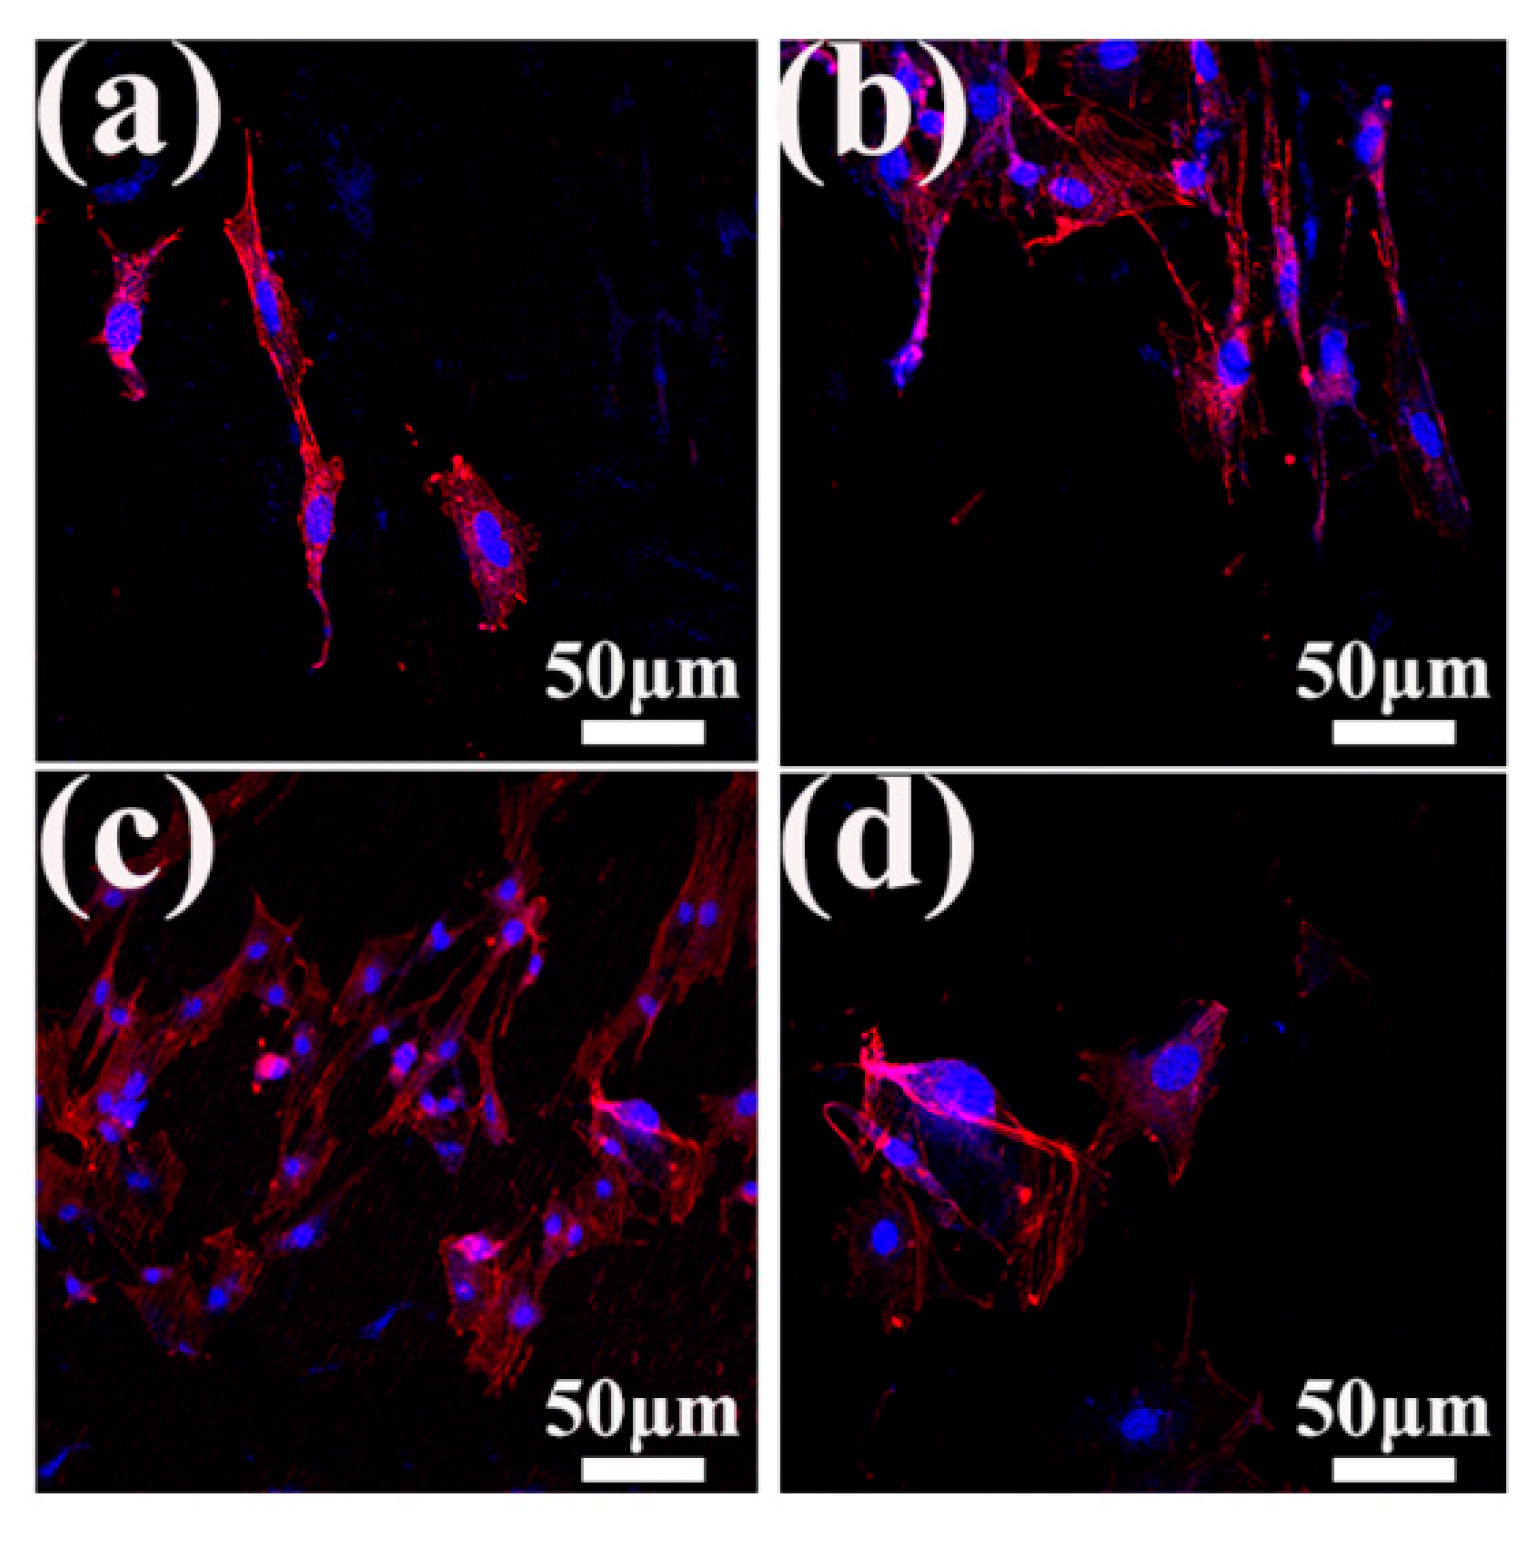
Cell adhesion is a key element in assessing bone implantations for ultimate tissue integration and new bone formation. Figure 9a–d show the fluorescence images of MC3T3-E1 cells after 1 day of culturing on different samples. A small number of cells exited on the as-received samples, most of which were in fusiform shape, and only a few cells started to divide. By contrast, more cells could be observed on the laser-treated samples, indicating that laser treatment can improve the biocompatibility of the samples. In particular, the LP-2 sample exhibited the best adhesion promotion abilities, with most adherent cells uniformly distributed and well spread, exhibiting an elongated or polygonal morphology, and containing expansive networks of actin filaments on surfaces. In summary, the cell adhesion on various samples presented the following trend: the LP-2 sample exhibited the best cell adhesion, followed by the LP-1 sample, and the LP-3 sample is similar to the as-received sample.
The proliferation of MC3T3-E1 cells on different samples was assessed using the CCK-8 assay from 1 day to 7 days. As shown in Figure 10, the optical density (OD) value increased for all samples over the 7-day incubation period, indicating that cells can grow and proliferate on all the samples. ANOVA analysis of cell proliferation evaluated via CCK-8 assay was shown in Table 3. On one day, no statistically significant difference in cell number was observed among the four groups. However, after 4 days and 7 days of cultivation, the cells on the LP-2 sample exhibited evidently higher OD values than the cells on the other groups, suggesting that the LP-2 sample is more suitable for the cell to proliferation.
The surface structure apparently influences the primary adhesion of cells and then alters cell proliferation and differentiation. As shown in Figure 2c, LP treatment can effectively change the samples’ surface structures. Therefore, LP-treated samples exhibited the ability to regulate cell adhesion and proliferation. Nevertheless, the relationship between surface structure and cell behavior remains unclear. At present, a large number of studies have been conducted on the mechanism of structure-regulating cell behavior, which is most likely affected by the following factors [34,35]. (1) Wettability. The surface wettability can be changed by constructing a specific microstructure, which will influence protein adsorption and further affect cell morphology, attachment, and proliferation [36,37]. (2) Matrix elastic modulus or stiffness. The spacing and density of a microstructure are likely to affect the matrix modulus. Previous studies have reported that a harder material surface will lead to a higher local adhesion complex activation and stronger cell tension, and, consequently, will affect cell adhesion, migration, proliferation, and differentiation [38,39]. However, the present study found that the elastic modulus was not significantly different among the four groups, but a significant difference in wettability was observed (Figure 4b). Therefore, we propose that wettability plays a major role in regulating cell behavior. The LP-2 sample exhibited the strongest wettability, which can accelerate surface reaction with ions, amino acids, and proteins in a tissue solution [40]. Thus, this sample exerts a better promoting effect on cell adhesion (Figure 9c). Cell adhesion is also the starting point of cell-initial fixation with an implanted prosthesis, which is beneficial for signaling osteogenic markers (osteocalcin, osteopathic, and runt related transcription factor-2) and can be conducive to cell proliferation and differentiation. These findings prove that the post-treatment method for LP-2 can endow a SLM-based Ti6Al4V surface with biocompatible characteristics during the early stage of orthopedic applications.

4. Conclusions

The effects of LP on the surface morphology, mechanical properties, and biocompatibility of Ti6Al4V components were investigated. The LP-2 parameters exhibited a significant reduction in roughness on the average Ra value and thus a better surface quality. LP led to an increase in surface hardness due to reduced porosity and completely dense microstructures within a depth of 100 μm. Compared with the as-received sample, LP exerted no evident effect on tensile properties. The high cycle fatigue life of the LP-surface was improved for the LP-2 parameters, eliminating pores and reducing crack initiation. The cell experiment showed that the LP-2 parameters improved cell adhesion and exhibited cell proliferation. The results indicate that LP improved the cell biocompatibility, while hydrophilicity positively affected early cell adhesion.

Author Contributions

Conceptualization, C.L. and Y.H.; methodology, Y.H; validation, X.Z. (Xianrui Zou) and X.Z. (Xinping Zhang); investigation, C.L.; resources, Y.F.; data curation, J.H.; writing—original draft preparation, Y.H.; writing—review and editing, N.L.; supervision, H.W. All authors have read and agreed to the published version of the manuscript.

Funding

The authors gratefully acknowledge the support by the National Key Research and Development Program of China (Project No. 2016YFB1101103); National Natural Science Foundation of China (Project Nos. 51771069,); Outstanding Youth Foundation of Hebei Province of China (Project No. E2015202282).

Conflicts of Interest

No potential conflict of interest was reported by the authors.

References

  1. Hamid, K.S.; Parekh, S.G.; Adams, S.B. Salvage of Severe Foot and Ankle Trauma with a 3D Printed Scaffold. Foot Ankle Int. 2016, 37, 433–439. [Google Scholar] [CrossRef]
  2. Wong, K.C.; Kumta, S.M.; Geel, N.V.; Demol, J. One-step reconstruction with a 3D-printed, biomechanically evaluated custom implant after complex pelvic tumor resection. Comput. Aided Surg. 2015, 20, 14–23. [Google Scholar] [CrossRef] [PubMed]
  3. Strano, G.; Hao, L.; Everson, R.M.; Evans, K.E. Surface roughness analysis, modelling and prediction in selective laser melting. J. Mater. Process. Technol. 2013, 213, 589–597. [Google Scholar] [CrossRef]
  4. Raines, A.L.; Olivares-Navarrete, R.; Wieland, M.; Cochran, D.L.; Schwartz, Z.; Boyan, B.D. Regulation of angiogenesis during osseointegration by titanium surface microstructure and energy. Biomaterials 2010, 31, 4909–4917. [Google Scholar] [CrossRef] [PubMed] [Green Version]
  5. Wall, I.; Donos, N.; Carlqvist, K.; Jones, F.; Brett, P. Modified titanium surfaces promote accelerated osteogenic differentiation of mesenchymal stromal cells in vitro. Bone 2009, 45, 17–26. [Google Scholar] [CrossRef] [PubMed]
  6. Habibzadeh, S.; Li, L.; Shum-Tim, D.; Davis, E.C.; Omanovic, S. Electrochemical polishing as a 316L stainless steel surface treatment method: Towards the improvement of biocompatibility. Corros. Sci. 2014, 87, 89–100. [Google Scholar] [CrossRef]
  7. Lyczkowska, E.; Szymczyk, P.; Dybala, B.; Chlebus, E. Chemical polishing of scaffolds made of Ti-6Al-7Nb alloy by additive manufacturing. Arch. Civ. Mech. Eng. 2014, 14, 586–594. [Google Scholar] [CrossRef]
  8. Balla, V.K.; Soderlind, J.; Bose, S.; Bandyopadhyay, A. Microstructure, mechanical and wear properties of laser surface melted Ti6Al4V alloy. J. Mech. Behav. Biomed. Mater. 2014, 32, 335–344. [Google Scholar] [CrossRef]
  9. Aviles, R.; Albizuri, J.; Lamikiz, A.; Ukar, E.; Aviles, A. Influence of laser polishing on the high cycle fatigue strength of medium carbon AISI 1045 steel. Int. J. Fatigue 2011, 33, 1477–1489. [Google Scholar] [CrossRef]
  10. Marimuthu, S.; Triantaphyllou, A.; Antar, M.; Wimpenny, D.; Morton, H.; Beard, M. Laser polishing of selective laser melted components. Int. J. Mach. Tool Manu. 2015, 95, 97–104. [Google Scholar] [CrossRef] [Green Version]
  11. Ma, C.P.; Guan, Y.C.; Zhou, W. Laser polishing of additive manufactured Ti alloys. Opt. Lasers Eng. 2017, 93, 171–177. [Google Scholar] [CrossRef]
  12. Yung, K.C.; Xiao, T.Y.; Choy, H.S.; Wang, W.J.; Cai, Z.X. Laser polishing of additive manufactured CoCr alloy components with complex surface geometry. J. Mater. Process. Technol. 2018, 262, 53–64. [Google Scholar] [CrossRef]
  13. Bhaduri, D.; Penchev, P.; Batal, A.; Dimov, S.; Soo, S.L.; Sten, S.; Harrysson, U.; Zhang, Z.; Dong, H. Laser polishing of 3D printed mesoscale components. Appl. Surf. Sci. 2017, 405, 29–46. [Google Scholar] [CrossRef]
  14. Aviles, R.; Albizuri, J.; Ukar, E.; Lamikiz, A.; Aviles, A. Influence of laser polishing in an inert atmosphere on the high cycle fatigue strength of AISI 1045 steel. Int. J. Fatigue 2014, 68, 67–79. [Google Scholar] [CrossRef]
  15. Qin, L.; Wu, H.; Guo, J.; Feng, X.; Dong, G.; Shao, J.; Zeng, Q.; Zhang, Y.; Qin, Y. Fabricating hierarchical micro and nano structures on implantable Co-Cr-Mo alloy for tissue engineering by one-step laser ablation. Colloids Surf. B 2018, 161, 628–635. [Google Scholar] [CrossRef] [PubMed]
  16. Moridi, A.; Demir, A.G.; Caprio, L.; Hart, A.J.; Previtali, B.; Colosimo, B.M. Deformation and failure mechanisms of Ti-6Al-4V as built by selective laser melting. Mater. Sci. Eng. A 2019, 768, 138456. [Google Scholar] [CrossRef]
  17. Qian, G.; Jian, Z.; Pan, X.; Berto, F. In-situ investigation on fatigue behaviors of Ti-6Al-4V manufactured by selective laser melting. Int. J. Fatigue 2020, 133, 105424. [Google Scholar] [CrossRef]
  18. Yu, Z.; Yang, G.; Zhang, W.; Hu, J. Investigating the effect of picosecond laser texturing on microstructure and biofunctionalization of titanium alloy. J. Mater. Process. Technol. 2018, 255, 129–136. [Google Scholar] [CrossRef]
  19. Klotzbach, A.; Hauser, M.; Beyer, E. Laser Cutting of Carbon Fiber Reinforced Polymers using Highly Brilliant Laser Beam Sources. Physics Procedia 2011, 12, 572–577. [Google Scholar] [CrossRef]
  20. Kancharla, V. Applications review: Materials processing with fiber lasers under 1kW. International Congress on Applications of Lasers & Electro-Optics 2006, 2006, 1301. [Google Scholar]
  21. Ahmmed, K.M.T.; Grambow, C.; Kietzig, A.-M. Fabrication of Micro/Nano Structures on Metals by Femtosecond Laser Micromachining. Micromachines 2014, 5, 1219–1253. [Google Scholar] [CrossRef]
  22. Chichkov, B.N.; Momma, C.; Nolte, S.; von Alvensleben, F.; Tünnermann, A. Femtosecond, picosecond and nanosecond laser ablation of solids. Appl. Phys. A 1996, 63, 109–115. [Google Scholar] [CrossRef]
  23. Wang, M.; Wu, Y.; Lu, S.; Chen, T.; Zhao, Y.; Chen, H.; Tang, Z. Fabrication and characterization of selective laser melting printed Ti-6Al-4V alloys subjected to heat treatment for customized implants design. Prog. Nat. Sci. Mater. Int. 2016, 26, 671–677. [Google Scholar] [CrossRef]
  24. Bouet, G.; Cabanettes, F.; Bidron, G.; Guignandon, A.; Peyroche, S.; Bertrand, P.; Vico, L.; Dumas, V. Laser-Based Hybrid Manufacturing of Endosseous Implants: Optimized Titanium Surfaces for Enhancing Osteogenic Differentiation of Human Mesenchymal Stem Cells. ACS Biomater. Sci. Eng. 2019, 5, 4376–4385. [Google Scholar] [CrossRef]
  25. Liang, C.; Wang, H.; Yang, J.; Cai, Y.; Hu, X.; Yang, Y.; Li, B.; Li, H.; Li, H.; Li, C.; et al. Femtosecond Laser-Induced Micropattern and Ca/P Deposition on Ti Implant Surface and Its Acceleration on Early Osseointegration. ACS Appl. Mater. Interfaces 2013, 5, 8179–8186. [Google Scholar] [CrossRef]
  26. Lamikiz, A.; Sanchez, J.A.; Lopez de Lacalle, L.N.; Arana, J.L. Laser polishing of parts built up by selective laser sintering. Int. J. Mach. Tool Manu. 2007, 47, 2040–2050. [Google Scholar] [CrossRef]
  27. Pfefferkorn, F.E.; Duffie, N.A.; Li, X.; Vadali, M.; Ma, C. Improving surface finish in pulsed laser micro polishing using thermocapillary flow. CIRP Ann-Manuf. Technol. 2013, 62, 203–206. [Google Scholar] [CrossRef]
  28. Kou, S.; Limmaneevichitr, C.; Wei, P.S. Oscillatory Marangoni Flow: A Fundamental Study by Conduction-Mode Laser Spot Welding. Weld. J. 2011, 90, 229S–240S. [Google Scholar]
  29. Truong, V.K.; Lapovok, R.; Estrin, Y.S.; Rundell, S.; Wang, J.Y.; Fluke, C.J.; Crawford, R.J.; Ivanova, E.R. The influence of nano-scale surface roughness on bacterial adhesion to ultrafine-grained titanium. Biomaterials 2010, 31, 3674–3683. [Google Scholar] [CrossRef]
  30. Park, J.-W.; Kim, Y.-J.; Park, C.H.; Lee, D.-H.; Ko, Y.G.; Jang, J.-H.; Lee, C.S. Enhanced osteoblast response to an equal channel angular pressing-processed pure titanium substrate with microrough surface topography. Acta Biomater. 2009, 5, 3272–3280. [Google Scholar] [CrossRef]
  31. Koohkan, M.R.; Attarnejad, R.; Nasseri, M. Time domain analysis of dam-reservoir interaction Using coupled differential quadrature and finite difference methods. Eng. Comput. 2010, 27, 280–294. [Google Scholar] [CrossRef]
  32. Mullen, L.; Stamp, R.C.; Fox, P.; Jones, E.; Ngo, C.; Sutcliffe, C.J. Selective laser melting: A unit cell approach for the manufacture of porous, titanium, bone in-growth constructs, suitable for orthopedic applications. II. Randomized structures. J. Biomed. Mater. Res. Part B Appl. Biomater. 2010, 92B, 178–188. [Google Scholar] [CrossRef] [PubMed]
  33. Pobloth, A.-M.; Checa, S.; Razi, H.; Petersen, A.; Weaver, J.C.; Schmidt-Bleek, K.; Windolf, M.; Tatai, A.Á.; Roth, C.P.; Schaser, K.-D.; et al. Mechanobiologically optimized 3D titanium-mesh scaffolds enhance bone regeneration in critical segmental defects in sheep. Sci. Transl. Med. 2018, 10, eaam8828. [Google Scholar] [CrossRef] [Green Version]
  34. Biggs, M.J.P.; Richards, R.G.; Dalby, M.J. Nanotopographical modification: A regulator of cellular function through focal adhesions. Nanomed.-Nanotechnol. Biol. Med. 2010, 6, 619–633. [Google Scholar] [CrossRef] [PubMed] [Green Version]
  35. Chehroudi, B.; Ghrebi, S.; Murakami, H.; Waterfield, J.D.; Owen, G.; Brunette, D.M. Bone formation on rough, but not polished, subcutaneously implanted Ti surfaces is preceded by macrophage accumulation. J. Biomed. Mater. Res. Part A 2010, 93A, 724–737. [Google Scholar] [CrossRef]
  36. Tangpasuthadol, V.; Pongchaisirikul, N.; Hoven, V.P. Surface modification of chitosan films. Effects of hydrophobicity on protein adsorption. Carbohydr. Res. 2003, 338, 937–942. [Google Scholar] [CrossRef]
  37. Gitlin, I.; Carbeck, J.D.; Whitesides, G.M. Why are proteins charged? Networks of charge-charge interactions in proteins measured by charge ladders and capillary electrophoresis. Chem.-Int. Edit 2006, 45, 3022–3060. [Google Scholar] [CrossRef]
  38. Engler, A.J.; Sen, S.; Sweeney, H.L.; Discher, D.E. Matrix elasticity directs stem cell lineage specification. Cell 2006, 126, 677–689. [Google Scholar] [CrossRef] [Green Version]
  39. Lu, T.; Wen, J.; Qian, S.; Cao, H.; Ning, C.; Pan, X.; Jiang, X.; Liu, X.; Chu, P.K. Enhanced osteointegration on tantalum-implanted polyetheretherketone surface with bone-like elastic modulus. Biomaterials 2015, 51, 173–183. [Google Scholar] [CrossRef]
  40. Jimbo, R.; Sawase, T.; Shibata, Y.; Hirata, K.; Hishikawa, Y.; Tanaka, Y.; Bessho, K.; Ikeda, T.; Atsuta, M. Enhanced osseointegration by the chemotactic activity of plasma fibronectin for cellular fibronectin positive cells. Biomaterials 2007, 28, 3469–3477. [Google Scholar] [CrossRef] [Green Version]
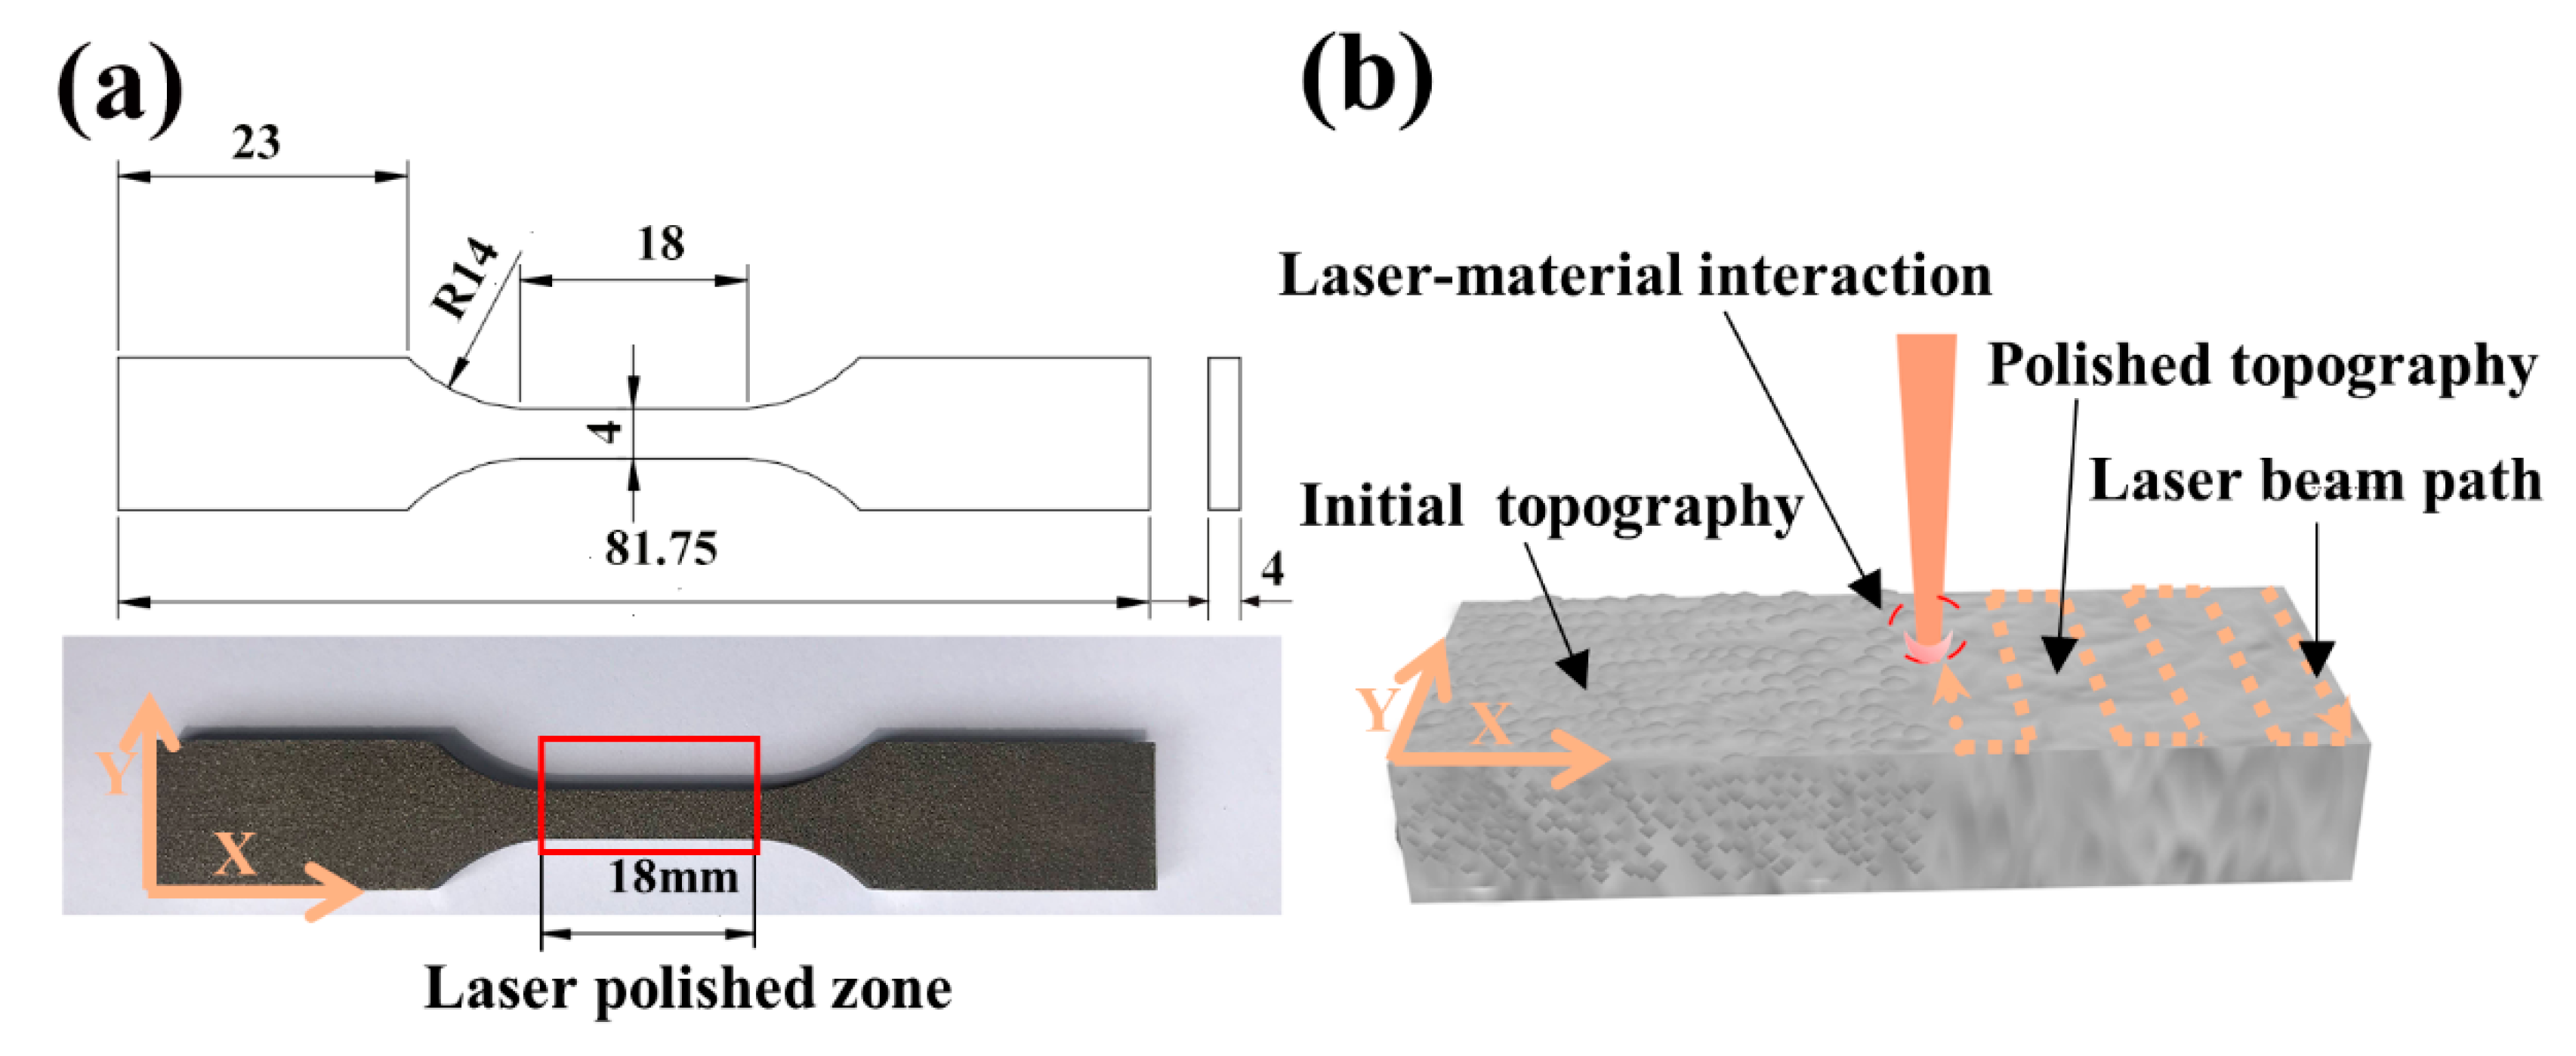
Figure 1. (a) Test specimens; (b) a schematic view of the laser polishing (LP).
Metals 10 00191 g001
Figure 2. Scanning electron microscope (SEM) images of the (a) as-received sample, the (b) LP-1 sample, the (c) LP-2 sample, and the (d) LP-3 sample.
Metals 10 00191 g002
Figure 3. Laser scanning confocal microscope (LSCM) images of the (a) as-received sample, the (b) LP-1 sample, the (c) LP-2 sample, and (d) the LP-3 sample.
Metals 10 00191 g003
Figure 4. (a) Surface roughness obtained from LSCM and (b) the contact angles of samples.
Metals 10 00191 g004
Figure 5. (a) The reconstructed false-color image of the as-received sample, (b) The reconstructed false-color image of the LP-2 sample, and (c) the porosity volume from different distances to the surface for the as-received and LP-2 samples. (The red shows the extension of the area analyzed).
Metals 10 00191 g005
Figure 6. The pore distribution of the as-received sample at different distances: (a) 0–10 μm; (b) 30–40 μm; (c) 60–70 μm, and (d) 70–100 μm. The pore distribution of the LP-2 sample at different distances: (e) 0–10 μm; (f) 30–40 μm; (g) 60–70 μm; and (h) 70–100 μm. (The purple part of the image, after threshold segmentation, is the pore.)
Metals 10 00191 g006
Figure 7. Mechanical properties: (a) microhardness distributions in the laser-polished layer, (b) tensile properties, (c) stress–life fatigue behavior for all geometries showing combined data points, and (d) stress life fatigue curves.
Metals 10 00191 g007
Figure 8. Fracture surfaces: (a) the as-received sample, (b) the LP-1 sample, (c) the LP-2 sample, and (d) the LP-3 sample. (Blue arrows show crack initiation sites, and red circle shows defects).
Metals 10 00191 g008
Figure 9. Adhesion and proliferation of MC3T3-E1 cells grown on different sample surfaces. (a) The as-received sample, (b) the LP-1 sample, (c) the LP-2 sample, and the (d) LP-3 sample. In images a–d: F-actin cytoskeleton of osteoblasts (red) and cell nuclei (blue) after 1 day of seeding.
Metals 10 00191 g009
Figure 10. Cell proliferation evaluated via CCK-8 assay. NOTE: which is the meaning of: (Black * shows p < 0.05 vs. the as-received sample. Red * represents p < 0.05 vs. two other LP groups).
Metals 10 00191 g010
Table 1. Chemical composition of Ti6Al4V.
TiALVONC
Balance5.5–6.753.5–4.5<2000 ppm<3000 ppm<3000 ppm
Table 2. LP parameters of different samples.
Process VariablesSamples
LP-1 LP-2LP-3
Energy density (W/cm2)0.853 × 1051.703 × 1052.503 × 105
Pulse overlap factor along X (%)505050
Pulse overlap factor along Y (%)505050
Table 3. ANOVA analysis of cell proliferation evaluated via CCK-8 assay.
Sample Comparationp Value
1 Day4 Day7 Day
As-received VS LP-10.4830.5810.394
As-received VS LP-20.1540.0360.041
As-received VS LP-30.2670.1470.328
As-received VS LP-40.0650.3910.247
LP-2 VS LP-30.0910.0290.030
LP-2 VS LP-40.3380.0220.024
LP-3 VS LP-40.4310.0670.473