Abstract
The plastic anisotropy of rolled Al sheets is the result of a crystallographic texture. It leads to the formation of uneven cup heights during deep-drawing, which is called earing. A new, simple and rapid method had been previously developed by the authors to predict earing directly from {h00} pole figures. In the present manuscript, this method is applied to cross-rolling for the first time. 5056 type aluminum sheets were unidirectionally- (conventionally) and cross-rolled from 4 to ~1 mm thickness in 6 or 12 passes. Earing was predicted from recalculated {200} pole figures obtained after X-ray diffraction texture measurements. The results were validated by deep-drawing tests. It is shown that the proposed method predicts the type (locations of ears) and magnitude of earing with satisfactory results. However, a different scaling factor must be used to calculate the magnitude of earing for cross-rolling than for unidirectional rolling even if all other parameters (including cold rolling, texture measurements, and deep-drawing) are the same. This is because the cross-rolled sheets exhibit a similar type but weaker earing compared to the unidirectionally rolled samples.
1. Introduction
The term cross-rolling is used for different special types of rolling processes [1]. Here, cross-rolling means a modified version of conventional or unidirectional sheet rolling, where the sheet—and consequently, the rolling direction (RD)—is rotated by 90° about its normal direction (ND) between subsequent passes [2,3,4,5]. The outcome is that a more random orientation distribution, that is, four-fold texture, is obtained, which is usually accompanied by a lower amount of plastic anisotropy. Li et al. applied cross-rolling on magnesium sheets and concluded that large basal plane scatter was achieved, which resulted in a more random texture [2]. Wronski et al. used cross-rolling on low carbon ferritic steel and copper and found that plastic anisotropy was decreased in copper; however, it increased in the low carbon steel [3]. Huh et al. applied cross-rolling to suppress cube texture formation in 5182 aluminum after annealing and observed a close to random structure and better formability [4]. Tang et al. obtained similar results on cross-rolled AZ31 aluminum, and besides negligible earing, they found that increased ductility was also achieved by cross-rolling [5]. Based on the literature, it can be safely stated that, in general, a more random texture and decreased plastic anisotropy is expected in aluminum alloys after cross-rolling.
Besides deep-drawing tests, several methods have been established to estimate earing. Fukui and Kudo found that earing can be predicted from the Lankford value Δr = (r0 + r90)/2 − r45 [6]. Since then, methods have been developed based on mechanical response [7], crystallography [8,9], and more complex theories were established [10]. Nowadays, prediction of earing is usually performed by finite element (FE) methods [11].
Recently, a new, simple method has been developed by the authors to predict earing based on pole figure data [12]. The advantage of the method over others is that qualitative information can be obtained quickly and directly from pole figures. If quantitative data is demanded, only one deep-drawing test is required. Furthermore, it can be combined with non-destructive (sample-cutting-free) texture measurement methods [13]. Thus, it is possible to predict earing in a truly non-destructive manner, which can have high potential in cases when unique, high value objects are to be examined. The aim of the present work is to extend the developed earing prediction method to the case of cross-rolling. For this, the method was applied on unidirectionally and cross-rolled 5056 type aluminum sheets and the results were validated with deep-drawing tests.
2. Materials and Methods
Sheets made of 5056 type aluminum having an initial thickness of 4 mm have been unidirectionally- (UD) and cross-rolled (CR) with a VonRoll experimental roll stand at the University of Miskolc. Other than the mode of rolling (UD or CR), all applied parameters were the same. Two sets of samples were produced with a different number of passes. The first set of samples (three UD samples, marked as A1, A5, and A6; and three CR samples, marked as A3K, A4K, and A9K) were cold-rolled to a ~1 mm final thickness through 6 passes. Sample A4K was rotated around ND between passes clockwise, while samples A3K and A9K were rotated around ND alternately back and forth prior to passes. The reduction during the first pass was 0.6 mm, and 0.5 mm during the subsequent passes. The final thickness of the UD samples was 1.04, 1.03, and 1. 03 mm; and that of the CR samples was 1.14, 1.13, and 1.13 mm. The second set of samples, rolled with 12 passes (one UD, marked as A10; and one CR, marked as A11K) were cold-rolled to a ~0.99 and 1.10 mm final thickness, respectively. The reduction during the first pass was 0.3 mm and 0.25 during the following passes. Sample A11K was rotated around ND alternately back and forth prior to passes. Table 1 summarizes the properties of the investigated samples.

Table 1.
The investigated samples and their properties. UD: unidirectionally; CR: cross-rolled.
Samples were cut along the longitudinal sections of the final sheets and prepared for optical microscope examinations with the use of Barker etchant. Optical microscope images were obtained with a Zeiss M1m microscope using polarized light.
Samples with a diameter of 30 mm were cut for texture measurements and samples with 50 mm were cut for deep-drawing tests. Texture examinations were carried out with a Bruker D8 Advance X-ray diffractometer using CuKα radiation equipped with an Eulerian cradle operating with a 40 kV tube voltage and a 40 mA heating current. {111}, {200}, and {220} pole figures were measured up to CHI = 75° sample tilting. Complete recalculated {200} pole figures were obtained with the software of the equipment, TexEval. Orthotropic deformation was used during recalculation for both UD and CR samples.
The applied earing prediction method is described in detail elsewhere [12]. Briefly, recalculated and complete {200} pole figures were obtained by texture analysis from the measured {111}, {200}, and {220} incomplete pole figures. Then, the CHI-cuts, which show the recalculated intensity values versus CHI of the complete {200} pole figures were plotted for each PHI (sample rotation) angle. The method applies the principle according to which the CHI-cuts can be approximated with a sum of Gaussian curves [14]. Thus, the CHI-cuts of the recalculated {200} pole figures were fitted with Gaussian curves. The area of each individual Gaussian curve was determined and then the areas were weighted (multiplied) with the sin of the CHI values corresponding to the peaks of the Gaussian curves. Afterwards, the weighted areas of the Gaussian curves were summarized to the given PHI. The summarized, weighted {200} intensities were plotted versus PHI, which shows the predicted relative cup height.
Deep-drawing tests were performed at the John von Neumann University with Erichsen deep-drawing equipment. The diameter of the samples was 50 mm and that of the drawn cups was 33 mm, giving a drawing ratio of 1.51. The applied blank holder force was 1 kN. Average earing was calculated as the ratio of average ear height and average cup height [12]. Predicted average earing was calculated similarly from the weighted {200} intensity curves and divided by a scaling factor. Since predicted average earing is calculated from measured X-ray intensity and not cup height, the use of a scaling factor is required to obtain comparable values. The determination of the scaling factor is based on comparison to experimental data. The scaling factor was determined by dividing the predicted average earing calculated form weighted {200} intensities with average earing. It was determined to both UD and CR cases. The obtained values were 40 and 60, respectively.
3. Results
3.1. Results of 6 Pass Rolling
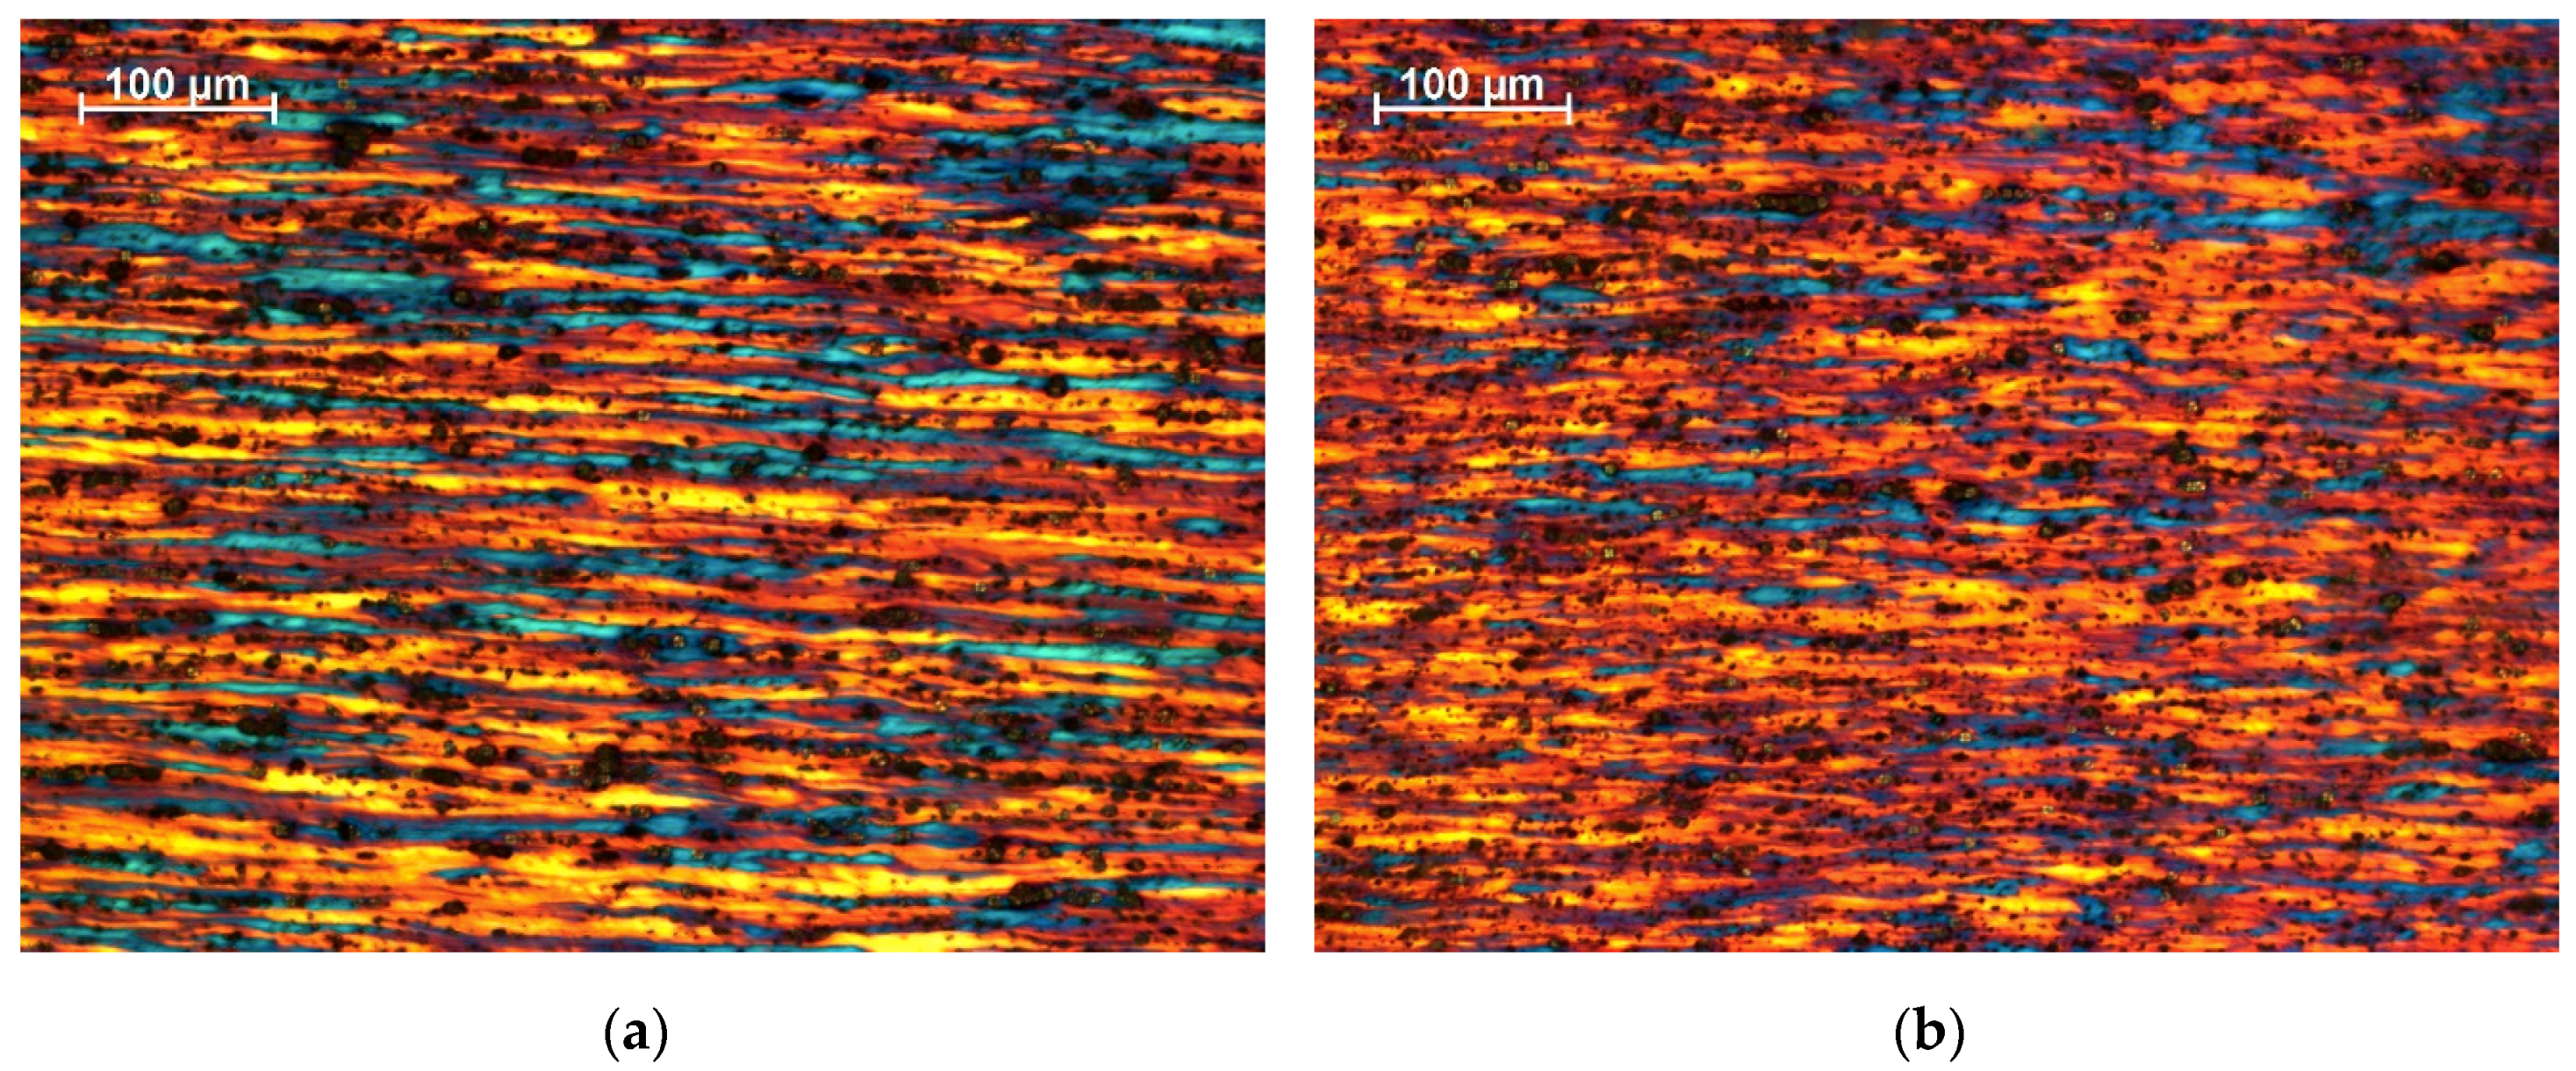
Figure 1 depicts the optical micrographs of one UD and CR sample. It can be seen that the both rolling types resulted in elongated grains and notable differences cannot be observed.
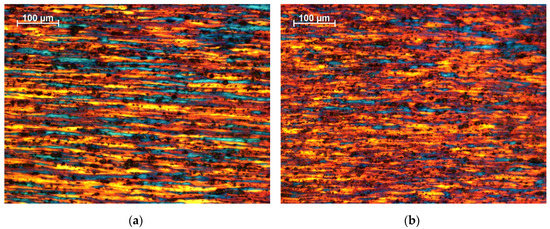
Figure 1.
Optical microscope images of the (a) UD (A5) and (b) CR (A4K) samples.
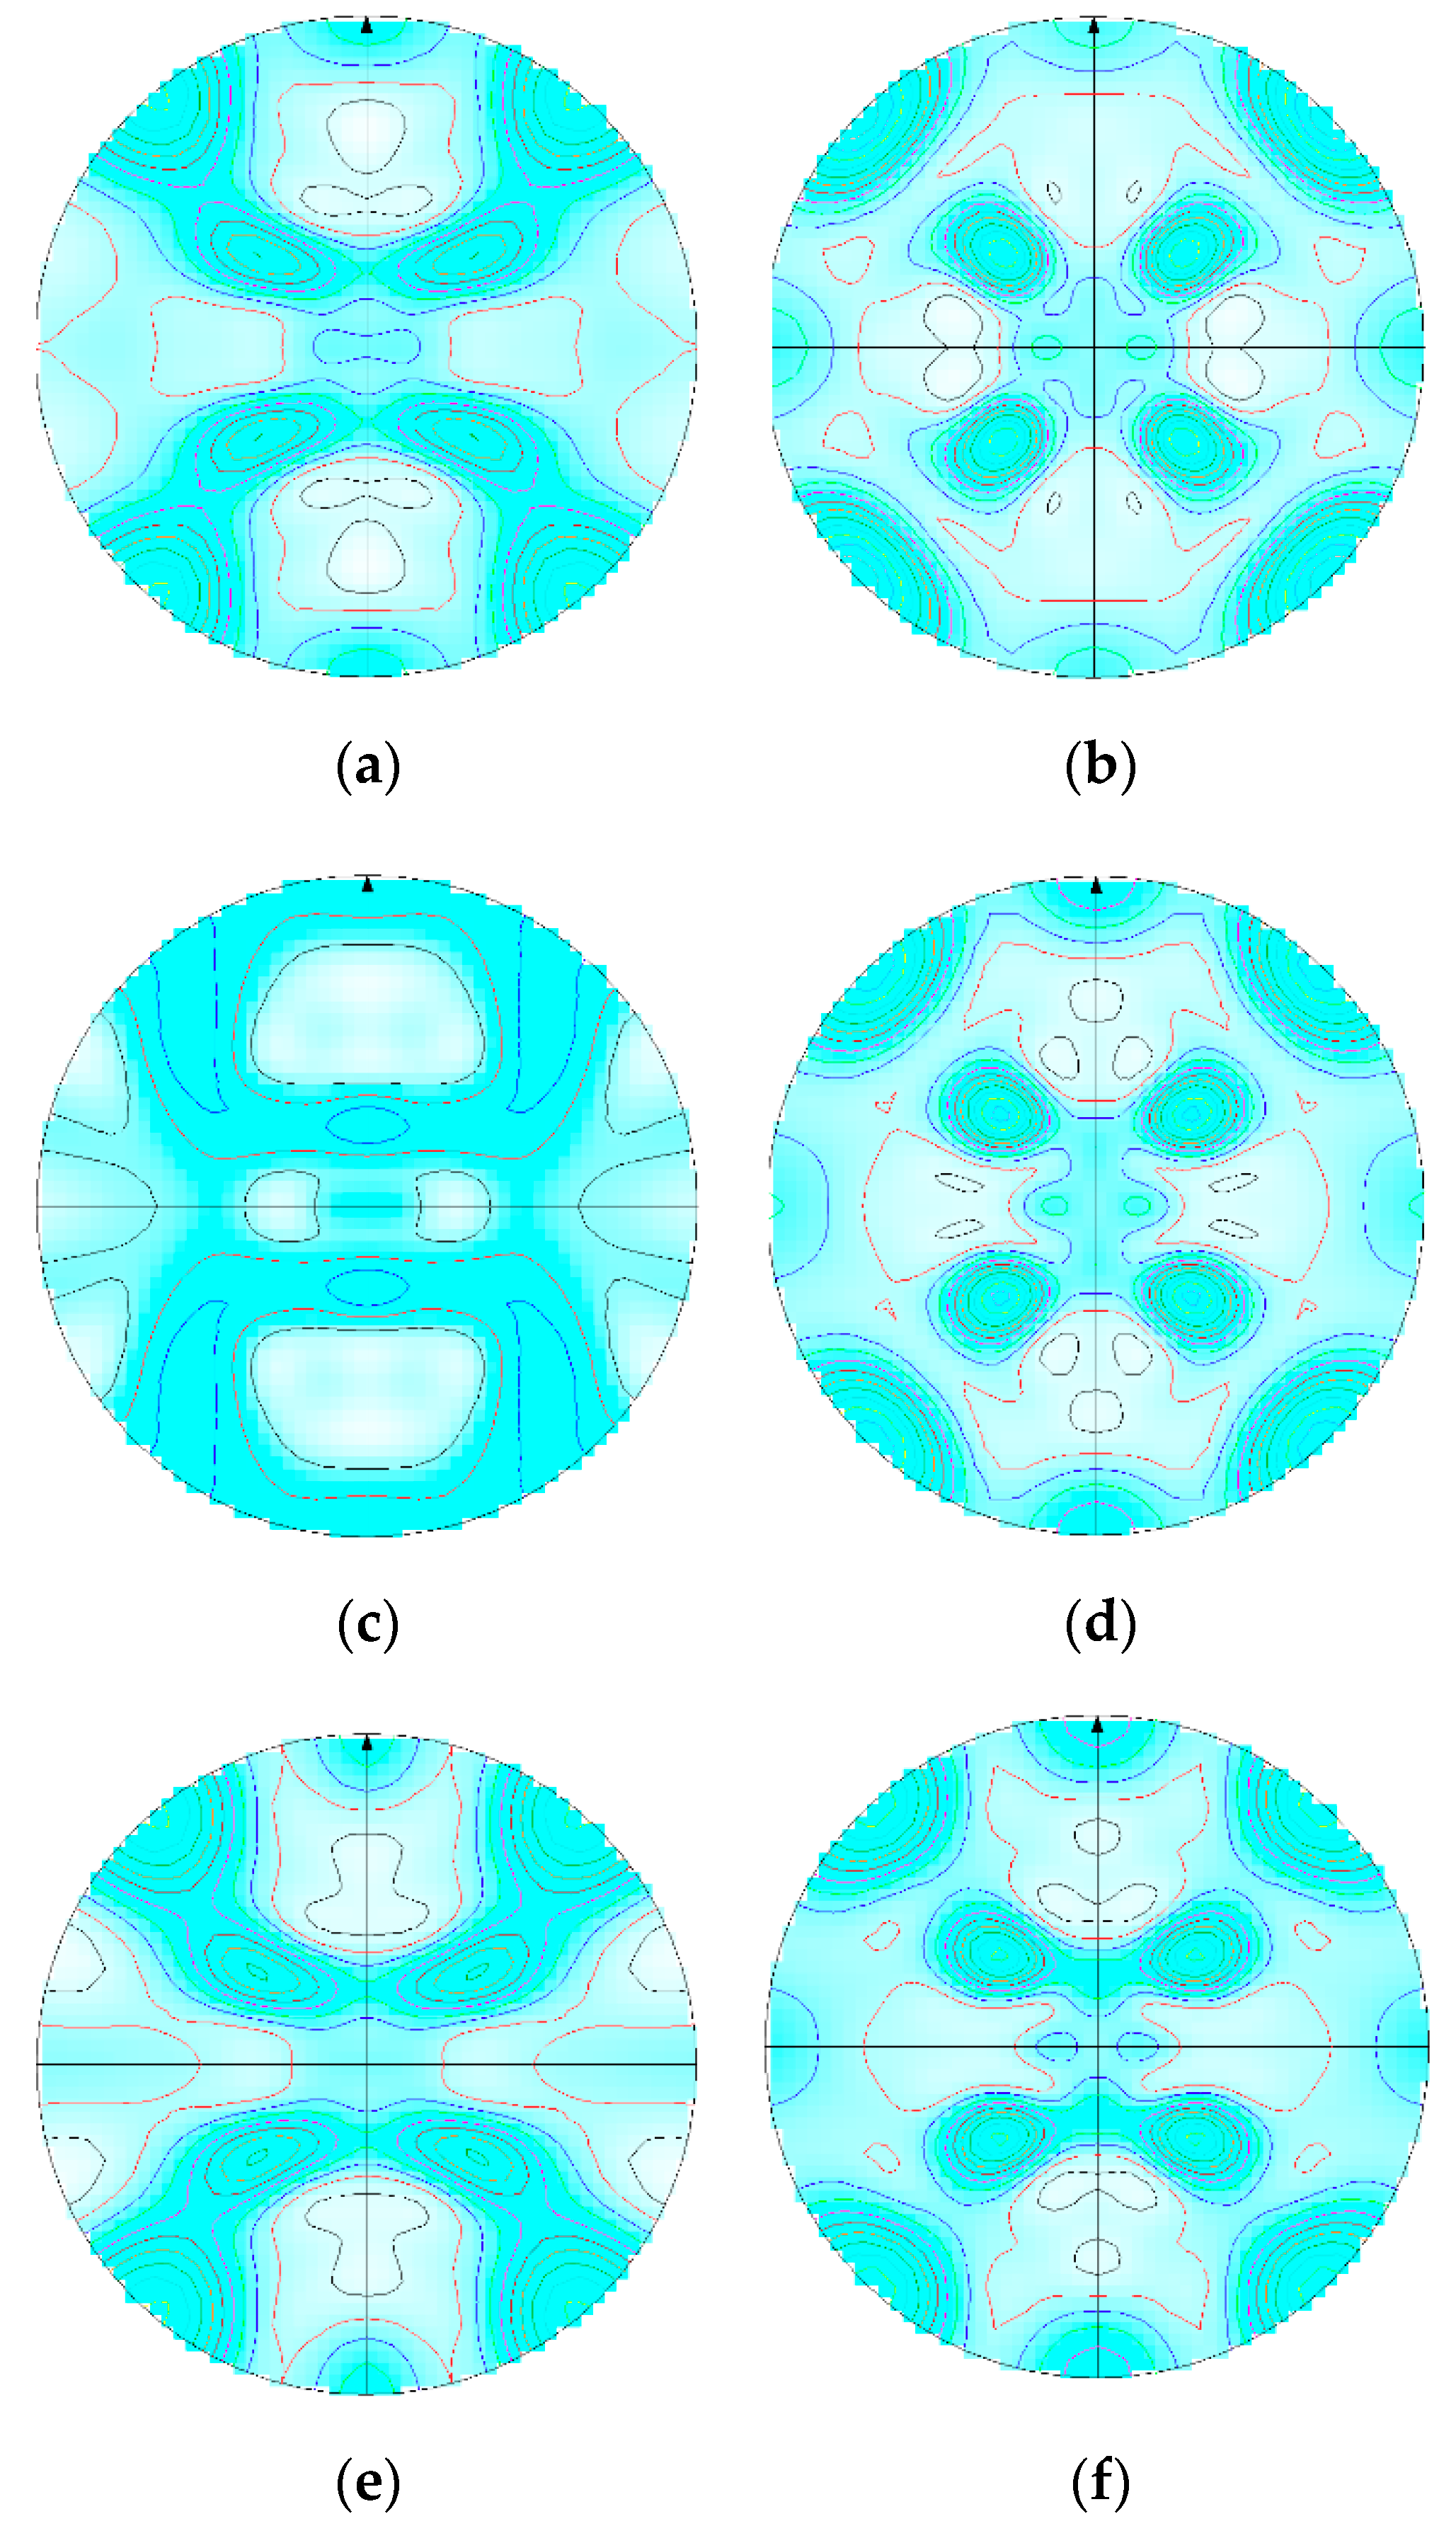
Figure 2 shows the recalculated {200} pole figures of the UD and CR samples rolled in 6 passes. It can be seen that the pole figures of the UD samples (Figure 2a,c,e) exhibit two-fold symmetry, while those of the CR samples (Figure 2b,d,f) exhibit four-fold symmetry.
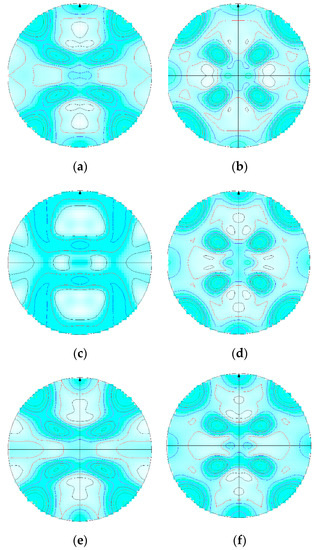
Figure 2.
Recalculated {200} pole figures of the samples cold-rolled in 6 steps. (a) A1; (b) A3K; (c) A5; (d) A4K; (e) A6; (f) A9K.
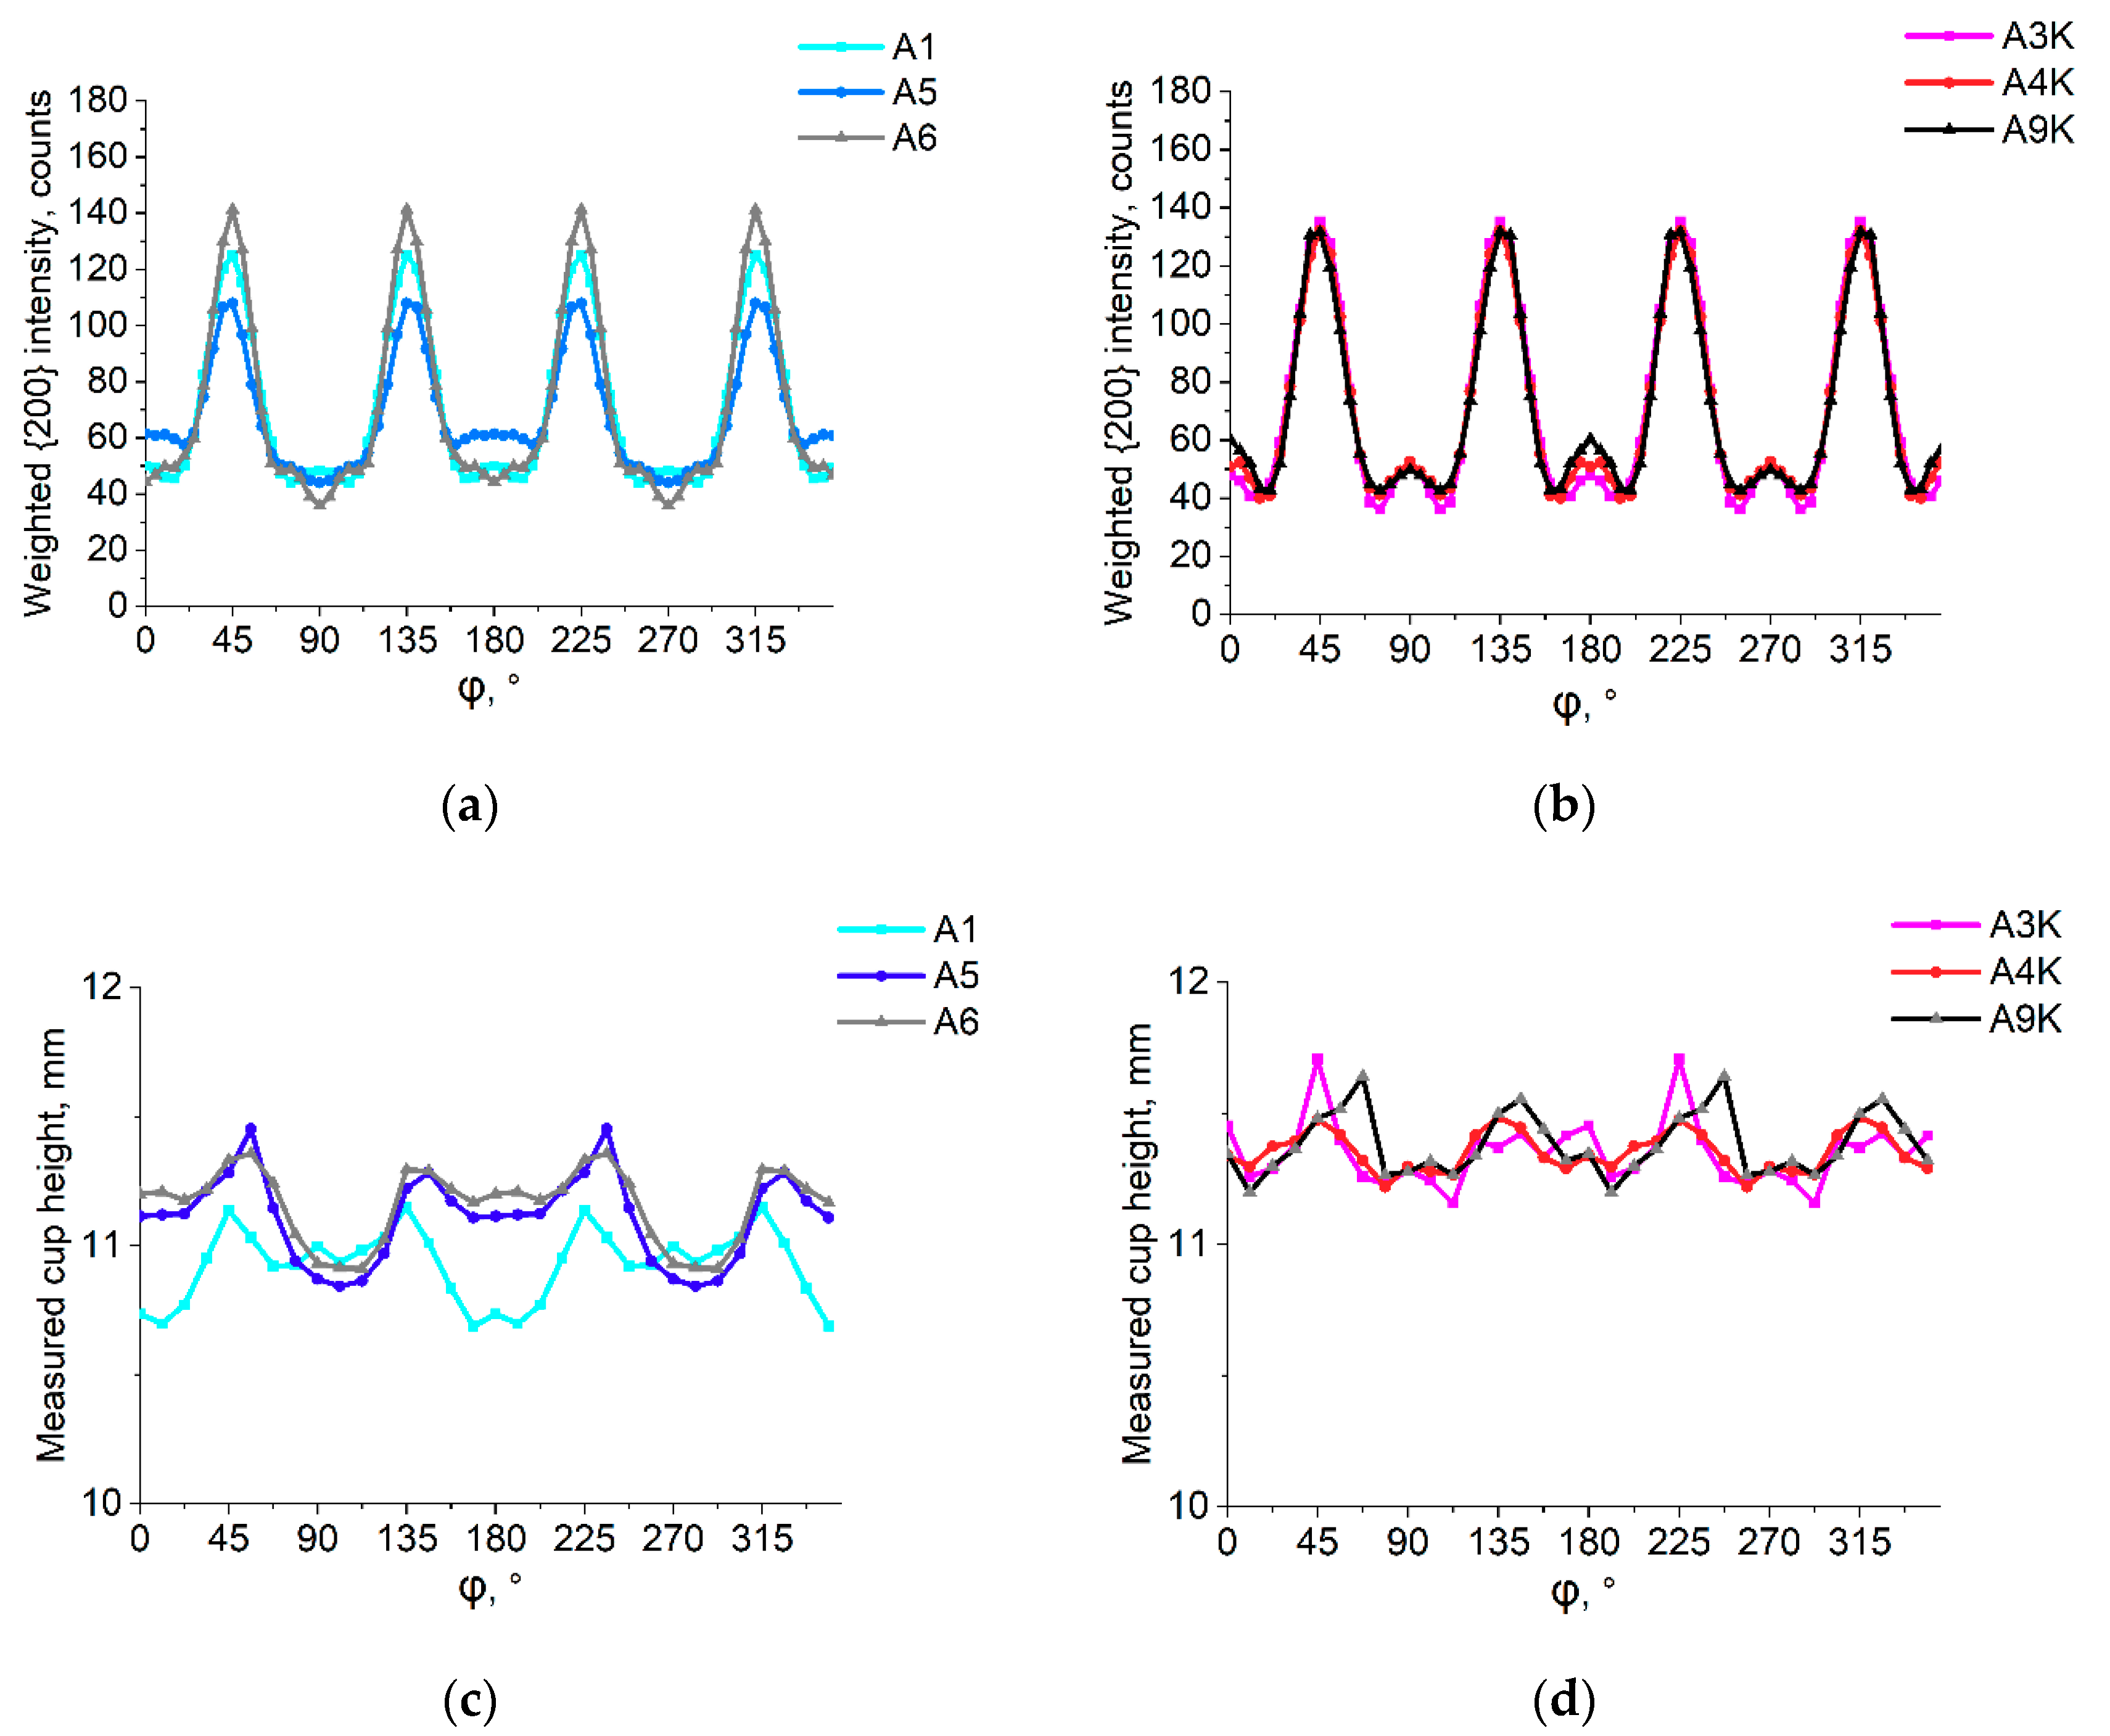
In Figure 3, the cup heights of the samples rolled in 6 passes are summarized. Figure 3a shows the predicted relative cup heights (weighted {200} intensities) versus PHI for the UD samples and Figure 3b for the CR samples. Figure 3c,d show measured cup heights for the UD and CR samples, respectively. For both UD and CR samples, ears appear in the 45° + (n × 90°) directions on the predicted and measured cup height diagrams as well. Accordingly, rolling earing is observed after both UD and CR. It is evident that the positions of ears can be recognized more easily on the predicted relative cup height diagrams. However, based on these diagrams, it is quite difficult to tell which rolling mode resulted in larger earing. It is also worth noting that on the predicted relative cup height diagrams, small peaks are present in the 0° + (n × 90°) directions as well besides the ears. This was observed in a previous work as well, and was used to follow the evolution of rolling earing to recrystallized earing [12].
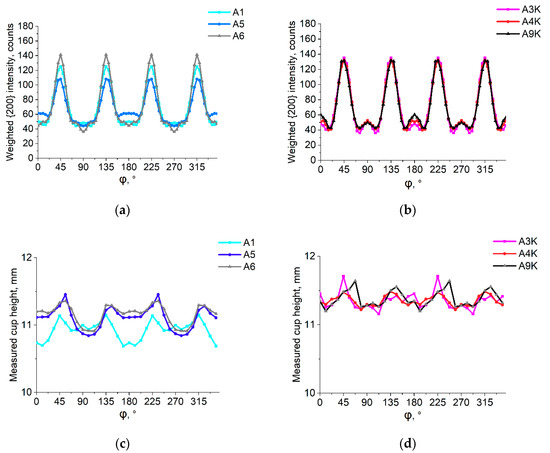
Figure 3.
Cup heights of the samples cold-rolled in 6 steps. (a) Predicted relative cup heights of unidirectionally rolled samples; (b) predicted relative cup heights of cross-rolled samples; (c) measured cup heights of unidirectionally rolled samples; (d) measured cup heights of cross-rolled samples.
Average earing calculated from measured cup heights and predicted average earing calculated from weighted {200} intensities of UD and CR samples are plotted in Figure 4a,b, respectively. Note that the used scaling factor for UD was 40 and for CR it was 60. For convenience, the negative sign, which usually corresponds to rolling type earing, is neglected. It can be seen that the average earing values of the UD samples are around 2.5, while those of the CR samples are around 1.5. Thus, it can be stated that cross-rolling results in notably smaller earing compared to unidirectional rolling.
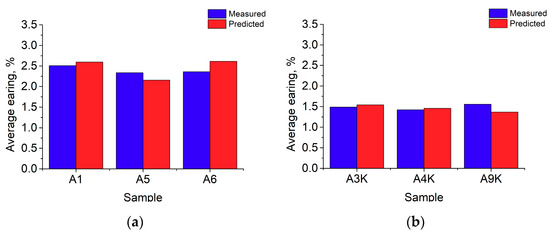
Figure 4.
Absolute value of average earing of the samples cold-rolled in 6 steps. (a) Measured and predicted average earing of unidirectionally rolled samples, scaling factor: 40; (b) measured and predicted average earing of cross-rolled samples, scaling factor: 60.
3.2. Results of 12 Pass Rolling
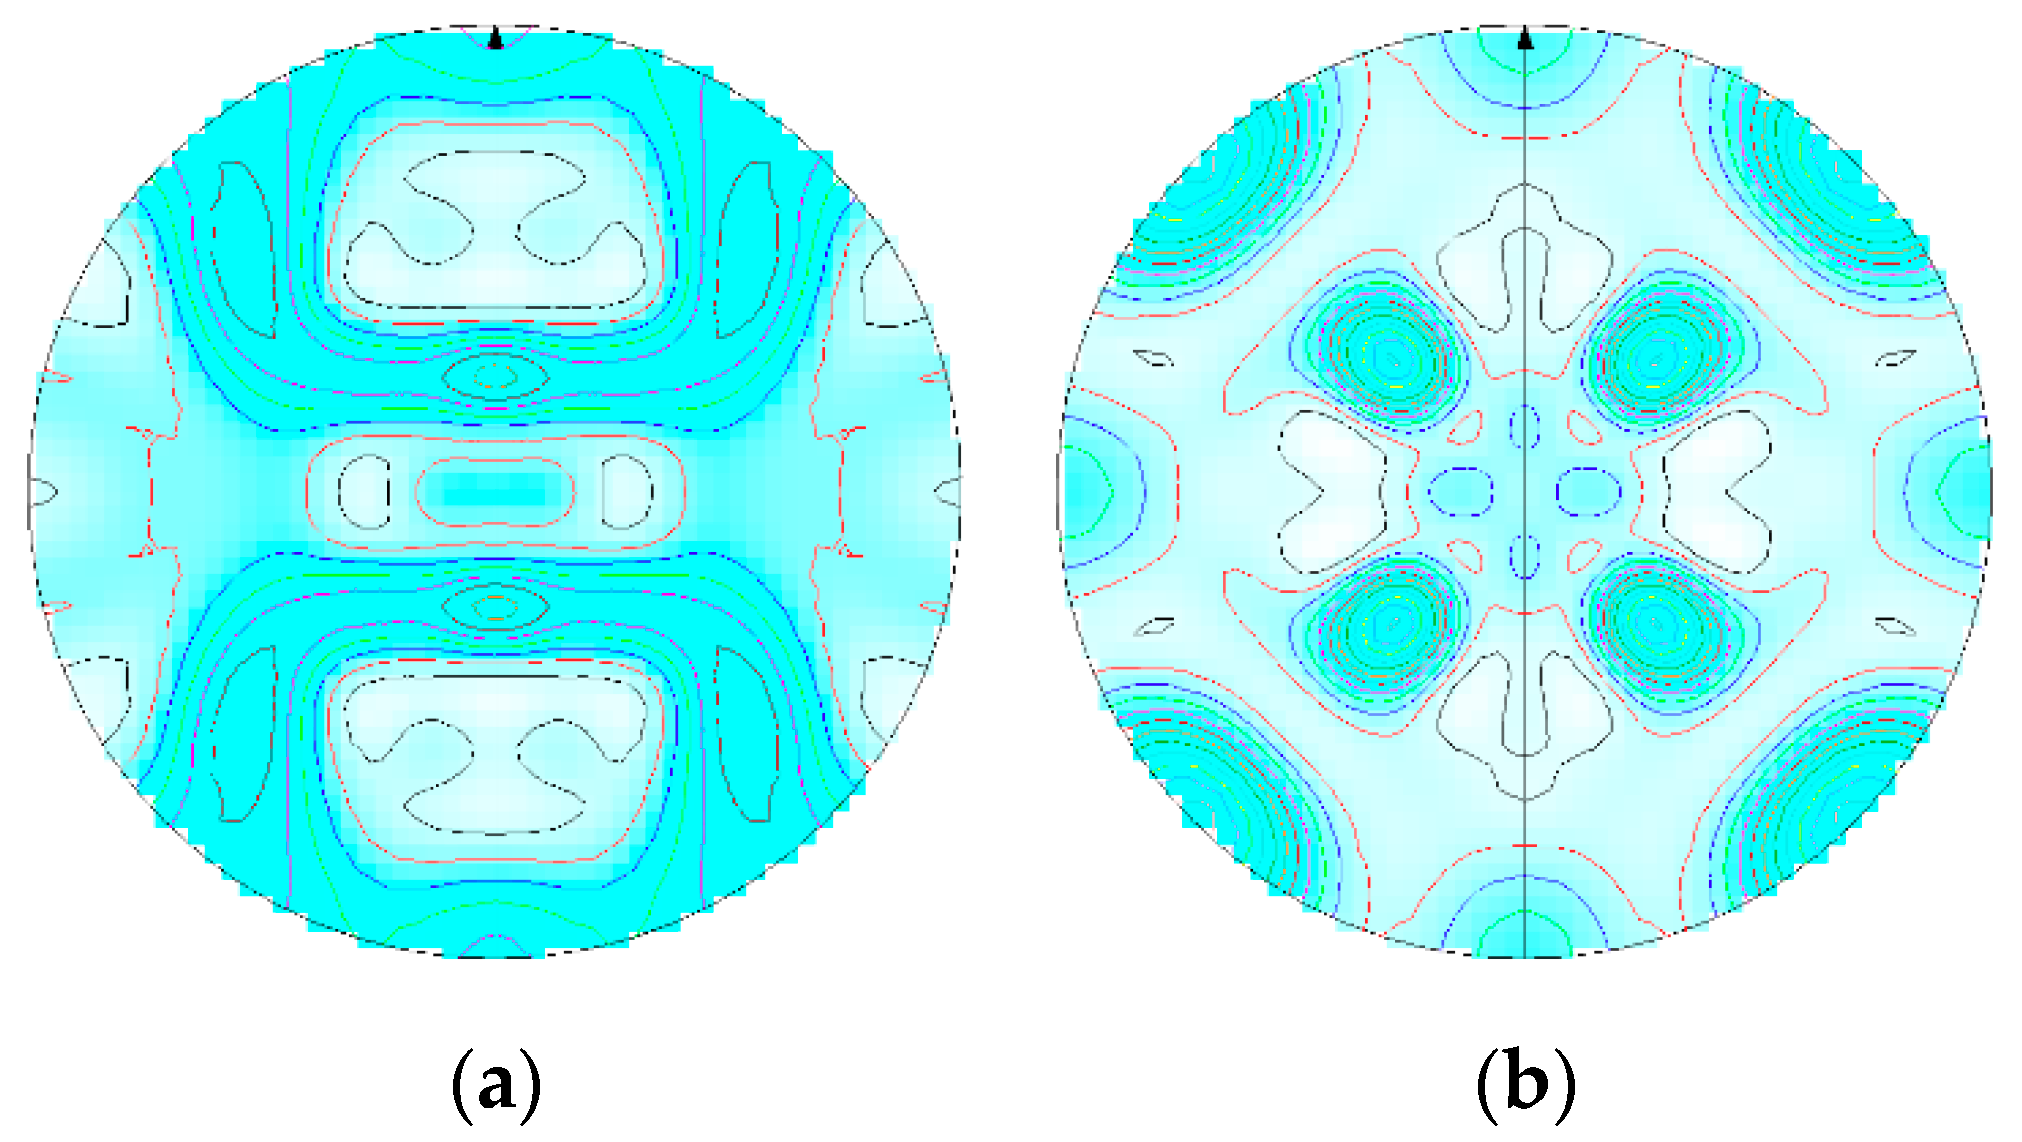
In Figure 5, the recalculated {200} pole figures of the UD and CR samples rolled in 12 passes is presented. The two-fold symmetry of the UD sample (Figure 5a) and the four-fold symmetry of the CR sample (Figure 5b) are clearly seen.
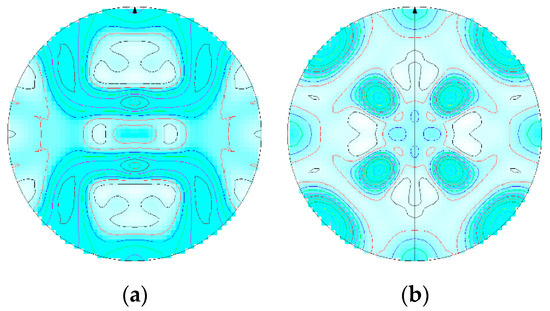
Figure 5.
Recalculated {200} pole figures of the samples cold-rolled in 12 steps. (a) A10; (b) A11K.
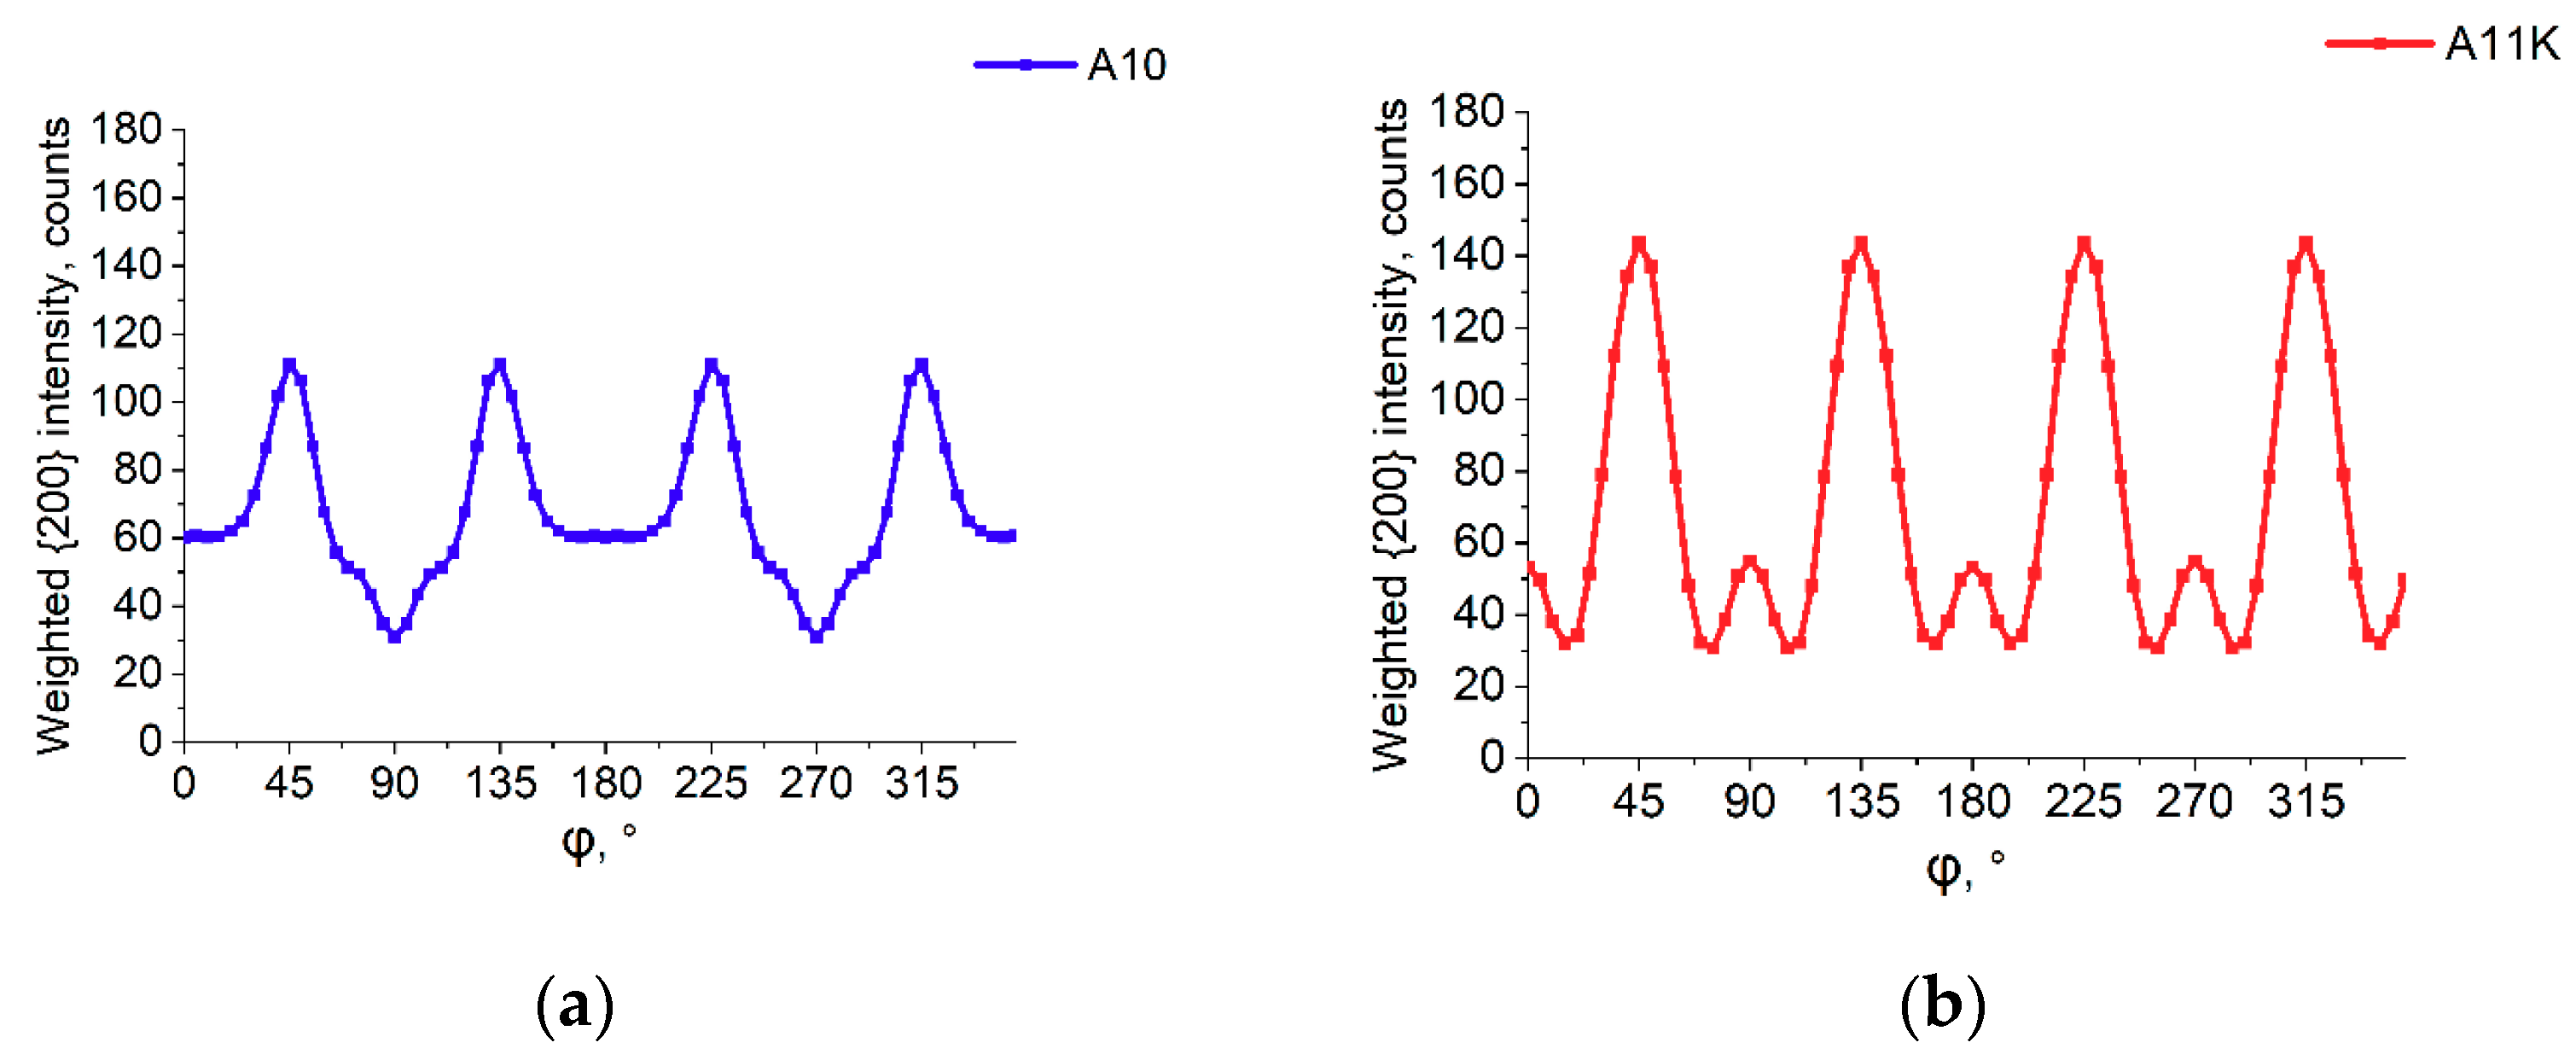
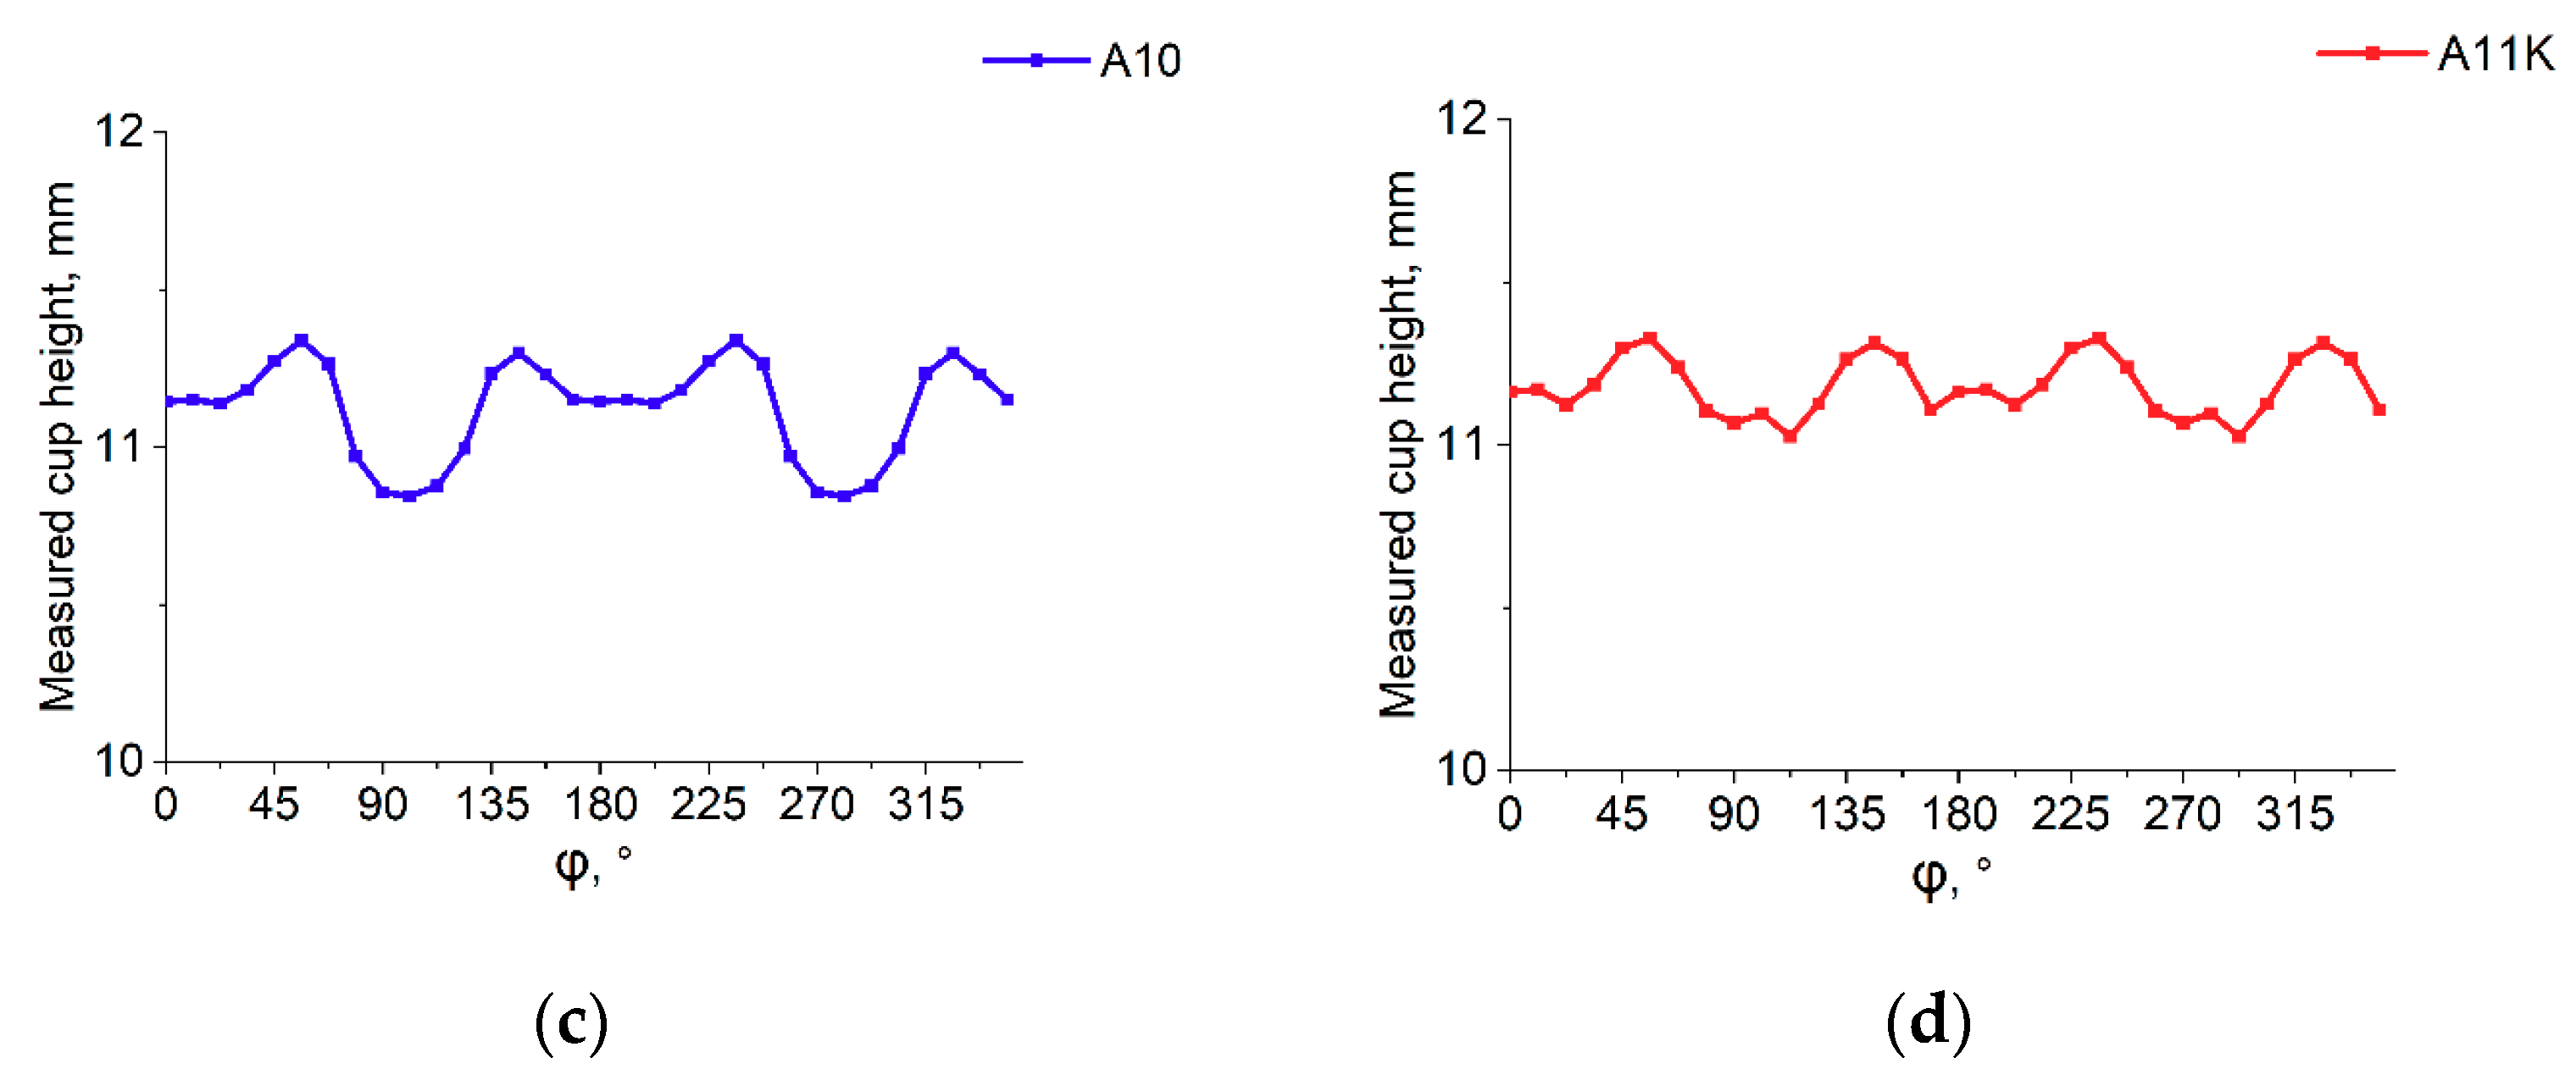
Figure 6 shows cup heights of the samples rolled in 12 passes. In Figure 6a, the predicted relative cup height for the UD sample can be seen, and in Figure 6b that of the CR sample. Figure 6c,d plots measured cup heights for the UD and CR samples, respectively. Again, ears appear in the 45° + (n × 90°) directions on the predicted and measured cup height diagrams after both UD and CR, showing that rolling earing has been developed. The magnitude of earing is difficult to read from the predicted relative cup height and also from the measured cup height diagrams.
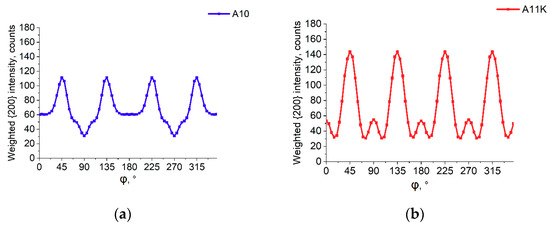
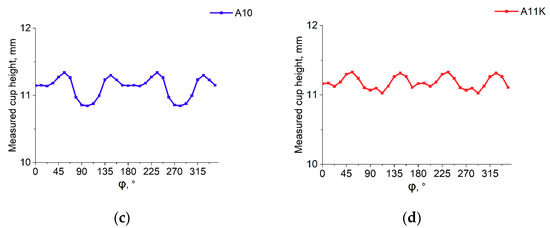
Figure 6.
Cup heights of the samples cold-rolled in 12 steps. (a) Predicted relative cup height of the unidirectionally rolled sample; (b) predicted relative cup height of the cross-rolled sample; (c) measured cup height of the unidirectionally rolled sample; (d) measured cup height of the cross-rolled sample.
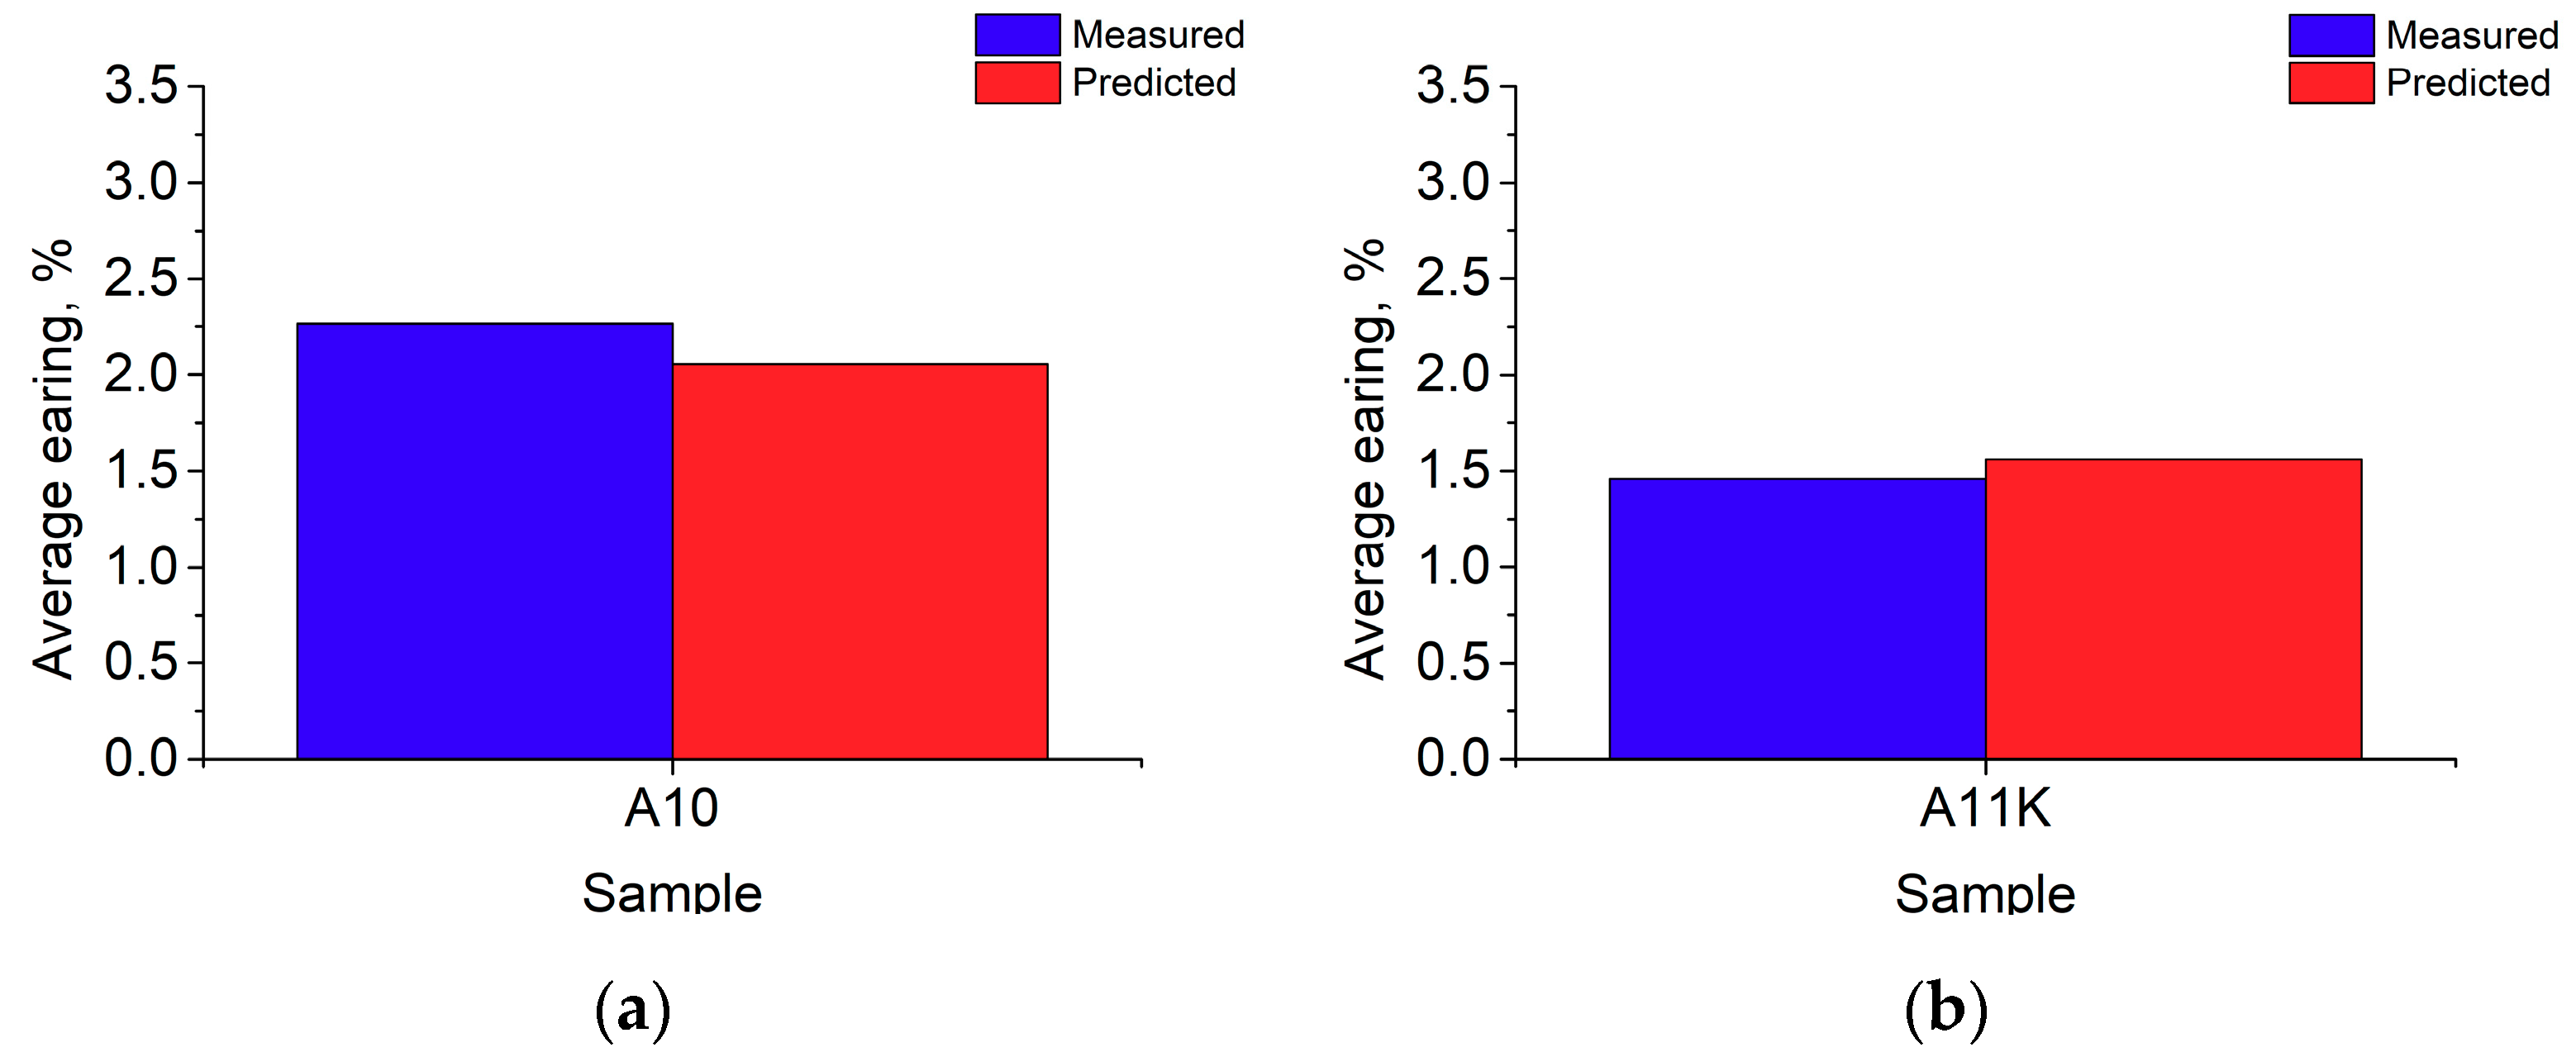
Average earing of UD and CR samples is plotted in Figure 7a,b, respectively. The values are around 2.2 for the UD and around 1.5 for the CR samples. It can be said that cross-rolled samples show smaller earing compared to unidirectionally rolled ones after 12 passes as well.

Figure 7.
Absolute value of average earing of the samples cold-rolled in 12 steps. (a) Measured and predicted average earing of the unidirectionally rolled sample, scaling factor: 40; (b) measured and predicted average earing of the cross-rolled sample, scaling factor: 60.
4. Discussion
It was seen that after both 6 and 12 passes, the cross-rolled, 5056 type aluminum sheets exhibited more uniform, four-folded {200} pole figures compared to unidirectionally rolled sheets. In accordance, a notably smaller value of rolling-type earing (~1.5) was observed after cross-rolling compared to the unidirectionally rolled sheets (~2.2–2.5). As a consequence, a different scaling factor was required to predict average earing in the case of cross-rolling (60 instead of 40) even if all other parameters (including the parameters of cold rolling, texture measurements, deep-drawing, blank geometry, etc.) are unchanged. Finally, it can be concluded that besides unidirectional rolling, the developed method can be applied for cross-rolling as well.
Author Contributions
Conceptualization, M.B.; methodology, M.B.; validation, A.H. and B.S.; formal analysis, M.B.; investigation, M.B., A.H. and B.S.; data curation, B.S. and A.H.; writing—original draft preparation, M.B.; writing—review and editing, A.H.; visualization, B.S.; supervision, V.M.; funding acquisition, M.B. All authors have read and agreed to the published version of the manuscript.
Funding
Supported by the ÚNKP-19-4 New National Excellence Program of the Ministry for Innovation and Technology and the NKFIH K119566 project.
Acknowledgments
The authors are grateful for Gabor Beres from the John von Neumann University for his aid in carrying out the deep-drawing tests.
Conflicts of Interest
The authors declare no conflict of interest.
References
- Neugebauer, R.; Glass, R.; Kolbe, M.; Hoffmann, M. Optimisation of processing routes for cross rolling and spin extrusion. J. Mater. Process. Tech. 2002, 125–126, 856–862. [Google Scholar] [CrossRef]
- Li, X.; Al-Samman, T. Mechanical properties and anisotropy of ME20 magnesium sheet produced by unidirectional and cross rolling. Mater. Des. 2011, 32, 4385–4393. [Google Scholar] [CrossRef]
- Wronski, S.; Wrobel, M.; Baczmanski, A.; Wierzbanowski, K. Effects of cross-rolling on residual stress, texture and plastic anisotropy in f.c.c. and b.c.c. metals. Mater. Charact. 2013, 77, 116–126. [Google Scholar] [CrossRef]
- Huh, M.Y.; Cho, S.Y.; Engler, O. Randomization of the annealing texture in aluminum 5182 sheet by cross-rolling. Mat. Sci. Eng. A 2001, A315, 35–46. [Google Scholar] [CrossRef]
- Tang, W.; Huang, S.; Li, D.; Peng, Y. Mechanical anisotropy and deep drawing behaviors of AZ31 magnesium alloy sheets produced by unidirectional and cross rolling. J. Mater. Process. Tech. 2015, 215, 320–326. [Google Scholar] [CrossRef]
- Fukui, S.; Kudo, H. The earing in deep-drawing and directionality in tension-test of sheet metal. Rep. Inst. Sci. Tech. Univ. Tokyo 1950, 4, 33. [Google Scholar]
- Sowerby, R.; Johnson, W. Prediction of earing in cups drawn from Anisotropic sheet using slip-line field theory. J. Strain Anal. 1974, 9, 102–108. [Google Scholar] [CrossRef]
- Tucker, G.E.G. Texture and earing in deep drawing of aluminium. Acta Metall. 1961, 9, 275–286. [Google Scholar] [CrossRef]
- Kanatake, N.; Tozawa, Y.; Otani, T. Calculations from texture of earing in deep drawing for fcc metal sheets. Int. J. Mech. Sci. 1983, 25, 337–345. [Google Scholar] [CrossRef]
- Van Houtte, P.; Cauwenberg, G.; Aernoudt, E. Analysis of the earing behaviour of aluminium 3004 alloys by means of a simple model based on yield loci calculated from orientation distribution functions. Mater. Sci. Eng. 1987, 95, 115–124. [Google Scholar] [CrossRef]
- Engler, O.; Mertens, N.; Van Dam, P. Texture-based design of a convoluted cut-edge for earing-free beverage cans. J. Mater. Process. Tech. 2011, 211, 1278–1284. [Google Scholar] [CrossRef]
- Benke, M.; Hlavacs, A.; Imre, P.; Mertinger, V. Prediction of earing of aluminium sheets from {h00} pole figures. Eur. J. Mech. A Solid 2020, 81, 103950. [Google Scholar] [CrossRef]
- Sepsi, M.; Mertinger, V.; Benke, M. Sample cutting-free pole figure measurement method for centreless diffractometers in modified X mode. Mater. Char. 2019, 151, 351–357. [Google Scholar] [CrossRef]
- Ma, Q.; Mao, W.; Feng, H.; Yu, Y. Rapid texture measurement of cold-rolled aluminum sheet by X-ray diffraction. Scr. Mater. 2006, 54, 1901–1905. [Google Scholar] [CrossRef]

© 2020 by the authors. Licensee MDPI, Basel, Switzerland. This article is an open access article distributed under the terms and conditions of the Creative Commons Attribution (CC BY) license (http://creativecommons.org/licenses/by/4.0/).