Article

Physical and Structural Characterization of Monocrystalline Cu-13.7% Al-4.2% Ni Alloy Submitted to Thermo-Cyclical Treatments under Applied Loads

by
Lioudmila A. Matlakhova
1,*,
Elaine C. Pereira
1,
Serguey A. Pulnev
2,
Carlos Y. Shigue
3 and
Natalia A. Palii
4
1
Advanced Materials Laboratory, Science and Technology Center, Darcy Ribeiro State University of Northern Rio de Janeiro, Campos dos Goytacazes 28013-620, Brazil
2
Division of Solid State Physics, Ioffe Institute, St. Petersburg 194021, Russia
3
Lorena School of Engineering, University of São Paulo, São Paulo 05508060, Brazil
4
Laboratory of Physical Chemistry of Amorphous and Nanocrystalline Alloys, A.A. Baikov Institute of Metallurgy and Materials Science, Russian Academy of Sciences, Moscow 119334, Russia
*
Author to whom correspondence should be addressed.
Metals 2020, 10(2), 219; https://doi.org/10.3390/met10020219
Submission received: 19 December 2019 / Revised: 24 January 2020 / Accepted: 25 January 2020 / Published: 4 February 2020

Abstract

:
Monocrystalline alloy with a nominal composition of Cu-13.7% Al-4.2% Ni (wt.%) that shows reversible martensitic transformations (RMTs) was studied. The alloy, manufactured by the “Memory Crystals Group” in Russia, was subjected to thermo-cyclical treatment (TCT) under tension within a range that included critical RMT temperatures. A special device was developed to perform TCTs (up to 500 cycles) and three different loads were applied: 0.11, 0.26, and 0.53 MPa. X-ray diffraction analysis, optical microscopy, differential calorimetry, and Vickers microhardness were involved in the alloy’s characterization. Under TCTs, the alloy displayed complex structural transformation, revealing the sequence of RMT, β1 ↔ R ↔ β′1 + γ′1; the involved phases were coherently precipitated but very sensitive to the experimental conditions. It was found that during TCTs (from 300 cycles) performed under optimum load (0.26 MPa), the processes of martensite reorientation, hardening, and stabilization of the structure were the most intensive thus leading to a reduction of RMT critical intervals and increased microhardness.

Graphical Abstract

1. Introduction

Metal alloys exhibiting the shape memory effect (SME) have specific properties due to the fact of reversible martensitic transformations (RMTs) [1,2,3]. Widely used in industrial and medical applications, TiNi-based alloys have superb SME characteristics [3,4,5,6], but owing to their high cost, other shape memory alloys (SMAs) are under consideration. Copper-based SMAs cost less; moreover, they have high transformation temperatures, superior thermal and electrical conductivity, and large recoverable strain [7,8,9].
Monocrystalline Cu–Al–Ni (Cu3Al-based) alloys have received special attention, because they display high SME parameters along with good thermoelastic properties, formability, and plasticity without embrittlement at high temperatures [7,8,9,10,11,12,13]. Such SMAs are based on the Cu3Al intermetallic compound; they have different structures, depending on the composition, temperature, heat treatment, and deformation. At elevated temperatures, the Cu3Al-based alloys have a structure of a β-phase, a body-centered cubic (BCC) phase, but below 565 °C, it undergoes the ordering to form the metastable β1 phase, an ordered cubic structure of the DO3 type [14,15]. With subsequent cooling and depending on the aluminum content, the ordered β1 phase, in turn, can transform into either martensite γ’1, the ordered phase of Cu3Ti type, or martensite β’1, the ordered phase of Cu3Al type [1,3,15]. Aside from the aforementioned phases, the diffractograms of monocrystalline Cu–Al–Ni alloys may display additional peaks that can be attributed to the rhombohedral ordered Al7Cu4Ni phase (JCPDS: 28-0016) with the space-group R-3m of the trigonal crystal system [16,17]. In our previous work [12,18,19], it was shown that the microstructures of Cu–Al–Ni alloys revealed the presence of the rhombohedral ordered Al7Cu4Ni phase, so the additional peaks in diffractograms would be due to (1) the ordering of the Ni atoms incorporated into the crystalline lattice of alloy and/or (2) the development of a transitional crystal lattice state during RMT, β1 ↔ γ′1 [15,16,17,18,19]. The Al7Cu4Ni phase is called the R-phase in the present study as in our previous works [18,19,20,21,22].
Multiple heating/cooling cycles within a temperature range, which includes critical RMT temperatures, are required to perform a repetitive SME regime for investigated alloys. The restrictions in the practical application of SMAs are the possible undesirable changes in the SMAs’ structure and performance after multiple thermal cycles. As is well known, thermos-cyclical treatments (TCTs) promote changes in the structure and phase composition of the alloy thus modifying its physical and mechanical properties [3,7,8,9,10,11]. In fact, each thermal cycle may produce additional imperfections, resulting in changes in RMT behavior, namely, the change in RMT critical temperatures [7,8,11].
Reversible martensitic transformations can develop under applied loads as well as thermal stresses in alloys that are used in force elements of several actuators. The applied loads give rise to tensions, deformations, and transformations of metastable phases (induced transformations) thus changing the structure and properties of the material in a complex way [4,7,8,9,10,11,12,13].
This work was conducted as the continuation of our work examining the effect of cyclic tests on monocrystalline alloys of the Cu–Al–Ni system on the structure, critical temperatures, and hysteresis of reversible martensitic transformations, involving multiple cycles of heating above Af and cooling below Mf; we changed the test conditions and the composition of the studied alloys. So, in Reference [12], monocrystalline Cu-13.5Al-4Ni alloys were subjected to 100, 200, and 300 thermal cycles (TC) without load. In Reference [13], we studied two monocrystalline alloys: Cu-13,5Al-4Ni and Cu-13,7Al-4,2Ni in the initial state and after 1, 100, and 200 thermal cycles (TCs) without load. In Reference [18], monocrystalline Cu-13.5Al-4Ni alloy was subjected to thermal cycling treatments conducted for 100, 200, and 300 cycles free of load and under a static load of 0.5 kg, corresponding to a compressive stress of 0.28 MPa. This stress was a fraction of the alloy’s “pseudo-yield” stress, determined as 60–65 MPa. In other tests, thermal cycling treatment was performed under different loads of 0.2 and 0.5 kg involving 300 cycles. In Reference [19], the same alloy was subjected to 300 thermal cycling treatment in a load-free regime and under three different applied load of 0.1, 0.2, and 0.5 kg, corresponding to 0.056, 0.112, and 0.280 MPa, respectively; and in Reference [20], this alloy passed through three distinct thermal cycling treatments involving 100, 200, and 300 cycles under one static load of 0.5 kg (0.280 MPa). These tests revealed that the monocrystalline Cu-13.5wt.% Al-4.0wt.% Ni alloy suffered reversible martensitic transformation, γ’1 ↔ β1 associated with a thermal hysteresis of about 20 °C when subjected to thermal cycling treatments. The phase transformation enthalpies of endothermic (direct) and exothermic (reverse) processes in the initial state and in a first of load-free thermal cycles were approximately 6.8–7.4 J/g. The thermal hysteresis of the RTM promotes changes in the number of phases associated with the RMT. These changes depend on the way the treatment ends, either by heating or by cooling. After 300 TCs without load, displacement of the critical temperatures Mo, Mf, Ao, As as well as the peak temperatures Ae and Me is observed towards values up to 10 °C lower, while Ms increases by more than 10 °C. This contributes to enlarging the temperature interval of the RMT occurrence. By contrast, no change occurred in the thermal hysteresis. After a load-free 300 TCs, if the end occurs by heating above Af, a larger amount of β1 is transformed. If the end occurs by cooling below Mf, an intermediate structure, the R-phase, related to the γ′1 ↔ β1 is found. This is apparently a consequence of accumulated structural defects that retard the RMT and tend to stabilize the intermediate stage. The alloy submitted to TCs under a load of 0.5 kg revealed a tendency towards a decrease in the critical intervals for both direct and reverse martensite transformation with an increasing number of cycles. This tendency is accentuated for treatments up to 300 cycles in which critical temperature intervals of RMTs smaller than 10 °C were recorded. The hysteresis of the RMT also decreased. This can be attributed to a higher participation of the R-phase, particularly above 200 cycles, either alone or coherent with γ′1 (direct on cooling) and β1 (reverse on heating). It is also suggested that the applied load contributes to the shape deformation observed in blocks of martensite variants. Despite complex structural transformations, the monocrystalline Cu-13.5wt.% Al-4.0wt.% Ni alloy showed good resistance to irreversible changes during applied tests.
In a more recent work [21], we paid attention to the behavior of a monocrystalline Cu-13.7Al-4.2Ni alloy subjected to thermal cycling treatment induced for 1, 100, 200, 300, 400, and 500 cycles without applied load, i.e., stress free.
In the current work, which revisits and expands our research, monocrystalline Cu-13.7% Al-4.2% Ni alloy was subjected to up to 500 cycles under three constant loads within a critical RMT temperatures range along with the physical and structural characterization of the alloy during applied TCTs.

2. Materials and Methods

The basic material investigated was a high purity monocrystalline Cu-13.7wt.% Al-4.2wt.% Ni alloy, obtained as a cylindrical bar (4 mm in diameter) from the Memory Crystals Group of the Technical University of Saint Petersburg, Russia [23]. Specimens approximately 4 mm in thickness were sectioned out perpendicular to the bar axis by means of a Minitom cutter (Struers A/S Pederstrupvej, Denmark). For microstructure characterization, the specimens were polished to an acceptable mirror finish using 0.1 μm alumina paste. No chemical etching was used, since the surface relief of transformation was enough to reveal the phases.
Specimens were submitted to 1, 100, 200, 300, 400, and 500 thermal cycles of heating up to 90 °C (above Af—in the initial state) followed by cooling to 0 °C (below Mf—in the initial state). Each TCT was carried under a static load (TCTL). Three loads were applied: 0.14, 0.35, and 0.70 kg, corresponding to the stress of 0.11, 0.26, and 0.53 MPa, respectively. The chosen loads were below the flow limit determined as 70 MPa for this alloy [18,21]. The load was applied along with thermocycling using the special device developed for this purpose [18,19,20,21,22]. After TCTL, the structure of the alloy was analyzed by optical metallography and X-ray diffraction. Structural characterization was conducted at room temperature (RT) by finishing the treatment: (a) with a half cooling cycle to 0 °C, then up to RT, and (b) with a half heating cycle to 90 °C, then down to RT [12,18,19,20,21,22].
The phase structure of the alloy was determined at RT by X-ray diffraction (XRD) in both Shimadzu 7000 (SHIMADZU Corporation, Kyoto, Japan) and Seifert 65 diffractometers (Seifert GmbH, Ahrensburg, Germany) using Cu-Kα and Co-Kα radiations, respectively, for 2θ angles from 25° to 75° at scanning steps of 0.03°/3 s.
The surface morphological relief induced by the phase transformation and the involved deformation-related defects were observed in a Neophot-32 microscope (Carl Zeiss AG, Oberkochen, Germany) with polarized light. The microhardness was measured with a Shimadzu HMV-2 Micro Vickers Hardness Tester (Shimadzu Corporation, Kyoto, Japan). The RMT critical temperatures and associated thermal effects after the TCTL were determined using a Q10 differential scanning calorimeter (TA Instrument Co. Ltd., New Castle, DE, USA). The thermal tests were conducted in the temperature range from −50 °C to +150 °C with a heating/cooling rate of 10 °C/min in an inert atmosphere. Cooling was carried out using an LNCA mode (liquid nitrogen cooling). After TCTL, the samples were submitted to two thermal cycles during the DSC runs. In the first cycle of the DSC analysis, the samples were cooled to −50 °C, then heated to +150 °C, and cooled and heated again within the indicated temperature range. To determine the thermal hysteresis value in our studies, we made use of the difference between the DSC peaks’ critical temperatures upon heating and cooling (ΔT = Ap − Mp), according to Morin and Trivero [11].

3. Results

3.1. Analysis of the Monocrystalline Cu-13.7% Al-4.2% Ni Alloy in the Initial State

Considering that the critical RMT temperatures of the studied alloy cover the ambient temperature (AT), special care was given to the structural analysis of the alloy before TCT. In other words, the structure of the alloy was examined in the as-received state and during the first load-free thermal cycle ending with the ½ cooling cycle (AT → 0 °C → AT), heating (AT → +90 °C → AT), and performing the XRD analysis at room temperature (Figure 1).
The XRD pattern of the alloy in the as-received state in Figure 1a shows a significant amount of the β′1 martensitic phase, determined by the intensive β′1 and β′1 peaks, traces of the R-phase, determined by the peak (107)R, and the other peak found for the R-phase coinciding with the peak belonging to the β′1 phase and β′1|(0213)R.
After the ½ cooling cycle, in addition to the major β′1 phase peaks, β′1 and β′1, the XRD pattern displays the martensitic γ′1 peaks, (011)γ′1, (212)γ′1, and (111)γ′1, the R-phase, peaks, (107)R, β′1|(0213)R, and the minor presence of the β1 phase, peak (331)β1 (Figure 1b). The structure of the alloy submitted to ½ heating cycle (Figure 1c) varied deeply in the participation of the aforementioned phases: the greater the participation of the martensite γ′1 phase, there was some increase in the participation of the high-temperature β1 phase, (331)β1, while the presence of the β′1 and R-phases was less intensive.
The DSC analysis of monocrystalline Cu-13.7% Al-4.2% Ni alloy in the initial state (Figure 2) showed that on the second heating, the reverse RMT (β′1 + γ′1) → β1 occurred in the range from +38.2 °C (As) to +68.8 °C (Af) through an endothermic process with a phase transformation enthalpy of 9 J/g. The process developed an “on-set” mode from +51.4 °C (Ao), presenting the peak temperature of +54.7 °C (Ap), where the heat flux was maximum. The process ended in an “off-set” mode at the temperature of +60.4 °C (Aof). On cooling of the alloy, the direct RMT β1 → (β′1 + γ′1) occurs between +51.4 °C (Ms) and 16.0 °C (Mf), having on-set temperature peaks 47.7 °C (Mo), +42 °C (Mp) and +32.6 °C (Mof), respectively, attributed to the exothermic process with a transformation enthalpy of 8.8 J/g.
It is known that SME Cu-Al-Ni alloys can undergo a single transformation (β1 → β′1 or β1 → γ′1) or a mixed transformation (β1 → γ′1 + β′1) depending on the composition of the alloy. In [24,25,26,27,28,29] it was confirmed that the mixed transformation (β1 → γ′1 + β′1) takes place in the structure of Cu–Al–Ni alloys of approximately the same composition as the studied alloy. These martensitic transformations to γ′1 or β′1 structures have negligible energy difference so that sliding along the atomic layers can be implemented. Thus, the transformation from one compact structure to another is easily accomplished [3,30].
The DSC results show that during heating/cooling of the alloy, the critical RMT ranges were narrow, approximately 30.6 °C for As-Af and 35.4 °C for Ms-Mf. As a measure of thermal hysteresis, the difference among the peak critical temperatures (ΔT = Ap − Mp) was determined at approximately 12.7 °C in the first thermal cycle [20,21,22]. According to References [3,24,25,26,27,28,29], RMT features can be deduced from the magnitude of the thermal hysteresis which is in good agreement with the results obtained, whereas the martensitic transformation β1 ↔ (β′1 + γ′1) presented hysteresis around 10 °C (Figure 3).

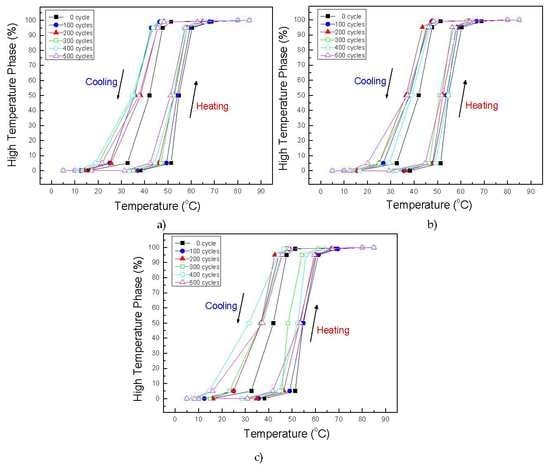
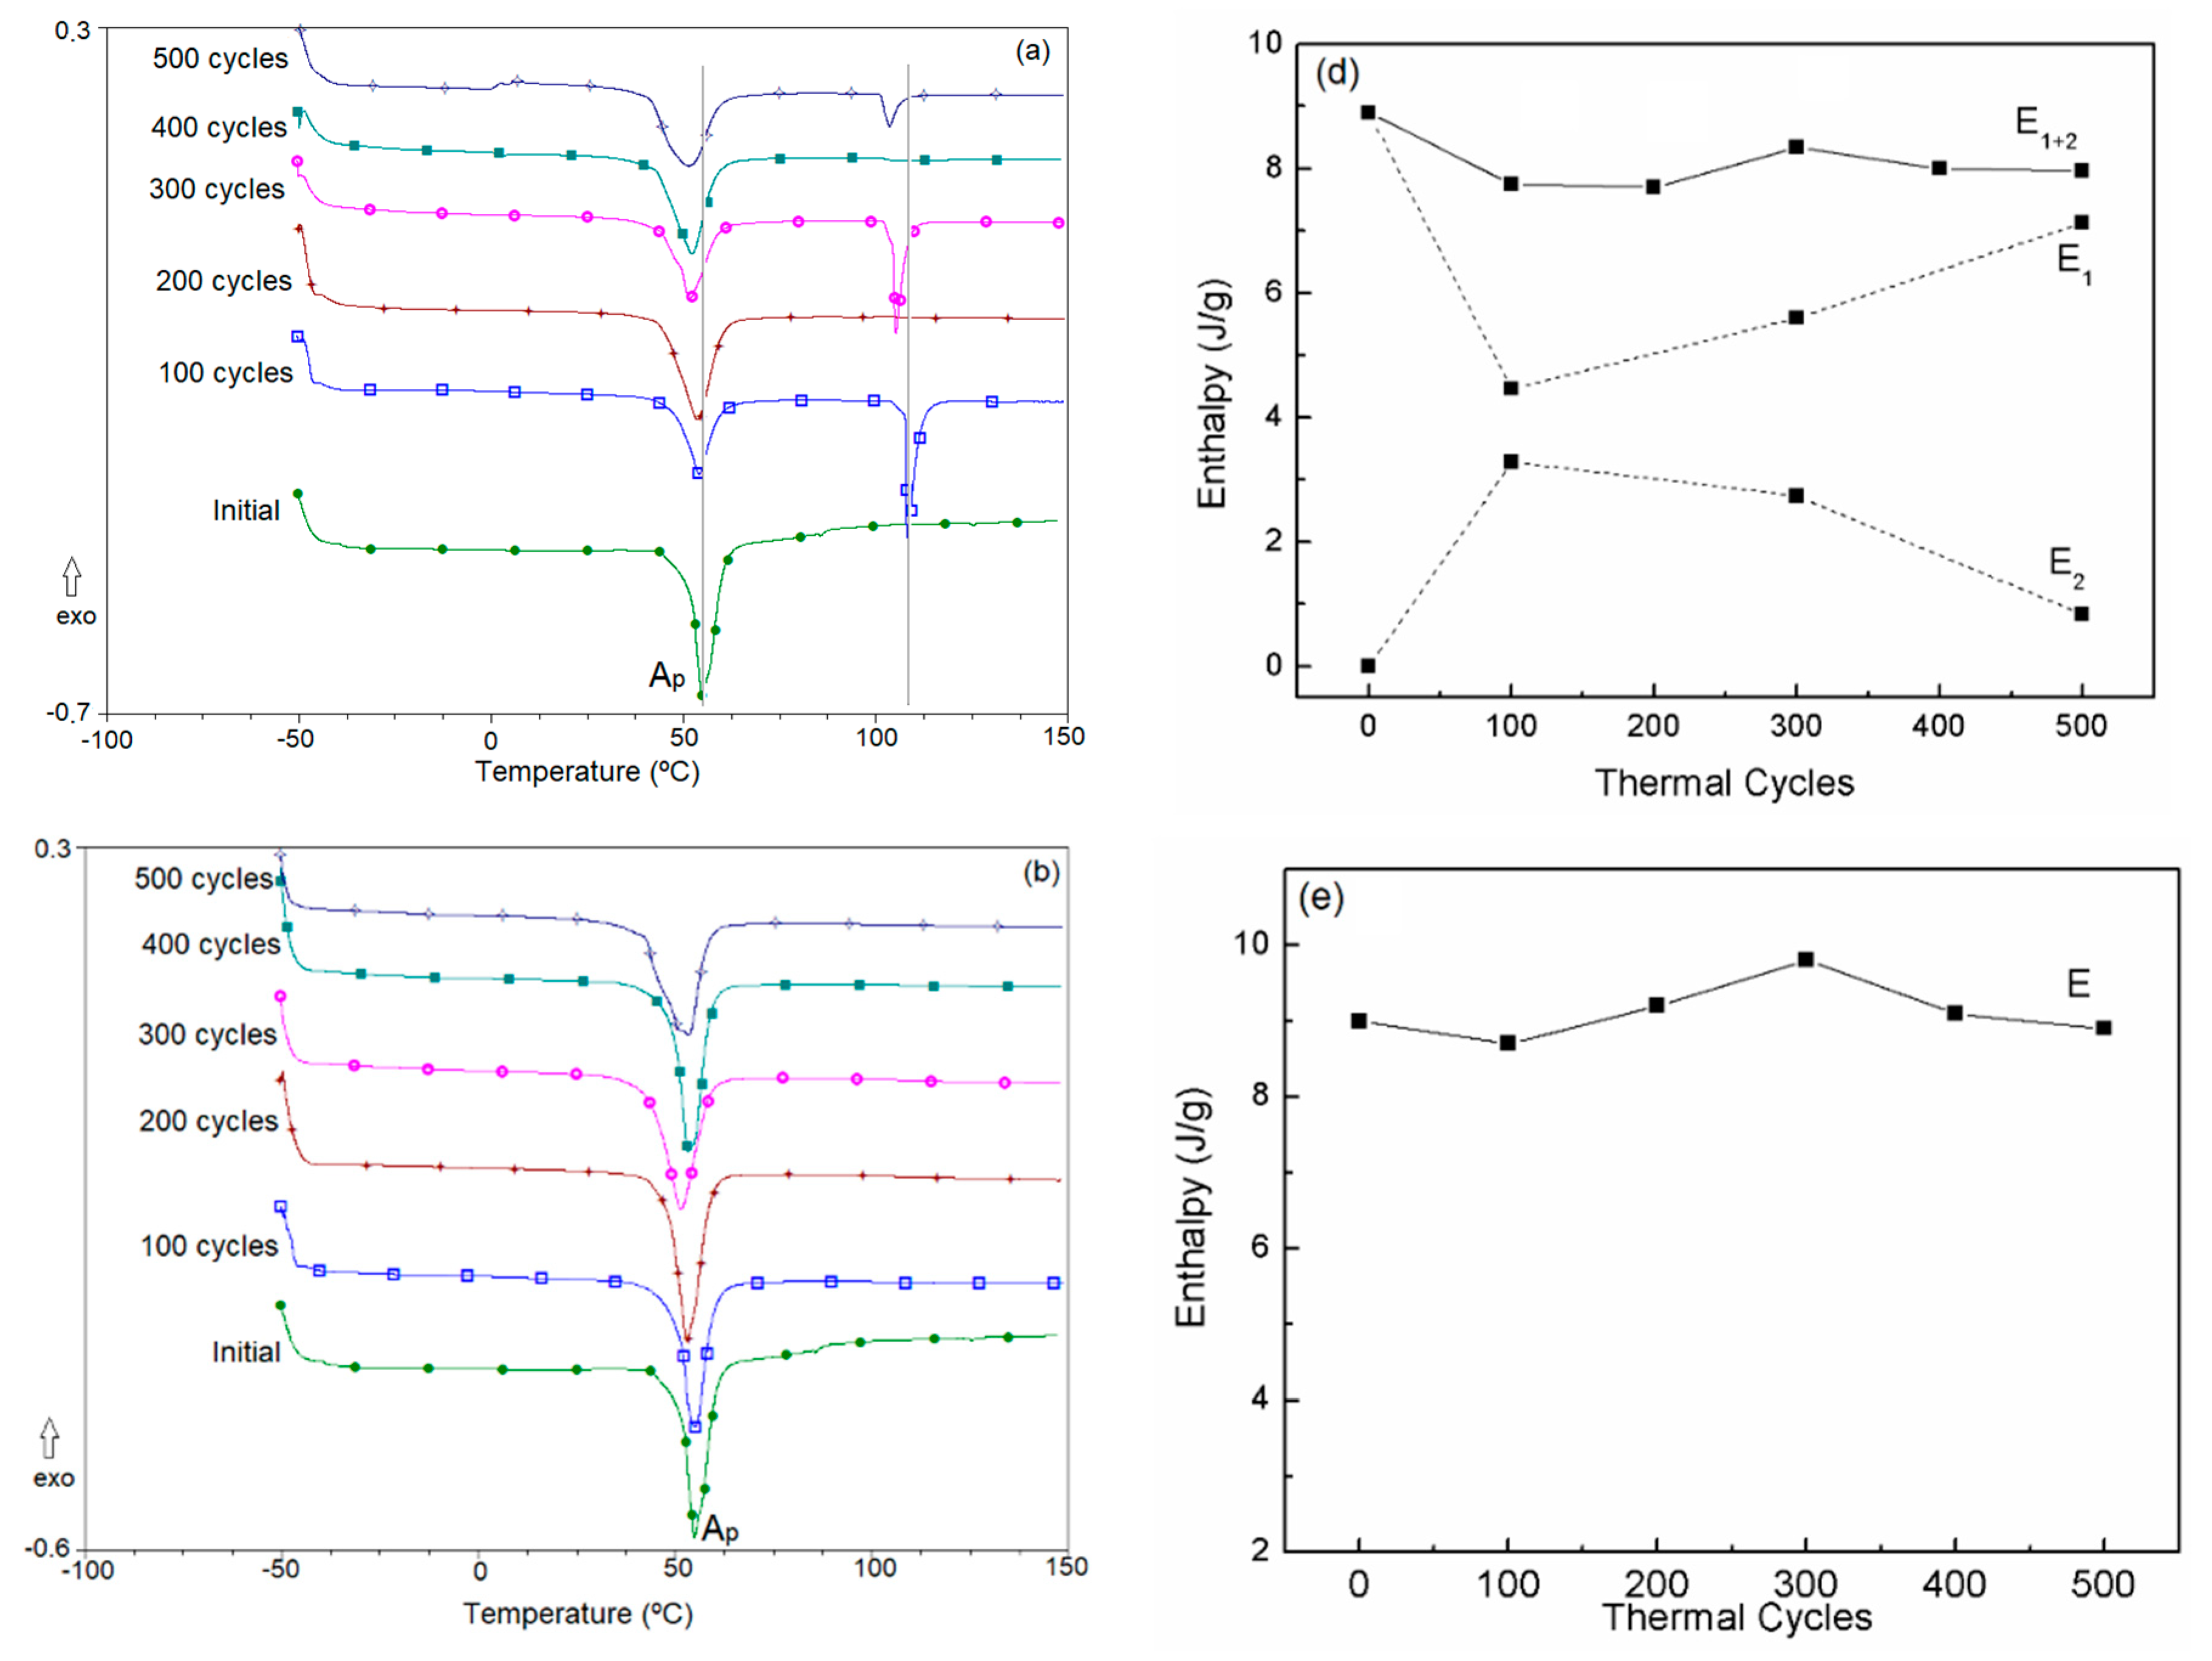
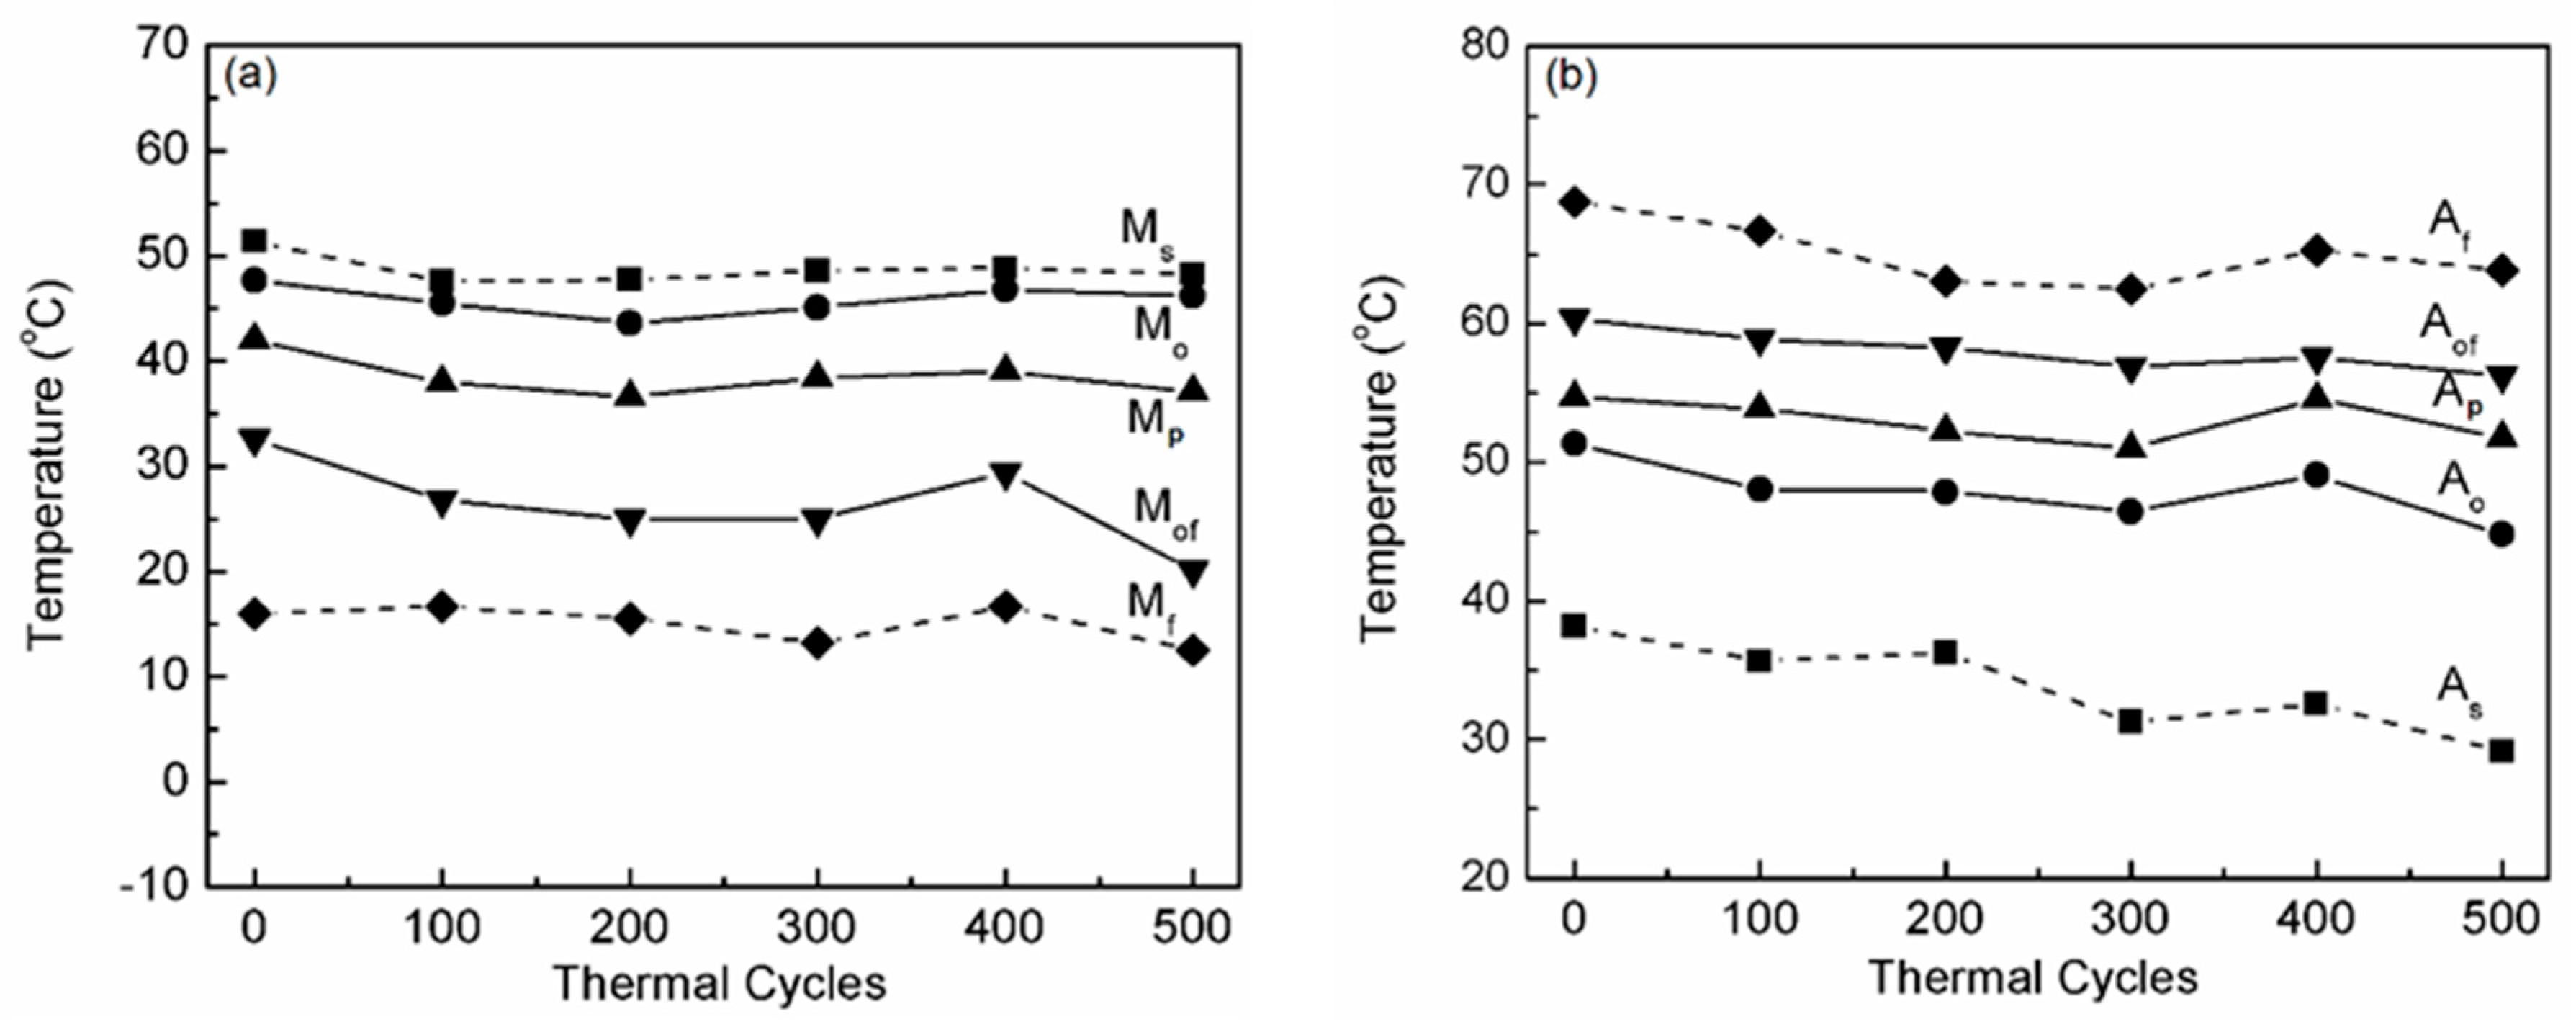
3.2. Differential Scanning Calorimetry of the Monocrystalline Cu-13.7% Al-4.2% Ni Alloy after TCT under Loads

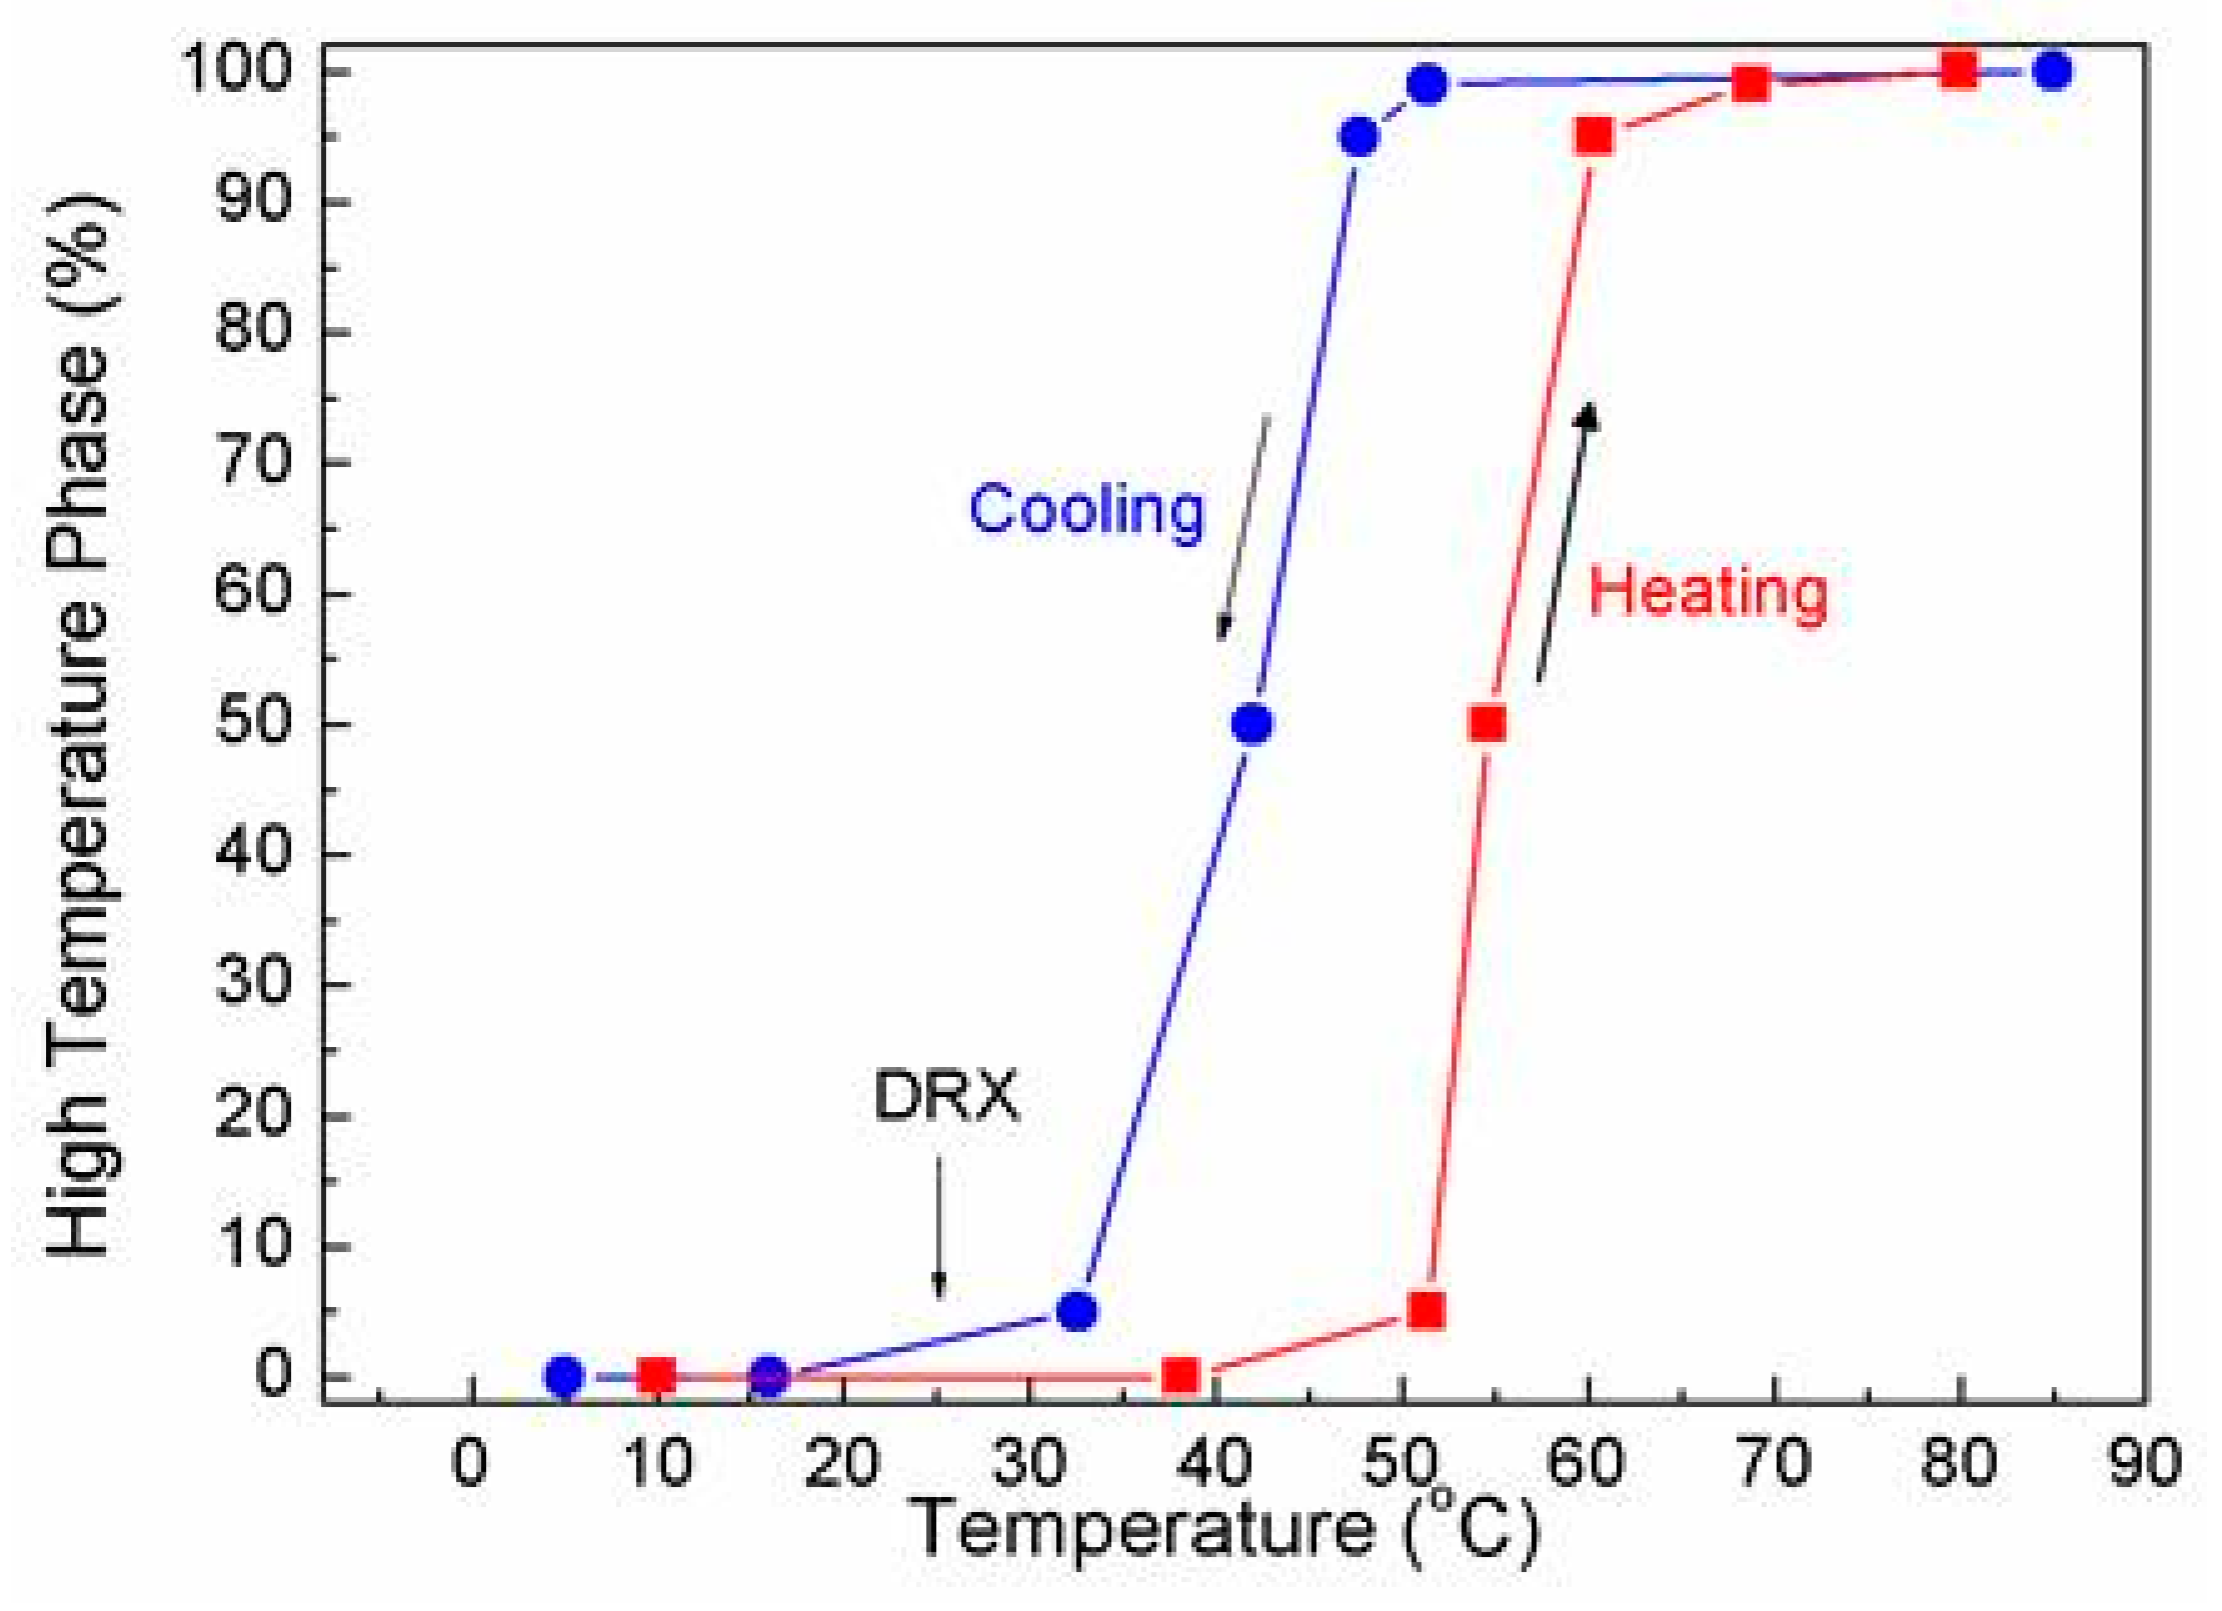
3.2.1. Reverse RMT Curves during the First Cycle of DSC Analysis

Thermal cycling-treated samples under loads were submitted to two thermal cycles in the DSC analysis. Firstly, the samples were cooled from RT. The reverse RMT curves obtained in the first DSC cycle of monocrystalline Cu-13.7% Al-4.2% Ni alloy submitted to TCT under load are shown in Figure 4. After TCT under loadings of 0.11 MPa (Figure 4a) and 0.53 MPa (Figure 4c), the reverse RMT peak was split into two. In contrast, at TCT under a load of 0.26 MPa, the reverse RMT curves of the alloy showed a single transformation peak; thus, structural imperfections accumulated during TCTs promote full RMT (Figure 4b).
This result becomes more evident when considering reverse RMT enthalpies (E) of the alloy after TCT under the loads of 0.11 (Figure 4d), 0.26 (Figure 4e), and 0.53 MPa (Figure 4f), where E1 and E2 are the enthalpy of the first and the second transformation peak, respectively; E1+2 is the sum of the enthalpies.
It is interesting to monitor the evolution of the enthalpies E1 and E2. The value of E2 tends to increase with an increase in the number of cycles up to 100 TCT (at 0.11 MPa) or up to 300 TCT (at 0.53 MPa) and decrease with a further increase in the number of TCTs under load. The value of enthalpy was entire in the case of TCTs under 0.26 MPa (Figure 4e). The total enthalpy of the reverse transformation, in all tests, varied only slightly with the number of cycles.
An increase in the critical temperature range of complete transformation (β′1 + γ′1) → β1 correlate with the accumulation of lattice distortions during TMR/TCT, possible structural imperfections, its decrease with “training”, and the predominant orientation of martensitic lamellas. Apparently, the load at 0.11 MPa was not large enough for “training” work, while the load at 0.53 MPa promoted the lattice distortions and the accumulation of its imperfections and complicated the implementation of TMR for the bulk material in the temperature range adopted in the TCT. In other words, under 0.11 MPa and 0.53 MPa, the TCT was realized in conditions of incomplete RMT cycles.
In these tests, a load at 0.26 MPa seemed to be sufficient to give rise to the reversible martensitic transformations during heating and cooling thus facilitating the “training” of the alloy during cyclic tests and maintaining a narrow range of TMR and did not stimulate the accumulation of defects in the alloy structure.

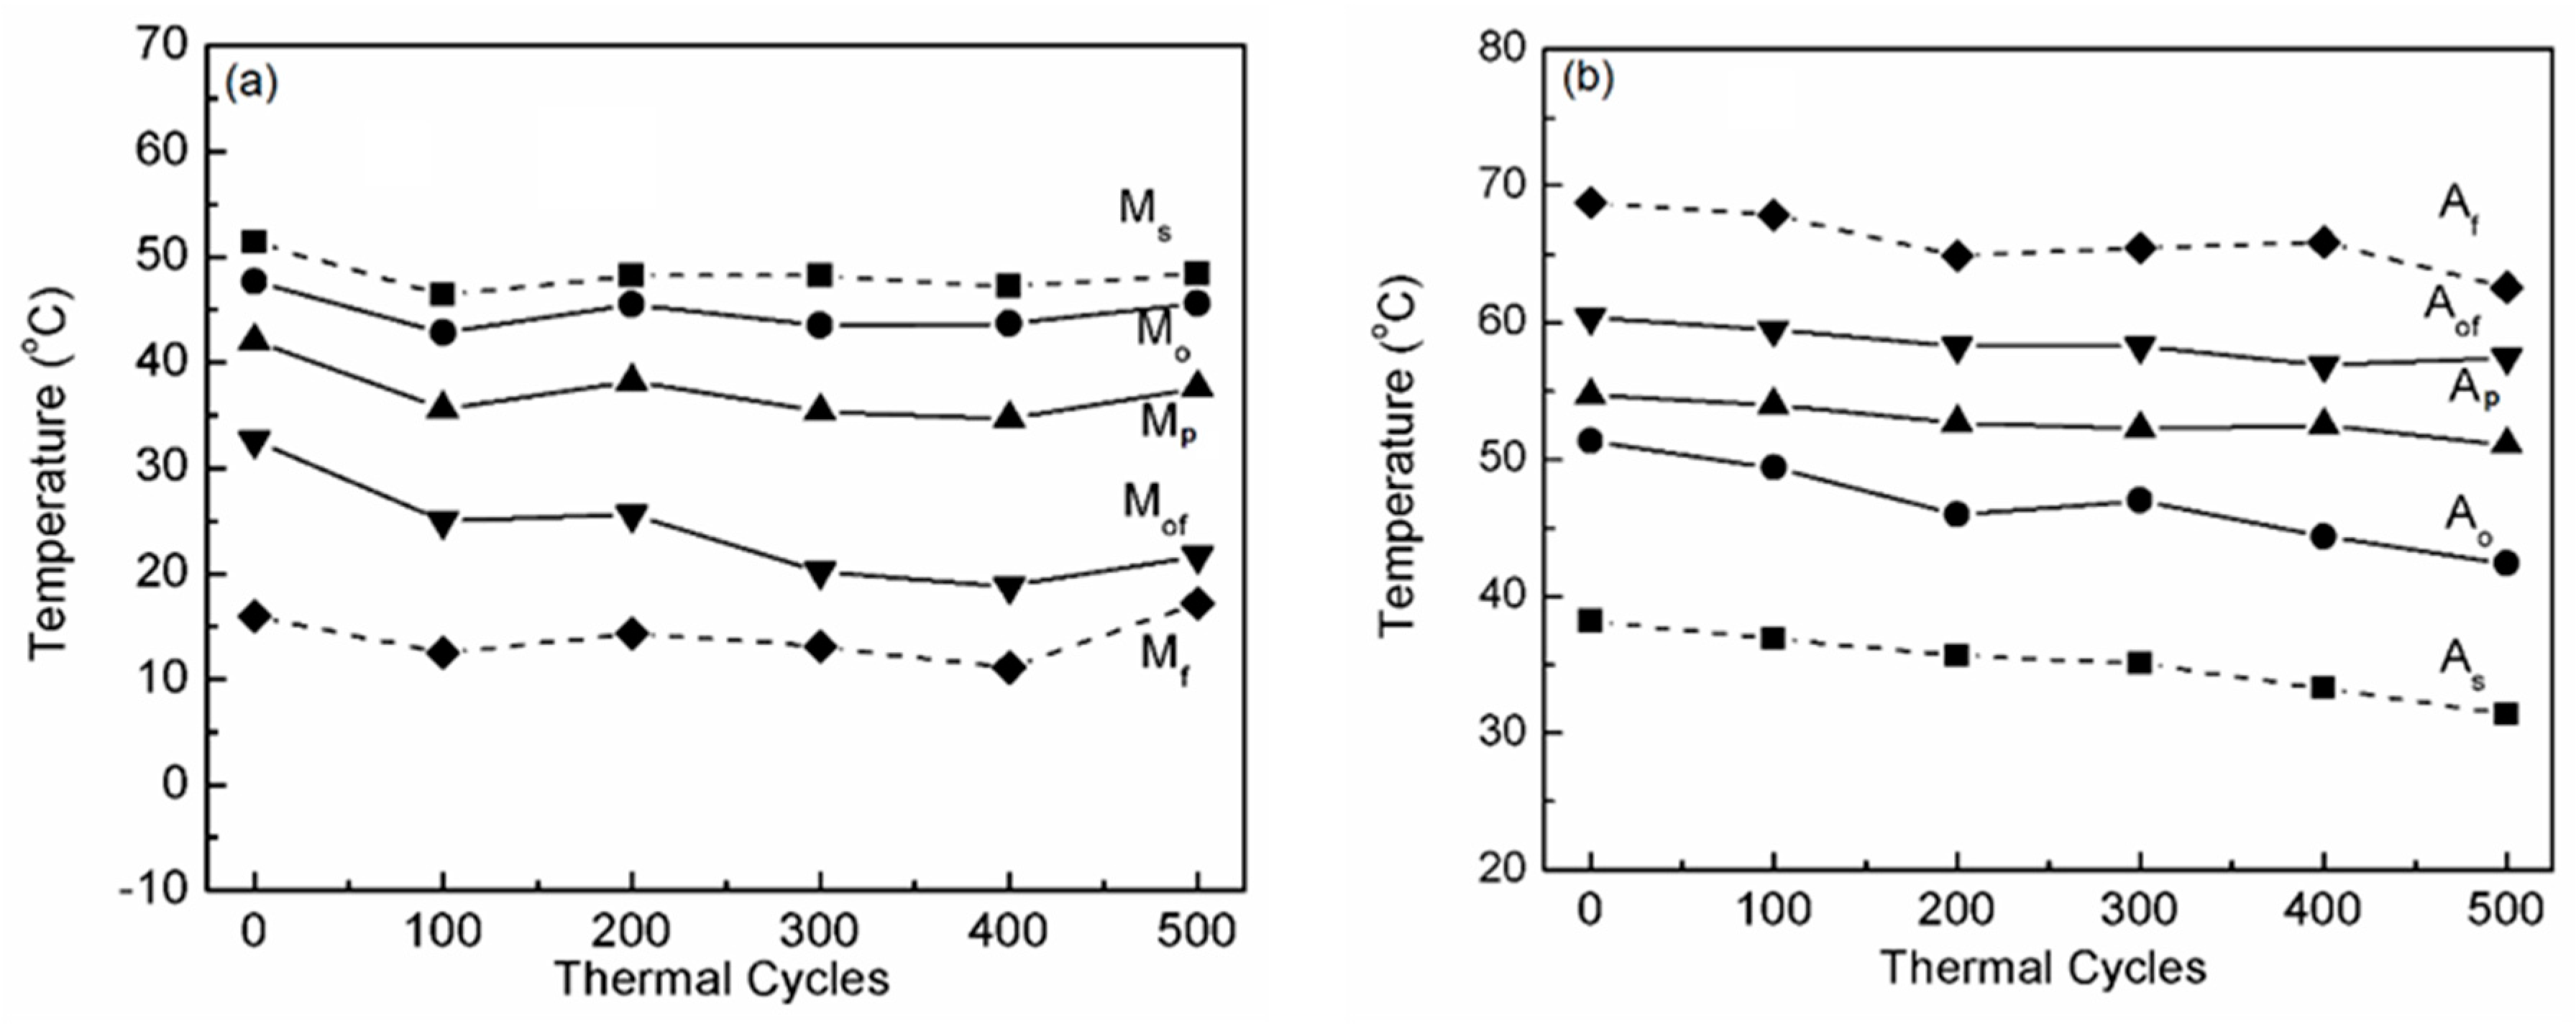
3.2.2. Direct and Reverse RMT of the Monocrystalline Cu-13.7% Al-4.2% Ni Alloy Curves after TCT under Loads

The DSC analysis of the alloy in the initial state showed that on heating, the reverse RMT β′1 → β1 occurred in the range of +38.2 °C (As) to +68.8 °C (Af) through an endothermic process: phase transformation enthalpy ~9 J/g. The process developed from an on-set temperature of +51.4 °C (Ao) and was responsible for the peak at +54.7 °C (Ap), where the heat flux was maximum. The process ended in an “off-set” mode at +60.4 °C (Aof). On cooling, the direct RMT, β1 → β′1, occurred in the temperature range of +51.4 °C (Ms) to 16.0 °C (Mf), having an on-set, peak and off-set temperatures at +47.7 °C (Mo), +42 °C (Mp), and +32.6 °C (Mof), respectively, associated with the exothermic process with a transformation enthalpy of 8.8 J/g (Figure 2).
The effect of TCTs under the loads of 0.11, 0.26, and 0.53 MPa on the RMT characteristics of the monocrystalline Cu-13.7% Al-4.2% Ni alloy as determined by DSC analysis during cooling and 2nd heating without load and manifested in the displacement of critical temperatures and intervals is shown in Figure 5, Figure 6 and Figure 7.
After TCTs under the load of 0.11 MPa, the critical temperatures of intensive RMT, mainly Mof and Ao, moved slightly to lower values, thus justifying the increase in the intensive RMT intervals. The intensive direct RMT ranges, Mo-Mp and Mo-Mof, increased from 5.7 and 15.1 °C (in the first cycle without loading) to 8.1 and 23.3 °C (300 TCTs) and remained almost constant at 8 and 23.9 °C (500 TCTs). The intensive intervals of reverse RMT, Ao-Ap and Ao-Aof, during the first thermal cycle, determined as 3.3 and 9 °C, increased to 8.7 and 15.1 °C, respectively, when it came to 500 TCTs (Figure 5).
After TCTs under the load of 0.26 MPa, the critical temperatures of intensive RMTs shifted slightly to lower values, up to 300 TCTs; then, the intensive temperatures remained constant and/or increased in value. The intensive direct RMT ranges, Mo-Mp and Mo-Mof, increased from 5.7 and 15.1 °C (in the first cycle without loading) to 9.1 and 26.1 °C (500 TCTs). The intensive intervals of reverse RMT, Ao-Ap and Ao-Aof, during the first thermal cycle were determined as 3.3 and 9 °C and increased to 7 and 11.5 °C (500 TCTs) (Figure 6).
After TCTs under a load of 0.53 MPa, the critical temperatures of intensive direct RMT, Mp and Mof, moved slightly to lower values, up to 400 TCTs, and remained the same. The intensive direct RMT intervals, Mo-Mp and Mo-Mof, increased from 5.7 and 15.1 °C (the first cycle without loading) to 8.4 and 29.7 °C after 500 TCTs. The critical temperatures of intensive reverse RMT, Ao, Ap, and Aof, moved slightly to lower values, up to 300 cycles, and tended to increase afterward. The intensive ranges of reverse RMT, Ao-Ap and Ao-Aof, during the first thermal cycle were determined as 3.3 and 9 °C, then decreased to 2.7 and 8.6 °C after 300 cycles, and finally increased to 11.7 and 17.5 °C with 500 cycles TCT (Figure 7).
The difference among the peak critical temperatures (ΔT = Ap − Mp), as a measure of the thermal hysteresis amplitude, was determined as approximately 12.7 °C in the first thermal cycle of the investigated alloy. The changes in peak temperatures, Ap and Mp, after TCT under load, alter the magnitude of the thermal hysteresis as observed in Figure 8.

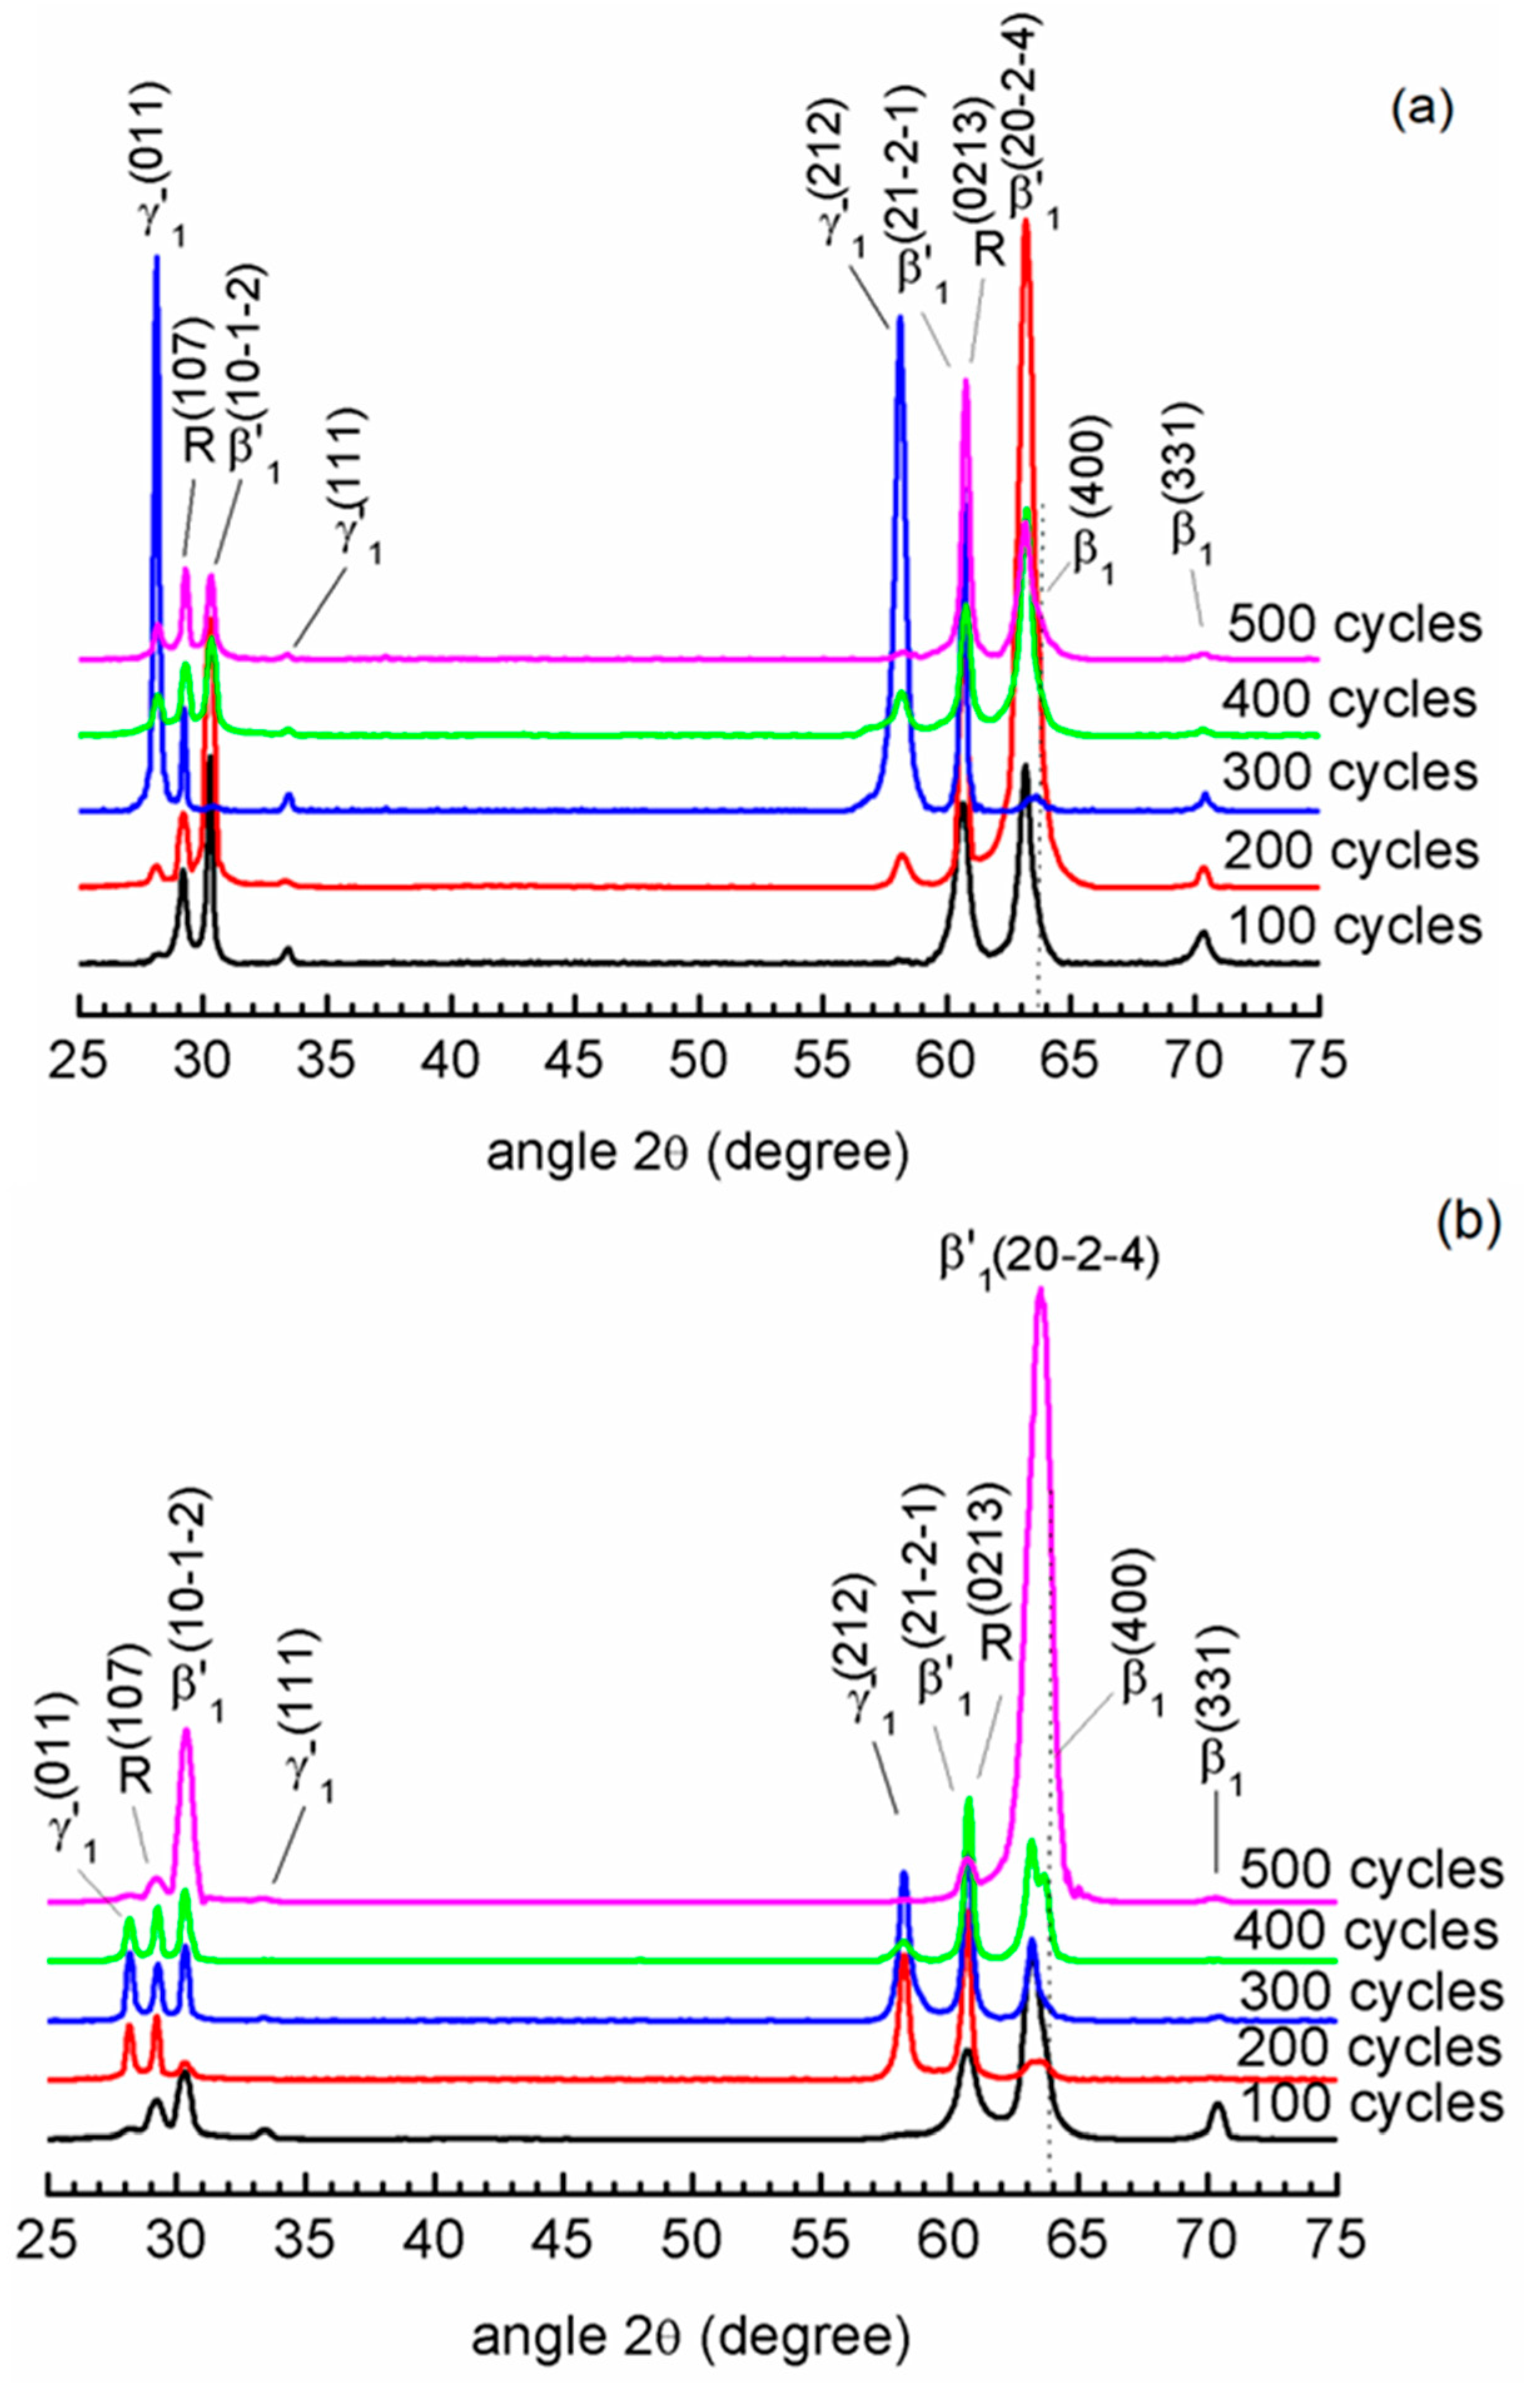
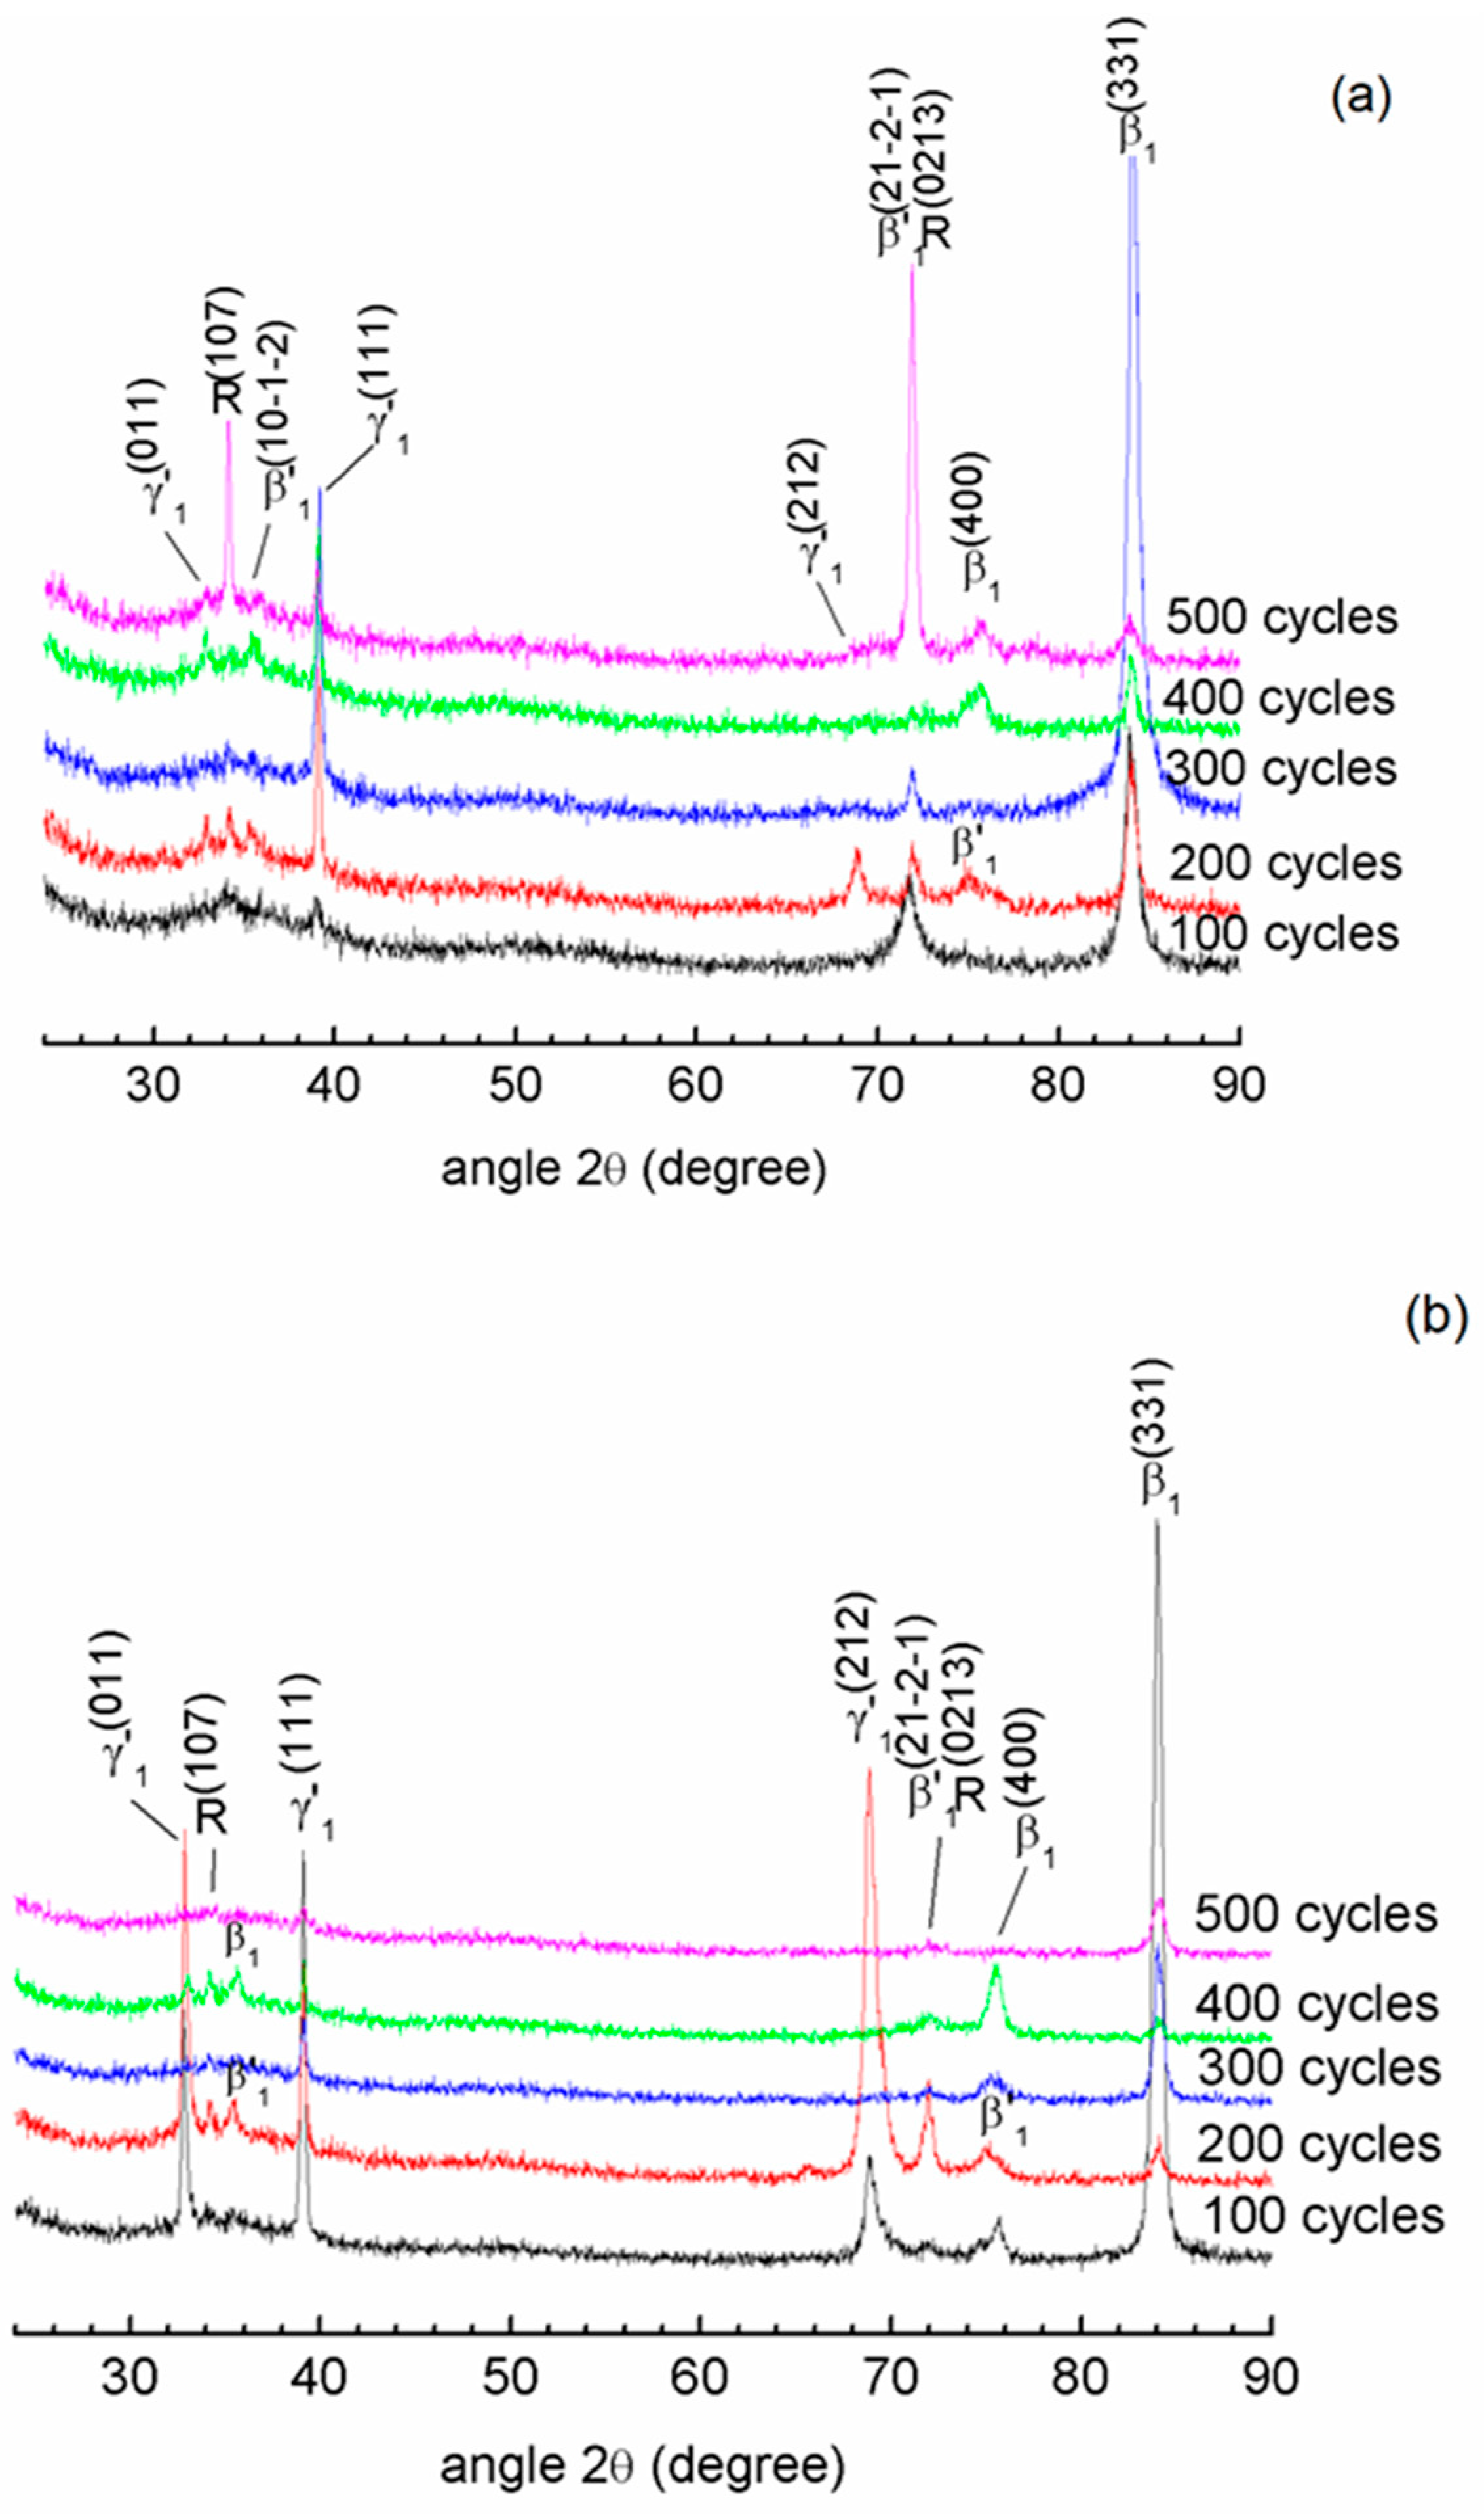
3.3. XRD Analysis of the Monocrystalline Cu-13.7% Al-4.2% Ni Alloy after TCT under Load

3.3.1. XRD Analysis after TCT under Loading of 0.11 MPa Ending with the ½ Cooling Cycle

The Cu-13.7% Al-4.2% Ni alloy diffractograms after TCT, terminated with the ½ cooling cycle (under load) and the ½ heating cycle (without the load), are shown in Figure 9a,b. As can be seen, the phase compositions of these alloys differ significantly.
The diffractogram of Cu-13.7% Al-4.2% Ni alloy after TCTs under the load of 0.11 MPa finished with the ½ cooling cycle exhibited four metastable phases (Figure 9a). The major phase was martensite β′1, an ordered AlCu3-type phase [31], peaks β′1 and β′1. The other martensitic phase γ′1, ordered Cu3Ti-type phase [1,3,15] was identified with the peaks (011)γ′1, (212)γ′1, and (111)γ′1. The high temperature phase β1, ordered BiF3-type phase [14] was detected by its (331)β1 peak. The Al7Cu4Ni phase with rhombohedral structure [16,17], called the R-phase in our works [18,19,20,21,22], is represented by the (107)R peak as well as the peak corresponding to the plane of coherence between the phases β′1 and R, β′1|(0213)R.
With the accumulation of 100 cycles, the major phase, martensite β′1, was identified by intense β′1 and β′1 peaks; the moderate (107)R peak corresponded to the R-phase. A peak related to the plane of coherence between the martensitic β′1 phase and R, β′1|(0213)R was detected. The other peaks, (011)γ′1, (111)γ′1, (212)γ′1 and (331)β1, had low intensity.
With the accumulation of 200 thermal cycles, the diffractogram shows minor changes in structure, reducing only the intensity of the coherence planes peak β′1|(0213)R and the R-phase peak (107)R. The martensitic β′1 phase was still observed, indicating its temperature/thermal stability. After 300 TCTs, the accumulated distortions promoted changes in the martensitic structure, and the induced martensitic transformation β′1 → γ′1 was observed. This TCT treatment promotes the greater stability of the martensitic phase γ′1, determined by (011)γ′1 and (212)γ′1 peaks. The plane of coherence between the martensitic phases β′1 and R, β′1|(0213)R, display moderate intensity.
The treatment of 400 TCTs once again results in major participation of martensite phase β′1 determined through the β′1 - peaks. After 500 TCTs the XRD patterns reveal intense coherent planes β′1|(0213)R peak, as well as β′1 and β′1 peaks, corresponding to martensitic β′1. The (107)R peak, referring to phase R, has moderate intensity. The other peaks, (011)γ′1, (111)γ′1, (212)γ′1 and (331)β1, have low intensity.

3.3.2. XRD Analysis after TCT under Loading of 0.11 MPa Ending with ½ Heating Cycle

With the accumulation of 100 cycles, the major phase is martensitic β′1, represented by (10-1-2)β′1 and (20-2-4)β′1 peaks. The peaks of coherent plane, β′1|(0213)R, of the R-phase, (107)R, and of the high temperature phase β1, (331)β1, display moderate intensity. The martensitic phase γ′1 is detected by its low intensity peaks (011)γ′1, (111)γ′1, and (212)γ′1, Figure 9b.
With the accumulation of 200 TCTs, the amount of martensite β′1 decreased and martensite γ′1 increased, exhibiting (011)γ′1 and (212)γ′1 peaks. The peak of the coherent plane β′1|(0213)R was intensive, whereas the R-phase peak, (107)R, exhibited moderate intensity.
After 300 TCTs, the XRD pattern changed slightly, displaying higher participation of the martensitic β′1 phase, and the (10-1-2)β′1 and (20-2-4)β′1 peaks reappeared.
After 200 and 300 TCTs, the induced martensitic transformation β′1 → γ′1 was incomplete (Figure 9b). The energy difference among these martensitic structures was negligible, and the sliding along of the atomic layers could be implemented. Thus, the transformation from one close-packed structure to the other was easily performed, mostly during thermal cycling [3,30].
The 400 TCTs induced considerable participation of the coherent plane β′1|(0213)R and of the martensitic β′1 (10-1-2)β′1 and (20-2-4)β′1 peaks. Reorientation of the high-temperature phase β1 was revealed by an intensive (400)β1 peak. The peaks associated with the γ′1 and R-phases, (011)γ′1, (212)γ′1, and (107)R were less intensive.
After 500 TCTs, the XRD pattern displayed a higher amount of the martensitic β′1 phase, represented by (10-1-2)β′1 and (20-2-4)β′1 peaks, a characteristic peak of the R-phase, (107)R, but small participation of the coherent plane β′1|(0213)R.

3.3.3. XRD Analysis after TCT under Loading of 0.26 MPa Ending with ½ Cooling Cycle

Figure 10a shows XRD patterns of Cu-13.7% Al-4.2% Ni alloy after TCTs under the load of 0.26 MPa ending with the ½ cooling cycle (under load). After 100 TCTs, the pattern exhibited a major peak corresponding to the β1 phase, (331)β1; the peak corresponding to the coherent planes β′1 with R, β′1/(0213)R, was detected with moderate intensity, while peaks of the martensitic γ′1, (111)γ′1, and of the R-phase, (107)R, had lower intensity.
With the accumulation of 200 TCTs, considerable participation by the martensite γ′1, (111)γ′1, (011)γ′1, and (212)γ′1 peaks and of the high-temperature phase β1, (331)β1 peak, was observed. The β′1 martensite, with the less intensive (10-1-2)β′1 and (20-2-4)β′1 peaks, as well as the R-phase, (107)R, and the coherent plane, β′1|(0213)R, were also detected. After 300 TCTs, the high-temperature β1 phase displayed an intensive (331)β1 peak. The martensite γ′1 was detected by a moderate intensity (111)γ′1 peak, while the peak corresponding to the coherent plane between the phases β′1 and R, β′1|(0213)R, had lower intensity.
With the accumulation of 400 TCTs, the XRD pattern indicated greater participation by the martensite γ′1 and high-temperature β1 phase as represented by (111)γ′1, (011)γ′1, (200)β1, (400)β1, and (331)β1 peaks. The R-phase peak, (107)R, had a small intensity. After 500 TCTs, the XRD pattern revealed the R-phase, as a major phase, represented by intensive (107)R and β′1|(0213)R peaks. The other (011)γ′1, (018)R, (111)γ′1, (400)β1, and (331)β1 peaks had lower intensity.

3.3.4. XRD Analysis after TCT under Loading of 0.26 MPa Ending with ½ Heating Cycle

The Cu-13.7% Al-4.2% Ni alloy XRD patterns after TCTs under 0.26 MPa load finished with the ½ heating cycle are shown in Figure 10b. With the accumulation of 100 cycles, high-temperature phase β1 displayed (331)β1 and (400)β1 peaks, and the martensitic γ’1 phase was detected by its (011)γ′1, (111)γ′1, and (212)γ′1 peaks.
The accumulation of 200 TCTs favored the greater participation by martensite γ′1, detected by (111)γ′1, (011)γ′1, and (212)γ′1 peaks. The other phases displayed (107)R, (10-1-2)β′1, (20-2-4)β′1 β′1|(0213)R, and (331)β1 peaks with lower intensity. After 300 TCTs, the considerable participation of the high-temperature β1 phase revealed by (331)β1 and (400)β1 peaks were observed. The martensite γ′1 was detected by its moderate intensity peak, (111)γ′1, while the phase R peaks, (107)R, and the coherent plane between the phases β′1|R, β′1|(0213)R, showed low intensity.
Accumulation of 400 TCTs resulted in the greater participation by the high-temperature phase β1 as represented by (200)β1, (400)β1, and (331)β1 peaks. The martensite γ′1 displayed moderate intensity (011)γ′1 and (111)γ′1 peaks. The phase R peak, (107)R, and the plane of coherence between phases β′1|R, β′1|(0213)R, were revealed by lower intensity.
After 500 TCTs, the XRD pattern indicated the high-temperature phase β1 as a major phase, identified with (331)β1 peak. Low-intensity (107)R, (111)γ′1, and β′1|(0213)R peaks corresponded to minor phases.

3.3.5. XRD Analysis after TCT under Loading of 0.53 MPa Ending with ½ Cooling Cycle

Cu-13.7% Al-4.2% Ni alloy diffractograms after TCT under the load of 0.53 MPa finished with the ½ cooling cycle are shown in Figure 11a. With the accumulation of 100 TCTs, the prominent participation of the martensite β′1 was represented by high (10-1-2)β′1 and (20-2-4)β′1 peaks as well as by the coherent plane β′1|(0213)R between β’1 and R-phases and the (107)R peak of the R-phase. The (011)γ′1, (111)γ′1, and (212)γ′1 peaks of martensite γ′1 and the (331)β1 peak of the high-temperature β1 phase showed moderate intensity, representing smaller participation by these phases. With the accumulation of 200 TCTs, the coherent plane β′1|(0213)R peak became higher, displaying the greater participation of β’1|R. The participation of the martensitic γ′1 and β′1 phases, as well as R-phase, were detected by the moderate intensity peaks: (011)γ′1, (111)γ′1, (212)γ′1, (10-1-2)β′1, (20-2-4)β′1, and (107)R. The (331)β1 peak of the high-temperature β1 phase had the lowest intensity.
The 300 cycle TCTs promoted greater stability of the martensite γ′1 identified by its (011)γ′1 and (212)γ′1 peaks. The coherent plane β′1|(0213)R peak between the martensitic phases β′1 and R, and (331)β1 peak of the high-temperature phase β1 were detected with moderate intensity. The (10-1-2)β′1, (20-2-4)β′1, and (107)R peaks were revealed with low intensity. After 400 cycles, the amount of martensitic β′1 phase increased, exhibiting intensive peaks (10-1-2)β′1 and (20-2-4)β′1. The coherent plane β′1|(0213)R peak between the martensitic β′1 and R-phases, (331)β1 peak of the high-temperature β1 phase, and the (107)R peak of R-phase were detected with moderate intensity. Martensite γ′1 was detected in a small amount.
After 500 TCTs, the XRD pattern exhibited the prominent participation of the martensitic β′1 phase by its (10-1-2)β′1 and (20-2-4)β′1 peaks while decreasing all other peaks related to γ′1, R, and β′1|R-phases.

3.3.6. XRD Analysis after TCT under Loading of 0.53 MPa Ending with ½ Heating Cycle

The Cu-13.7% Al-4.2% Ni alloy diffractograms after TCTs finished with the ½ heating cycle are shown in Figure 11b. After 100 cycles, major participation by the martensitic γ′1 phase, identified by intensive (011)γ′1, (111)γ′1, (212)γ′1 peaks was observed. The R, β′1, β′1|R, and β1 phases were detected by moderate intensity (107)R, (10-1-2)β′1, (20-2-4)β′1, β′1|(0213)R, and (331)β1 peaks. With the accumulation of 200 TCTs, the amount of γ′1 martensite decreased while the participation of the coherent plane between the martensitic β′1 and R-phases, β′1|(0213)R, increased. Associated with the R-phase, the (107)R peak was detected with moderate intensity. There was an insignificant amount of the other aforementioned phases.
After 200 cycles, the martensite β′1 stabilized, its peaks(10-1-2)β′1 and (20-2-4)β′1 shifted slightly, thus developing a strong coherence with the high-temperature phase β1, represented by (200)β1 and (400)β1 peaks. After 400 TCTs, the R, γ′1, and β1 phases were detected in smaller amounts.

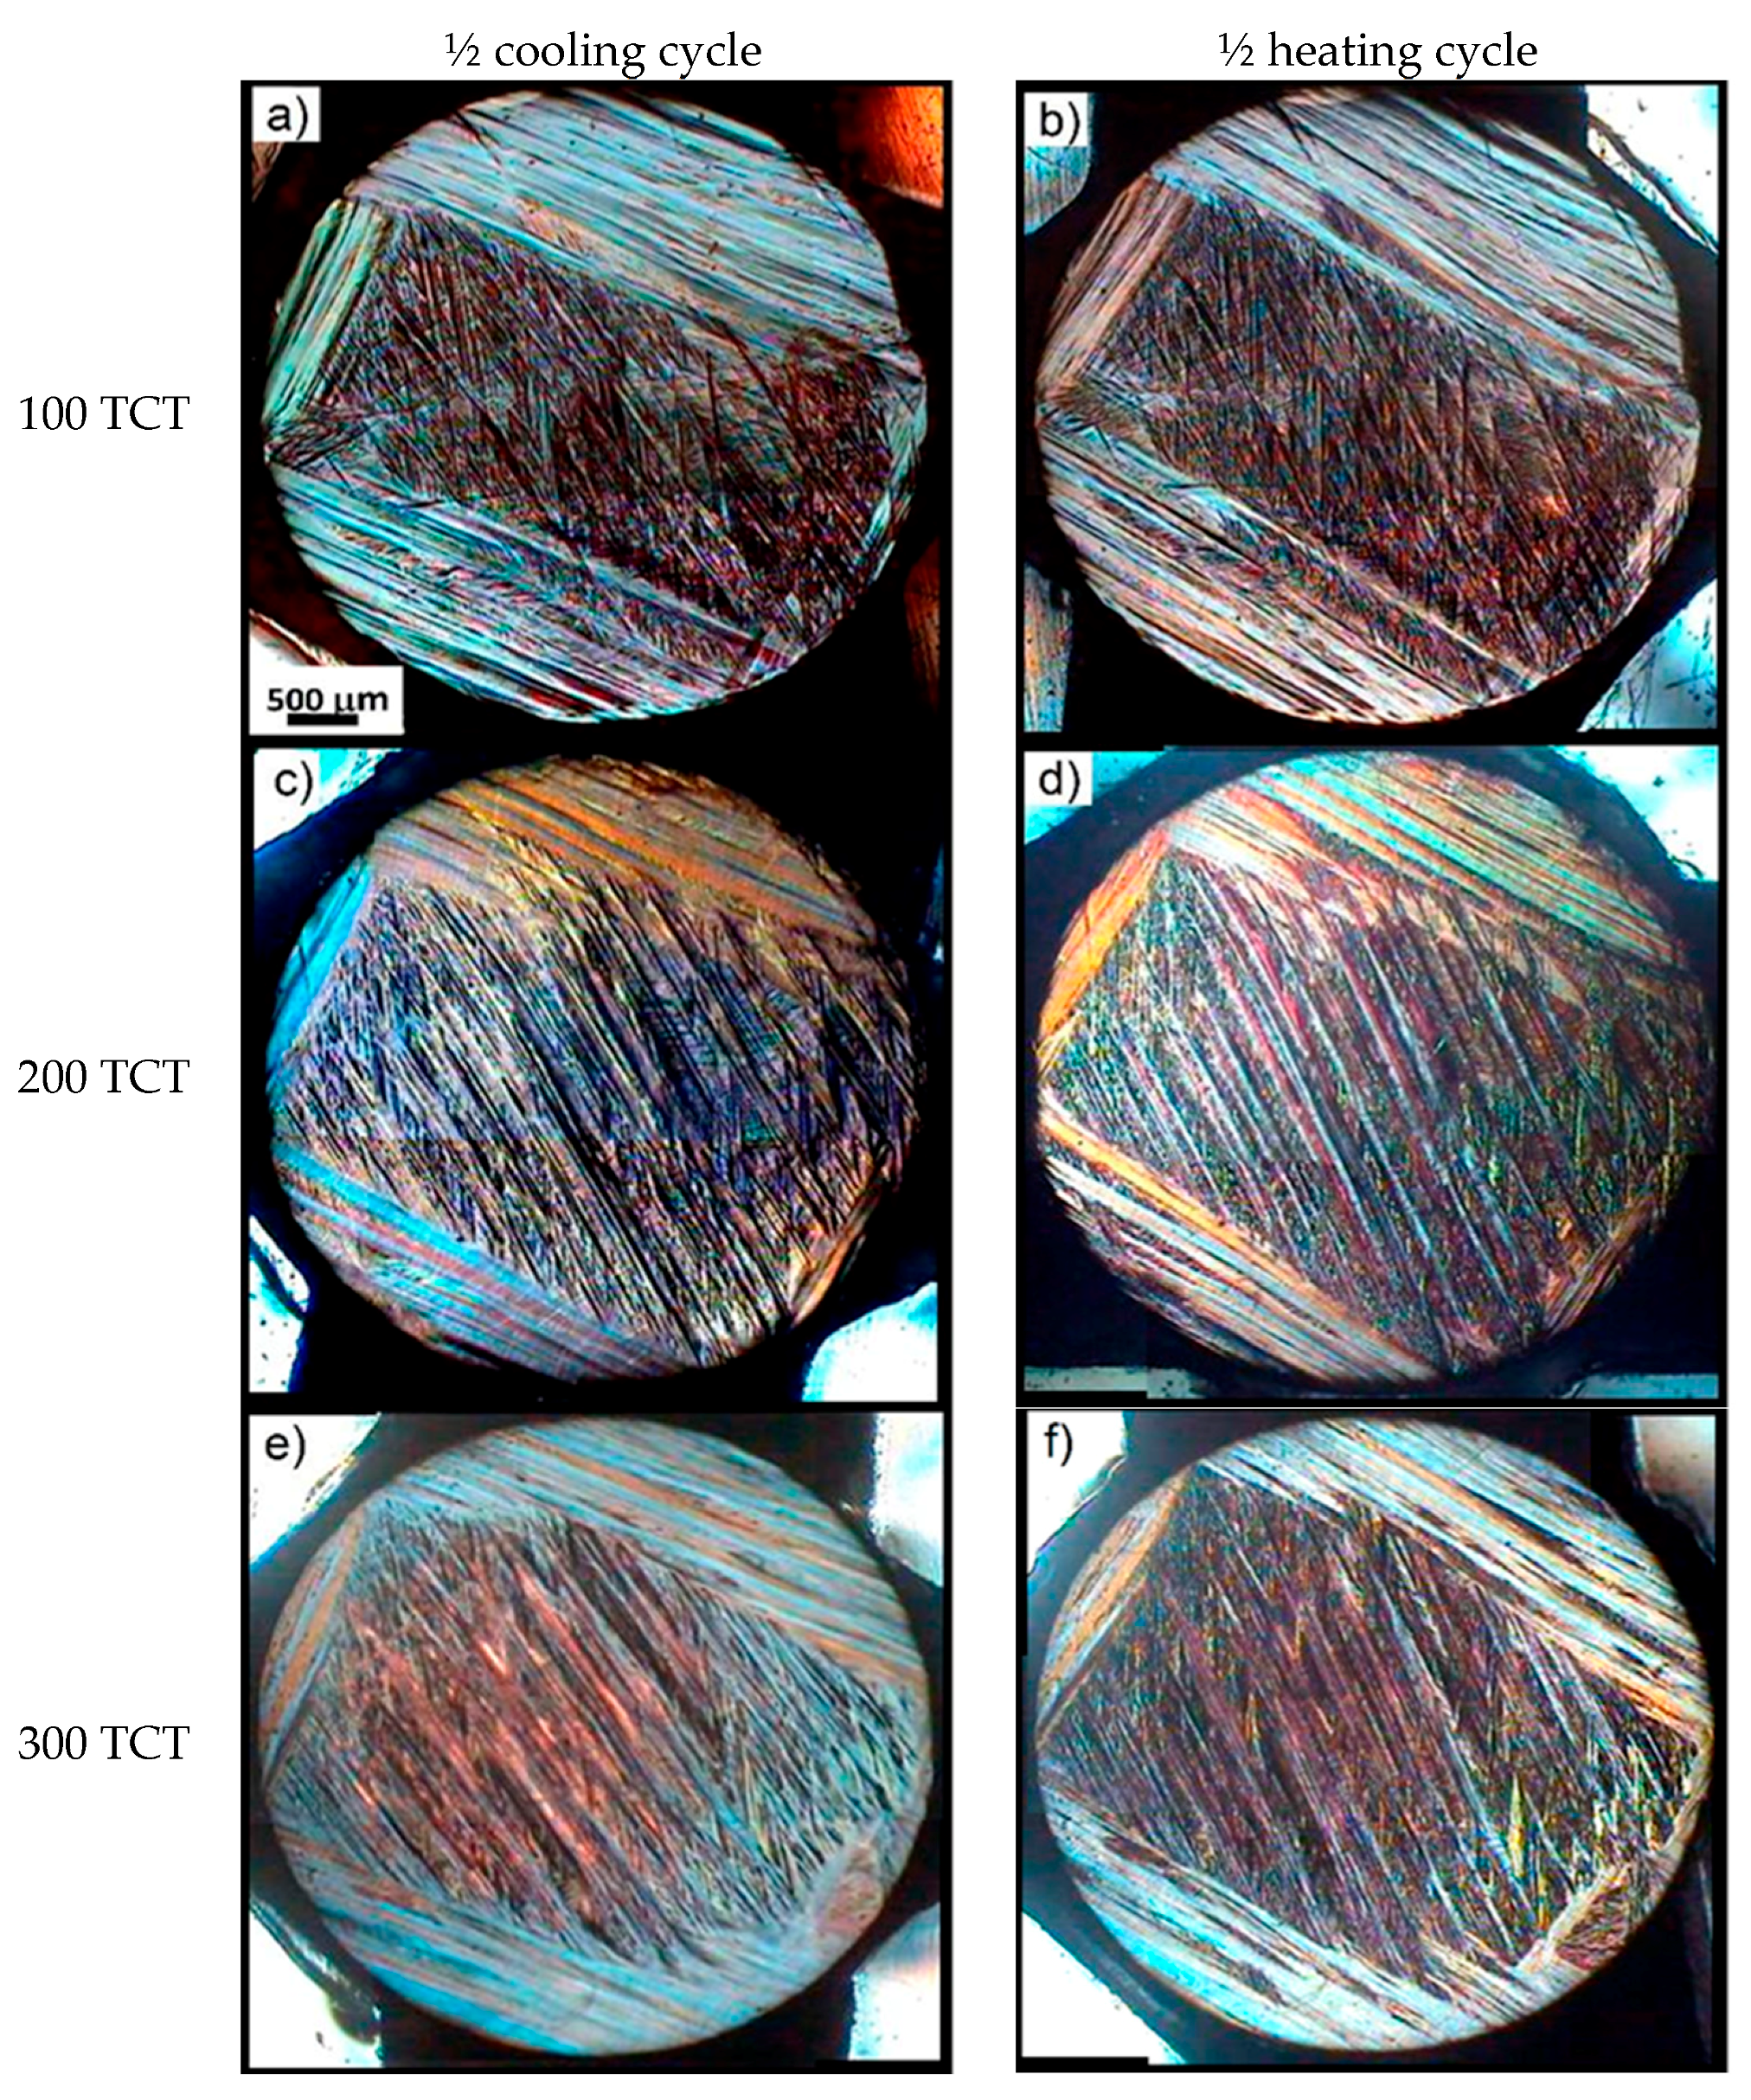
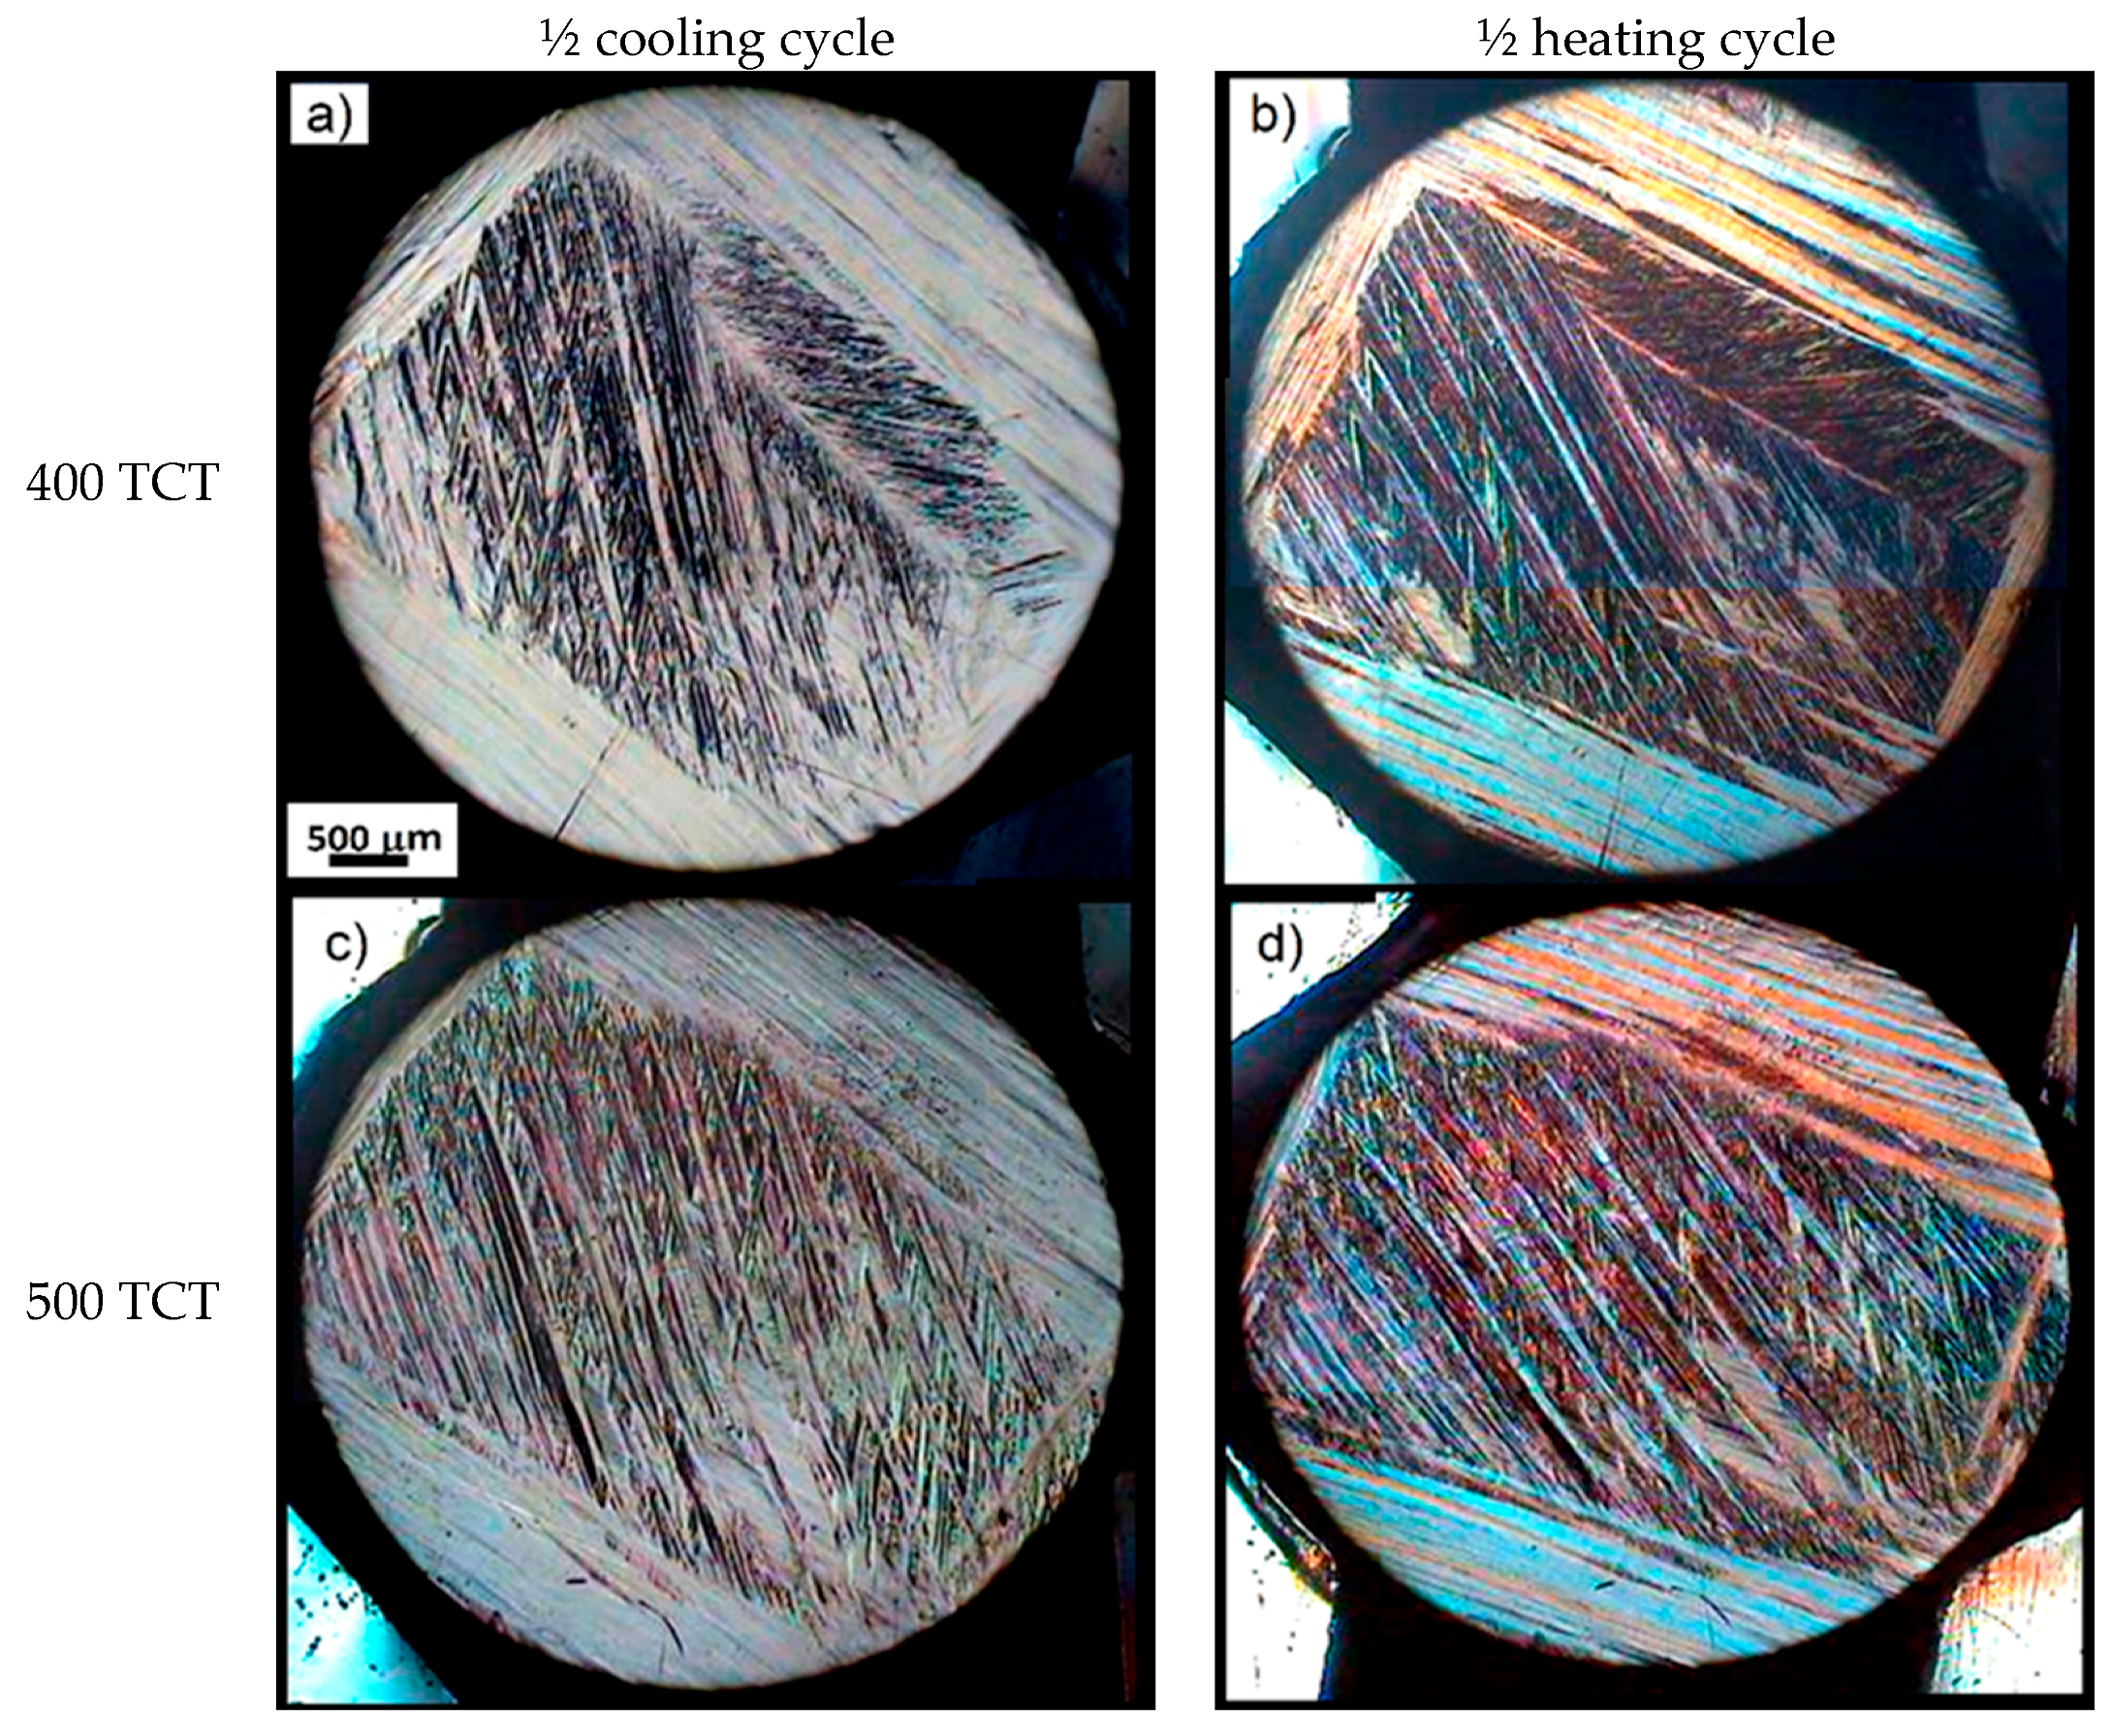
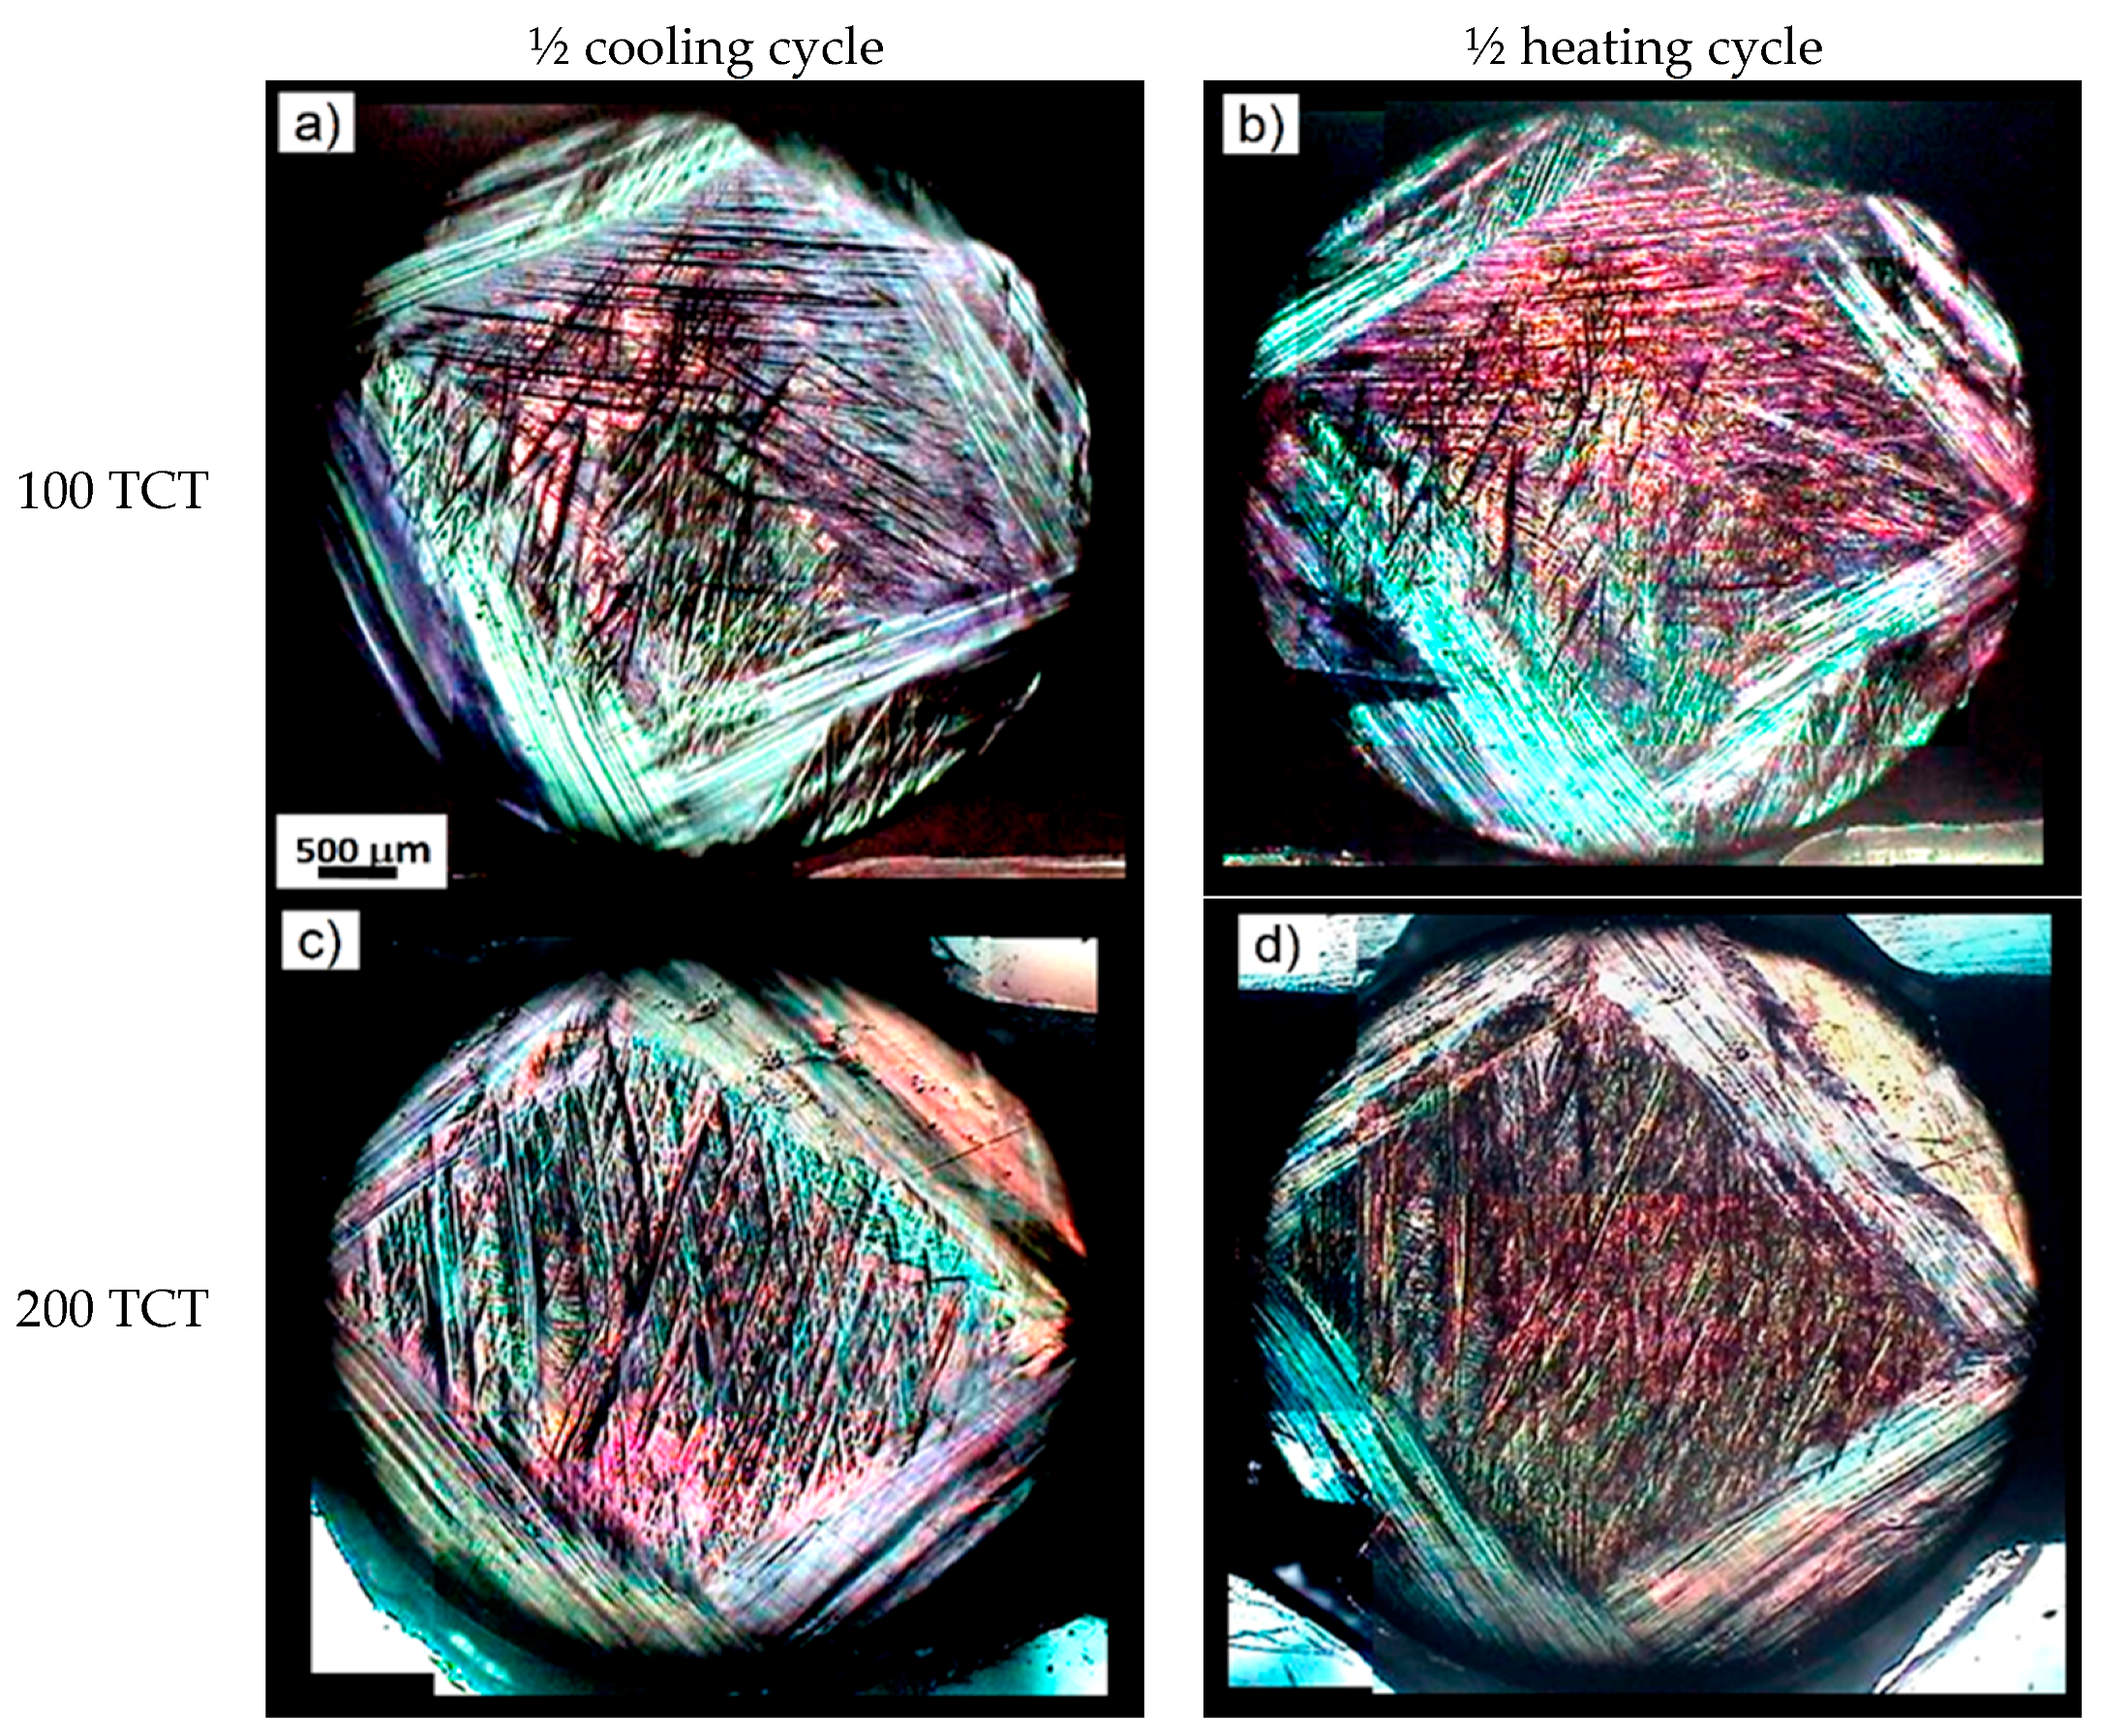
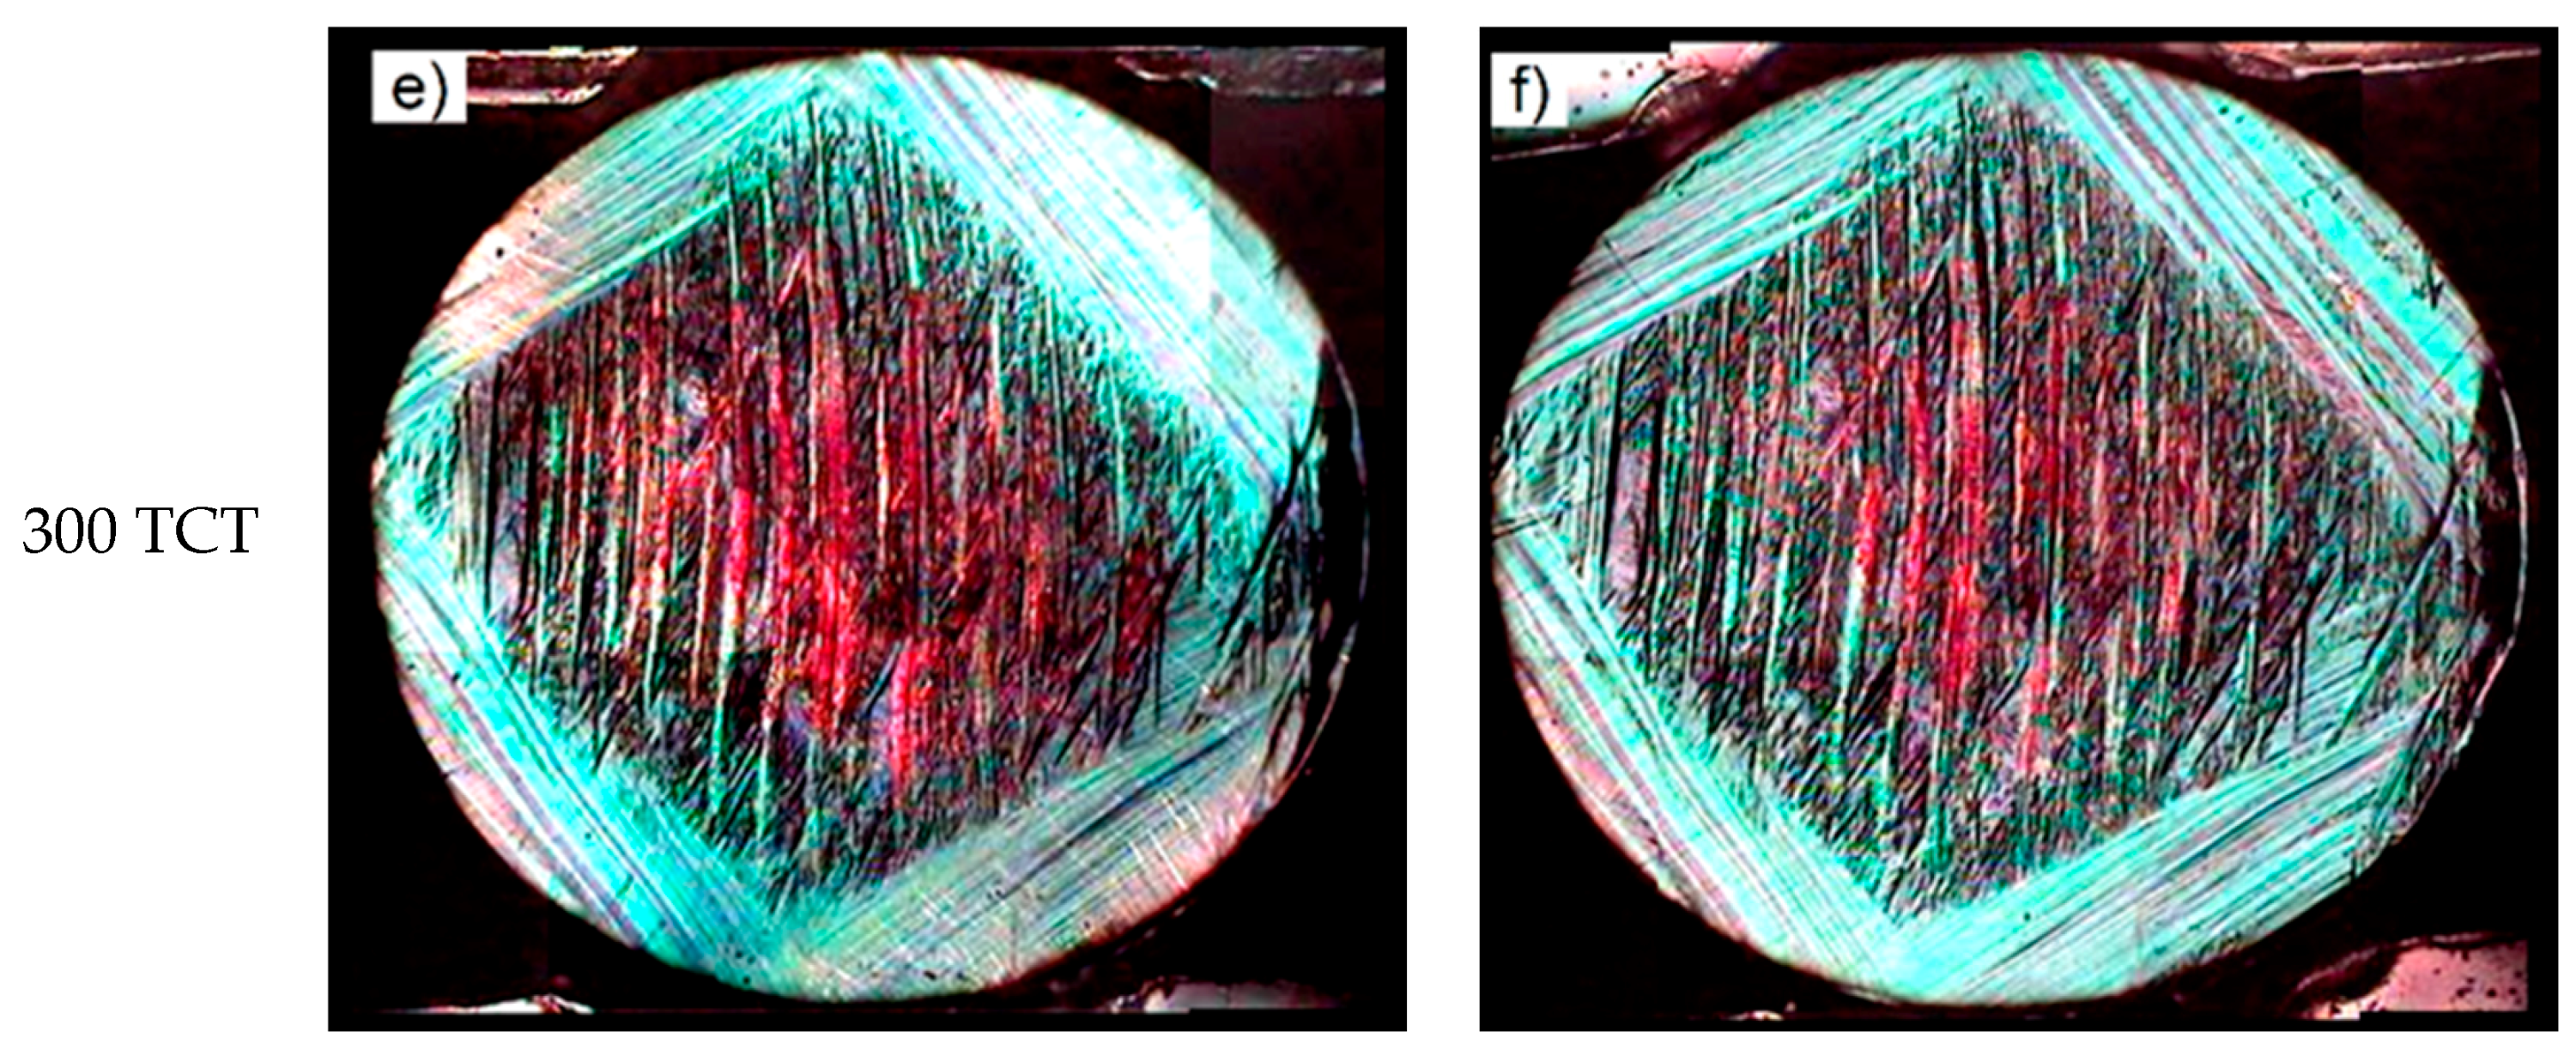
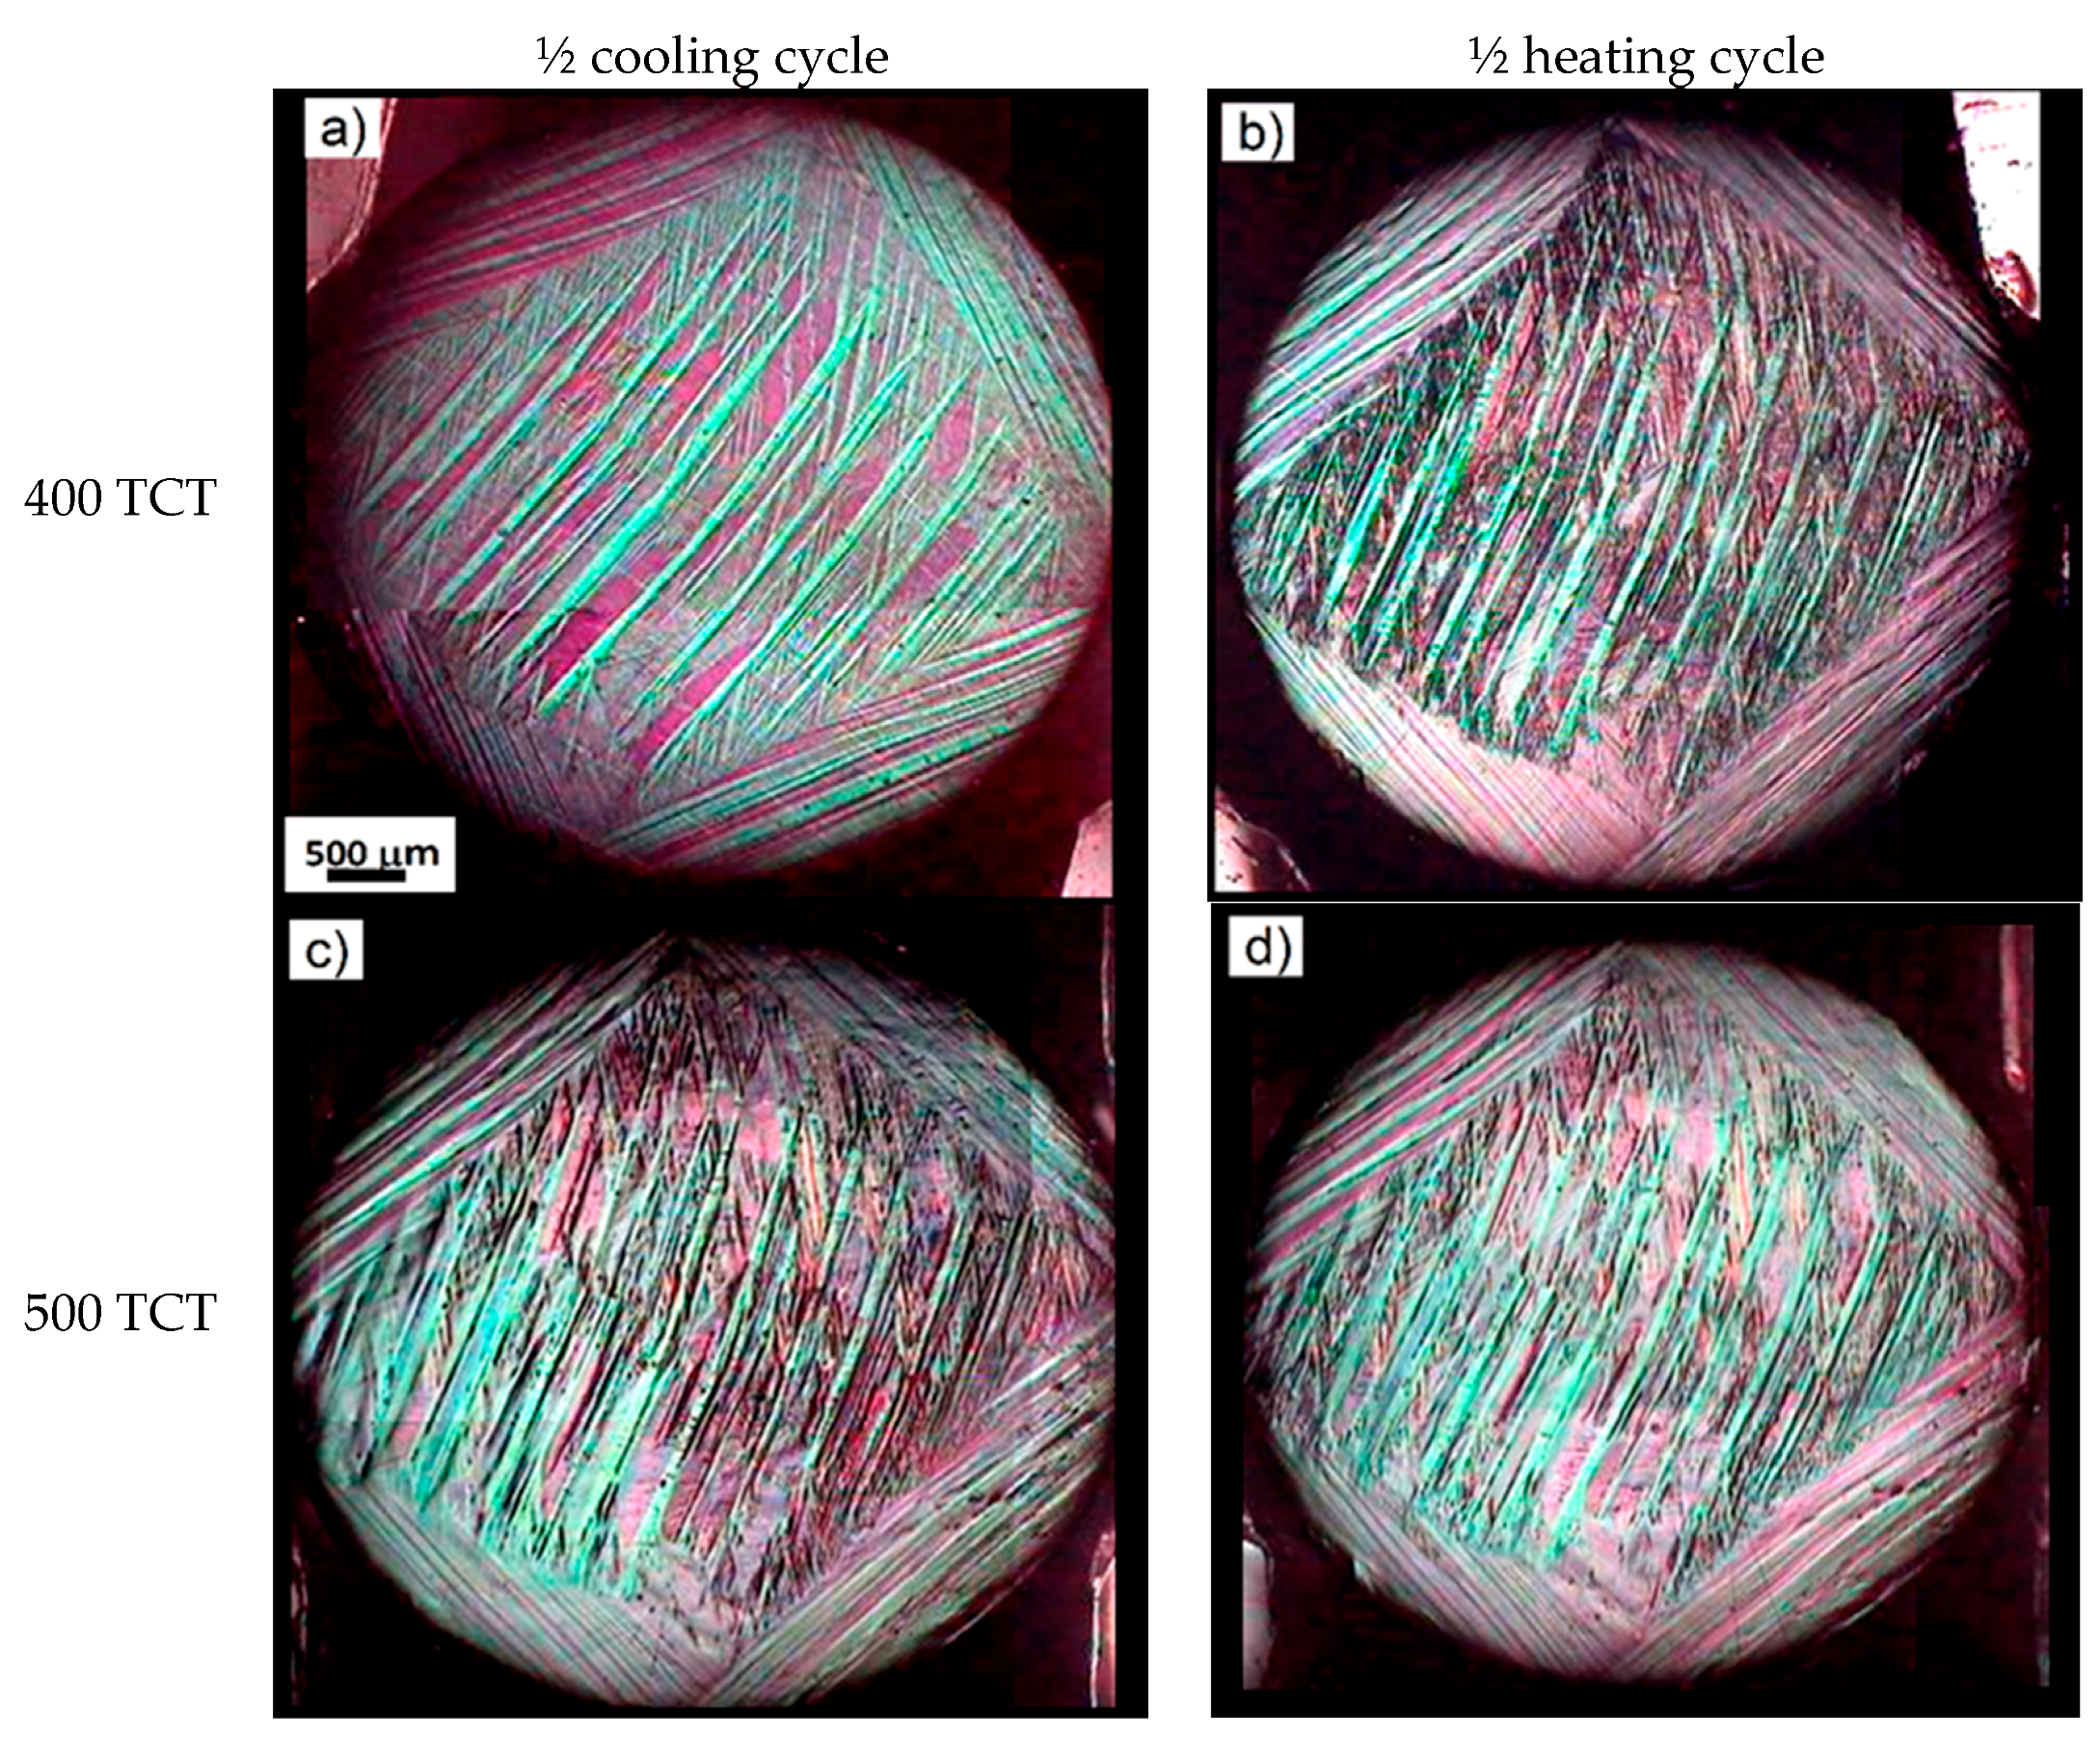
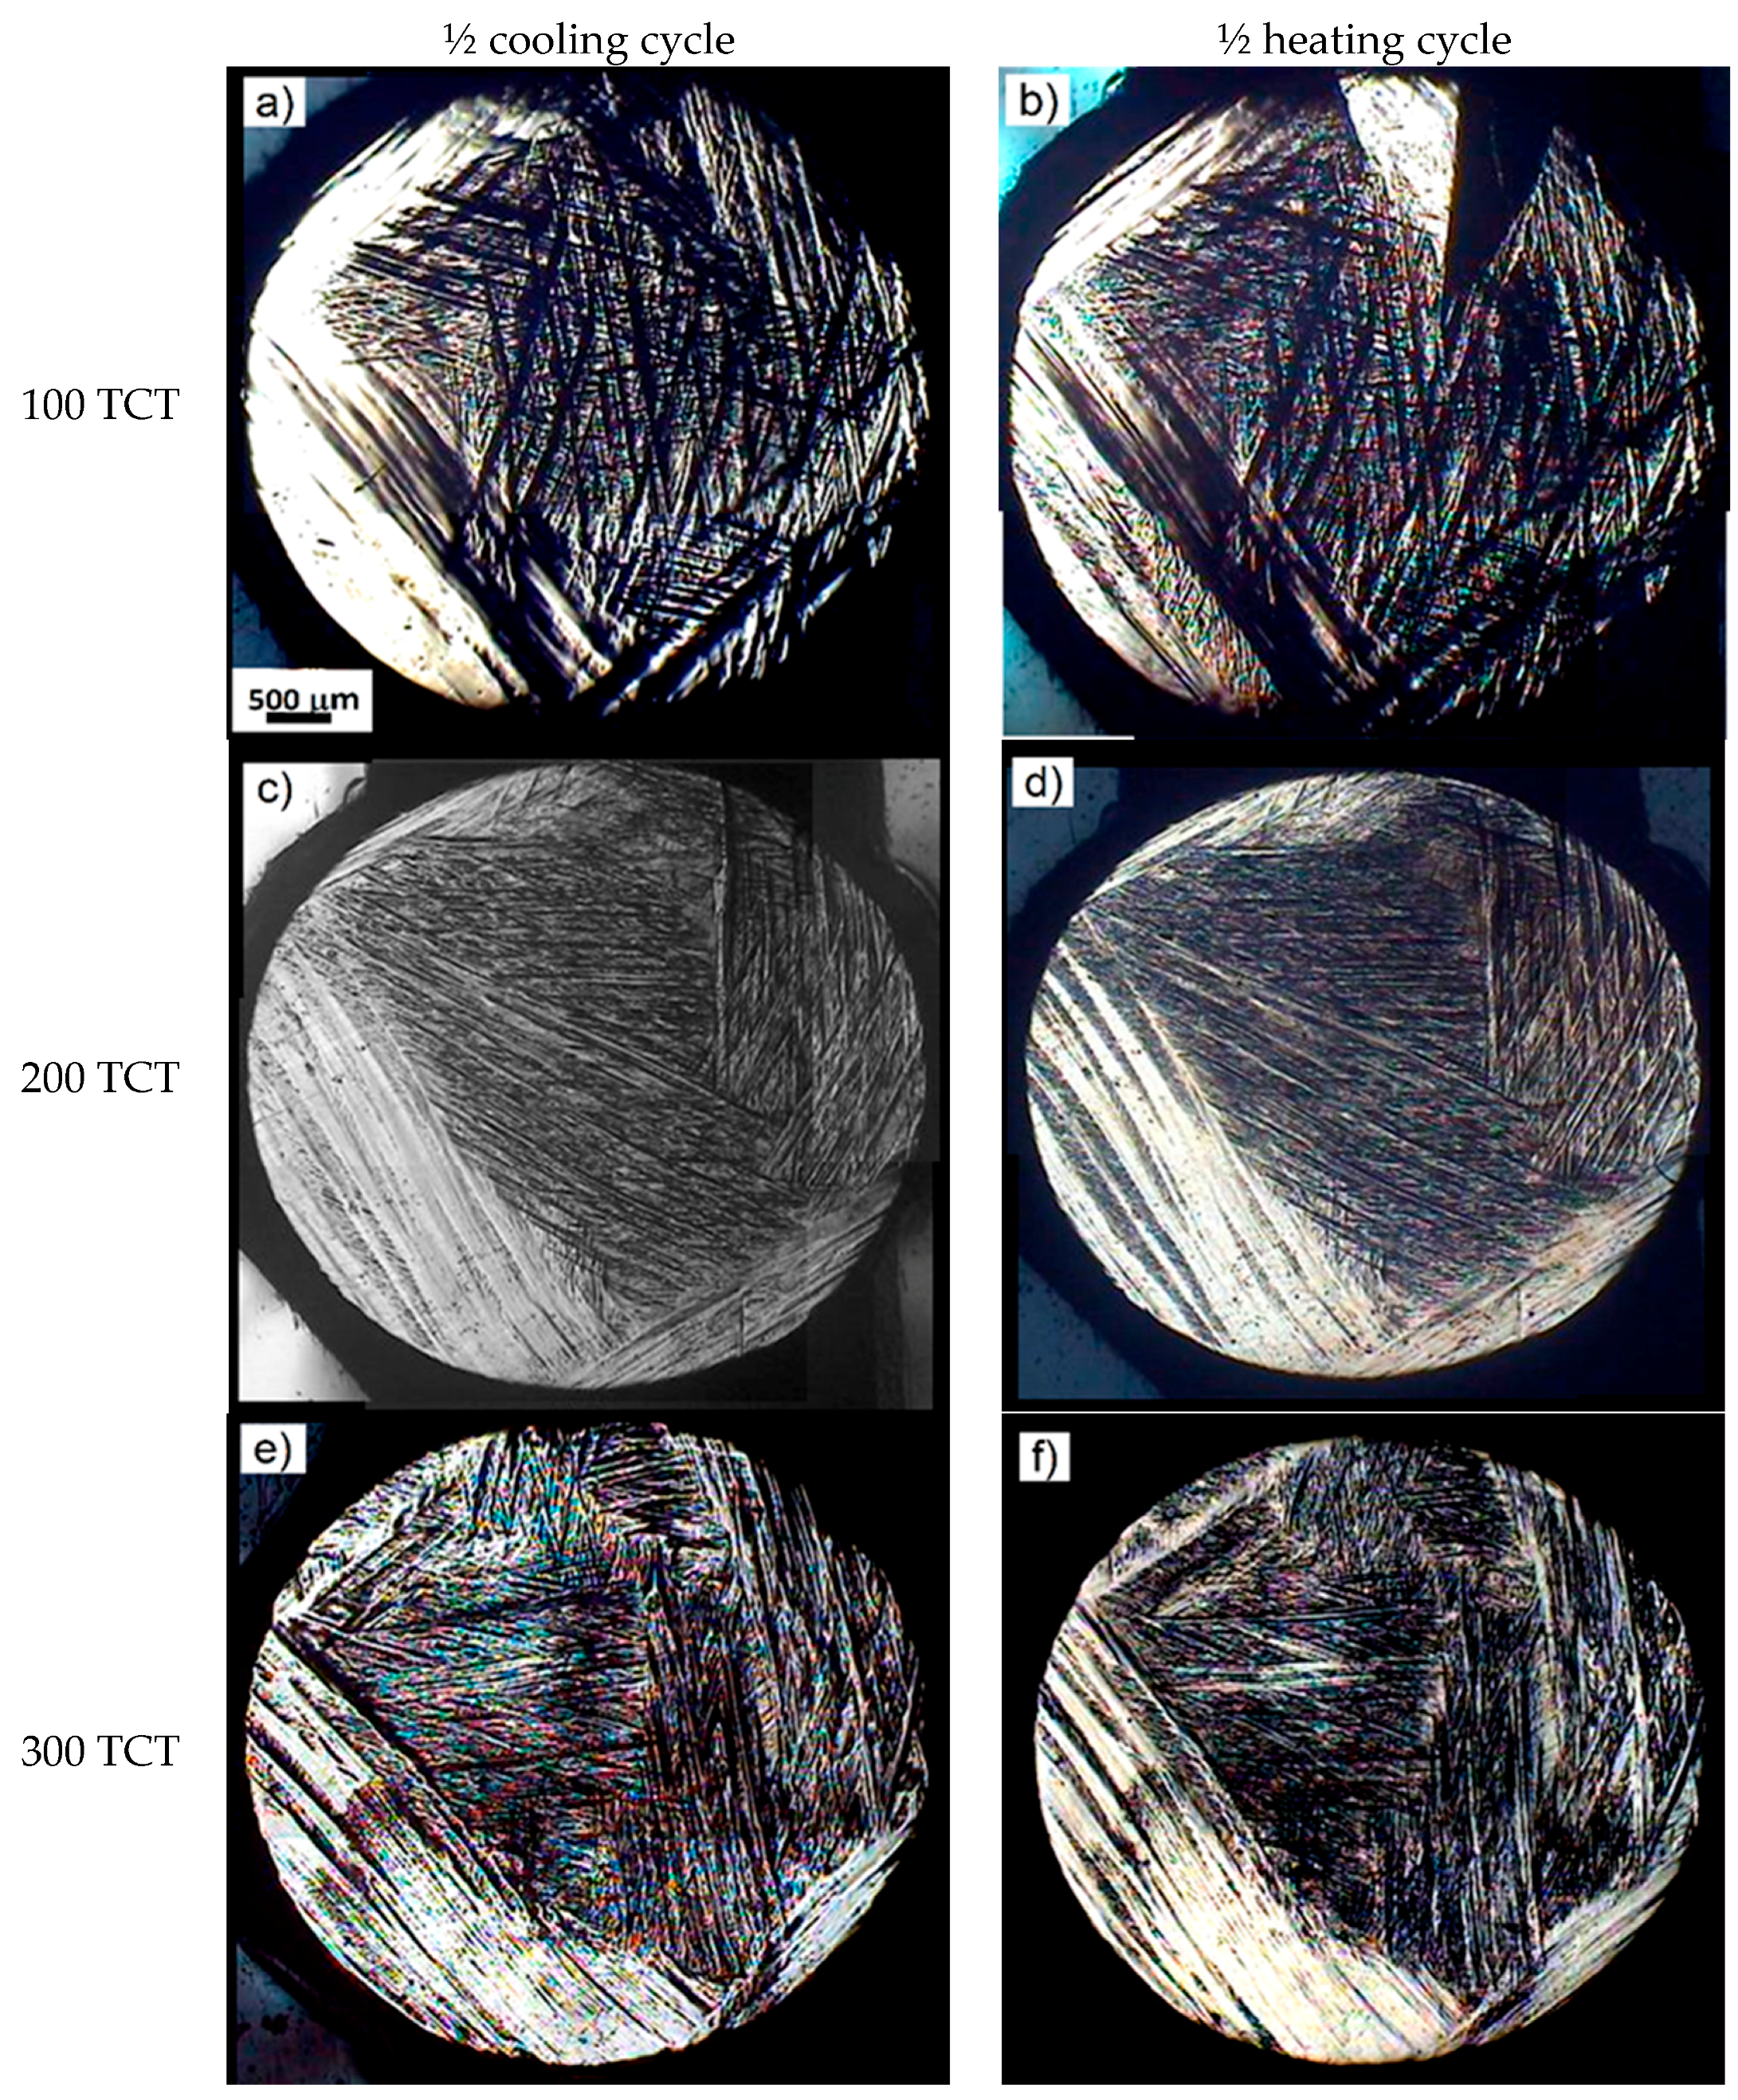
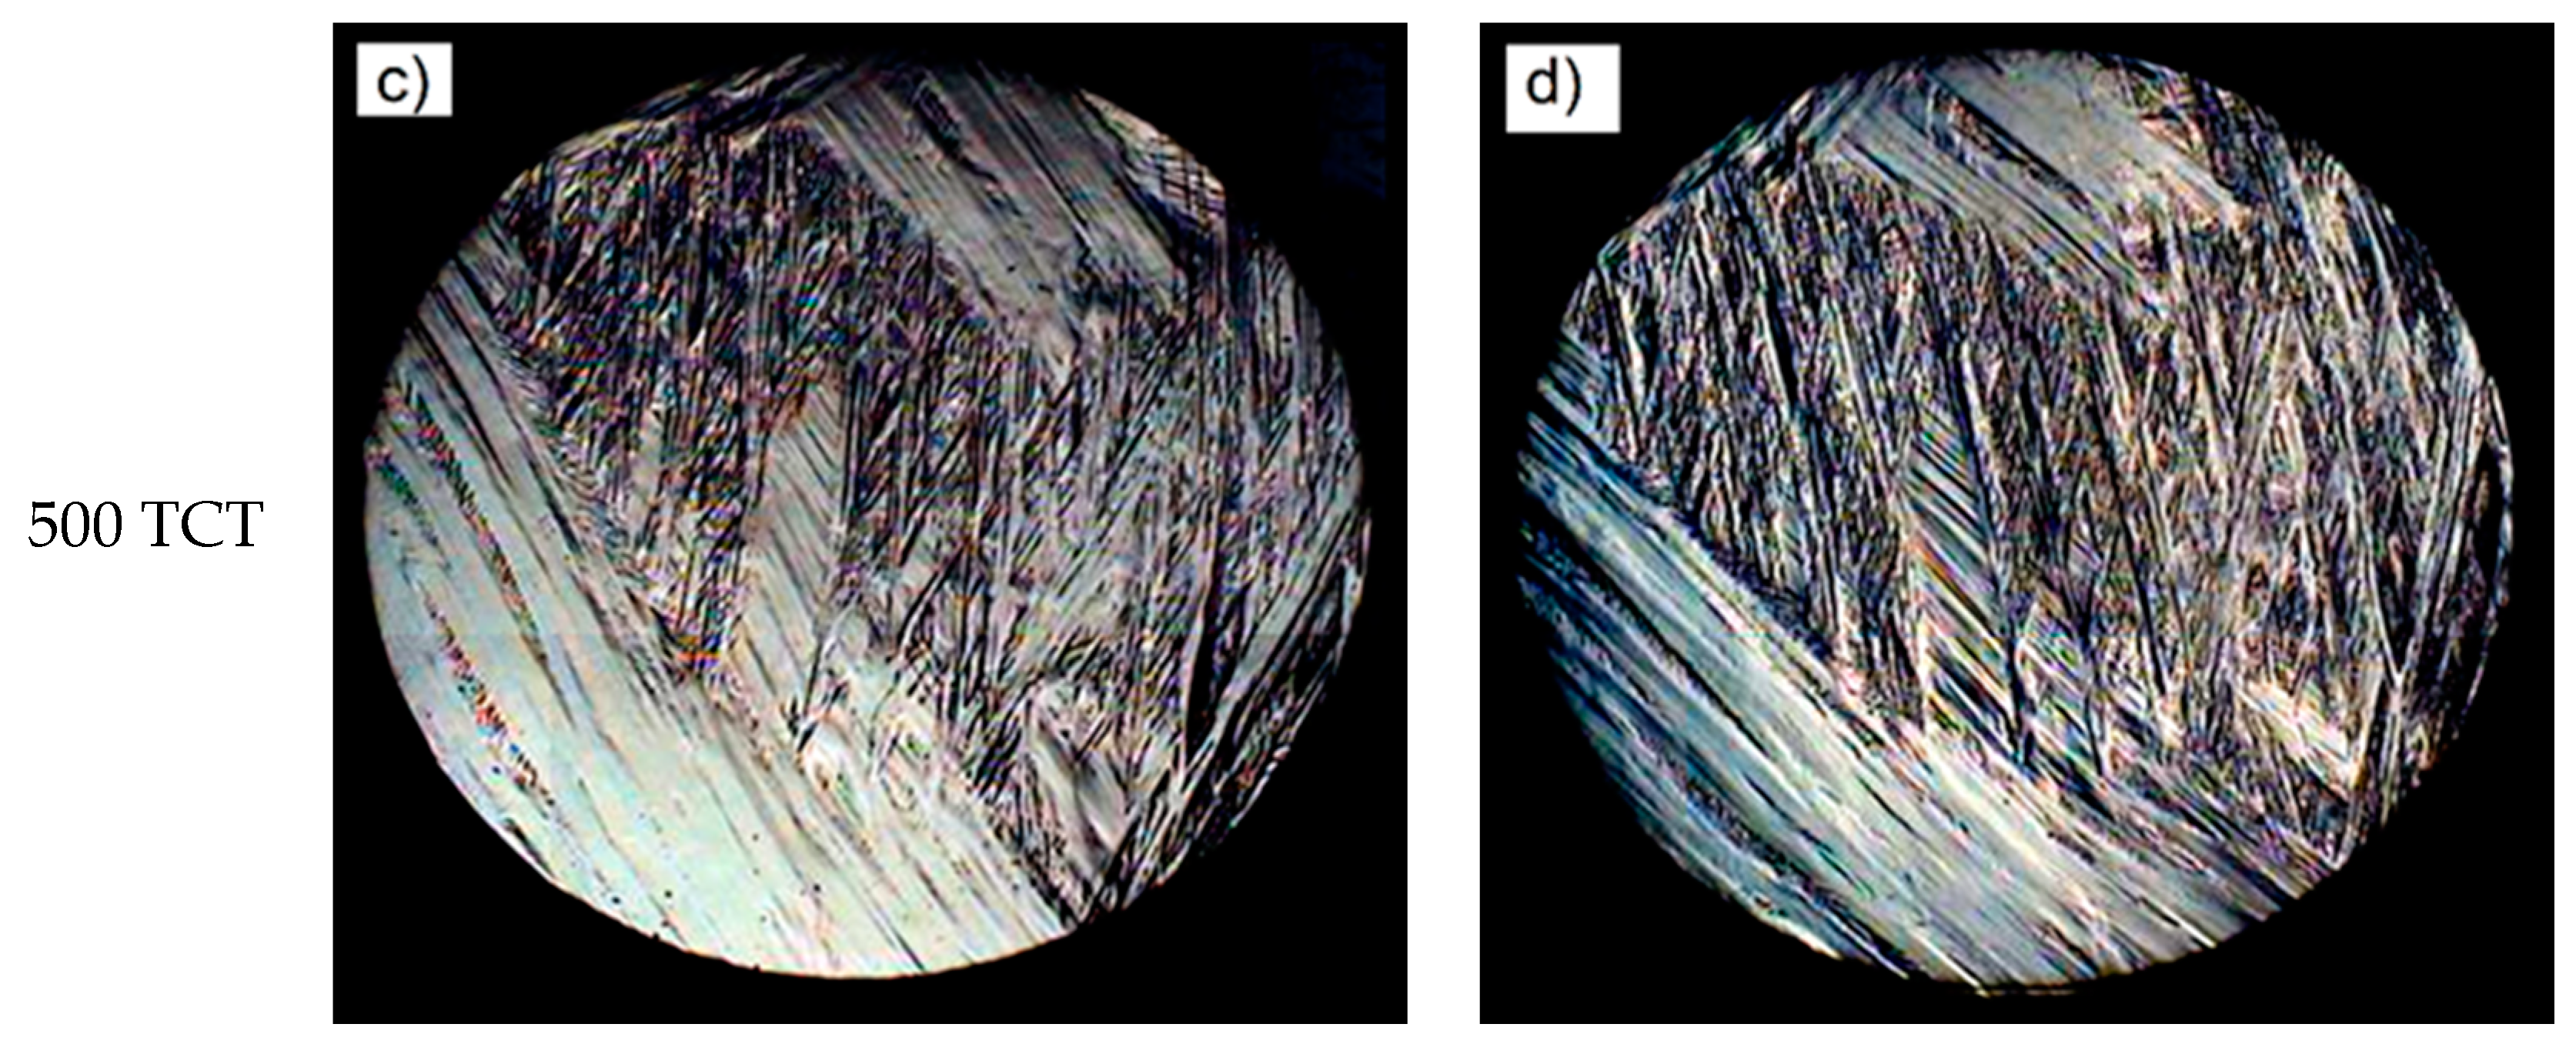
3.4. Optical Microscopy after TCT under Loading

The structure of Cu-13.7% Al-4.2% Ni alloy after TCTs under the load of 0.11 MPa is shown in Figure 12 and Figure 13. In the initial state, the alloy demonstrated a surface structure composed of martensitic blocks: a central block and four peripheral blocks. No significant changes were detected by optical microscopy at the end of treatment and ½ cooling cycle (Figure 12a,c,e and Figure 13a,c) or ½ heating cycle (Figure 12b,d,f and Figure 13b,d).
After TCTs under the load of 0.11 MPa, two martensitic blocks of the peripheral region were eliminated (Figure 12a–f). With the accumulation of 400 and 500 cycles (Figure 13a–d), the martensitic lamellae were not as distinct as before, but it was possible to examine microscopic characteristics of fine needles of this β′1 martensitic phase as estimated by XRD (Figure 9) [1,3].
The microstructure of Cu-13.7% Al-4.2% Ni alloy after TCTs under the load of 0.26 MPa is shown in Figure 14 and Figure 15. The accumulation of structural imperfections during 100 and 200 cycles promoted the development of deep sliding lines, superimposed on the specific martensitic relief (Figure 14a,c). These lines originated from the multiple RMTs induced by TCTs [3,8,18,19,20,21,22]. On heating, the superficial lines became microscopically visible due to the relief of tension (Figure 14b,d). In the peripheral part a spear-shaped needle feature, martensite γ′1 (highlighted in Figure 14b) was presented prominently in the XRD pattern of Figure 10b. With the accumulation of 300 thermal cycles, the reorientation of the martensite lamellae could be noticed (Figure 14e,f). The microstructure of the alloy after TCTs of 400 and 500 cycles was practically stable, with the completely oriented martensitic lamellae in the central region (Figure 15a–d).
The morphological aspect of Cu-13.7% Al-4.2% Ni alloy after TCT under the load of 0.53 MPa is shown in Figure 16 and Figure 17. With the accumulation of thermal cycles, the martensitic relief was less pronounced, probably due to the coherency between the martensitic β′1 and R-phases as noted in the diffractograms of Figure 11. With the accumulation of 300, 400, and 500 cycles, the martensitic relief changed; thus, differently oriented lamellae could be distinguished within the initial martensitic blocks (Figure 16e,f and Figure 17a,d). After TCTs, the individual blocks of the martensitic lamellae with different orientations were observed throughout the sample’s cross-sectional area. It is noted that the sliding lines caused by the RMT overlapped in certain regions, where the accumulation of structural defects probably occurs during TCT tests. Nevertheless, it can be said that the structural orientation was the result of the training under the applied load.

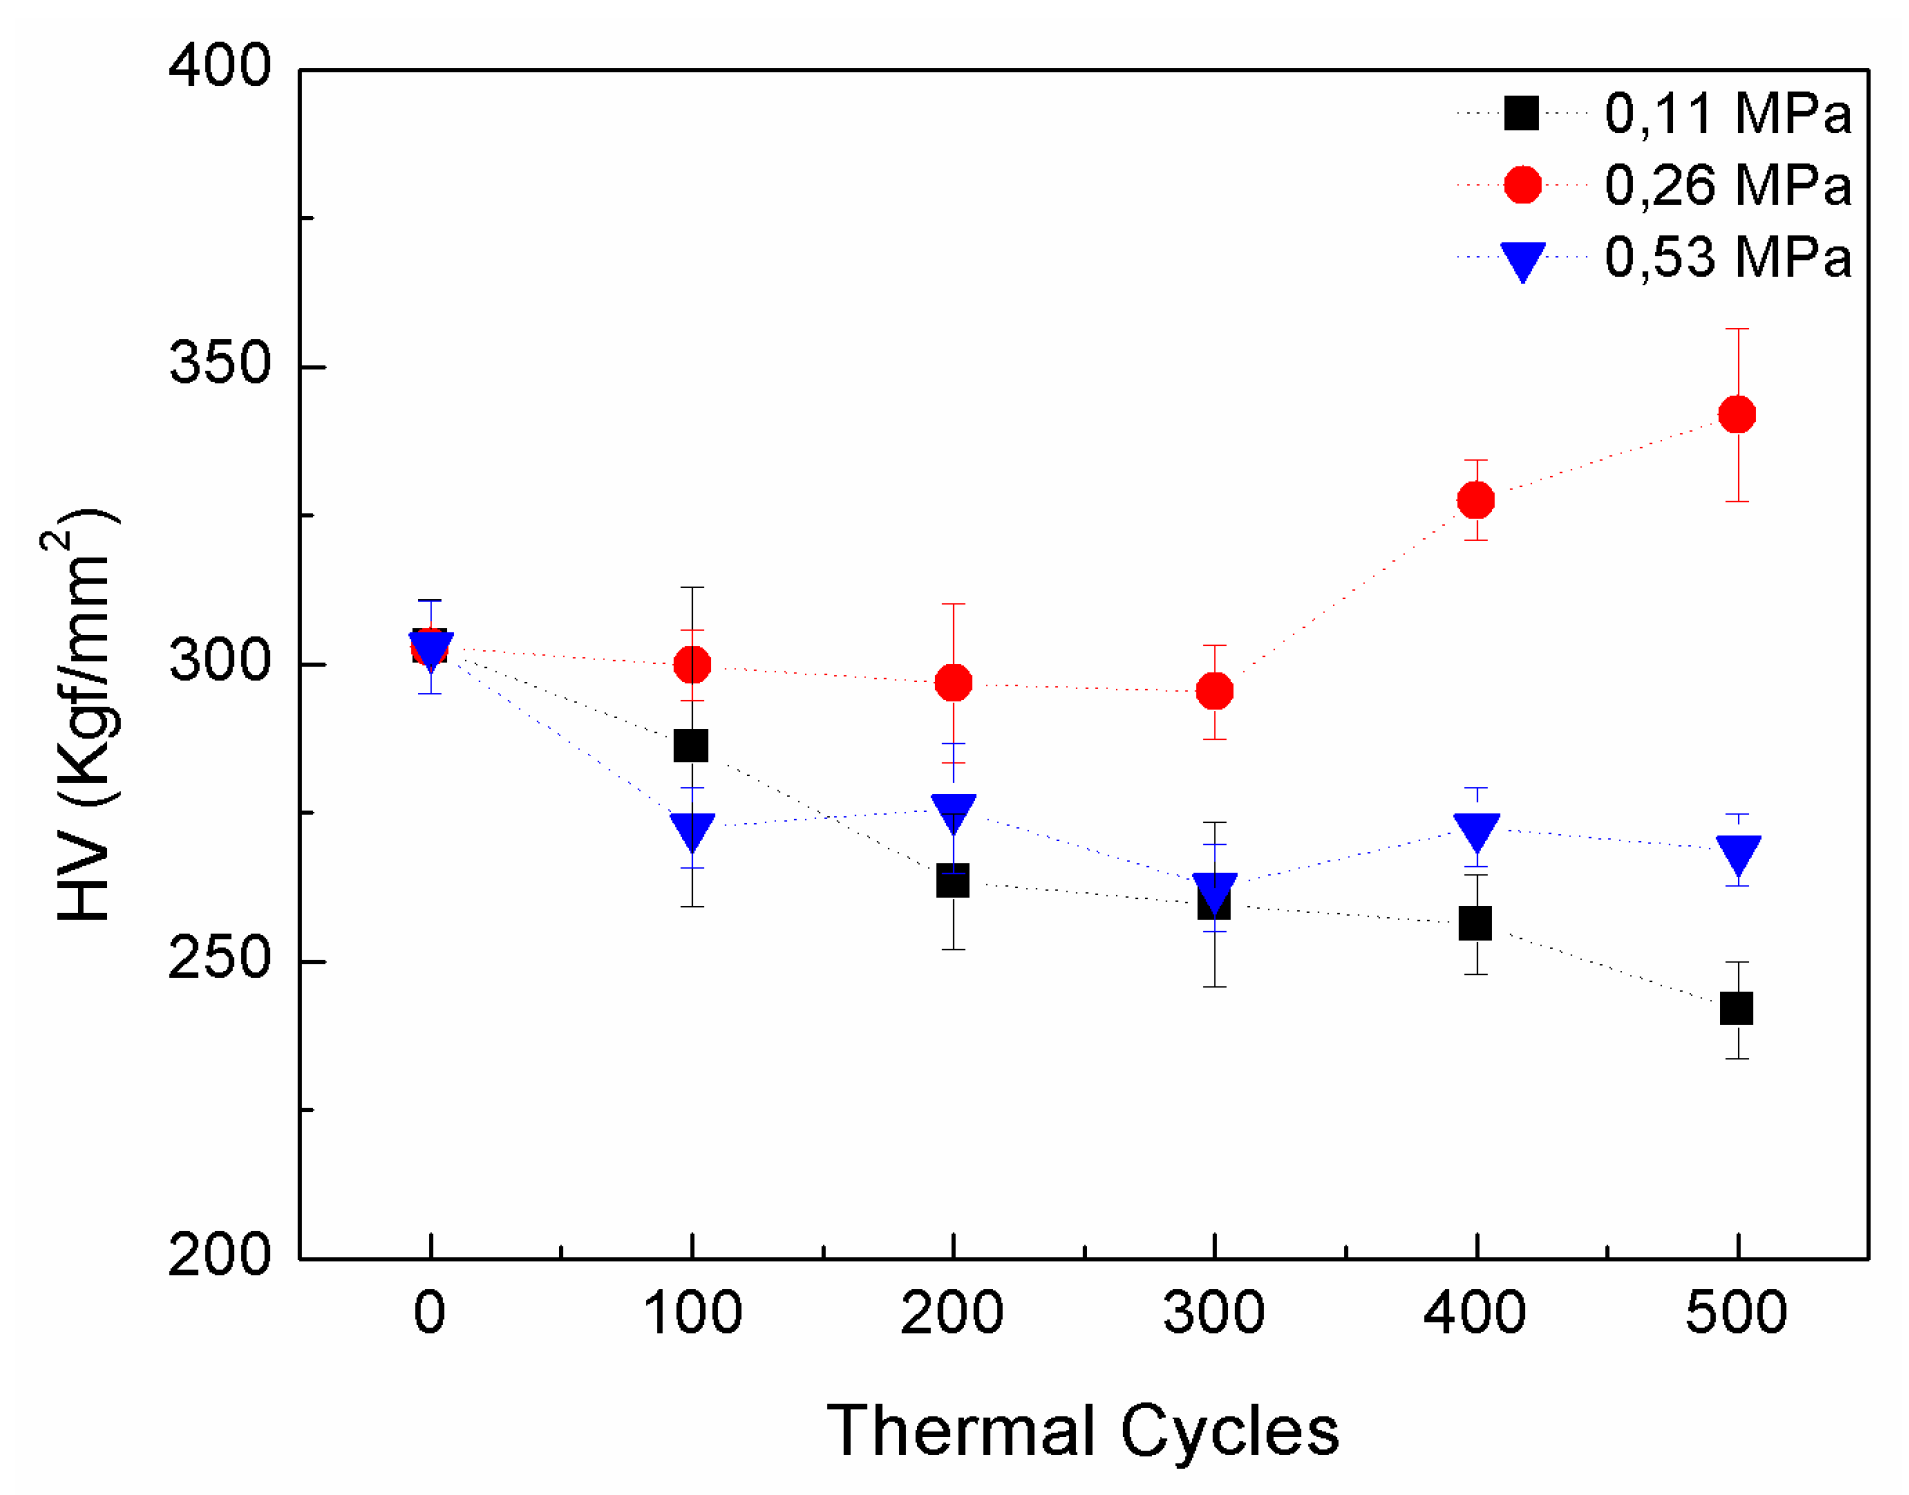
3.5. Vickers Microhardness after TCT under Loads

The average values of Vickers microhardness as a function of the number of thermal cycles under the loads of 0.11, 0.26, and 0.53 MPa applied to the monocrystalline Cu-13.7% Al-4.2% Ni alloy are shown in Figure 18. Determined as 303 ± 7.8 kgf/mm2 in the initial state, microhardness tended to decrease after TCTs under the loads of 0.11 and 0.53 MPa, going down to 241.8 ± 8.1 kgf/mm2 and 268.7 ± 6 kgf/mm2, respectively, after 500 TCTs. However, after TCTs under the load of 0.26 MPa, microhardness displayed a stability plateau up to 300 thermal cycles. With the higher number of cycles, the microhardness increased from 295.3 ± 7.9 kgf/mm2, after 300 cycles, to 341.9 ± 14.5 kgf /mm2, after 500 thermal cycles, which could be typical for the more strained condition of any alloy with a stable structure due to the accumulation of imperfections that can hinder the development of the transformation. But, the apparent increase in microhardness can be associated with the recovery during unloading of the reversible strain accumulated by the induced martensitic transformation [1,2,3].

4. Discussion

The investigated alloy demonstrated complex phase transformation involving coherent phases sensitive to experimental conditions. One of the key proofs of the coherence among the phases in the alloy structure was the absence of several DSC transformation peaks, contrary to that observed in similar alloys [3,24,25,26,27,28,29]. A single RMT peak indicated the sequence of transformation β1 ↔ R ↔ β′1 + γ′1 in the structure of monocrystalline Cu-13.7% Al-4,2% Ni alloy.
It should be noted that after TCTs finishing with the ½ heating cycle (AT → 90 °C → AT without loading), the XRD patterns of the alloys (Figure 9b, Figure 10b and Figure 11b) were in good agreement with the direct RMT critical temperatures (Figure 5a, Figure 6a and Figure 7a). Figure 5a shows that the temperature of the direct intensive RMT Mof, determined after the first thermal cycle of the alloy, was above the TA, estimated by XRD analysis (20 ± 5 °C); it is assumed that this is within the martensite γ′1 field (below Mof) as observed in the diffractogram of Figure 9b. In general, when the critical temperature Mof decreased approaching AT, a greater participation of the martensite β′1 and less participation of the others phases (γ′1, β′1|R and R) was observed in the diffractograms of Figure 9b, Figure 10b and Figure 11b.
It is noted that during all TCTs (Figure 5b, Figure 6b and Figure 7b), the XRD procedure for temperature (20 ± 5 °C) went beyond the reverse RMT temperatures even with the accumulation of TCTs, and the critical temperature Af was very far from TA. So, the participation of the high-temperature phase β1 (mainly in the diffractograms after TCTs under the load of 0.26 MPa (Figure 10) was assumed to be a load response that promoted reverse RMT: γ′1 + β′1 → R → β1, only partially. These results are in agreement with our previous work [18,19,20,21,22], where the same TCTs of a Cu–Al–Ni alloy with comparable composition were performed; however, in TCTs without the applied load, it was not noticed.
During thermal cycling under load, two thermodynamic factors had a complex effect on the implementation of reversible martensitic transformations. Firstly, the load induced reversible MTs of the M → Adef type, when heated from the martensitic phase temperature, or A → Mdef, when cooled from the austenitic phase temperature, thus orienting the structure in a certain way [1,2,3,32]. The fact of the possible reversible martensitic transformation of M- into A-phase under load, as predicted by Vasilevsky in 1971 [32], was experimentally proven in the studies on TiNi- [33,34,35,36,37] and Cu–Al–Ni [38]-based alloys with RMT.
Secondly, the load induced deformation that can be reversible (SME) or irreversible (inelastic deformation) in the alloys with RMT [2,3]. Reversible deformation depends on the load and it increases to a certain value (4–8%) initially but later on decreases. In this case, the temperature ranges for the realization of RMT and SMA expanded drastically as would be studied for a TiNi alloy [33,34,35,36,37]. According to the Clausius–Clapeyron equation, the applied external stress resulted in an increase in the critical temperatures of RMT [3,39]. On the other hand, the directed action of the load promoted some orientation of the structure and facilitated the transformation of martensitic lamellae according to certain variants [3,5].
As early as the 1980s in the works of Antipov et al. [40], the behavior of TiNi alloys with SME subjected to TCTs under different loads of flexural strain was analyzed. It was discovered that on heating during TCT, the return angle (determines the degree of shape restoration) decreased intensively in the first cycles and stabilized an increase in the number of thermal cycles, revealing the stabilization of the structure accompanied by a martensite reorientation and hardening. It was found that under optimized stresses, the return angle stabilization and stability of the structure develops with fewer cycles, while under low and/or excessive applied stresses, angle stabilization is delayed or even noticeable.
Comparison of the results of Antipov et al. [40] with the results of this work for the Cu–Al–Ni SMAs reveals a very similar tendency. With TCTs under the lowest applied load (0.11 MPa), structural stability with reorientation and hardening was not achieved even after TCT of 500 cycles, although critical temperatures and hysteresis showed fewer changes during cyclic tests as observed in Figure 5, Figure 6, Figure 7 and Figure 8.
During TCTs under a higher applied load (0.26 MPa), RMT-induced processes of reorientation, hardening, and stabilization of the structure occurred more intensively, resulting in critical intervals reduction, microhardness increasing, and stabilization, from 300 thermal cycles. Such a conclusion was based on microhardness behavior, critical temperatures, hysteresis, and structural changes as observed in Figure 6, Figure 8 and Figure 18.
With the highest applied load (0.53 MPa), the reorientation and hardening processes could be expected to be faster; however, the excessive load acts both to facilitate the reorientation and to make the shape restoration difficult. As a result, the entire volume of alloy does not participate in the RMT in the limited temperature range adopted in the tests. In this process, the accumulation was more significant which slows down all the RMT reactions, increasing the critical intervals and revealing the intermediate structural states at the ambient temperature (TA) as observed in Figure 7 and Figure 8.
Nevertheless, the changes in the main RMT parameters of monocrystalline Cu-13.7% Al-4.2% Ni alloy after TCT under all applied loads (after “training” under loads) were not very significant, especially after complete RMT cycles which indicates good resistance of the alloy investigated to irreversible structure changes.

5. Conclusions

  • The monocrystalline Cu-13.7% Al-4.2% Ni alloy represents complex mixed transformation, revealing the RMT sequence β1 ↔ R ↔ β′1 + γ′1, where the present phases are coherent with each other and are very sensitive to structural changes.
  • Alterations in the alloy structure by finishing the ½ cycle heating treatment (TA → 90 °C → TA) show good consistency with the critical temperatures of direct RMT. The martensite γ′1 field lies below the end of the intensive direct RMT (below Mof). Above this temperature, a greater participation of martensite β′1 is observed, coherent to phase R.
  • The participation of the high-temperature phase β1 in the alloy structure, mainly after TCTs under the load of 0.26 MPa, appears as a response of the load applied during the treatment which promotes partially the reverse RMT γ′1 + β′1 → R → β1.
  • During TCTs performed under optimized load (0.26 MPa), where the RMT range was not changed, the reorientation, hardening, and stabilization of the structure during RMT occur more intensively, resulting in a reduction of critical intervals, increasing and stabilizing of the microhardness, from 300 thermal cycles.
  • The changes in the main RMT parameters of monocrystalline Cu-13.7% Al-4.2% Ni alloy during TCT under load are not very significant, especially after complete RMT cycles, which indicate good resistance of the alloy investigated to irreversible changes, making its practical use feasible.

Author Contributions

L.A.M.: conceptualization, project administration, creation of the special device for heat cycling, analyses of all results, original manuscript preparation; E.C.P.: investigation, the heat cycling tests performing, structure and DSC analyses, original figures preparation, discussion; S.A.P.: support and manufacture of the investigated alloy; C.Y.S.: DSC performing and DSC analysis, N.A.P.: discussion, translation into English and article edition, provision of referenced papers, including links and DOI. All authors have read and agreed to the published version of the manuscript.

Funding

The researchers are grateful for the research support granted by FAPERJ, CAPES, and CNPq; N.A.P. thanks the support of state assignment No. 075-00947-20-00.

Acknowledgments

The researchers are grateful for the research support granted by Luciana Lezira Pereira de Almeida technique of LAMAV/CCT/UENF for the performance of X-ray diffraction analysis.

Conflicts of Interest

The authors declare no conflict of interest. The funders had no role in the design of the study; in the collection, analyses, or interpretation of data; in the writing of the manuscript, or in the decision to publish the results.

References

  1. Kurdyumov, G.V.; Khandros, L.G. On the thermoelastic equilibrium on martensitic transformations. Dokl. Akad. Nauk SSSR 1949, 66, 211–214. Available online: http://archive.ujp.bitp.kiev.ua/files/journals/53/si/53SI20p.pdf (accessed on 25 January 2020).
  2. Perkins, J. Shape memory effects in alloys. In Proceedings of the International Symposium on Shape Memory Effects and Applications, Toronto, ON, Canada, 19–20 May 1975; Available online: https://www.springer.com/gp/book/9781468422139 (accessed on 25 January 2020).
  3. Otsuka, K.; Wayman, C.M. (Eds.) Shape Memory Materials; Cambridge University Press: Cambridge, UK, 1999; Available online: https://ru.scribd.com/document/368059783/K-Otsuka-C-M-Wayman-Shape-Memory-Materials-Cambridge-University-Press-1998 (accessed on 25 January 2020).
  4. Duerig, T.W.; Pelton, A.; Stöckel, D. An overview of nitinol medical applications. Mater. Sci. Eng. A 1999, 273, 149–160. [Google Scholar] [CrossRef]
  5. Otsuka, K.; Ren, X. Physical metallurgy of Ti–Ni-based shape memory alloys. Prog. Mater. Sci. 2005, 50, 511–678. [Google Scholar] [CrossRef]
  6. SMST-2017: Nitinol and Beyond. In Proceedings of the International Conference on Shape Memory and Superelastic Technologies (SMST 2017), San Diego, CA, USA, 15–19 May 2017; Volume 1, p. 230. Available online: https://www.asminternational.org/web/smst/events/proceedings/-/journal_content/56/10192/37425484/PUBLICATION (accessed on 25 January 2020).
  7. Font, J.; Cesari, E.; Muntasell, J.; Pons, J. Thermomechanical cycling in Cu–Al–Ni-based melt-spun shape-memory ribbons. Mater. Sci. Eng. A 2003, 354, 207–211. [Google Scholar] [CrossRef]
  8. Tadaki, T. Cu-based shape memory alloys. In Shape Memory Materials; Otsuka, K., Wayman, C.M., Eds.; Cambridge University Press: Cambridge, UK, 1999; pp. 97–116. [Google Scholar]
  9. Martynov, V.; Bokate, M.D.; Johnson, A.D.; Grey, G.R. Superelastic and shape memory single Crystal Cu-Al-Ni: Fabrication and Applications. In Proceedings of the International Conference on Shape Memory and Superelastic Technologies, Pacific Grove, CA, USA, 7–11 May 2006; pp. 427–439. Available online: http://docplayer.net/50163627-Smst-shape-memory-and-superelastic-technologies-proceedings-of-the-international-conference-on.html (accessed on 25 January 2020).
  10. Pulnev, S.; Nikolaev, V.; Priadko, A.; Rogov, A.; Vahhi, I. Actuators and drivers based on CuAlNi shape memory single crystals. J. Mater. Eng. Perform. 2011, 20, 497–499. [Google Scholar] [CrossRef]
  11. Morin, M.; Trivero, F. Influence of thermal cycling on the reversible martensitic transformation in a Cu-Al-Ni shape memory alloy. Mater. Sci. Eng. A 1995, 196, 177–181. [Google Scholar] [CrossRef]
  12. Silva, R.J.C.; Matlakhova, L.A.; Pereira, E.C.; Matlakhov, A.N.; Monteiro, S.N.; Rodríguez, R.J.S. Thermal cycling treatment and structural changes in Cu-Al-Ni monocrystalline alloys. Mater. Sci. Forum Trans. Tech. Publ. 2006, 514, 692–696. [Google Scholar] [CrossRef]
  13. Matlakhova, L.A.; Motta, A.C.; Matlakhov, A.N.; Pereira, E.C.; Toledo, R.; Monteiro, S.N. Estrutura de ligas monocristalinas Cu-Al-Ni após ciclagem térmica. Technol. Metall. Mater. Min. 2009, 6, 80–85. [Google Scholar]
  14. Hund, F.; Fricke, R. Der Kristallbau von α-BiF3. Z. Anorg. Chem. 1949, 258, 198–204. [Google Scholar] [CrossRef]
  15. Vol, A.E. The Structure and Properties of Binary Systems; Fizmatgiz: Moscow, Russia, 1959; Volume 1, p. 755. [Google Scholar]
  16. Bown, M.G. The structure of rhombohedral T (NiCuAl). Acta Crystallogr. 1956, 9, 70–74. [Google Scholar] [CrossRef]
  17. Shishkovsky, I.; Yadroitsev, I.; Morozov, Y. Laser-assisted synthesis in Cu-Al-Ni system and some of its properties. J. Alloys Compd. 2016, 658, 875–879. [Google Scholar] [CrossRef]
  18. Matlakhova, L.A.; Pereira, E.C.; Matlakhov, A.N.; Monteiro, S.N. Structure and properties of a monocrystalline Cu-Al-Ni alloy submitted to thermal cycling under load. In Shape Memory Alloys: Manufacture, Properties and Applications; Nova Publishers: Hauppauge, NY, USA, 2010; ISBN 978-1-60741-789-7. Available online: http://www.novapublishers.org/catalog/product_info.php?products_id=20903 (accessed on 25 January 2020).
  19. Pereira, E.C.; Matlakhova, L.A.; Matlakhov, A.N.; Monteiro, S.N.; Rodriguez, R.S. Effect of applied load on the characteristics of reversible martensitic transformation during thermal cycling treatment of a monocrystalline Cu-13.5Al-4Ni alloy. Mater. Sci. Res. J. 2010, 4, 15–36. Available online: https://www.researchgate.net/publication/286317945_Effect_of_applied_load_on_the_characteristics_of_reversible_martensitic_transformation_during_thermal_cycling_treatment_of_a_monocrystalline_Cu-13.5Al-4Ni_alloy (accessed on 25 January 2020).
  20. Matlakhova, L.A.; Pereira, E.C.; Matlakhov, A.N.; Monteiro, S.N.; Rodriguez, R.S. Stress assisted thermal cycling treatment of a monocrystalline Cu-Al-Ni alloy. Mater. Sci. Res. J. 2011, 5, 31–50. [Google Scholar]
  21. Pereira, E.C.; Matlakhova, L.A.; Matlakhov, A.N.; Shigue, C.Y.; Monteiro, S.N. Physical and Structural Characterization of a Monocrystalline Cu-13.7Al-4.2Ni Alloy Subjected to Thermal Cycling Treatments. Metall. Mater. Trans. A 2014, 45, 1866–1875. [Google Scholar] [CrossRef]
  22. Pereira, E.C.; Matlakhova, L.A.; Matlakhov, A.N.; Araújo, C.J.; Shigue, C.Y.; Monteiro, S.N. Reversible martensite transformations in thermal cycled polycrystalline Cu-13.7% Al-4.0% Ni alloy. J. Alloys Compd. 2016, 688, 436–446. [Google Scholar] [CrossRef]
  23. Pul’nev, S.A.; Nikolaev, V.I.; Malygin, G.A.; Kuz’min, S.L.; Shpeizman, V.V.; Nikanorov, S.P. Generation and relaxation of reactive stresses in Cu-Al-Ni shape-memory alloy. Tech. Phys. 2006, 51, 1004–1007. [Google Scholar] [CrossRef]
  24. Recarte, V.; Pérez-Sáez, R.B.; Bocanegra, E.H.; Nó, M.L.; San Juan, J. Dependence of the martensitic transformation characteristics on concentration in Cu–Al–Ni shape memory alloys. Mater. Sci. Eng. A 1999, 273, 380–384. [Google Scholar] [CrossRef]
  25. Recarte, V.; Pérez-Sáez, R.B.; Nó, M.L.; San Juan, J. Evolution of martensitic transformation in Cu–Al–Ni shape memory alloys during low-temperature aging. J. Mater. Res. 1999, 14, 2806–2813. [Google Scholar] [CrossRef]
  26. Recarte, V.; Pérez-Sáez, R.B.; Nó, M.L.; San Juan, J. Ordering kinetics in Cu–Al–Ni shape memory alloys. J. Appl. Phys. 1999, 86, 5467–5473. [Google Scholar] [CrossRef]
  27. Recarte, V.; Pérez-Sáez, R.B.; San Juan, J.; Bocanegra, E.H.; Nó, M.L. Influence of Al and Ni concentration on the martensitic transformation in Cu-Al-Ni shape-memory alloys. Metall. Mater. Trans. A 2002, 33, 2581–2591. [Google Scholar] [CrossRef]
  28. Ibarra, A.; Caillard, D.; San Juan, J.; Nó, M.L. Martensite nucleation on dislocations in Cu–Al–Ni shape memory alloys. Appl. Phys. Lett. 2007, 90, 101–107. [Google Scholar] [CrossRef]
  29. Ibarra, A.; San Juan, J.; Bocanegra, E.H.; Nó, M.L. Evolution of microstructure and thermomechanical properties during superelastic compression cycling in Cu–Al–Ni single crystals. Acta Mater. 2007, 55, 4789–4798. [Google Scholar] [CrossRef]
  30. Nishiyama, Z. Martensitic Transformations; Fine, M.E., Meshii, M., Wayman, C.M., Eds.; Academic Press: San Francisco, NY, USA, 1978; p. 480. [Google Scholar]
  31. Swann, P.R.; Warlimont, H. The electron-metallography and crystallography of copper-aluminum martensites. Acta Metall. 1963, 11, 511–527. [Google Scholar] [CrossRef]
  32. Wasilewski, R.J. The effects of applied stress on the martensitic transformation in TiNi. Metall. Mater. Trans. 1971, 2, 2973–2981. [Google Scholar] [CrossRef]
  33. Kovneristy, Y.K.; Fedotov, S.G.; Matlakhova, L.A. Effect of deformation on phase transformations and modulus of elongation in titanium nickelide—Based alloy. In Proceedings of the 5th International Conference on Titanium, Munich, Germany, 10–14 September 1984; Volume 3, pp. 1673–1681. [Google Scholar]
  34. Kovneristy, Y.K.; Fedotov, S.G.; Matlakhova, L.A.; Oleynikova, S.V. Shape memory and shape reversibility effects in a TiNi alloy as a function of deformation. Fiz. Met. Metallogr. (USSR) 1986, 62, 124–129. [Google Scholar]
  35. Kovneristy, Y.K.; Fedotov, S.G.; Matlakhova, L.A. The influence of plastic deformation on the structure, shape memory effect and other properties of TiNi alloy. In Proceedings of the International Symposium CN Shape Memory Alloys, Guilin, China, 6–9 September 1986; pp. 175–180. [Google Scholar]
  36. Fedotov, S.G.; Kovneristy, Y.K.; Matlakhova, L.A.; Zhebynieva, N.F. Structural changes in alloy TiNi with the shape memory effect during deformation. Phys. Met. Metall. 1988, 65, 564–569. [Google Scholar]
  37. Matlakhova, L.A.; Belousov, O.K.; Palii, N.A. Elastic Modulus and structure changes in TiNi during SME and RSME. Available online: https://www.lap-publishing.com/catalog/details//store/gb/book/978-613-9-85937-5/elastic-modulus-and-structure-changes-in-tini-during-sme-and-rsme?locale=ru (accessed on 25 January 2020).
  38. Matlakhova, L.A.; Motta, A.C.; Matlakhov, A.N.; Kolmakov, A.G.; Sevostianov, M.A. Módulo de elasticidade da liga monocristalina Cu-Al-Ni deformada por compressão. In Proceedings of the 18th Brazilian Congress of Engineering and Materials Science—CBECiMat, Porto de Galinhas, Brazil, 24–28 November 2008; pp. 6463–6474. Available online: https://www.scribd.com/document/50128870/18Cbecimat (accessed on 25 January 2020).
  39. Pérez-Landazábal, J.I.; Recarte, V.; Pérez-Sáez, R.B.; Nó, M.L.; Campo, J.; San Juan, J. Determination of the next-nearest neighbor order in β phase in Cu-Al-Ni shape memory alloys. Appl. Phys. Lett. 2002, 81, 1794–1796. [Google Scholar] [CrossRef]
  40. Antipov, A.I.; Matlakhova, L.A.; Tolmachev, A.N.; Oleinikova, S.V.; Zebyneva, N.F. Effect of Thermomechanical Treatment on the Shape Memory Effect in TN-1 Alloys. Fiz. Khim. Obrab. Mater. 1981, 6, 67–70. [Google Scholar]
Figure 1. The XRD patterns of the alloy (a) in the as-received state, (b) after the ½ cooling cycle, and (c) after the ½ heating cycle.
Metals 10 00219 g001
Figure 2. The DSC analysis of monocrystalline Cu-13.7% Al-4.2% Ni alloy in the initial state showed reverse heating and direct reversible martensitic transformations (RMT).
Metals 10 00219 g002
Figure 3. Schematic representation of the thermal hysteresis, showing the transformation β1 ↔ (β′1 + γ′1), presenting hysteresis around 10 °C.
Metals 10 00219 g003
Figure 4. The reverse RMT curves (ac) and reverse RMT enthalpies (E) (df) obtained in the first DSC cycle of monocrystalline Cu-13.7% Al-4.2% Ni alloy submitted to TCT under loadings of (a) 0.11 MPa, (b) 0.26MPa, and (c) 0.53 MPa.
Metals 10 00219 g004aMetals 10 00219 g004b
Figure 5. RMT critical temperatures obtained by DSC analysis during (a) cooling and (b) 2nd heating without loading of the monocrystalline Cu-13.7% Al-4.2% Ni alloy after TCT under the load of 0.11 MPa.
Metals 10 00219 g005
Figure 6. RMT critical temperatures obtained by DSC analysis during (a) cooling and (b) 2nd heating without loading of the monocrystalline Cu-13.7% Al-4.2% Ni alloy after TCT under the load of 0.26 MPa.
Metals 10 00219 g006
Figure 7. RMT critical temperatures obtained by DSC analysis during (a) cooling and (b) 2nd heating without loading of the monocrystalline Cu-13.7% Al-4.2% Ni alloy after TCT under the load of 0.53 MPa.
Metals 10 00219 g007
Figure 8. Values of thermal hysteresis as a function of applied TCT of the monocrystalline Cu-13.7% Al-4.2% Ni alloy.
Metals 10 00219 g008
Figure 9. Diffractograms of Cu-13.7% Al-4.2% Ni alloy after TCTs under loading of 0.11 MPa finished with the (a) ½ cooling cycle and (b) ½ heating cycle.
Metals 10 00219 g009
Figure 10. Diffractograms of Cu-13.7% Al-4.2% Ni alloy after TCTs under loading of 0.26 MPa finished with the (a) ½ cooling cycle and (b) ½ heating cycle.
Metals 10 00219 g010
Figure 11. Diffractograms of Cu-13.7% Al-4.2% Ni alloy after TCTs under loading of 0.53 MPa finished with the (a) ½ cooling cycle and (b) ½ heating cycle.
Metals 10 00219 g011aMetals 10 00219 g011b
Figure 12. Microstructure of Cu-13.7% Al-4.2% Ni alloy after (a,b) 100; (c,d) 200; and (e,f) 300 TCTs under the loading of 0.11 MPa, finished with the (a,c,e) ½ cooling cycle and (b,d,f) ½ heating cycle.
Metals 10 00219 g012
Figure 13. Microstructure of Cu-13.7% Al-4.2% Ni alloy after (a,b) 400 and (c,d) 500 TCTs under the loading of 0.11 MPa, finished with the (a,c) ½ cooling cycle and (b,d) ½ heating cycle.
Metals 10 00219 g013
Figure 14. Microstructure of Cu-13.7% Al-4.2% Ni alloy after (a,b) 100; (c,d) 200; and (e,f) 300 TCTs under the loading of 0.26 MPa, finished with the (a,c,e) ½ cooling cycle and (b,d,f) ½ heating cycle.
Metals 10 00219 g014aMetals 10 00219 g014b
Figure 15. Microstructure of Cu-13.7% Al-4.2% Ni alloy after (a,b) 400 and (c,d) 500 TCTs under the loading of 0.26 MPa, finished with the (a,c) ½ cooling cycle and (b,d) ½ heating cycle.
Metals 10 00219 g015
Figure 16. Microstructure of Cu-13.7% Al-4.2% Ni alloy after (a,b) 100; (c,d) 200; and (e,f) 300 TCTs under the loading of 0.53 MPa, finished with the (a,c,e) ½ cooling cycle and (b,d,f) ½ heating cycle.
Metals 10 00219 g016
Figure 17. Microstructure of Cu-13.7% Al-4.2% Ni alloy after (a,b) 400 and (c,d) 500 TCTs under the loading of 0.53 MPa, finished with the (a,c) ½ cooling cycle and (b,d) ½ heating cycle.
Metals 10 00219 g017aMetals 10 00219 g017b
Figure 18. Vickers microhardness as function of the number of thermal cycles under loadings of 0.11, 0.26, and 0.53 MPa applied to the monocrystalline Cu-13.7% Al-4.2% Ni alloy.
Metals 10 00219 g018

