Article

Influence of Morphology of Intermetallic Particles on the Microstructure and Properties Evolution in Severely Deformed Al-Fe Alloys

1
Institute of Physics of Advanced Materials, Ufa State Aviation Technical University, 450008 Ufa, Russia
2
Laboratory of Mechanics of Advanced Bulk Nanomaterials for Innovative Engineering Applications, Saint Petersburg State University, 198504 Saint Petersburg, Russia
3
Groupe de Physique des Matériaux, Normandie Université, UNIROUEN, INSA Rouen, CNRS, 76000 Rouen, France
*
Author to whom correspondence should be addressed.
Metals 2021, 11(5), 815; https://doi.org/10.3390/met11050815
Submission received: 27 April 2021 / Revised: 11 May 2021 / Accepted: 14 May 2021 / Published: 17 May 2021
(This article belongs to the Special Issue Physical Metallurgy of Light Alloys and Composite Materials)

Abstract

:
This study focuses on the difference in microstructural features and physical properties of Al-2Fe and Al-4Fe alloys subjected to large plastic straining. The difference in the intermetallic particle morphology in the initial state is shown to be a key parameter influencing the particle and grain fragmentation process and, as a result, the properties of these two alloys. We demonstrate that the shape and average size of Al-Fe intermetallic particles provide stronger effect on the microstructure evolution during high pressure torsion (HPT) than their volume fraction. The formation of Fe supersaturated solid solution in Al in these two alloys during deformation is discussed in connection to the morphology of the intermetallic phase. The major microstructural attributes, responsible for the solid solution formation, are highlighted.

1. Introduction

Efforts to increase aluminum alloys’ strength without significant sacrifice in electrical conductivity is a current trend in industry. At the same time, the material used as an electrical conductor should demonstrate good thermal stability, which can be challenging in case of aluminum alloys [1]. With this in mind, finding ways to simultaneously improve mechanical and electrical properties is important. This combination is essential for creating new lightweight conductive materials for the electrical industry, and it can comprise ultrafine-grained Al-Fe alloys.
Aluminum alloys, particularly Al-Fe alloys, have several advantages as conductive materials. First, aluminum and iron are very common and cheap metals, which make them economically preferable. Second, the solubility of iron in aluminum for conventionally processed alloys, at temperatures ranging from room to near-melting, is close to zero [2]. This eliminates the major contribution to electrical resistance (i.e., solid solute atoms). The other contributions are grain boundaries, particles, and dislocation density [2].
Previous studies of Al-Fe alloys have found applications in conductive wires in automobiles [3,4,5,6] and as household cables. However, conventional approaches have reached the limit of increasing the mechanical strength and electrical conductivity of these materials. This is due to the absence of iron solubility in aluminum limiting the variations of precipitation morphology.
In conventionally produced aluminum alloys, there are usually two major intermetallic phases: Al13Fe4 and Al6Fe [7,8,9]. These phases precipitate as needle- and plate-like particles of relatively large size (microns to hundreds of microns). Conventional approaches, such as drawing/rolling etc., are not able to reduce these particles to the nanoscale, which would provide increased mechanical strength. Nanoscale particles could easily be formed from solid solution by simple heat treatment, but, as was mentioned earlier, formation of solid solution of Fe in Al is difficult to achieve via conventional methods.
Another possibility is to obtain a supersaturated solid solution thanks to the introduction of severe plastic deformation (SPD) [10,11]. As well as leading to grain size refinement, particle shredding, and an increase of defect density, SPD is also known for the formation of supersaturated solid solution in systems, which is considered very hard or nearly impossible [5,10].
A number of studies were conducted involving SPD of Al-Fe alloys. The concentration of Fe in a solid solution was increased up to 2 wt.% or more [10,11,12,13,14,15,16,17,18,19,20,21,22,23,24,25]. Such solid solutions may give an opportunity to homogeneously precipitate Al-Fe intermetallic particles in a way that was previously impossible.
The formation of strain-induced supersaturated solid solutions depends on a number of parameters. It was previously demonstrated that it could be influenced not only by the second-phase volume fraction [12], but also by the particle morphology [13]. Larger interphase areas naturally give more opportunities for solute atoms to migrate into the matrix. In addition, the second-phase morphology directly influences the fragmentation process during deformation. This effect was demonstrated in [13], where differences in the particle morphology before deformation affected microstructures and the mechanical and physical properties of the alloy after SPD. However, the underlying mechanisms were not deeply investigated, and to optimize the second-phase fragmentation process and the solid solution formation, one needs a systematic study of the influence of the primary as-cast microstructure (volume fraction, intermetallic phase, particle size, morphology, and distribution). To achieve this goal, the present study focuses on two alloys (Al-2Fe and Al-4Fe) with very different initial microstructures.

2. Materials and Methods

The samples of Al-2 wt.% Fe and Al-4 wt.% Fe alloys were prepared on the basis of A99 grade primary aluminum (GOST 11069-2001). Melting was carried out in a GRAFICARBO GF 1100 electric resistance furnace (Graficarbo S.R.L., Zorlesco, Italy) in a graphite crucible at 830 °C at Russia’s National University of Science and Technology “MISIS”. Ingots with a diameter of 20 mm and a length of 200 mm were obtained by casting into a graphite mold (at the 20 K/s cooling rate). The total amount of trace materials, including Si, did not exceed 0.1 wt.% for either of the alloys.
The cylinders were then sliced into discs (1.5 mm thick) using a wire-cutting APTA-120 machine (Delta-Test, Fryazino, Russia). HPT was carried out by placing the disc-shaped sample between two rotating anvils and applying high hydrostatic pressure to the sample, inducing a simple shear type deformation. In this study, discs of as-cast alloy were subjected to 20 revolutions of HPT performed at room temperature (RT) under a pressure of 6 GPa and a speed of 1 rpm in closed anvils. Such a processing route was chosen based on primary experiments showing that these parameters provide uniform microstructures [26,27] and, possibly, supersaturated solid solutions.
Microstructural, mechanical, and electrical data were collected from a specific location in the middle of the sample’s radius 5 mm, thus rendering it comparable with other research.
Transmission electron microscopes (TEMs, JEOL, Tokyo, Japan) using different analysis modes (i.e., BF bright-field analysis, SAED-selected area electron diffraction) and STEM (scanning transmission electron microscopy-JEOL ARM 200F) were employed for the microstructure analysis. Objects for TEM were prepared by twin-jet electro-polishing on a Struers Tenupol-5 (Copenhagen, Denmark) with 20% nitric acid in methanol below −20 °C at an operating voltage of 20 V. To ensure statistically reliable results, at least three foils were used for each state.
Scanning electron microscopy (SEM) was performed on a ThermoFisher Helios G4 PFIB DualBeam (Waltham, MA, USA).
X-ray diffraction (XRD) analysis was conducted with a Rigaku Ultima IV (Tokyo, Japan) diffractometer using CuKα radiation (30 kV and 20 mA). Values of lattice parameter a, coherent scattering domain (CSD), size D, and elastic microdistortion level <ε2>1/2 were calculated via the Rietveld refinement method using MAUD software (v.2.97, University of Trento, Trento, Italy) [28]. To calculate dislocation density (ρ), Equation (2) was used:
ρ = 2 3 ε 2 1 / 2 D × b
where b = a 2 / 2 is the Burgers vector for FCC metals, and D is the coherent scattering domain [29].
Tensile tests were carried out in triplicate using an Instron 5982 (Instron, Norwood, MA, USA) machine at RT and a strain rate of 10−3 s−1. Yield stress (σ0.2), ultimate tensile stress (σUTS), and ductility (δ), measured as elongation-to-failure, were obtained from the small samples with gauge dimensions of 1.0 mm × 1.0 mm × 4.0 mm, prepared by wire-cutting. The maximum error for sample dimensions was 0.02 mm.
Electrical conductivity (ω) was determined with a ±2% error, using the eddy current method [30]. Electrical conductivity relative to annealed copper (International Annealed Copper Standard, %IACS) was calculated according to Equation (3):
I A C S = ω A l ω C u × 100 %
where ωAl is the measured electrical conductivity of aluminum alloy, and ωCu is the conductivity of annealed chemically pure copper (58 MS/m).

3. Results

3.1. Microstructure Evolution of the Alloys during HPT

3.1.1. SEM Analyses

Figure 1a,b shows the microstructure of the as-cast Al-2Fe and Al-4Fe samples. For the Al-2Fe alloy (Figure 1a), the microstructure consists of the net/web of eutectic phase particles, surrounding the dendritic aluminum phase. This could also be described as the ellipsoidal-shape areas of the aluminum phase, divided by aluminum-intermetallic conglomerates. The volume fraction of the intermetallic phase in the Al-2Fe alloy is 4.6%.
The microstructure of the Al-4Fe alloy is different from that of the Al-2Fe alloy. The amount of the intermetallic phase is higher than 7.7%. It comprises very coarse plate-like particles with a thickness/width up to 10 microns, and a length up to 50 microns (Figure 1b). In addition to these coarse particles, the microstructure also consists of smaller fractions of particles distributed between them. Smaller particles in the Al-4Fe alloy form a structure, similar to Al-2Fe alloy, only these particles are larger and are located sparsely in comparison.
The intermetallic particles in the alloys are the mix of the Al6Fe and Al13Fe4 phases [21], formed during the crystallization [31,32,33,34,35,36].
It can be seen that the Al-2Fe alloy has a casting microstructure very similar to that in Al-RE (rare earth) alloys [12,13] and other Al-Fe alloys [20,21,22,23].
Figure 1c,d show the microstructure formed in alloys during HPT. While the intermetallic particles in the Al-2Fe alloy are pretty small and hardly distinguishable (Figure 1c), the size of these particles in Al-4Fe after HPT varies from a fraction to tens of microns.
Since the intermetallic particles in the Al-2Fe alloy exhibit a narrow size distribution, we can affirm that the fragmentation of the particles occurred homogeneously. On the contrary, the refinement of the coarse particles in the Al-4Fe alloy was incomplete, as fragments of large particles are still exhibited in the microstructure (Figure 1d) and the particle size distribution is large.

3.1.2. XRD Analyses

XRD profiles corresponding to the as-cast and HPT-processed states of Al-2Fe and Al-4Fe alloys are presented in Figure 2, where peaks of different phases are indexed. For the phase analysis we have used the reference crystal structures corresponding to Al (FCC, a = b = c = 4.049 Å), Al6Fe (orthorhombic, a = 6.46 Å, b = 7.44 Å, c = 8.78 Å), and Al13Fe4 (monoclinic, a = 15.49 Å, b = 8.08 Å, c = 12.47 Å, β=107.69°), where a, b, c are the lattice parameters. Thanks to the analysis of the XRD profiles we have revealed the phases with the crystal structure close to stoichiometry of the reference phases. Interestingly, the as-cast specimen of Al-2Fe alloy mainly contains a stable Al13Fe4 phase, while in the as-cast Al-4Fe alloy a metastable Al6Fe phase is dominant. This can be explained by the chemical composition of the as-cast materials: it is known that, depending on the alloy composition and cooling rate, different types of Al-Fe intermetallic phases can be formed [36].
After HPT the opposite trend is observed: Al6Fe and Al13Fe4 phases are formed in the Al-2Fe and Al-4Fe alloys, respectively, while the peaks of precursor particles disappear.
Revealing possible scenarios for phase transformations in Al-Fe alloys during HPT is beyond the scope of this study and will be reported later. The results of qualitative phase analysis and structural parameters evaluation are thus presented.
The precise quantitative phase analysis is complicated by texture effects especially in the coarse-grained states where statistically limited number of grains are oriented in the reflection position with respect to the scattering vector. Nevertheless, the XRD profile of Al-4Fe in the as-cast state demonstrates visibly the highest intensity of all major peaks related to the precipitate phase among all studied cases. It indicates that this state is characterized with the maximal volume fraction of precipitates.
HPT resulted in a noticeable shift in the positions of Al peaks to higher diffraction angles in both alloys. The calculated lattice parameter for Al matrix reduced by 0.078% for the Al-2Fe alloy and 0.035% for the Al-4Fe alloy (which is well consistent with the data reported in [36]). This indicates to a process of strain-induced dissolution of Fe in Al [36], which is more intensive in Al-2Fe. Besides, Al-2Fe has a smaller coherent domain size and higher dislocation density: about 90 nm and 2.2 × 10¹⁴ m−2, respectively, versus 200 nm and 2.9 × 10¹³ m−2 for the Al-4Fe alloy. From the presented data it follows that HPT-induced structure refinement, defect accumulation, and Fe dissolution are more pronounced in Al-2Fe compared to Al-4Fe despite the difference in the alloying element concentration.

3.1.3. TEM and STEM Analyses

Figure 3a,b shows the bright-field TEM images, comparing the microstructures of the Al-2Fe and Al-4Fe alloys samples after HPT, respectively. To the right from BF images in Figure 3 the selected area diffraction (SAED) patterns obtained from a region of 1.5 µm size, are presented. The number of particles, contained within the aperture area of the SAED patterns, is quite small, thus the number of the reflections from particles is small as well. However, the number of reflections was just enough to index phases.
Analysis of the SAED patterns showed the presence of the Al and Al13Fe4 phase in both Al-2Fe and Al-4Fe alloys after HPT. Peaks that could be attributed to the Al6Fe phase could not be observed in TEM. This is probably due to the fact, that the amount of Al6Fe phase is quite small. Besides, overlap between the Al6Fe (131), Al6Fe (222) and Al6Fe (132) peaks with Al (111) and Al (200) peaks makes them hardly distinguishable.
The number of reflections on the Al-4Fe SAED patterns is lower due to the larger mean grain size.
The microstructure of the Al-2Fe alloy after HPT is composed of equiaxed, ultrafine grains with a mean grain size ~125 ± 10 nm. Figure 3b shows that the microstructure of the Al-4Fe alloy after HPT exhibits the equiaxed grains with a mean size ~340 ± 20 nm. The microstructures of both alloys exhibit grains with high-angles misorientation.
Bright-field TEM does not provide sufficient information for the size, distribution, and morphology of the intermetallic particles. Intermetallic particles in these alloys contains a high amount of Fe, which should provide a clear contrast between the matrix and the particles in the z-contrast mode (HAADF) of STEM [24].
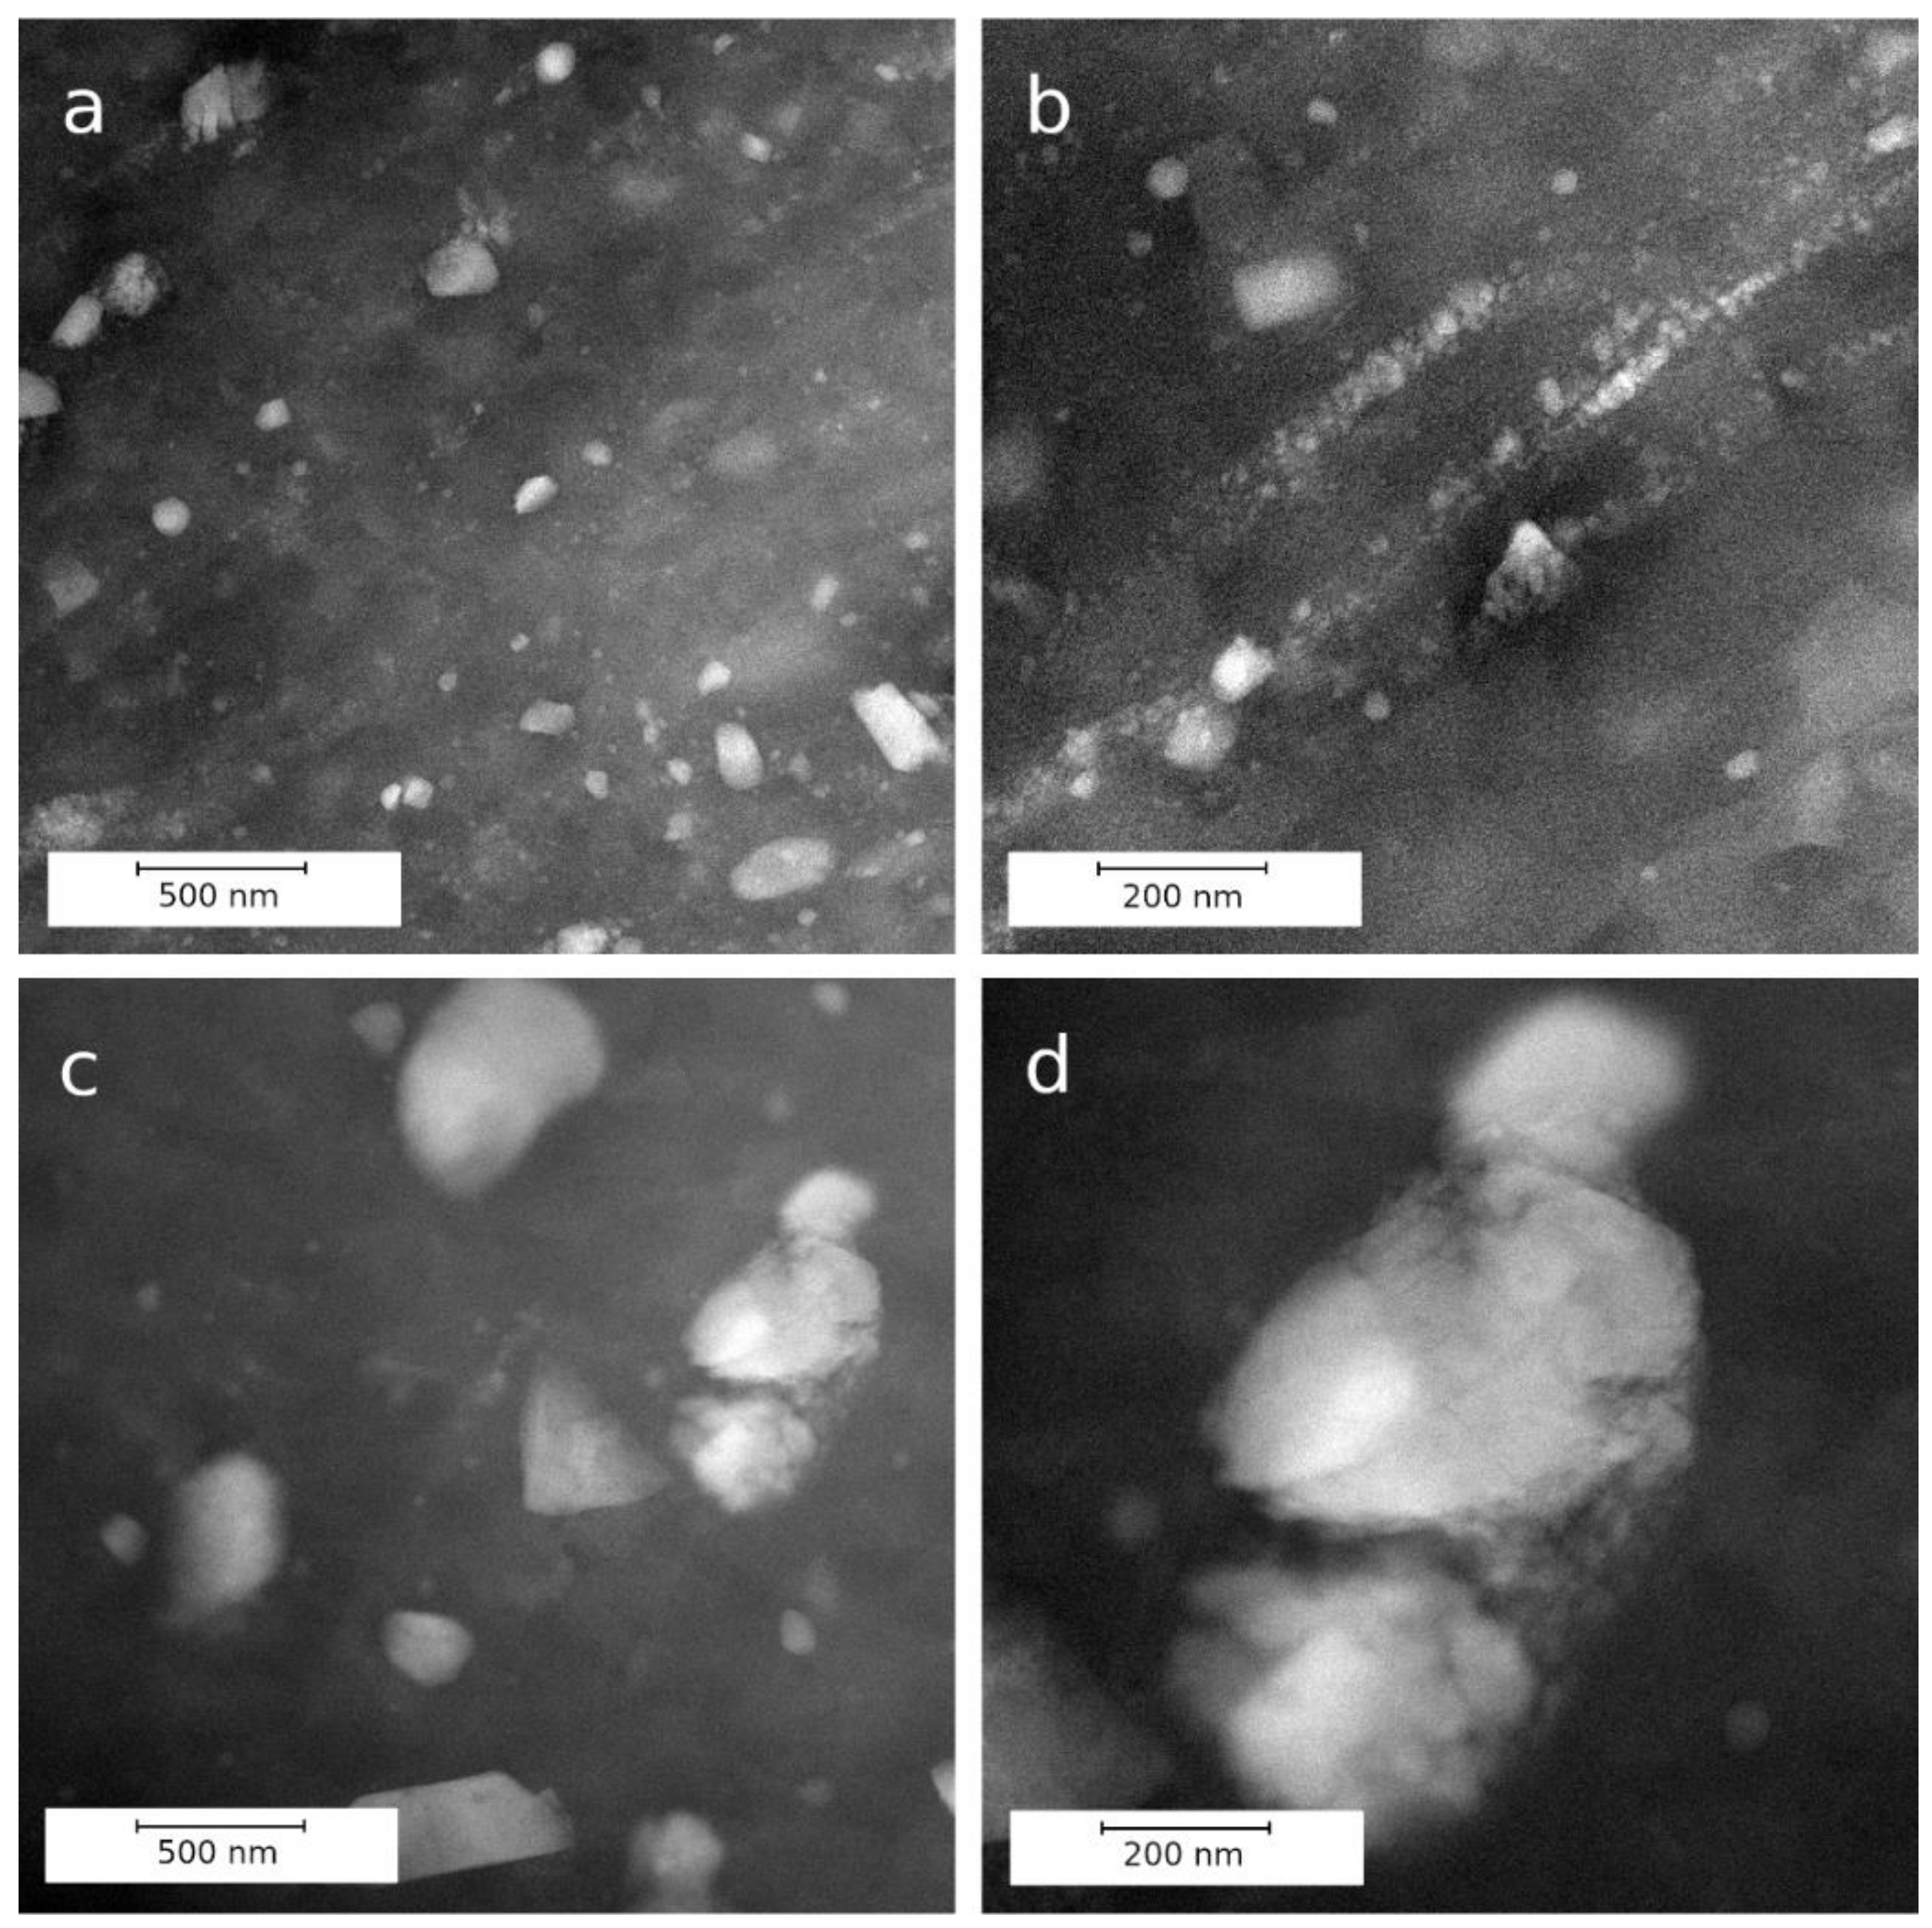
Figure 4 shows STEM images of Al-2Fe (Figure 4a,b) and Al-4Fe (Figure 4c,d) alloys after HPT. According to these data, the mean size of particles in the Al-4Fe alloy is significantly larger than in the Al-2Fe alloy (277 ± 16 nm versus 78 ± 4 nm). The difference in grain size of these two alloys (Figure 3a,b) is very likely to be connected with the difference in particle size since the deformation conditions for both alloys were similar.
The origin of differences in the two alloys, subjected to the same deformation treatment, probably lies in the particle fragmentation process. In the Al-2Fe alloy, linear arrays of fine particles can be observed (Figure 4b). Such arrays are former intermetallic particles, fragmented and elongated during the deformation.
The particle fragmentation in the Al-4Fe alloy after HPT is different. During the observation, no similar arrays could be observed. Instead, “clouds” of finer particles surrounding coarse ones were exhibited (Figure 4d). This means that the amount of deformation induced by HPT was probably not large enough to cause cracks throughout the whole particle. Instead, small particles are fragmented from the surface region, while the core of the coarse particle remains intact. Thus, even after HPT, the coarse particles are still present, and fine particles are distributed non-uniformly. All this contributes to a reduced impact on the structure evolution during the HPT in comparison to the Al-2Fe alloy, as it will be discussed later

3.2. Physical and Mechanical Properties

Table 1 presents the results of the study of electrical and mechanical properties of Al-2Fe and Al-4Fe alloys in as-cast condition and after HPT.
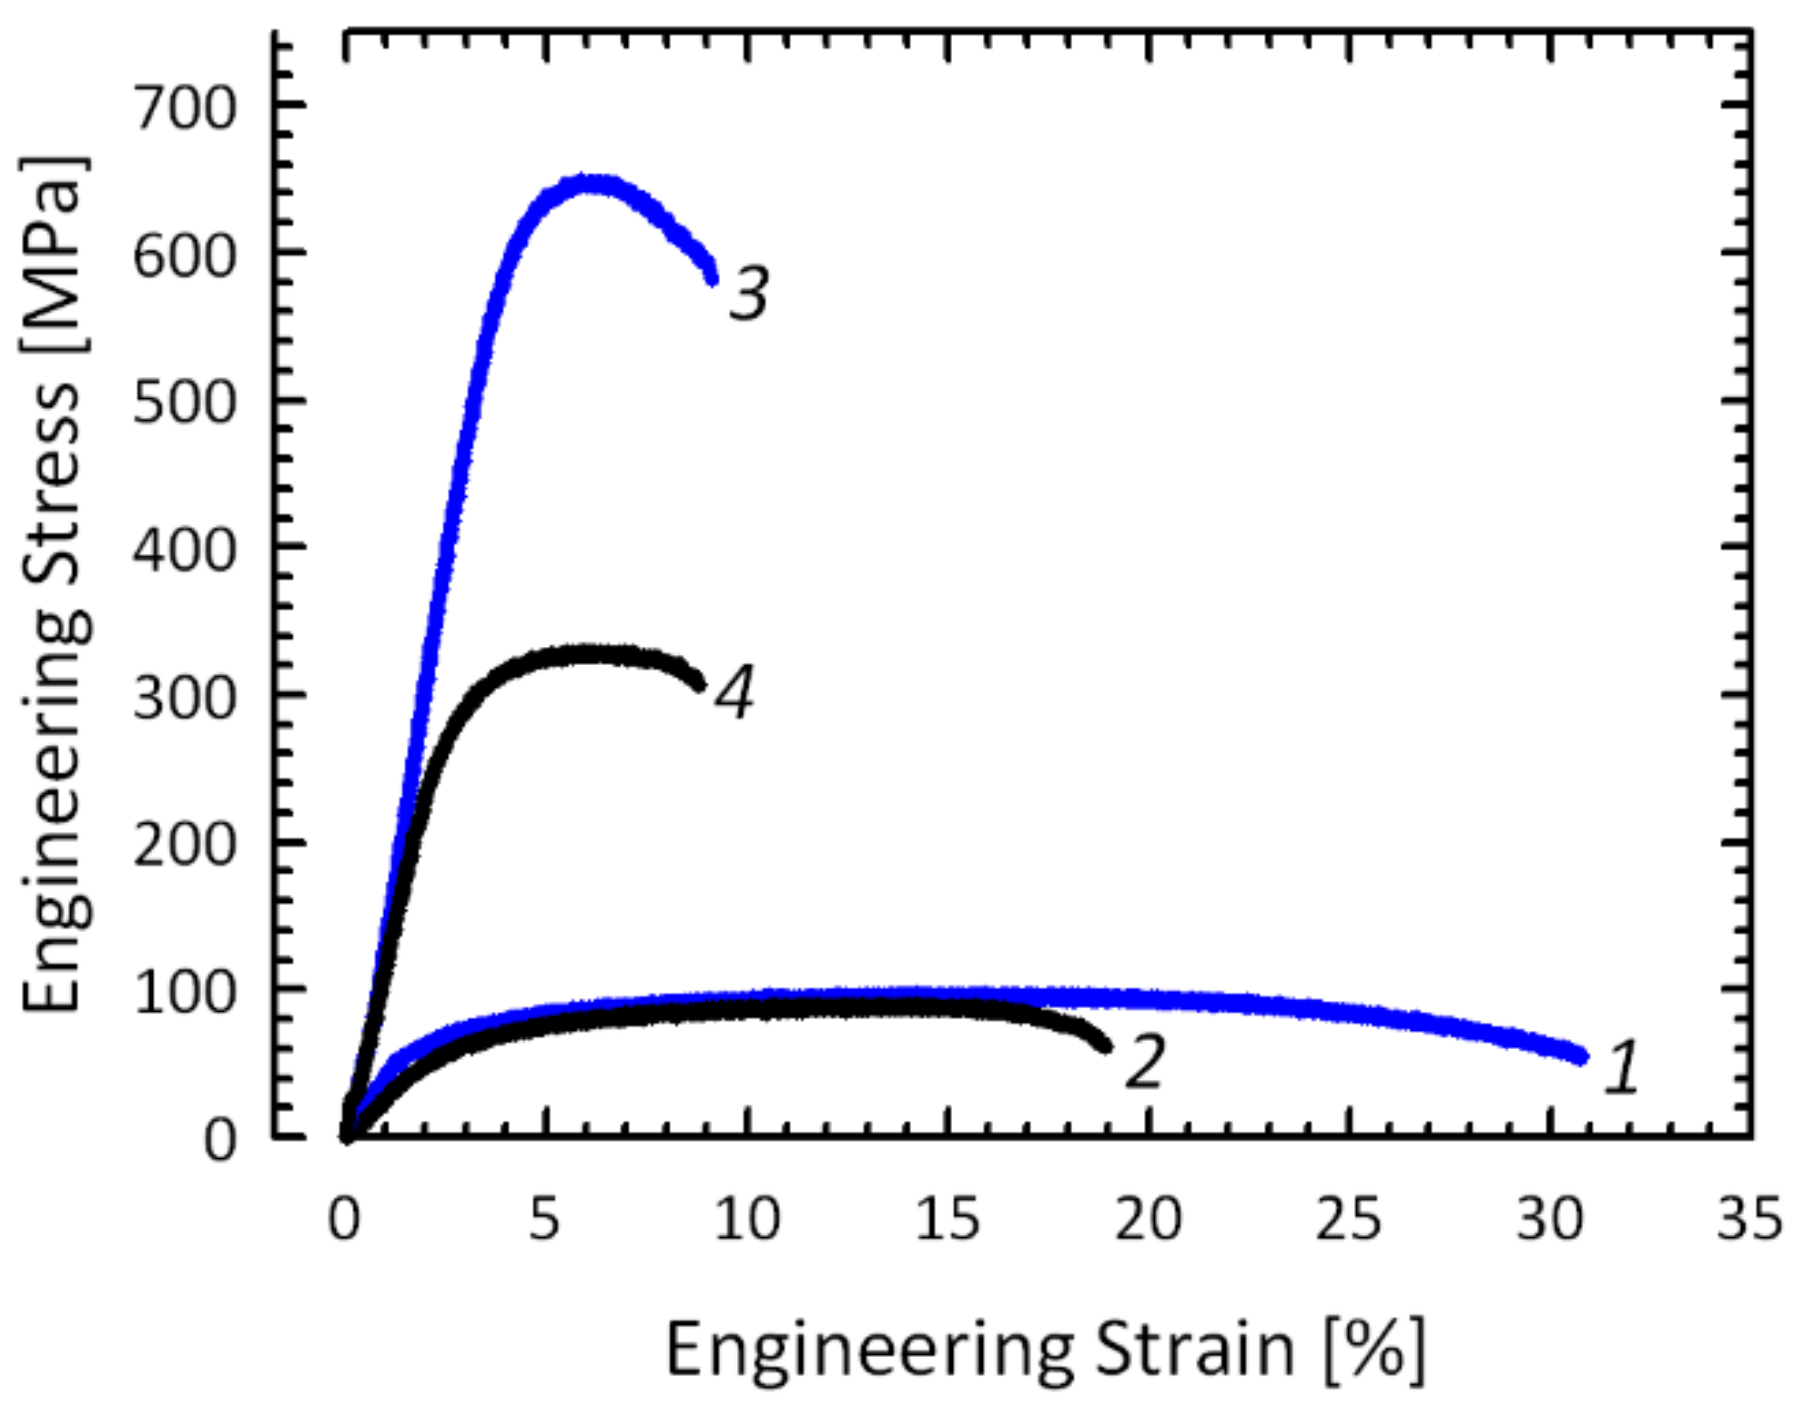
Despite the difference in the iron content and the intermetallic particle morphology in the initial state, both alloys have a comparable ultimate tensile strength (~90 MPa). The presence of coarse intermetallic particles in the Al-4Fe alloy embrittles it Al-4Fe alloy elongation to failure is 8% lower than that of the Al-2Fe alloy in the initial state (Figure 5).
The level of the electrical conductivity is higher for the Al-2Fe alloy in the as-cast state. This is due to the lower total amount of iron in the alloy, and due to the absence of coarse intermetallic particles, contrary to the Al-4Fe alloy.
As a result of microstructure refinement during HPT, the level of the ultimate tensile strength increases to ~650 MPa for the Al-2Fe alloy and to ~340 MPa for the Al-4Fe alloy. The increase in tensile strength is not as big for the Al-4Fe alloy as for the Al-2Fe alloy due to the larger intermetallic particle size and a nonuniform distribution of nanoscaled particles (Section 3.1.3). HPT also leads to a decrease in the ductility of the Al-2Fe and the Al-4Fe alloys. It should be noted, however, that after HPT both alloys still maintain a relatively high level of elongation to failure: ~5% for the Al-2Fe alloy and ~8% for the Al-4Fe alloy. Because the fragmentation of the intermetallic particles in the Al-4Fe alloy is not as complete as in the Al-2Fe alloy, the Al-4Fe alloy samples still contain areas free of the finely dispersed second phase particles. These areas improve the elongation to failure for the Al-4Fe alloy in comparison to the Al-2Fe alloy.
The electrical conductivity after HPT decreases for both Al-2Fe and Al-4Fe alloys. The decrease in the electrical conductivity is 15.4 %IACS for the Al-2Fe alloy and 6.2 %IACS for the Al-4Fe alloy (Table 1). The electrical conductivity is affected, among other things, by the presence of the finely dispersed second phase particles and the size of the grains. It was observed in Section 3.1.3 that Al-4Fe alloy after HPT has a higher mean grain size and also contains areas, free of the fine intermetallic particles, while Al-2Fe alloy after HPT is characterized by lower mean grain size and uniformly distributed fine second-phase particles. Such difference in microstructure may explain the difference in the level of electrical conductivity.
The electrical conductivity is known to be particularly sensitive to the presence of the solid solution, so the sharp decrease of it in the Al-2Fe alloy can be the indirect sign of the solid solution formation. This will be discussed in the detail in the Discussion section.

4. Discussion

4.1. Particle Morphology

The SEM data show that the particle fragmentation process is not the same in Al-2Fe and Al-4Fe alloys, presumably due to the morphology of the intermetallic particles in the as-cast state. The difference in the alloys’ properties could be explained by the difference in the fragmentation process. To evaluate this difference, we take the overall interphase area parameter total surface of the “aluminum–particle” interface.
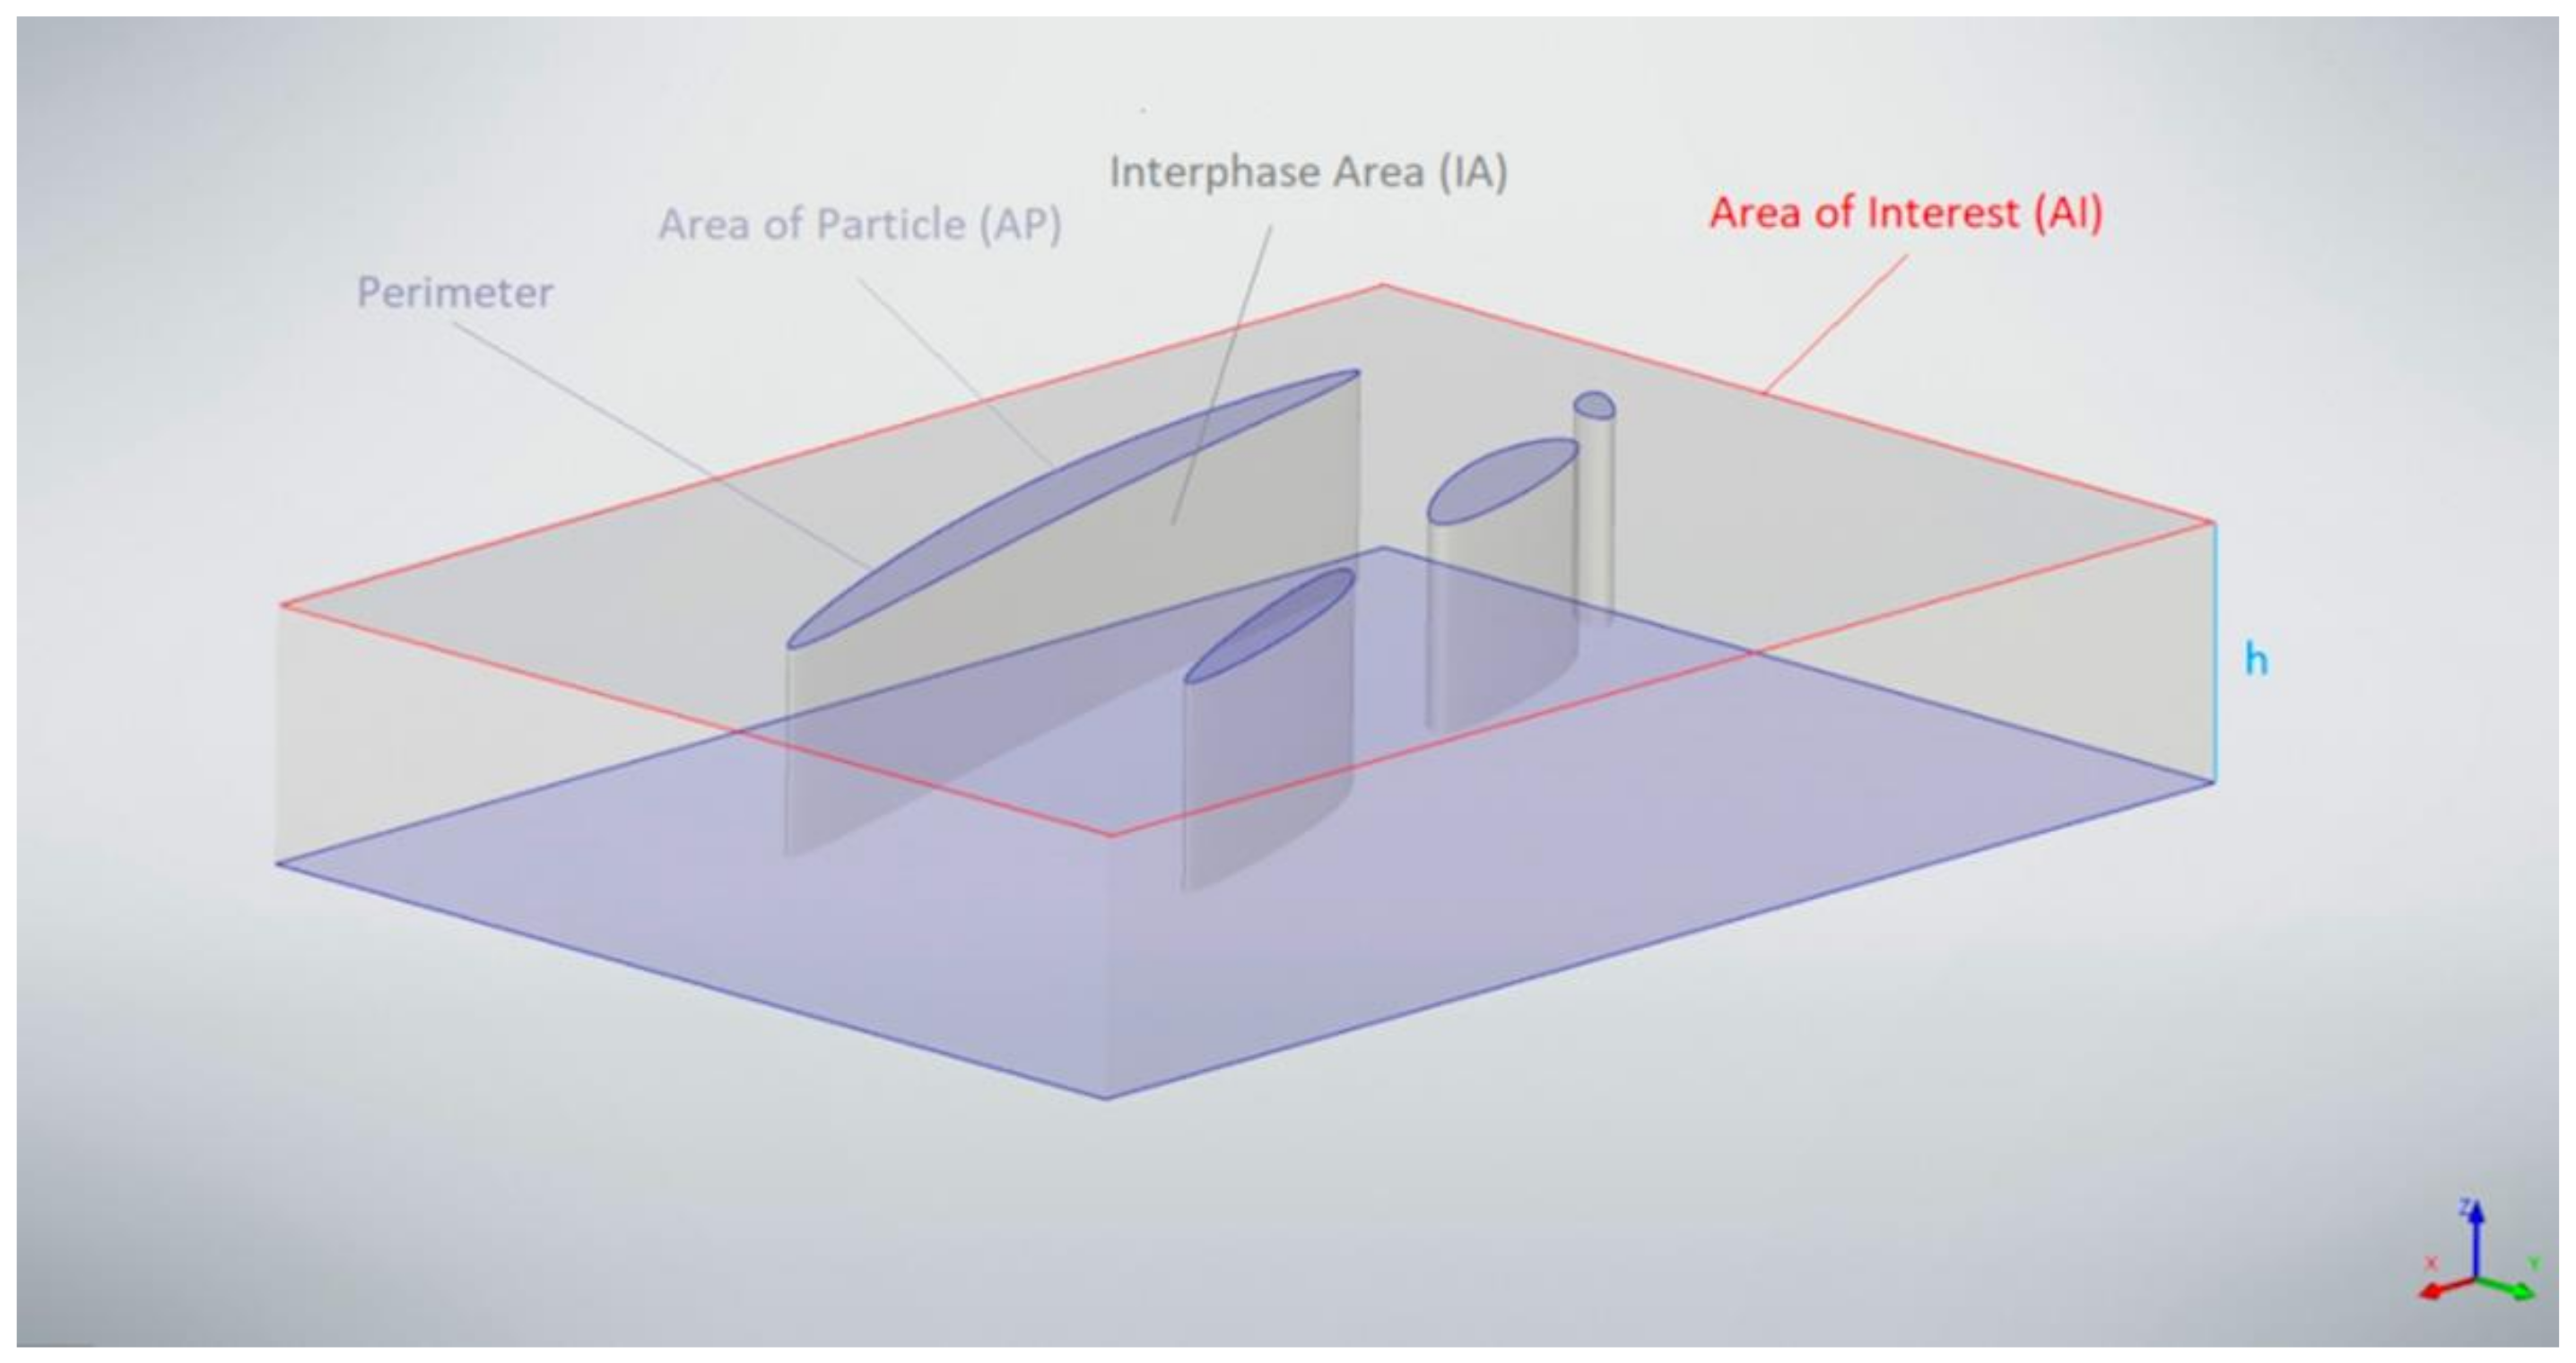
Corresponding calculations and measurements have been undertaken in order to find the overall interphase area between aluminum and intermetallic particles. The following assumption has been made: all particles have the shape of perpendicular prisms with a base of AP (area of particle) and a height of h (Figure 6).
The area of interest (AI) is calculated via the markers on the SEM images. For statistical purposes, acquisition of data has been performed over multiple SEM images for each of the alloys.
The interphase area (IA) is calculated as a perimeter (P) multiplied by the h:
I A = P × h
Relative interphase area (RIA) is calculated as the interphase area divided by the studied volume (area of interest multiplied by the h):
R I A = I A A I × h = P A I
Table 2 represents the results of the statistical analysis of the data, collected from the Al-Fe alloys SEM images. The average particle size (area) in the as-cast state is smaller in the Al-2Fe alloy 0.26 µm2 against 2.55 µm2 in the Al-4Fe alloy.
HPT leads to particle refinement, and thus to a decrease of their average area of 13 times for the Al-2Fe and of 10 times for the Al-4Fe alloy.
The average perimeter of particles is bigger in the Al-4Fe alloy in both the as-cast (0.49 µm against 0.26 µm) and HPT (1.24 µm against 0.49 µm) conditions, indicating the presence of the coarser particles in Al-4Fe both before and after deformation. It can be seen (Table 2) that the total perimeter of the particles increases by about two times for the Al-2Fe alloy after HPT, and decreases by about two times for the Al-4Fe alloy. For us, the perimeter-to-area ratio (PtA) is of greater importance, since it considers both of these parameters.
The perimeter-to-area ratio (PtA) can be more informative, since it combines these two parameters. The value of the PtA is the same for the alloys in the as-cast state, but changes drastically after HPT from 1 to 24.5 µm−1 for the Al-2Fe alloy and from 1.1 to 4.96 µm−1 for the Al-4Fe alloy. The higher the value of the PtA, the smaller the particles in the studied volume. Hence, the particle refinement in the Al-4Fe alloy is five times less intensive than in the Al-2Fe alloy.
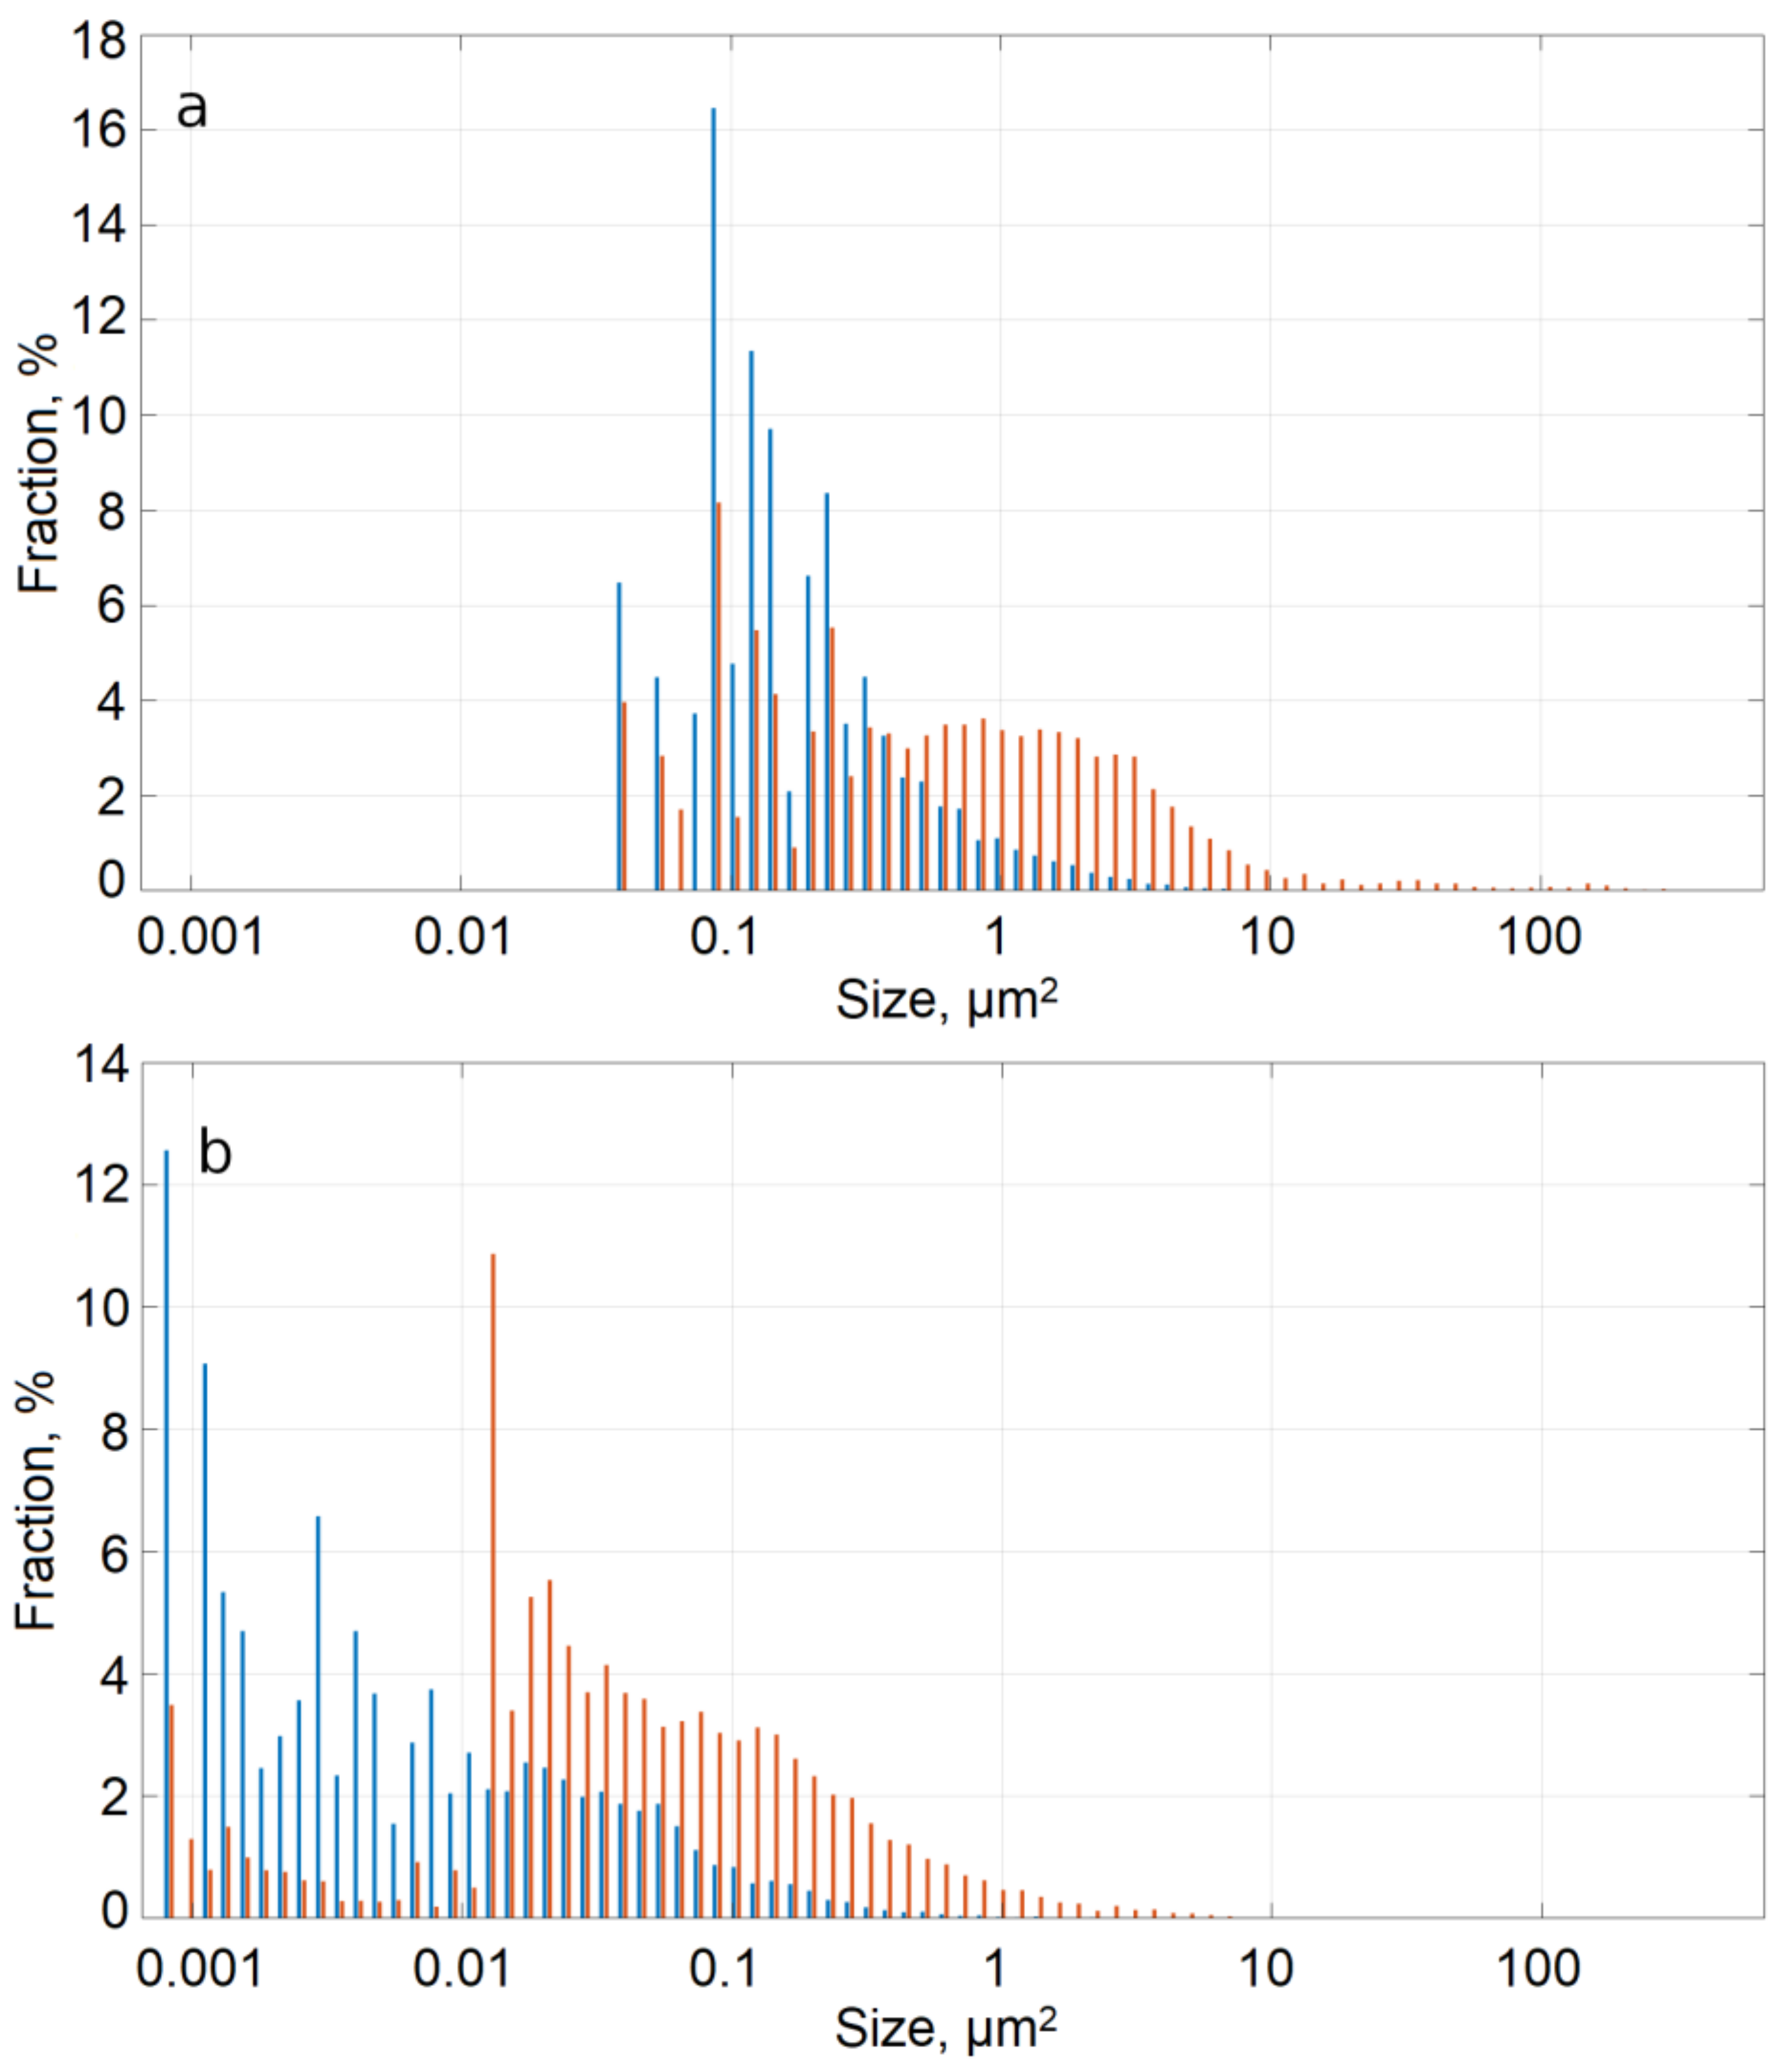
Figure 7 shows the area distribution of particles in Al-Fe alloys depending on their size. In the as-cast state in the Al-2Fe alloy, the area distribution is close to normal, while the Al-4Fe alloy plot has a plateau, pointing to the presence of coarser particles. After HPT, both curves for the Al-2Fe and Al-4Fe alloys become skewed left, showing the decrease in the average area size of the particles. While the distribution of the particle size is characterized by a single peak, for the Al-2Fe alloy, the curve for the Al-4Fe alloy exhibits a second peak, signifying bimodal distribution.
The RIA parameter shows how many interphase boundaries are presented at a given volume. The higher the value of RIA, the higher the density of the interphase boundaries. In the as-cast state, RIA in the Al-2Fe alloy is higher than in the Al-4Fe alloy 0.396 µm−1 against 0.234 µm−1. The difference is even more notable after HPT—the RIA in the HPT state in the Al-2Fe alloy is more than three times greater than in the Al-4Fe alloy.
The RIA parameter and the level of electrical conductivity in the as-cast Al-2Fe alloy are higher than in the Al-4Fe alloy. This means that in the as-cast condition, the surface amount of the interphase boundaries is not as significant as the total amount of the intermetallic phase. During the HPT, however, we observe a much more intense change of properties (Section 3.2), making the interphase area (and, thus, the morphology of the intermetallic phase in the as-cast state) more significant for the physical properties than its total amount.

4.2. Formation of the Solid Solution

The differences in mechanical strength and electrical conductivity are linked to different structural parameters, such as dislocation density, grain size, size and density of particles and so on.
Among all, the negative effect of solid solution on the conductivity is much higher than that of the other crystal lattice defects [1]. A sharp decrease in the electrical conductivity after the HPT (Table 1) can indirectly indicate the strain-induced formation of supersaturated solid solution of Fe in Al.
The lattice parameters of the Al-2Fe and the Al-4Fe alloys in the as-cast condition are close to that of pure Al. It allows suggesting that nearly all Fe atoms are stored within the intermetallic phases which is consistent with the results presented in [25,36]. After HPT, the lattice parameter of both Al-2Fe and Al-4Fe alloys decreases. This change can be associated with the dissolution of Fe in Al [16,25,36]. Al-4Fe alloy, where the decrease of the lattice parameter is smaller than in Al-2Fe alloy, exhibits a tendency to form solid solution with a smaller concentration of Fe.
The discussion in Section 4.1 supports the HPT-induced dissolution of Fe in Al. Since Fe could only migrate to Al from intermetallic particles, and the RIA parameter after HPT is 3 times higher in the Al-2Fe alloy than in the Al-4Fe alloy, the microstructure of the as-cast Al-2Fe alloy provides wider opportunities for Fe to diffuse into the Al matrix by the higher density of interphase boundaries.
The difference in the lattice parameter, electrical conductivity, and density of the interphase boundaries before and after HPT in both alloys indicates more intensive formation of the strain-induced solid solution of Fe in Al in Al-2Fe alloy. Since intermetallic particles are still present after the HPT, we can safely assume that the concentration of Fe in the supersaturated solid solution is far less than 1 at. % (which is the total amount of Fe in Al-2Fe alloy). The solid solution is formed due to the partial dissolution of intermetallic particles. This observation is consistent with the previous studies, focused on the intermetallic phase transformation in Al-Fe alloys [14,15,25,36].
Higher dissolution rate of Fe in Al matrix in Al-2Fe alloy than in Al-4Fe alloy during HPT proves that the total amount of alloying element is not as important for the formation of the solid solution as the morphology of the intermetallic phase in the initial state.

5. Conclusions

This study shows that in Al-Fe alloys the morphology of the intermetallic phase in the cast-state has a notable effect on the structural evolution during 20 revolutions of HPT. This feature can be even more important, than the concentration of Fe in the alloy. The initial size and dispersity of the particles, formed during crystallization, their volume fraction, and, respectively, the length of the interphase boundaries plays an important role in forming mechanical and electrical properties by HPT. The following specific conclusions are drawn from the results presented in this study:
  • The initial microstructure of the Al-2Fe and the Al-4Fe alloys is composed of the mixture of Al and eutectic Al6Fe and Al13Fe4 phases. In the Al-2Fe alloy the intermetallic particles are shaped as plates/needles with the length up to 150 nm, while Al-4Fe alloy contains, among the fine plate-like particles, coarser particles with the size up to tens of microns.
  • As a result of HPT, the intermetallic particles become fragmented and redistributed in the bulk of the Al-2Fe and Al-4Fe alloys. Intermetallic particles in the Al-2Fe alloy are in the comparable size range and are uniformly distributed within the Al matrix, while in the Al-4Fe alloy the size of the particles after HPT varies from tens of nanometers to few microns, and their distribution is bimodal.
  • Al-4Fe alloy after HPT is characterized by a larger grain size than Al-2Fe alloy. Intermetallic particles morphology in Al-2Fe alloy created the possibility for the solid solution formation, thus inhibiting the grain boundary migration. In addition, in Al-4Fe alloy intermetallic particles were distributed heterogeneously, and thus created regions in material’s volume where the movement of the grain boundaries was not inhibited.
  • HPT processing leads to an increase of the UTS to ~650 MPa for the Al-2Fe alloy and to the decrease of its electrical conductivity to 40.4 %IACS. The changes in the Al-4Fe alloy have a similar character but are less pronounced due to the different morphology of intermetallic particles in the as-cast state.
  • We show that Al-2Fe alloy has a uniform size distribution of the intermetallic particles after HPT because of the different particle morphology in the initial state. In particularly, the uniformity of the particle size distribution is achieved due to the higher, relative to the Al-4Fe alloy, overall interphase area in the as-cast state.
  • Supersaturated solid solution of the Fe in Al is formed by HPT in Al-2Fe alloy. Al-4Fe alloy, due to lower density of interphase boundaries in the as-cast state, has fewer opportunities for the Fe to diffuse into the Al matrix, so the solid solution forms it with a significantly lower Fe concentration.
  • Predesigned morphology in low-solubility alloys, coupled with deformation techniques, could be effectively used as a tool for the production of high-strength materials with a unique set of properties.

Author Contributions

Conceptualization, M.M. and A.M.; methodology, X.S.; software, N.E.; writing—original draft preparation, A.M.; writing—review and editing, N.E., M.M. and X.S.; visualization, E.M. All authors have read and agreed to the published version of the manuscript.

Funding

This research was funded by Russian Science Foundation, Grant number 20-79-10133.

Institutional Review Board Statement

Not applicable.

Informed Consent Statement

Not applicable.

Data Availability Statement

Not applicable.

Acknowledgments

Authors are grateful to the personnel of the research and technology Joint Research Center, Nanotech, Ufa State Aviation Technical University, for their assistance with instrumental analysis.

Conflicts of Interest

The authors declare no conflict of interest.

References

  1. Murashkin, M.Y.; Sabirov, I.; Sauvage, X.; Valiev, R.Z. Nanostructured Al and Cu alloys with superior strength and electrical conductivity. J. Mater. Sci. 2016, 51, 33–49. [Google Scholar] [CrossRef]
  2. Polmear, I.J. Light Alloys-From Traditional Alloys to Nanocrystalls, 4th ed.; Monash University: Melbourne, Australia, 2006. [Google Scholar]
  3. Jablonski, M.; Knych, T.; Smyrak, B. Effect of iron addition to aluminium on the structure and properties of wires used for electrical purposes. In Proceedings of the 5th International Conference on Light Metals Technology, Luneburg, Germany, 19–22 July 2011; Trans Tech Publications Ltd.: Luneburg, Germany, 2011; pp. 459–462. [Google Scholar]
  4. Jablonski, M.; Knych, T.; Smyrak, B. New Aluminium Alloys for Electrical Wires of Fine Diameter for Automotive Industry. Arch. Metall. Mater. 2009, 54, 671–676. [Google Scholar]
  5. Sekia, S.; Susai, K.; Takamura, S. Development of aluminium wire for automotive harnesses. In Proceedings of the 60th Interna-tional Wire & Cable Symposium (IWCS), Charlotte Convention Center, Charlotte, NC, USA, 7–9 November 2011; pp. 445–449. [Google Scholar]
  6. Horikoshi, T.; Koruda, H.; Shimizu, M.; Aoyama, S. Development of Aluminium Alloy Conductor with High Electrical Con-ductivity and Controlled Tensile Strength and Elongation. Hitachi Cable Rev. 2006, 25, 31–34. [Google Scholar]
  7. Nasu, S.; Gonser, U.; Preston, R.S. Defects and phases of iron in aluminium. J. Phys. Colloq. 1980, 41, 385–386. [Google Scholar] [CrossRef]
  8. Shabashov, V.A.; Brodova, I.G.; Mukoseev, A.G.; Sagaradze, V.V.; Litvinov, A.V. Mossbauer study of the dissolution of iron aluminides under strong cold deformation, Proceedings of the Russian Academy of Sciences. Phys. Ser. 2005, 10, 1459–1464. [Google Scholar]
  9. Shabashov, V.A.; Brodova, I.G.; Mukoseev, A.G.; Sagaradze, V.V.; Litvinov, A.V. Structural transformations in the Al-Fe sys-tem under intense plastic deformation. Phys. Met. Metall. 2005, 4, 66–67. [Google Scholar]
  10. Senkov, O.N.; Valiev, R.Z.; Pirzada, M.D.S.; Liu, J.; Froes, F.H. A new approach to hardening of Al-Fe alloys. Synthesis of Lightweight Metals: In proceedings of the 128th Annual Meeting & Exhibition of The Minerals, Metals & Materials Society. San Diego, CA, USA, 28 February–4 March 1999; pp. 129–134. [Google Scholar]
  11. Stolyarov, V.V.; Brodova, I.G.; Yablonskikh, T.I.; Lapovok, R. The effect of backpressure on the structure and mechanical properties of the Al-5 wt % Fe alloy produced by equal-channel angular pressing. Phys. Met. Metallogr. 2005, 100, 182–191. [Google Scholar]
  12. Medvedev, A.E.; Murashkin, M.Y.; Enikeev, N.A.; Valiev, R.Z.; Hodgson, P.D.; Lapovok, R. Enhancement of mechanical and electrical properties of Al-RE alloys by optimizing rare-earth concentration and thermo-mechanical treatment. J. Alloys Compd. 2018, 745, 696–704. [Google Scholar] [CrossRef]
  13. Medvedev, A.E.; Murashkin, M.Y.; Enikeev, N.A.; Bikmukhametov, I.; Valiev, R.Z.; Hodgson, P.D.; Lapovok, R. Effect of the eutectic Al-(Ce,La) phase morphology on microstructure, mechanical properties, electrical conductivity and heat resistance of Al-4.5(Ce,La) alloy after SPD and subsequent annealing. J. Alloys Compd. 2019, 796, 321–330. [Google Scholar] [CrossRef]
  14. Fadeeva, V.; Leonov, A. Amorphization and crystallization of Al-Fe alloys by mechanical alloying. Mater. Sci. Eng. A 1996, 206, 90–94. [Google Scholar] [CrossRef]
  15. Fadeeva, V.; Leonov, A.V.; Khodina, L. Metastable Phases in Mechanically Alloyed Al-Fe System. Mater. Sci. Forum 1995, 179–181, 397–402. [Google Scholar] [CrossRef]
  16. Mukhopadhyay, D.K.; Suryanarayana, C.; Froes, F.H.S. Structural evolution in mechanically alloyed Al-Fe powders. Met. Mater. Trans. A 1995, 26, 1939–1946. [Google Scholar] [CrossRef]
  17. Senkov, O.N.; Froes, F.H.; Stolyarov, V.V.; Valiev, R.Z.; Liu, J. Non-equilibrium structures in aluminium-iron alloys subjected to severe plastic deformation. In Proceedings of the 1997 5th International Conference on Advanced Particulate Materials and Processes, West Palm Beach, FL, USA, 7–9 April 1997; pp. 95–102. [Google Scholar]
  18. Senkov, O.; Froes, F.; Stolyarov, V.; Valiev, R.; Liu, J. Microstructure of Aluminum-Iron Alloys Subjected to Severe Plastic Deformation. Scr. Mater. 1998, 38, 1511–1516. [Google Scholar] [CrossRef]
  19. Stolyarov, V.; Lapovok, R.; Brodova, I.; Thomson, P. Ultrafine-grained Al–5 wt.% Fe alloy processed by ECAP with backpressure. Mater. Sci. Eng. A 2003, 357, 159–167. [Google Scholar] [CrossRef]
  20. Cubero-Sesin, J.M.; Horita, Z. Strengthening of Al through addition of Fe and by processing with high-pressure torsion. J. Mater. Sci. 2012, 48, 4713–4722. [Google Scholar] [CrossRef]
  21. Cubero-Sesin, J.M.; Horita, Z. Age Hardening in Ultrafine-Grained Al-2PctFe Alloy Processed by High-Pressure Torsion. Metall. Mater. Trans. A Phys. Metall. Mater. Sci. 2015, 46, 2614–2624. [Google Scholar] [CrossRef] [Green Version]
  22. Cubero-Sesin, J.M.; In, H.; Arita, M.; Iwaoka, H.; Horita, Z. High-pressure torsion for fabrication of high-strength and high-electrical conductivity Al micro-wires. In Special Section: Ultrafinegrained Materials, 19th ed.; Mathaudhu, S.N., Estrin, Y., Horita, Z., Lavernia, E., Liao, X.Z., Lu, L., Wei, Q., Wilde, G., Zhu, Y.T., Eds.; Kluwer Academic Publishers: Amsterdam, The Netherlands, 2014; pp. 6550–6557. [Google Scholar]
  23. Cubero-Sesin, J.M.; Watanabe, M.; Arita, M.; Horita, Z.J. Aging and precipitation behavior in supersaturated Al-2%Fe alloy produced by high-pressure torsion. In Proceedings of the 14th International Conference on Aluminium Alloys, ICAA 2014, Trondheim, Norway, 15–19 June 2014; Trans Tech Publications Ltd.: Trondheim, Norway, 2014; pp. 766–771. [Google Scholar]
  24. Duchaussoy, A.; Sauvage, X.; Edalati, K.; Horita, Z.; Renou, G.; Deschamps, A.; De Geuser, F. Structure and mechanical behavior of ultrafine-grained aluminum-iron alloy stabilized by nanoscaled intermetallic particles. Acta Mater. 2019, 167, 89–102. [Google Scholar] [CrossRef] [Green Version]
  25. Medvedev, A.E.; Murashkin, M.Y.; Enikeev, N.A.; Valiev, R.Z.; Hodgson, P.D.; Lapovok, R. Optimization of Strength-Electrical Conductivity Properties in Al-2Fe Alloy by Severe Plastic Deformation and Heat Treatment. Adv. Eng. Mater. 2017, 20, 1700867. [Google Scholar] [CrossRef]
  26. Valiev, R.Z.; Aleksandrov, I.V. Bulk Nanostructural Metallic Materials; Akademkniga: Moscow, Russia, 2007. [Google Scholar]
  27. Vorhauer, A.; Pippan, R. On the homogeneity of deformation by high pressure torsion. Scr. Mater. 2004, 51, 921–925. [Google Scholar] [CrossRef]
  28. Lutterotti, L.; Matthies, R.; Wenk, H.R.; Schultz, A.; Richardson, J. Combined texture and structure analysis of deformed lime-stone from time-of-flight neutron diffraction spectra. J. Appl. Phys. 1997, 81, 594–600. [Google Scholar] [CrossRef]
  29. Williamson, G.K.; Smallman, R.E., III. Dislocation densities in some annealed and cold-worked metals from measurements on the X-ray debye-scherrer spectrum. Philos. Mag. 1956, 1, 34–46. [Google Scholar] [CrossRef]
  30. ASTM E1004-09. Standard Test Method for Determing Electrical Conductivity Using The Electromagnetic (Eddy-Current) Method; ASTM International: West Conshohocken, PA, USA, 2009. [Google Scholar]
  31. Saller, B.D.; Hu, T.; Ma, K.; Kurmanaeva, L.; Lavernia, E.J.; Schoenung, J.M. A comparative analysis of solubility, segregation, and phase formation in atomized and cryomilled Al–Fe alloy powders. J. Mater. Sci. 2015, 50, 4683–4697. [Google Scholar] [CrossRef]
  32. Kim, D.H.; Cantor, B. Structure and decomposition behaviour of rapidly solidified Al-Fe alloys. J. Mater. Sci. 1994, 29, 2884–2892. [Google Scholar] [CrossRef]
  33. Nayak, S.; Wollgarten, M.; Banhart, J.; Pabi, S.; Murty, B. Nanocomposites and an extremely hard nanocrystalline intermetallic of Al–Fe alloys prepared by mechanical alloying. Mater. Sci. Eng. A 2010, 527, 2370–2378. [Google Scholar] [CrossRef]
  34. Sasaki, H.; Kita, K.; Nagahora, J.; Inoue, A. Nanostructures and mechanical properties of bulk Al-Fe alloys prepared by elec-tron-beam deposition. Mater. Trans. 2001, 42, 1561–1565. [Google Scholar] [CrossRef] [Green Version]
  35. Sasaki, T.; Ohkubo, T.; Hono, K. Microstructure and mechanical properties of bulk nanocrystalline Al–Fe alloy processed by mechanical alloying and spark plasma sintering. Acta Mater. 2009, 57, 3529–3538. [Google Scholar] [CrossRef]
  36. Shabashov, V.A.; Brodova, I.G.; Mukoseev, A.G.; Sagaradze, V.V.; Litvinov, A.V. Deformation-induced phase transformations in the Al–Fe system under intensive plastic deformation. J. Phys. Condens. Matter 2007, 19. [Google Scholar] [CrossRef]
Figure 1. Backscattered SEM images of the samples of the Al-2Fe and Al-4FE alloys: (a) Al-2Fe as-cast, (b) Al-4Fe as-cast, (c) Al-2Fe after HPT, (d) Al-4Fe after HPT.
Metals 11 00815 g001
Figure 2. XRD profiles of the Al-2Fe and Al-4Fe alloys in the as-cast state and after HPT.
Metals 11 00815 g002
Figure 3. TEM bright-field (left) and SAED patterns (right) from the samples of the Al-2Fe (a) and Al-4Fe (b) after HPT. Indexed reflections are highlighted for the Al and Al13Fe4 phases with the corresponding color.
Metals 11 00815 g003
Figure 4. STEM HAADF images, obtained from the samples of the Al-2Fe alloy (a,b) and Al-4Fe alloy (c,d) HPT.
Metals 11 00815 g004
Figure 5. Engineering stress-strain curves obtained by tensile tests of Al-Fe alloys in the as-cast state (1: Al-2Fe, 2: Al-4Fe) and after HPT (3: Al-2Fe, 4: Al-4Fe). For the sake of clarity, only one curve is provided for each state.
Metals 11 00815 g005
Figure 6. Particle morphology model describing the terms necessary for the calculations.
Metals 11 00815 g006
Figure 7. Particle area distribution: (a) in as-cast state, (b) after HPT. Histogram for Al-2Fe alloy is marked by blue color, for Al-4Fe alloy is marked by orange color. µm2.
Metals 11 00815 g007
Table 1. Mechanical and electrical properties of Al-Fe alloys in the as-cast state and after HPT.
AlloyStateσ0.2, MPaσUTS, MPaδ, %ω, MS/mIACS, %
Al-2FeAs-cast55 ± 6100 ± 226 ± 232.4 ± 0.255.8 ± 0.3
HPT564 ± 12649 ± 65.0 ± 0.323.4 ± 0.740.4 ± 1.7
Al-4FeAs-cast70 ± 688 ± 718 ± 231.2 ± 0.254.2 ± 1.2
HPT270 ± 19340 ± 228.0 ± 0.527.8 ± 0.148.0 ± 0.6
Table 2. Analysis data of Al-Fe alloys’ intermetallic particles, obtained from the SEM images.
AlloyStateAverage Particle Area, µm2Average Particle Perimeter, µmPerimeter-to-Area Ratio, µm−1RIA, µm−1
Al-2FeAs-cast0.26 ± 0.0020.26 ± 0.0021.000.396
HPT0.02 ± 0.0010.49 ± 0.00624.501.466
Al-4FeAs-cast2.55 ± 0.1602.85 ± 0.1801.100.234
HPT0.25 ± 0.0401.24 ± 0.0204.960.460
Publisher’s Note: MDPI stays neutral with regard to jurisdictional claims in published maps and institutional affiliations.