
Al Alloys and Casting Processes for Induction Motor Applications in Battery-Powered Electric Vehicles: A Review

Abstract
:1. Introduction
2. Classification of Aluminum Alloys
2.1. Al-Cu Alloys
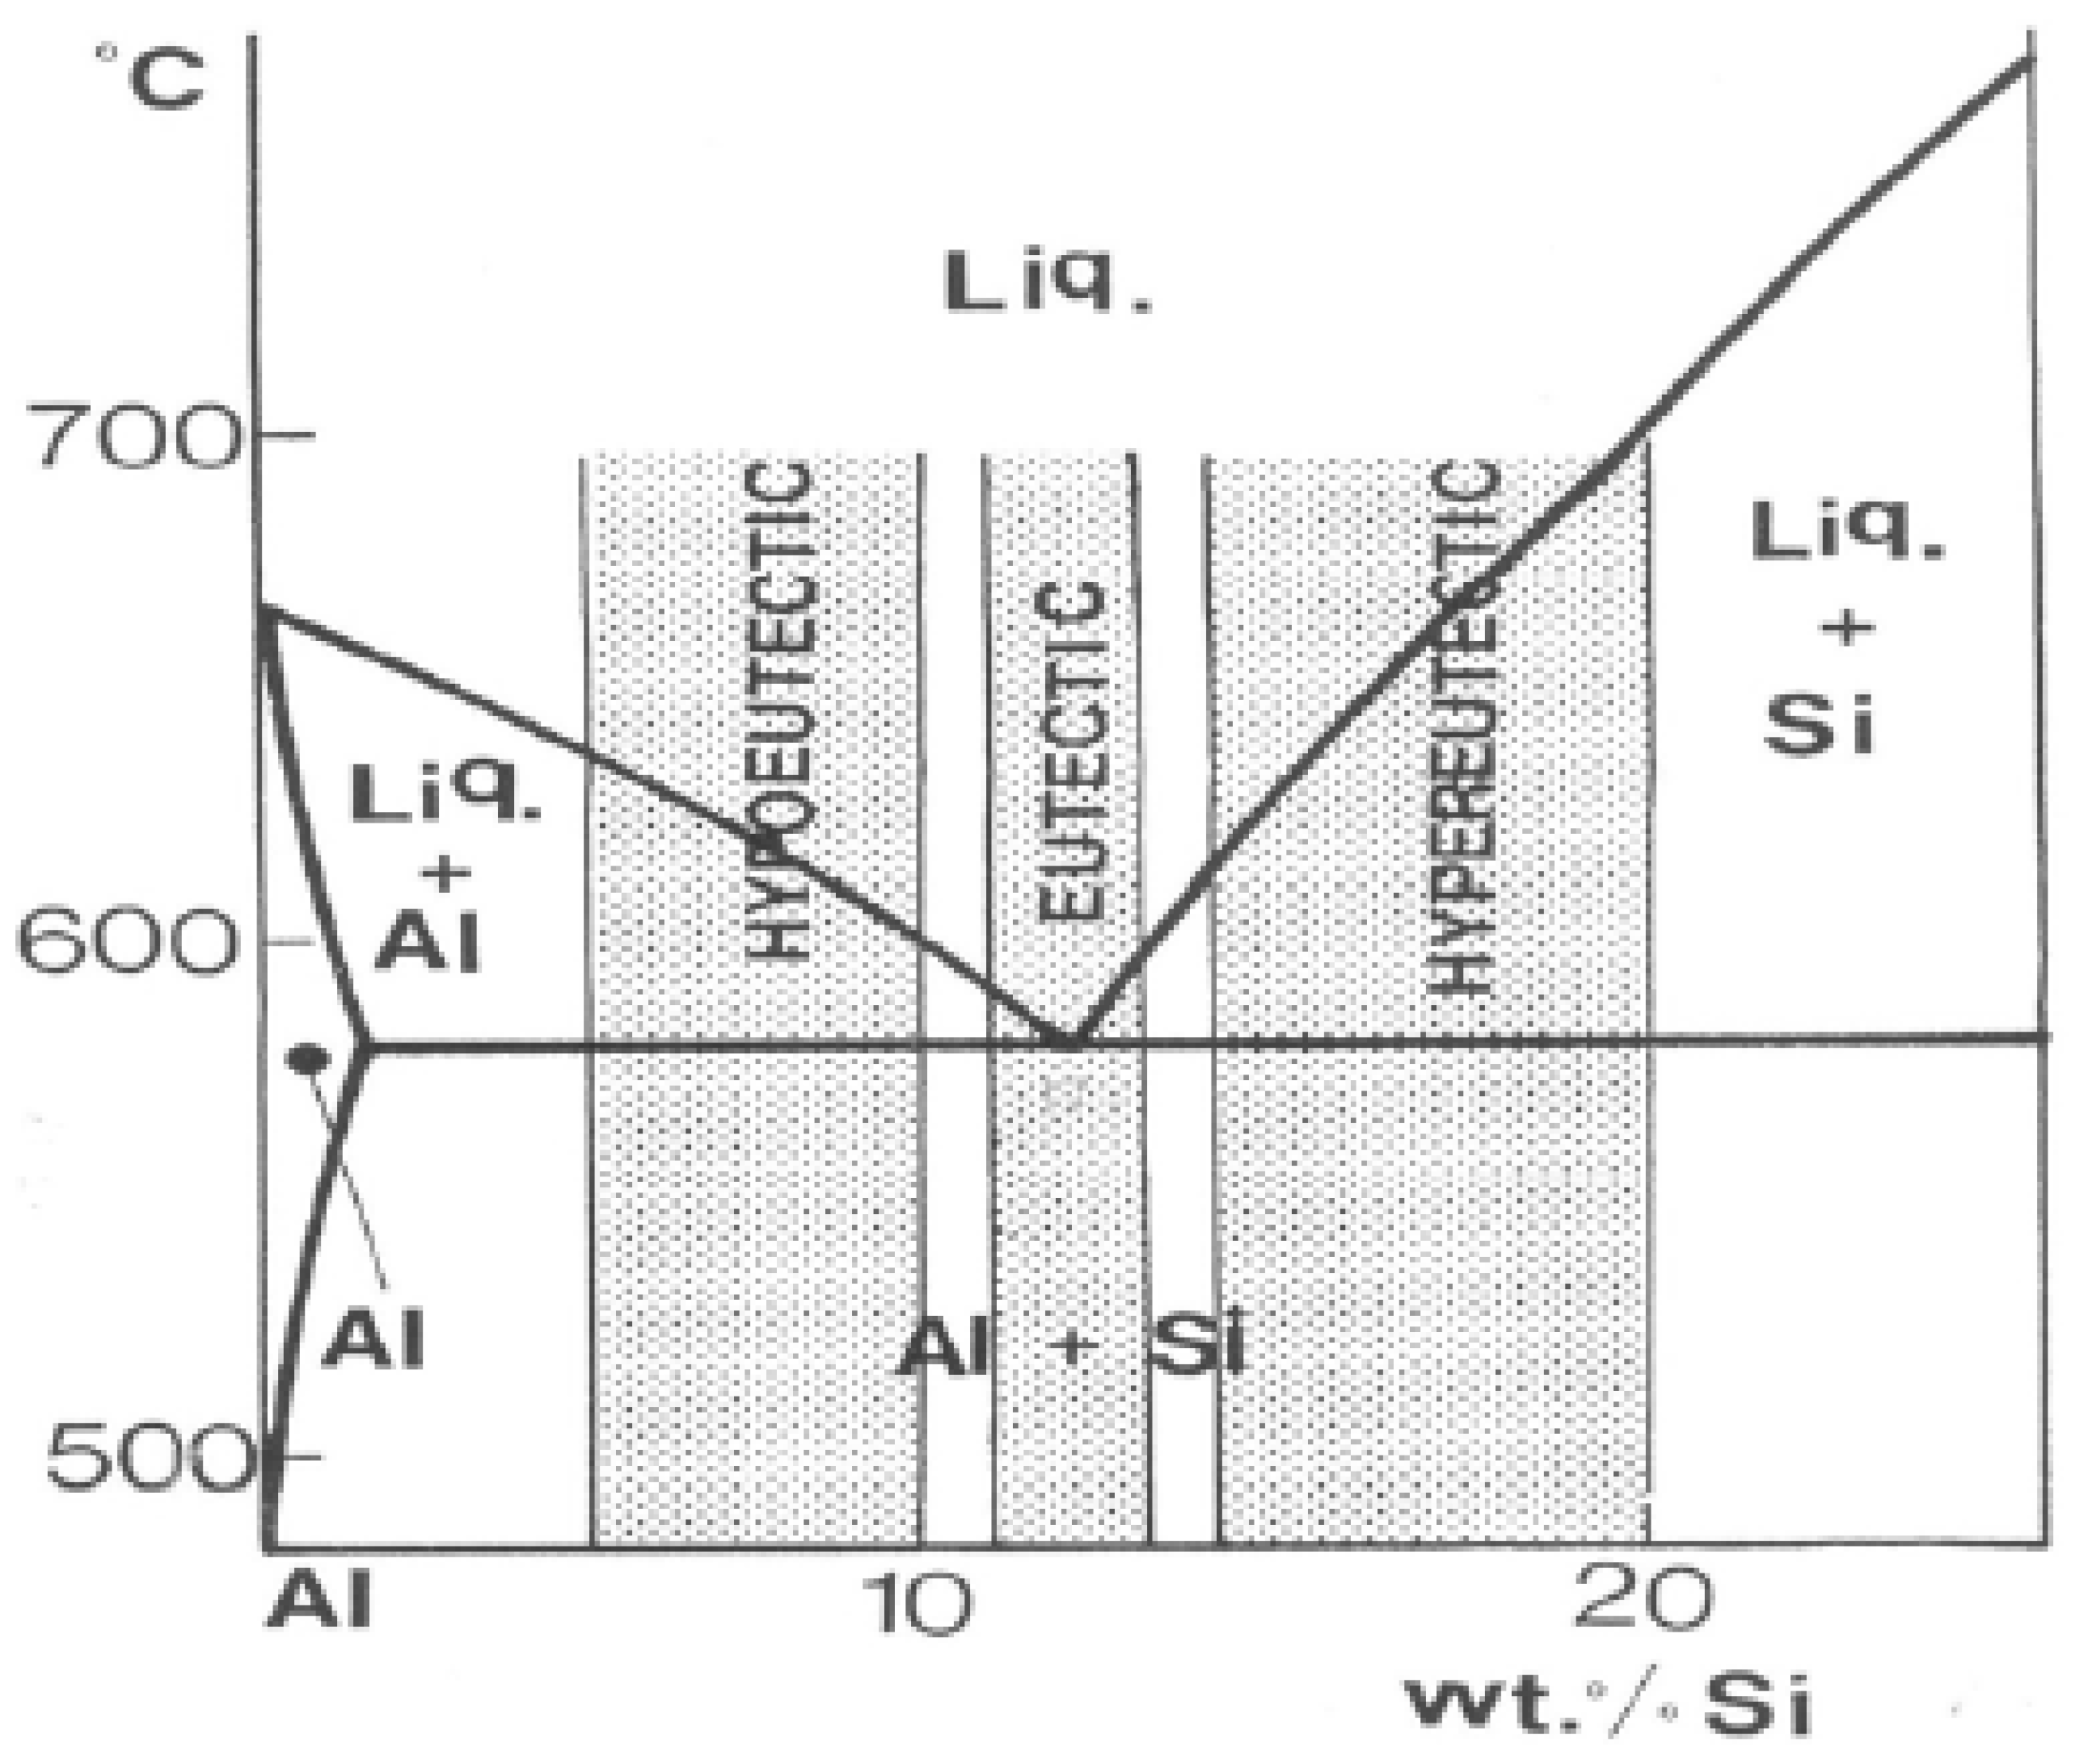
2.2. Al-Cu-Si Alloys
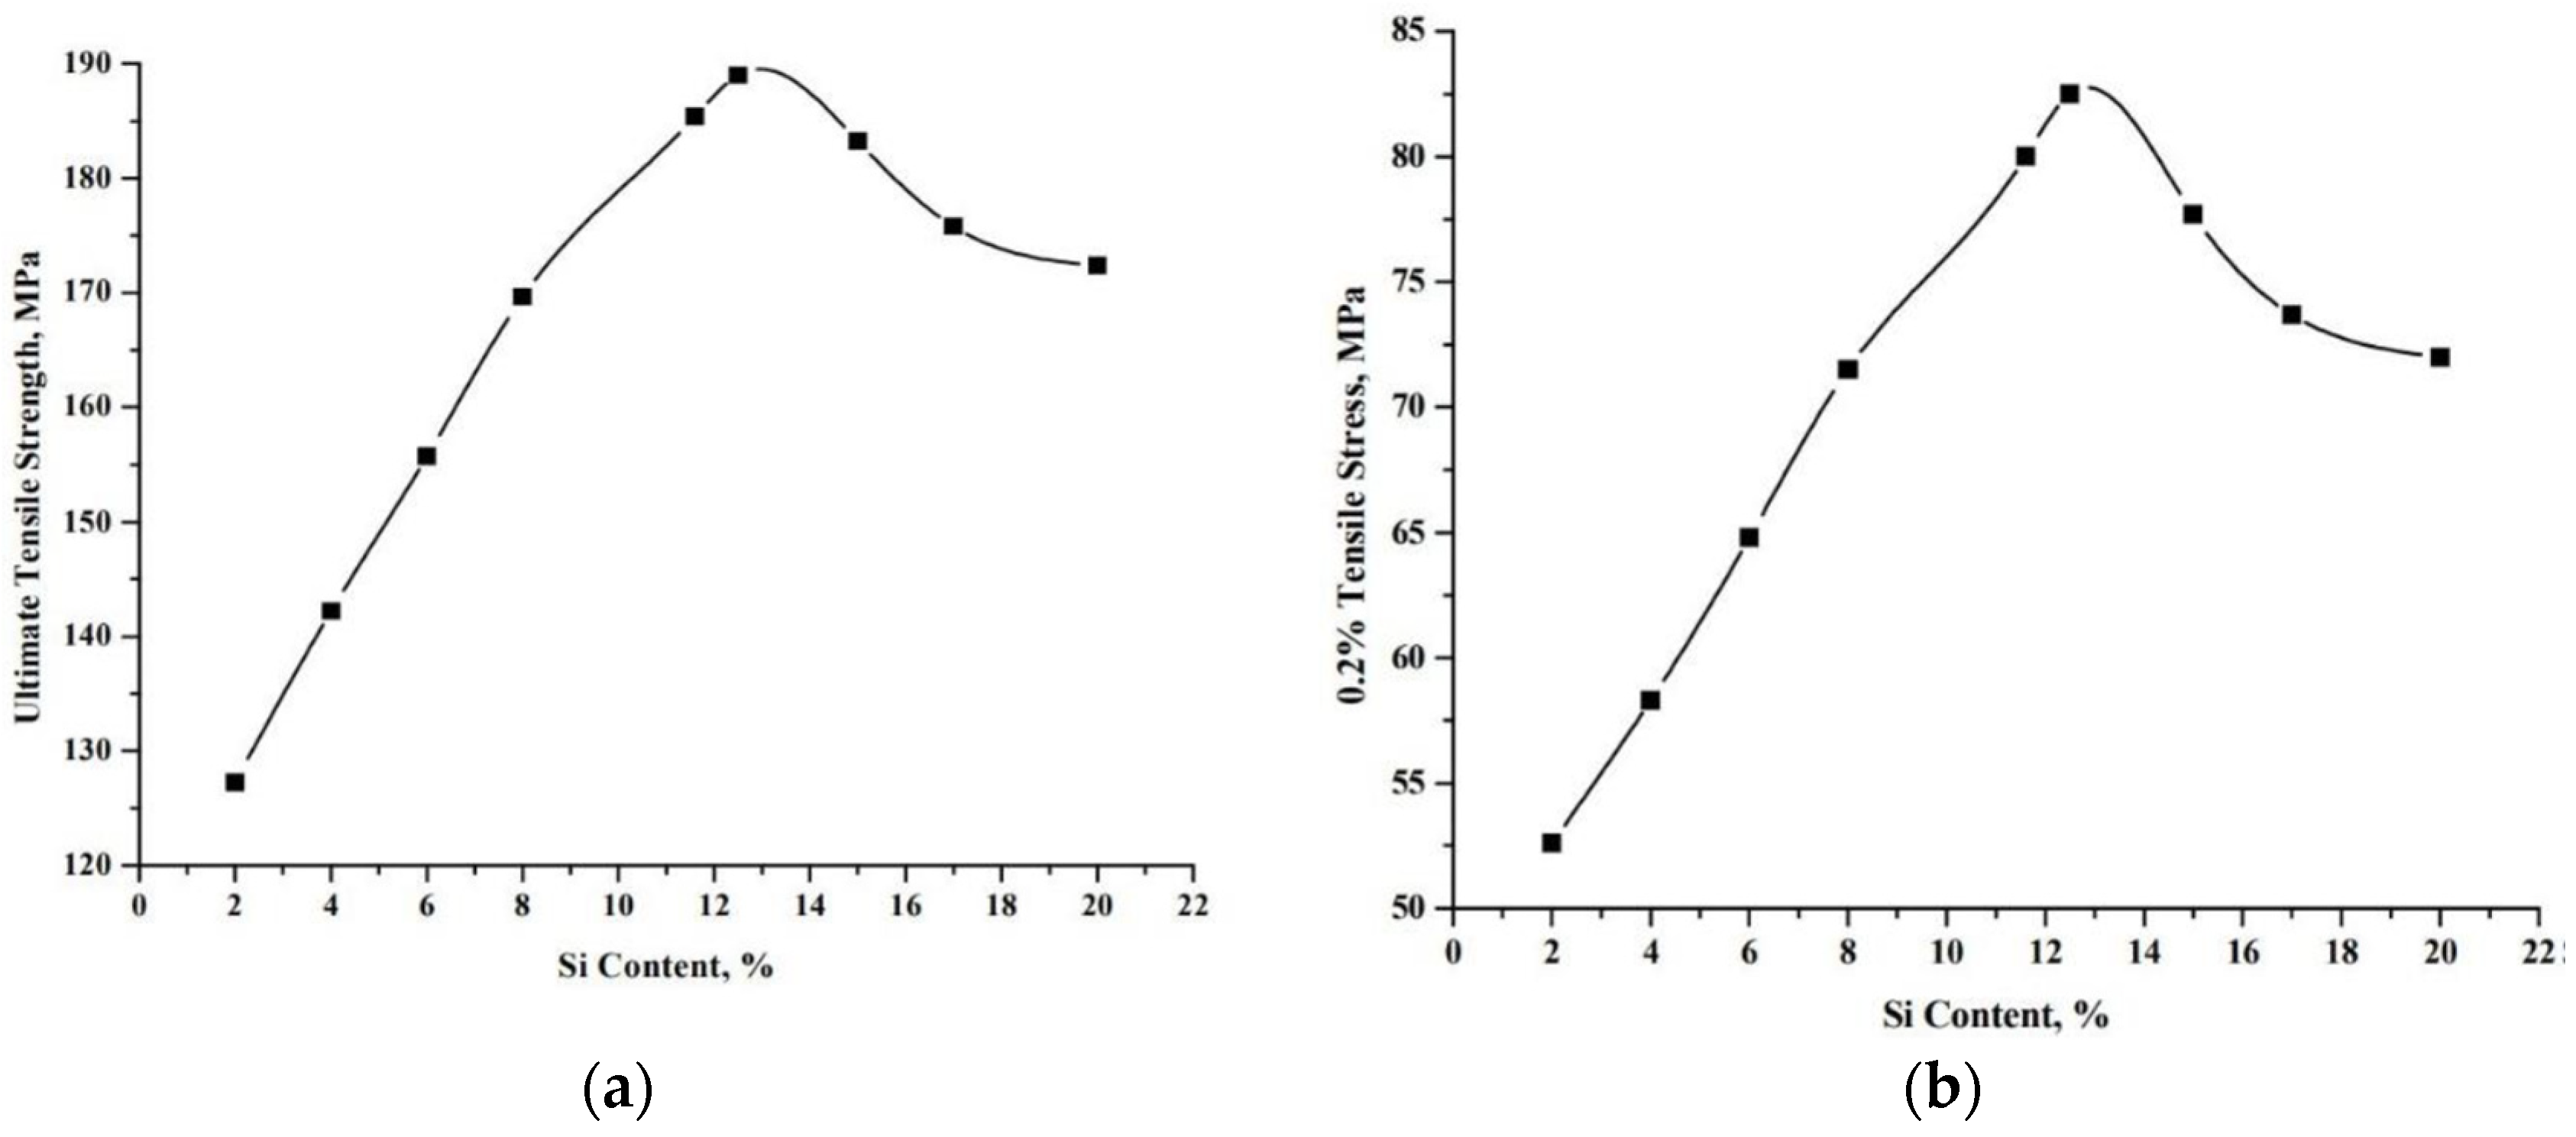
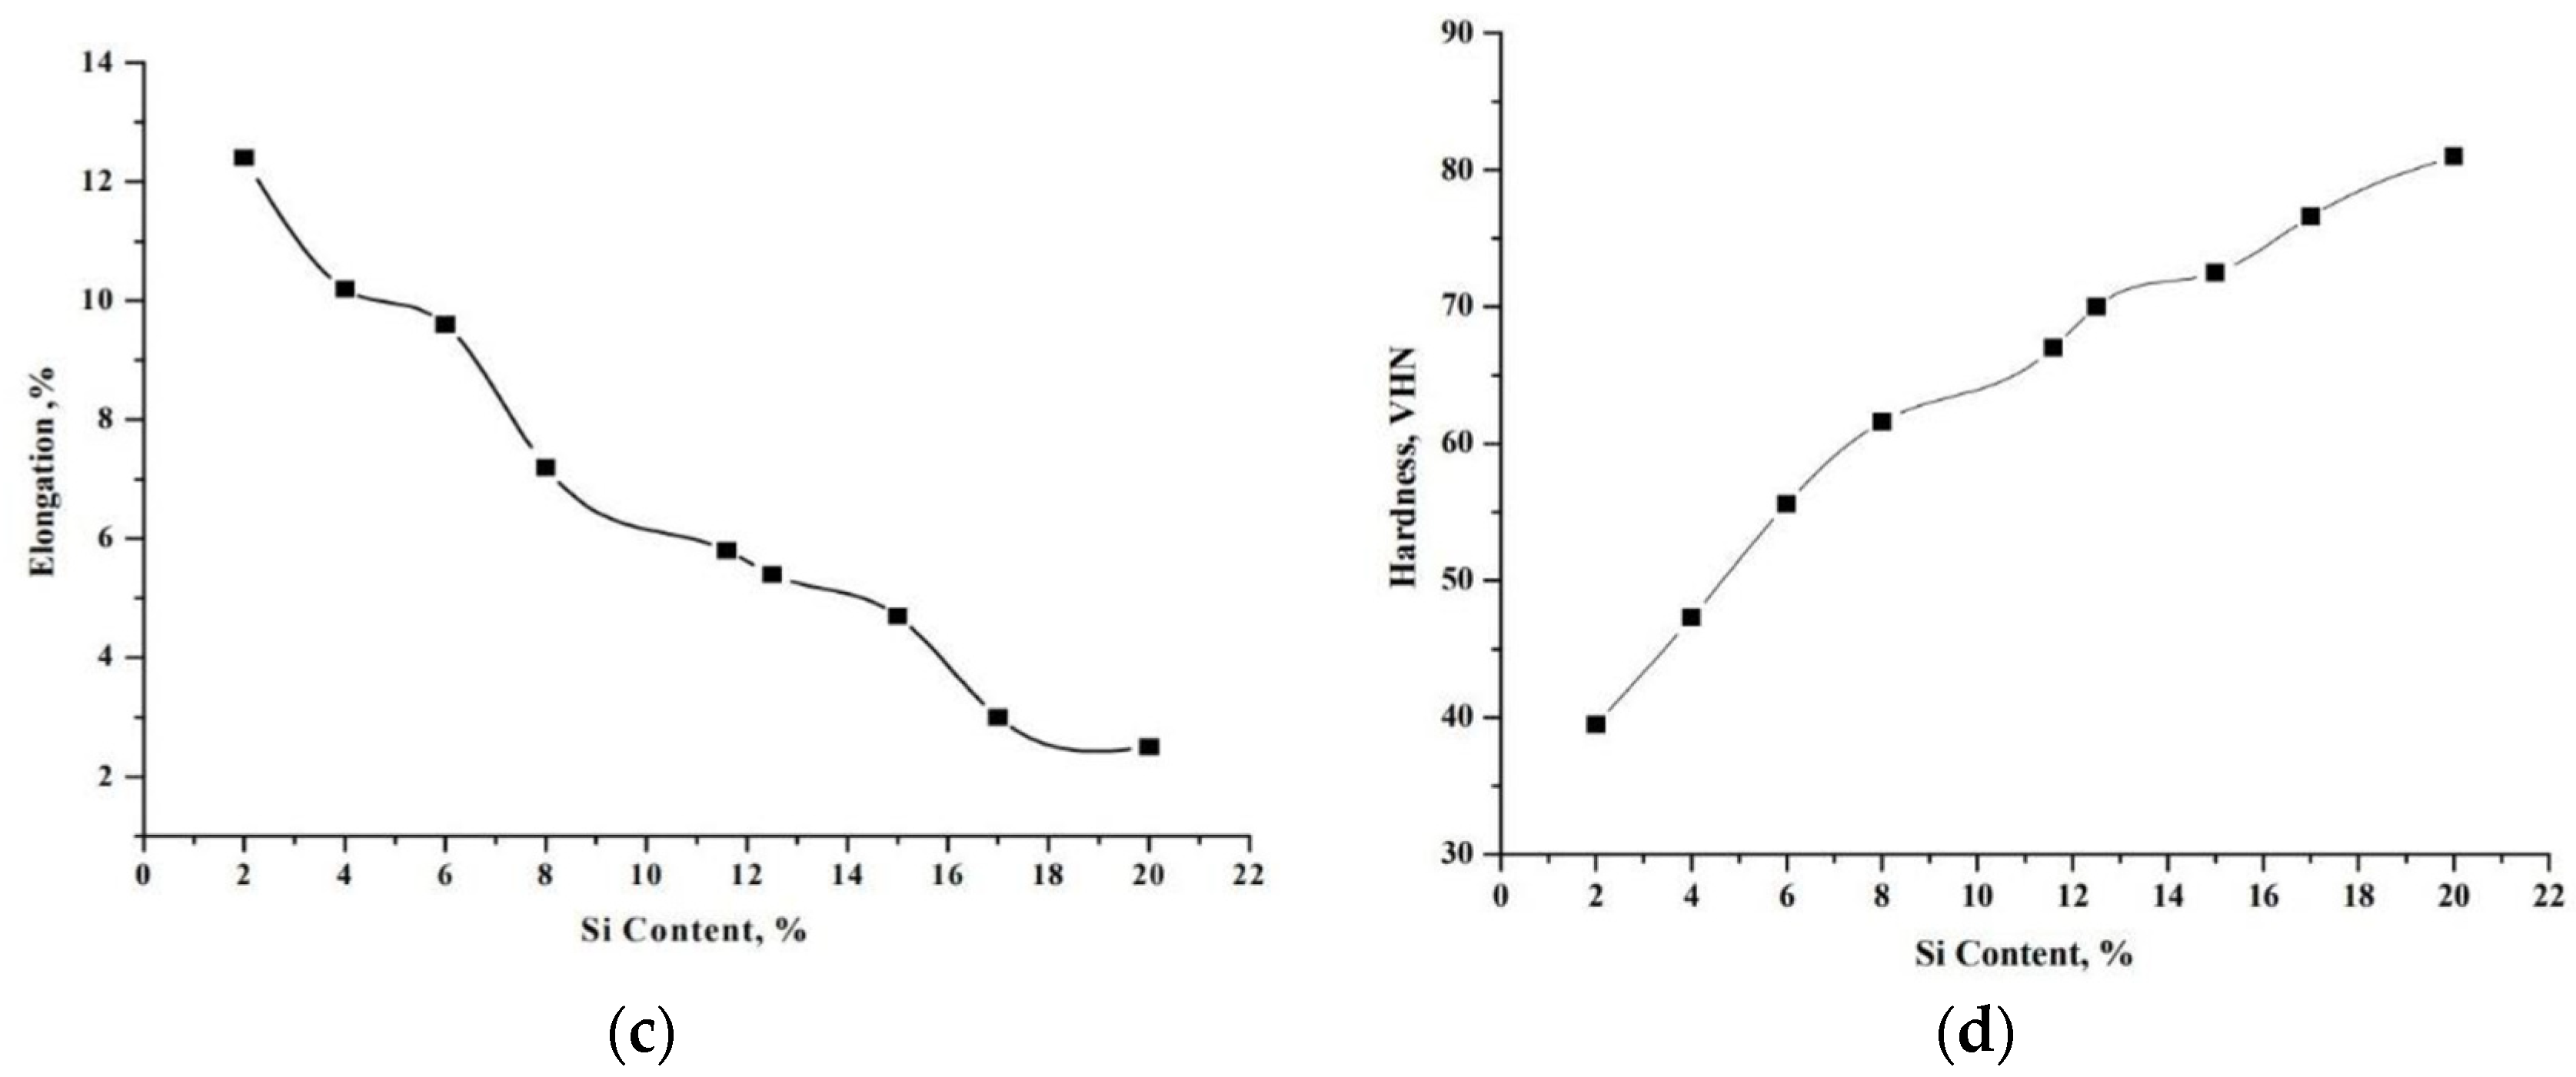
2.3. Mechanical Properties of Al-Si Alloys
3. Casting Processes
3.1. High Pressure Die Casting (HPDC)
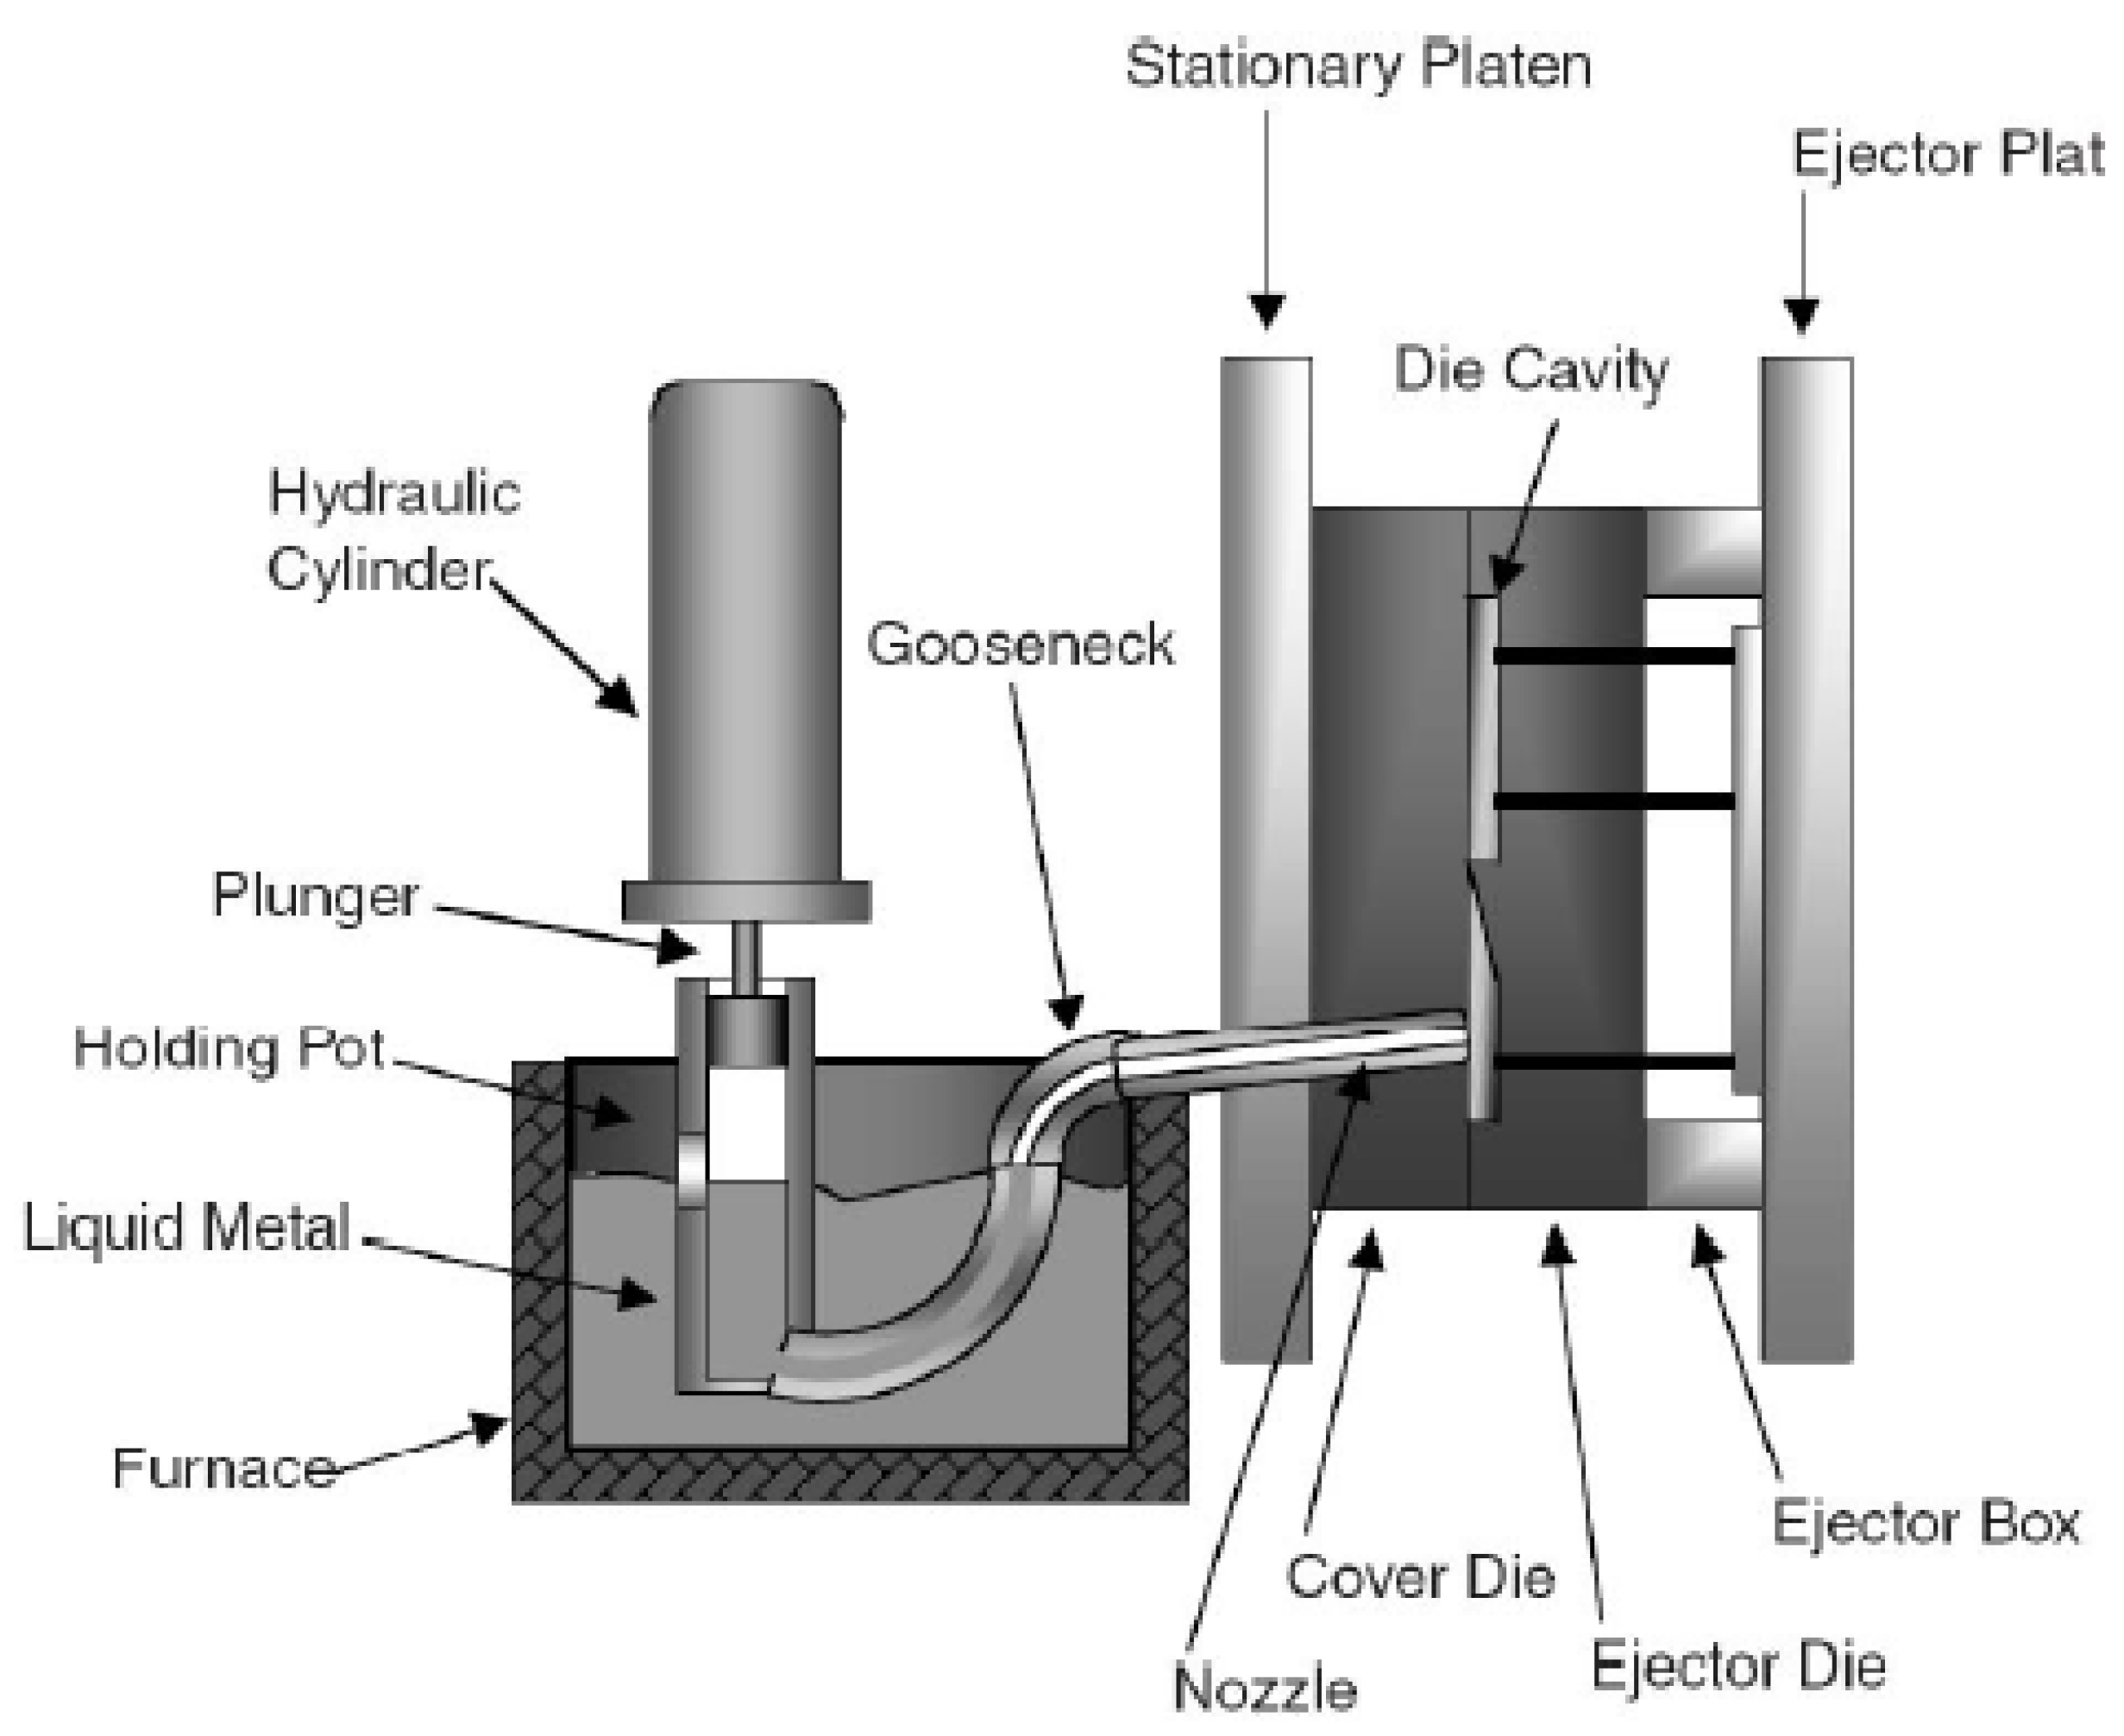
3.1.1. Hot-Chamber Die Casting Process
3.1.2. Cold-Chamber Die Casting Process
3.2. Squeeze Casting Process
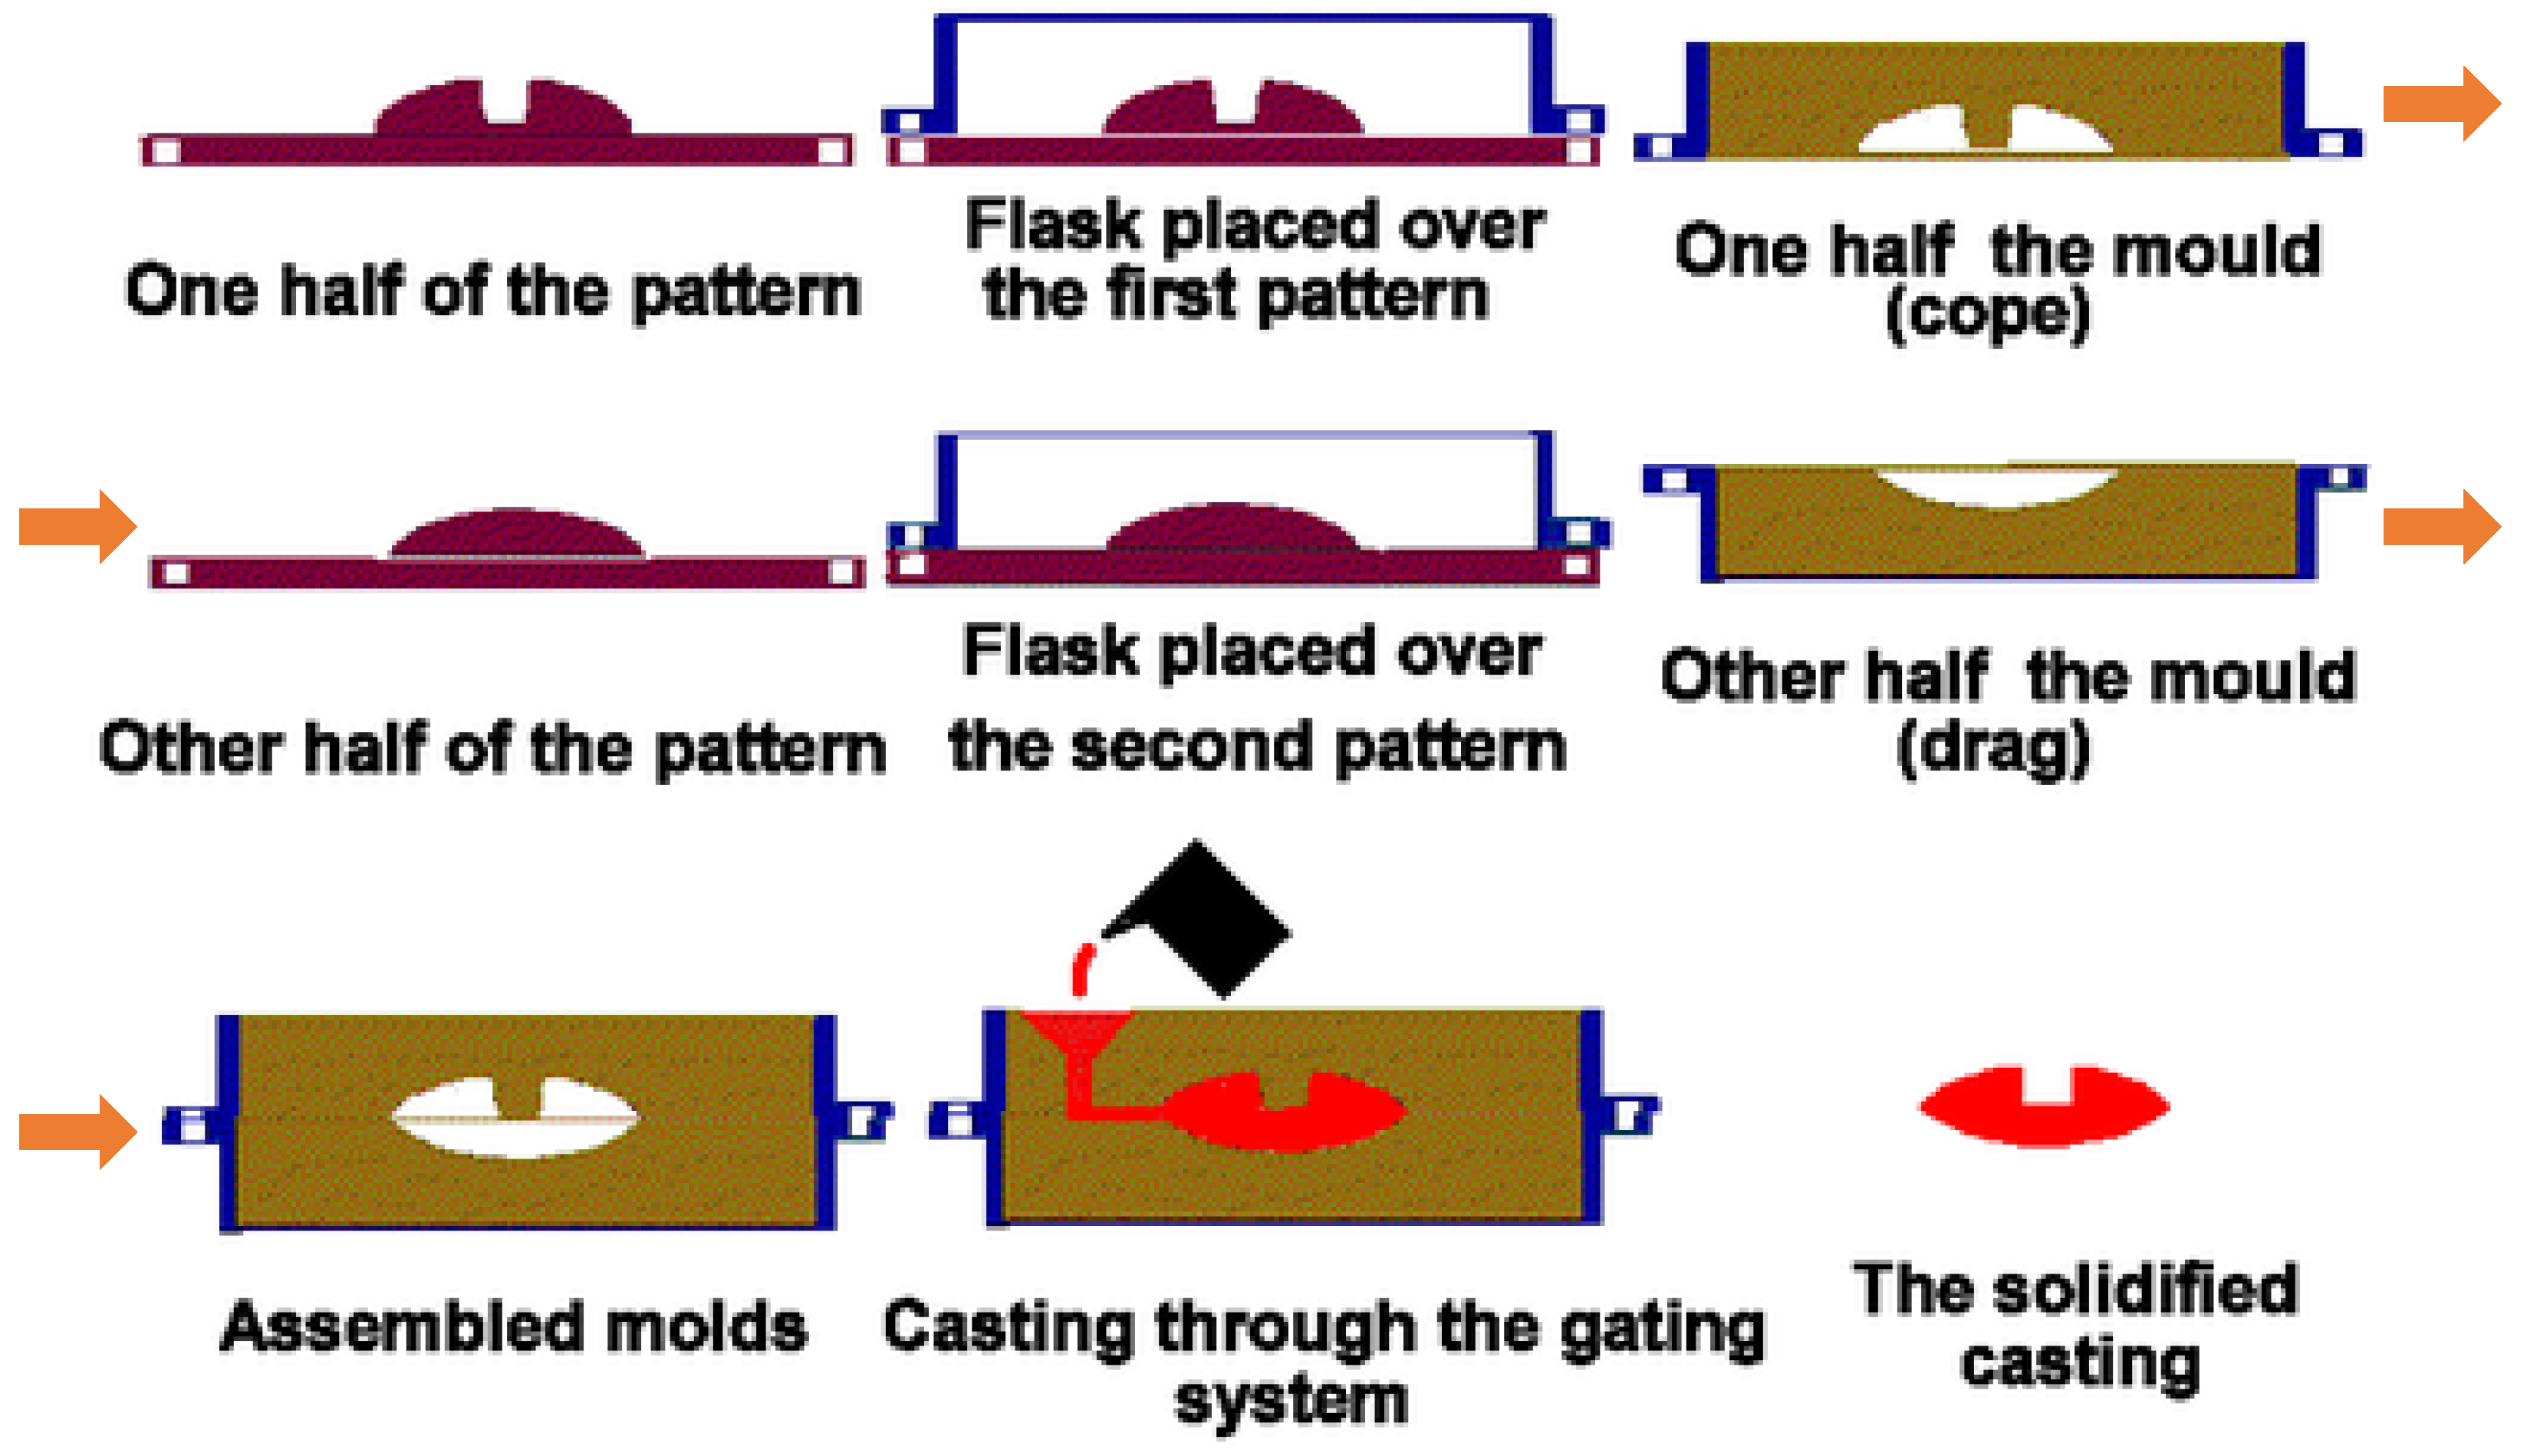
3.3. Sand Casting
3.4. Casting Processes for BEVs
4. Strengthening Mechanisms of Aluminum Alloys
4.1. Solid Solutions Strengthening
4.2. Precipitation Strengthening
4.3. Dislocation Accumulation Strengthening
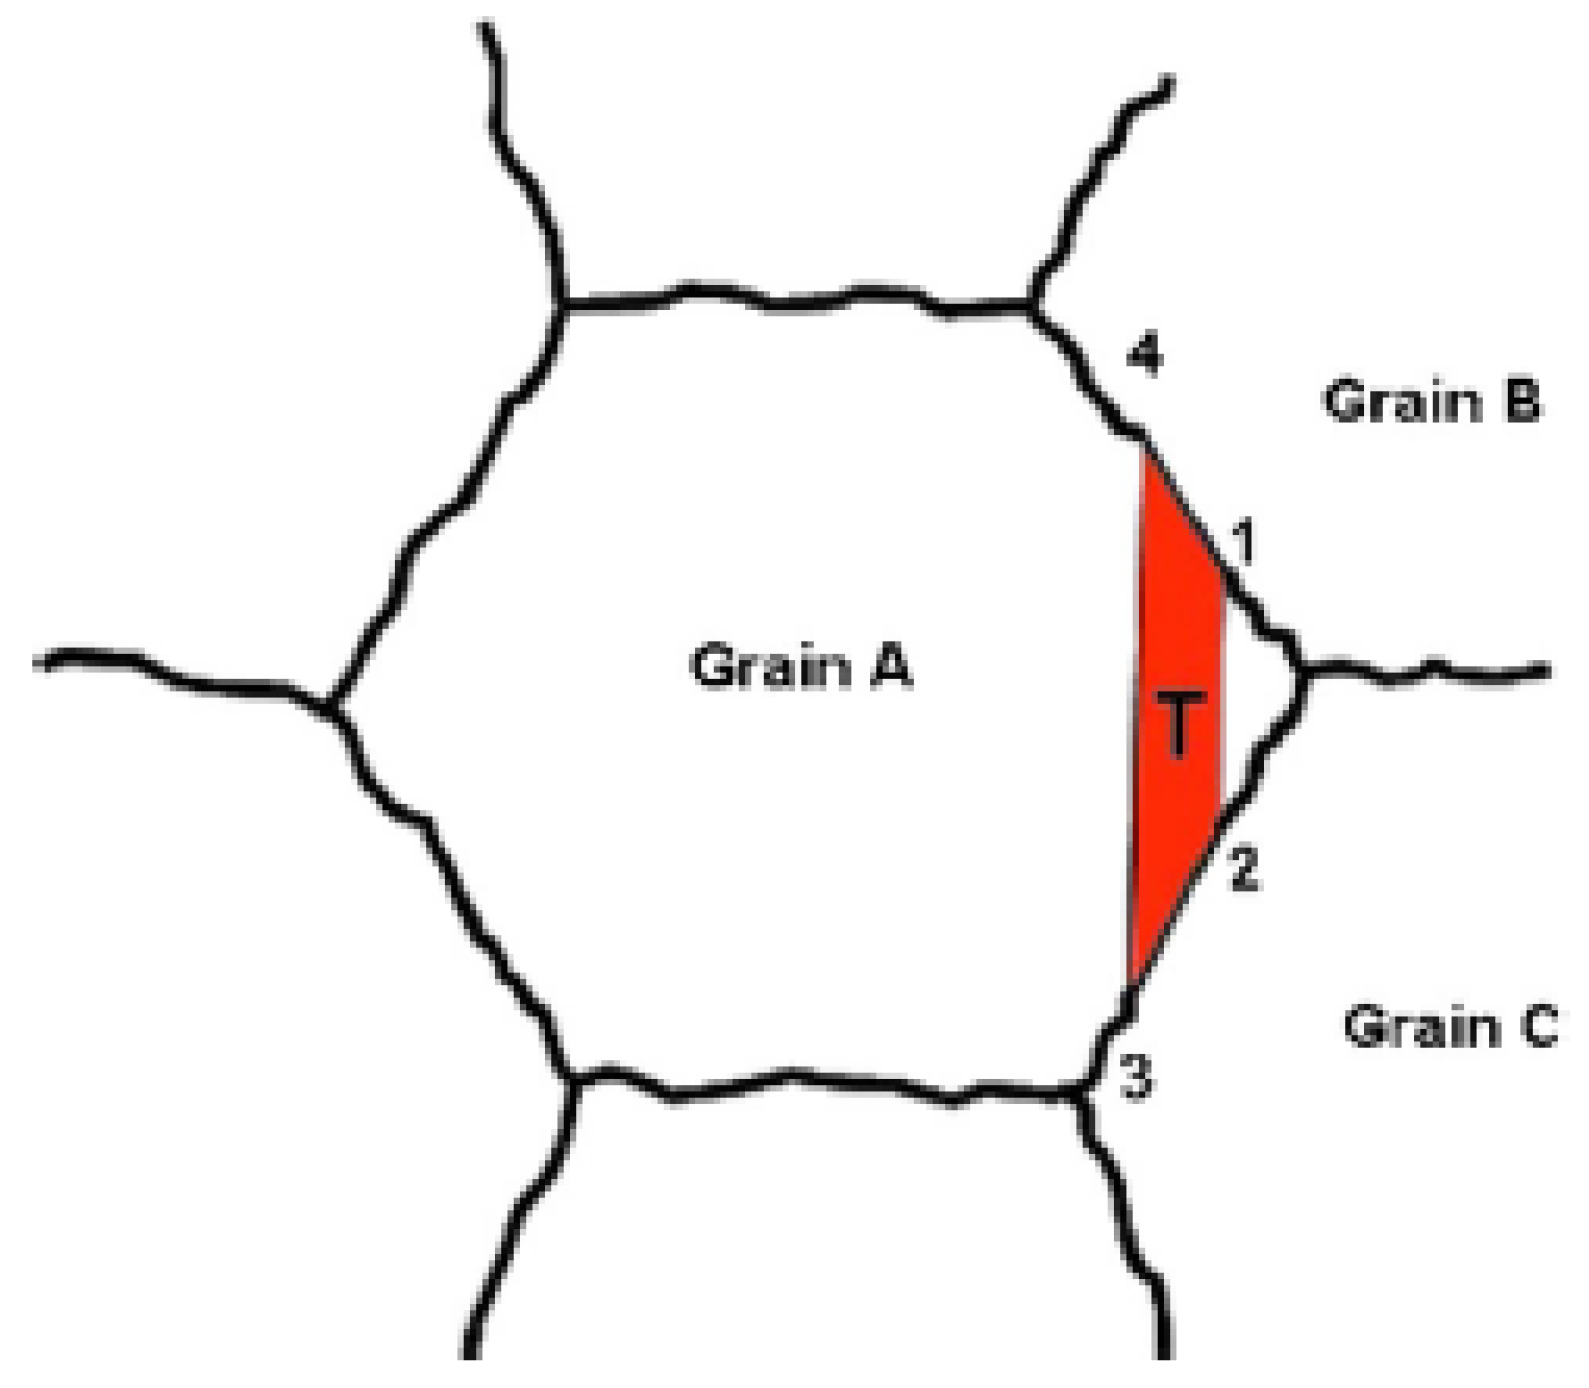
4.4. Grain Boundary Strengthening
5. Electrical Conductivity of Aluminum Alloys
5.1. Electrical Conductivity of Pure Aluminum
5.2. Electrical Conductivity of Wrought Al Alloys
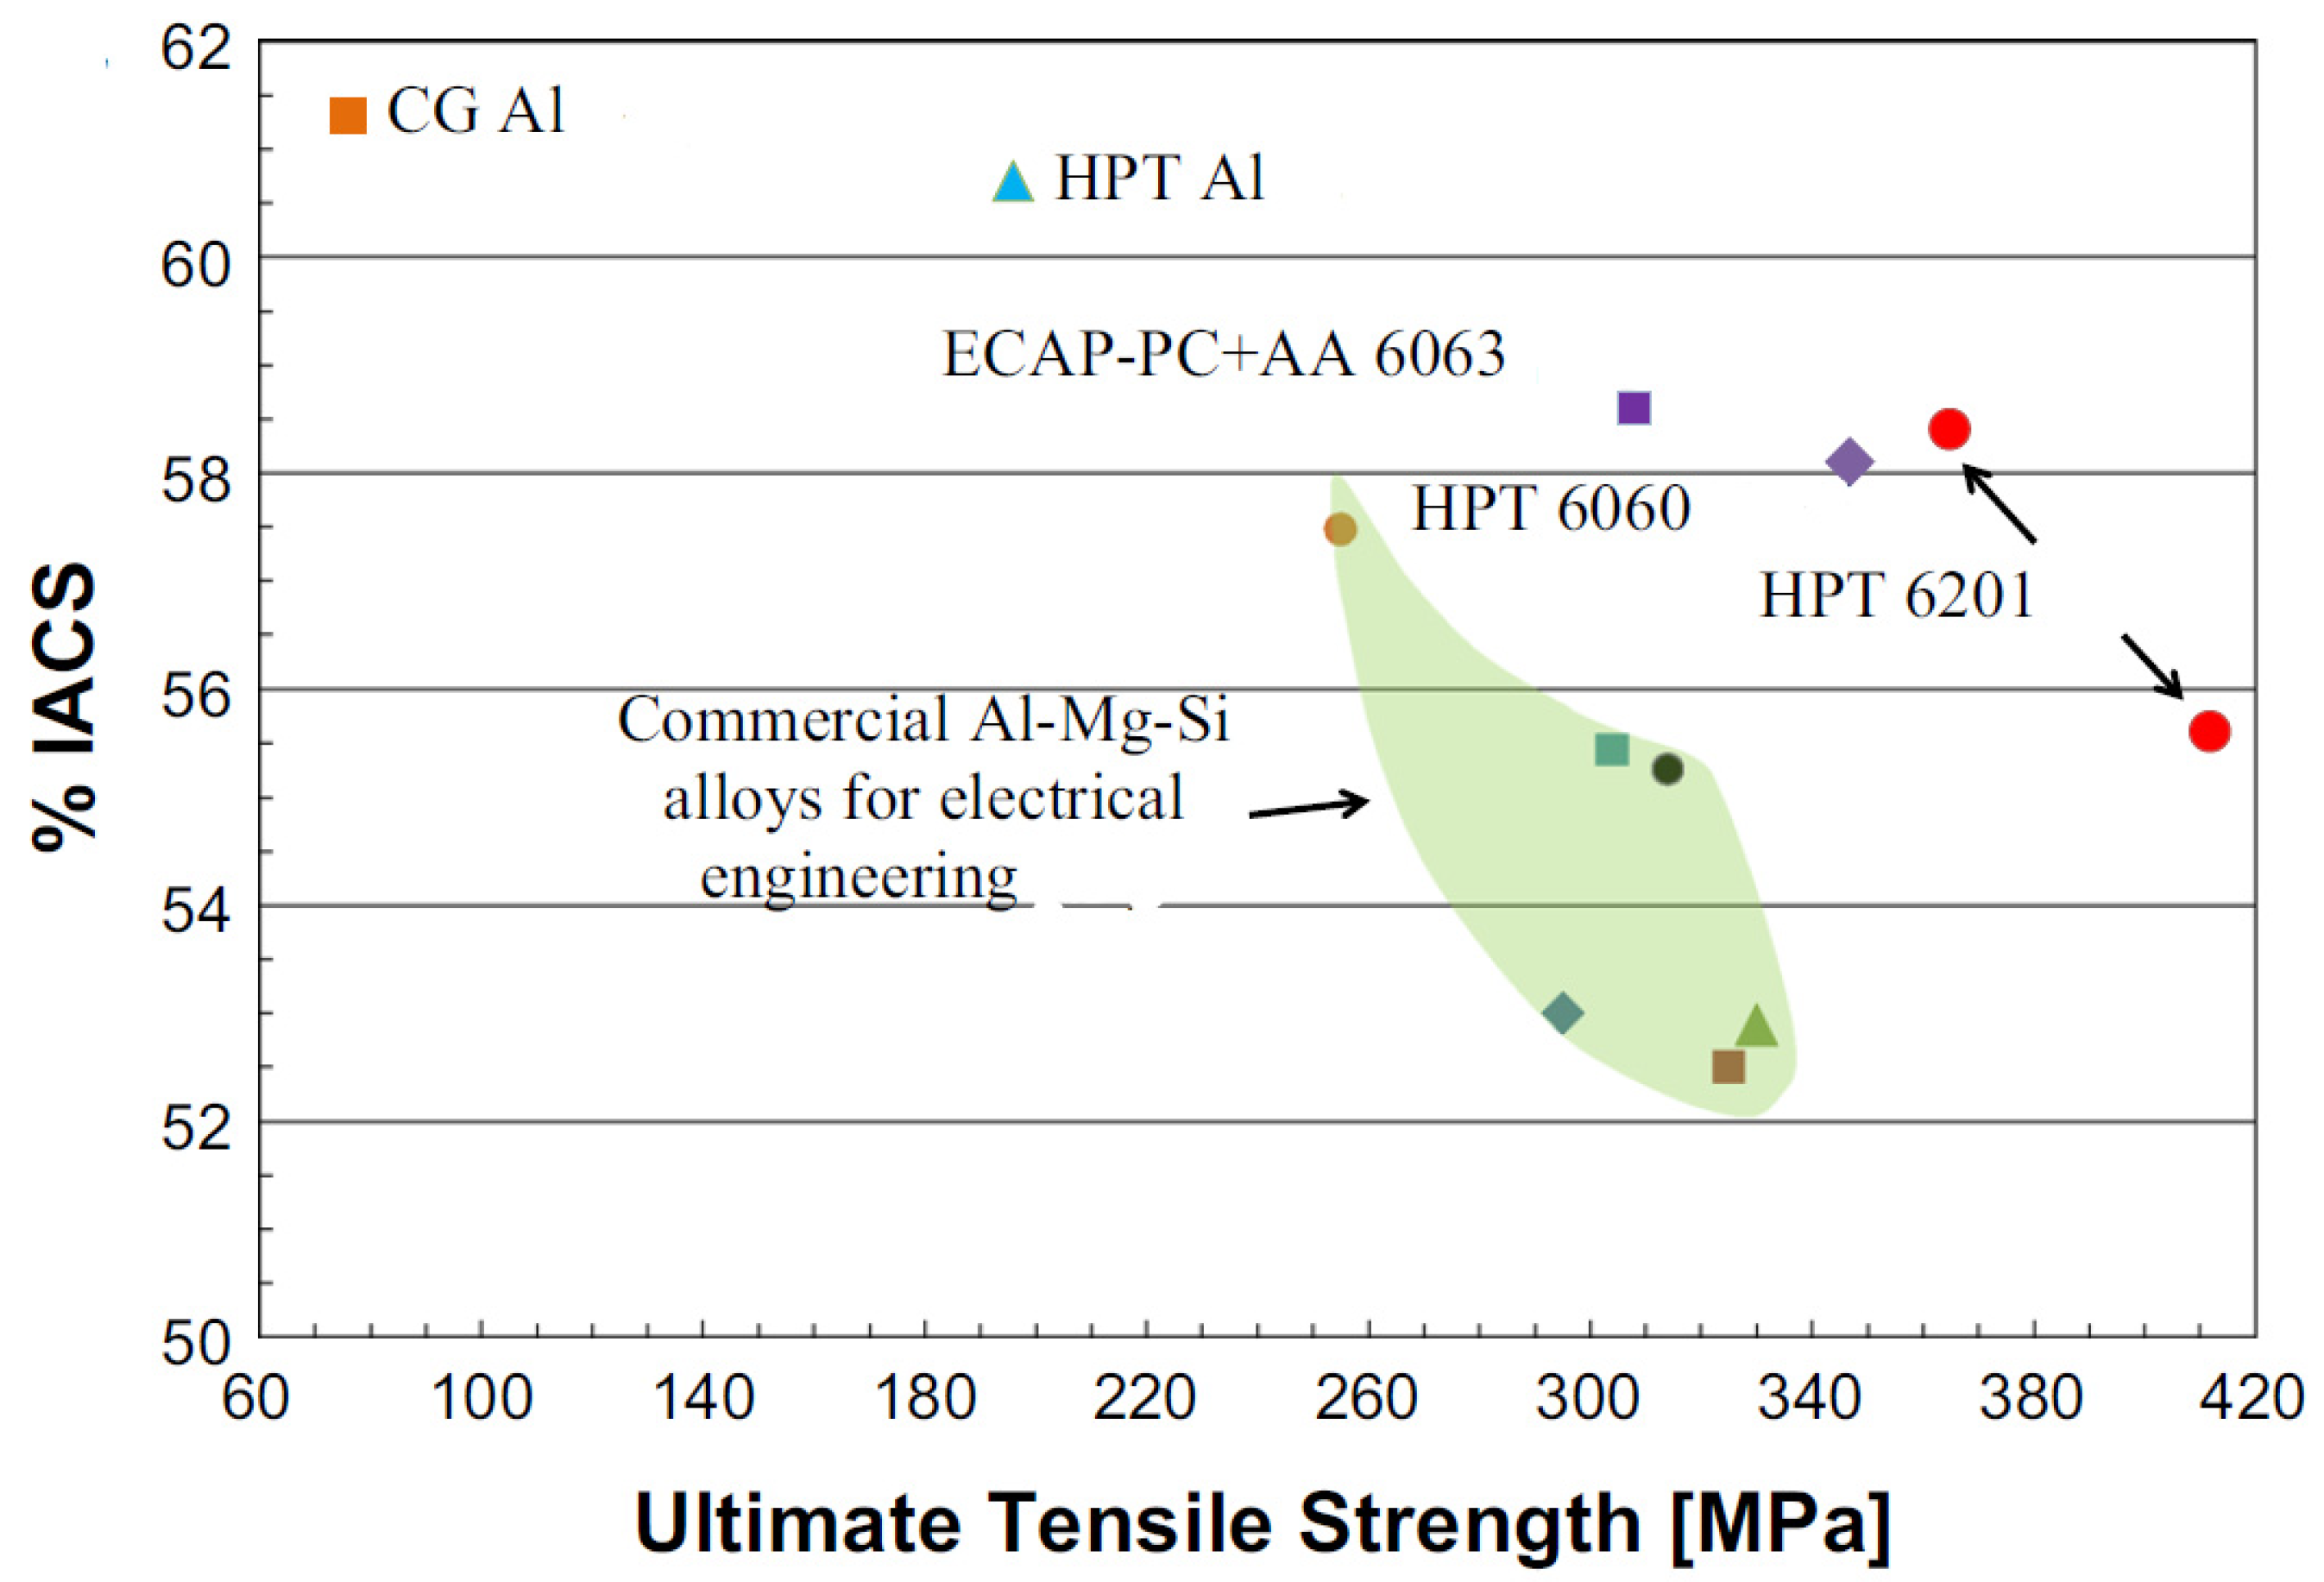
5.2.1. Nanostructure in Wrought Alloys
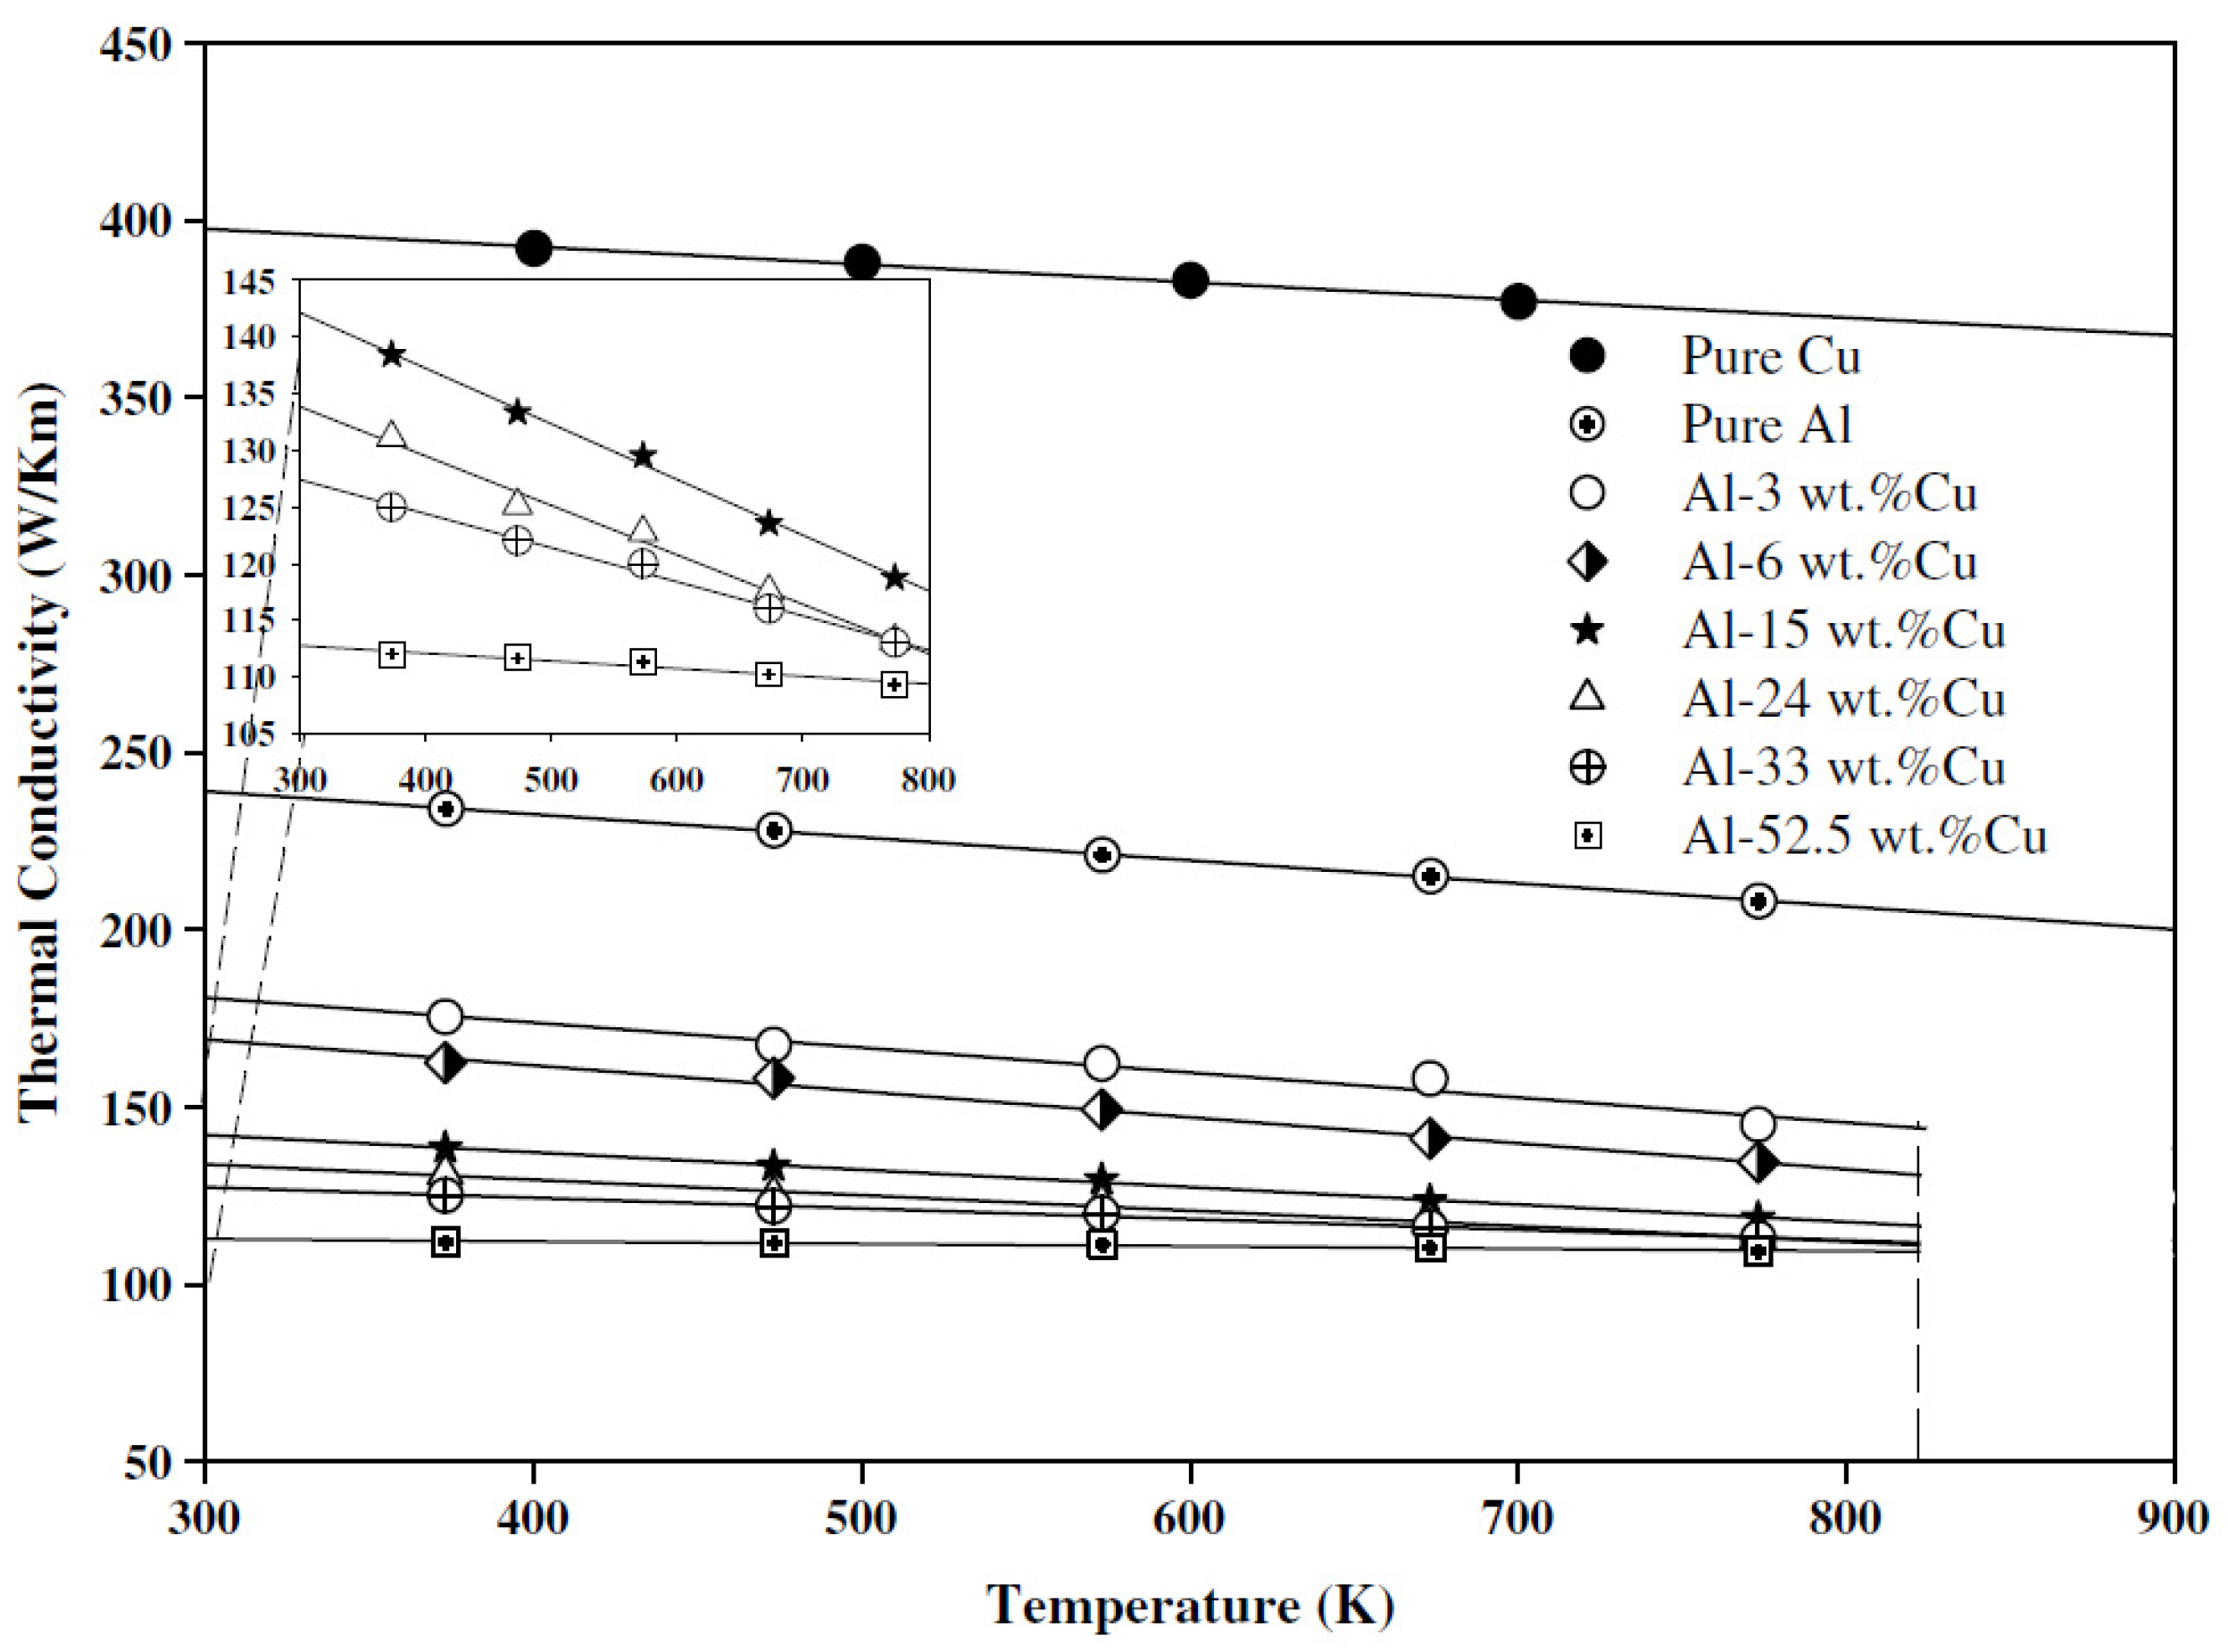
5.2.2. Thermal Conductivity in Wrought Alloys
5.2.3. Electrical Conductivity in Wrought Alloys
5.3. Electrical Conductivity of Cast Al Alloys
5.3.1. Cast Al-Si-Cu-Mg Alloys
5.3.2. Cast Al-Ni Alloys
5.4. Advantages and Disadvantages of Potential Wrought and Cast Al Alloys
6. Summary
Funding
Institutional Review Board Statement
Informed Consent Statement
Data Availability Statement
Acknowledgments
Conflicts of Interest
Nomenclature
| BEV | Battery-powered electric vehicle |
| S | Strengthening |
| So | Peierls stress |
| Sgs | Grain size strengthening |
| Sss | Solid solution strengthening |
| Sdis | Dislocation strengthening |
| Sp | Precipitation strengthening |
| ρ | Resistance |
| ρT | Temperature resistance |
| ρD | Lattice defects and solutes resistivity |
| ρss | Solute atoms resistivity |
| ρp | Resistivity added by second phase particles |
| ρdis | Dislocation resistivity |
| ρv | Vacancies resistivity |
| ρgs | Grain boundaries resistivity |
| σ | Electrical conductivity |
| σ0 | Electrical conductivity at melting point (σ0 = 41,400 Ω−1cm−1 for pure aluminum) |
| Ke | Thermal conductivity of free electrons |
| L | Lorenz number (L0 = 2.445 × 10⁻⁸ ΩW/K2) |
| T | Temperature |
| TL | Liquidus temperature |
References
- Boukhnifer, M.; Raisemche, A. Fault tolerant control for induction motor in electrical vehicle. In Proceedings of the 2012 IEEE International Conference on Control Applications, Dubrovnik, Croatia, 3–5 October 2012; pp. 136–141. [Google Scholar]
- Popovich, A.; Sufiiarov, V.; Polozov, I.; Borisov, E.; Masaylo, D.; Orlov, A. Microstructure and mechanical properties of additive manufactured copper alloy. Mater. Lett. 2016, 179, 38–41. [Google Scholar] [CrossRef]
- Daesung, J.U.N.G. End Ring for Induction Motor. U.S. Patent No. 9,866,095, 9 January 2018. [Google Scholar]
- Davis, J. (Ed.) ASM Specialty Handbook: Aluminum and Aluminum Alloys; ASM International: Materials Park, OH, USA, 2002. [Google Scholar]
- Beaulieu, D. Characteristics of Structural Aluminum; Presses de l’aluminum: Chicoutimi, QC, Canada, 2005. [Google Scholar]
- Fang, L. Development of As-Cast High Strength Aluminum Alloys with Ni and Sr Addition. Ph.D. Dissertation, University of Windsor, Windsor, ON, Canada, 2018. [Google Scholar]
- Davis, J.R. ASM Handbook, Alloy. Phase Diagrams; Section 2; ASM International: Material Park, OH, USA, 2002; Volume 5, p. 44. [Google Scholar]
- Mondolfo, L.F. Metallography of Aluminum Alloys. 2007. Available online: https://www.amazon.com/Metallography-Aluminum-Alloys-Lucio-Mondolfo/dp/1406736724 (accessed on 5 January 2022).
- Backerud, L.; Chai, G.; Tamminen, J. Solidification characteristics of aluminum alloys. AFS Trans. 1990, 2, 24–37, 71–81. [Google Scholar]
- Abdel-Jaber, G.T.; Omran, A.M.; Khalil, K.A.; Fujii, M.; Seki, M.; Yoshida, A. An investigation into solidification and mechanical properties behavior of Al-Si casting alloys. Int. J. Mech. Mechatron. Eng. IJMME-IJENS 2010, 10, 34–41. [Google Scholar]
- Fang, L.; Zhang, X.; Hu, H.; Nie, X.; Tjong, J. Microstructure and tensile properties of squeeze cast aluminium alloy A380 containing Ni and Sr addition. Adv. Mater. Process. Technol. 2017, 3, 90–100. [Google Scholar] [CrossRef]
- Elzanaty, H. Effect of different Si content on the mechanical properties in Al-based alloy. Int. J. Res. Eng. Technol. 2014, 2, 49–54. [Google Scholar]
- Kalhapure, M.G.; Dighe, P.M. Impact of silicon content on mechanical properties of aluminum alloys. Int. J. Sci. Res. 2015, 4, 38–40. [Google Scholar]
- Vinarcik, E.J. High. Integrity Die Casting Process; John Wiley & Sons Inc.: Hoboken, NJ, USA, 2003. [Google Scholar]
- Doehler, H. Die Casting; McGraw Hill Book Company: New York, NY, USA, 1951. [Google Scholar]
- Hollinggrak, J. Casting Metals. UK Patent 4371, 8 September 1819. [Google Scholar]
- Chernov, D.K. Reports of the Imperial Russian Metallurgical Society. UK Patent 4371, 17 December 1878. [Google Scholar]
- Plyatskii, V.M.; Hammond, R.E.; Wald, A. Extrusion Casting; Primary Sources: New York, NY, USA, 1965. [Google Scholar]
- Seredenko, V.P.; Malei, T.P. Pressing of components from liquid steel. Dokl. Akad. Nauk SSSR 1961, 5, 253–255. [Google Scholar]
- Gulyaev, B.B. Crystallization of Steel under mechanical pressure. Liteinoe Proizv. 1960, 12, 33. [Google Scholar]
- Meyer, W. Squeeze Forming a Process for Producing High-Quality Castings; Metall: Clausthal-Zellerfeld, Germany, 1976. [Google Scholar]
- Hu, H. Squeeze casting of magnesium alloys and their composites. J. Mater. Sci. 1998, 33, 1579–1589. [Google Scholar] [CrossRef]
- Ghomashchi, M.R.; Vikhrov, A. Squeeze casting: An overview. J. Mater. Processing Technol. 2000, 101, 1–9. [Google Scholar] [CrossRef]
- Biringuccio, V.; Smith, C.S., Translators; The Pirotechnia of Vannoccio Biringuccio: The Classic Sixteenth-Century Treatise on Metals and Metallurgy; Dover Publications: Mineola, NY, USA, 17 April 2013.
- Weiss, D. Advances in the Sand Casting of Aluminium Alloys. In Fundamentals of Aluminium Metallurgy; Woodhead Publishing: Sawston, UK, 2018; pp. 159–171. [Google Scholar]
- Saleem, M.Q. Helium Assisted Sand Casting of Aluminum Alloys. Ph.D. Dissertation, Worcester Polytechnic Institute, Worcester, MA, USA, 2011. [Google Scholar]
- Kamikawa, N.; Huang, X.; Tsuji, N.; Hansen, N. Strengthening mechanisms in nanostructured high-purity aluminium deformed to high strain and annealed. Acta Mater. 2009, 57, 4198–4208. [Google Scholar] [CrossRef]
- Asgharzadeh, H.; Simchi, A.; Kim, H.S. Microstructural features, texture and strengthening mechanisms of nanostructured AA6063 alloy processed by powder metallurgy. Mater. Sci. Eng. A 2011, 528, 3981–3989. [Google Scholar] [CrossRef]
- Soboyejo, W. Mechanical Properties of Engineered Materials; CRC Press: Boca Raton, FL, USA, 2002; Volume 152. [Google Scholar]
- Kelly, A.; Nicholson, R.B. (Eds.) Strengthening Methods in Crystals; Elsevier: London, UK, 1971. [Google Scholar]
- Ashby, M.F. The deformation of plastically non-homogeneous materials. Philos. Mag. 1970, 21, 399–424. [Google Scholar] [CrossRef]
- Murashkin, M.Y.; Sabirov, I.; Sauvage, X.; Valiev, R.Z. Nanostructured Al and Cu alloys with superior strength and electrical conductivity. J. Mater. Sci. 2016, 51, 33–49. [Google Scholar] [CrossRef]
- Hall, E.O. The deformation and aging of mild steel. Proc. Phys. Soc. B 1951, 64, 747–753. [Google Scholar] [CrossRef]
- Rossiter, P.L. The Electrical Resistivity of Metals and Alloys; Cambridge University Press: Cambridge, UK, 1987. [Google Scholar]
- Kasap, S.; Capper, P. (Eds.) Springer Handbook of Electronic and Photonic Materials; Springer: Wurzburg, Germany, 2006. [Google Scholar]
- Matthiessen, A.; Vogt, C. On the influence of temperature on the electric conducting-power of alloys. Philos. Trans. R. Soc. Lond. 1864, 154, 167–200. [Google Scholar]
- Lu, L.; Shen, Y.; Chen, X.; Qian, L.; Lu, K. Ultrahigh strength and high electrical conductivity in copper. Science 2004, 304, 422–426. [Google Scholar] [CrossRef] [Green Version]
- Dugdale, J.S. The Electrical Properties of Metals and Alloys; Arnold: London, UK, 1977. [Google Scholar]
- Valiev, R.Z.; Sabirov, I.; Zhilyaev, A.P.; Langdon, T.G. Bulk nanostructured metals for innovative applications. JOM 2012, 64, 1134–1142. [Google Scholar] [CrossRef]
- Valiev, R.Z.; Murashkin, M.Y.U.; Sabirov, I. A nanostructural design to produce high strength Al alloys with enhanced electrical conductivity. Scr. Mater. 2014, 76, 13–16. [Google Scholar] [CrossRef]
- Bobruk, E.V.; Murashkin, M.Y.; Kazykhanov, V.U.; Valiev, R.Z. Aging behavior and properties of ultra-fine grained aluminium alloys of Al-Mg-Si system. Rev. Adv. Mater. Sci. 2012, 31, 14–34. [Google Scholar]
- Miller, M.K. Atom. Probe Tomography: Analysis at the Atomic Level; Springer Science & Business Media: Boston, MA, USA, 2012. [Google Scholar]
- Sivanesh, P.; Charlie, K.; Robert, S.J.; Ethan, F.; Paul, E. Aluminum Alloys for Die Casting. U.S. Patent No. WO 2020/028730 A1, 6 February 2020. [Google Scholar]
- Cubero-Sesin, J.M.; Arita, M.; Horita, Z. High strength and electrical conductivity of Al-Fe alloys produced by synergistic combination of high-pressure torsion and aging. Adv. Eng. Mater. 2015, 17, 1792–1803. [Google Scholar] [CrossRef]
- Chen, X.H.; Lu, L.; Lu, K. Electrical resistivity of ultra-fine grained copper with nanoscale growth twins. J. Appl. Phys. 2007, 102, 083708. [Google Scholar] [CrossRef] [Green Version]
- Aksöz, S.; Ocak, Y.; Maraşlı, N.; Çadirli, E.; Kaya, H.A.S.A.N.; Böyük, U. Dependency of the thermal and electrical conductivity on the temperature and composition of Cu in the Al based Al–Cu alloys. Exp. Therm. Fluid Sci. 2010, 34, 1507–1516. [Google Scholar] [CrossRef]
- Plevachuk, Y.; Sklyarchuk, V.; Yakymovych, A.; Eckert, S.; Willers, B.; Eigenfeld, K. Density, viscosity, and electrical conductivity of hypoeutectic Al-Cu liquid alloys. Metall. Mater. Trans. A 2008, 39, 3040–3045. [Google Scholar] [CrossRef]
- Kaya, H.A.S.A.N. Dependence of electrical resistivity on temperature and composition of Al–Cu alloys. Mater. Res. Innov. 2012, 16, 224–229. [Google Scholar] [CrossRef]
- Ishikawa, H.; Takashima, Y.; Okada, Y. Squirrel-Cage motor Rotor and Squirrel-Cage Motor. U.S. Patent No. 9,935,533, 4 March 2018. [Google Scholar]
- Xia, S.; Sanjiu, Y.; Xiao, B.; Sirui, L. Effects of Si, Cu and Mg addition on electrical conductivity and mechanical properties of cast aluminum alloys. Spec. Cast. Nonferrous Alloys 2010, 12, 12–20. [Google Scholar]


| Alloy Series | Principal Alloying Element |
|---|---|
| 1xx.x | Pure Aluminum (≥99%) |
| 2xx.x | Copper |
| 3xx.x | Silicon and/or Copper and/or Magnesium |
| 4xx.x | Silicon |
| 5xx.x | Magnesium |
| 6xx.x | Not used |
| 7xx.x | Zinc |
| 8xx.x | Tin |
| 9xx.x | Other |
| Metal | Electrical Conductivity | Electrical Resistivity (10−8, Ohm m) | Density (g/cm3) | Melting Point (°C) | |
|---|---|---|---|---|---|
| (MS/m) | (%IACS) | ||||
| Silver | 62.1 | 106 | 1.6 | 10.5 | 961 |
| Copper | 58.5 | 100 | 1.7 | 8.9 | 1083 |
| Gold | 44.2 | 75 | 2.3 | 19.4 | 1064 |
| Aluminum | 36.9 | 63 | 2.7 | 2.7 | 660 |
| Material | Processing: Grain Size d | Ultimate Tensile Strength (MPa) | Elongation (%) | Electrical Conductivity at RT, IACS (%) | References |
|---|---|---|---|---|---|
| AA6201 | CG T81; d = 65 µm | 330 | 6.1 | 53.6 | [42] |
| HPT at RT; d = 0.13 µm | 510 | 2.5 | 47.7 | ||
| HPT at RT + HPT at 130 °C d = 0.28 µm + nanoparticles | 412 | 4.9 | 55.6 | ||
| HPT at RT + HPT at 180 °C d = 0.44 µm + nanoparticles | 365 | 8.8 | 58.4 | ||
| AA6060 | CG T6 | 250 | 8 | 53.6 | [43] |
| HPT at RT; d = 0.18 µm | 525 | 5 | 51.8 | ||
| HPT at 180 °C; d = 0.35 µm + nanoparticles | 347 | 7 | 58.1 |
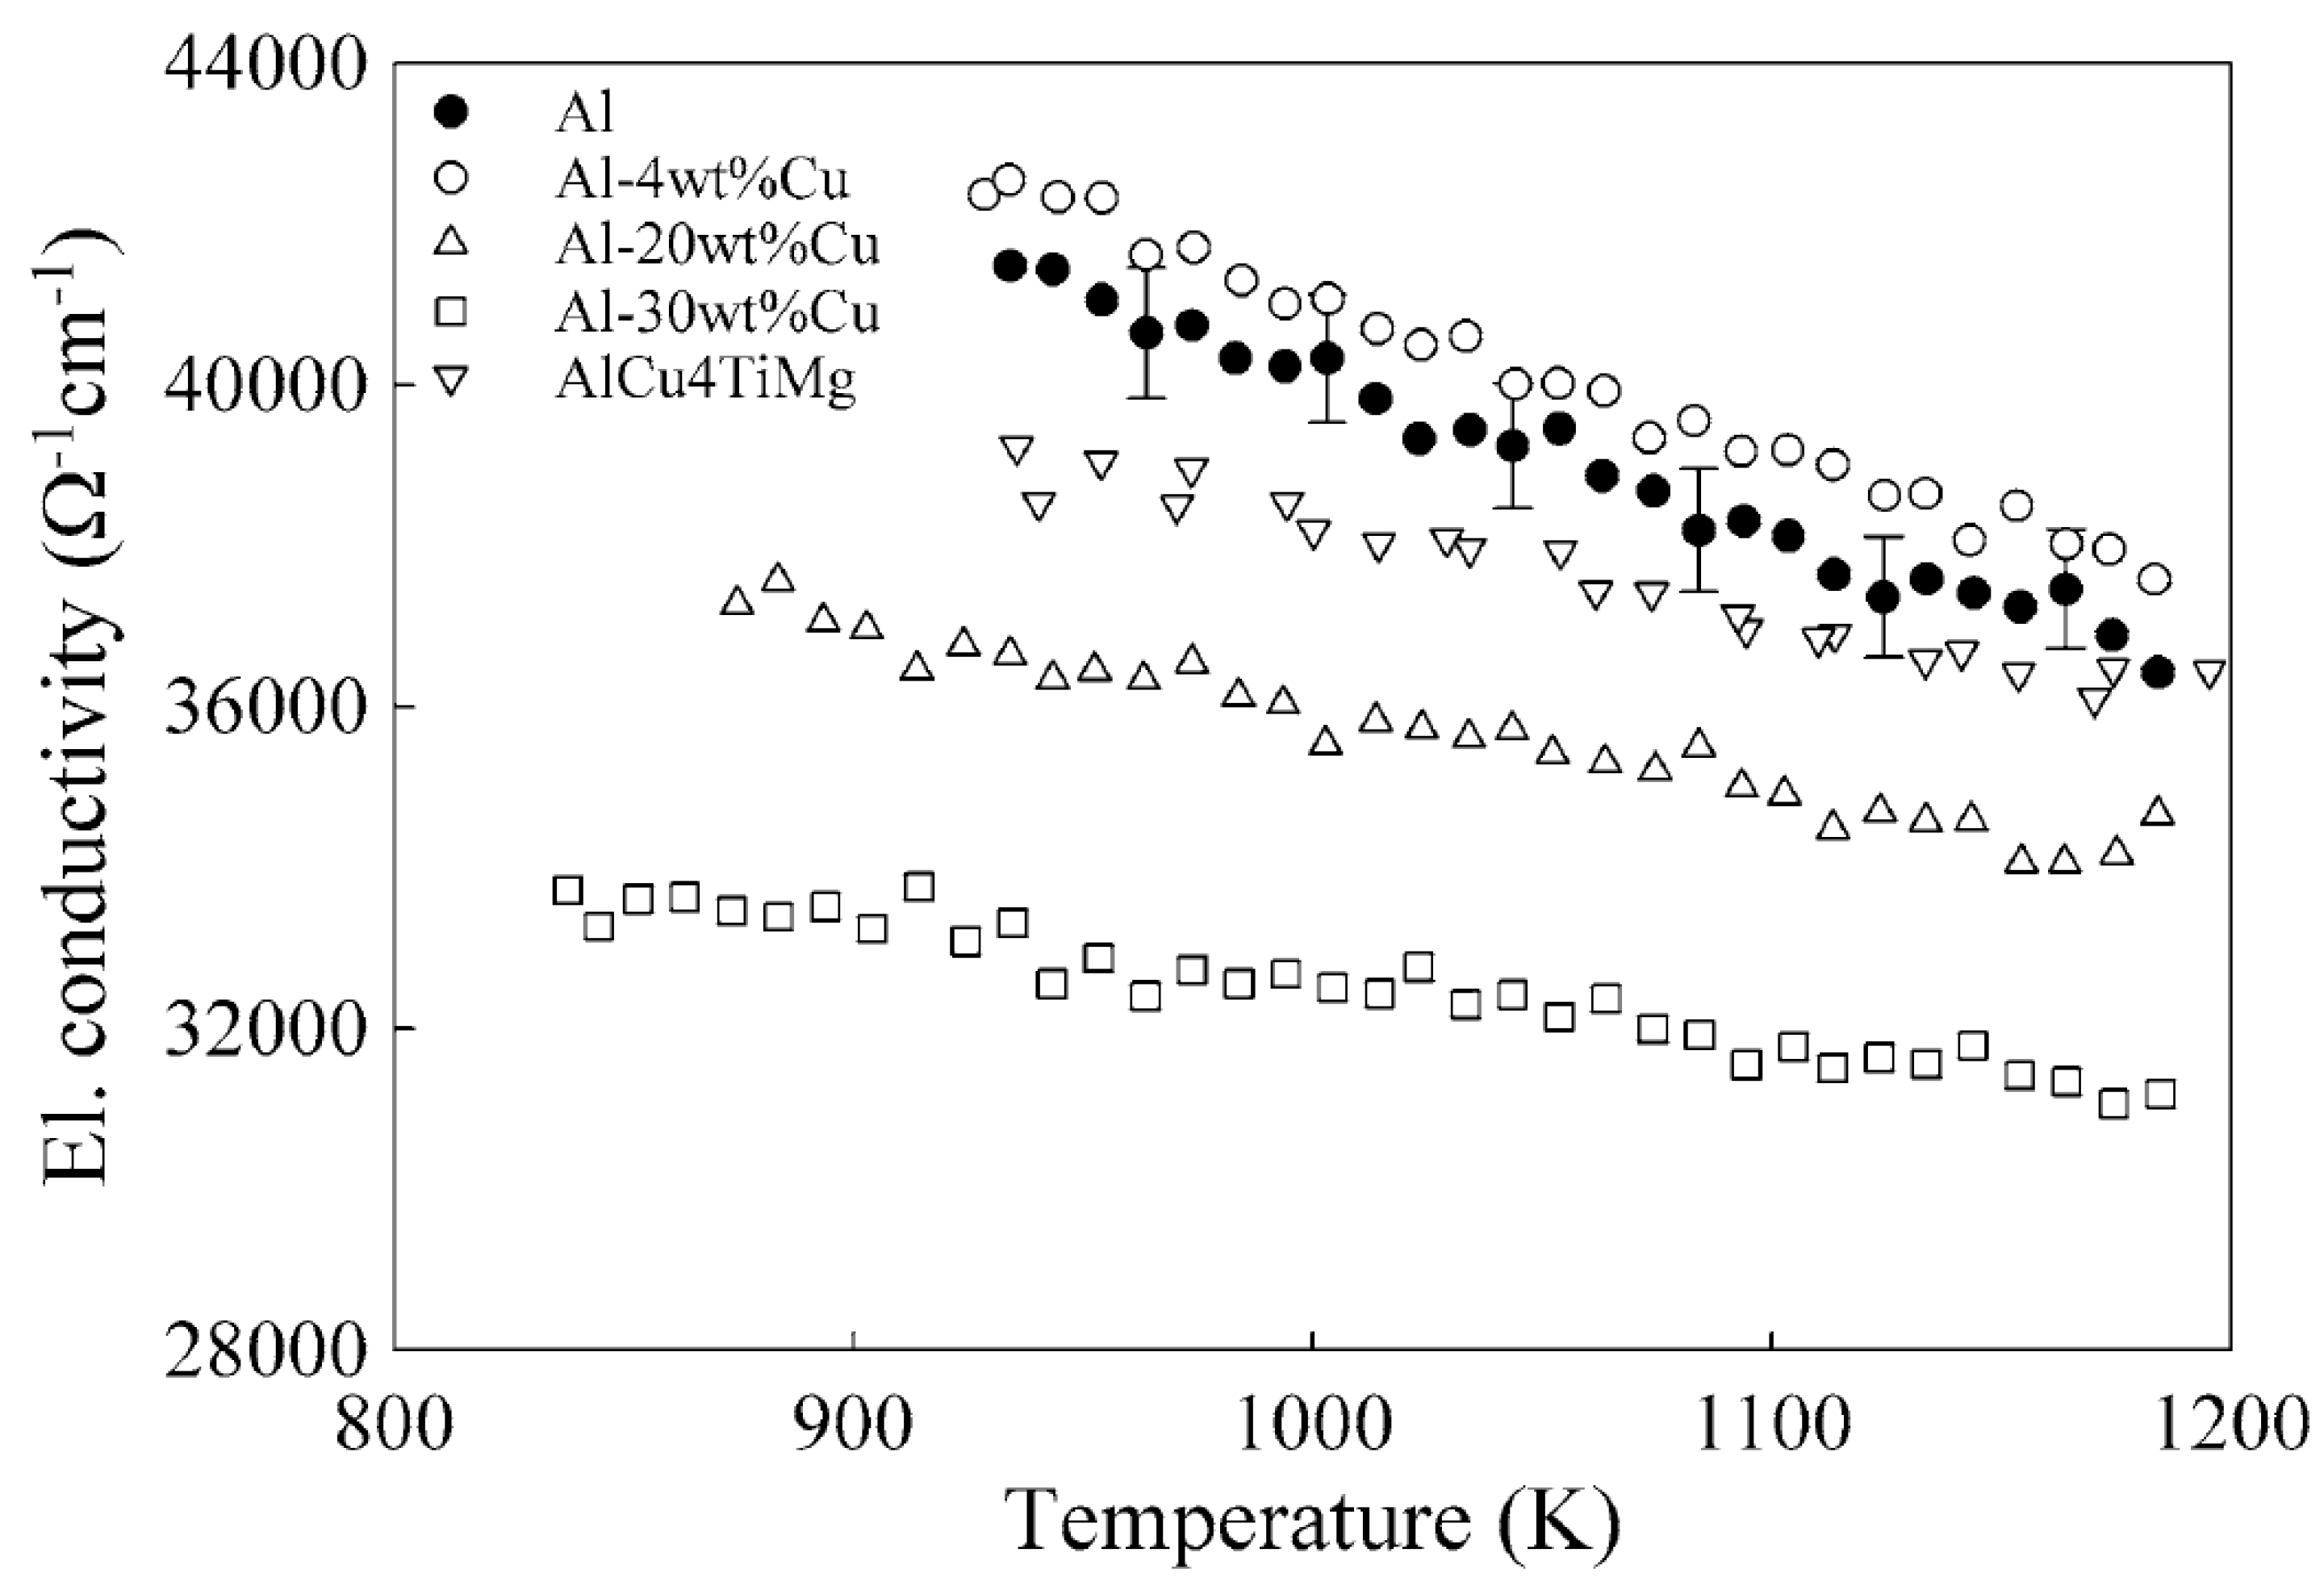
| Alloy | TL (K) | σ0 (Ω−1cm−1) | dσ/dT (Ω−1cm−1K−1) |
|---|---|---|---|
| Al | 933 | 41,400 | −19.36 |
| Al-4 wt% Cu | 922 | 42,600 | −19.13 |
| Al-20 wt% Cu | 873 | 37,300 | −10.2 |
| Al-30 wt% Cu | 836 | 33,800 | −7.34 |
| AlCu4TiMg | 931 | 39,100 | −11.72 |
| Experiment | Si | Cu | Mg |
|---|---|---|---|
| s-1 | 3% | 0.5% | 0.3% |
| s-2 | 3% | 1.0% | 0.6% |
| s-3 | 3% | 1.5% | 0.9% |
| s-4 | 4% | 0.5% | 0.6% |
| s-5 | 4% | 1.0% | 0.9% |
| s-6 | 4% | 1.5% | 0.3% |
| s-7 | 5% | 0.5% | 0.3% |
| s-8 | 5% | 1.0% | 0.3% |
| s-9 | 5% | 1.5% | 0.6% |
| UTS/MPa | Elongation (%) | HBS | σ/(MS·m−1) | |||||
|---|---|---|---|---|---|---|---|---|
| F | T6 | F | T6 | F | T6 | F | T6 | |
| s-1 | 180 | 298 | 7.46 | 3.92 | 49 | 90 | 25.3(42.2%IACS) | 25.7(42.8%IACS) |
| s-2 | 179 | 313 | 3.43 | 1.68 | 69 | 119 | 24.6(41.0%IACS) | 25.1(41.8%IACS) |
| s-3 | 188 | 289 | 3.14 | 1.58 | 77 | 125 | 24.0(40.0%IACS) | 24.3(40.5%IACS) |
| s-4 | 185 | 338 | 3.61 | 1.78 | 73 | 112 | 24.1(40.2%IACS) | 26.3(43.8%IACS) |
| s-5 | 166 | 321 | 2.4 | 1.68 | 74 | 119 | 23.2(38.7%IACS) | 24.5(40.8%IACS) |
| s-6 | 183 | 325 | 3.92 | 2.58 | 64 | 111 | 23.7(39.5%IACS) | 24.9(41.5%IACS) |
| s-7 | 161 | 287 | 1.89 | 1.78 | 72 | 116 | 22.7(37.8%IACS) | 25.1(41.8%IACS) |
| s-8 | 169 | 300 | 3.6 | 2.59 | 65 | 103 | 23.1(38.5%IACS) | 24.8(41.3%IACS) |
| s-9 | 180 | 282 | 2.8 | 0.7 | 75 | 126 | 22.4(37.3%IACS) | 24.0(40.0%IACS) |
| x-1 | 164 | 316 | 3.39 | 1.48 | 66 | 110 | 23.9(39.8%IACS) | 23.8(39.7%IACS) |
| x-2 | 190 | 313 | 4.42 | 1.55 | 68 | 121 | 22.8(38.0%IACS) | 23.7(39.5%IACS) |
| Property | Alloy | ||
|---|---|---|---|
| Al-1Si-0.4Mg-0.03Ti | Al-3.6Si-0.4Mg-0.03Ti | Al-5.3Ni-0.35Fe-0.03Ti | |
| Conductivity (as cast, %IACS) | 50 | 47 | 50 |
| Conductivity (T5—225 °C/2 h, %IACS) | 53 | 50 | Not applicable (NA) |
| Yield strength (as cast, MPa) | 110 | 110 | 90 |
| Yield strength (T5—225 °C/2 h, MPa) | 160 | 150 | Not applicable (NA) |
| UTS (as cast, MPa) | 160 | 170 | 150 |
| Strengthening and Element | Strengths | Electrical Conductivity | References | |
|---|---|---|---|---|
| Strengthening Mechanism | Solid Solutions Strengthening | Good | Poor | [40,41,42,43,44,45,46,47,48,49,50] |
| Precipitation Strengthening | Good | Poor | ||
| Dislocation Strengthening | Good | Poor | ||
| Grain Boundary Strengthening | Good | Poor | ||
| Elements | Silicon (Si) | Good | Limited | [16,43,50] |
| Magnesium (Mg) | Good | Limited | ||
| Copper (Cu) | Good | Poor | ||
| Nickel (Ni) | Good | Unknown | ||
| Strontium (Sr) | Limit | Unknown | ||
Publisher’s Note: MDPI stays neutral with regard to jurisdictional claims in published maps and institutional affiliations. |
© 2022 by the authors. Licensee MDPI, Basel, Switzerland. This article is an open access article distributed under the terms and conditions of the Creative Commons Attribution (CC BY) license (https://creativecommons.org/licenses/by/4.0/).
Share and Cite
Li, Y.; Hu, A.; Fu, Y.; Liu, S.; Shen, W.; Hu, H.; Nie, X. Al Alloys and Casting Processes for Induction Motor Applications in Battery-Powered Electric Vehicles: A Review. Metals 2022, 12, 216. https://doi.org/10.3390/met12020216
Li Y, Hu A, Fu Y, Liu S, Shen W, Hu H, Nie X. Al Alloys and Casting Processes for Induction Motor Applications in Battery-Powered Electric Vehicles: A Review. Metals. 2022; 12(2):216. https://doi.org/10.3390/met12020216
Chicago/Turabian StyleLi, Yuxian, Anita Hu, Yintian Fu, Sufeng Liu, Wutian Shen, Henry Hu, and Xueyuan Nie. 2022. "Al Alloys and Casting Processes for Induction Motor Applications in Battery-Powered Electric Vehicles: A Review" Metals 12, no. 2: 216. https://doi.org/10.3390/met12020216
APA StyleLi, Y., Hu, A., Fu, Y., Liu, S., Shen, W., Hu, H., & Nie, X. (2022). Al Alloys and Casting Processes for Induction Motor Applications in Battery-Powered Electric Vehicles: A Review. Metals, 12(2), 216. https://doi.org/10.3390/met12020216