Article

Numerical Study on Asymmetrical Rolled Aluminum Alloy Sheets Using the Visco-Plastic Self-Consistent (VPSC) Method

1
Centre of Mechanical Technology and Automation (TEMA), Department of Mechanical Engineering, University of Aveiro, 3810-193 Aveiro, Portugal
2
Department of Engineering, Lancaster University, Lancaster LA1 4YR, UK
3
Department of Materials and Ceramic Engineering, CICECO, University of Aveiro, 3810-193 Aveiro, Portugal
*
Author to whom correspondence should be addressed.
Metals 2022, 12(6), 979; https://doi.org/10.3390/met12060979
Submission received: 14 May 2022 / Revised: 30 May 2022 / Accepted: 5 June 2022 / Published: 7 June 2022

Abstract

:
Asymmetric rolling is a forming process that has raised interest among researchers due to the significant improvements it introduces to the mechanical response of metals. The main objective of the present work is to perform a numerical study on asymmetrical rolled aluminum alloy sheets to identify and correlate the effect of the additional shear strain component on the material formability, tensile strength, and texture orientations development during multi-pass metal forming. Conventional (CR), asymmetric continuous (ASR-C), and asymmetric rolling-reverse (ASR-R) simulations were carried out using the visco-plastic self-consistent (VPSC) code. For the ASR process, two different shear strain values were prescribed. Moreover, two hardening models were considered: a Voce-type law and a dislocation-based model that accounts for strain path changes during metal forming. Results showed that the ASR process is able to improve the plastic strain ratio and tensile strength. The ASR-C revealed better results, although the expected shear orientations are only evident in the ASR-R process.

1. Introduction

Aluminum alloy sheets have raised particular interest in the automotive industry because of their mechanical and physical properties, combined with excellent performance while meeting eco-sustainability and lightweight requirements. However, rolled sheets present a cube orientation due to recrystallization, which results in lower deep-drawability [1]. Thus, the asymmetric rolling (ASR) process emerged as an alternative to conventional rolling to improve the material properties, such as increased strength and formability, due to grain refinement, shear texture components, or both [2].
One way to investigate and predict texture development and mechanical properties during metal forming is through numerical analysis. Computational methods estimate certain unknowns according to input data and constitutive models, which gives a better understanding of the process parameters and outcomes. Wroński and coworkers [3,4,5] implemented the polycrystalline deformation Leffers–Wierzbanowski (LW) model in the finite element commercial software ABAQUS to predict deformation texture orientations and bending behavior during asymmetric rolling of low carbon steel and an AA-6061 alloy. Simulations showed that the ASR process improves metal formability. Furthermore, experiments validated the numerical model. The FACET/ALAMEL approach presented by Shore and coworkers [6] was able to predict the plastic anisotropy of aluminum alloy sheets and examine the texture evolution during the ASR process. Their results showed more favorable texture changes for the ASR in the latest steps of the process. Tam, Nakamachi, Kuramae, and coworkers [7,8,9] implemented a dynamic-explicit crystallographic homogenized elasto-viscoplastic finite element coupled model to investigate rolled aluminum alloy sheets and reached similar conclusions regarding the formability improvement in asymmetric rolled sheets. The visco-plastic self-consistent (VPSC) model is another suitable formulation for predicting texture evolution and returning macroscopic material properties during the ASR process. The VPSC is a polycrystal model developed by Molinari and coworkers [10] and Lebensohn and Tomé [11,12] that adopts a theoretical homogeneous environment (HEM) described by the average constitutive law of the polycrystal. Furthermore, it considers that the grain is an ellipsoidal inclusion embedded in the HEM. The interaction between the grain and the HEM can be used to estimate the interaction between the grain and all the other crystals. The VPSC is based on the mechanisms of slip and twinning systems activated by a resolved shear stress and returns the macroscopic stress–strain response and texture evolution during the processes simulations. Tamimi and coworkers [13] used the VPSC model to predict the mechanical behavior of an AA-5182 alloy and respective texture evolutions during conventional rolling, asymmetric continuous, and asymmetric rolling-reverse processes. The goal was to investigate the plastic anisotropy and improve the plastic strain ratio (also known as the R-value). The results showed shear texture components, suggesting a higher plastic strain ratio. Also, experiments were conducted and compared with numerical analysis showing good agreement. The asymmetric-rolled AA-5182 alloy was also investigated by Grácio and coworkers [14], in which the anisotropic yield criteria Yld2000 [15] coupled with the M–K theory [16] was considered. Simulation results showed a more isotropic material for the asymmetric rolling-reverse process. More recently, Dhinwal and Toth [17] used the VPSC approach to study asymmetric rolled low carbon steel sheets. The material hardening model was based on the work of Kalidindi and coworkers [18,19] and Zhou and coworkers [20]. They observed that simulating rolling and shear in different steps resulted in better texture predictions than simulating both deformation processes simultaneously. To study the effect of strain path changes in low carbon steel, Kitayama and coworkers [21] extended the model proposed by Rauch and coworkers [22] and implemented their new dislocation-based hardening model in the VPSC code. However, it did not account for back-stress effects. This feature was added by Wen and coworkers to model tensile tests with reloads on Mg alloy sheets [23] and cyclic shear and tensile loads on low carbon steel sheets [24]. The simulation results showed a significant improvement by replicating the material behavior during strain path changes.
In the present work, we perform rolling simulations of the plastic deformation of polycrystalline aggregates with the VPSC formulation to study the mechanical response and texture evolution of aluminum alloy sheets. Conventional, asymmetric continuous, and asymmetric rolling-reverse processes are investigated and compared considering: (a) different thickness reductions; (b) two different amounts of shear strain for the ASR processes; and (c) a Voce-type hardening law and the RGBV-based model proposed by Wen [24], referred to as DDR model from now on (acronym for dislocation density reverse).

2. Materials and Methods

The VPSC code [25] requires input files containing information about the simulation procedure and material parameters. Apart from the main input file (which contains the paths and file names, and other parameters for the run), the VPSC code needs to read from three external files:
  • The initial crystallographic texture, where the orientations are represented by a set of Euler angles with the respective volume fractions (weights);
  • The material model characterization, where the crystal symmetry, deformation modes, and material properties, such as elastic and thermal constants, are defined. The constitutive law with the respective coefficients and parameters is also specified in this file;
  • The test procedure, where we prescribe the velocity gradient, the load test conditions, the increment size, and the number of increments.

2.1. Texture Orientations

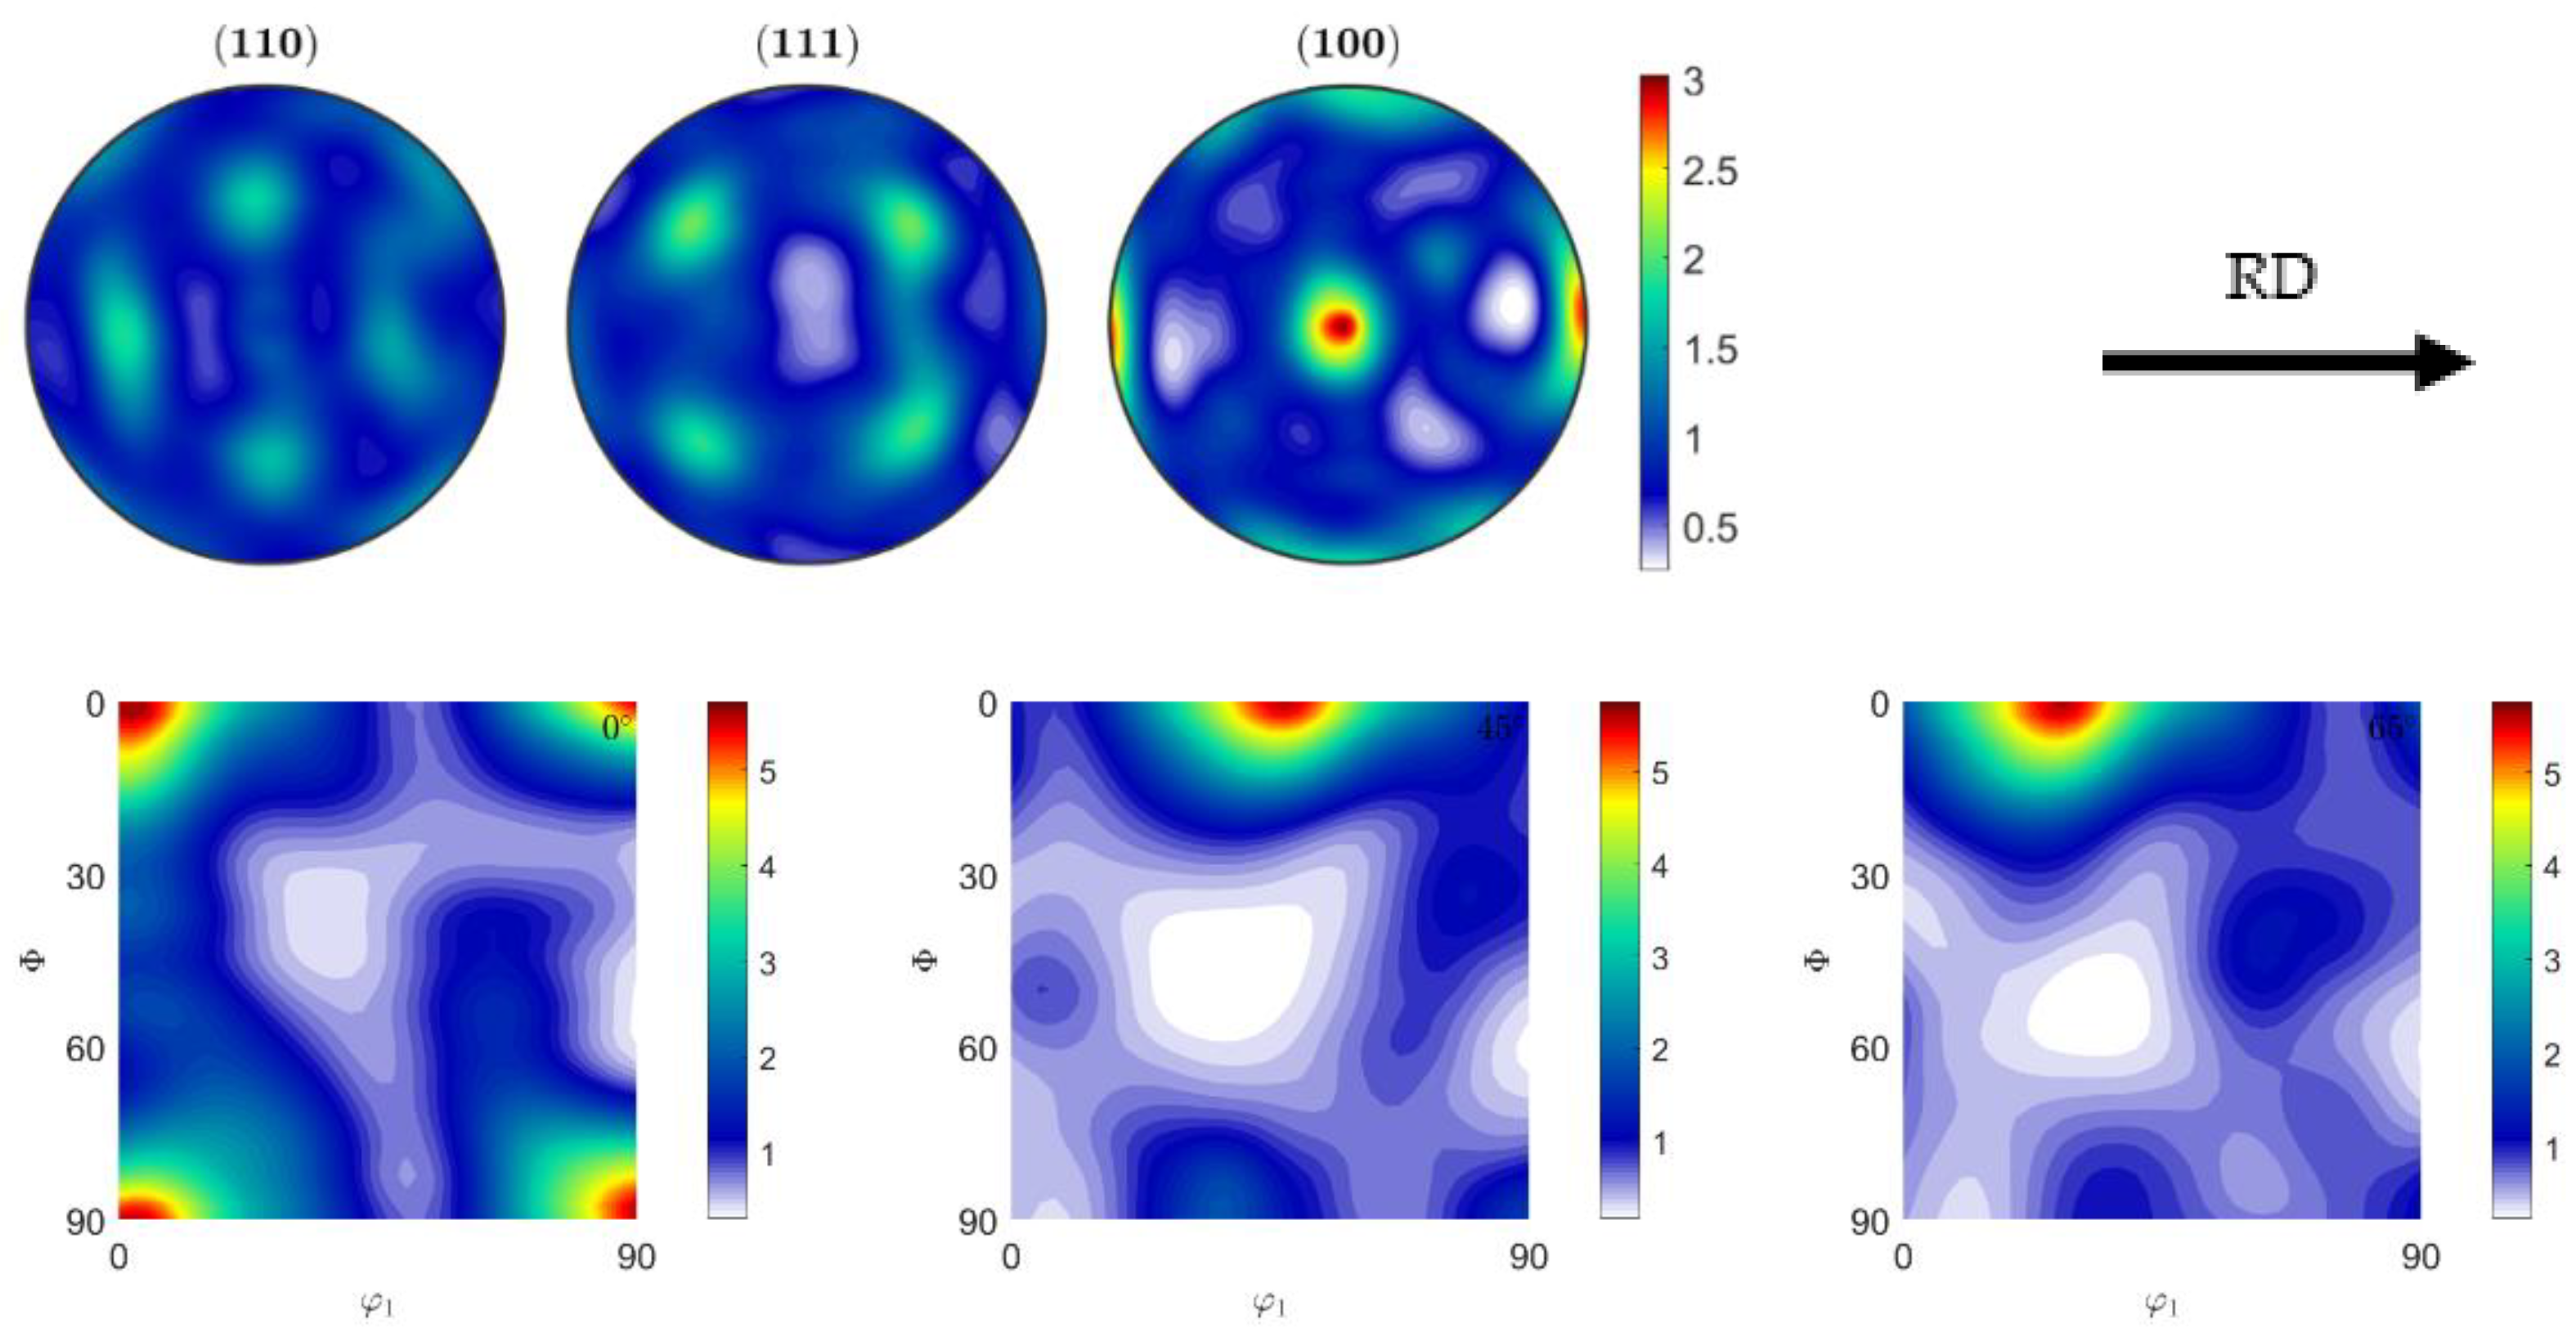
The material used in this work is the aluminum alloy 6061-T4. The chemical composition given by the supplier is presented in Table 1 and the electron backscatter diffraction (EBSD) orientations map of the initial material is represented in Figure 1. The respective {110}, {111}, and {100} pole figures and the Orientation Density Function (ODF) sections for φ2 = 0°, φ2 = 45°, and φ2 = 65, processed with the Matlab MTEX free toolbox [26], are presented in Figure 2. The ideal texture orientations for aluminum alloys are presented and further discussed in Section 3.3.

2.2. Material Modeling

As for the material characterization files, the twelve slip systems for FCC (face-centered cubic) materials were defined and two hardening laws were considered. First, a Voce-type law was considered, as follows:
τ = τ 0 + ( τ 1 + θ 1 Γ ) [ 1 e x p ( Γ | θ 0 τ 1 | ) ] ,
where the evolution of the threshold resolved shear stress, τ, is a function of the accumulated shear strain, Γ, in each grain. τ0 is the initial critical resolved shear stress (CRSS), θ0 is the initial hardening rate, θ1 is the asymptotic hardening rate, and (τ0 + τ1) is the back-extrapolated CRSS [25,27]. The values for the simulations are presented in Table 2.
Second, the dislocation-based hardening model, which considers dislocations accumulation and annihilation, and back-stress phenomena proposed by Wen and coworkers [24], was chosen to investigate the effects of strain path changes, specifically for the asymmetric rolling-reverse process. The constants for the model are presented in Table 3.
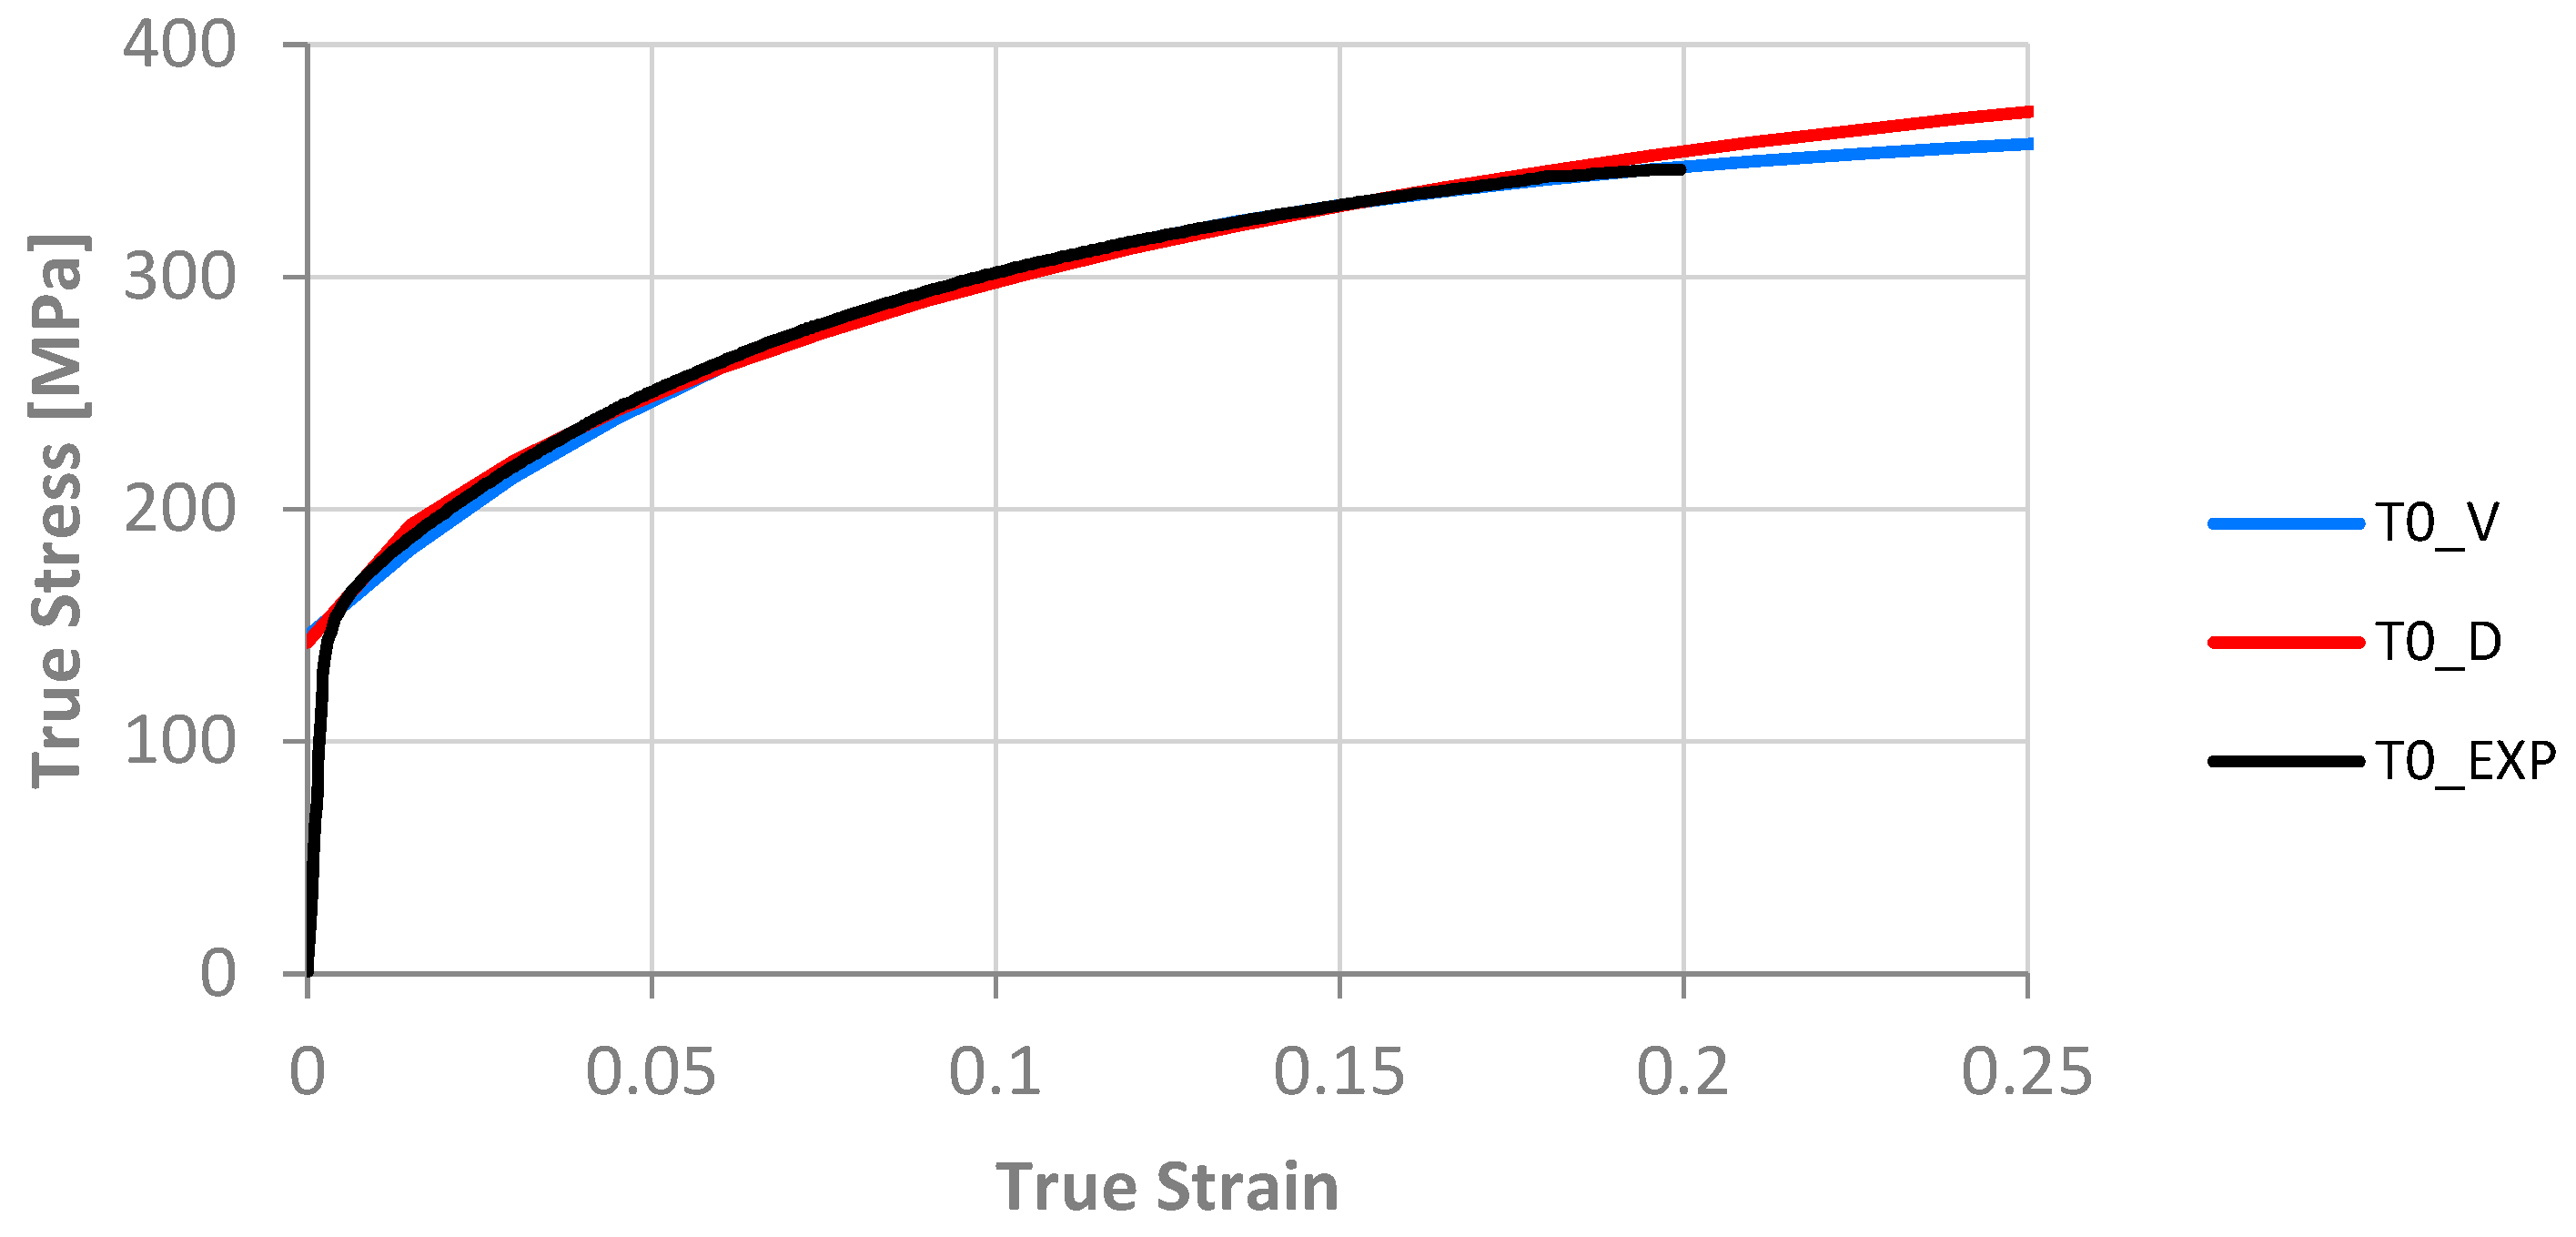
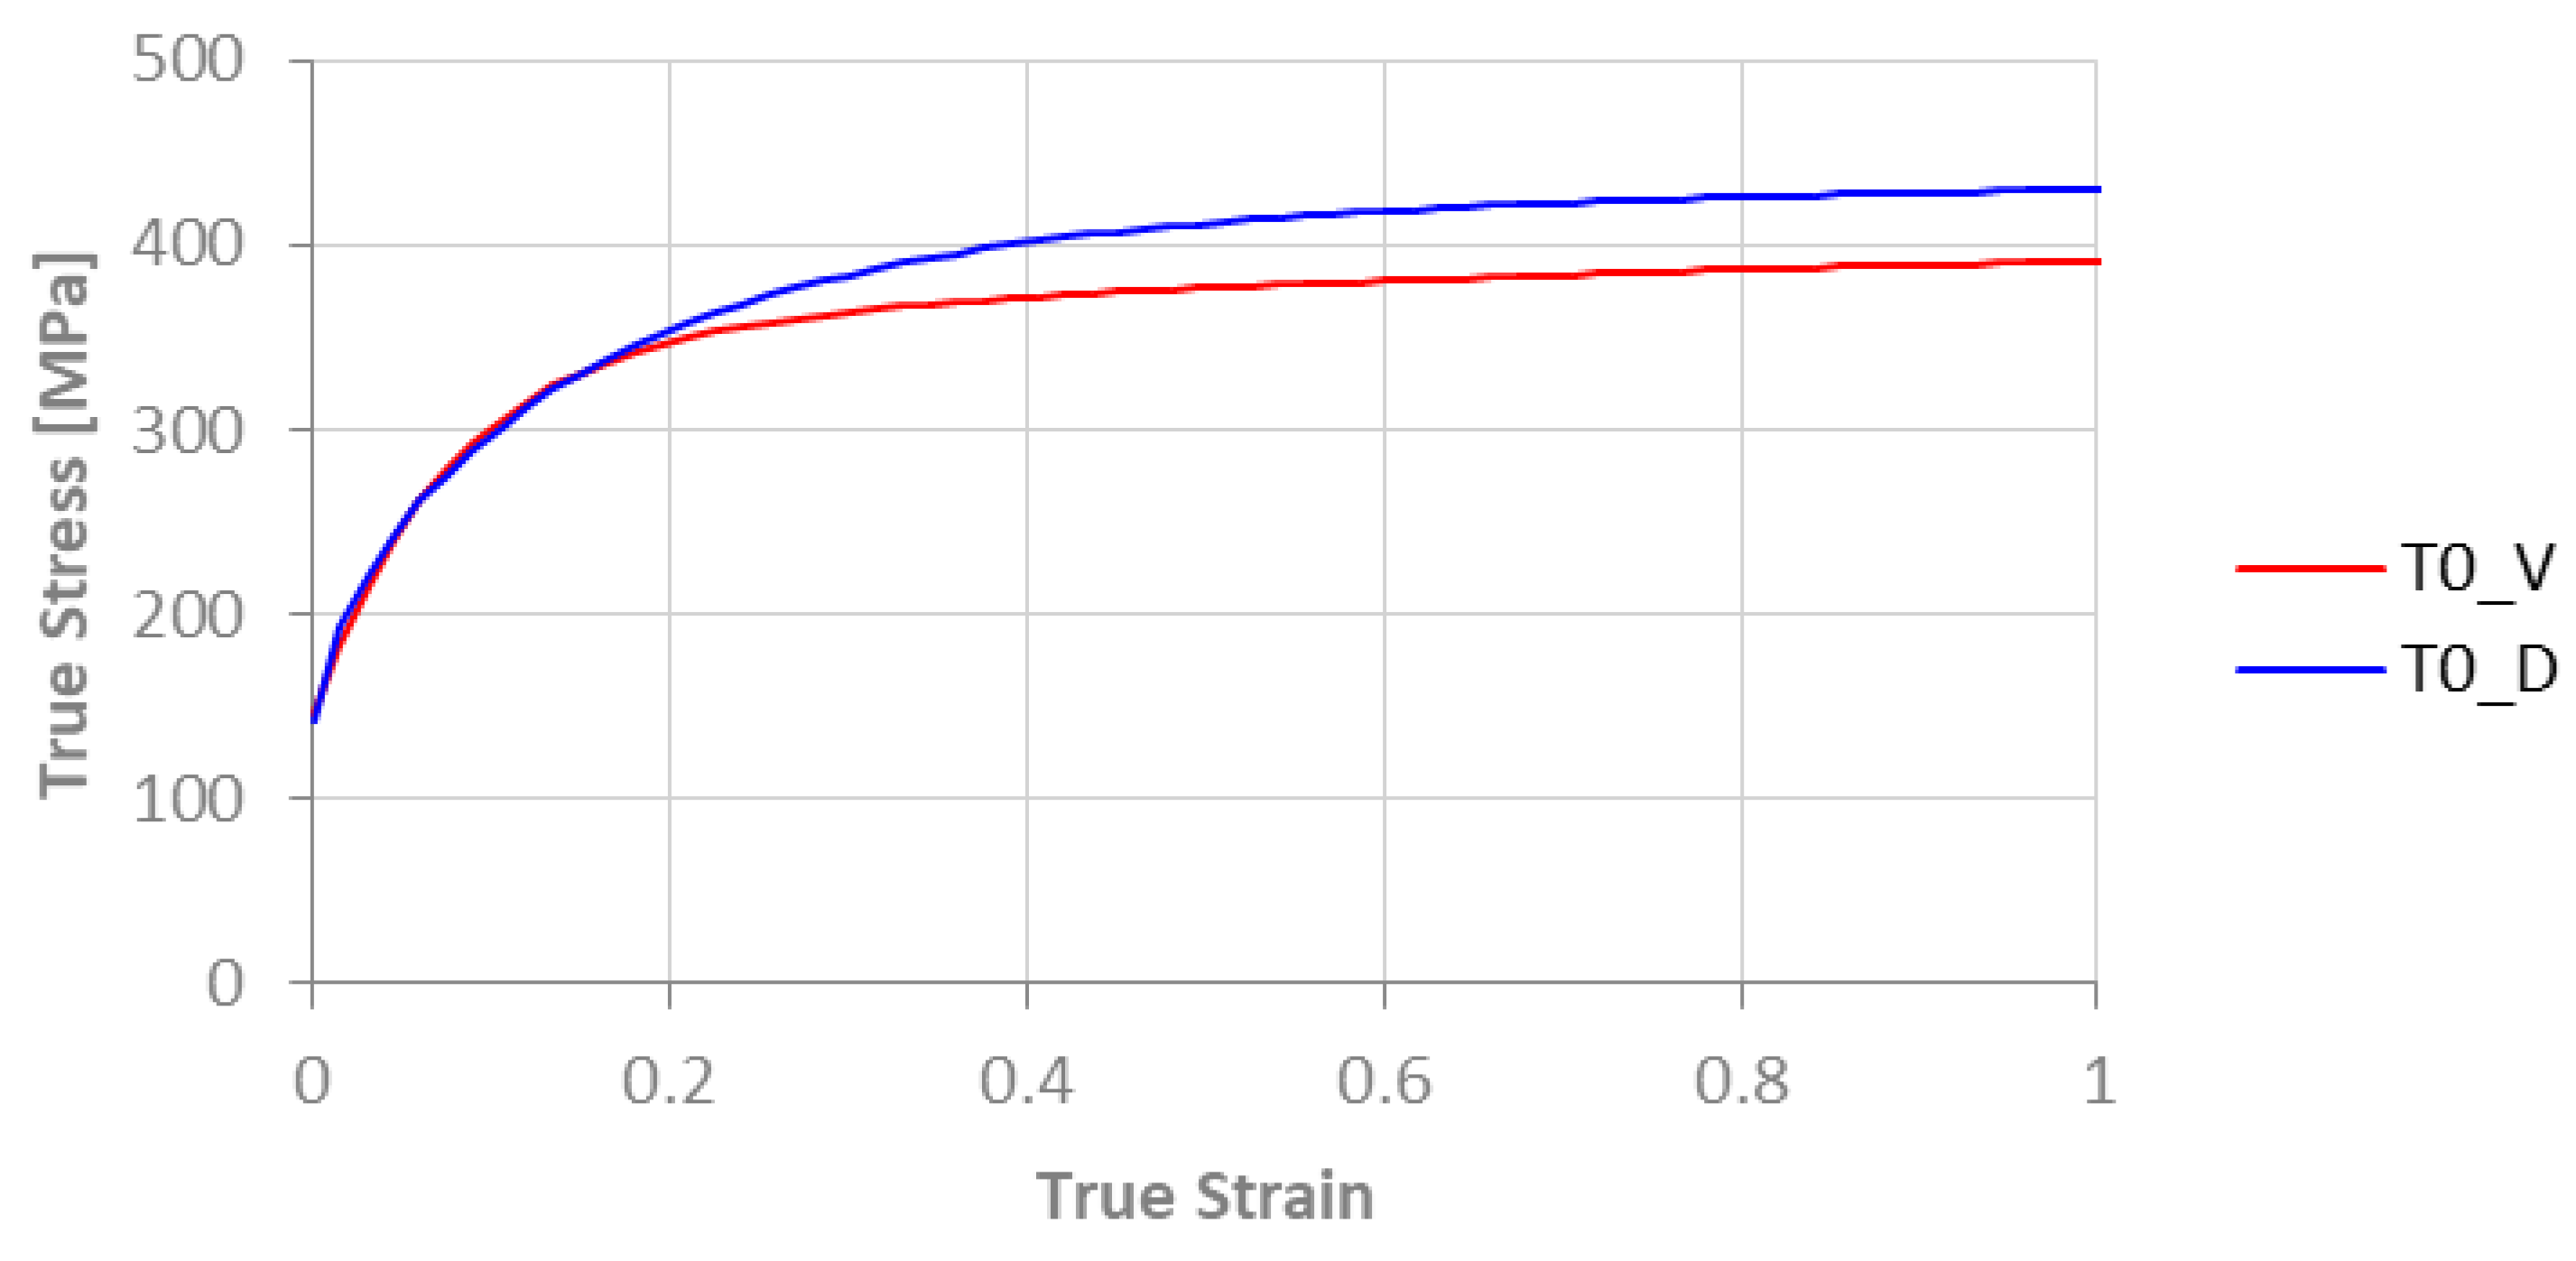
Tensile tests were simulated to verify the fitting of numerical models to experimental data. As can be seen in Figure 3, both models are able to describe the hardening behavior of the AA6061-T4 alloy. It should be noted that the two curves start to diverge for strain values greater than 0.2, where there is no real data information.

2.3. Simulation Boundary Conditions

The boundary conditions are defined in the process file, where it is possible to prescribe strain and stress components. For a conventional rolling test, a plain-strain condition is considered, and the corresponding reduction strain is incrementally imposed in the normal direction (compression). Assuming | ε | is the absolute value of the strain in the normal direction, caused by the thickness reduction, and L is the macroscopic velocity gradient, the strain tensor can be written as follows:
ε i j = [ ε 11 ε 12 ε 13 ε 21 ε 22 ε 23 ε 31 ε 32 ε 33 ] = 1 2 [ 2 ε 11 γ 12 γ 13 γ 21 2 ε 22 γ 23 γ 31 ε γ 32 2 ε 33 ] = | ε | L ,
where indices 1, 2, and 3 correspond to the rolling direction (RD), transverse direction (TD), and normal direction (ND), respectively. In a broader way, the normalized velocity gradient for rolling conditions can be stated as follows:
L = [ 1 0 p 0 0 0 0 0 1 ] ,
where p represents the presence of shear. That is, if p = 0, the process is conventional, whereas p ≠ 0 means an asymmetric rolling process.
Shear strain can be measured empirically by marking a vertical line along with the thickness of the sample before rolling. After the asymmetric rolling process, this line will present a slope, as represented in Figure 4. The relation between the slope angle and the shear deformation is shown in Equation (4).
p = ± γ 13 ε 33 ,     w h e r e     γ 13 = t a n ( θ ) ;  
In the present work, the thickness reductions of 20% and 30% were considered. For a 20% reduction in thickness, the corresponding strain component in the normal direction is ln ( 1 0.2 ) 0.2 , and for a 30% reduction in thickness, the corresponding strain is ln ( 1 0.3 ) 0.36 . As for the shear deformation, the angles of 7° and 12° were chosen to investigate the shear effect during the asymmetric rolling process. The parameters are summarized in Table 4.
It must be noted that, in the first step of the asymmetric rolling process, p > 0. For the continuous asymmetric rolling simulations, p > 0 in all subsequent steps. For the asymmetric rolling-reverse, p < 0 for even steps and p > 0 for odd steps.

3. Results and Discussion

In this section, we present and discuss the mechanical response of the simulated rolled AA6061-T4 and the texture evolution obtained by conventional (CR), asymmetrical continuous (ASR-C), and asymmetrical rolling-reverse (ASR-R) simulations. Two hardening models were applied, a Voce-type (V) and the DDR (D). For the asymmetric rolling conditions, two different shear strain values were prescribed, 0.12 (SH1) and 0.21 (SH2), corresponding to shear angles of 7° and 12°, respectively.

3.1. Stress-Strain Curves

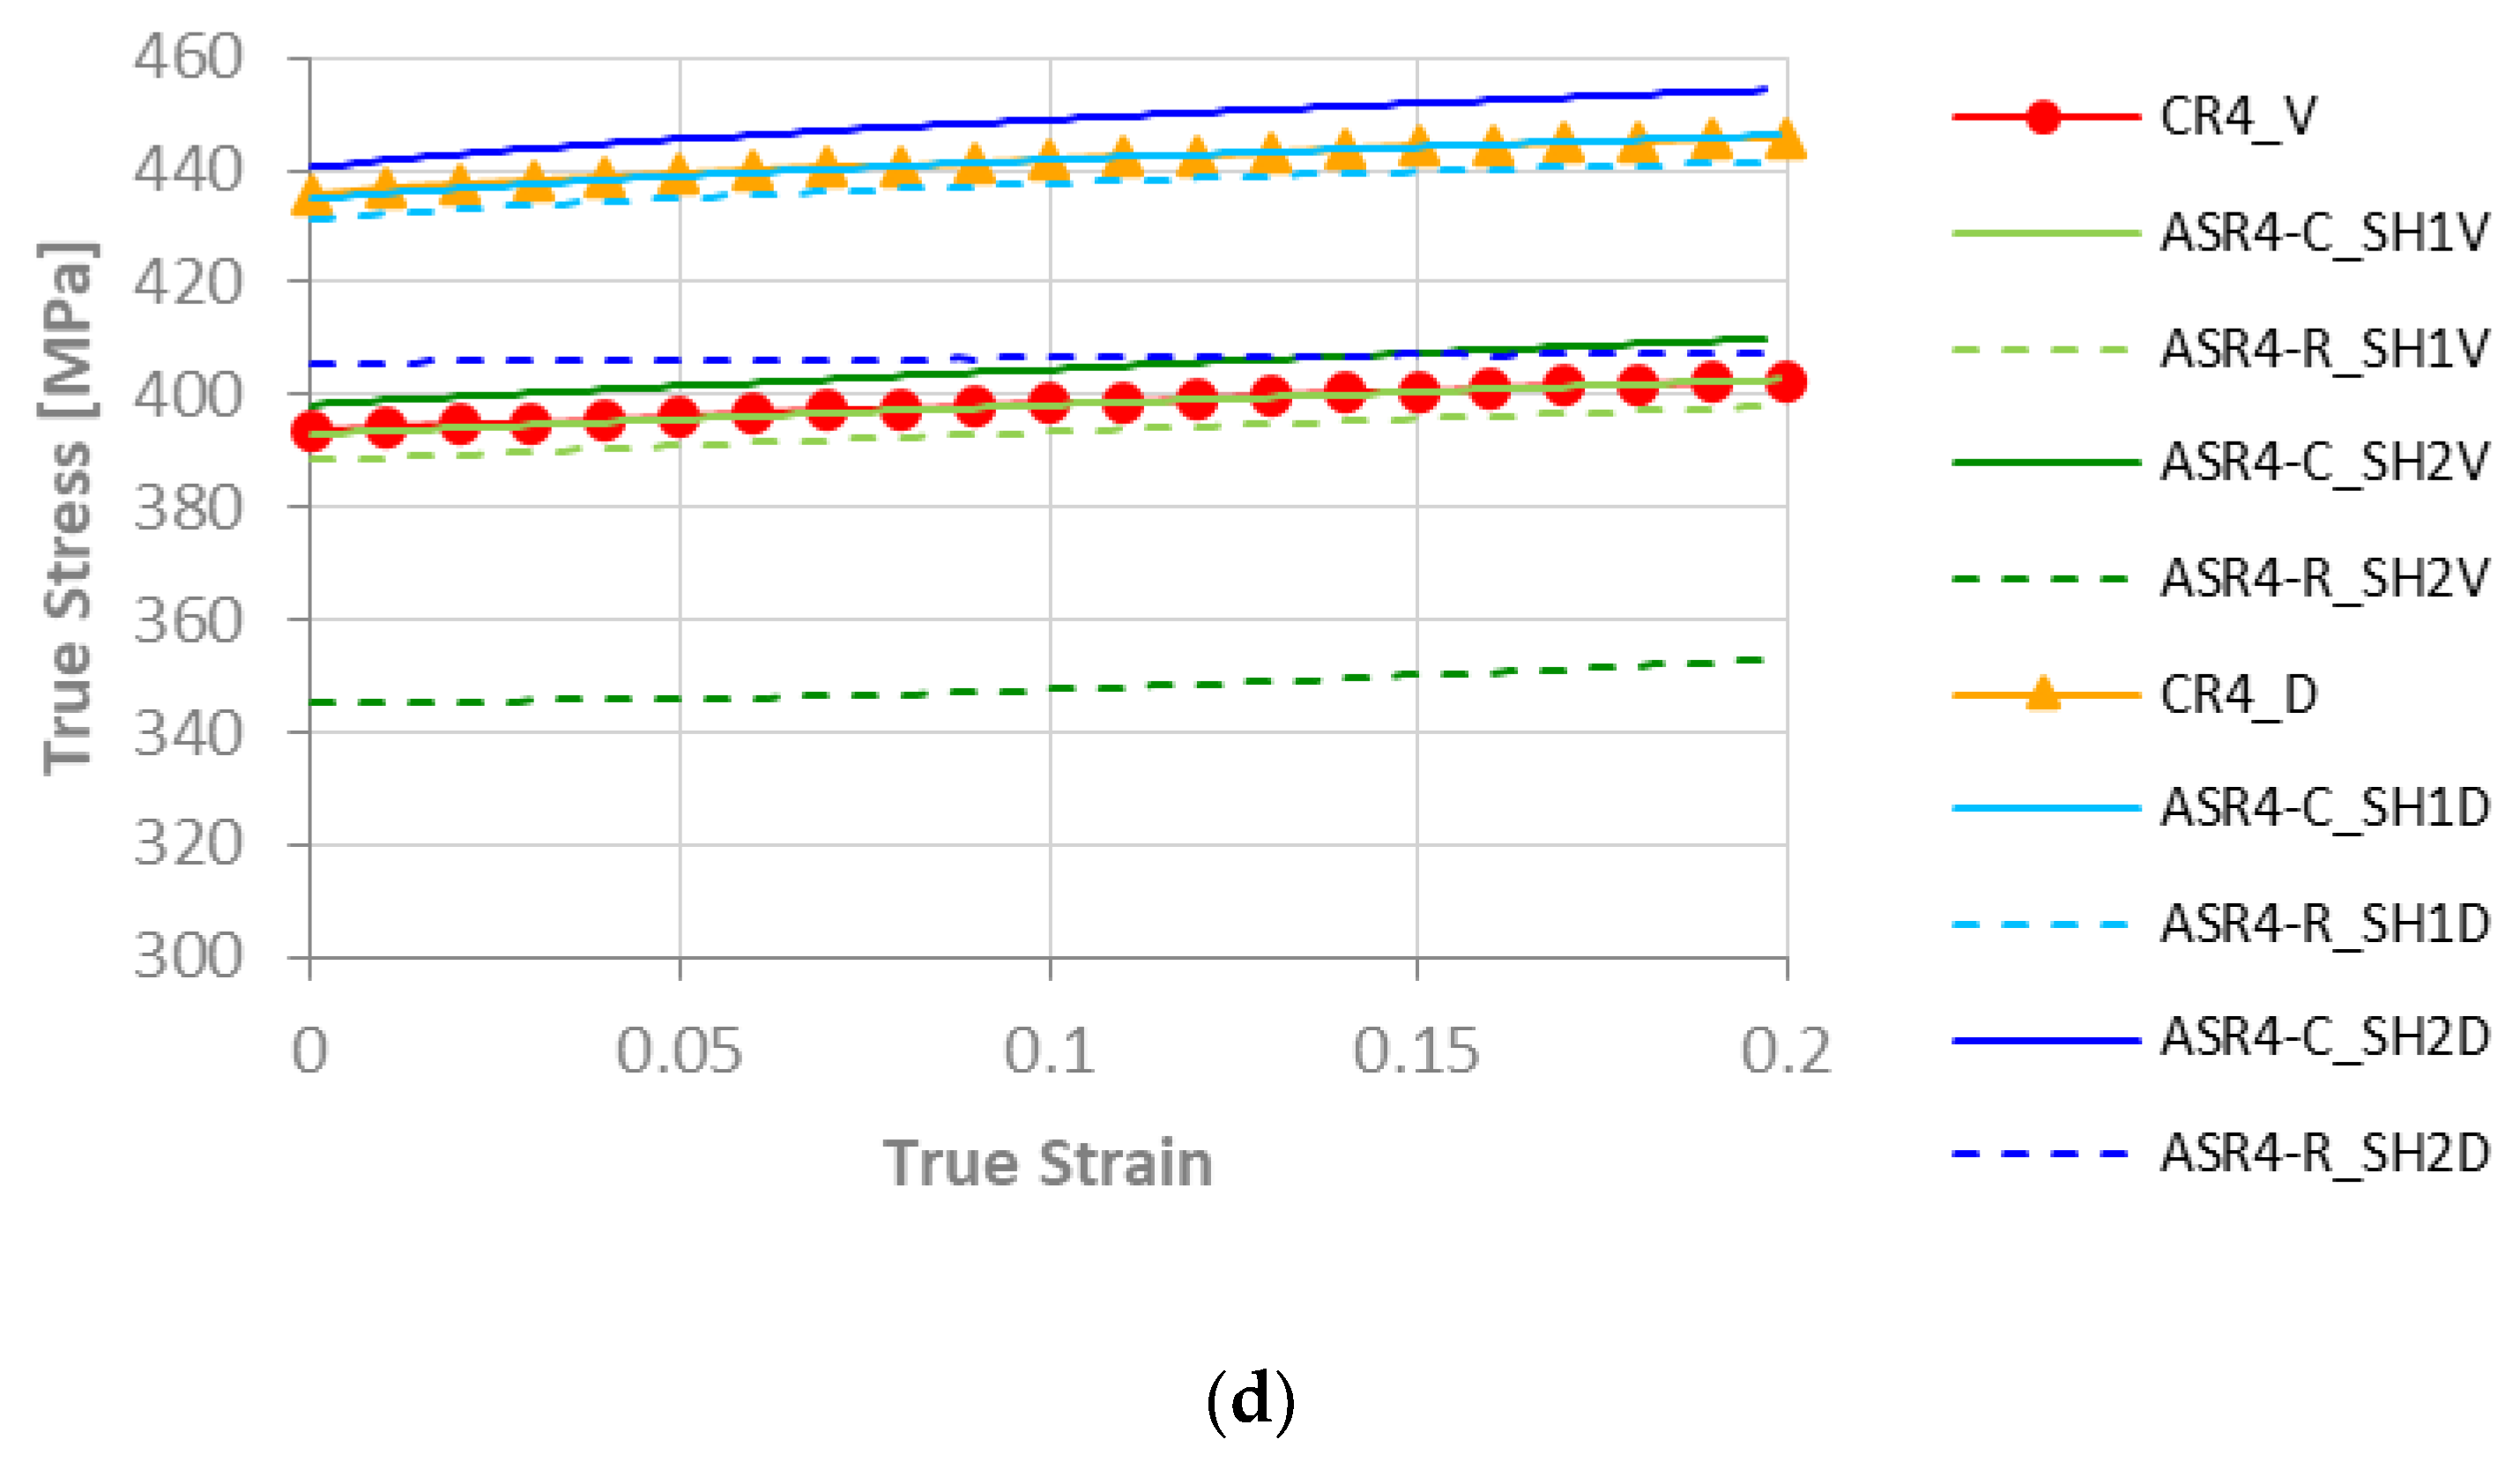
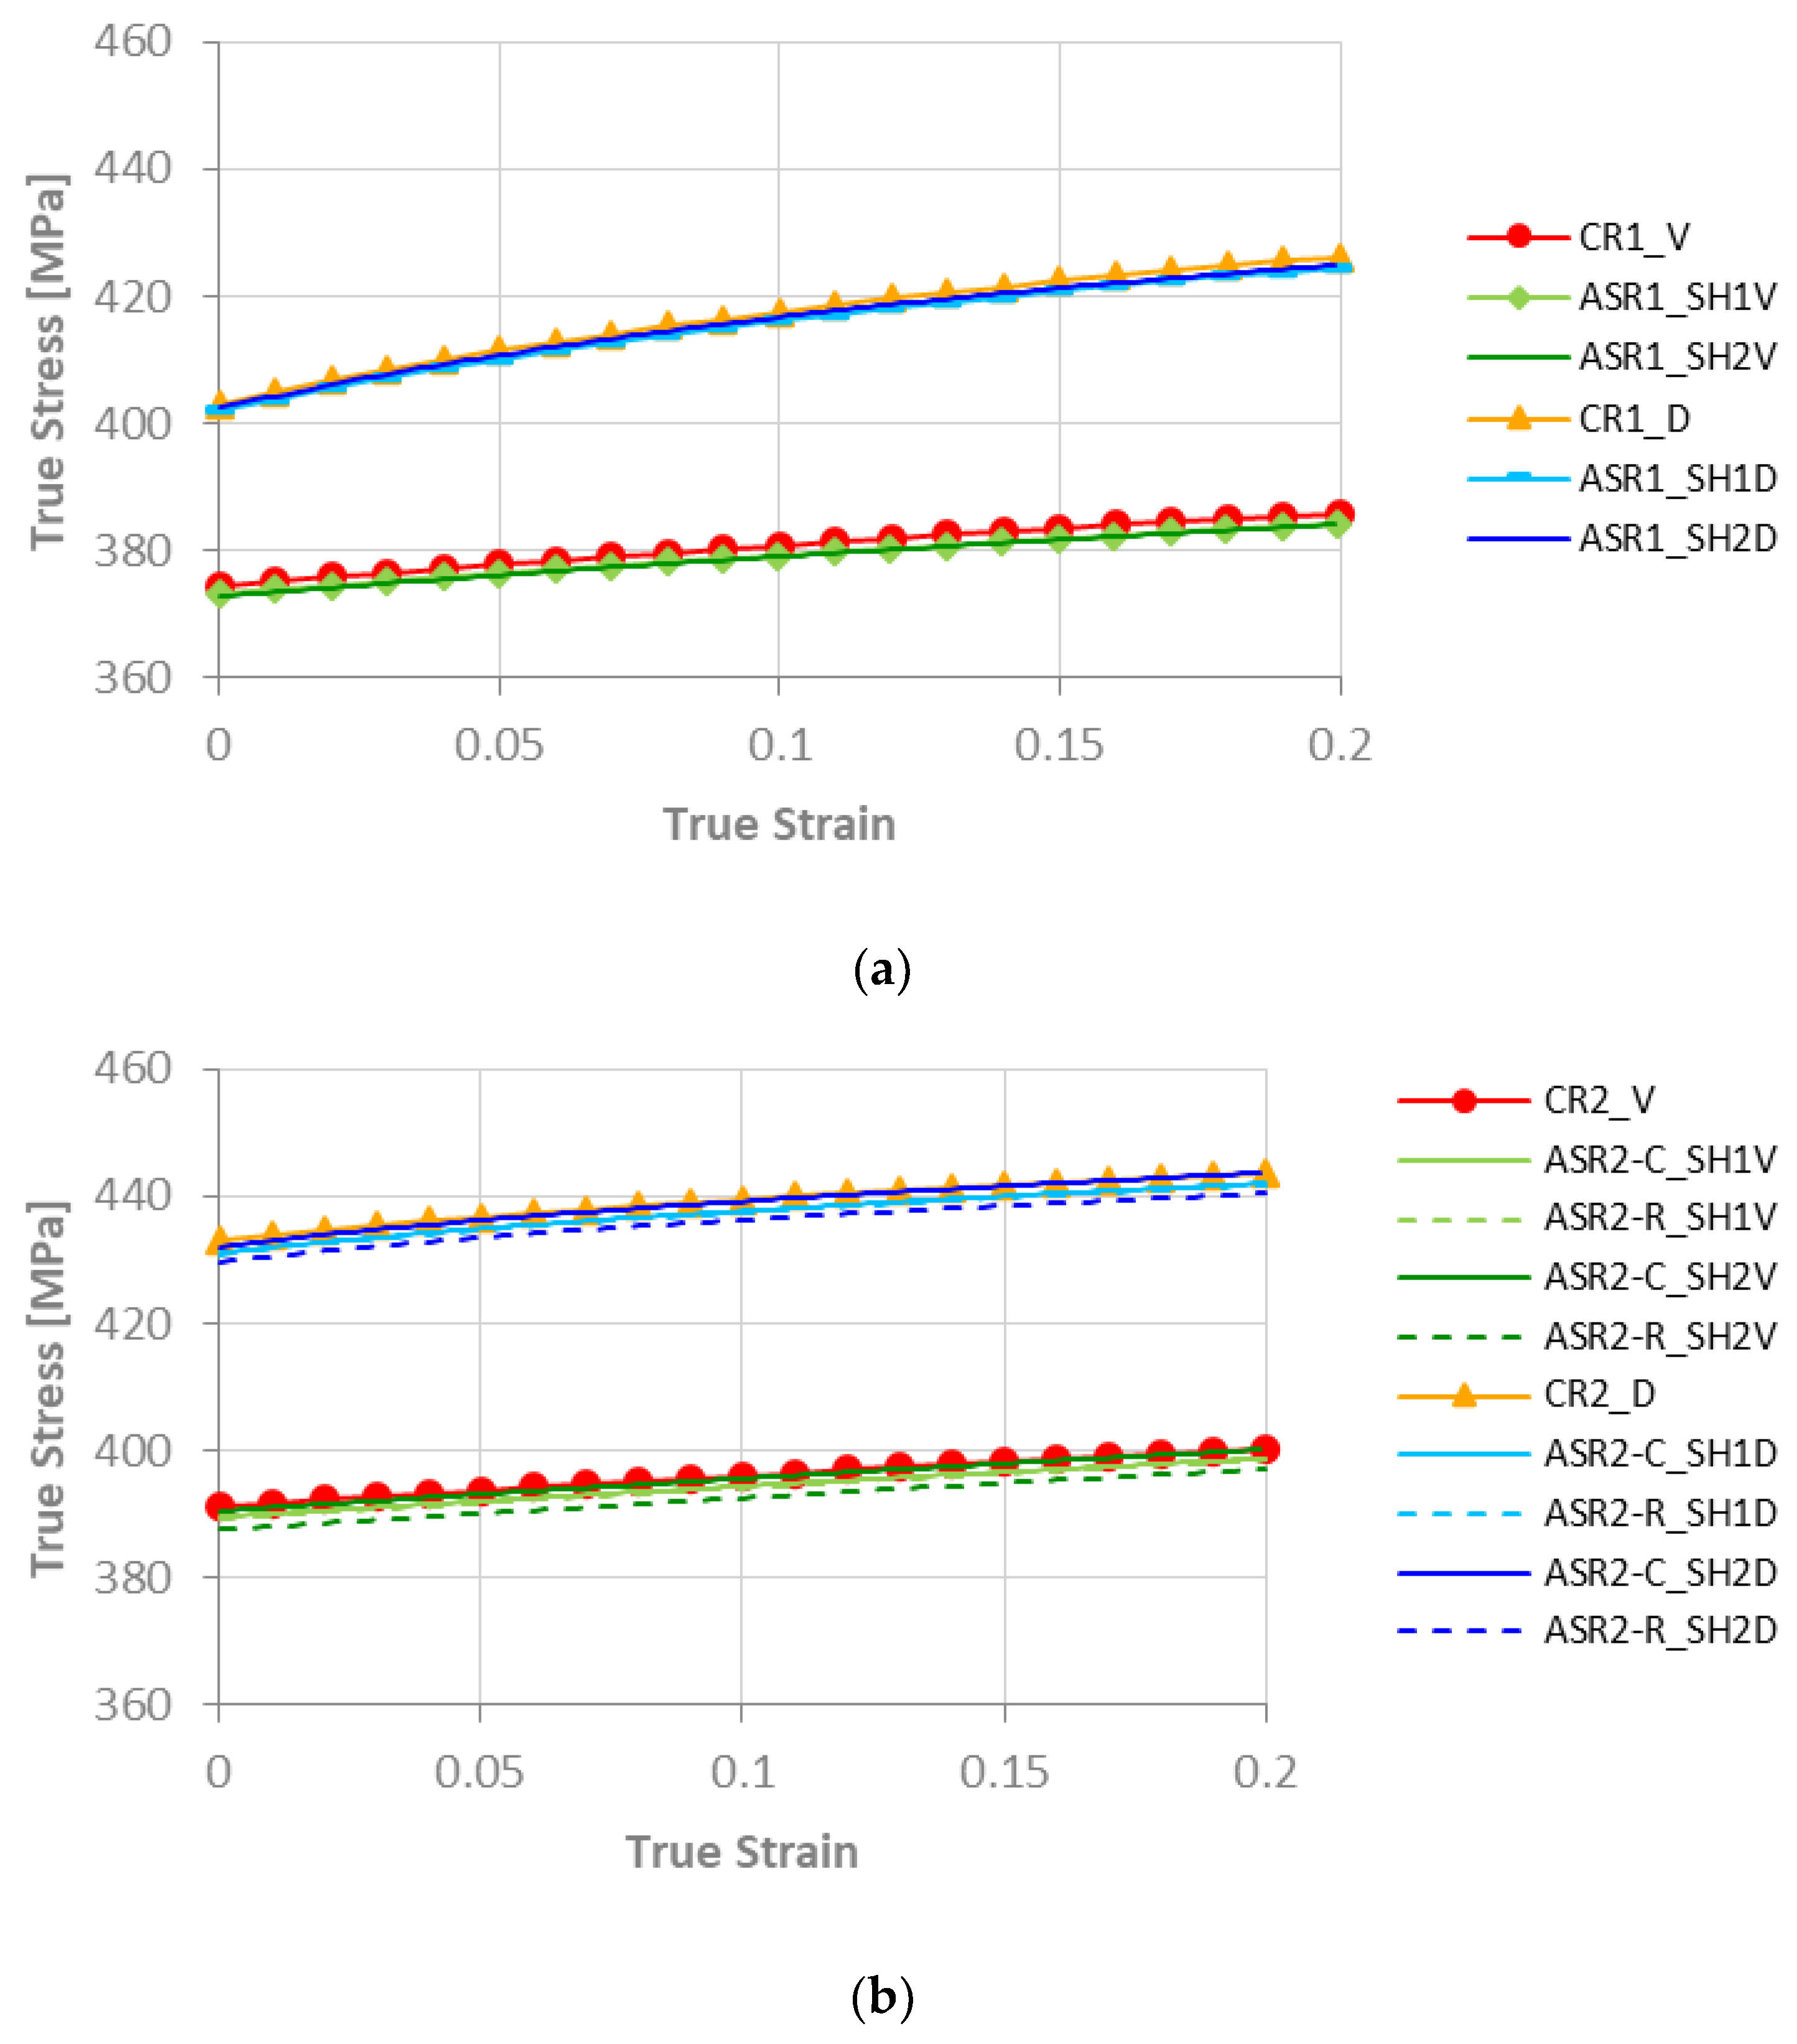
Figure 5 illustrates the true stress–strain curves after rolling grouped by the sequence pass number, of four-pass sequences with a 20% reduction. As can be seen, the Voce-type and DDR results follow the same tendency; however, for the same strain values, the DDR model returns higher stress values. The CR and ASR-C curves are almost coincident with the lower shear strain value, whereas for the higher value of shear strain, the stress values slightly increase. The ASR-R results reflect lower yield stress values compared to CR and ASR-C for both hardening rules, with more evidence for higher shear strain values.
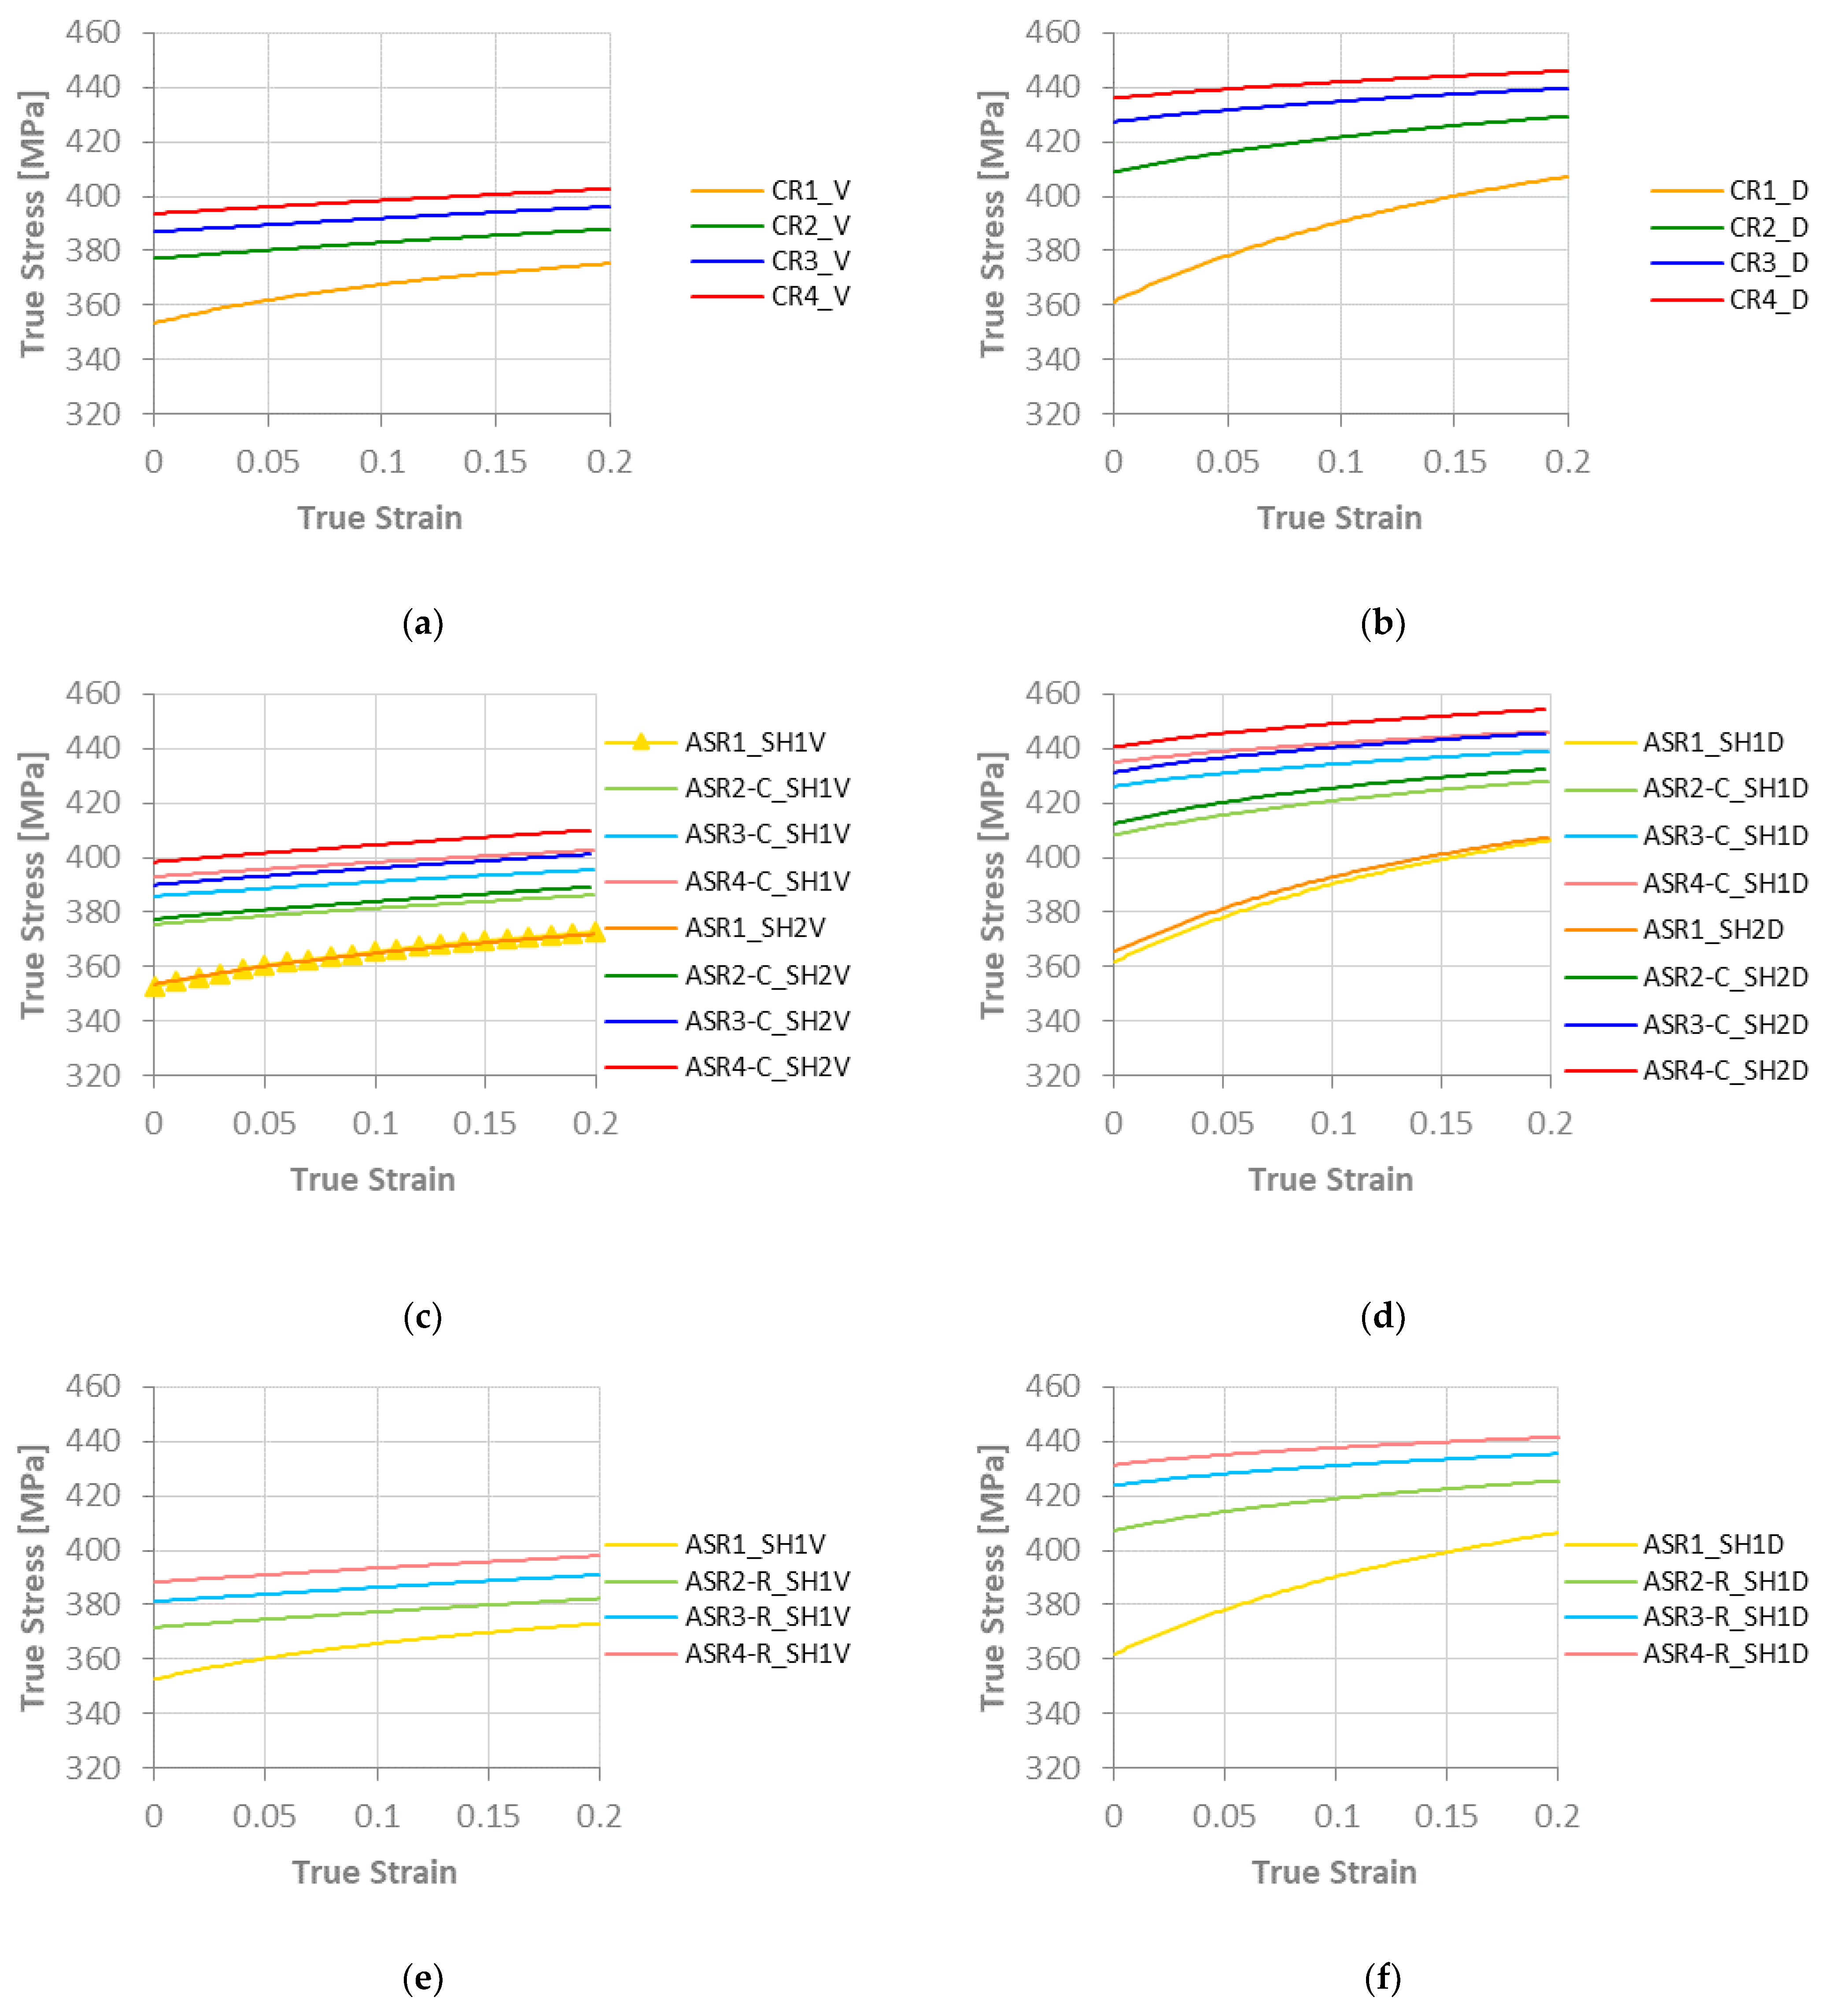
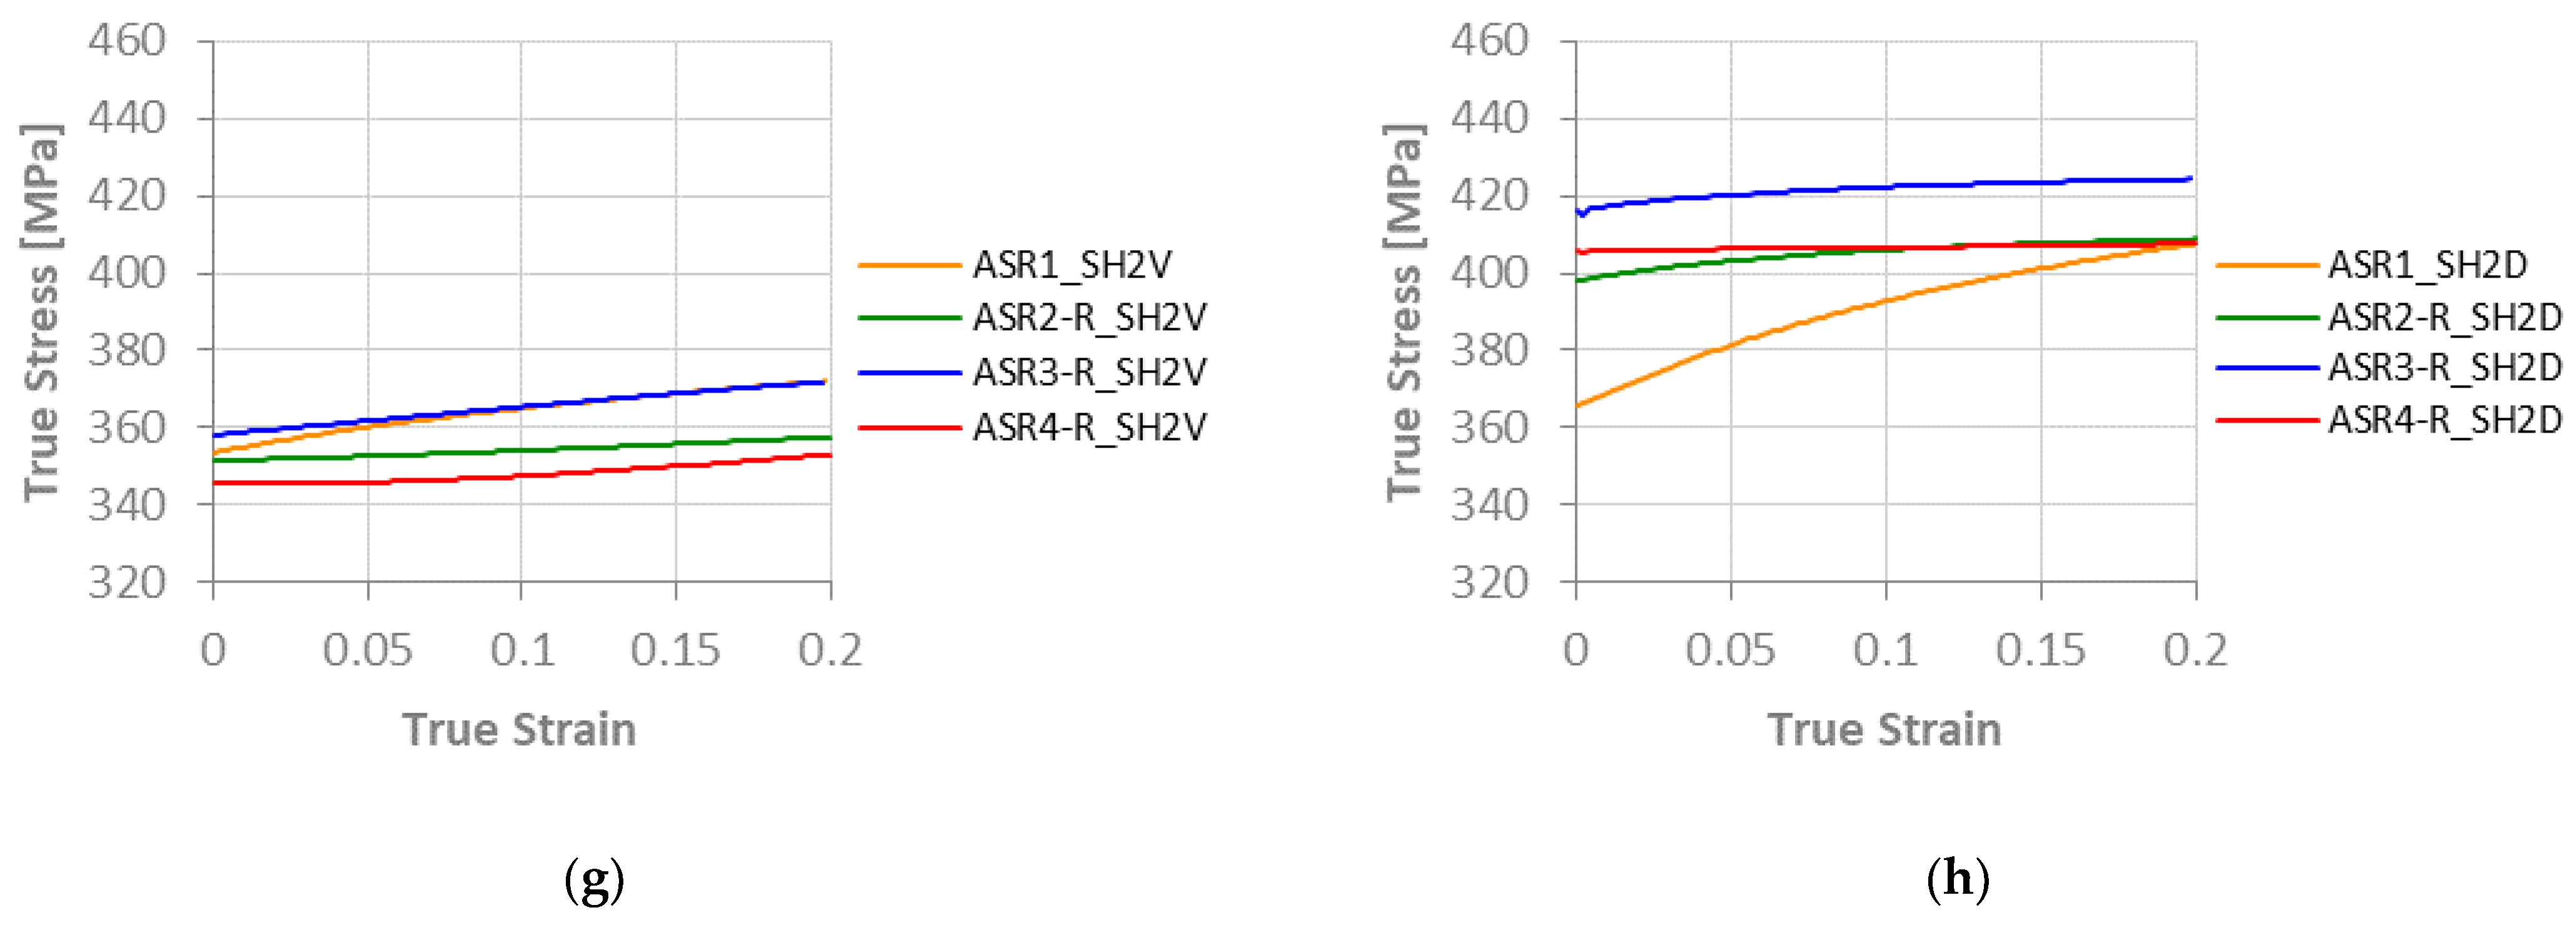
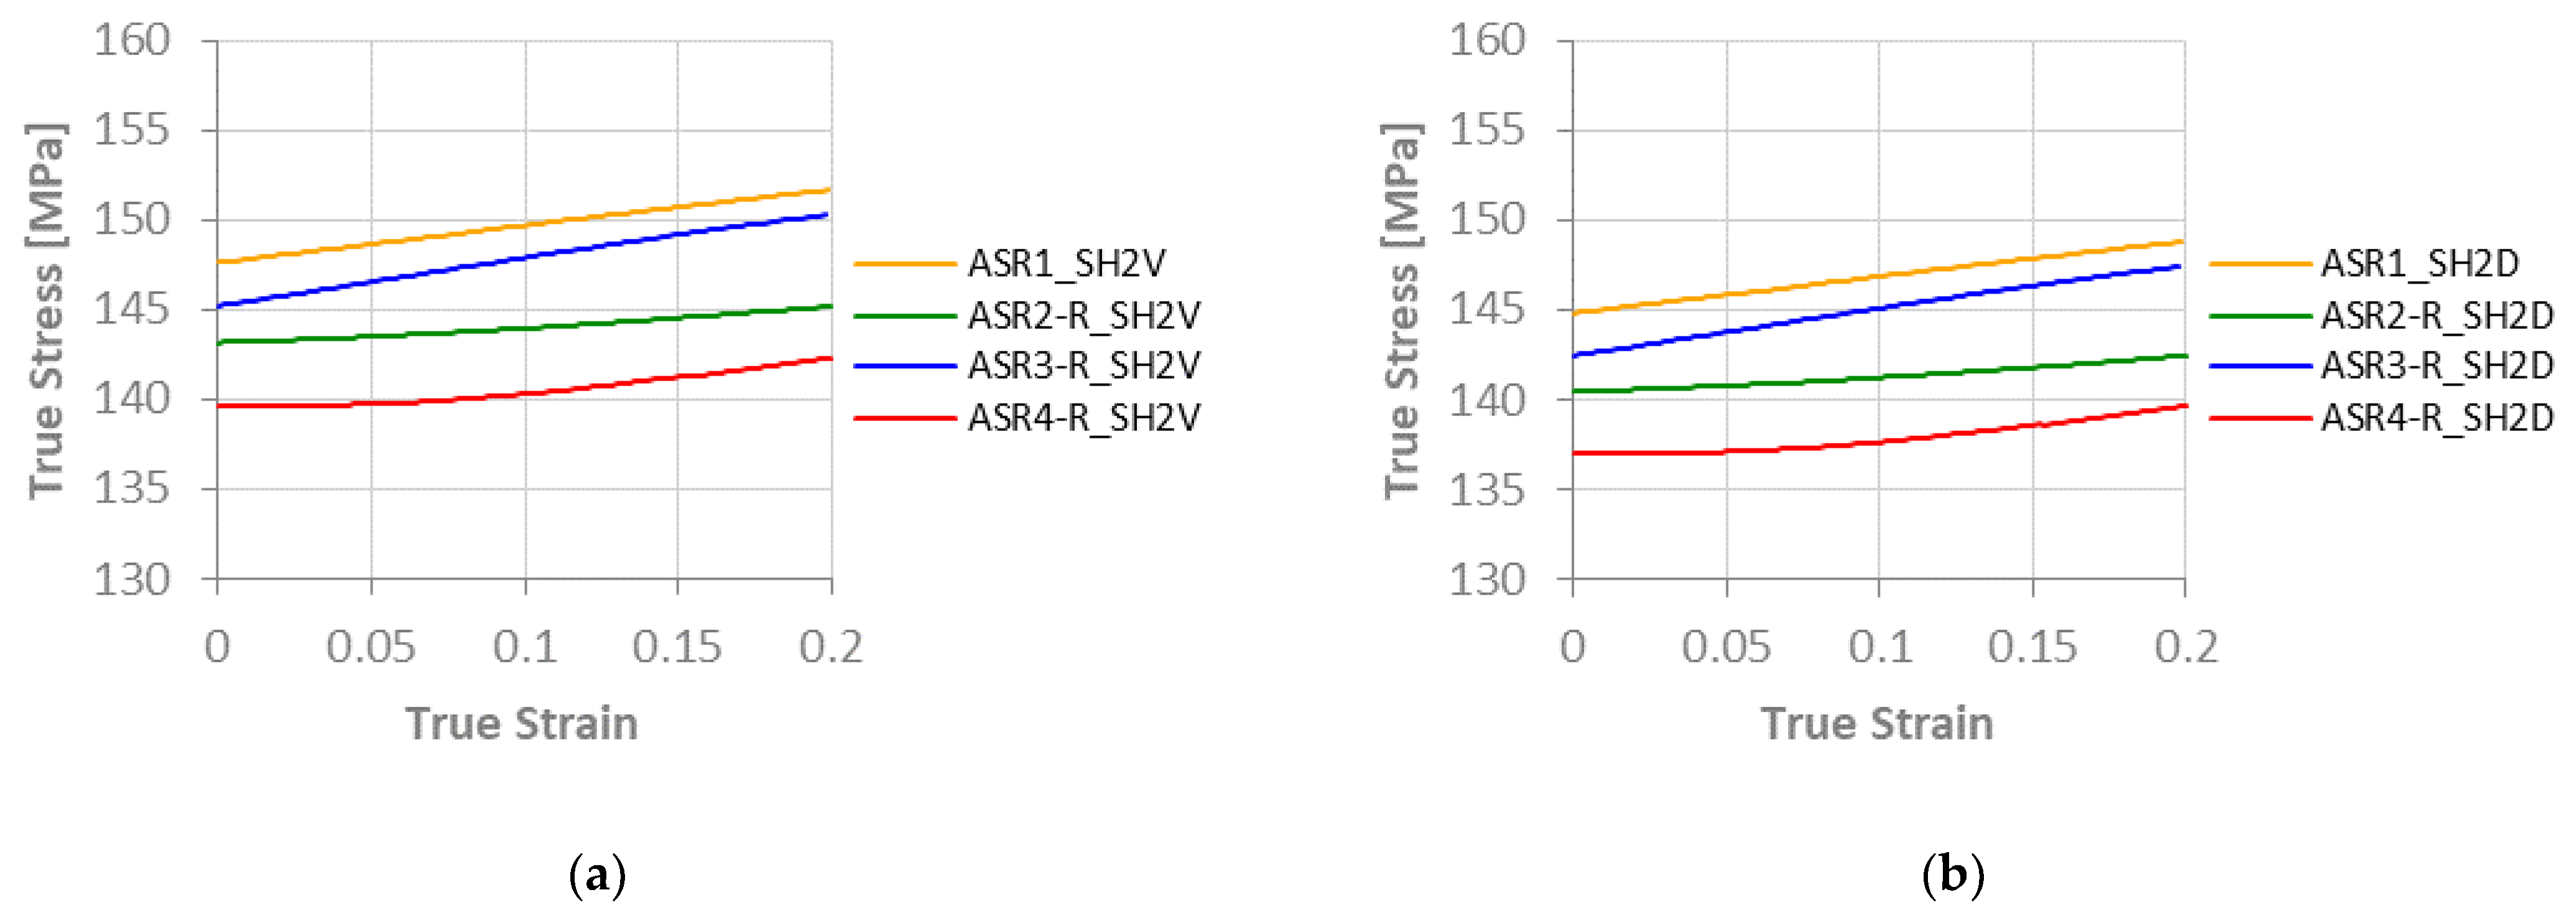
Analyzing the same results by rolling sequences, in Figure 6, we notice that the conventional and asymmetric rolling-continuous simulations describe a stress-increasing trend from the first to the last step, as expected. Similar results are seen for the asymmetric rolling-reverse using a lower value of shear strain in Figure 6e,f. However, a softening effect becomes visible for the higher imposed shear strain value. As shown in Figure 6g, the true stress–strain curves obtained with the Voce-type law present yield stress values in the following order: σ 0 4 < σ 0 2 < σ 0 1 < σ 0 3 , where σ 0 n is the yield stress after pass n (n = 1, 2, 3, 4). The softening behavior occurs after the second and fourth rolling passes. In Figure 6h, the sequence becomes σ 0 1 < σ 0 2 < σ 0 4 < σ 0 3 for the DDR model, where the softening behavior is perceptible after the fourth rolling stage. To better understand this material response, new asymmetric-reverse rolling simulations were carried out without considering the texture evolution. The results are presented in Figure 7. As noted, the stress values increase with the rolling pass number for both hardening laws, which indicates that the softening behavior is closely related to the texture evolution during the numerical simulations. Additionally, in Figure 8, asymmetric-reverse rolling simulations considering the texture evolution and no hardening update revealed the same trend seen in Figure 6g. The stress decreases from the first to the second pass; then it increases from the second to the third pass; and finally, the stress decreases from the third to the fourth pass. These results reinforce the importance of the texture evolution on the predicted mechanical response. In general, the lower yield stress in ASR-R, compared to ASR-C and CR cases, is related to the texture evolution. The difference in the strain path leads to different textures at the end of rolling and thus affects the flow stress.
A similar analysis for two-pass rolling sequences, with a 30% reduction per pass, revealed that the DDR model shows higher stress values for the same amount of strain; this is the most evident observation from Figure 9. However, in these sequences, the curves corresponding to the asymmetric rolled-reverse process are almost coincident with the CR and ASR-C curves, while for a 20% reduction passes, the ASR-R curves are noticeably below the other two.
In Figure 10, it is clear there is an increased yield stress trend despite the rolling sequence. That is, curves from the 2nd pass are consistently above those from the 1st pass. Additionally, the shear strain value does not have a significant impact. Curves (SH2) are slightly above curves (SH1).
Comparing the curves in Figure 5a with the ones in Figure 9a, it is noticeable that the yield stress increases with the pass reduction (≈360 MPa for a 20% reduction, and ≈380/400 MPa for 30%, depending on the hardening law). Moreover, comparing the curves in Figure 5c with the ones in Figure 9b, corresponding to 49% and 51% of the total thickness reduction, respectively, it is clear that the yield stress values are ≈390 MPa for the Voce-type model and ≈430 MPa for the DDR model, which indicates that the total reduction is more relevant than the reduction per pass.
Finally, an aspect that must be considered when analyzing these curves is the accumulated strain during the tests. The fitting curves are obtained for a strain value of 25%, but the accumulated strain value is much higher during the rolling sequences. When we consider a 100% deformation, the divergence between the two models becomes more pronounced, as shown in Figure 11, which explains the differences in the previous examined results.

3.2. R-Values

In metal sheet manufacturing, it is important to quantify the plastic anisotropy of the material. Usually, the normal anisotropy parameter, R ¯ , (which is the average of the R-value in different tensile directions) is calculated to evaluate the drawability of the metal sheet and has the following expression:
R ¯ = R 0 + 2 R 45 + R 90 4   ,
where R0, R45, and R90 are the determined R-value for 0°, 45°, and 90° to the rolling direction in a uniaxial tensile test. On the other hand, the planar anisotropy, Δ R , represents the variation of the R-value in different tensile directions and it is useful to study earing formation in deep drawing processes. The planar anisotropy is given by the following:
Δ R = R 0 2 R 45 + R 90 2     .
Moreover, the plastic anisotropy is related to the crystallographic texture, meaning it is possible to vary the average R-value of sheet metals by controlling the rolling process parameters to produce desirable grain orientation [13,28,29,30]. In this work, the R-values were simulated with the VPSC code after each rolling pass. The tensile tests were performed from 0° to 90° to the rolling direction in intervals of 15°. In terms of simulation, the code rotates the texture by the required angle and the tensile strain is always prescribed along the direction 1.
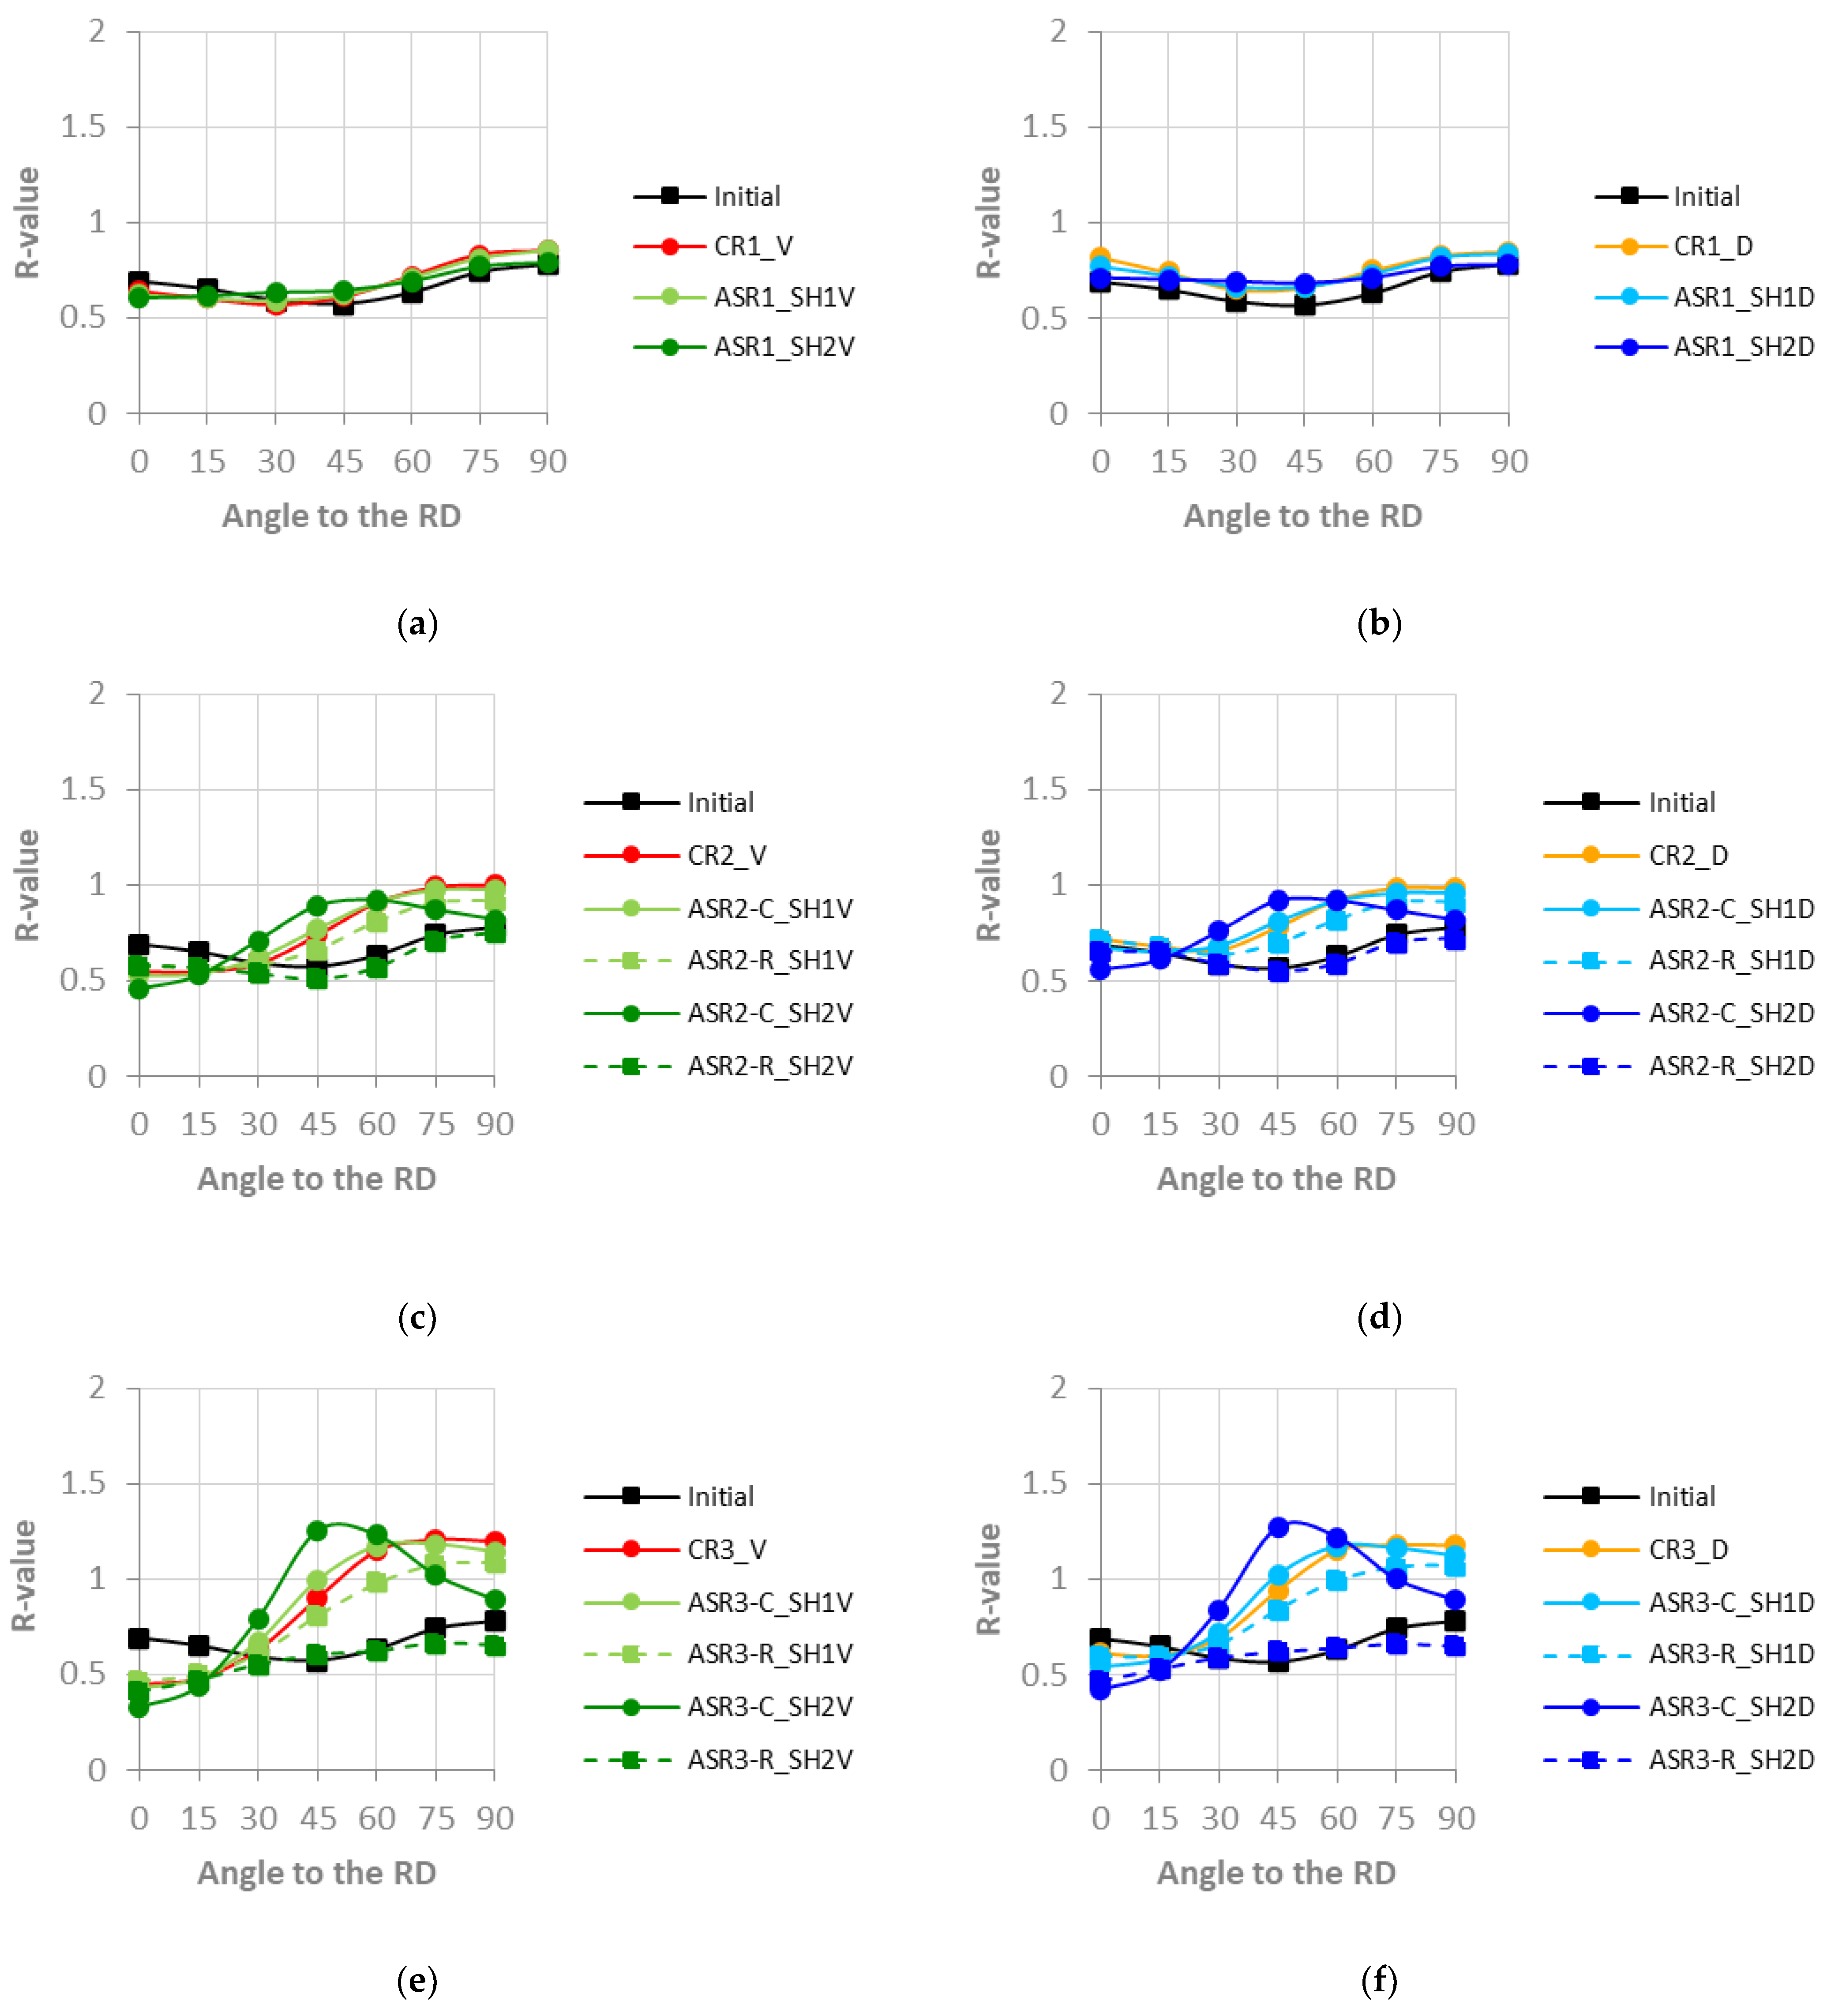
Figure 12 shows the simulated R-values of four-pass sequences rolling with a 20% thickness reduction per pass of CR, ASR-C, and ASR-R processes, considering the previous conditions, namely two values of shear strain, (SH1) and (SH2), and two hardening laws, a Voce-type law (V) and the DRR model (D). As can be seen, the Voce-type and DDR models return similar results. For the 15° and 30° angles, a slight difference is noticeable between them, but they converge for the remaining angles. The influence of the shear component gains a greater significance with the rolling step (total accumulated strain). For the ASR-C sequence, the higher shear strain value (2) results in a higher R45, and for the angles 30° and 60° the shear strain value has no significant impact on the respective R-values. On the other hand, the simulation shows that the ASR-R process reduces the R-values from R30 to R90. Furthermore, in the CR and ASR-C simulations, the R0 and R15 decrease with the number of passes (and the other R-values increase).
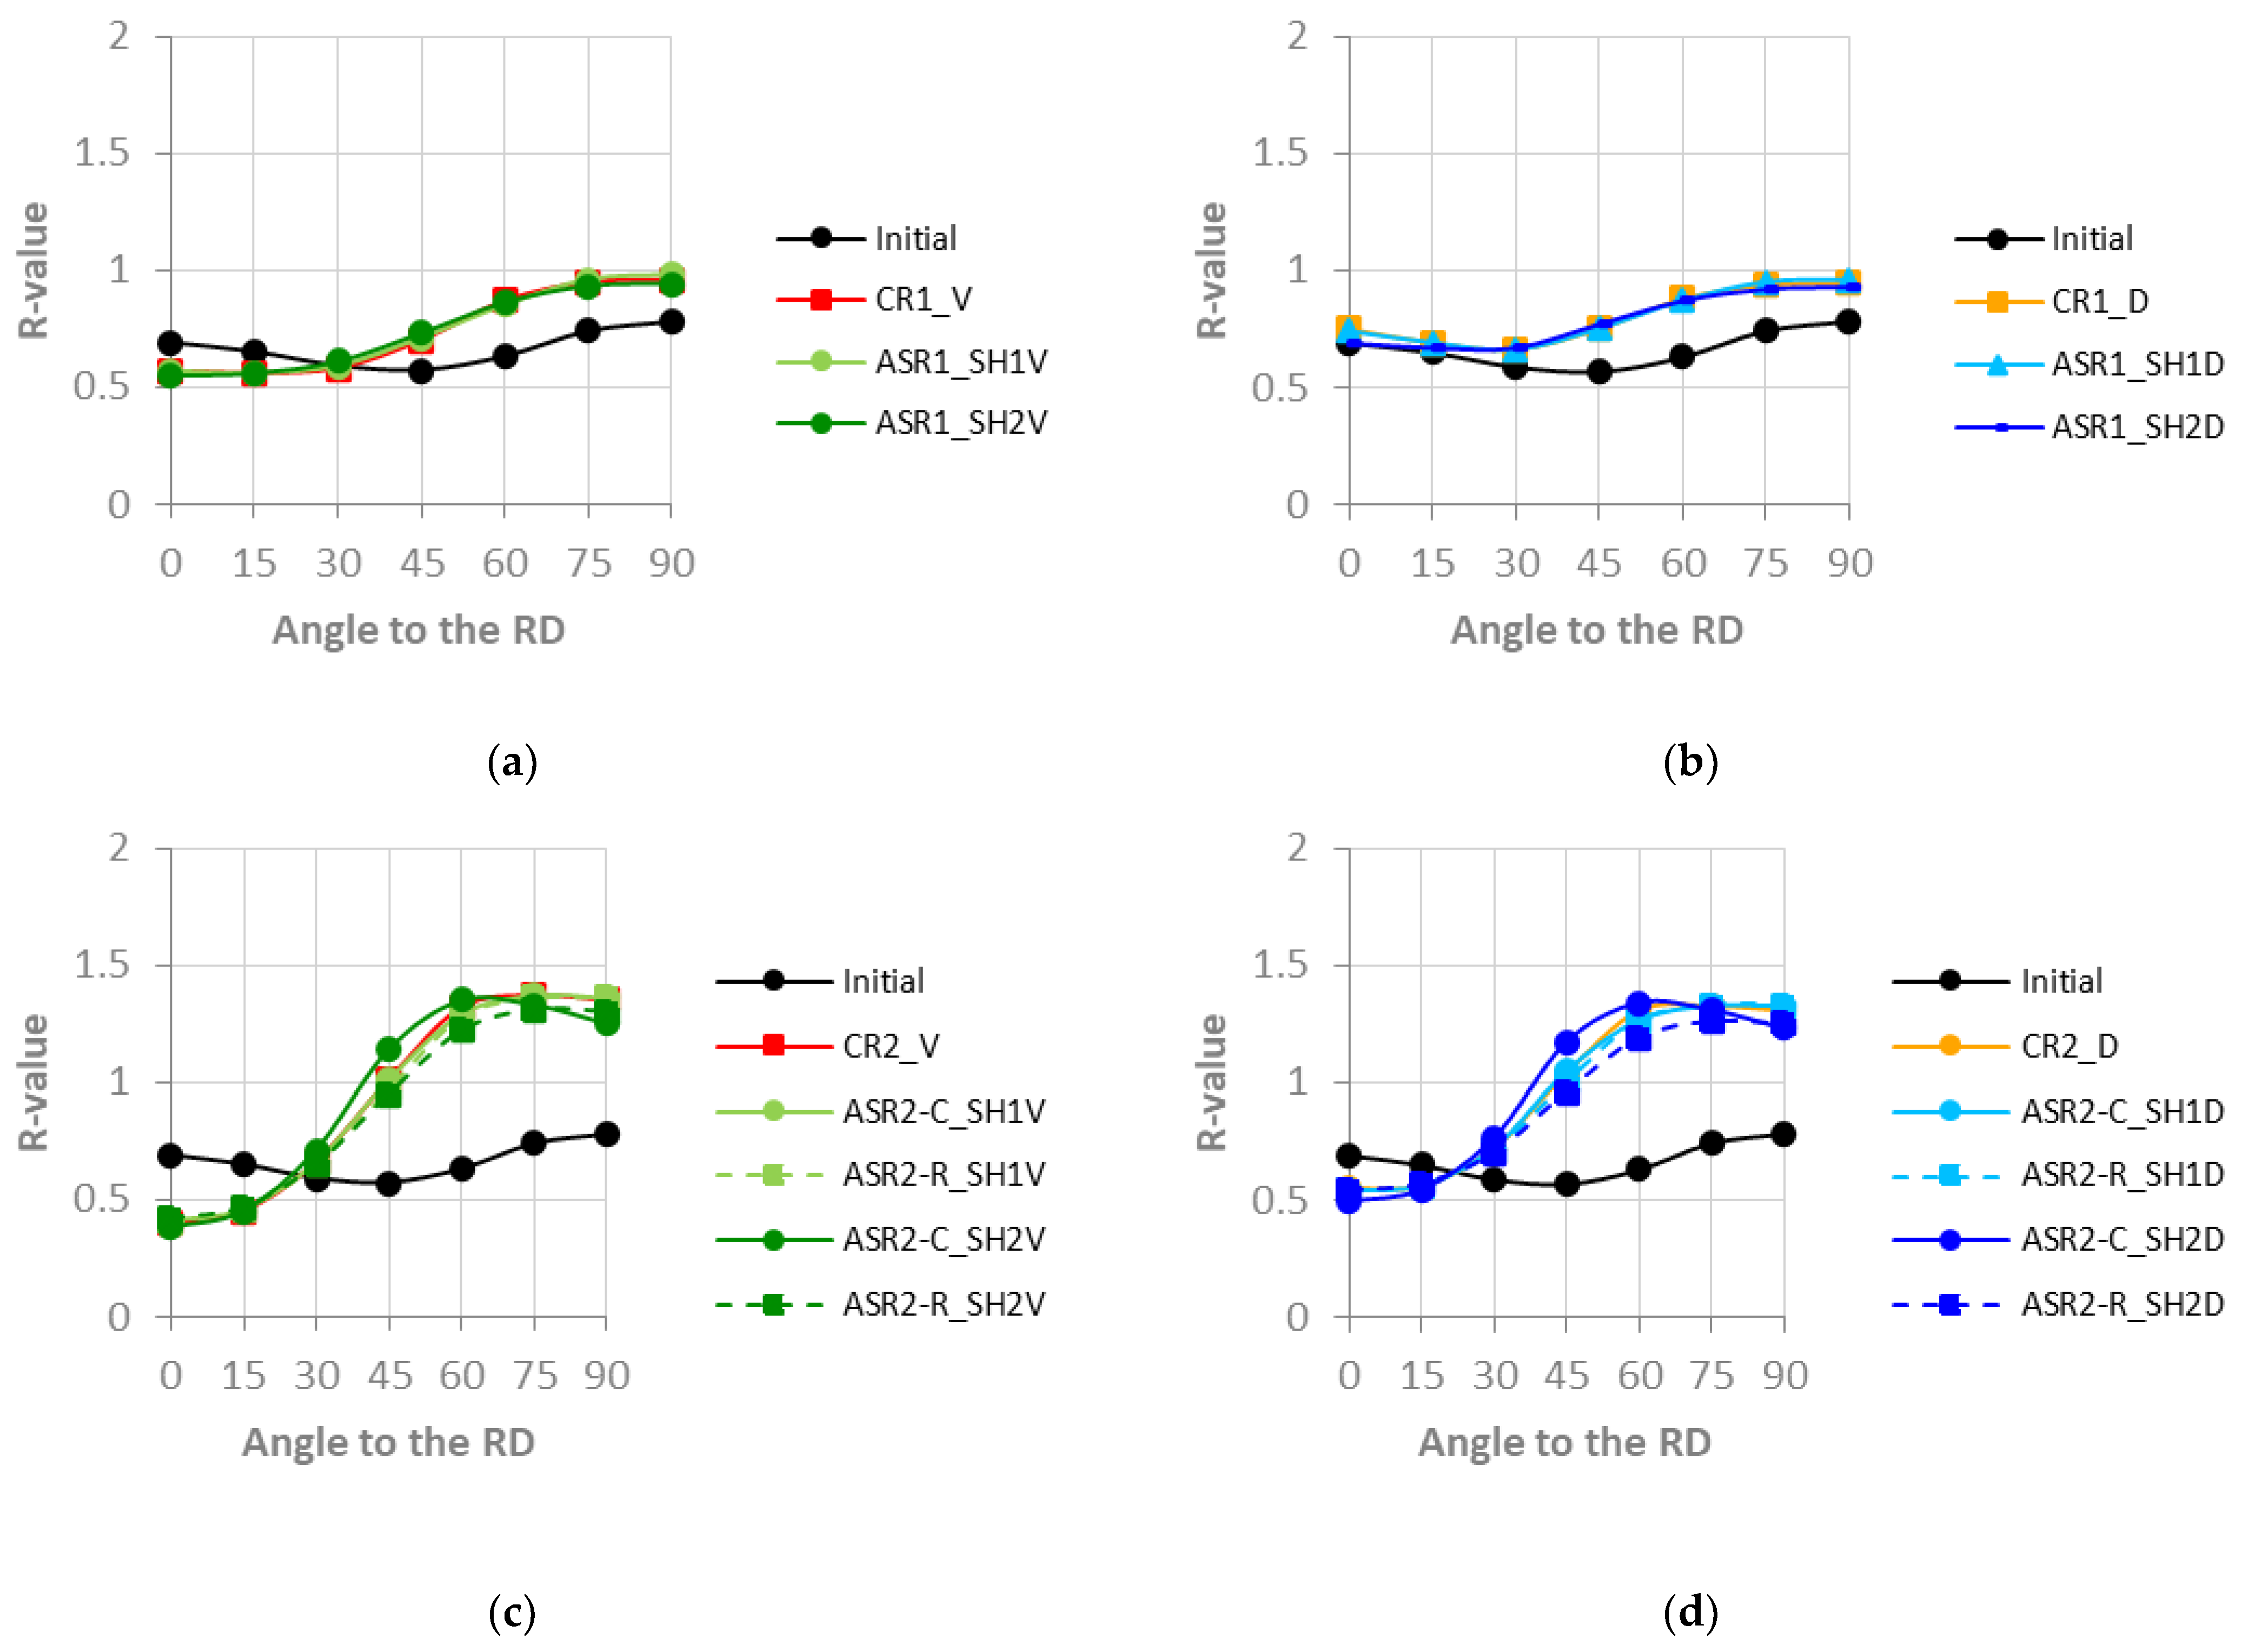
For the two-pass sequences, the R-values show less discrepancy, as can be seen in Figure 13. Combining the information from these Figures (Figure 12 and Figure 13) with Table 5 and Table 6, where the planar and normal anisotropy coefficients are presented for all simulations, it is clear that the ASR process enhances the material drawability by increasing the normal anisotropy. However, the four-pass asymmetric-reverse rolling process, with a 20% reduction per pass, for the higher amount of shear strain indicates a discrepancy, which could be related to the softening effect due to texture evolution.

3.3. Textures

As previously mentioned, the plastic anisotropy (R-values) is strongly related to the crystallographic orientations. The texture of conventional rolled aluminum alloy sheets present mainly brass {011}<211>, S {123}<634>, and copper {112}<111> components (the so-called β-fiber texture). After annealing, the β-fiber texture changes to cube texture {100}<001>, which impairs the formability of the material [31,32]. On the contrary, the presence of the γ-fiber texture {111}//ND enhances the drawability. It has been shown that the {111}//ND orientation can be induced by the ASR process [33].
The ideal texture components for the FCC metals are presented in Table 7 and the corresponding pole figures and ODF are shown in Figure 14.
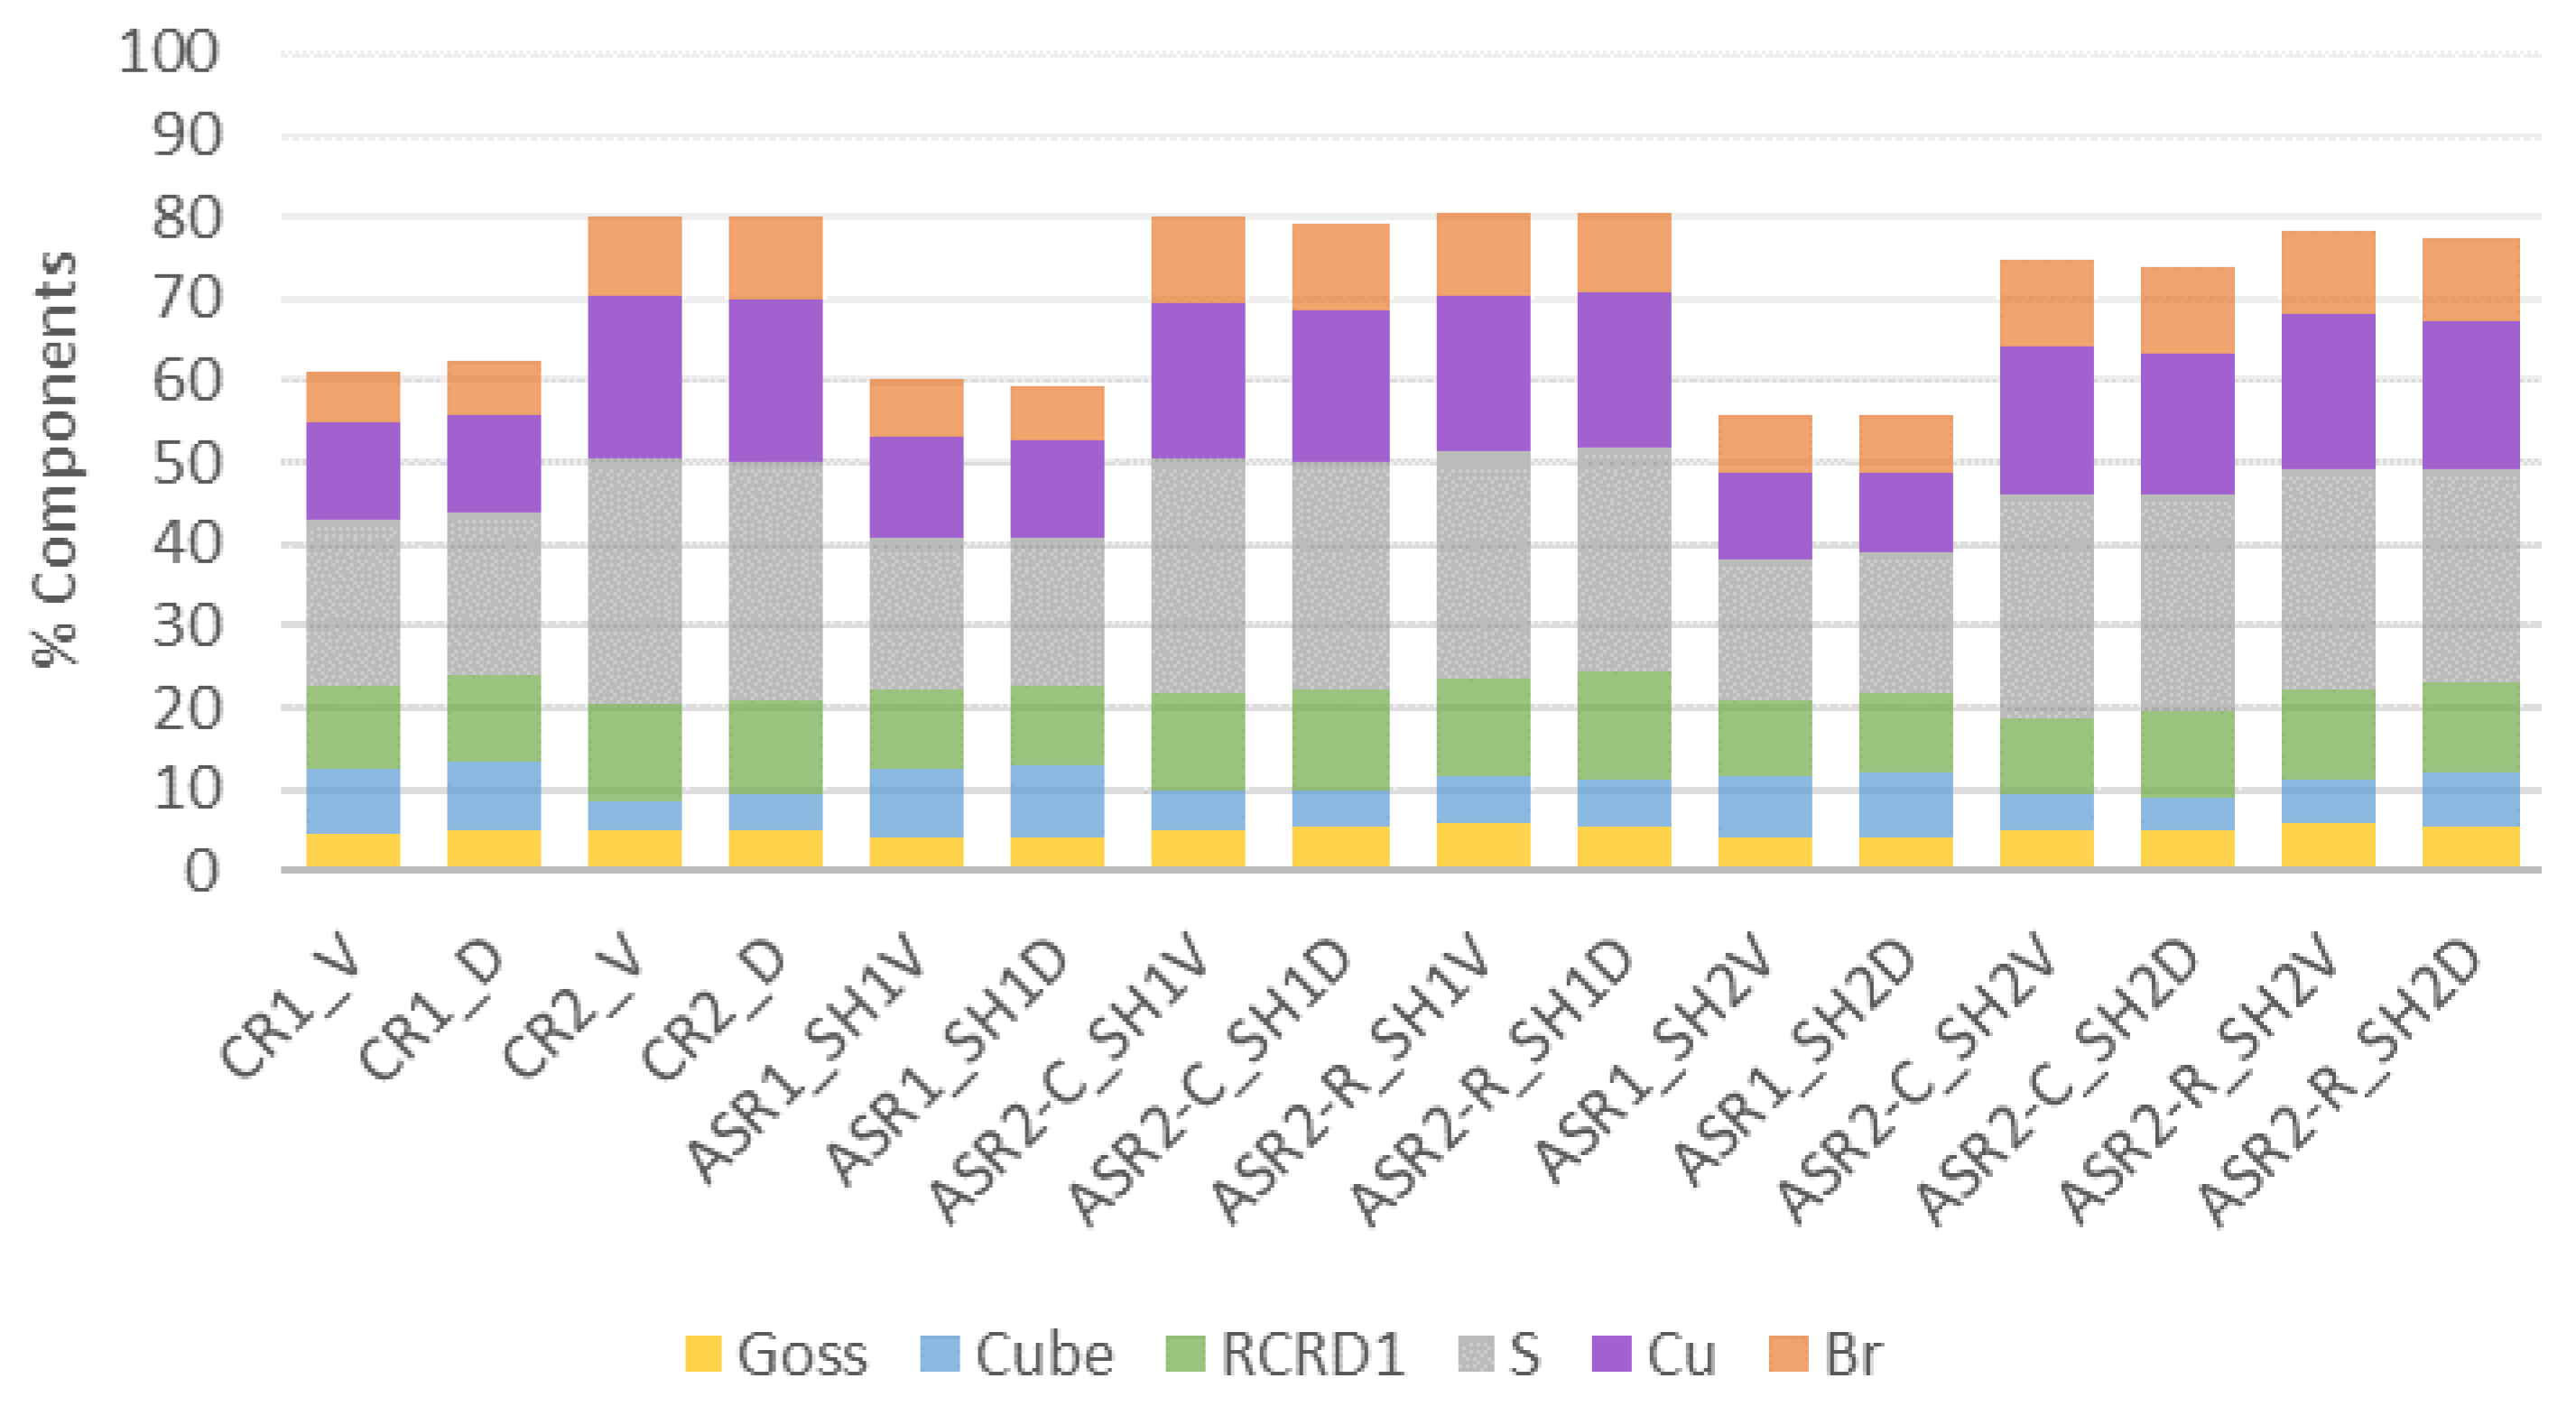
The VPSC code has a built-in routine to return the percentage of rolling components of FCC metals. The results for simulations with a thickness reduction of 20% per pass are represented in Figure 15, and for a reduction of 30% in Figure 16.
The bar charts show that the predominant component is S for all simulations, followed by the Cu orientation for most cases. The exceptions can be noted for a 20% reduction in the first passes and the ASR-R (SH2) results, where the Cube and RCRD1 orientations present higher percentages than Cu. The S, Cu, and Br components increase with the pass sequence, whereas the Cube orientation decreases, except for the ASR-R (SH2), in which there are no significant variations. Although these charts give an overview, the bars do not reach 100%, meaning that some components are not yet individually quantified by the VPSC. For the ASR simulations, especially for higher shear deformation, the percentages of unknown components are more significant than for the other tests, which may indicate the presence of the desirable shear texture orientations. Nevertheless, the results show that the rolling components become stronger with the rolling sequence, except for the ASR-R (SH2).
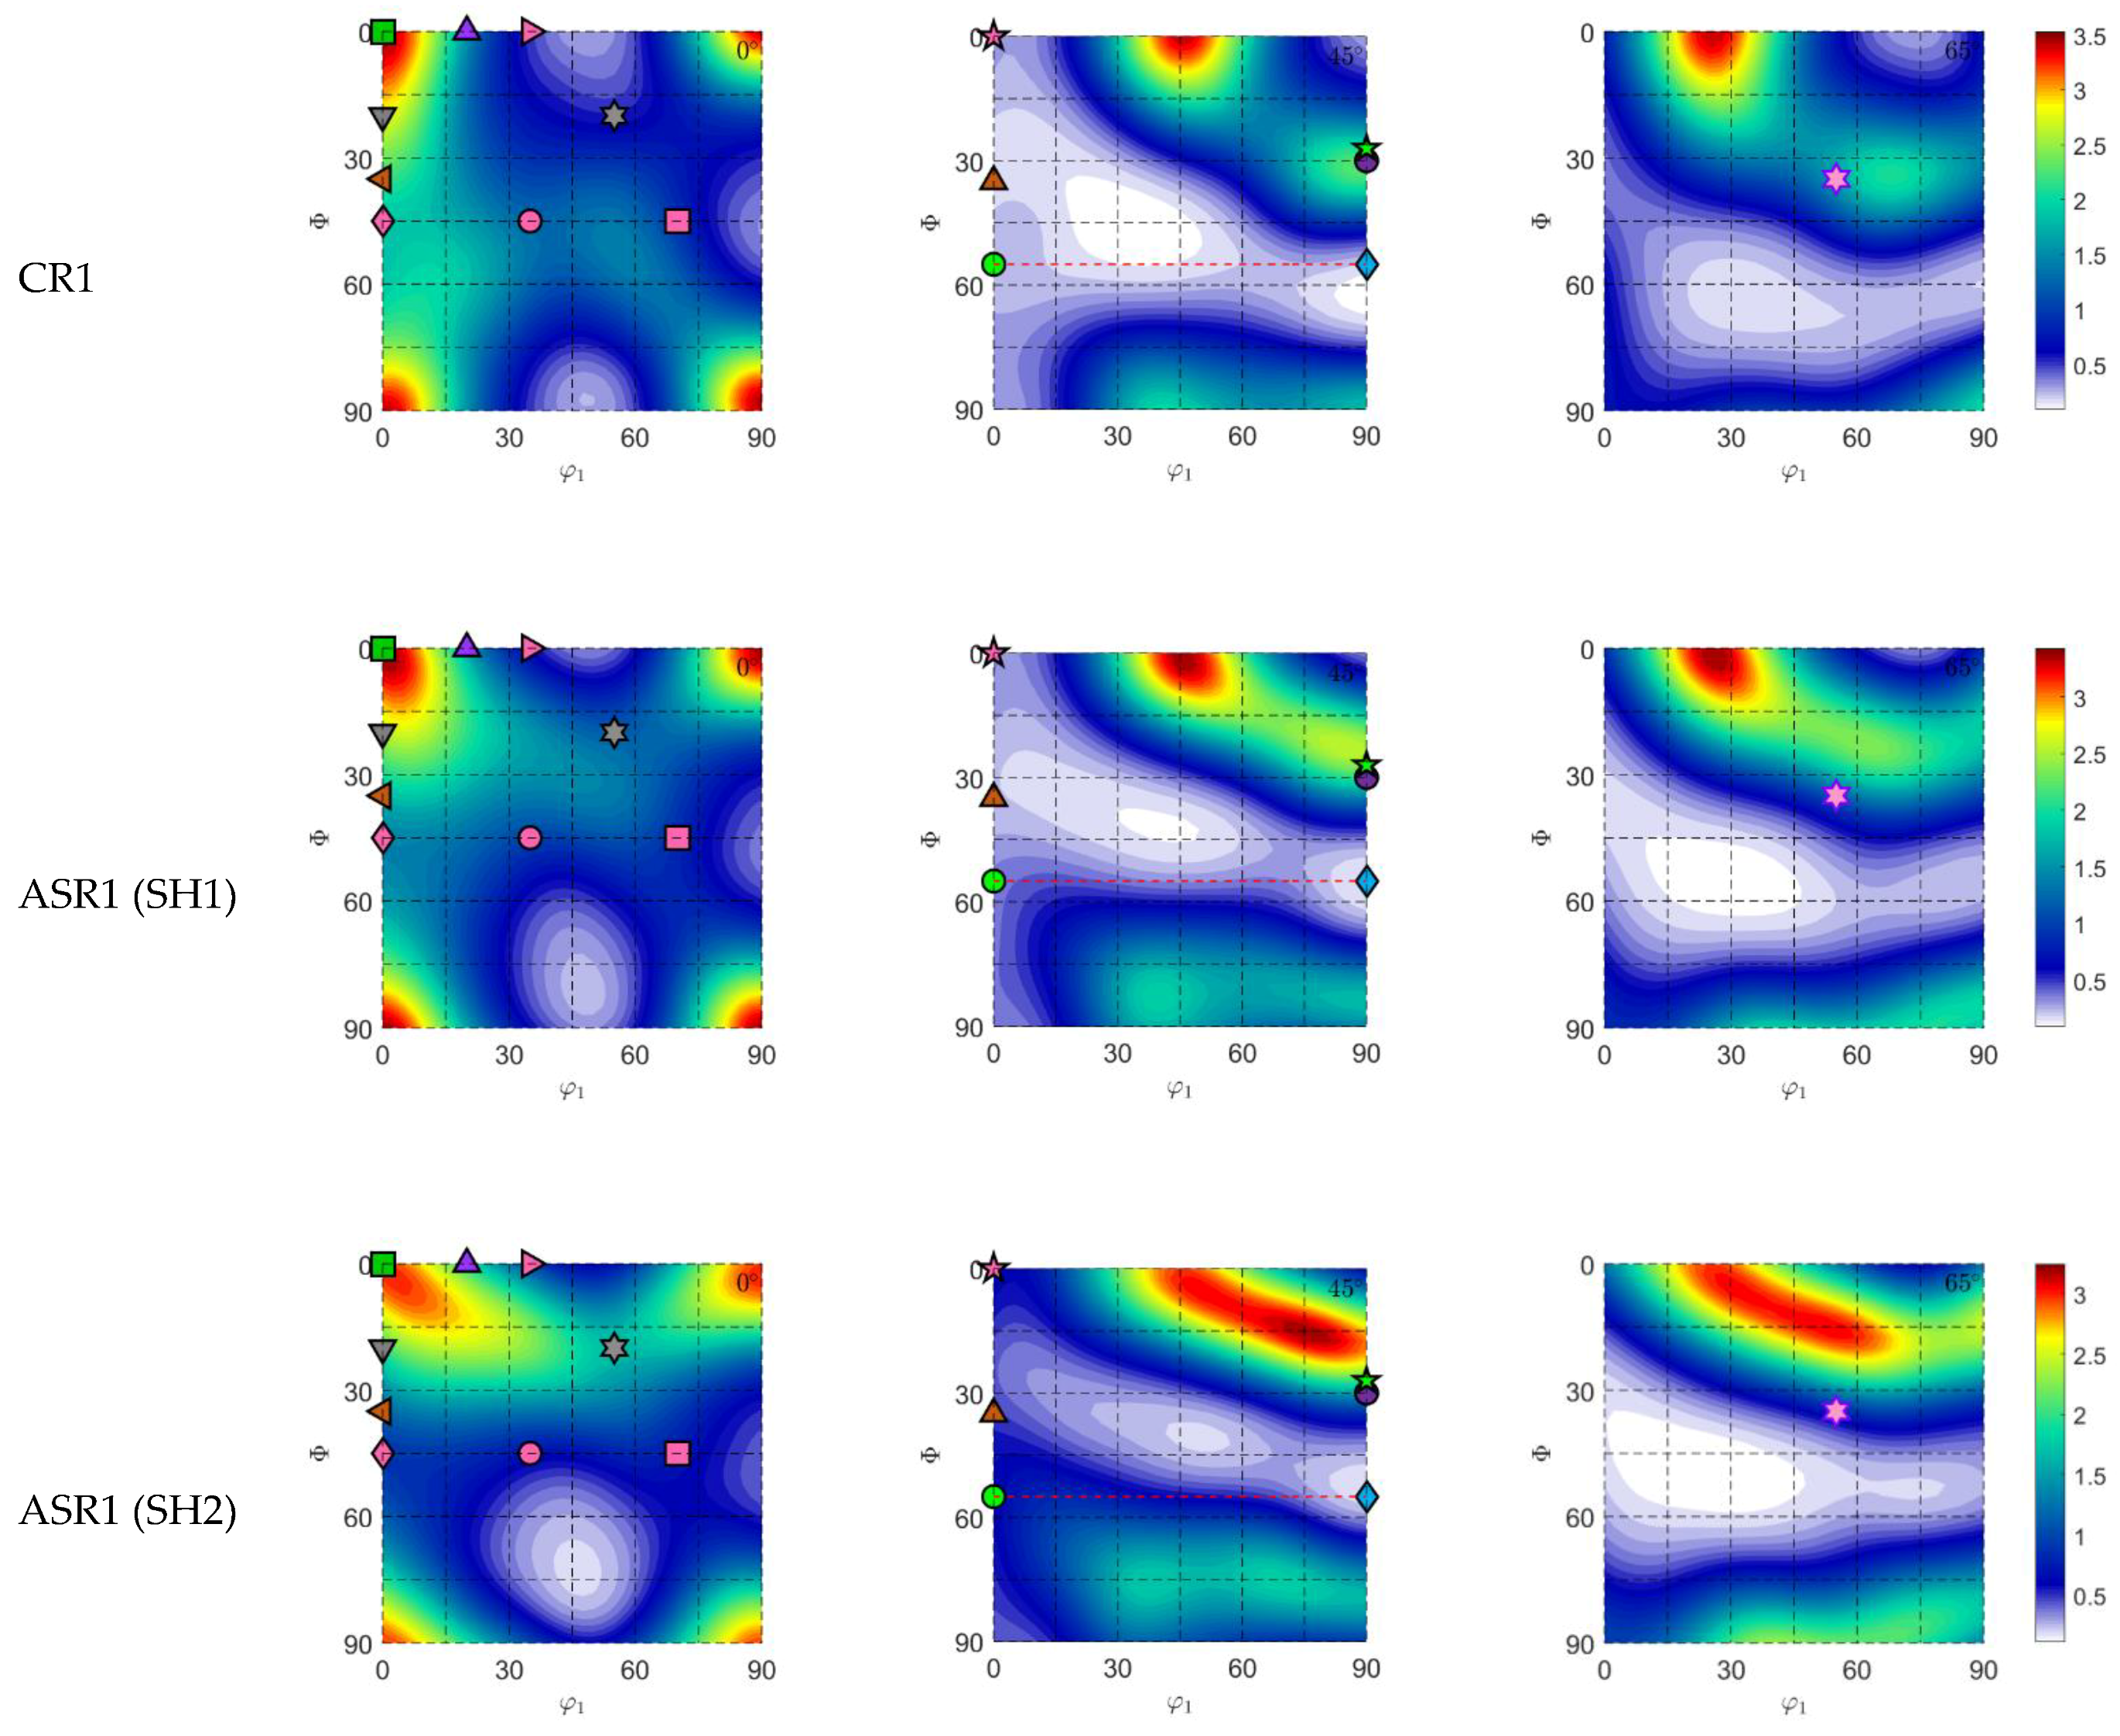
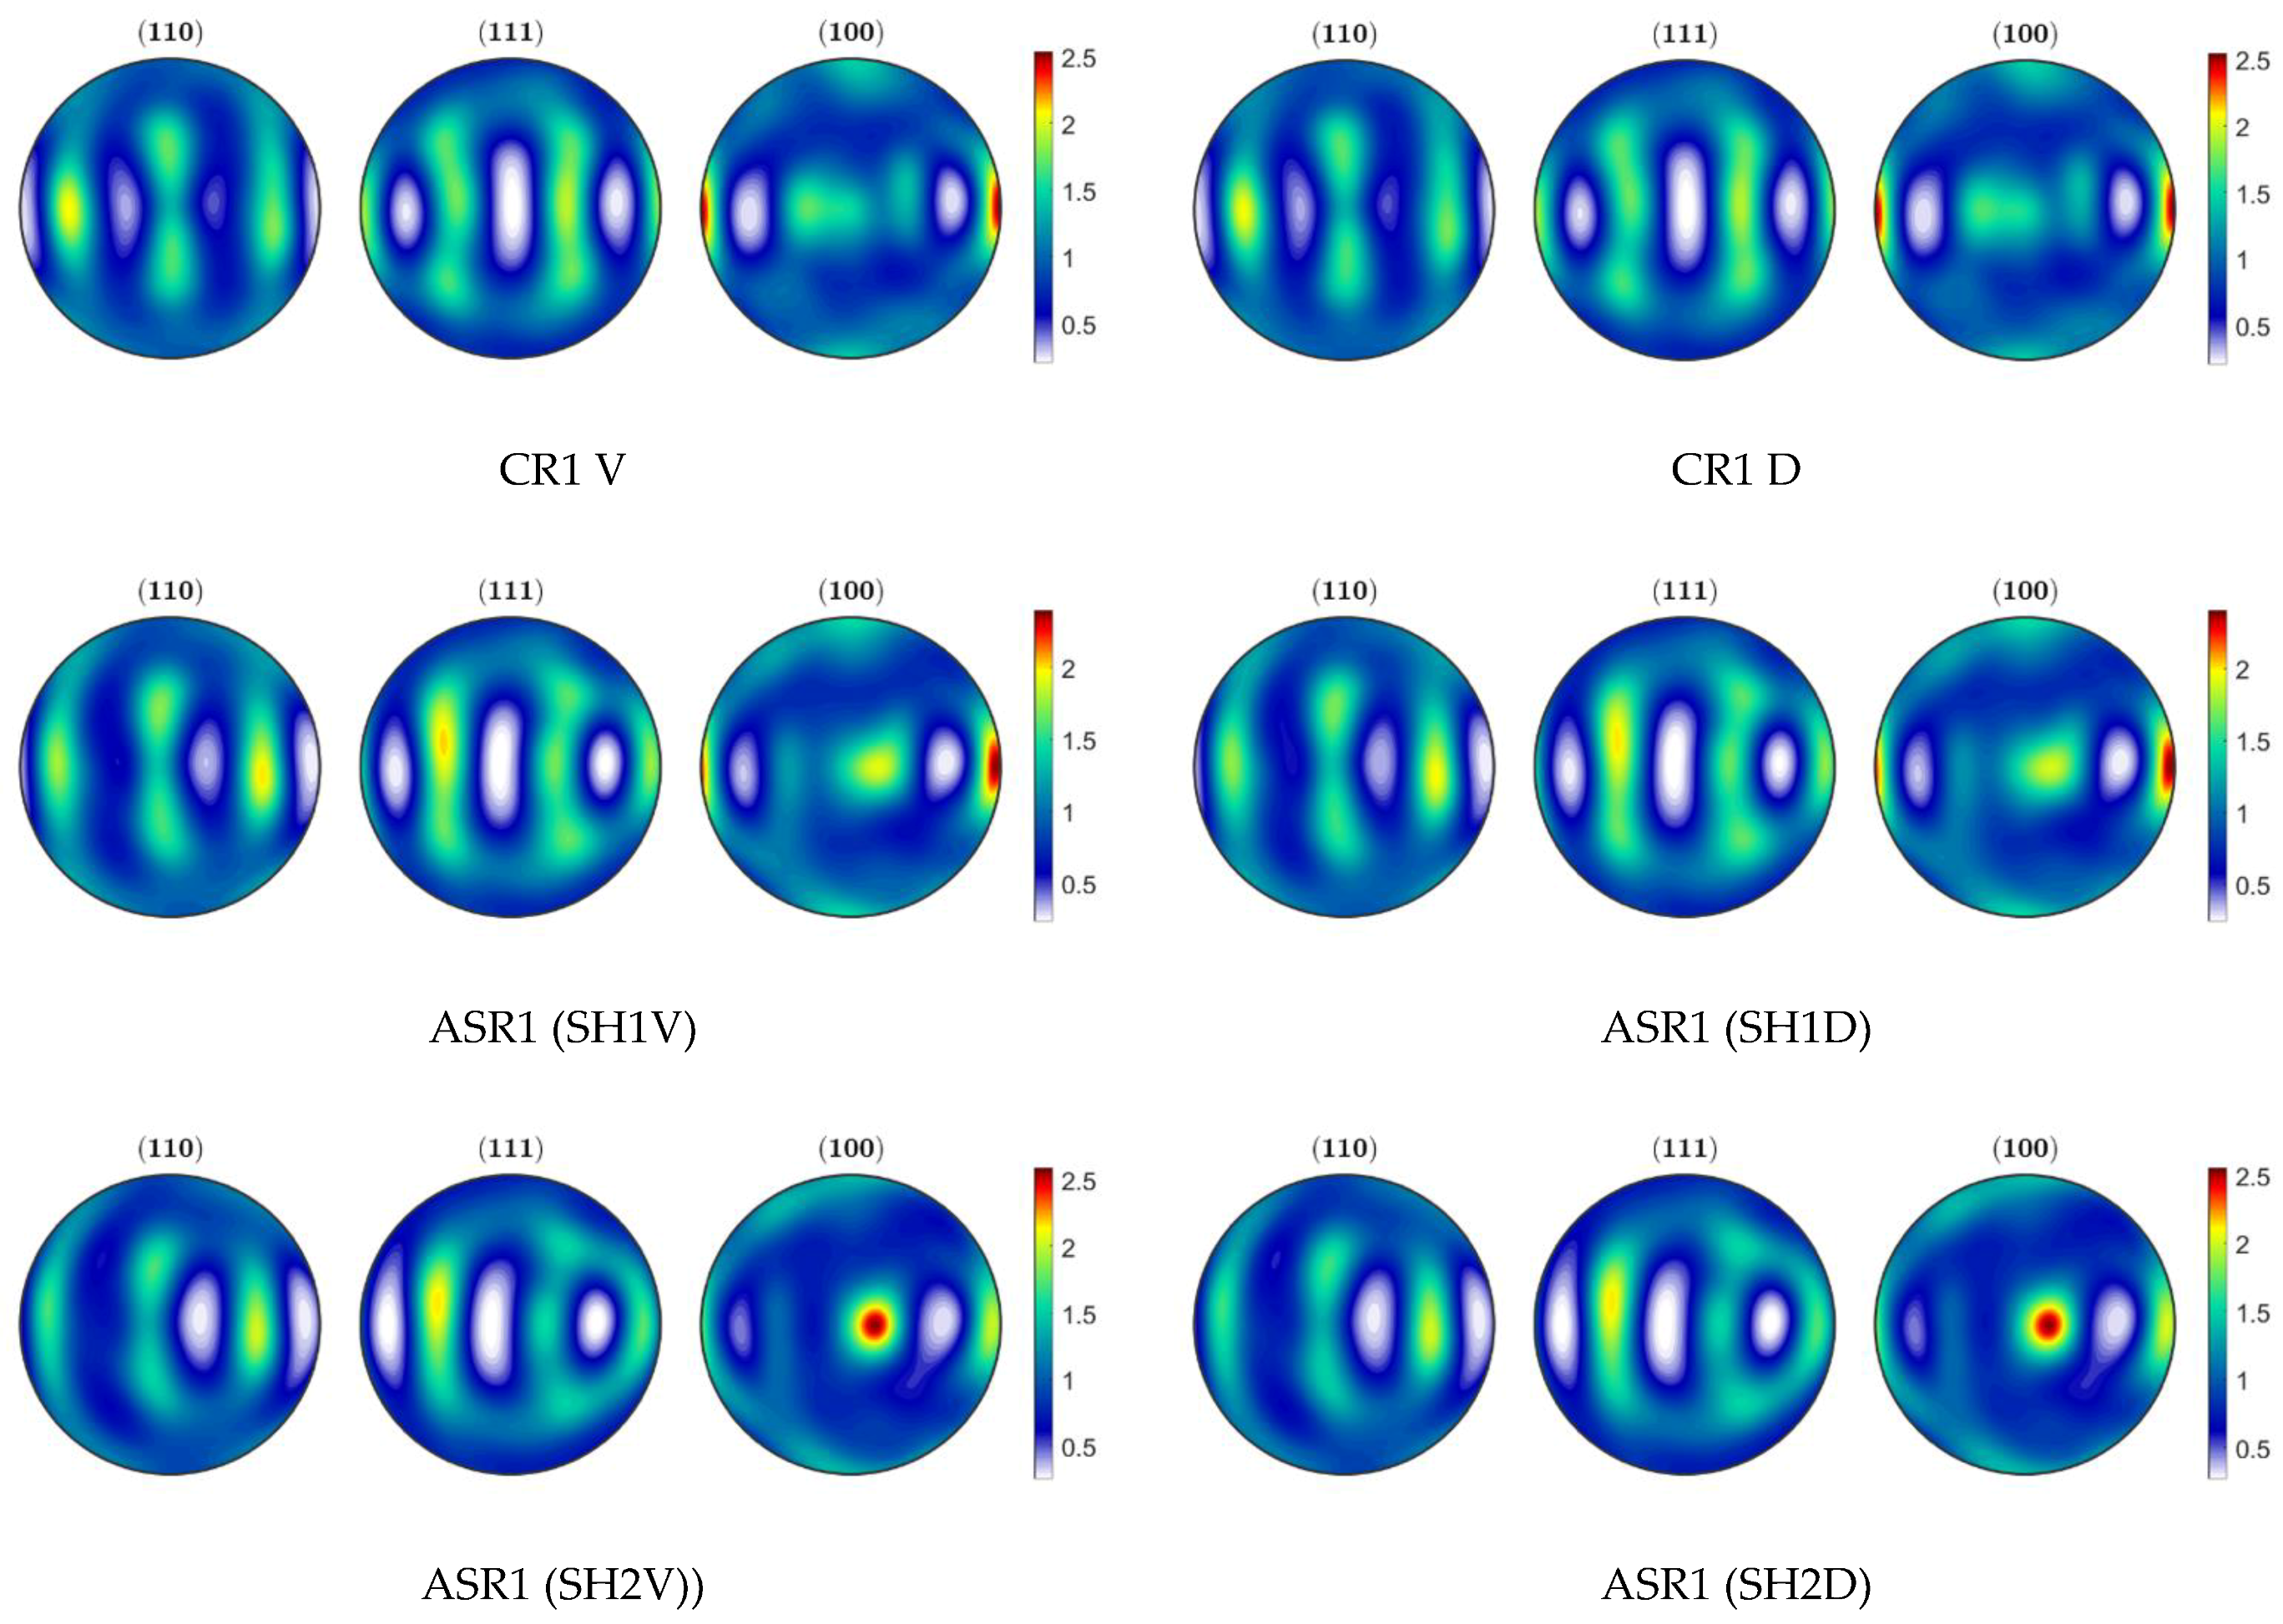
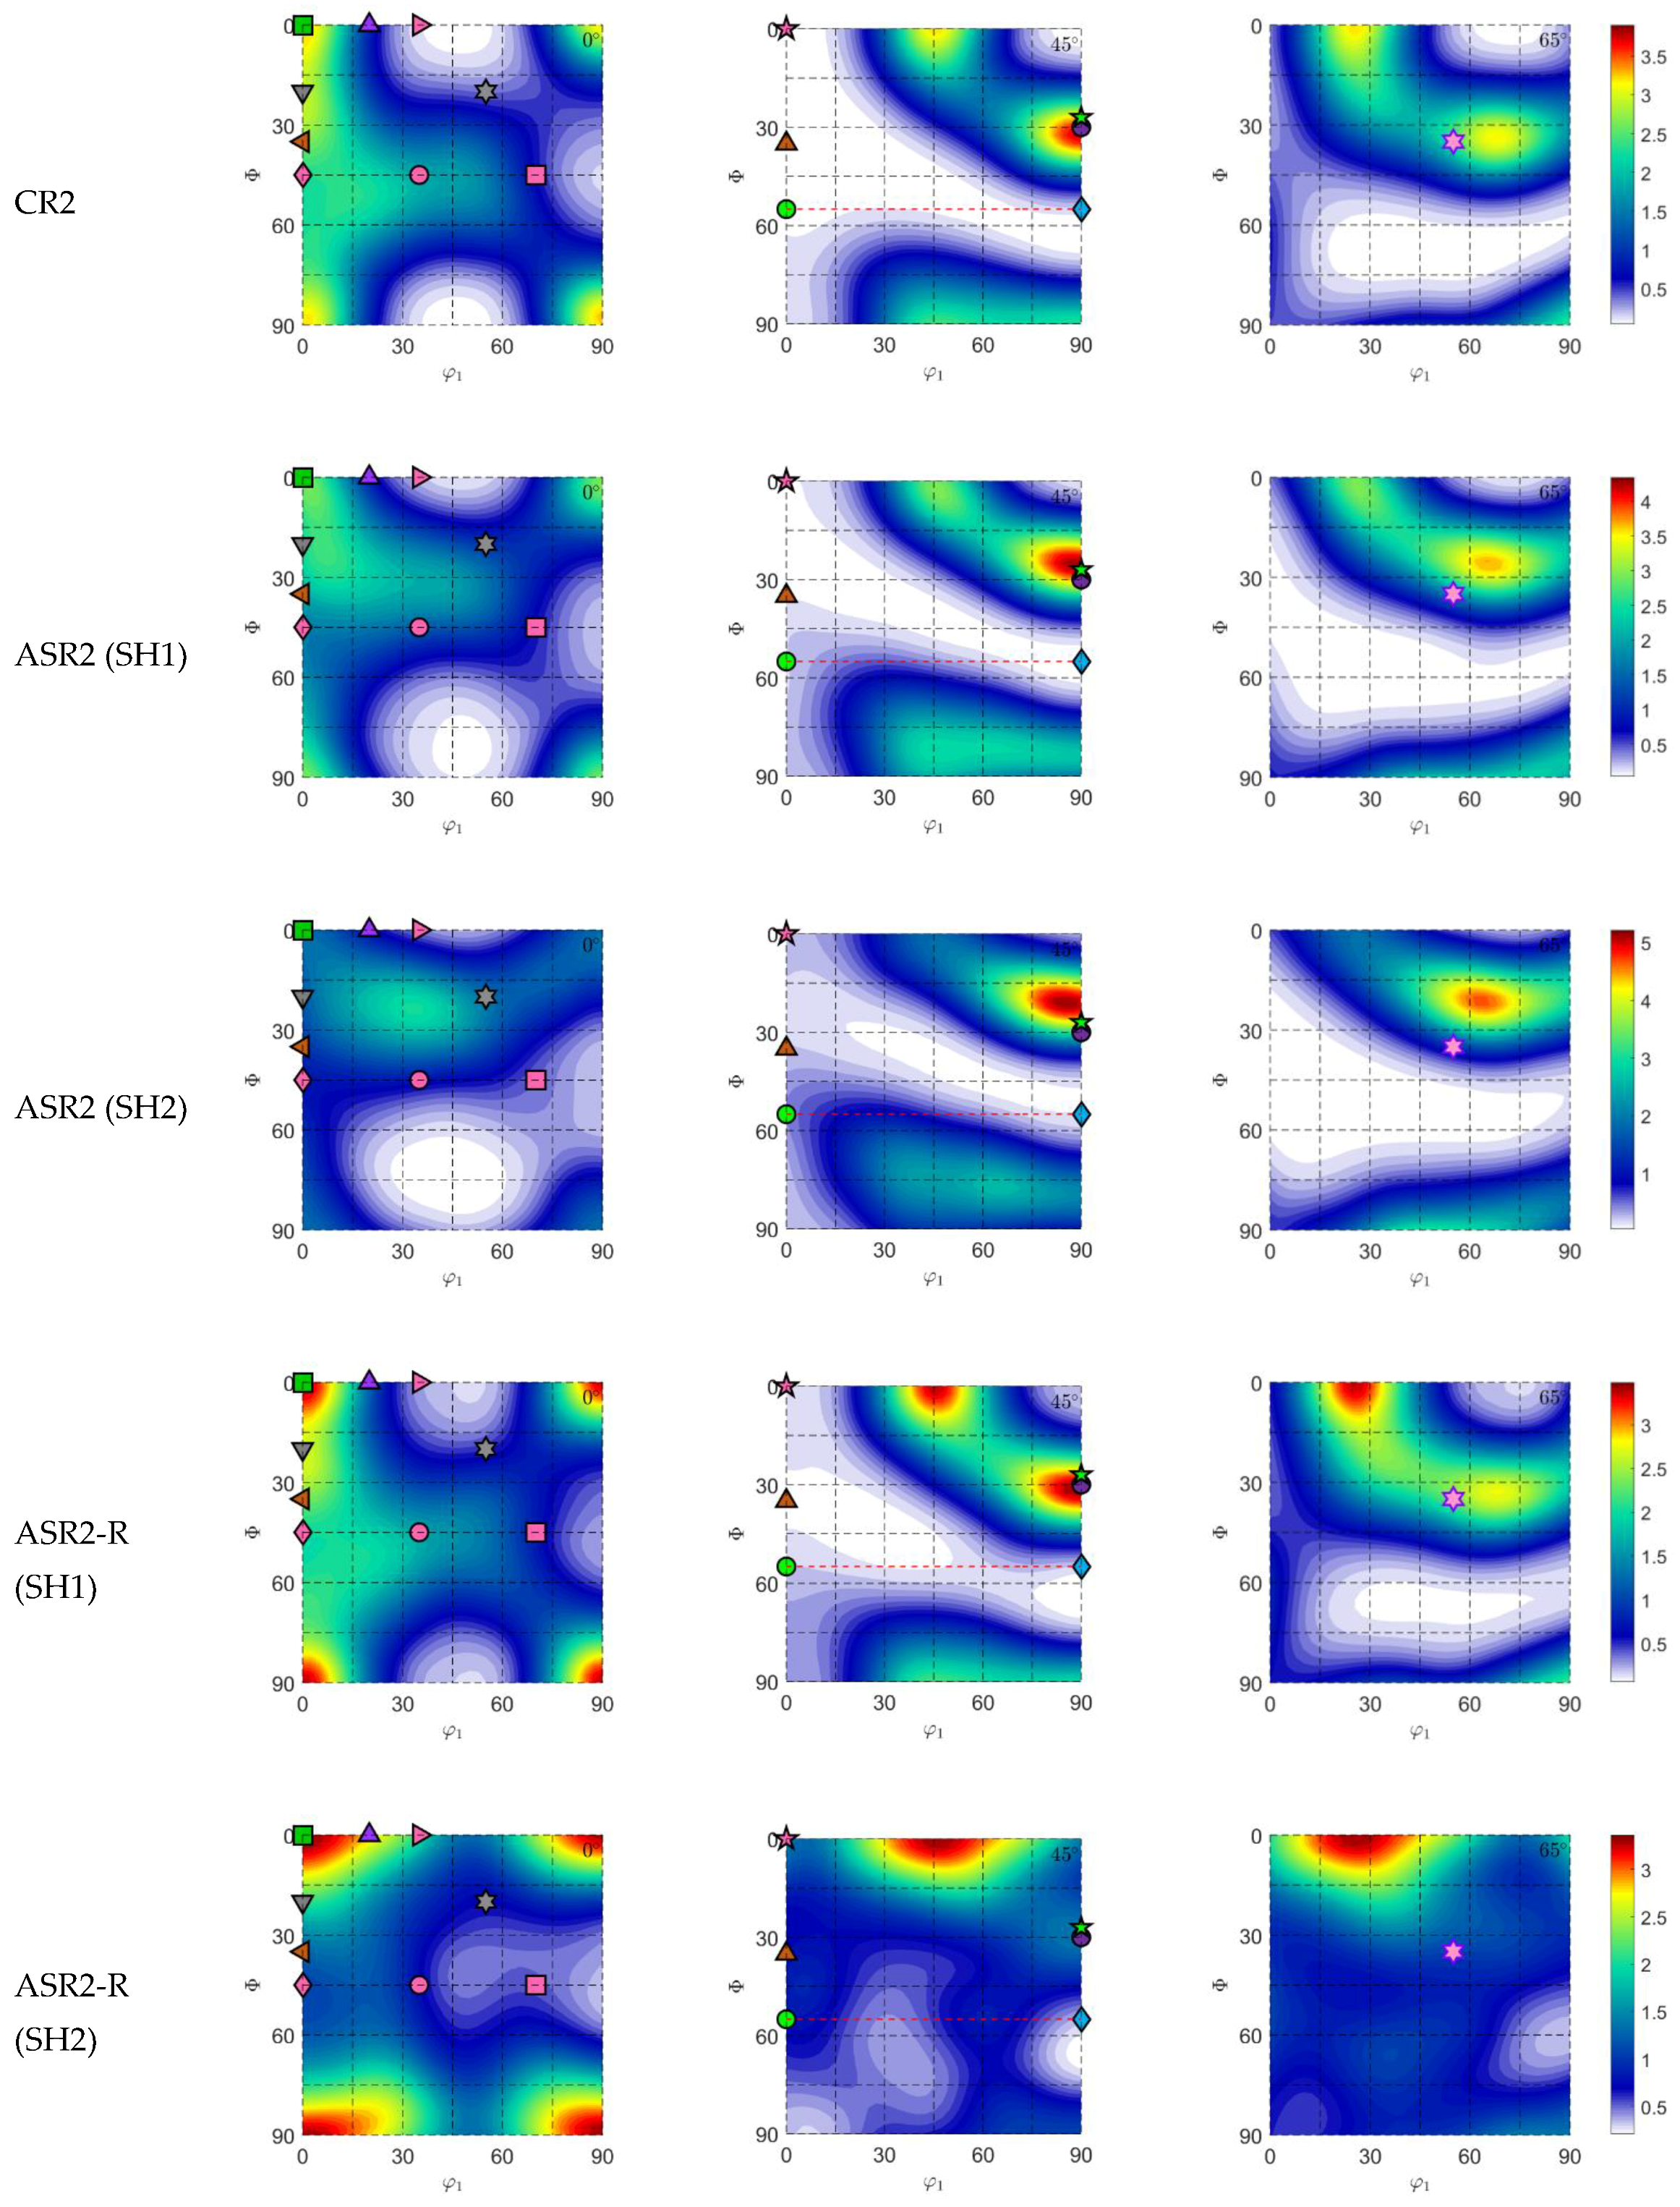
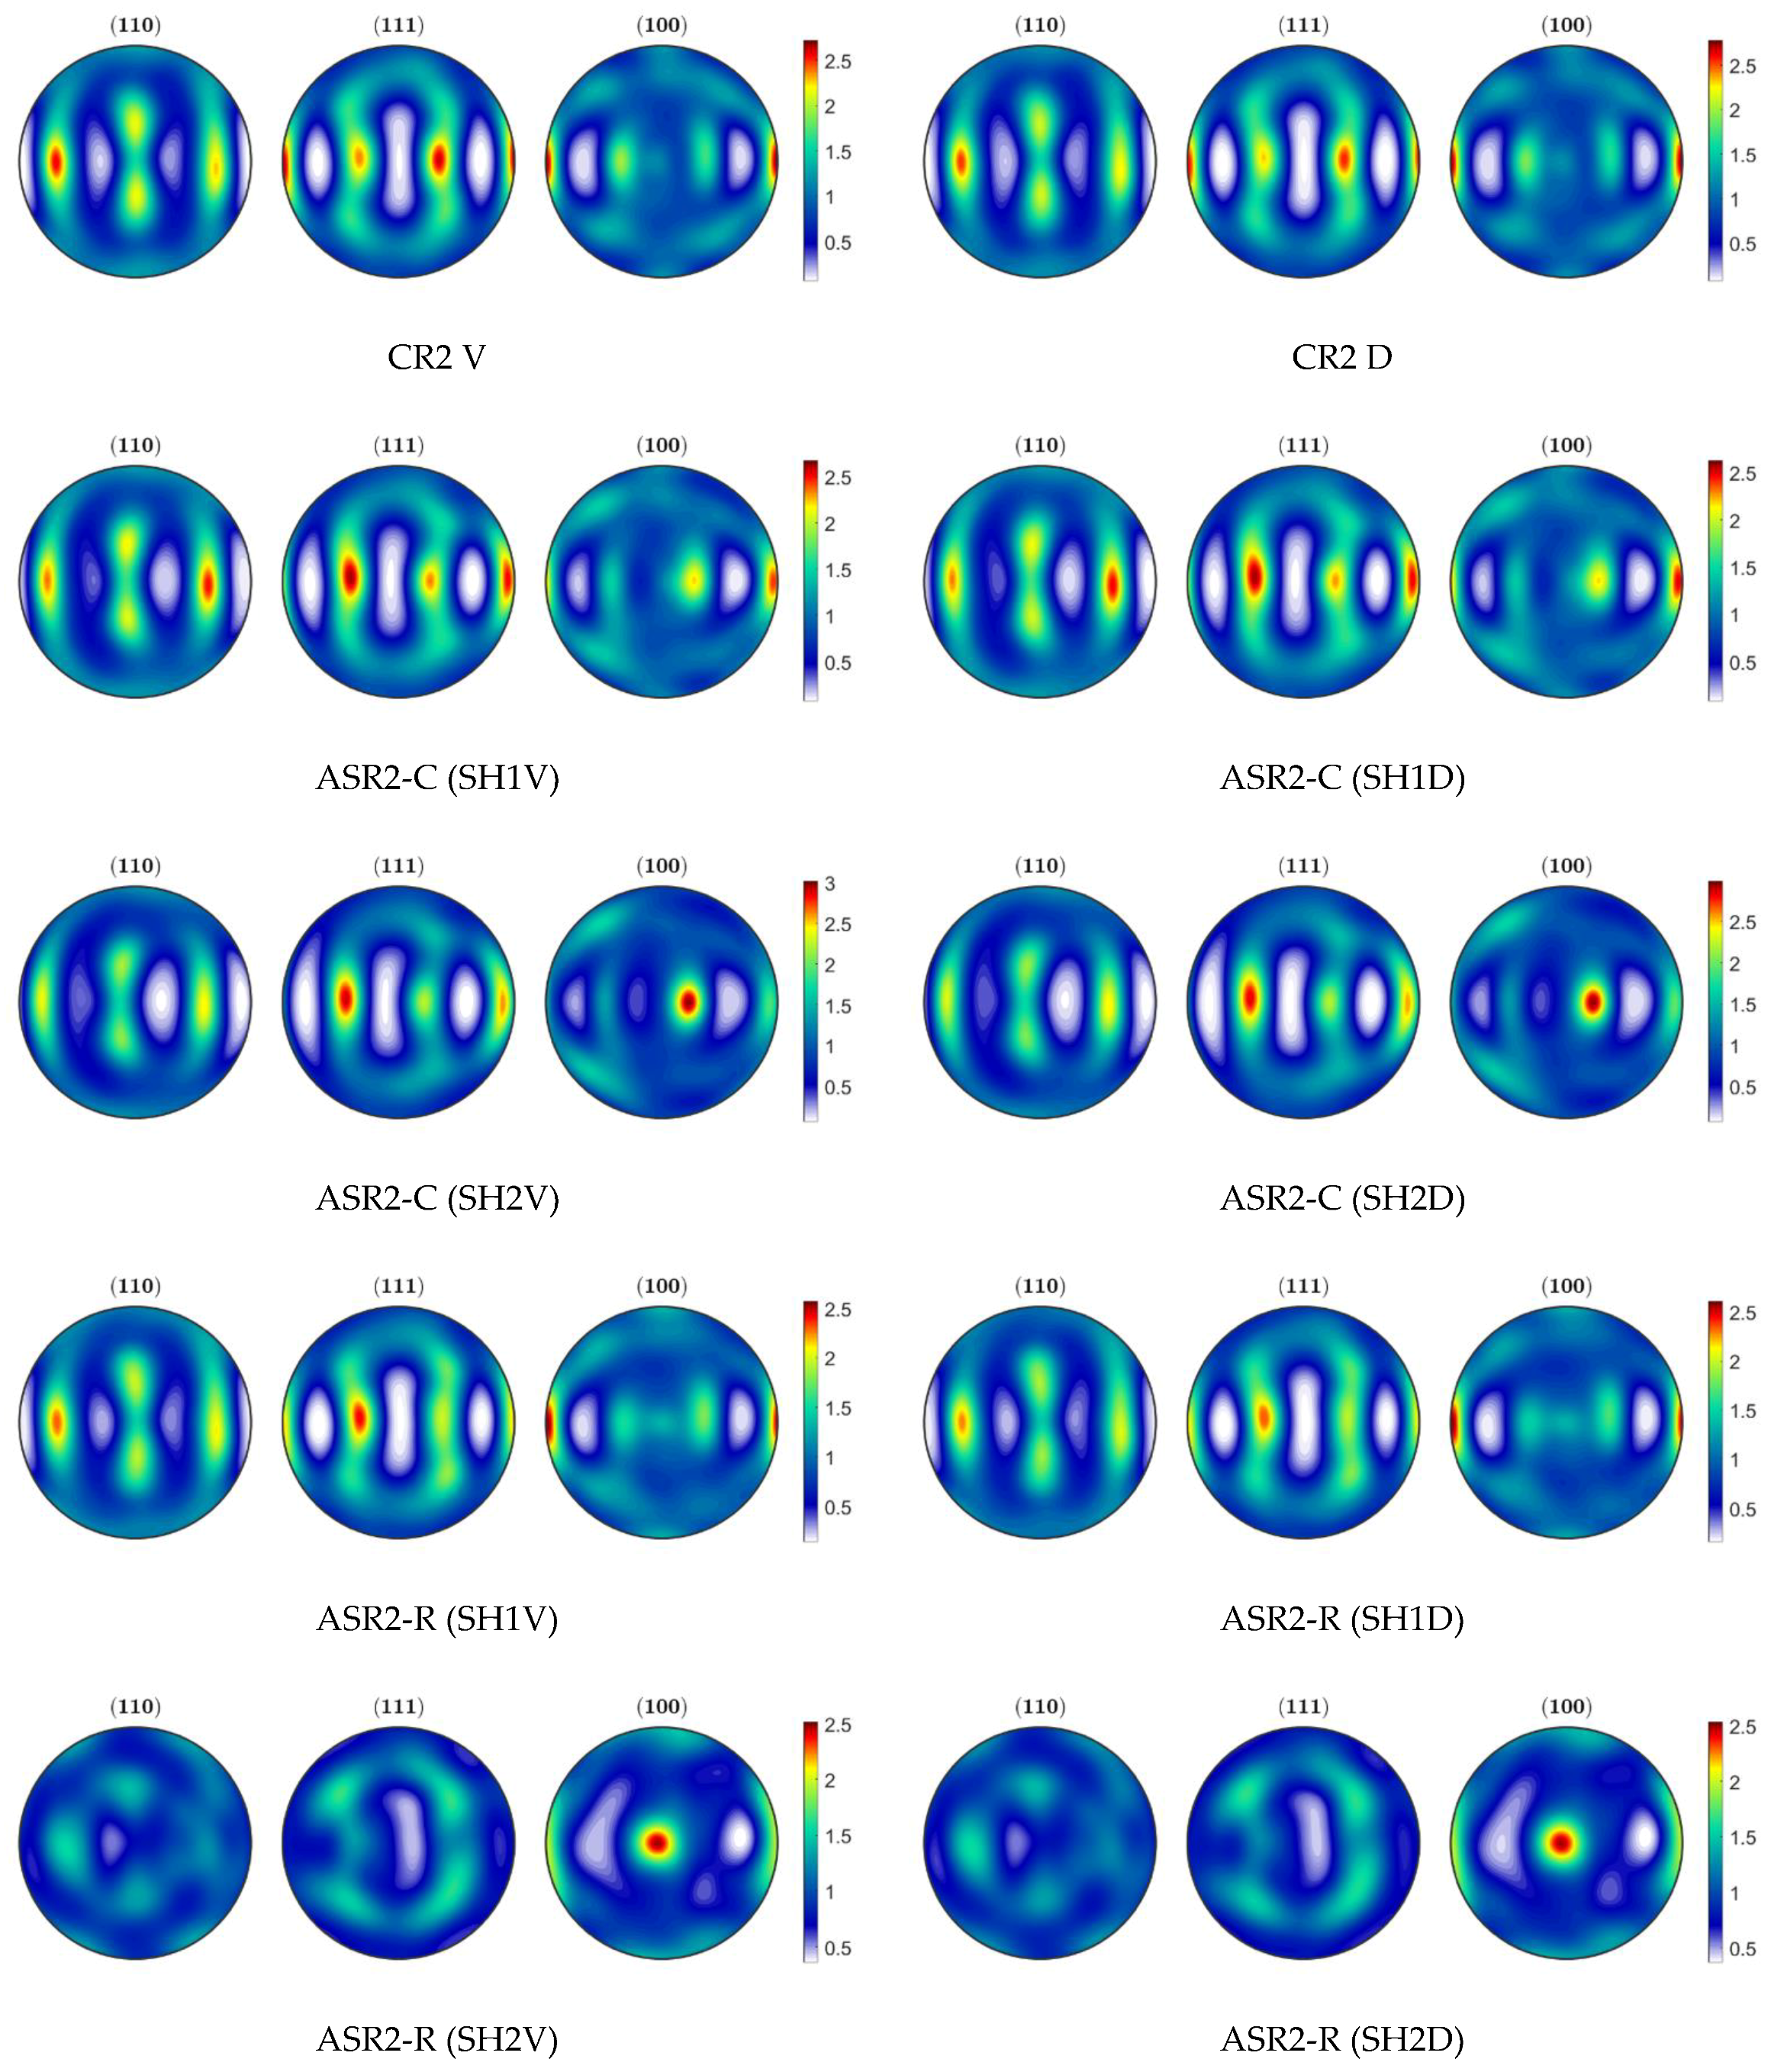
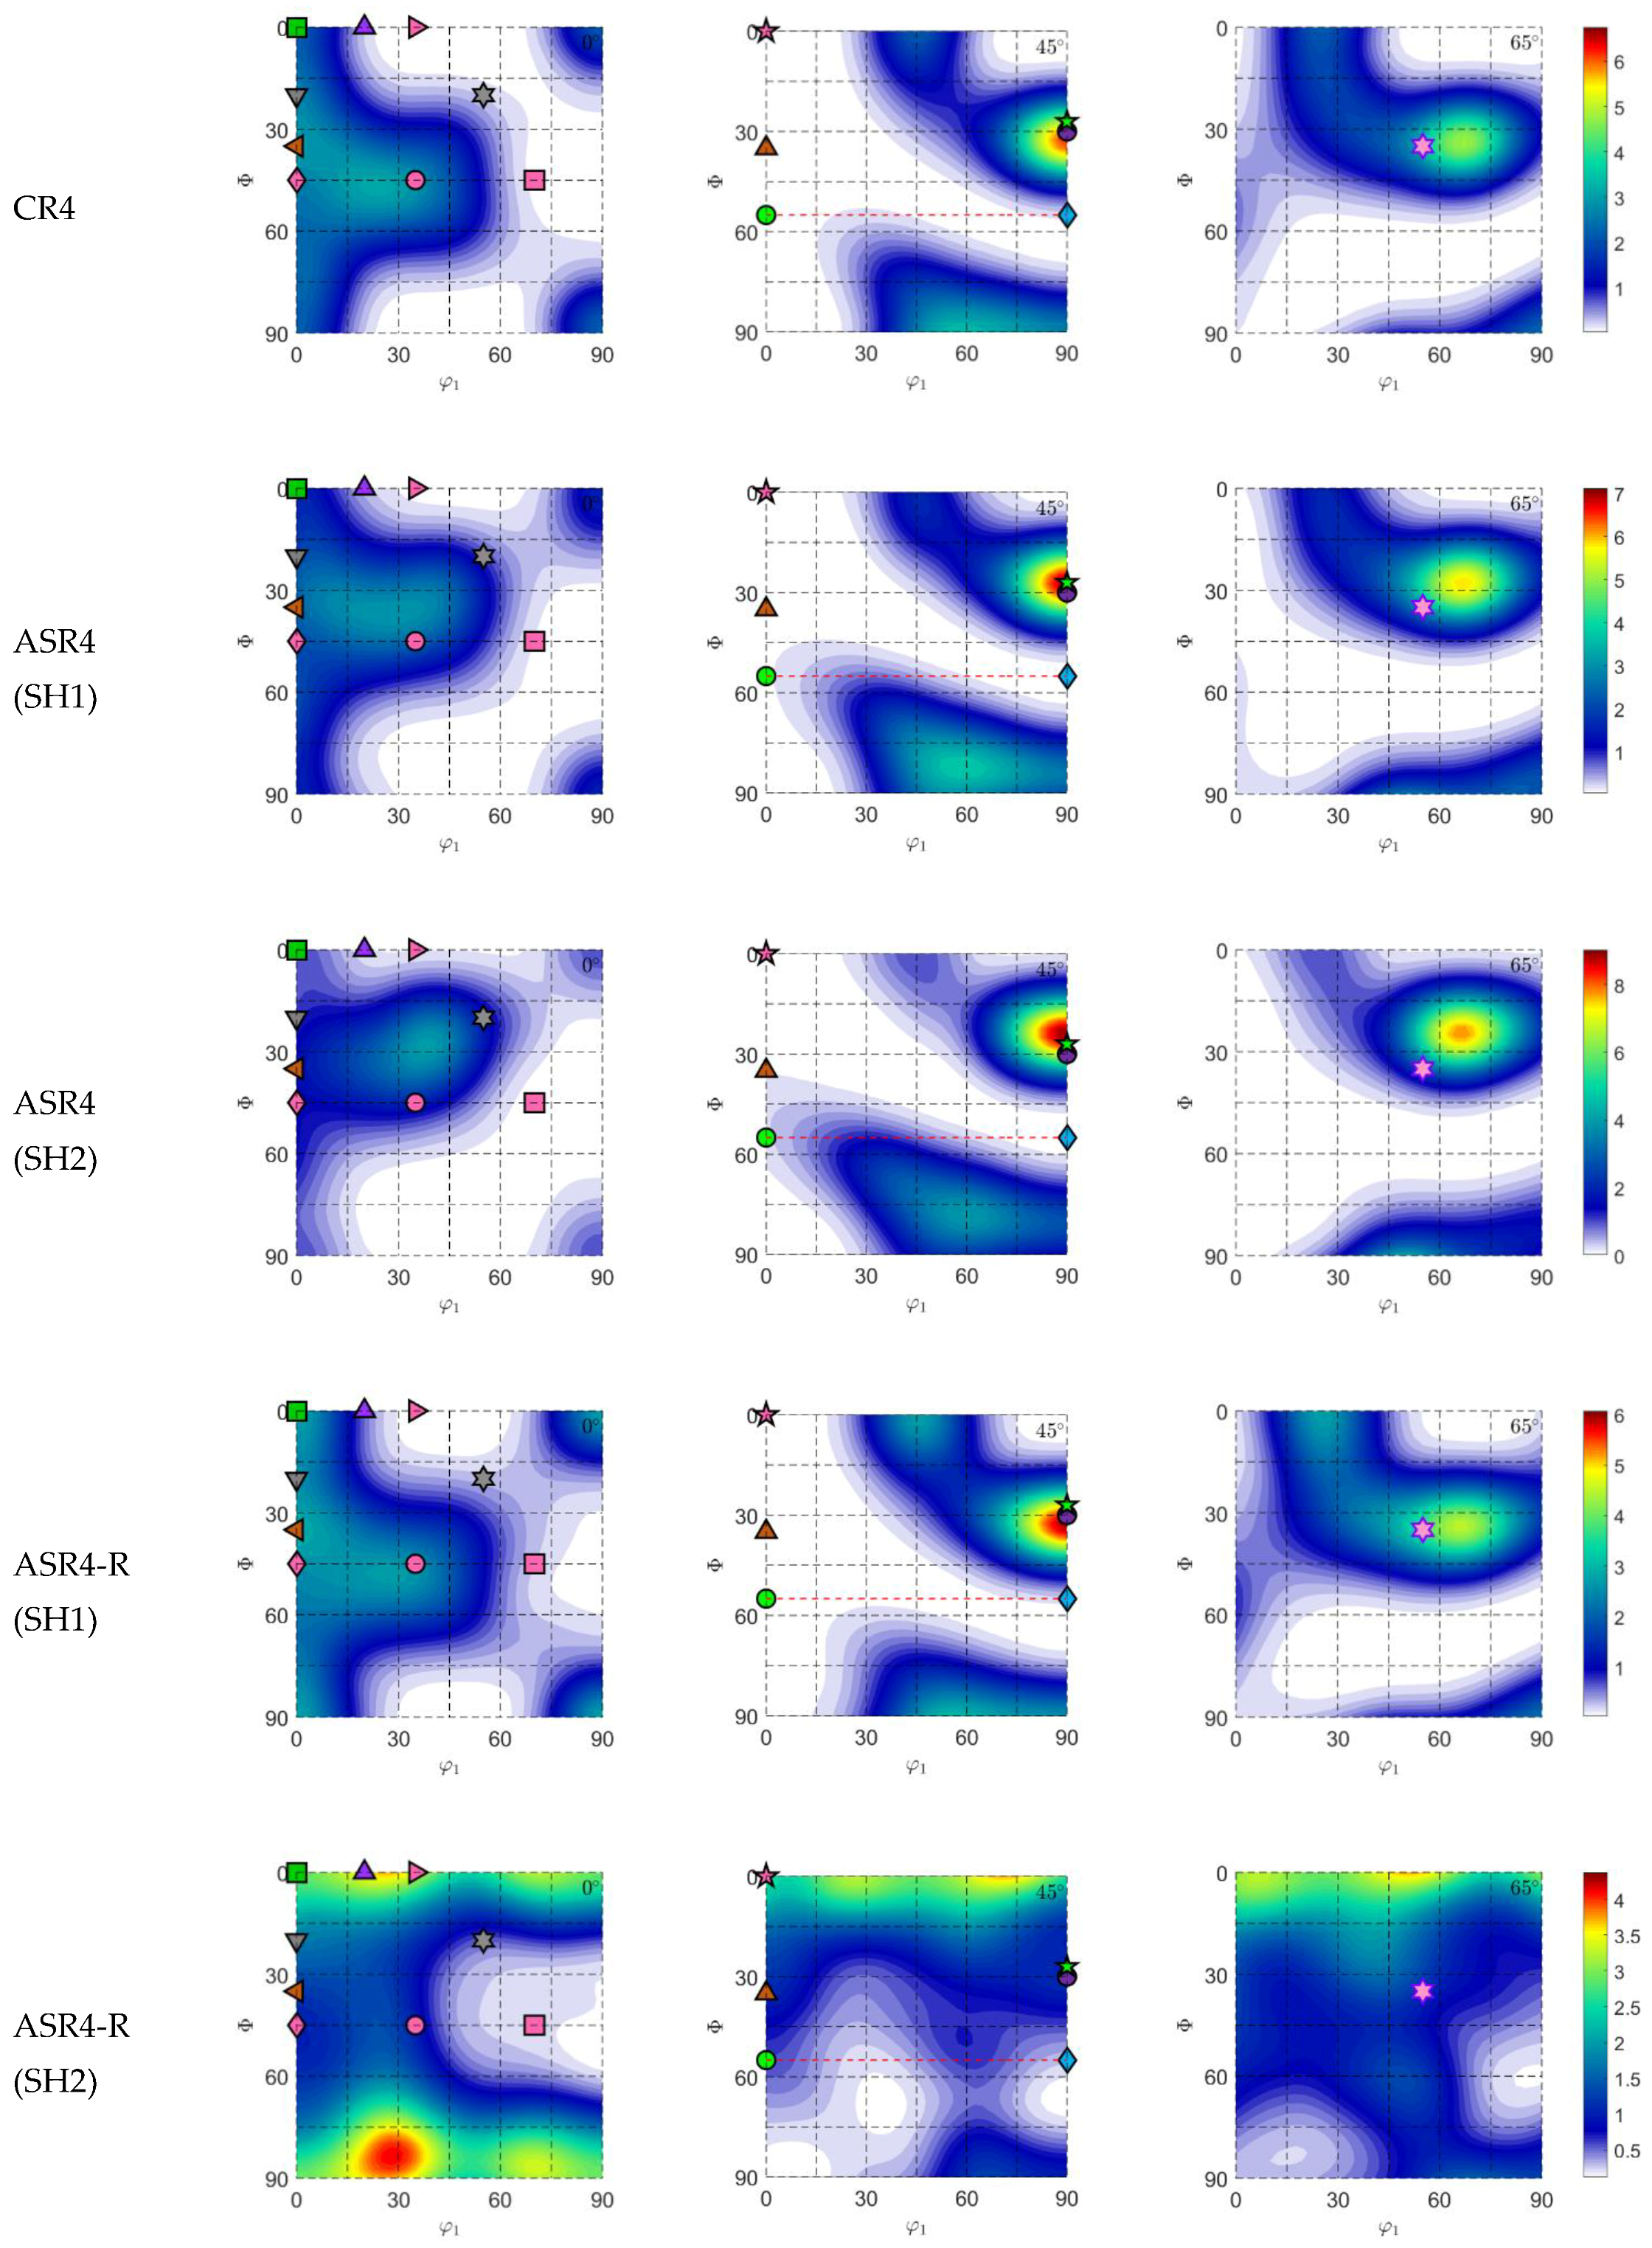
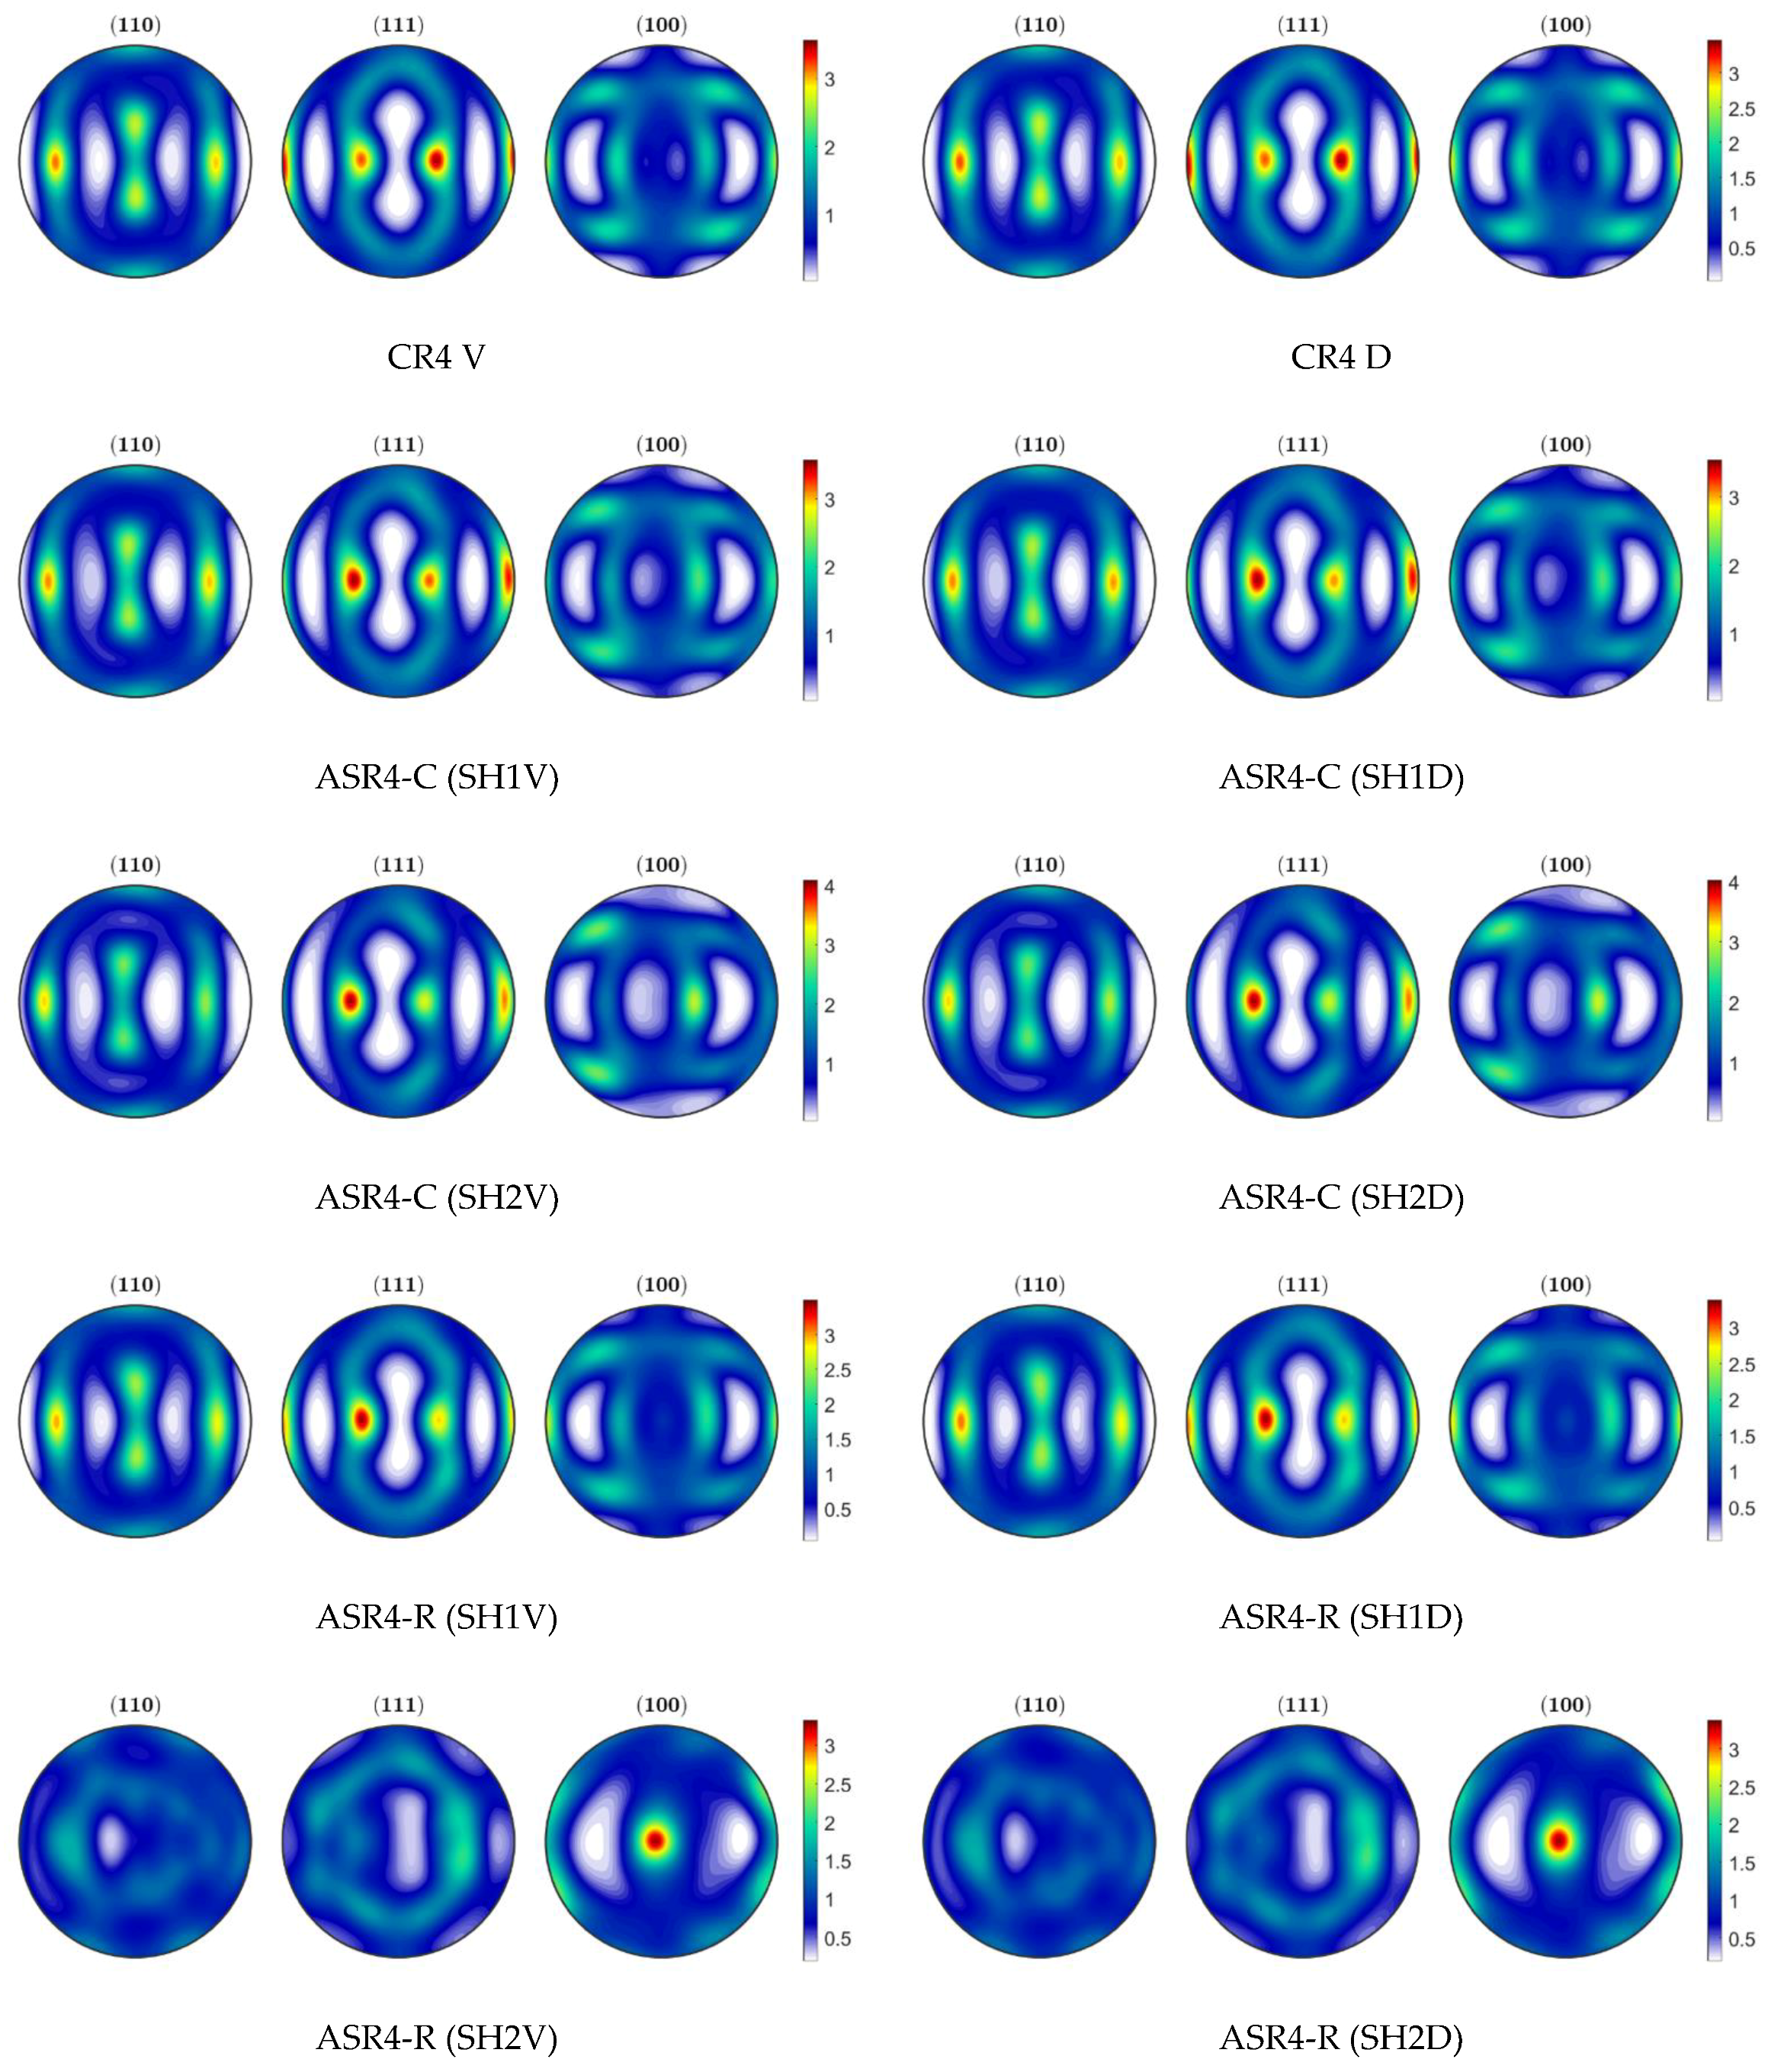
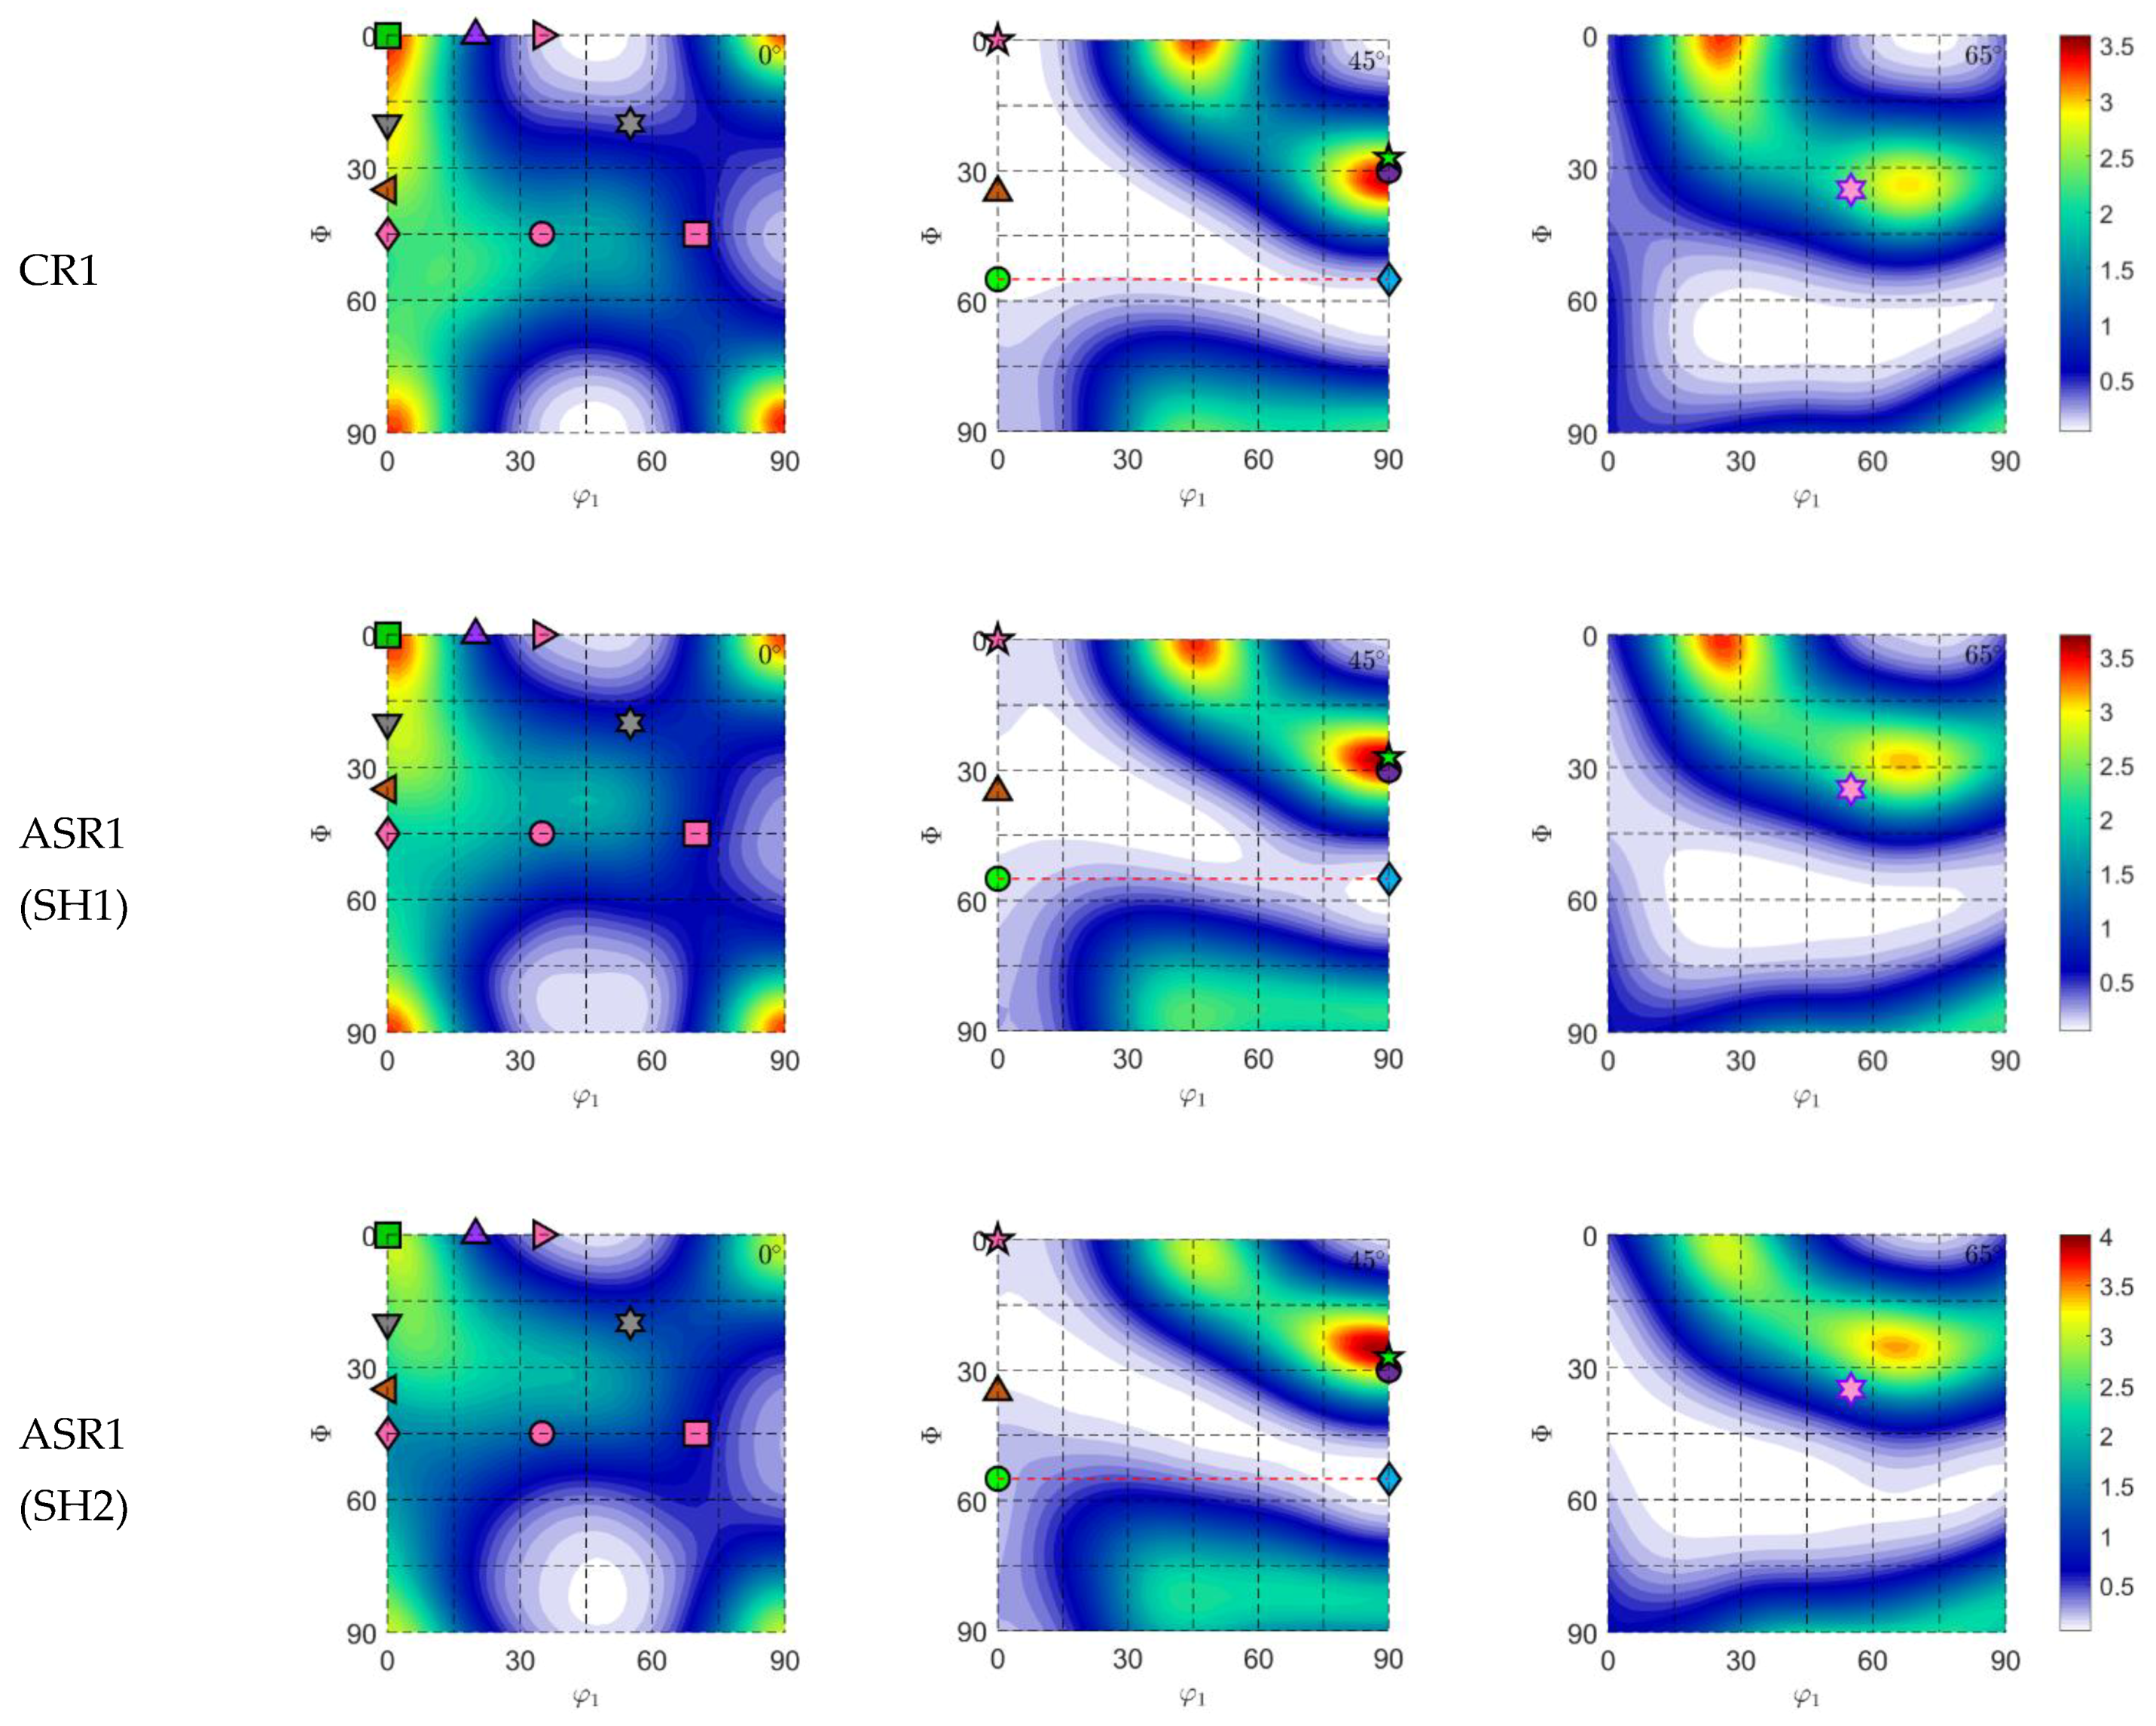
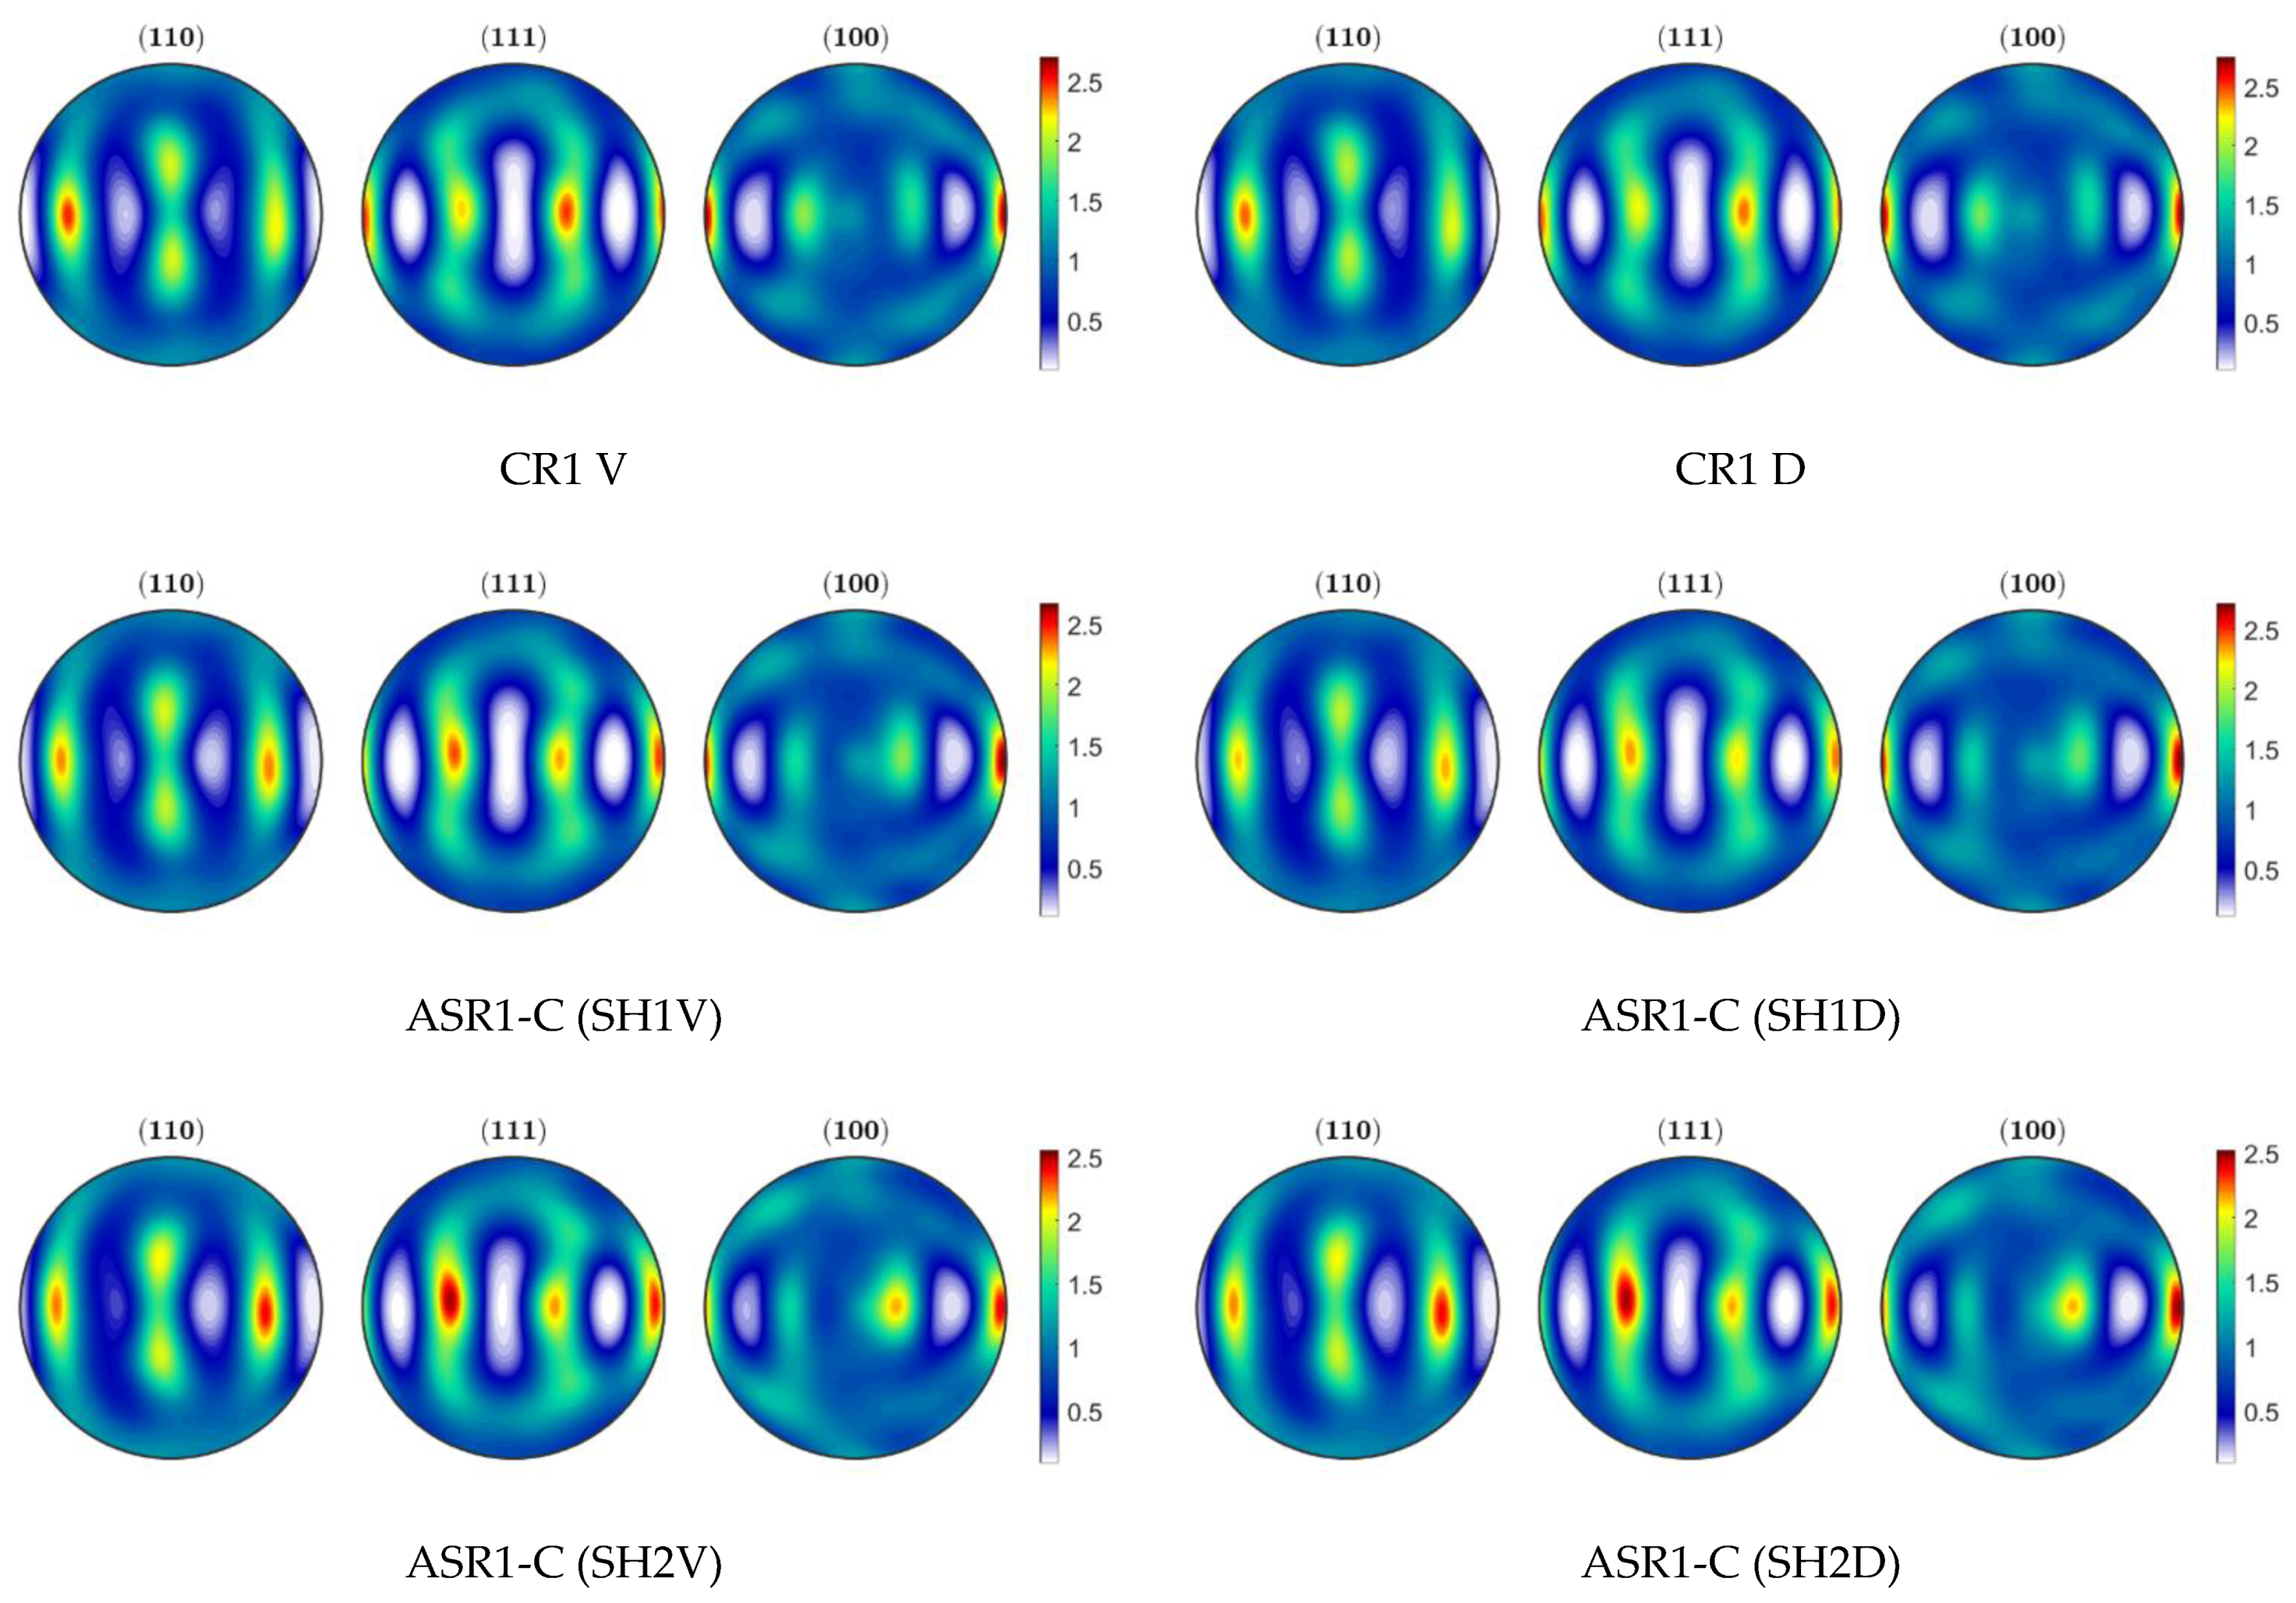
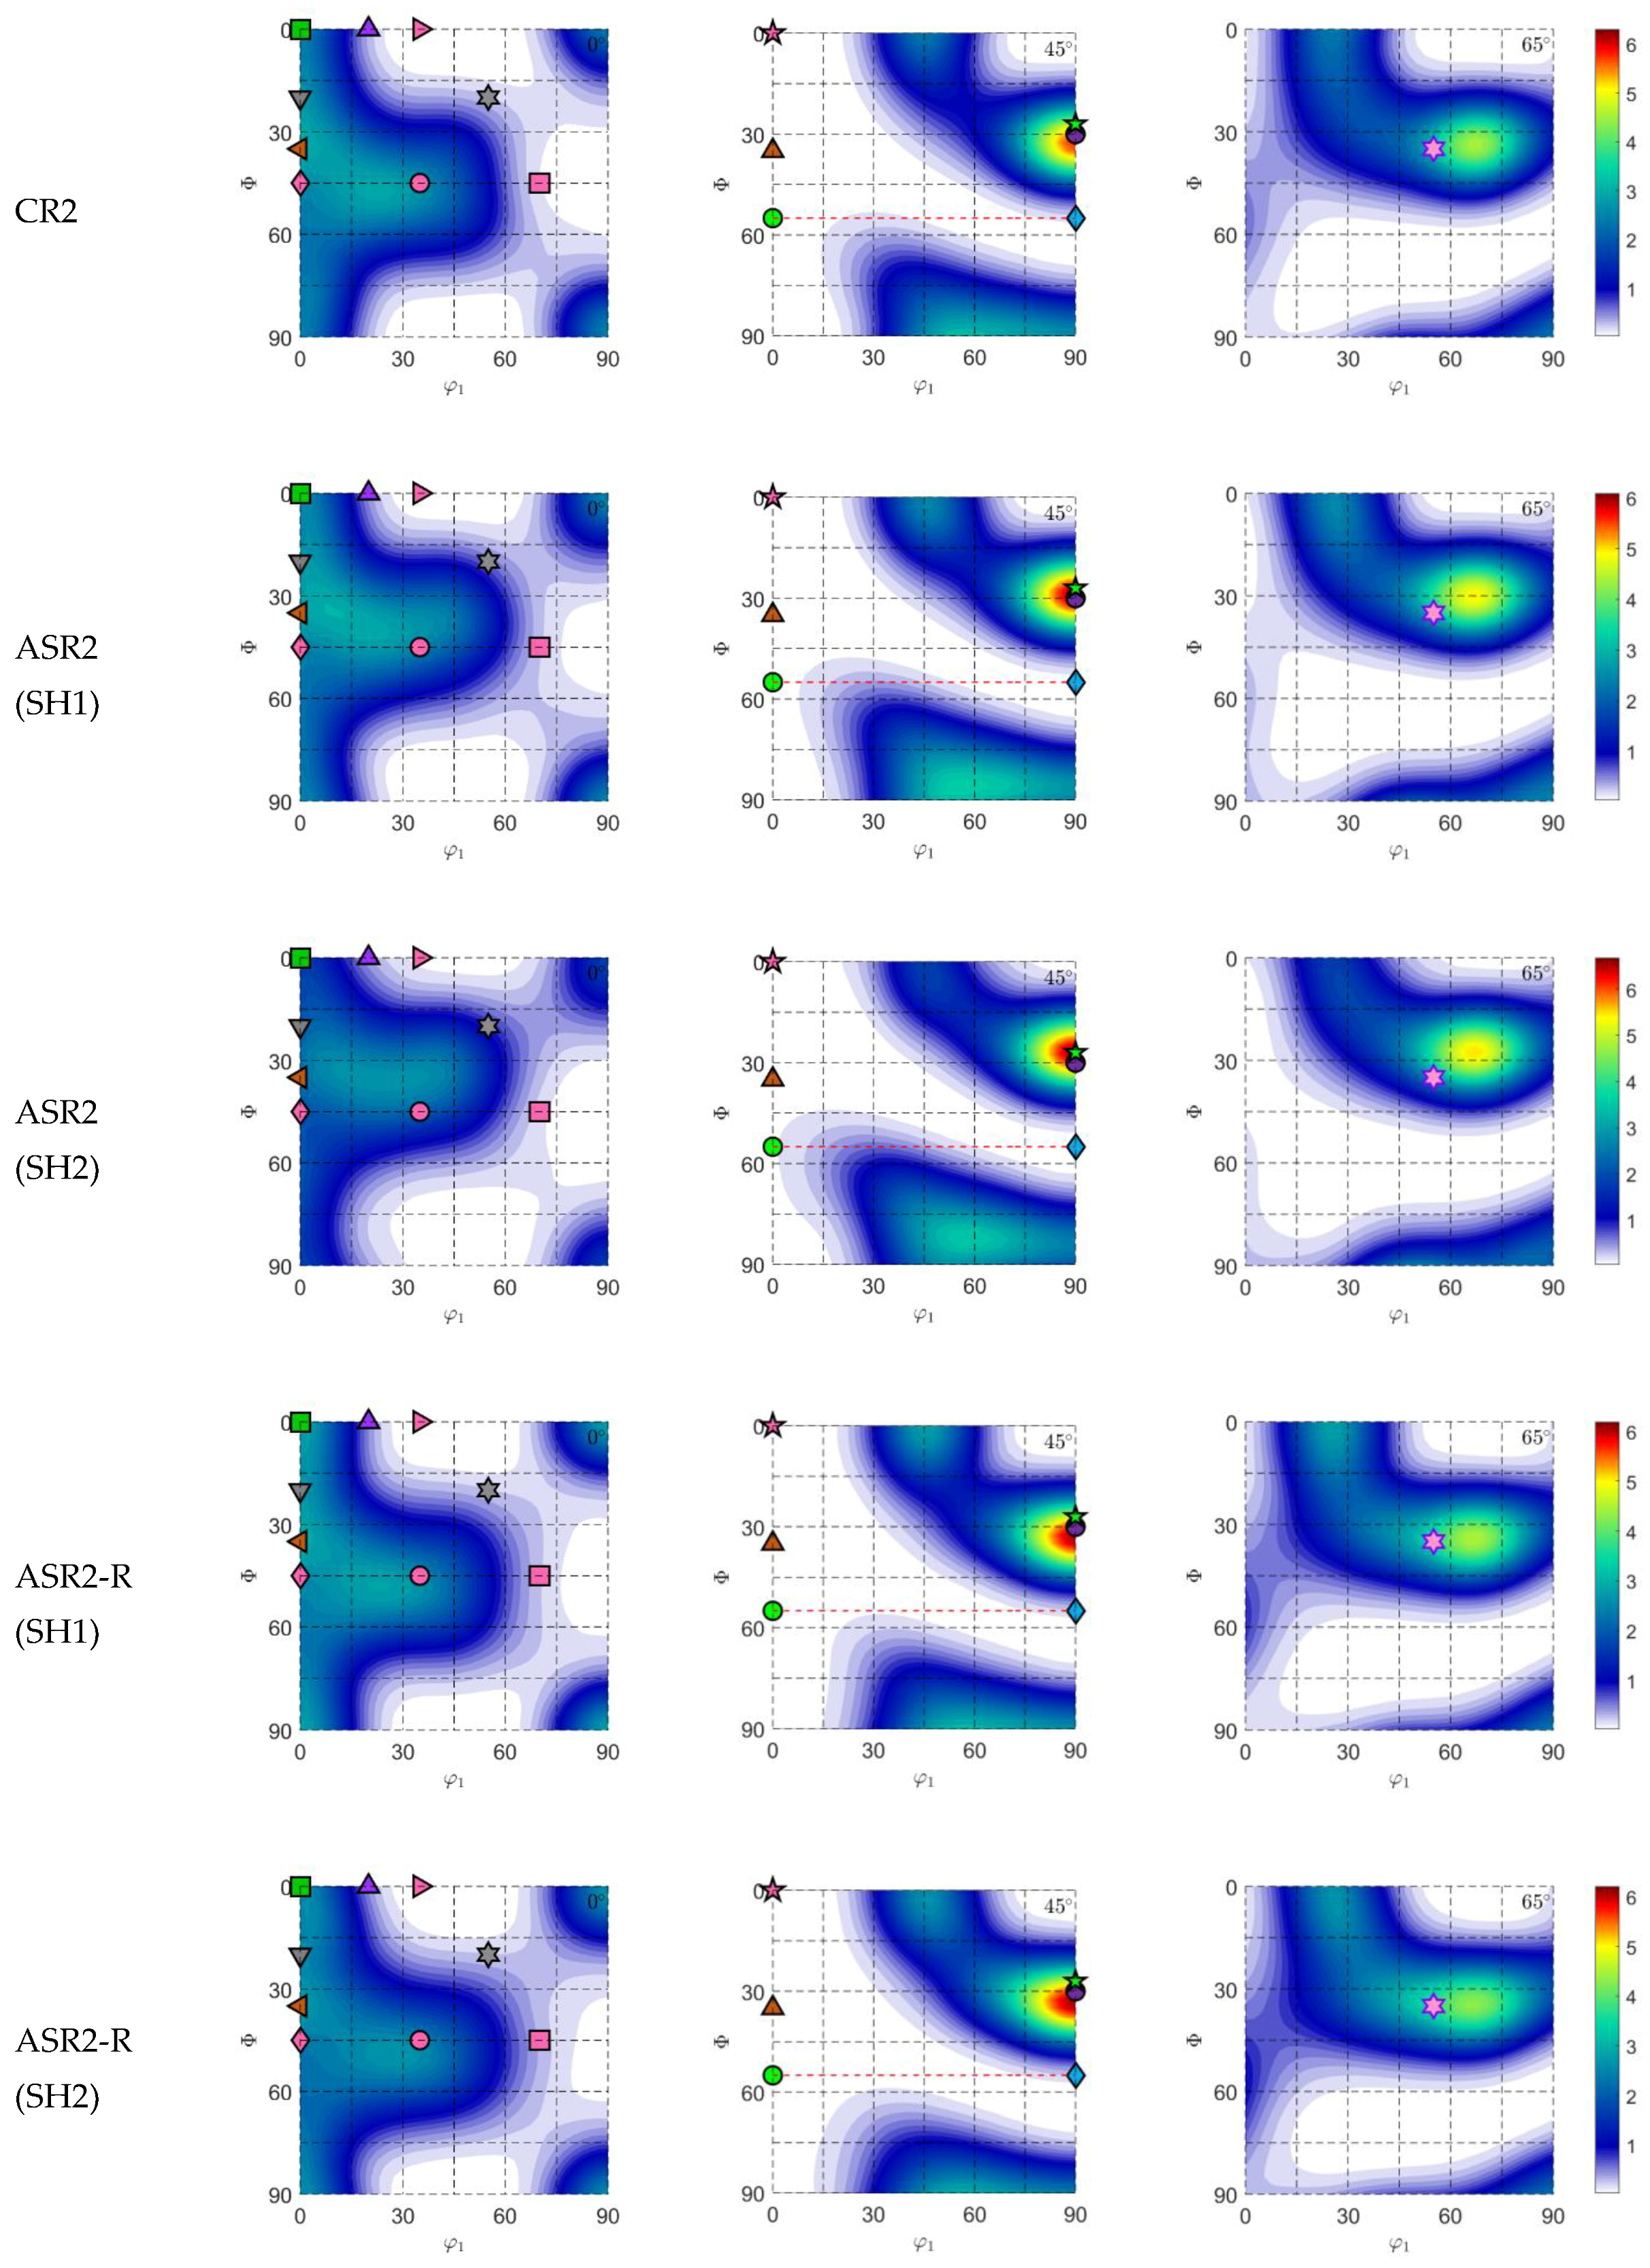
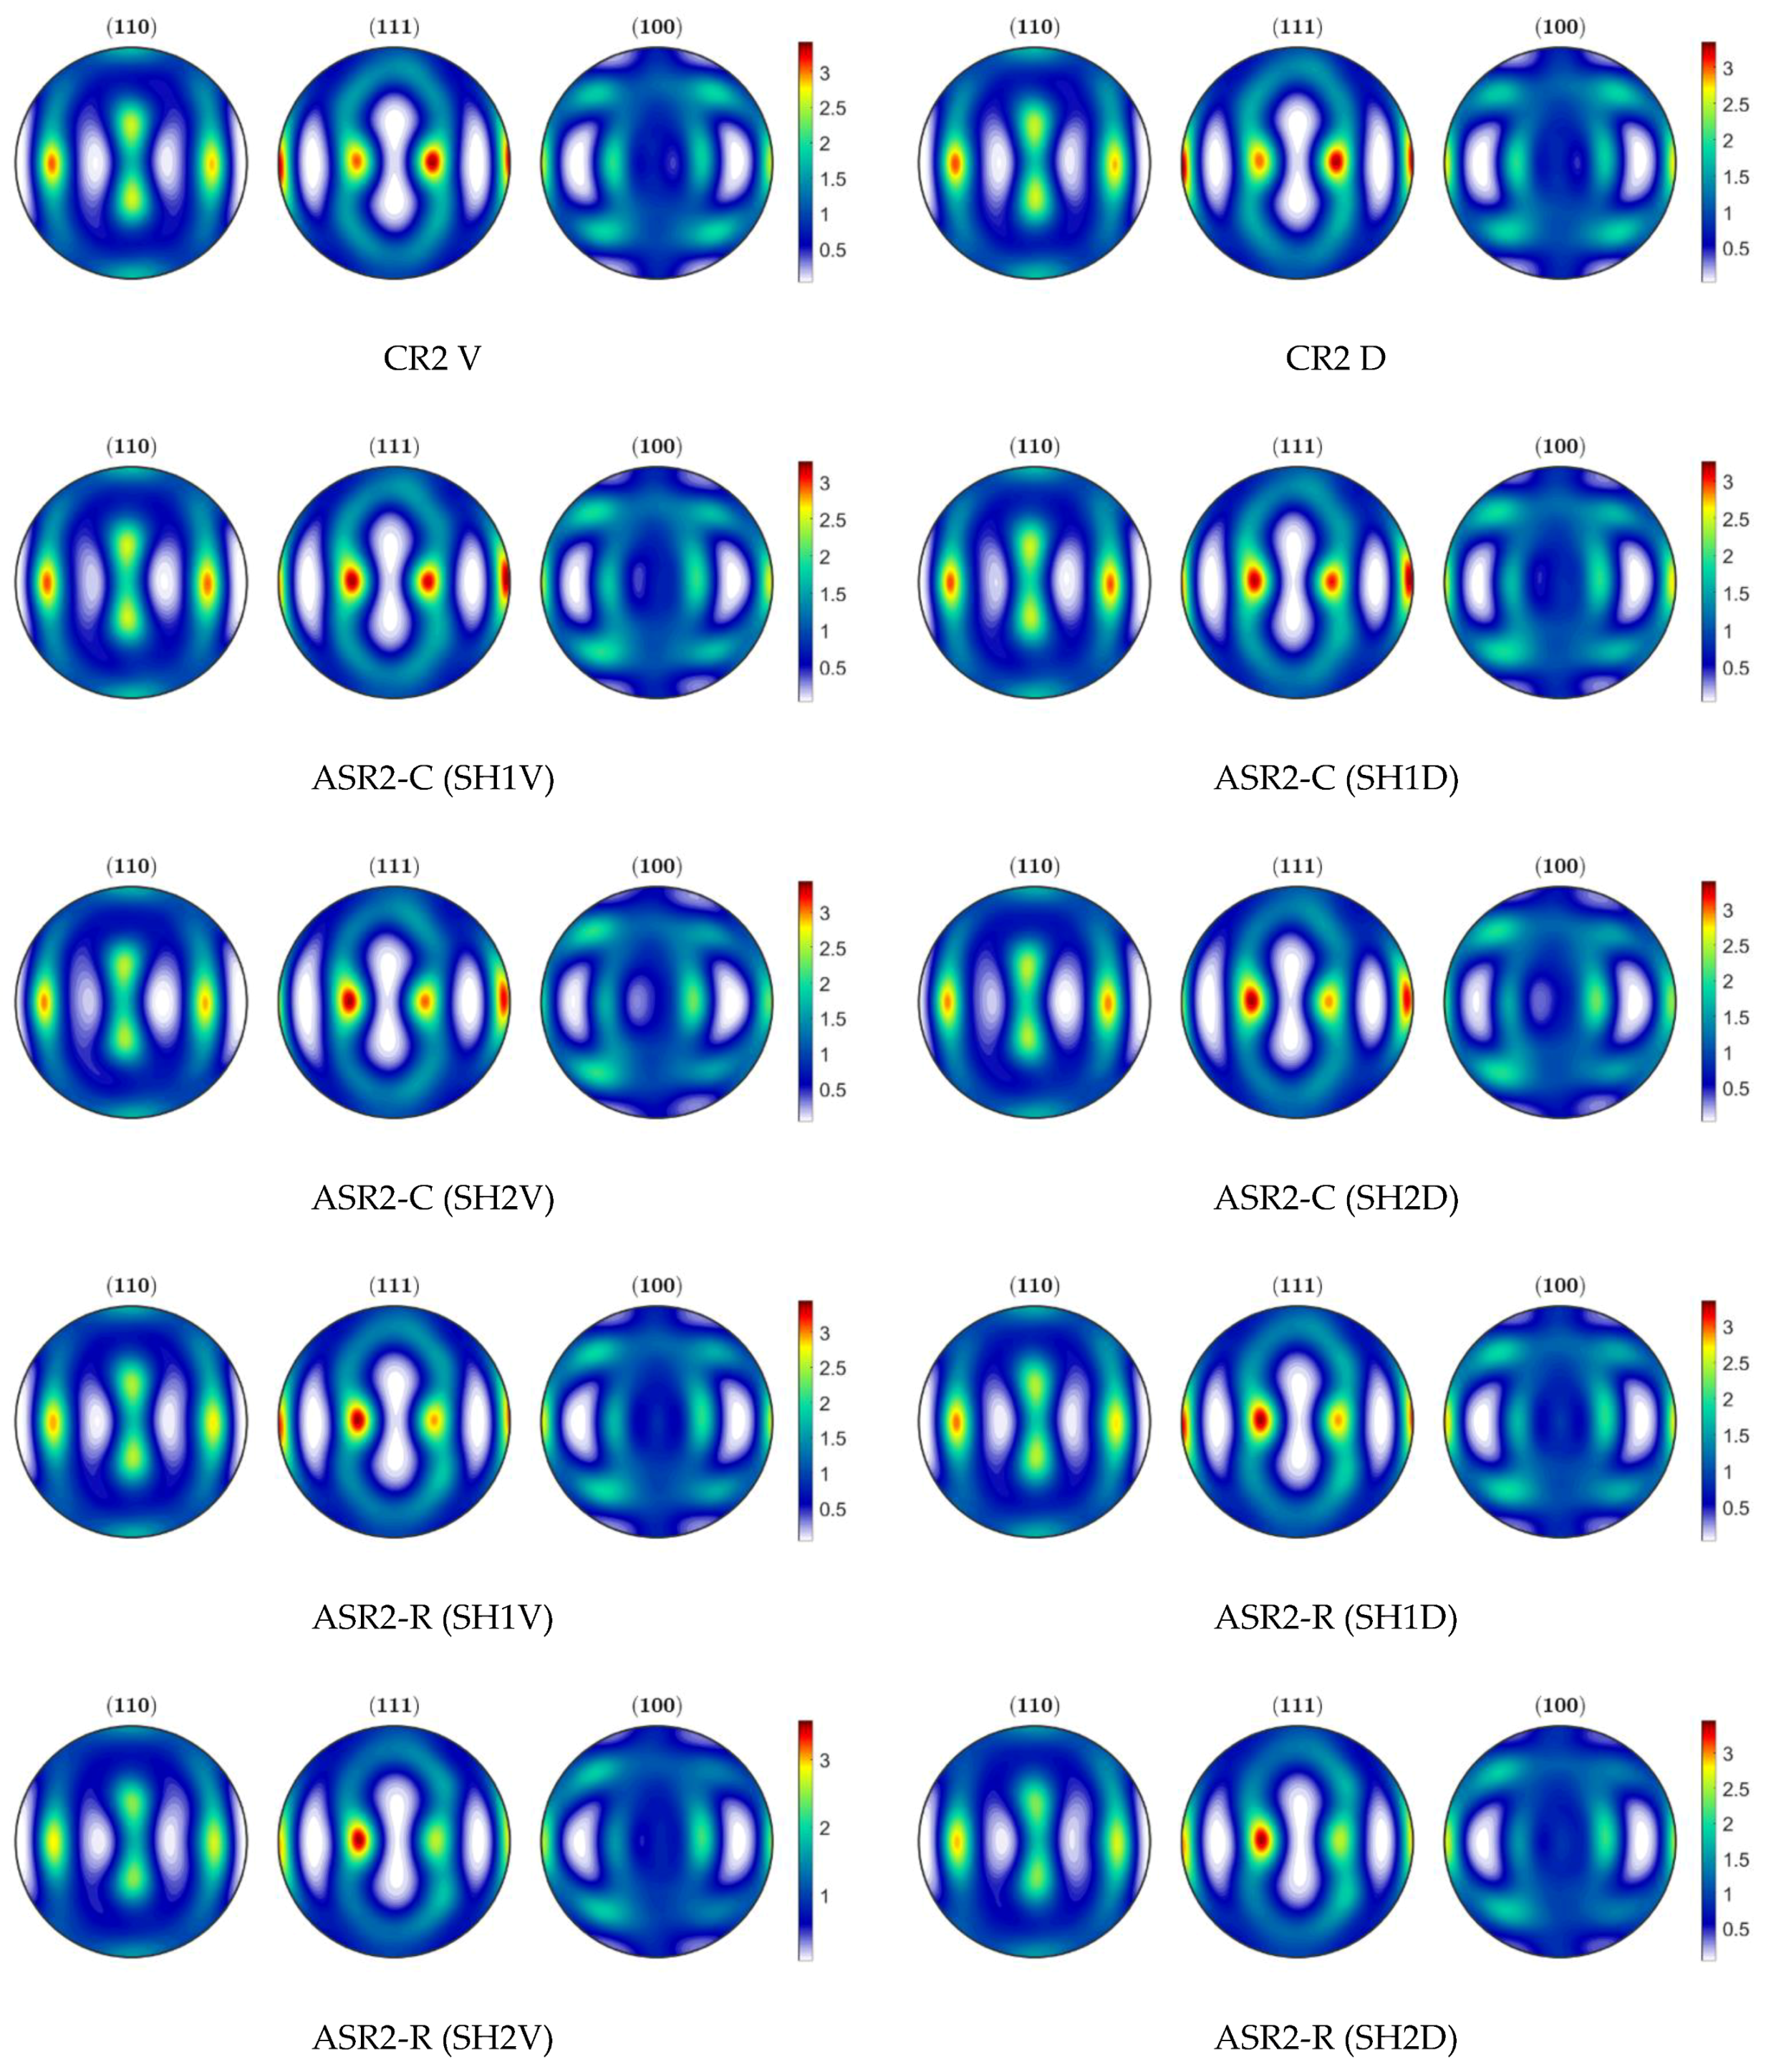
To better understand the missing information, ODF sections considering φ2 = 0°, φ2 = 45°, and φ2 = 65°, and pole figures {110}, {111}, and {100}, are presented in Appendix A from Figure A1, Figure A2, Figure A3, Figure A4, Figure A5, Figure A6, Figure A7, Figure A8, Figure A9, Figure A10, Figure A11 and Figure A12, collected by the sequence pass number. Because the Voce-type and DDR models have similar outcomes (as noted in the bar charts and pole figures), the ODF sections presented represent both approaches well, although corresponding to the Voce-type. The texture evolution predicted by the VPSC model is not sensitive to the hardening law. On the other hand, the grain constitutive law may influence the texture outputs. In this work, the linearization scheme used is a variation of the tangent approach ( n e f f = 10 ).
Additionally, for simplicity, the components are analyzed in terms of ODF sections using the icon legend from Figure 14.
The texture orientations for the CR and ASR with lower imposed shear strain tests show slight differences, suggesting that the prescribed shear deformation may be insufficient to produce shear texture. However, the shear orientations are weak to nonexistent for higher shear deformation in the ASR-C process. Shear orientations are present for the ASR-R (SH2) simulations with a thickness reduction of 20% per pass, although the γ-fiber intensity decreases with the sequence pass number. These observations disagree with those verified with experimental tests by Lee and Lee [34]. In their work, AA1050 aluminum alloy sheets were asymmetrically rolled in several passes using two rolls with different diameters rotating at the same angular speed. They observed that the measured textures approached the ideal shear deformation texture {001}<110> and ND//{111}. Kim and Lee [31] studied the texture evolution on 99.99% asymmetrically rolled aluminum sheets by conducting experimental (different upper and lower rolls radii) and simulation tests. Although the simulated textures were qualitatively comparable with the ones measured, all predictions deviated from the ideal shear orientations. Additionally, they defined the ratio α = ε 13 ε 33 and related it to the stable shear deformation textures. They concluded that by increasing the shear to normal strain ratio, the shear deformation texture would approach the ideal orientations. Moreover, they were unable to obtain the ideal shear texture by unidirectional asymmetric rolling (ASR-C), but by a reversing ASR (ASR-R) scheme, in which the rolling direction changes between passes. A similar conclusion can also be seen in the work of Lee and Lee [35] for asymmetrical rolled AA1050 sheets. Kuramae et al. [9] used a two-scale Finite Element Method (FEM) to predict the texture evolution of AA6022 sheets obtained by cold and warm asymmetric rolling. They concluded that the warm ASR introduced more shear texture orientations into the material than cold ASR Sidor and coworkers [36] performed ASR experimental trials (with different upper and lower rolls radii) and simulations using three different models, namely the full constraint Taylor (FCT) [37], the VPSC model [11], and the Alamel model [37,38], to investigate the texture evolution of AA6016 sheets. Experiments introduced ideal shear texture orientations into the metal, and simulations were in good agreement with the experimental results, although with deviations from the ideal shear texture orientations. Generally, the Alamel model can achieve a better prediction of the texture evolution than the FCT and VPSC models. It must be noted that the shear to normal strain ratio in our work is lower than the ones used in the scientific papers mentioned above, which may explain the weak shear texture orientations in our results. Moreover, it would be advisable to further investigate how the strain path change during multi-step asymmetric rolling affects the mechanical response. Although numerical analysis is an excellent tool to predict the behavior of the material, more experiments should be carried out for a considerable amount of rolling steps to verify the liability of the VPSC for those conditions.

4. Conclusions

  • There is no substantial difference between the Voce-type and DDR model results. The discrepancies in the mechanical behavior may be explained by the fitting curves, which diverge for strain values greater than 0.2. The texture orientations given by both models are almost identical.
  • The ASR-C simulations indicate increased yield stress and improved drawability. However, the planar anisotropy follows the same trend, indicating earing formation during metal forming such as deep drawing.
  • The simulated ASR-R process for lower prescribed shear strain increases the normal anisotropy and makes the material more isotropic. However, a slight decrease in the material strength can be noticed.
  • The ASR-R simulations for higher prescribed shear strain revealed shear orientations development. However, it compromises the material strength and drawability. Additionally, the results indicate a more isotropic material.
  • Overall, the results suggest that the planar anisotropy increase is due to the reduction of the Cube component, although not necessarily due to a higher intensity in the gamma fiber region.
  • The mechanical response predicted by the VPSC has a very significant dependence on the hardening rate and texture evolution during the numerical analysis. Under certain circumstances, the texture evolution may cause an undesired softening effect as verified in the ASR-R results.

Author Contributions

Conceptualization, G.V.; investigation, writing—original draft preparation, A.G.; formal analysis, A.G., G.V., W.W. and A.B.L.; writing—review and editing, G.V., W.W. and M.C.B.; project administration, G.V., A.B.L. and M.C.B.; funding acquisition, G.V., A.B.L. and M.C.B. All authors have read and agreed to the published version of the manuscript.

Funding

This work was supported by the projects POCI-01-0145-FEDER-032362 (PTDC/EME-ESP/32362/2017) financed by the Operational Program for Competitiveness and Internationalization, in its FEDER/FNR component, and the Portuguese Foundation of Science and Technology (FCT), in its State Budget component (OE), UIDB/00481/2020 and UIDP/00481/2020—FCT—Portuguese Foundation of Science and Technology; and CENTRO-01-0145-FEDER-022083—Centro Portugal Regional Operational Program (Centro2020), under the PORTUGAL 2020 Partnership Agreement, through the European Regional Development Fund.

Data Availability Statement

Not applicable.

Acknowledgments

The authors thank Carlos Tome from Los Alamos National Laboratory for providing the visco-plastic self-consistent polycrystal software.

Conflicts of Interest

The authors declare no conflict of interest.

Appendix A

Appendix A presents the ODF sections considering φ2 = 0°, φ2 = 45°, and φ2 = 65° and pole figures {110}, {111}, and {100}, collected by the sequence pass number. The ideal texture components shown in the ODF sections are presented in Figure 14.
Figure A1. ODF sections for the first pass with a 20% thickness reduction per pass.
Metals 12 00979 g0a1
Figure A2. Pole figures for the first pass with a 20% thickness reduction per pass.
Metals 12 00979 g0a2
Figure A3. ODF for the second pass with a 20% thickness reduction per pass.
Metals 12 00979 g0a3
Figure A4. Pole figures for the second pass with a 20% thickness reduction per pass.
Metals 12 00979 g0a4
Figure A5. ODF sections for the third pass with a 20% thickness reduction per pass.
Metals 12 00979 g0a5
Figure A6. Pole figures for the third pass with a 20% thickness reduction per pass.
Metals 12 00979 g0a6
Figure A7. ODF sections for the fourth pass with a 20% thickness reduction per pass.
Metals 12 00979 g0a7
Figure A8. Pole figures for the fourth pass with a 20% thickness reduction per pass.
Metals 12 00979 g0a8
Figure A9. ODF sections for the first pass with a 30% thickness reduction per pass.
Metals 12 00979 g0a9
Figure A10. Pole figures for the first pass with a 30% thickness reduction per pass.
Metals 12 00979 g0a10
Figure A11. ODF sections for the second pass with a 30% thickness reduction per pass.
Metals 12 00979 g0a11
Figure A12. Pole figures for the second pass with a 30% thickness reduction per pass.
Metals 12 00979 g0a12

References

  1. Miki, Y.; Noguchi, O.; Ueno, Y.; Suzuki, Y.; Koyama, K.; Komatsubara, T. Improvement of Deep Drawability of Al-Mg-Si Alloy Sheets for Automotive Panel by Asymmetric Warm Rolling. In Proceedings of the 12th International Conference on Aluminium Alloys, Yokohama, Japan, 5–9 September 2010. [Google Scholar]
  2. Vincze, G.; Simões, F.J.P.; Butuc, M.C. Asymmetrical Rolling of Aluminum Alloys and Steels: A Review. Metals 2020, 10, 1126. [Google Scholar] [CrossRef]
  3. Wroński, S.; Wierzbanowski, K.; Bacroix, B.; Chauveau, T.; Wróbel, M.; Rauch, A.; Montheillet, F.; Wroński, M. Texture heterogeneity of asymmetrically cold rolled low carbon steel. Arch. Metall. Mater. 2009, 54, 89–102. [Google Scholar]
  4. Wronski, M.; Wierzbanowski, K.; Bacroix, B.; Lipinski, P. Asymmetric rolling textures of aluminium studied with crystalline model implemented into FEM. In IOP Conference Series: Materials Science and Engineering; IOP Publishing: Bristol, UK, 2015; Volume 82. [Google Scholar] [CrossRef] [Green Version]
  5. Wronski, M.; Wierzbanowski, K.; Wronski, S.; Bacroix, B.; Lipinski, P. Experimental and finite element analysis of asymmetric rolling of 6061 aluminum alloy using two-scale elasto-plastic constitutive relation. Arch. Metall. Mater. 2017, 62, 1991–1999. [Google Scholar] [CrossRef] [Green Version]
  6. Shore, D.; Van Houtte, P.; Roose, D.; Van Bael, A. Multiscale modelling of asymmetric rolling with an anisotropic constitutive law. Comptes Rendus-Mec. 2018, 346, 724–742. [Google Scholar] [CrossRef]
  7. Tam, N.N.; Nakamura, Y.; Terao, T.; Kuramae, H.; Nakamachi, E.; Sakamoto, H.; Morimoto, H. Asymmetrie rolling process simulations by using dynamic explicit crystallographic homogenized elasto/viscoplastic finite element method. J. Soc. Mater. Sci. Jpn. 2008, 57, 583–589. [Google Scholar] [CrossRef] [Green Version]
  8. Nakamachi, E.; Kuramae, H.; Sakamoto, H.; Morimoto, H. Process metallurgy design of aluminum alloy sheet rolling by using two-scale finite element analysis and optimization algorithm. Int. J. Mech. Sci. 2010, 52, 146–157. [Google Scholar] [CrossRef]
  9. Kuramae, H.; Sakamoto, H.; Morimoto, H.; Nakamachi, E. Process metallurgy design for high-formability aluminum alloy sheet metal generation by using two-scale FEM. Procedia Eng. 2011, 10, 2250–2255. [Google Scholar] [CrossRef] [Green Version]
  10. Molinari, A.; Canova, G.R.; Ahzi, S. A self consistent approach of the large deformation polycrystal viscoplasticity. Acta Metall. 1987, 35, 2983–2994. [Google Scholar] [CrossRef]
  11. Lebensohn, R.A.; Tomé, C.N. A self-consistent anisotropic approach for the simulation of plastic deformation and texture development of polycrystals: Application to zirconium alloys. Acta Metall. Mater. 1993, 41, 2611–2624. [Google Scholar] [CrossRef]
  12. Lebensohn, R.A.; Tomé, C.N. A self-consistent viscoplastic model: Prediction of rolling textures of anisotropic polycrystals. Mater. Sci. Eng. A 1994, 175, 71–82. [Google Scholar] [CrossRef] [Green Version]
  13. Tamimi, S.; Correia, J.P.; Lopes, A.B.; Ahzi, S.; Barlat, F.; Gracio, J.J. Asymmetric rolling of thin AA-5182 sheets: Modelling and experiments. Mater. Sci. Eng. A 2014, 603, 150–159. [Google Scholar] [CrossRef]
  14. de Almeida Gracio, J.J.; Vincze, G.; Yoon, J.W.; Cardoso, R.P.R.; Rauch, E.F.; Barlat, F.G. Modeling the Effect of Asymmetric Rolling on Mechanical Properties of Al-Mg Alloys. Steel Res. Int. 2015, 86, 922–931. [Google Scholar] [CrossRef]
  15. Barlat, F.; Brem, J.C.; Yoon, J.W.; Chung, K.; Dick, R.E.; Lege, D.J.; Pourboghrat, F.; Choi, S.H.; Chu, E. Plane stress yield function for aluminum alloy sheets-Part 1: Theory. Int. J. Plast. 2003, 19, 1297–1319. [Google Scholar] [CrossRef]
  16. Marciniak, Z.; Kuczyński, K. Limit strains in the processes of stretch-forming sheet metal. Int. J. Mech. Sci. 1967, 9, 609–620. [Google Scholar] [CrossRef]
  17. Dhinwal, S.S.; Toth, L.S. Unlocking deformation path in asymmetric rolling by texture simulation. Materials 2020, 13, 101. [Google Scholar] [CrossRef] [Green Version]
  18. Kalidindi, S.R.; Bronkhorst, C.A.; Anand, L. Crystallographic texture evolution in bulk deformation processing of FCC metals. J. Mech. Phys. Solids 1992, 40, 537–569. [Google Scholar] [CrossRef]
  19. Kalidindi, S.R.; Anand, L. An approximate procedure for predicting the evolution of crystallographic texture in bulk deformation processing of fcc metals. Int. J. Mech. Sci. 1992, 34, 309–329. [Google Scholar] [CrossRef]
  20. Zhou, Y.; Neale, K.W.; Tóth, L.S. A modified model for simulating latent hardening during the plastic deformation of rate-dependent FCC polycrystals. Int. J. Plast. 1993, 9, 961–978. [Google Scholar] [CrossRef]
  21. Kitayama, K.; Tomé, C.N.; Rauch, E.F.; Gracio, J.J.; Barlat, F. A crystallographic dislocation model for describing hardening of polycrystals during strain path changes. Application to low carbon steels. Int. J. Plast. 2013, 46, 54–69. [Google Scholar] [CrossRef]
  22. Rauch, E.F.; Gracio, J.J.; Barlat, F.; Vincze, G. Modelling the plastic behaviour of metals under complex loading conditions. Model. Simul. Mater. Sci. Eng. 2011, 19, 035009. [Google Scholar] [CrossRef]
  23. Wen, W.; Borodachenkova, M.; Tomé, C.N.; Vincze, G.; Rauch, E.F.; Barlat, F.; Grácio, J.J. Mechanical behavior of Mg subjected to strain path changes: Experiments and modeling. Int. J. Plast. 2015, 73, 171–183. [Google Scholar] [CrossRef] [Green Version]
  24. Wen, W.; Borodachenkova, M.; Tomé, C.N.; Vincze, G.; Rauch, E.F.; Barlat, F.; Grácio, J.J. Mechanical behavior of low carbon steel subjected to strain path changes: Experiments and modeling. Acta Mater. 2016, 111, 305–314. [Google Scholar] [CrossRef] [Green Version]
  25. Tomé, C.N.; Lebensohn, R.A. Manual for Code Visco-Plastic Self-Consistent (VPSC), Version 7d; Los Alamos National Laboratory: Los Alamos, NM, USA, 2018.
  26. Bachmann, F.; Hielscher, R.; Schaeben, H. Texture analysis with MTEX- Free and open source software toolbox. Solid State Phenom. 2010, 160, 63–68. [Google Scholar] [CrossRef] [Green Version]
  27. Tome, C.; Canova, G.R.; Kocks, U.F.; Christodoulou, N.; Jonas, J.J. The relation between macroscopic and microscopic strain hardening in F.C.C. polycrystals. Acta Metall. 1984, 32, 1637–1653. [Google Scholar] [CrossRef]
  28. Inoue, H.; Takasugi, T. Texture control for improving deep drawability in rolled and annealed aluminum alloy sheets. Mater. Trans. 2007, 48, 2014–2022. [Google Scholar] [CrossRef] [Green Version]
  29. Wang, K.; Li, J.; Stoughton, T.B.; Carsley, J.E.; Carlson, B.E. Effect of preform annealing on plastic anisotropy of an age-hardenable Al-Mg-Si alloy. J. Mater. Process. Technol. 2018, 252, 381–388. [Google Scholar] [CrossRef]
  30. Kasemer, M.; Falkinger, G.; Roters, F. A numerical study of the influence of crystal plasticity modeling parameters on the plastic anisotropy of rolled aluminum sheet. Model. Simul. Mater. Sci. Eng. 2020, 28, 085005. [Google Scholar] [CrossRef]
  31. Kim, K.-H.H.; Lee, D.N. Analysis of deformation textures of asymmetrically rolled aluminum sheets. Acta Mater. 2001, 49, 2583–2595. [Google Scholar] [CrossRef]
  32. Kang, S.B.; Min, B.K.; Kim, H.W.; Wilkinson, D.S.; Kang, J. Effect of asymmetric rolling on the texture and mechanical properties of AA6111-aluminum sheet. Metall. Mater. Trans. A Phys. Metall. Mater. Sci. 2005, 36, 3141–3149. [Google Scholar] [CrossRef]
  33. Sidor, J.; Miroux, A.; Petrov, R.; Kestens, L. Controlling the plastic anisotropy in asymmetrically rolled aluminium sheets. Philos. Mag. 2008, 88, 3779–3792. [Google Scholar] [CrossRef]
  34. Lee, J.K.; Lee, D.N. Shear texture development and grain refinement in asymmetrically rolled aluminum alloy sheets by varied reduction per pass. In Materials Science Forum; Trans Tech Publications Ltd.: Freienbach, Switzerland, 2002; Volume 408–412, pp. 1419–1424. [Google Scholar]
  35. Lee, J.-K.; Lee, D.N. Texture control and grain refinement of AA1050 Al alloy sheets by asymmetric rolling. Int. J. Mech. Sci. 2008, 50, 869–887. [Google Scholar] [CrossRef]
  36. Sidor, J.; Miroux, A.; Petrov, R.; Kestens, L. Microstructural and crystallographic aspects of conventional and asymmetric rolling processes. Acta Mater. 2008, 56, 2495–2507. [Google Scholar] [CrossRef]
  37. Van Houtte, P.; Kanjarla, A.K.; Van Bael, A.; Seefeldt, M.; Delannay, L. Multiscale modelling of the plastic anisotropy and deformation texture of polycrystalline materials. Eur. J. Mech. A/Solids 2006, 25, 634–648. [Google Scholar] [CrossRef]
  38. Van Houtte, P.; Li, S.; Seefeldt, M.; Delannay, L. Deformation texture prediction: From the Taylor model to the advanced Lamel model. Int. J. Plast. 2005, 21, 589–624. [Google Scholar] [CrossRef]
Figure 1. EBSD orientation map of the initial material.
Metals 12 00979 g001
Figure 2. Pole figures {110}, {111}, and {100}, and ODF sections for φ2 = 0° (left), φ2 = 45° (middle), and φ2 = 65° (right) of the initial material.
Metals 12 00979 g002
Figure 3. Fitting stress–strain curves for the DDR (D) and Voce-type (V) strain hardening rules.
Metals 12 00979 g003
Figure 4. Shear deformation scheme: (a) before rolling and (b) after asymmetric rolling.
Metals 12 00979 g004
Figure 5. Stress–strain curves after a thickness reduction of 20% per pass of CR, ASR-C, and ASR-R simulations using two different hardening laws, Voce-type (V) and DDR (D), and two different amounts of shear, (SH1) and (SH2), for the asymmetric rolling tests: (a) 1st pass; (b) 2nd pass; (c) 3rd pass; and (d) 4th pass.
Metals 12 00979 g005aMetals 12 00979 g005b
Figure 6. Stress–strain curves of four-pass sequences rolling with 20% reduction per pass, considering two different shear strain values, (SH1) and (SH2), for simulations: (a) conventional rolling with a Voce-type hardening law (V); (b) conventional rolling with DDR model (D); (c) asymmetric rolling-continuous with a Voce-type hardening law; (d) asymmetric-continuous rolling with DDR model; (e) asymmetric-reverse rolling with a Voce-type hardening law and a lower shear strain value (SH1); (f) asymmetric rolling-reverse with DDR model and a lower shear strain value (SH1); (g) asymmetric-reverse rolling with a Voce-type hardening law and a higher shear strain value (SH2); and (h) asymmetric rolling-reverse with DDR model and a higher shear strain value (SH2).
Metals 12 00979 g006aMetals 12 00979 g006b
Figure 7. Stress–strain curves of a four-pass asymmetric-reverse rolling sequence, with 20% reduction per pass, considering a shear strain of 0.21 (SH2), and without considering texture evolution using: (a) a Voce-type hardening law (V) and (b) the DDR model (D).
Metals 12 00979 g007
Figure 8. Stress–strain curves of a four-pass asymmetric-reverse rolling sequence, with 20% reduction per pass, considering a shear strain of 0.21 (SH2), only considering texture evolution and no hardening update during simulations using: (a) a Voce-type hardening law (V) and (b) the DDR model (D).
Metals 12 00979 g008
Figure 9. Stress–strain curves after a thickness reduction of 30% per pass of CR, ASR-C, and ASR-R simulations using two different hardening laws, Voce-type (V) and DDR (D), and two different shear strain values, (SH1) and (SH2), for the asymmetric rolling: (a) 1st pass and (b) 2nd pass.
Metals 12 00979 g009
Figure 10. Stress–strain curves of two-pass sequences rolling with a 30% reduction per pass, considering two different shear strain values, (SH1) and (SH2), for: (a) conventional rolling with a Voce-type hardening law (V); (b) conventional rolling with DDR model (D); (c) asymmetric-continuous rolling with a Voce-type hardening law; (d) asymmetric-continuous rolling with DDR model; (e) asymmetric-reverse rolling with a Voce-type hardening law; and (f) asymmetric-reverse rolling with DDR model, simulation.
Metals 12 00979 g010
Figure 11. Voce-type and DDR model stress–strain curves for a 100% deformation.
Metals 12 00979 g011
Figure 12. Simulated R-values of four-pass sequences rolling with a 20% thickness reduction per pass of CR, ASR-C, and ASR-R processes, considering two different amounts of shear strain, (SH1) and (SH2), for the: (a) 1st pass using a Voce-type hardening law (V); (b) 1st pass using the DDR model (D); (c) 2nd pass using a Voce-type hardening law; (d) 2nd pass using the DDR mode© (e) 3rd pass using a Voce-type hardening law; (f) 3rd pass using the DDR model; (g) 4th pass using a Voce-type hardening law; and (h) 4th pass using the DDR model.
Metals 12 00979 g012aMetals 12 00979 g012b
Figure 13. Simulated R-values of two-pass sequences rolling with a 30% thickness reduction per pass of CR, ASR-C, and ASR-R processes, considering two different shear strain values, (SH1) and (SH2), for the: (a) 1st pass using a Voce-type hardening law (V); (b) 1st pass using the DDR model (D); (c) 2nd pass using a Voce-type hardening law; and (d) 2nd pass using the DDR model.
Metals 12 00979 g013
Figure 14. Ideal texture components for FCC metals, represented in pole figures {110}, {111}, and {100}, and ODF sections for φ2 = 0°, φ2 = 45°, and φ2 = 65°.
Metals 12 00979 g014
Figure 15. VPSC texture rolling components for four-pass sequences with 20% reduction per pass.
Metals 12 00979 g015
Figure 16. VPSC texture rolling components for two-pass sequences with 30% reduction per pass.
Metals 12 00979 g016
Table 1. Chemical composition of the material as-received wt.%.
SiFeCuMnMgNiCrZnTiOthers
0.590.480.250.110.940.000.230.110.100.15
Table 2. Material constants of the Voce-type model for the AA6061-T4 alloy (MPa).
τ 0 τ 1 θ 0 θ 1
55.580.0450.00.8
Table 3. Material constants of the DDR model for the AA6061-T4 alloy.
ConstantsValues
μ (Elastic shear modulus)24.0 GPa
b (Burgers vector)2.86 × 10⁻¹⁰
D (Grain size)10 μm
τ 0 (Initial CRSS)55 MPa
K (Mobile to storage parameter)67
f (Recombination parameter)4
ρ m i n (Lower reversibility threshold)1.0 × 10¹²
ρ m a x (Lower reversibility threshold)7.0 × 10¹⁴
f B S (Back-stress parameter)0.5
q (Back-stress parameter)2
m (Recombination rate parameter)0.3
α S S (Dislocation–dislocation interaction)0.81 (S = S′)
0.60 (S ≠ S′)
Table 4. Rolling test parameters for the VPSC model.
Thickness Reduction (ND)
Simulation Processes Parameters20%30%
| ε | = ln ( 1 %   R e d 100 ) ≈0.2≈0.36
p ( θ = 7 ° ) ±0.6±0.35
p ( θ = 12 ° ) ±1.05±0.6
Table 5. Normal and planar anisotropy coefficients for four-pass rolling sequences with a 20% reduction per pass.
Hardening Models
Voce-TypeDDR
TestPass No. R ¯ | Δ R | R ¯ | Δ R |
Initial00.65250.1650.65250.165
CR10.67750.1350.74750.175
20.75750.0350.8150.07
30.86250.0750.91750.045
40.9950.171.03250.155
ASR-C (SH1)10.67750.1150.73250.145
20.760.020.81250.005
30.88750.2050.9250.19
41.03750.4051.0750.39
ASR-R (SH1)20.7050.090.75750.115
30.7950.030.83750.005
40.89750.0650.93250.055
ASR-C (SH2)10.66750.0550.71250.065
20.7650.250.8050.23
30.930.640.96250.615
41.15251.0551.181.06
ASR-R (SH2)20.58750.1550.61750.135
30.5650.070.590.06
40.4450.050.4650.07
Table 6. Normal and planar anisotropy coefficients for two-pass rolling sequences with a 20% reduction per pass.
Hardening Models
Voce-TypeDDR
TestPass No. R ¯ | Δ R | R ¯ | Δ R |
Initial00.65250.1650.65250.165
CR10.73250.0650.80.1
20.94250.1350.9850.11
ASR-C (SH1)10.74250.0650.80.1
20.94750.1250.99250.115
ASR-R (SH1)20.9250.090.96750.065
ASR-C (SH2)10.73750.0150.790.04
20.97750.3251.0150.31
ASR-R (SH2)20.9050.090.92750.065
Table 7. Ideal texture components for FCC metals.
Euler Angles (Bunge) (°)
Component Nameφ1Φφ2{hkl}<uvw>
DeformationBrass (Br)35450{011}<211>
S553565{123}<634>
Copper (Cu)903045{112}<111>
Dillamore (D)902745{4411}<11118>
ShearRotated Cube (RC)0045{001}<110>
E05545{111}<112>
F905545{111}<110>
I03545{112}<110>
RecrystallizationGoss0450{011}<001>
Cube000{001}<100>
Rotated Cube RD1 (RCRD1)0200{013}<100>
Rotated Cube RD2 (RCRD2)0350{023}<100>
Rotated Cube ND1 (RCND1)2000{001}<310>
Rotated Cube ND2 (RCND2)3500{001}<320>
P70450{011}<122>
Q55200{013}<231>
R557525{124}<211>
Publisher’s Note: MDPI stays neutral with regard to jurisdictional claims in published maps and institutional affiliations.