
Numerical Study on Asymmetrical Rolled Aluminum Alloy Sheets Using the Visco-Plastic Self-Consistent (VPSC) Method


Abstract
:1. Introduction
2. Materials and Methods
- The initial crystallographic texture, where the orientations are represented by a set of Euler angles with the respective volume fractions (weights);
- The material model characterization, where the crystal symmetry, deformation modes, and material properties, such as elastic and thermal constants, are defined. The constitutive law with the respective coefficients and parameters is also specified in this file;
- The test procedure, where we prescribe the velocity gradient, the load test conditions, the increment size, and the number of increments.
2.1. Texture Orientations
2.2. Material Modeling
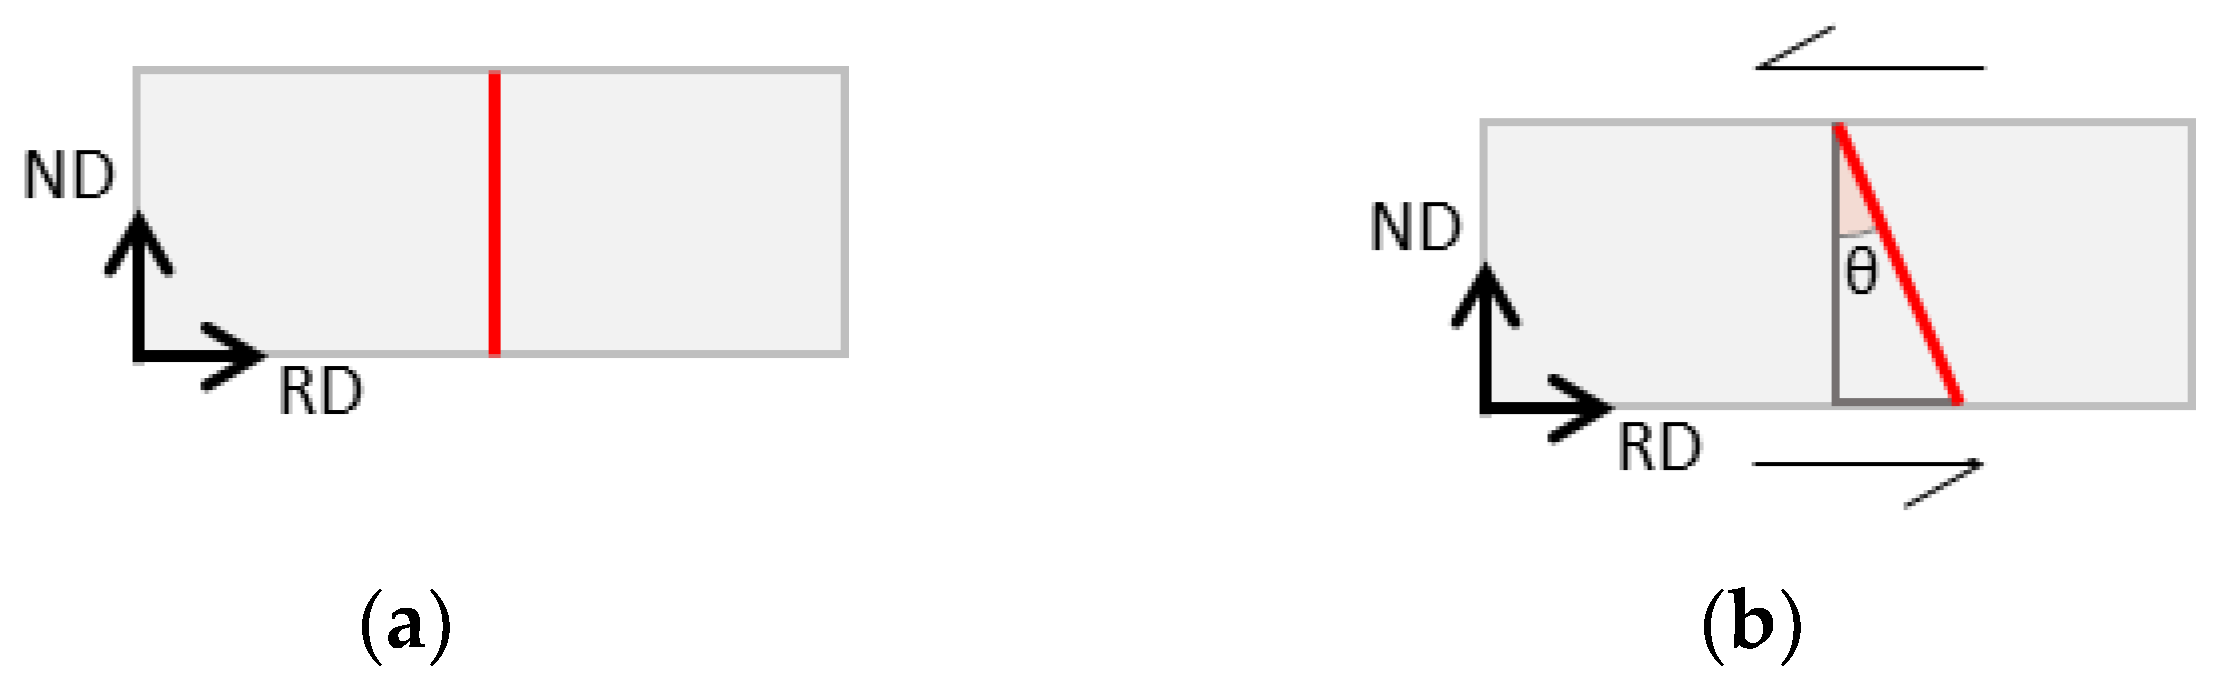
2.3. Simulation Boundary Conditions
3. Results and Discussion
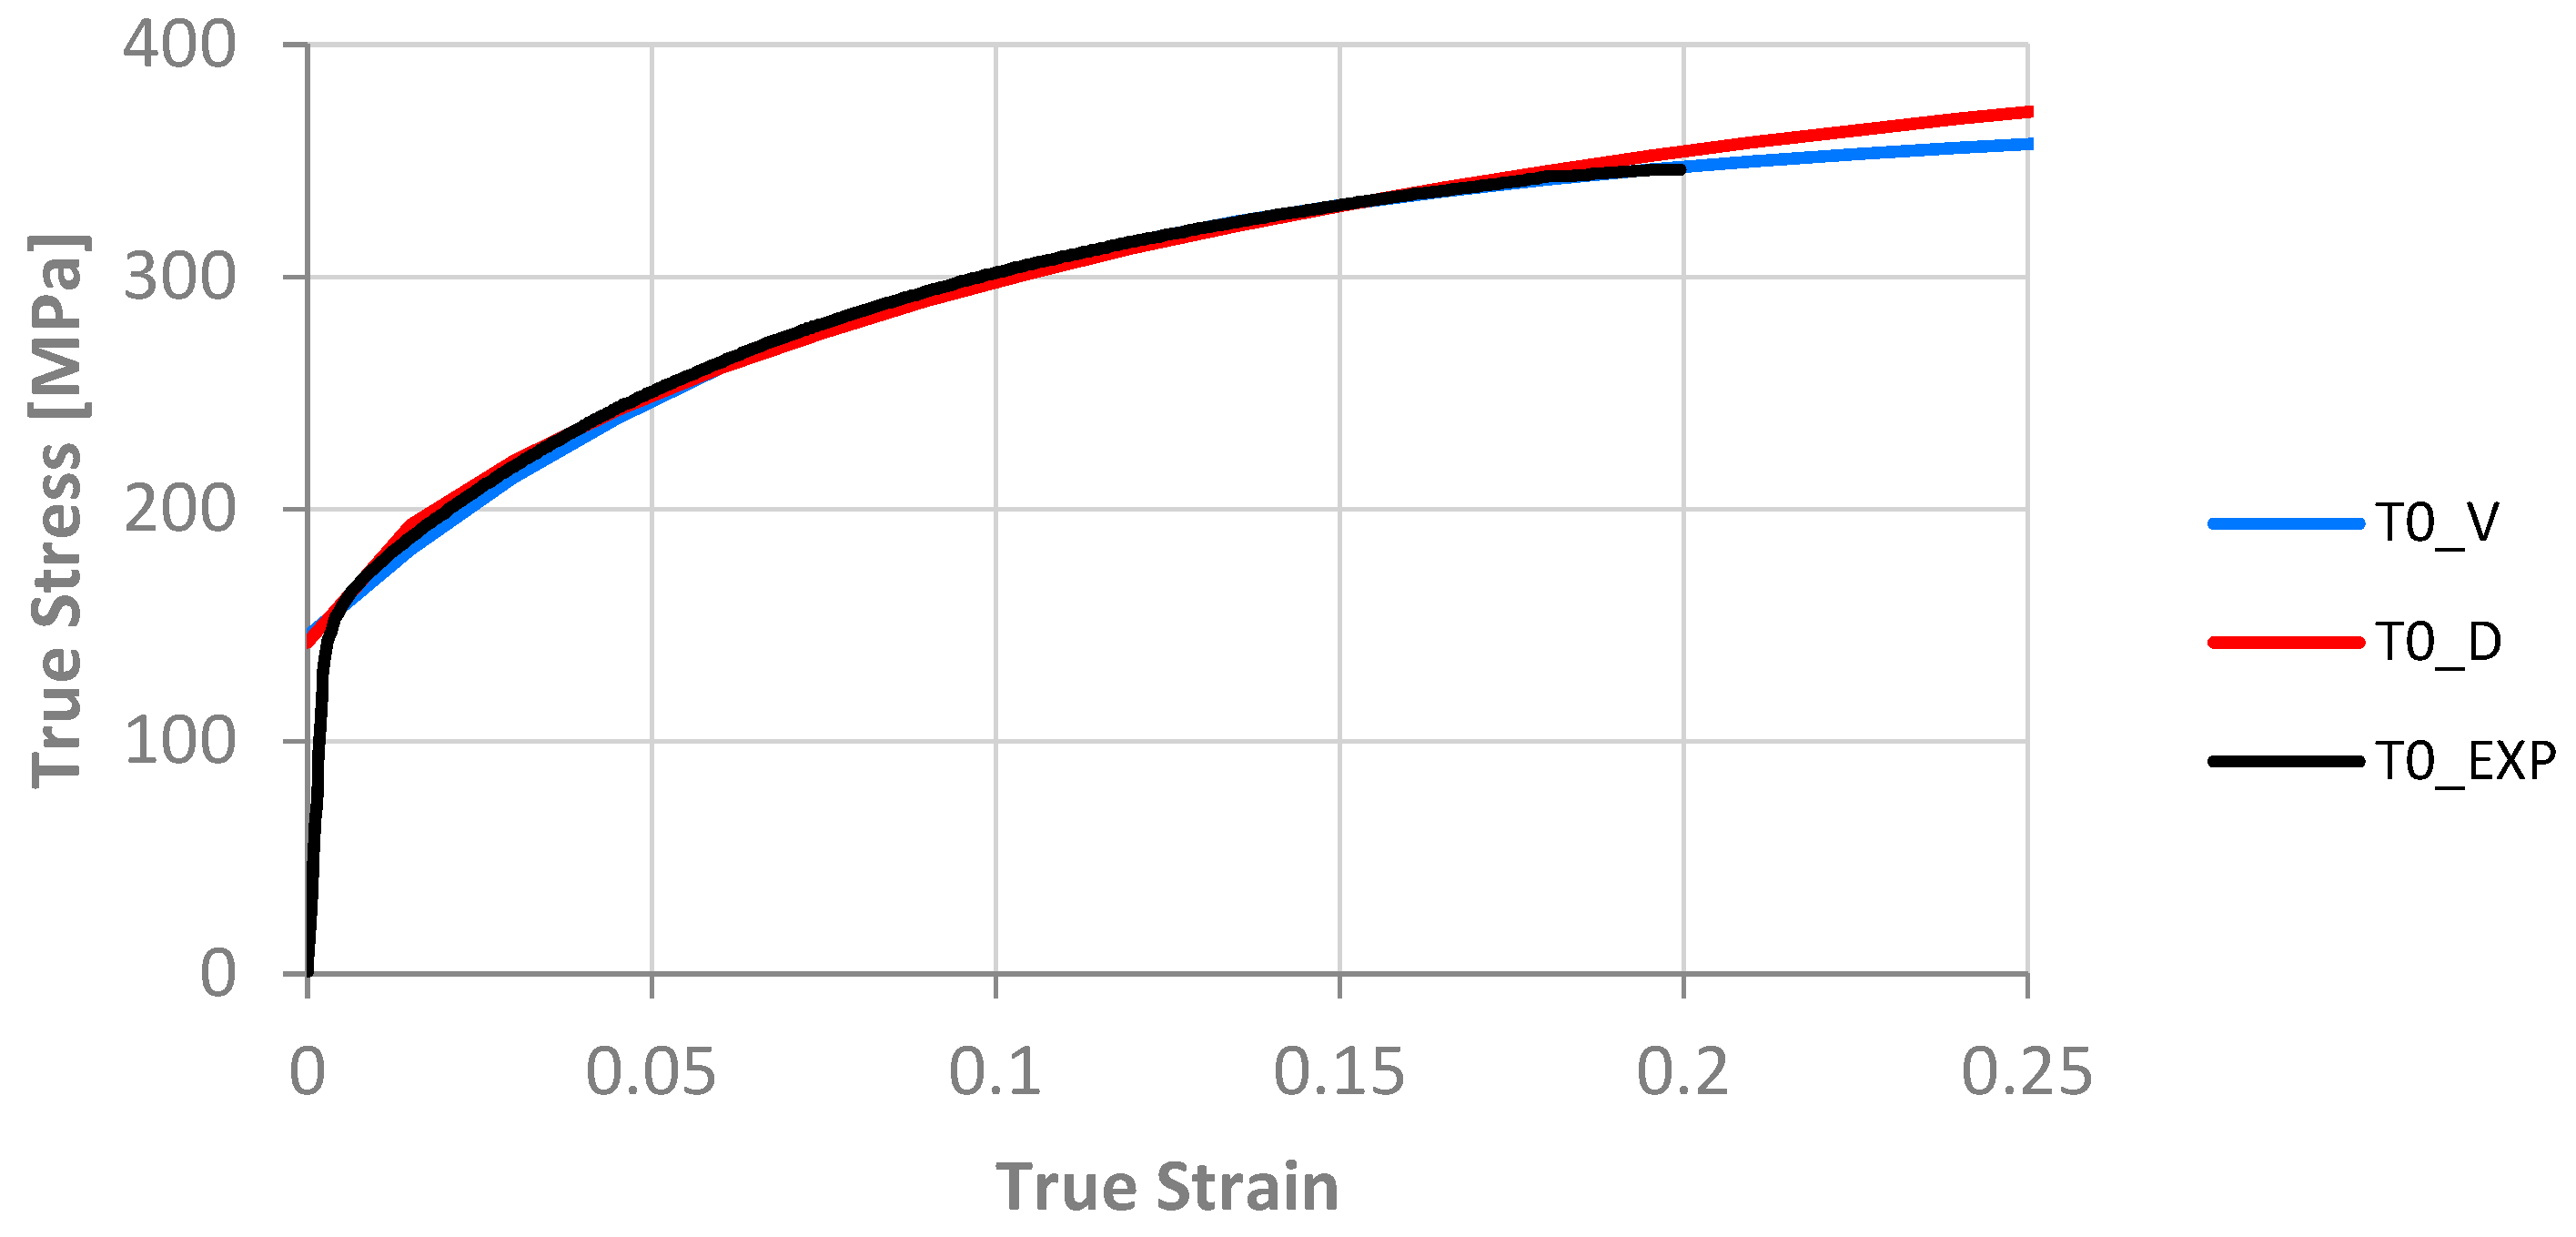
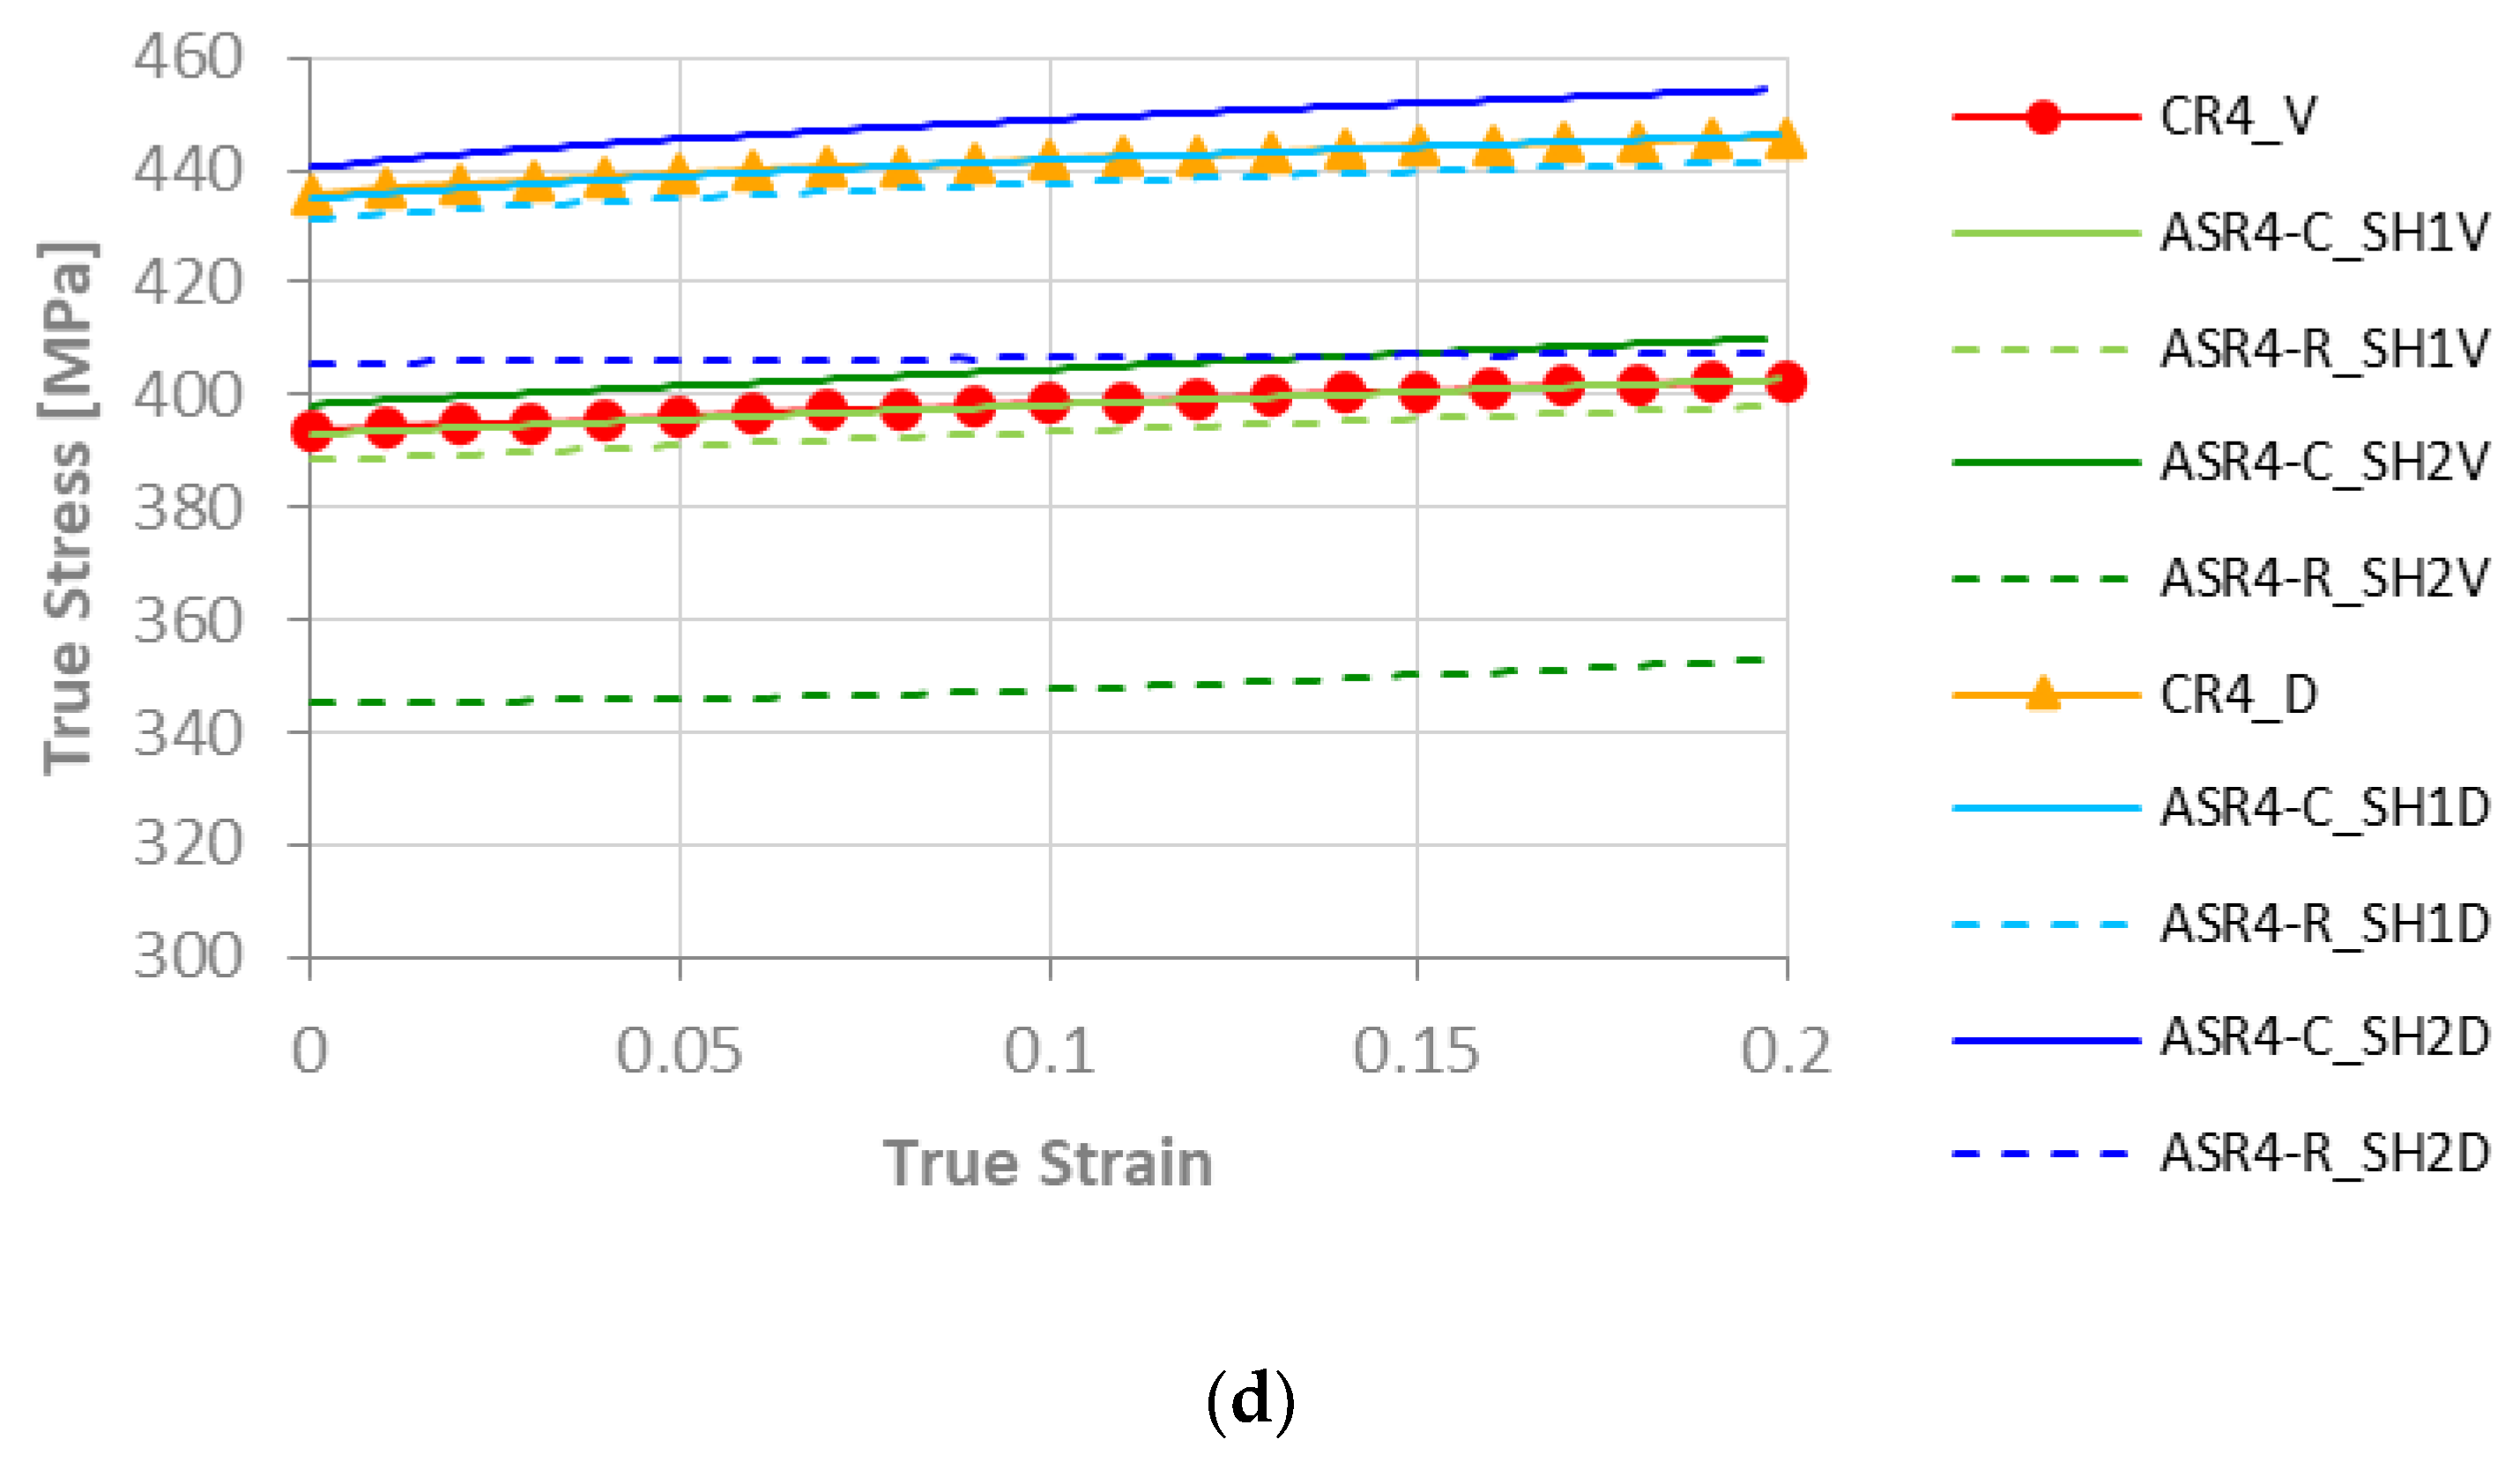
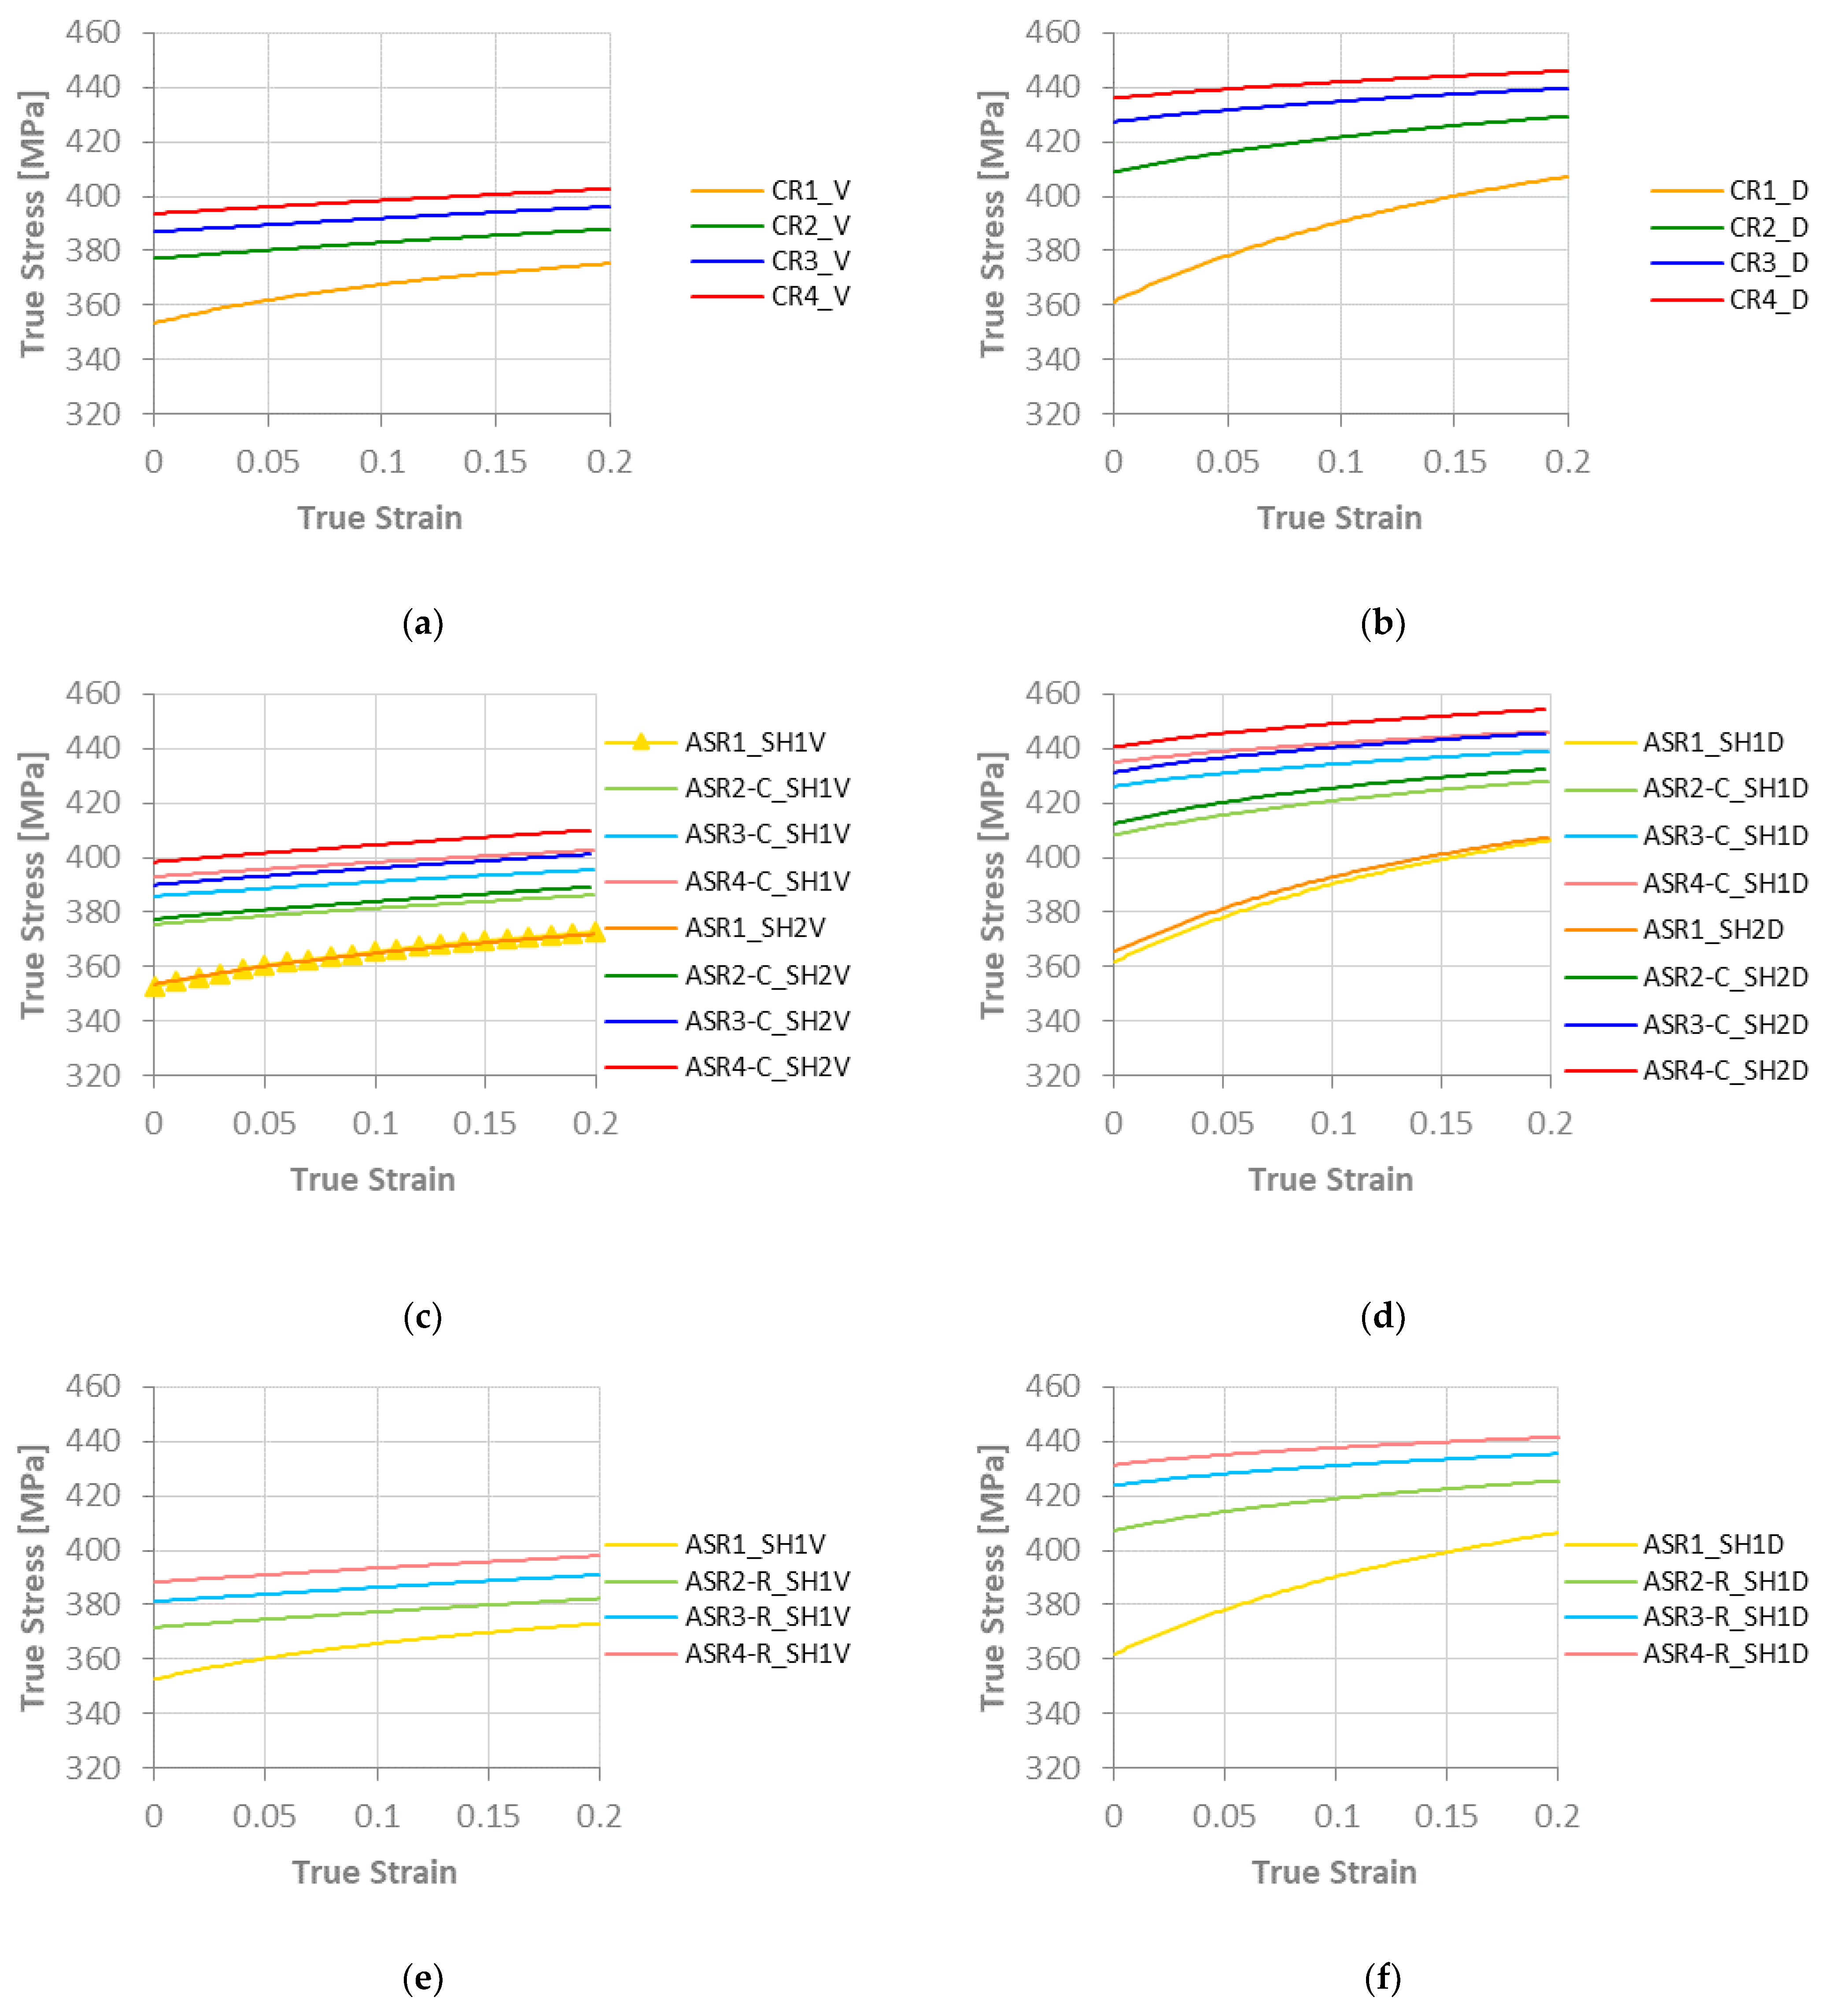
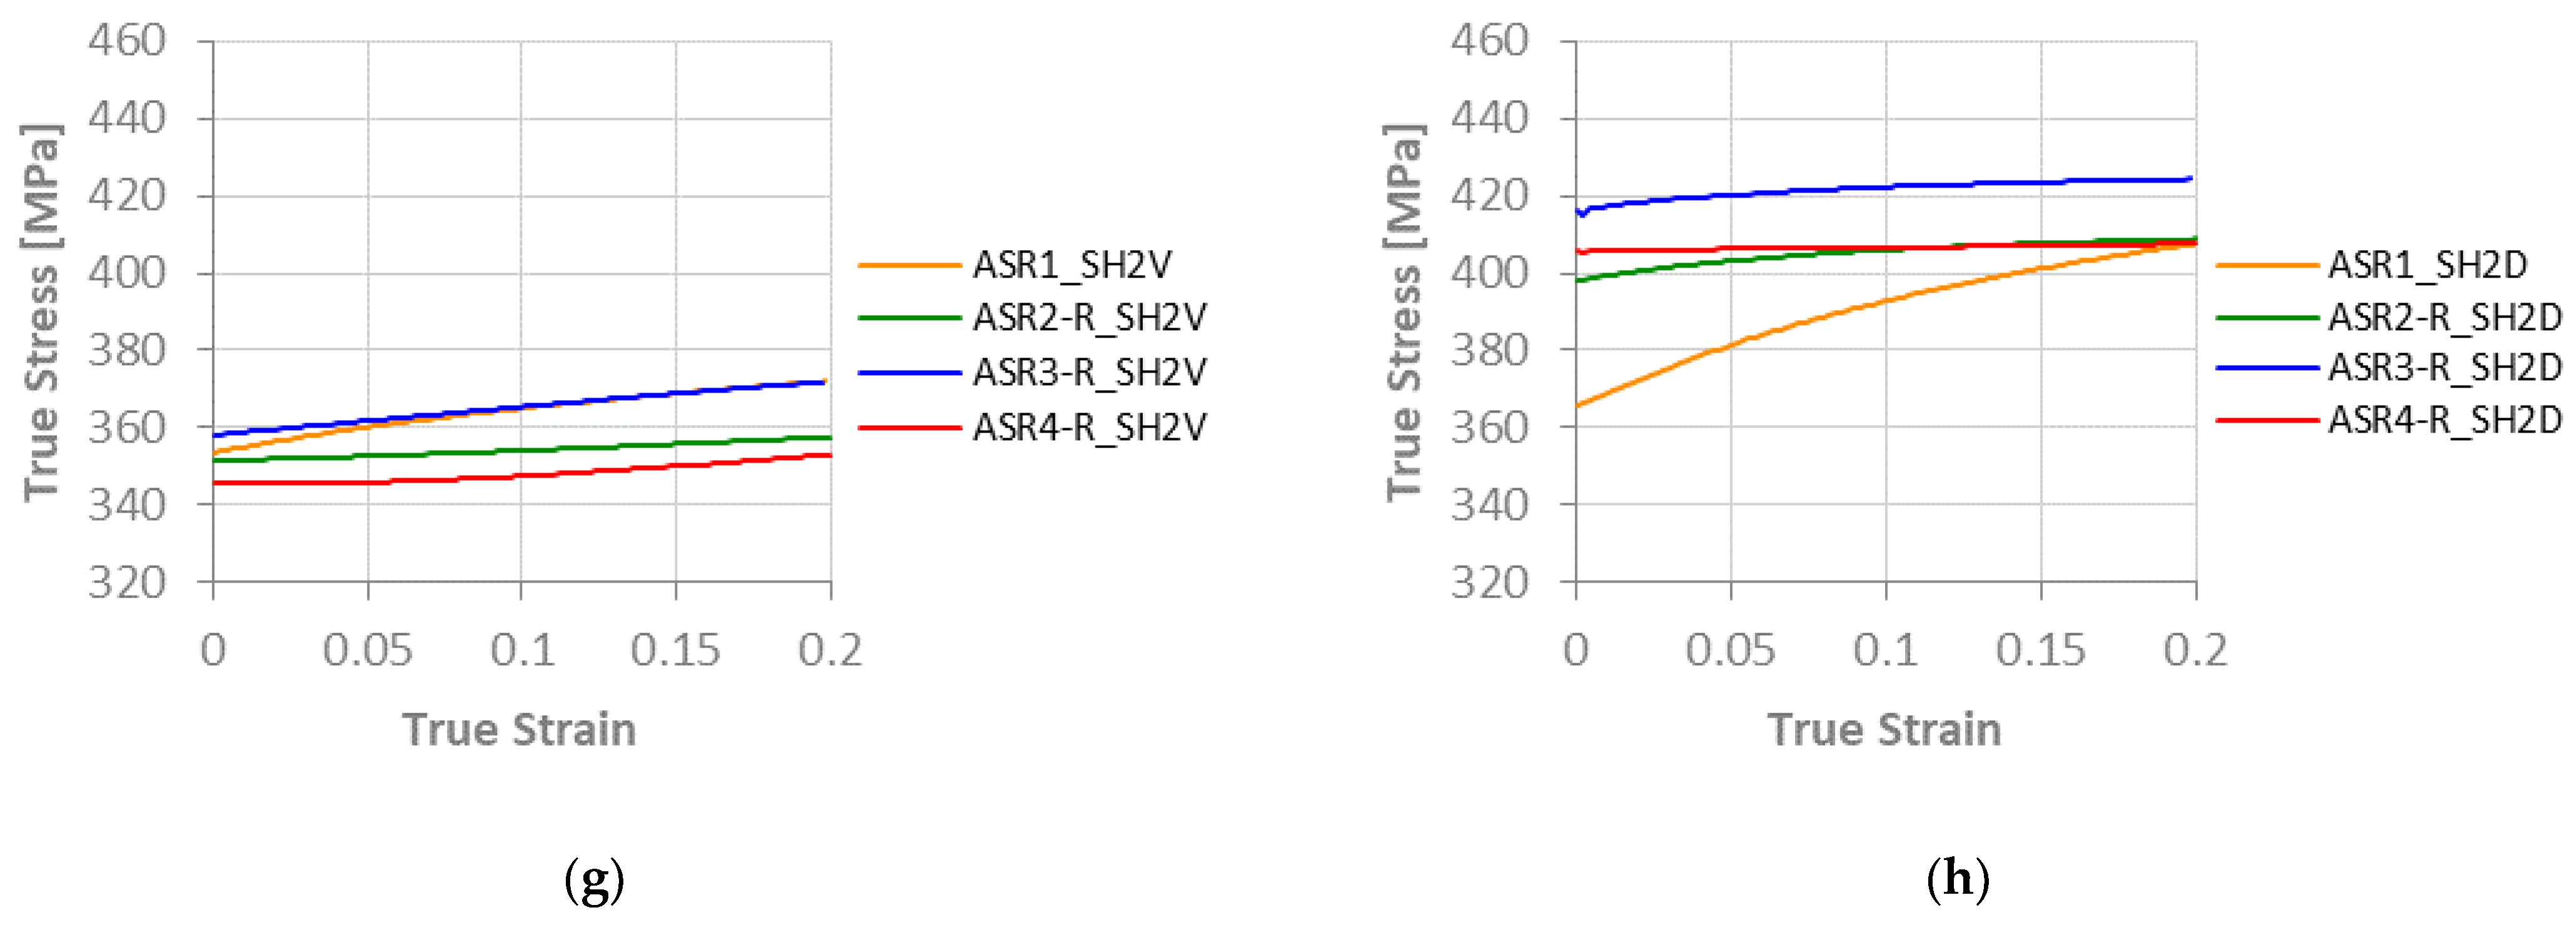
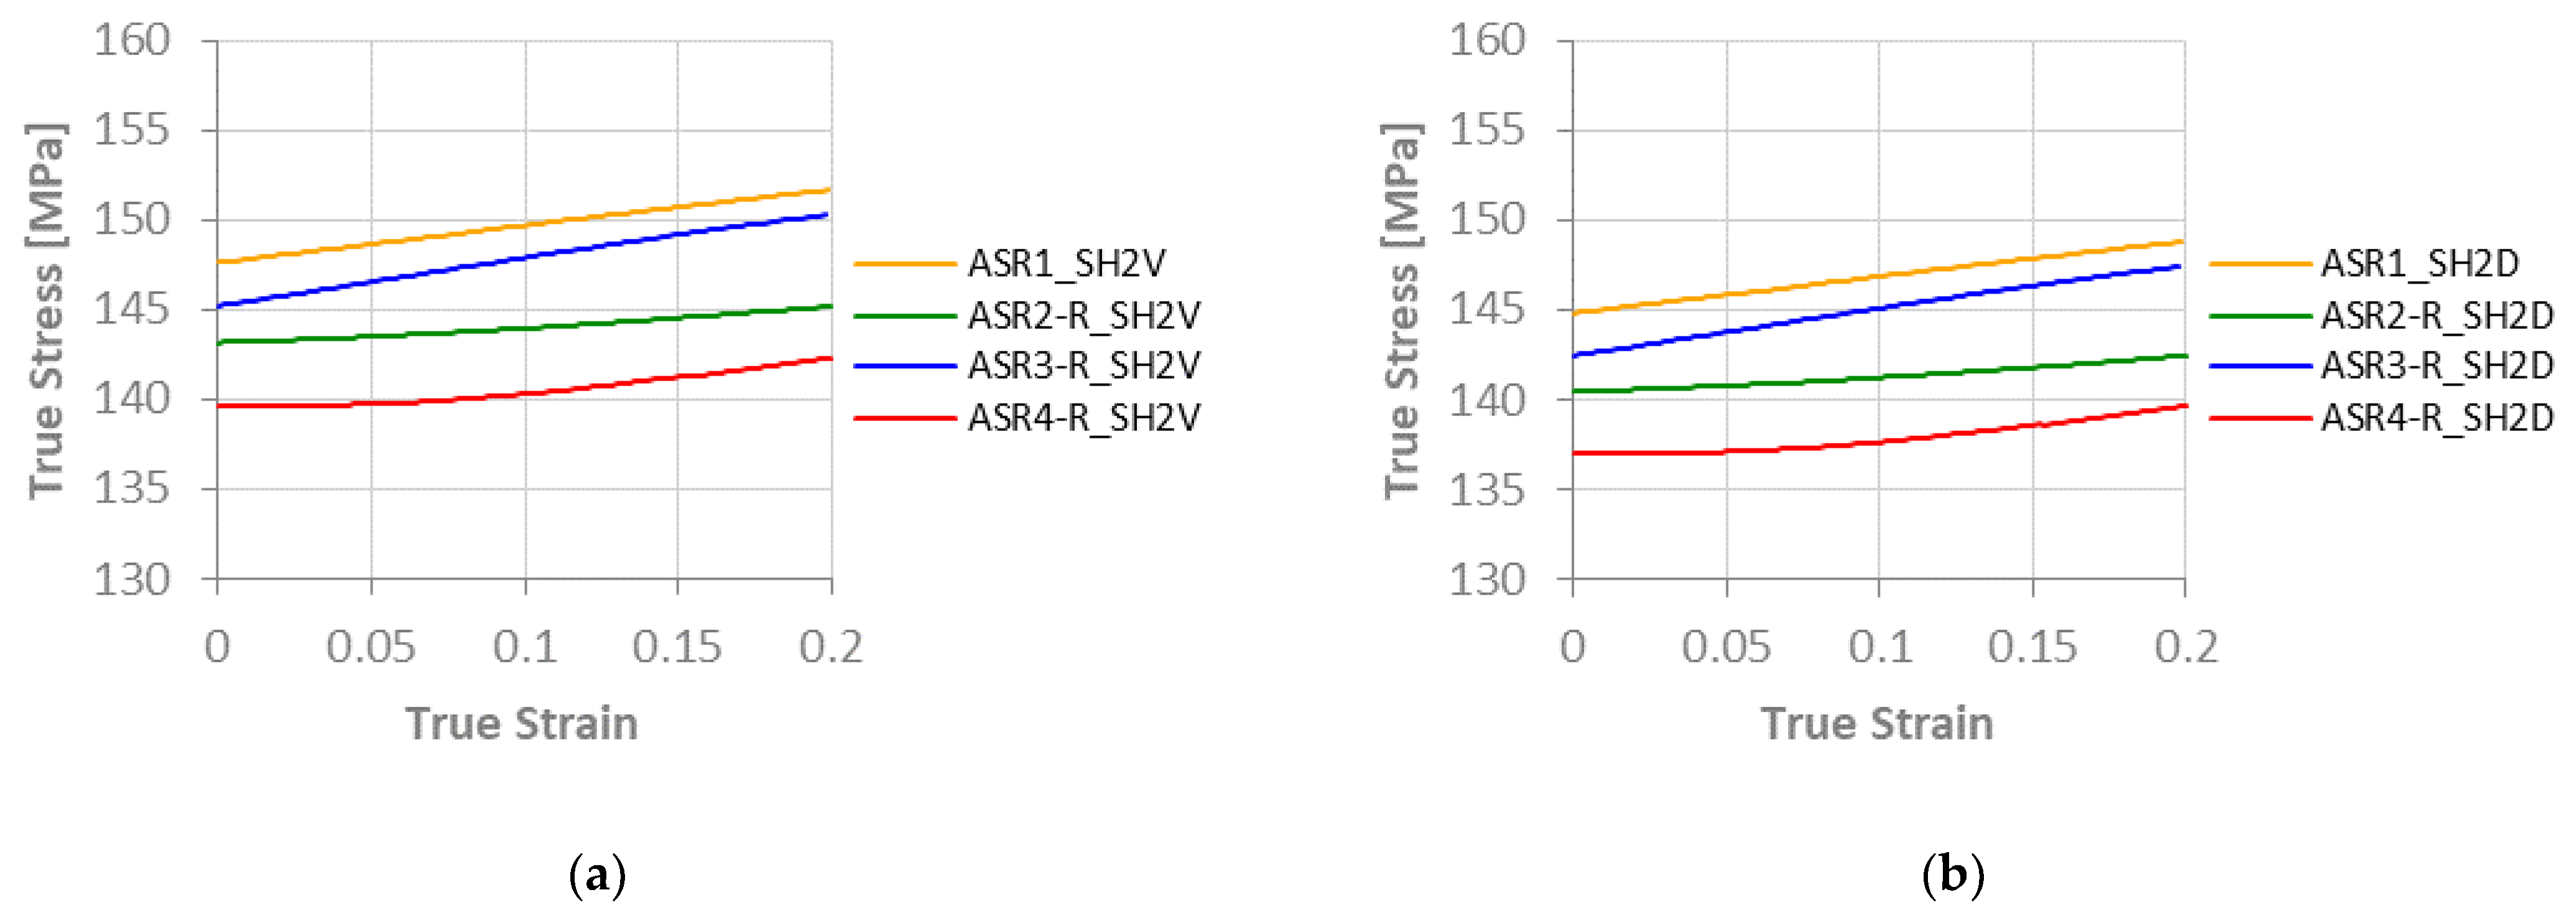
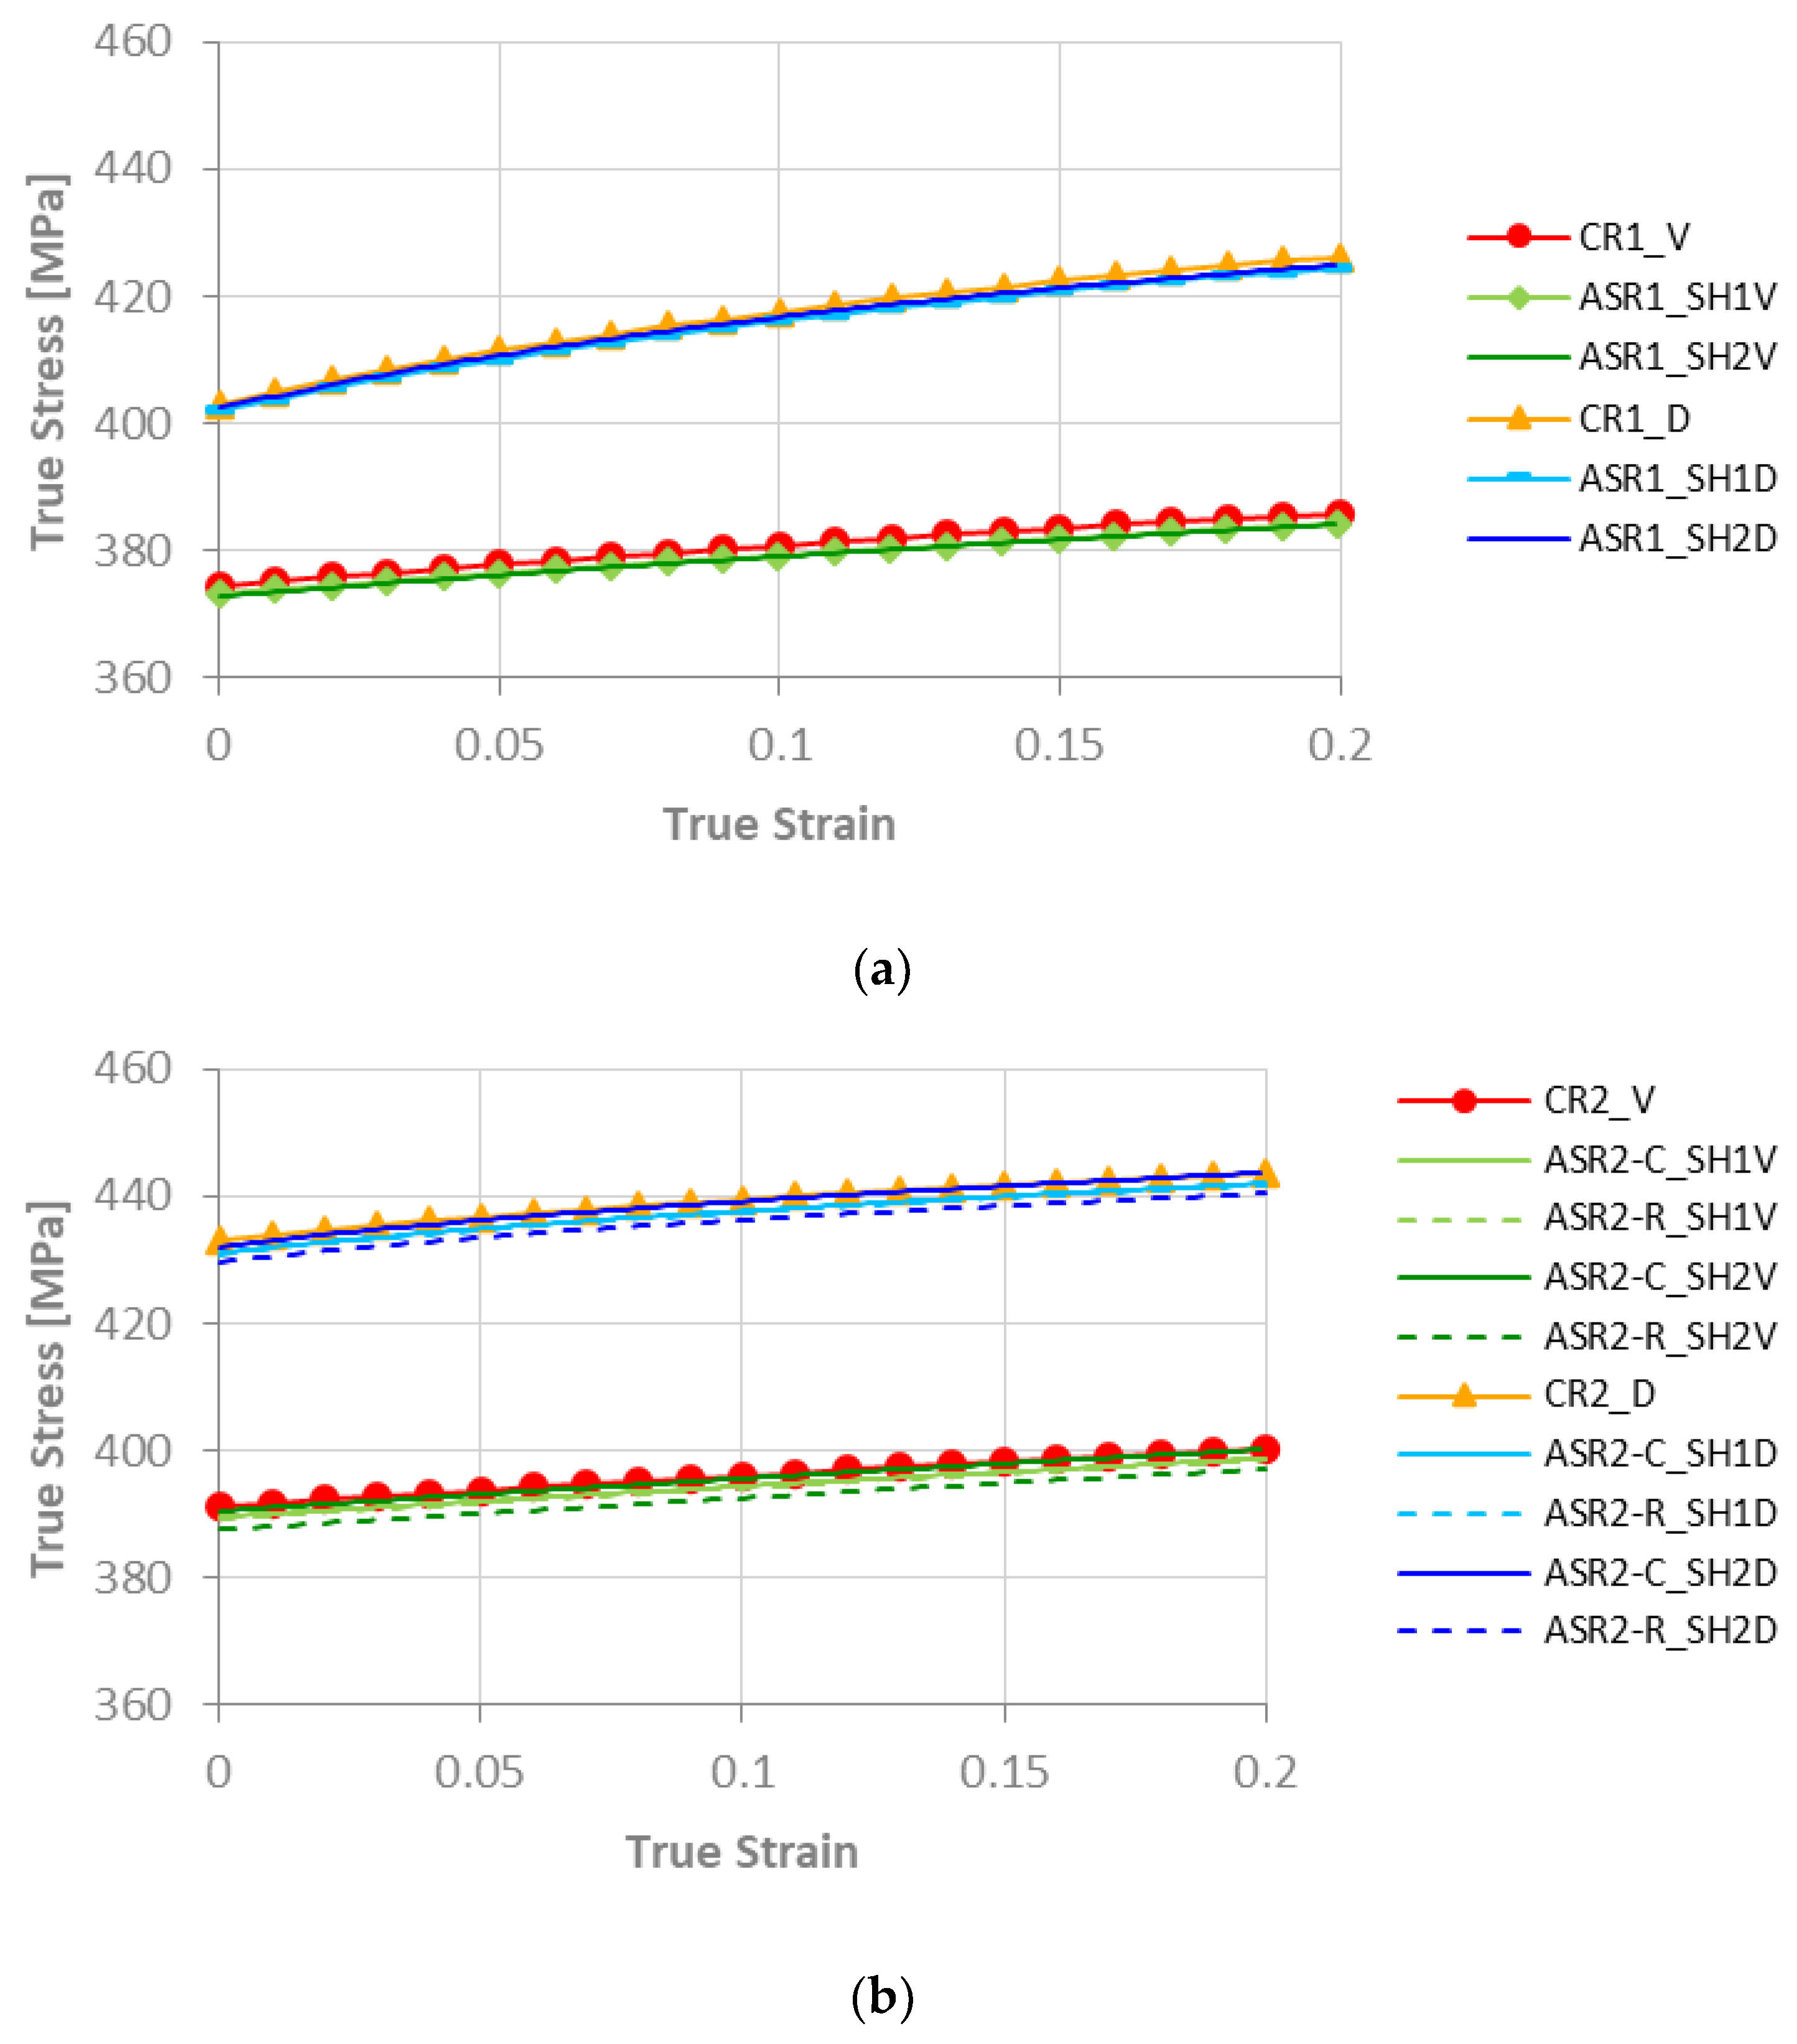
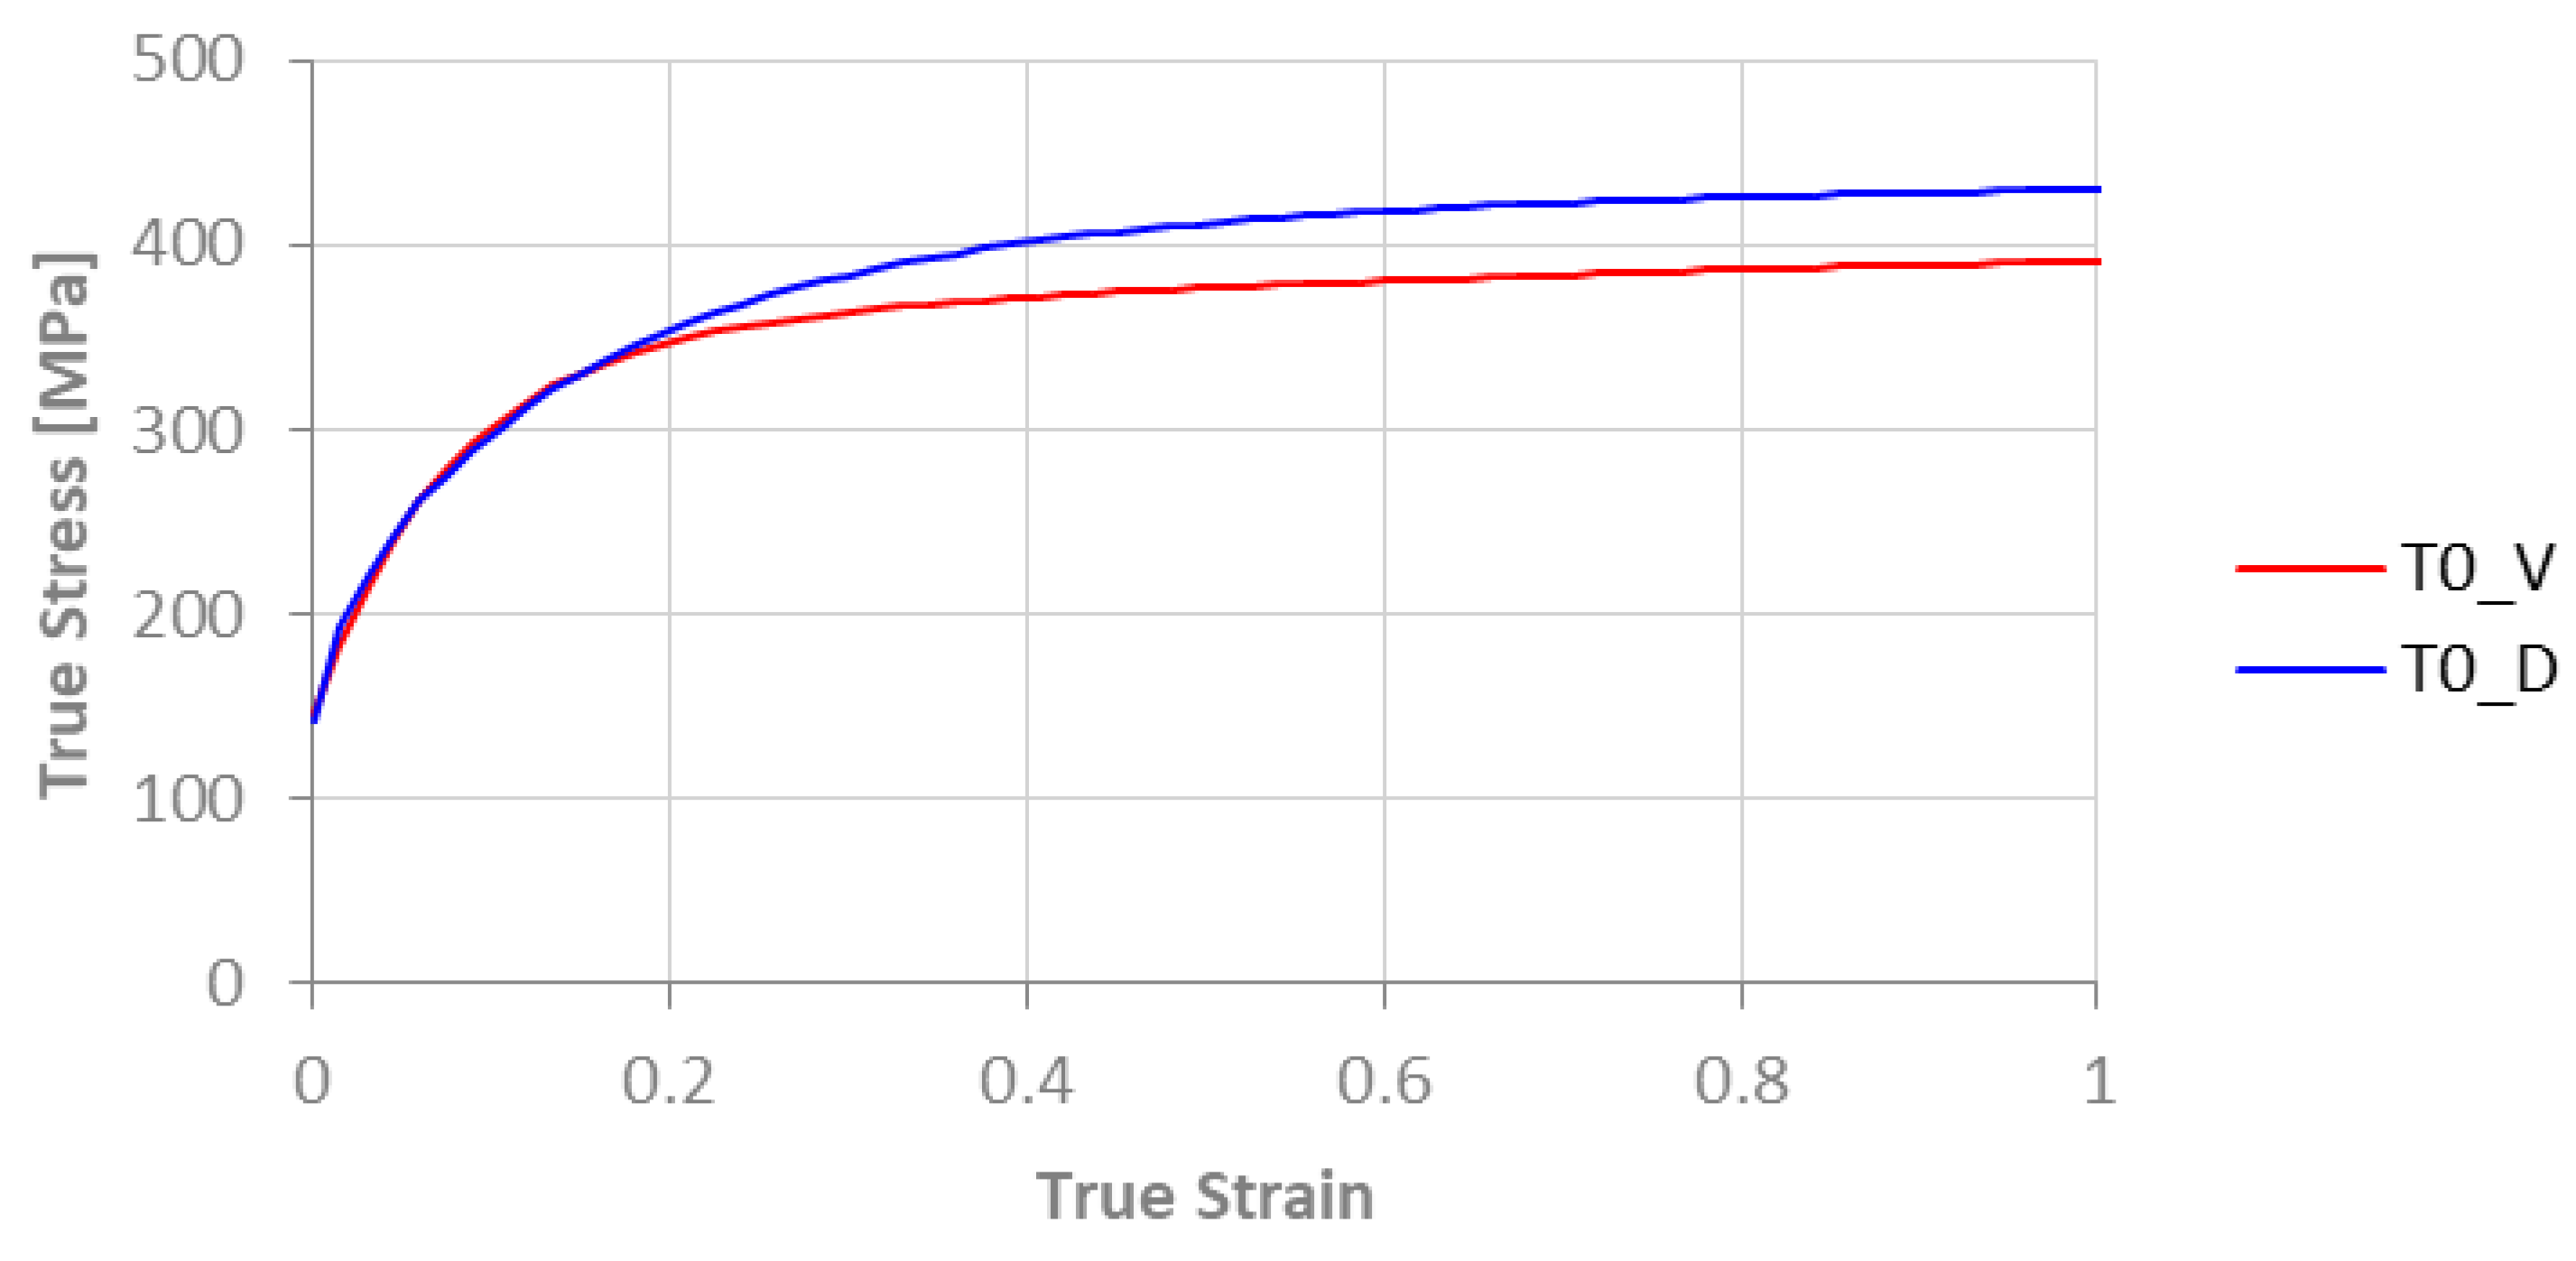
3.1. Stress-Strain Curves
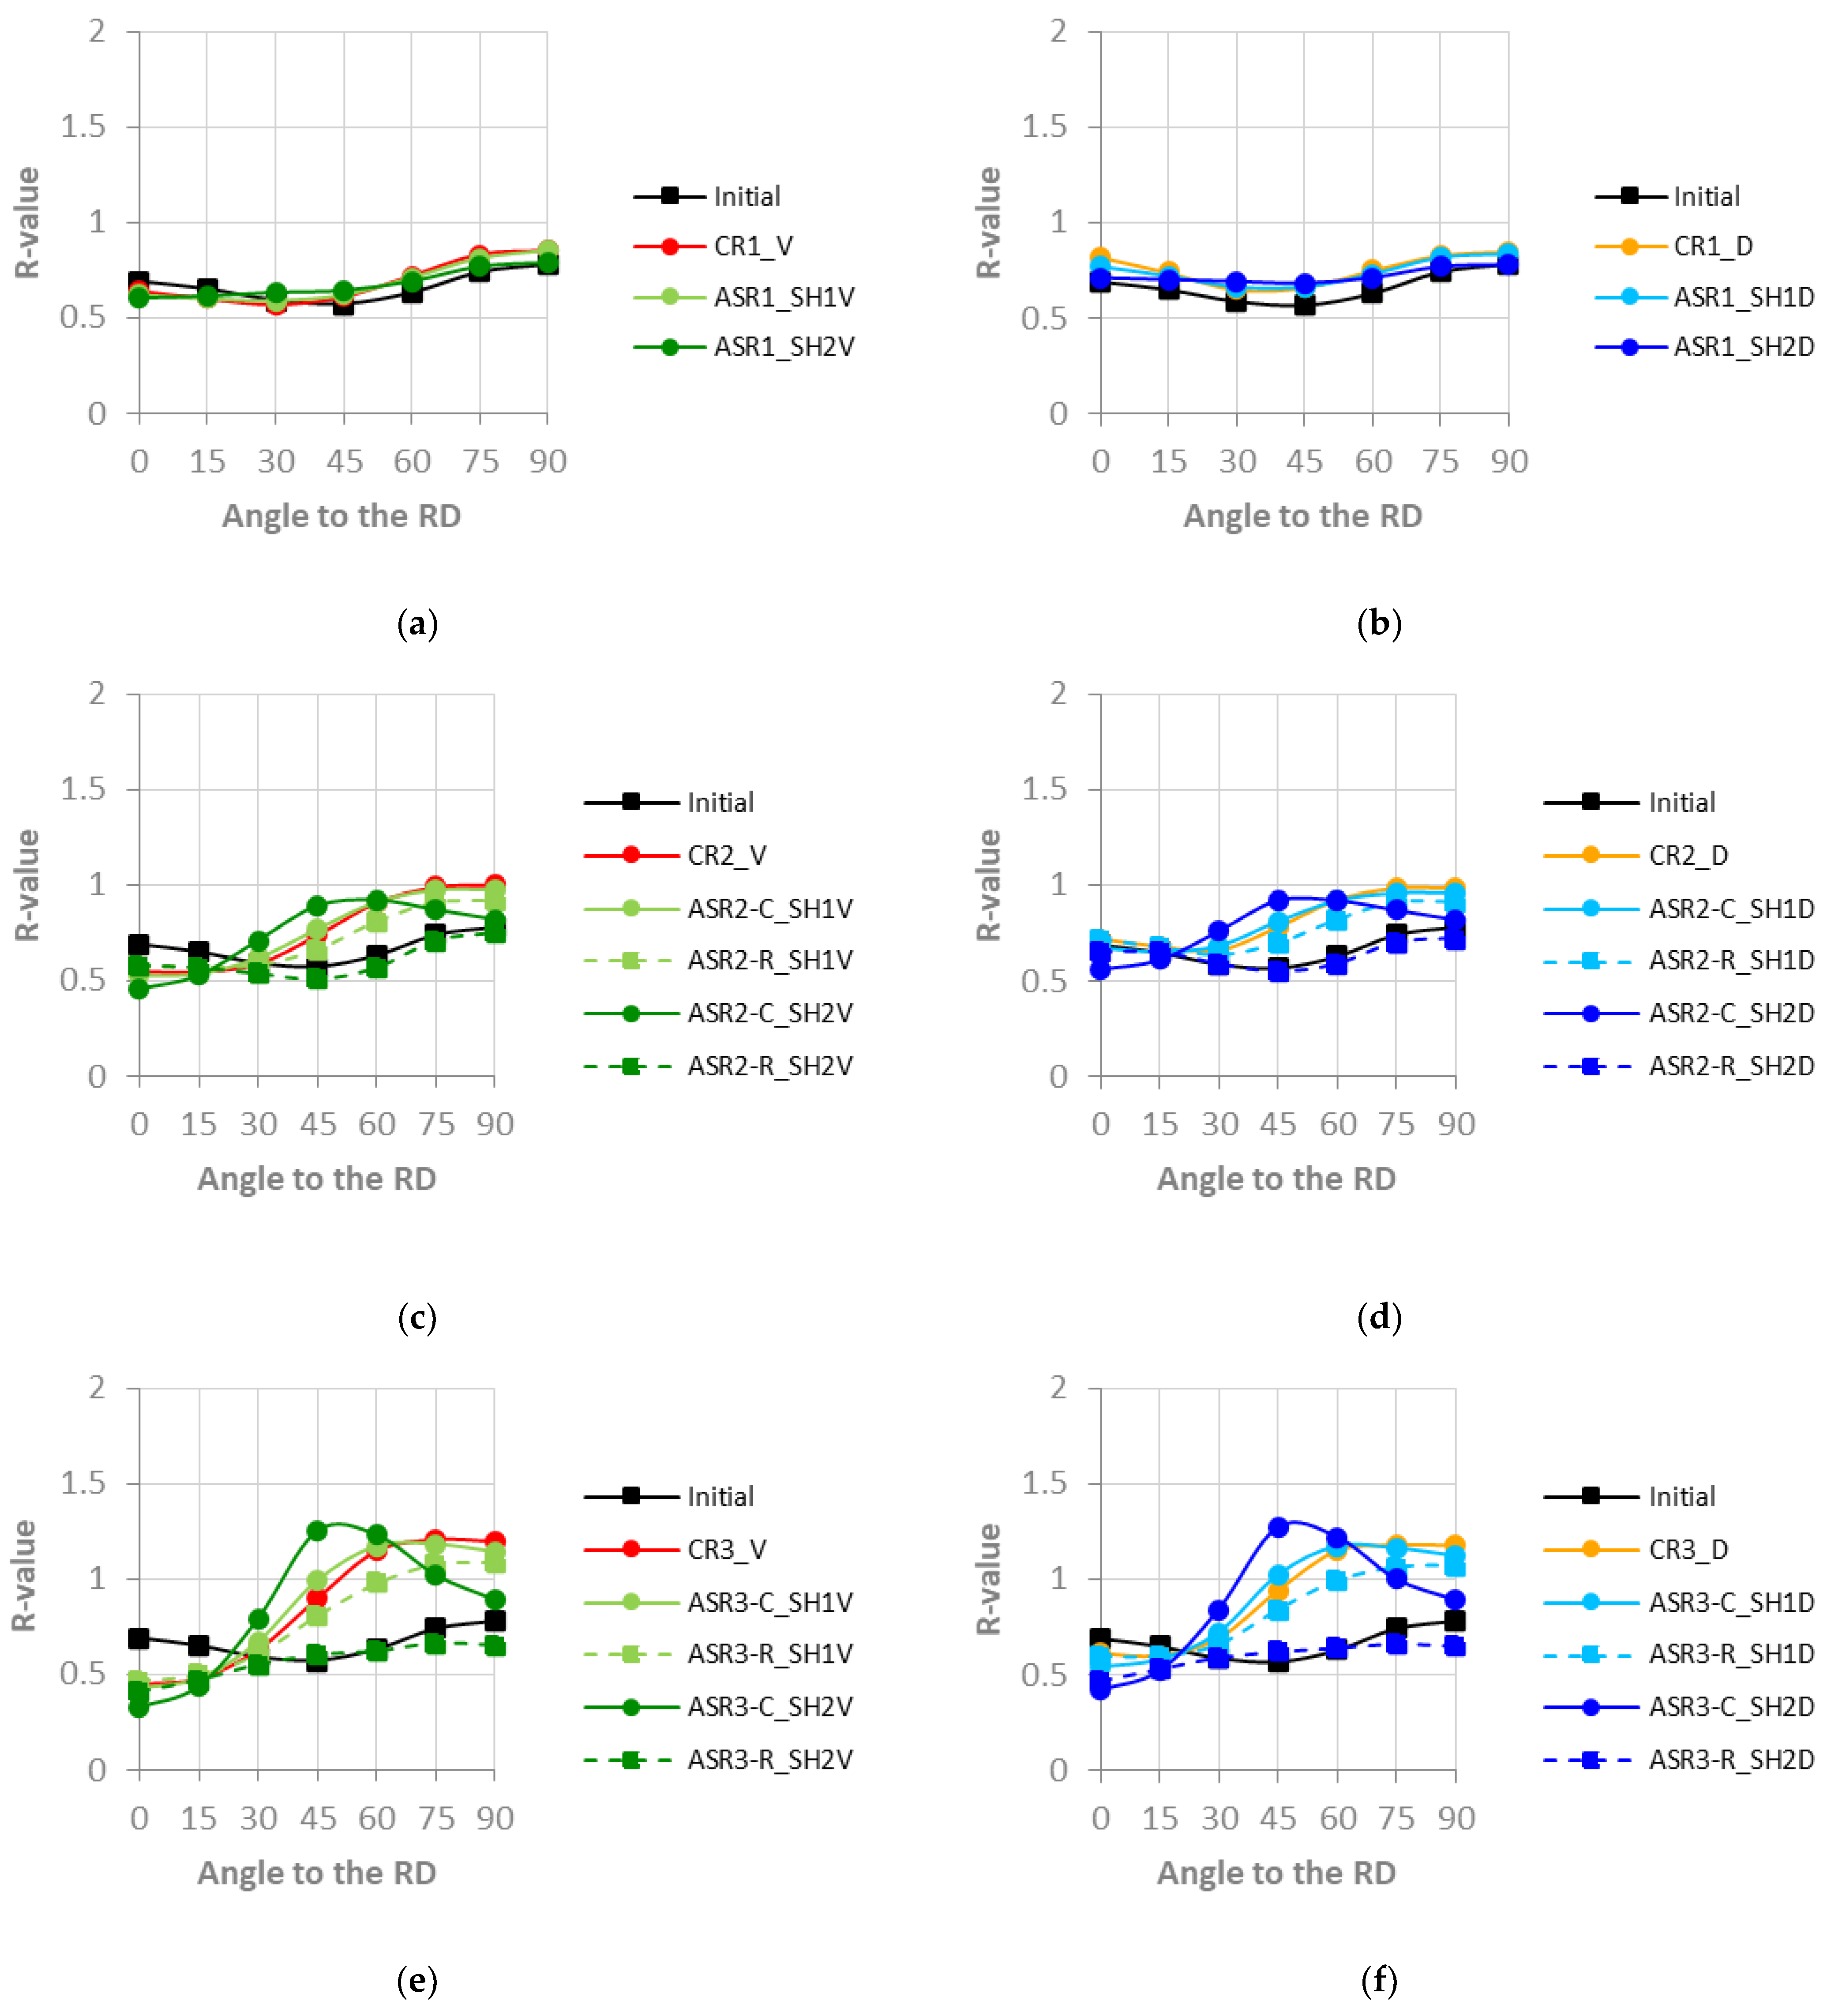
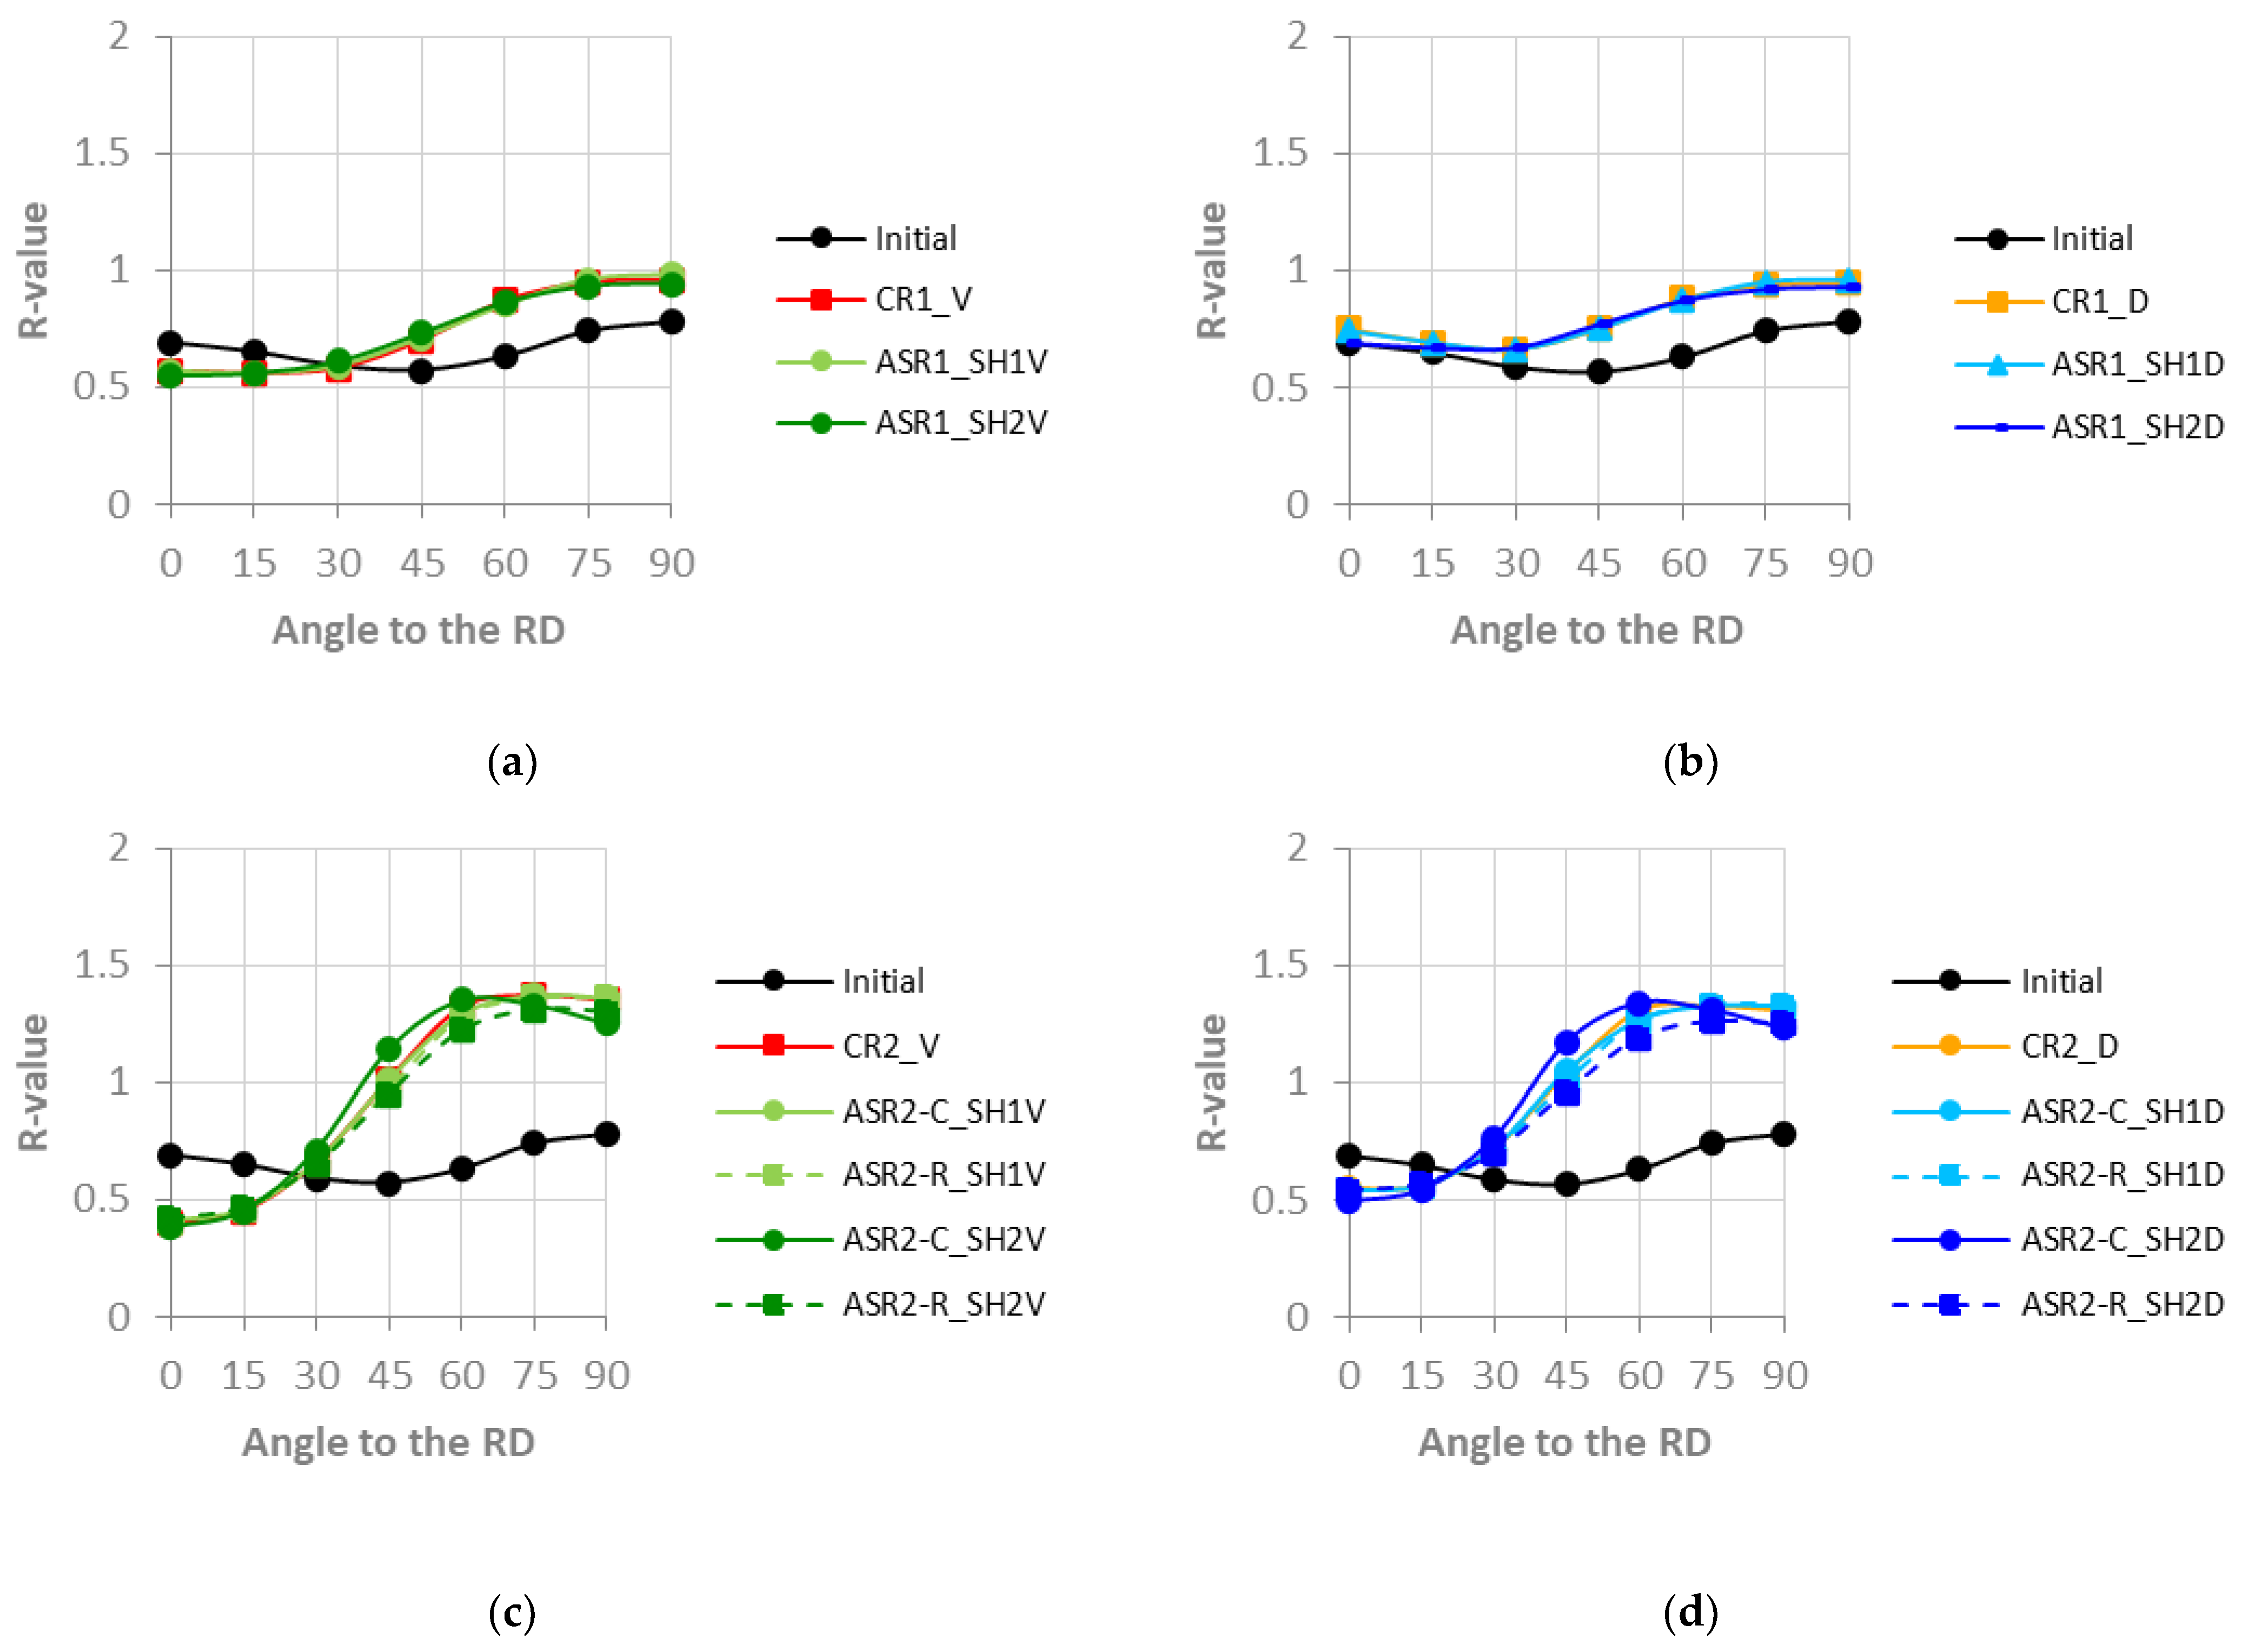
3.2. R-Values
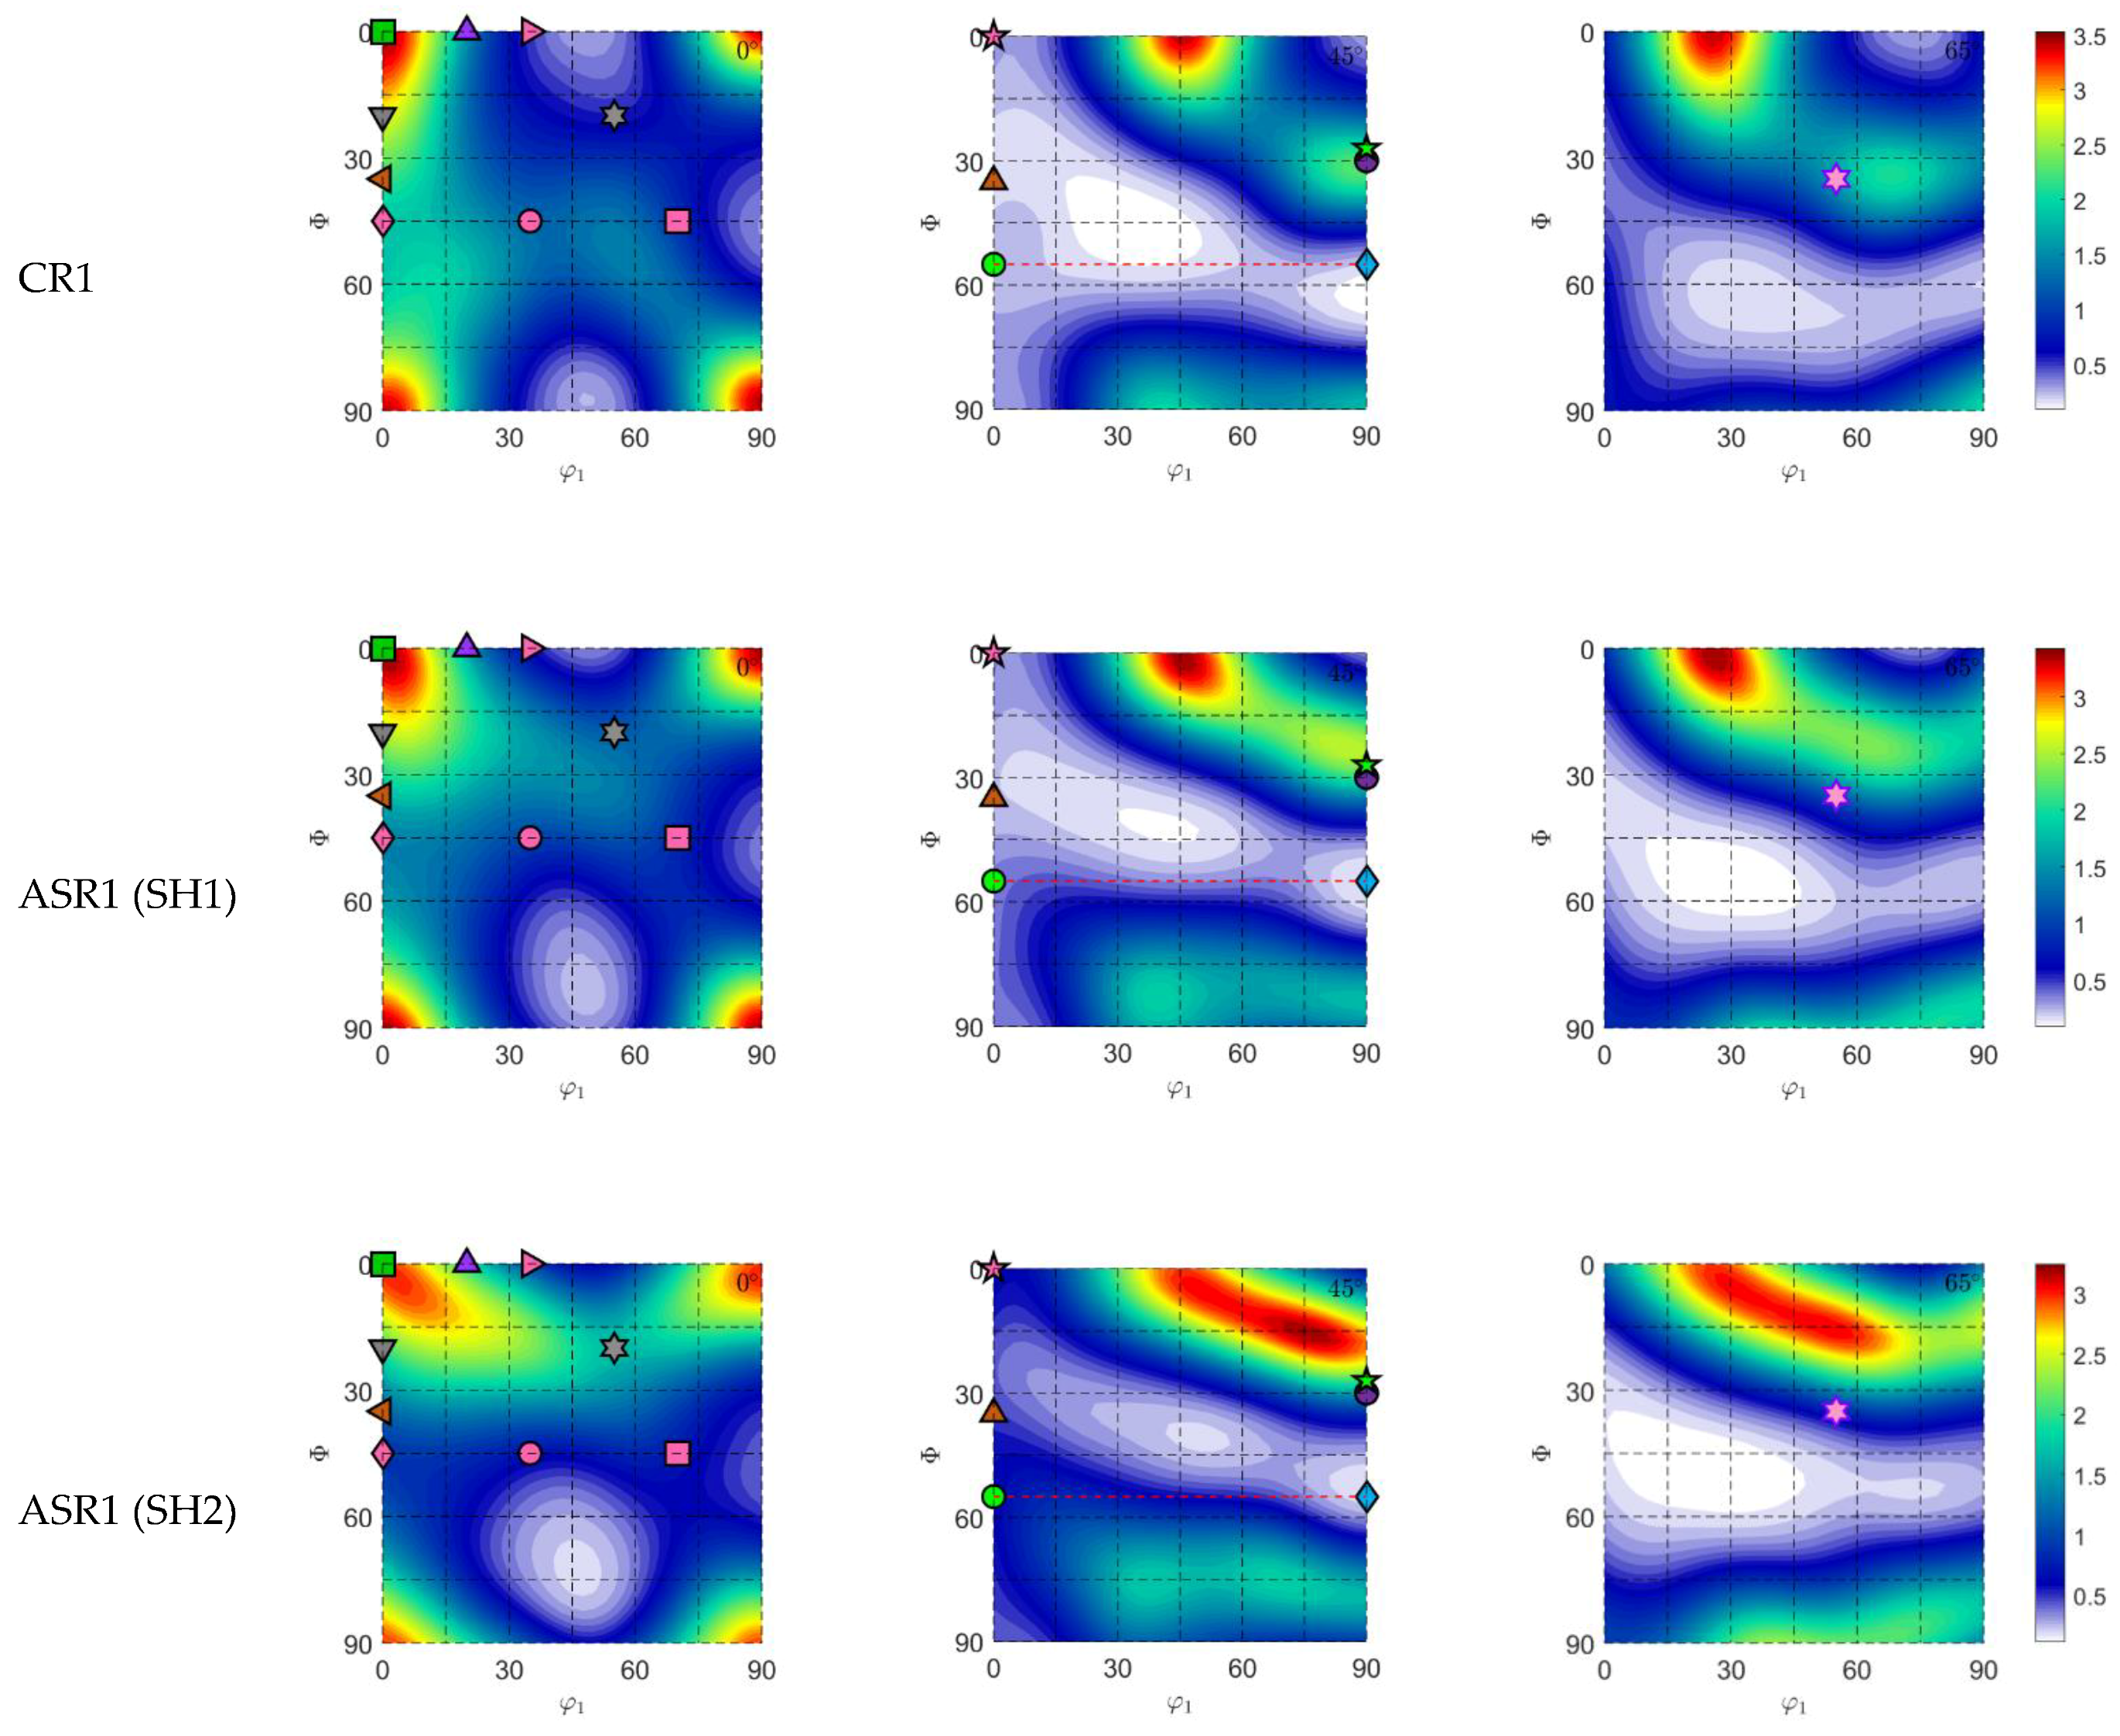
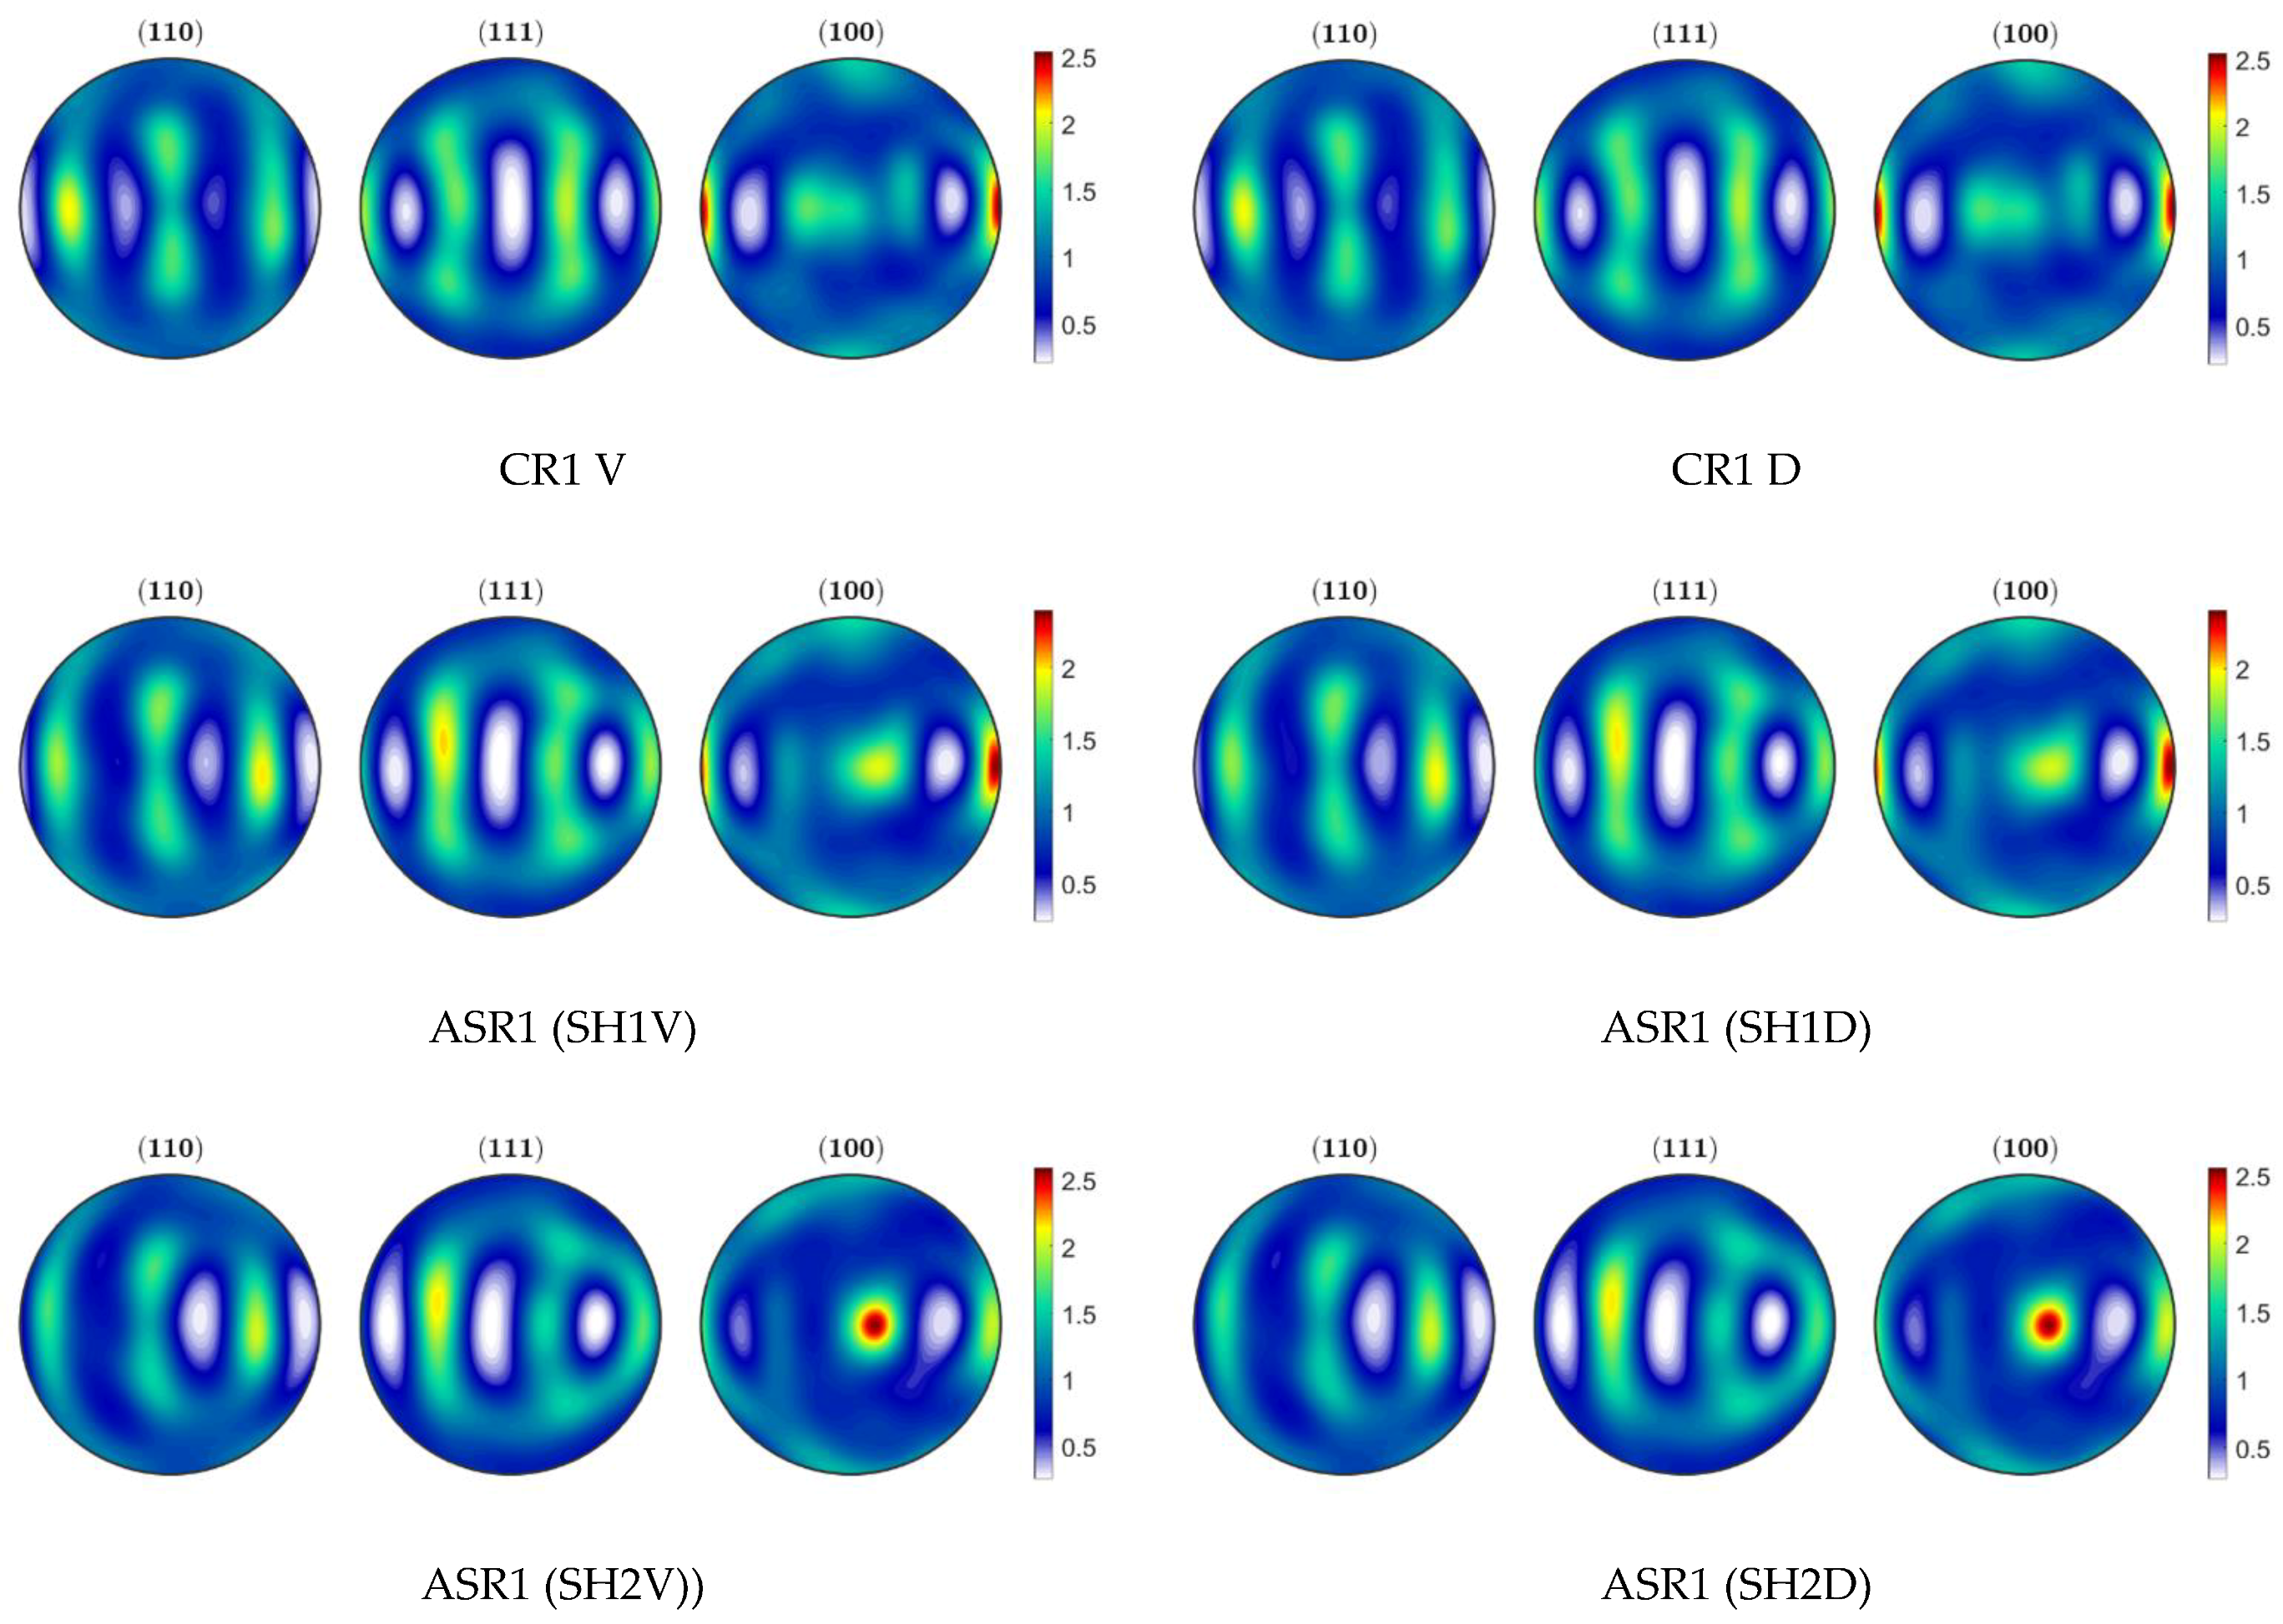
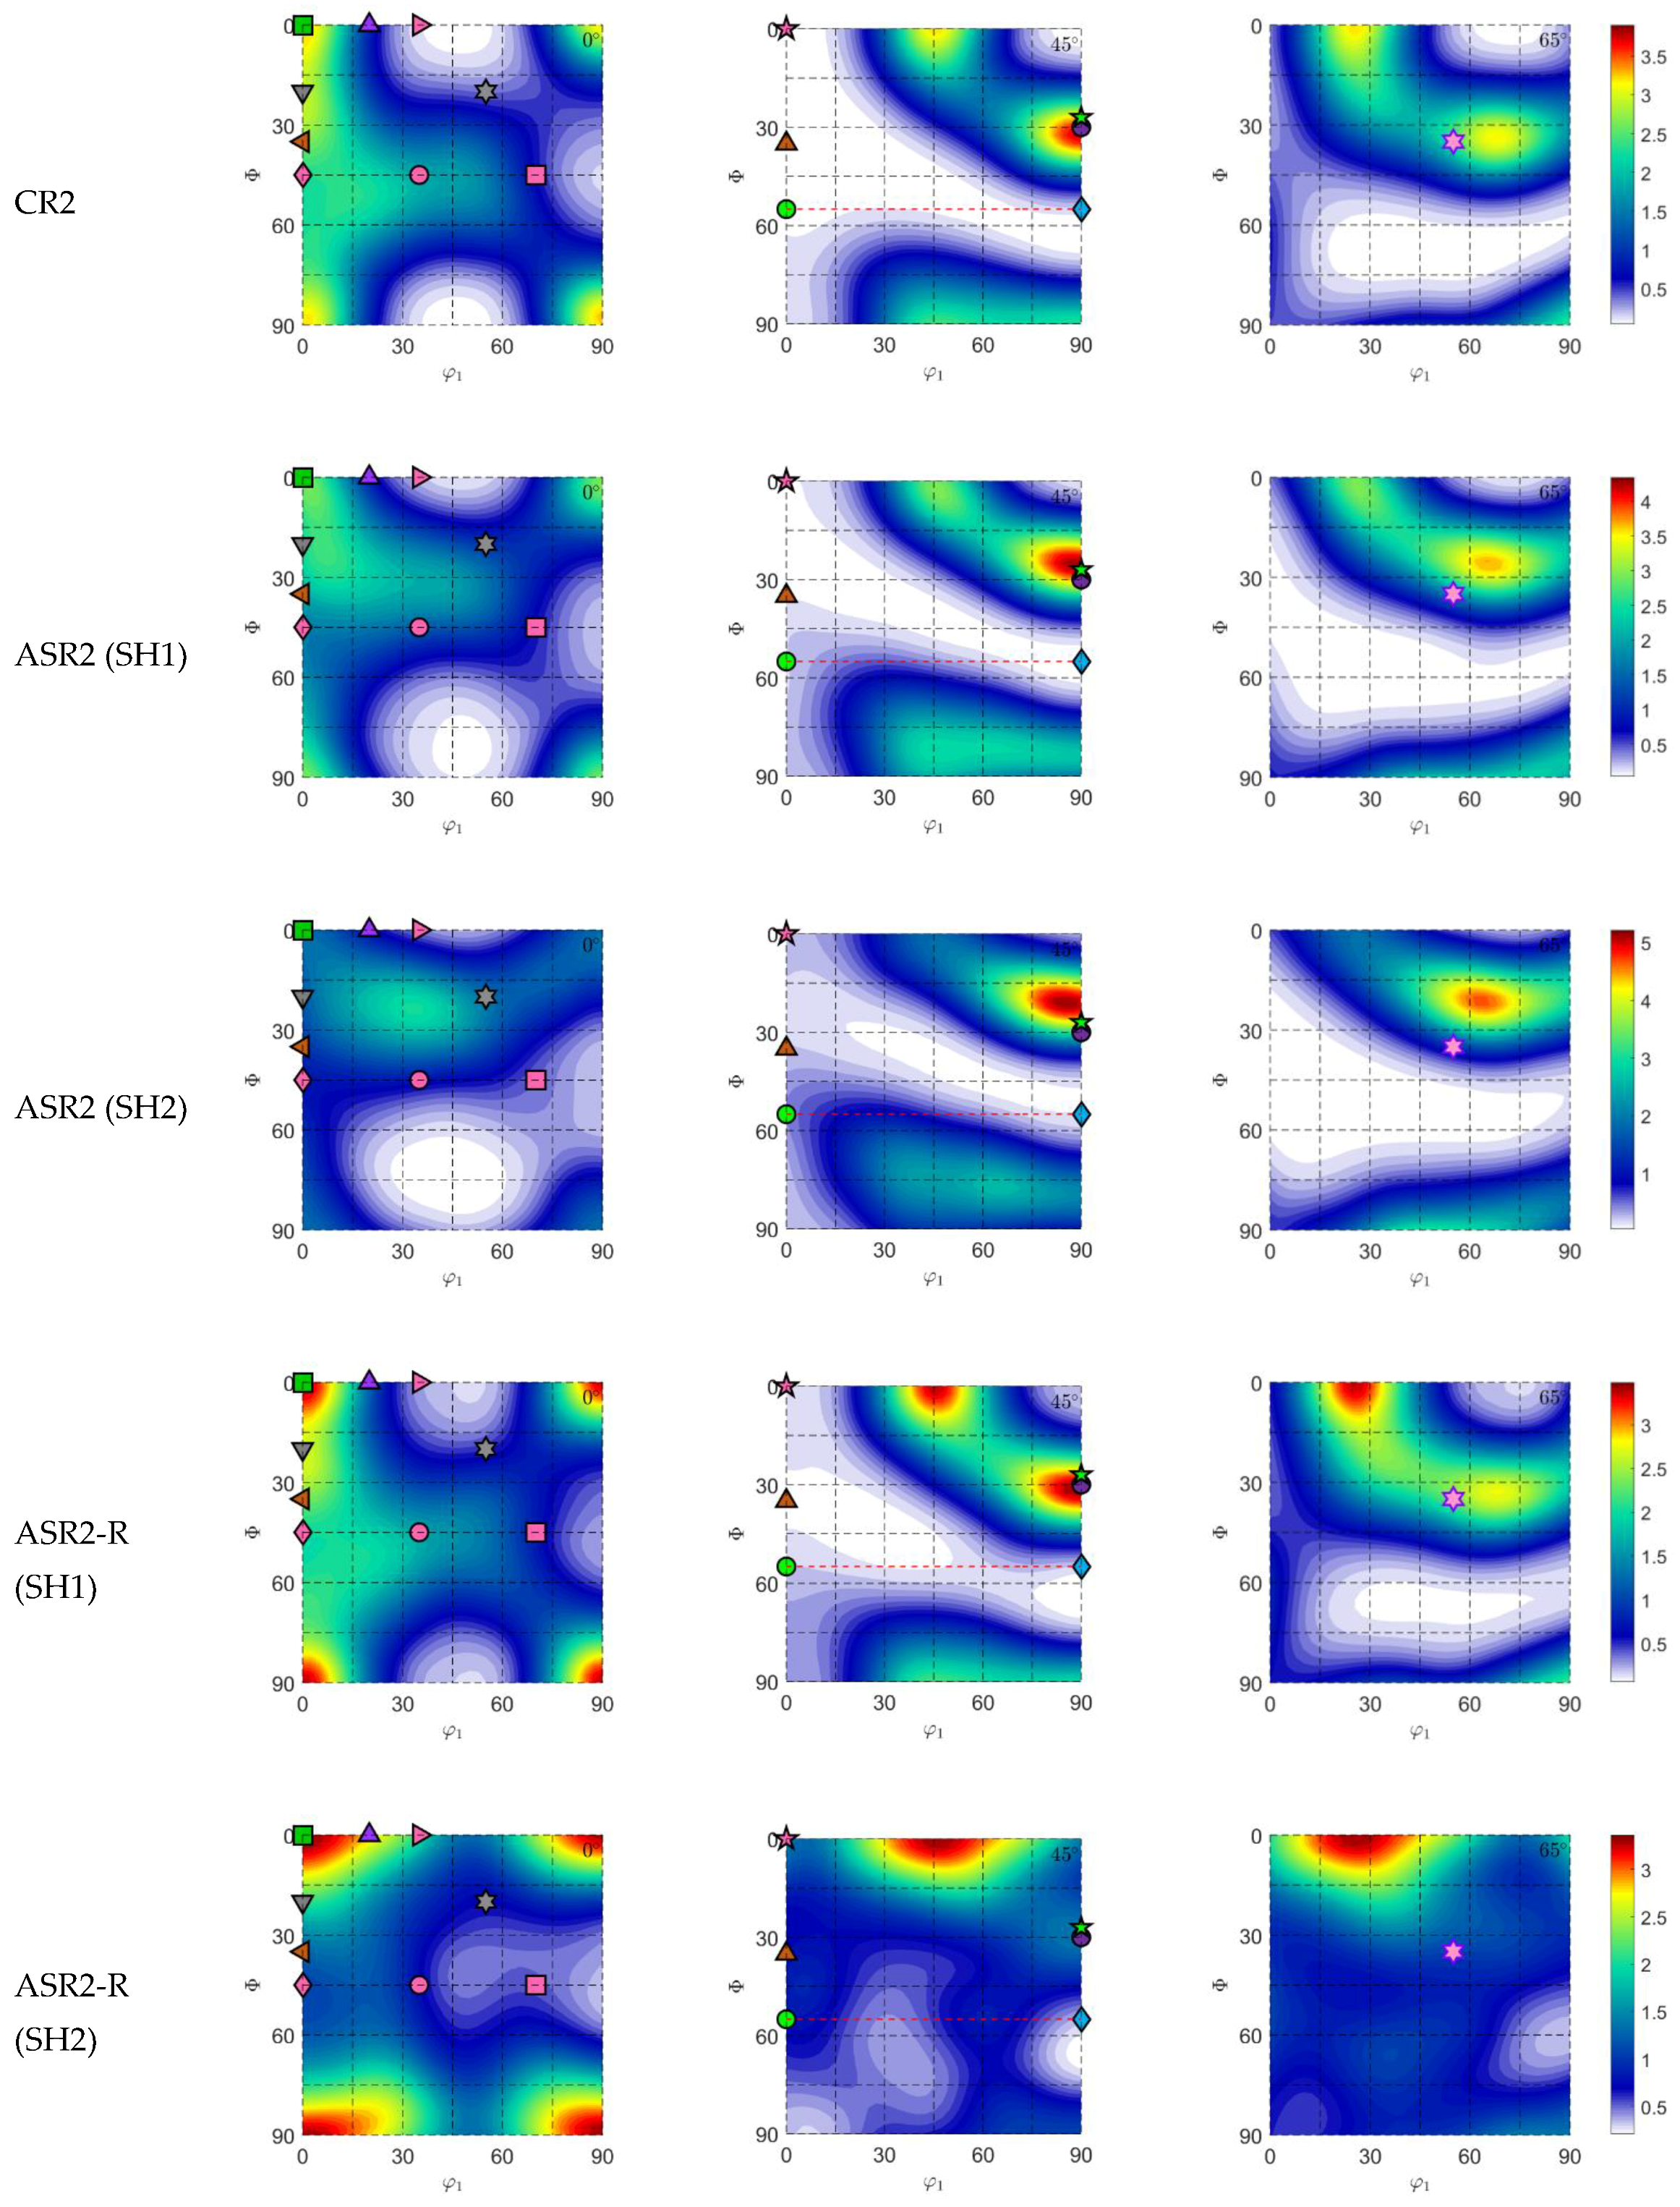
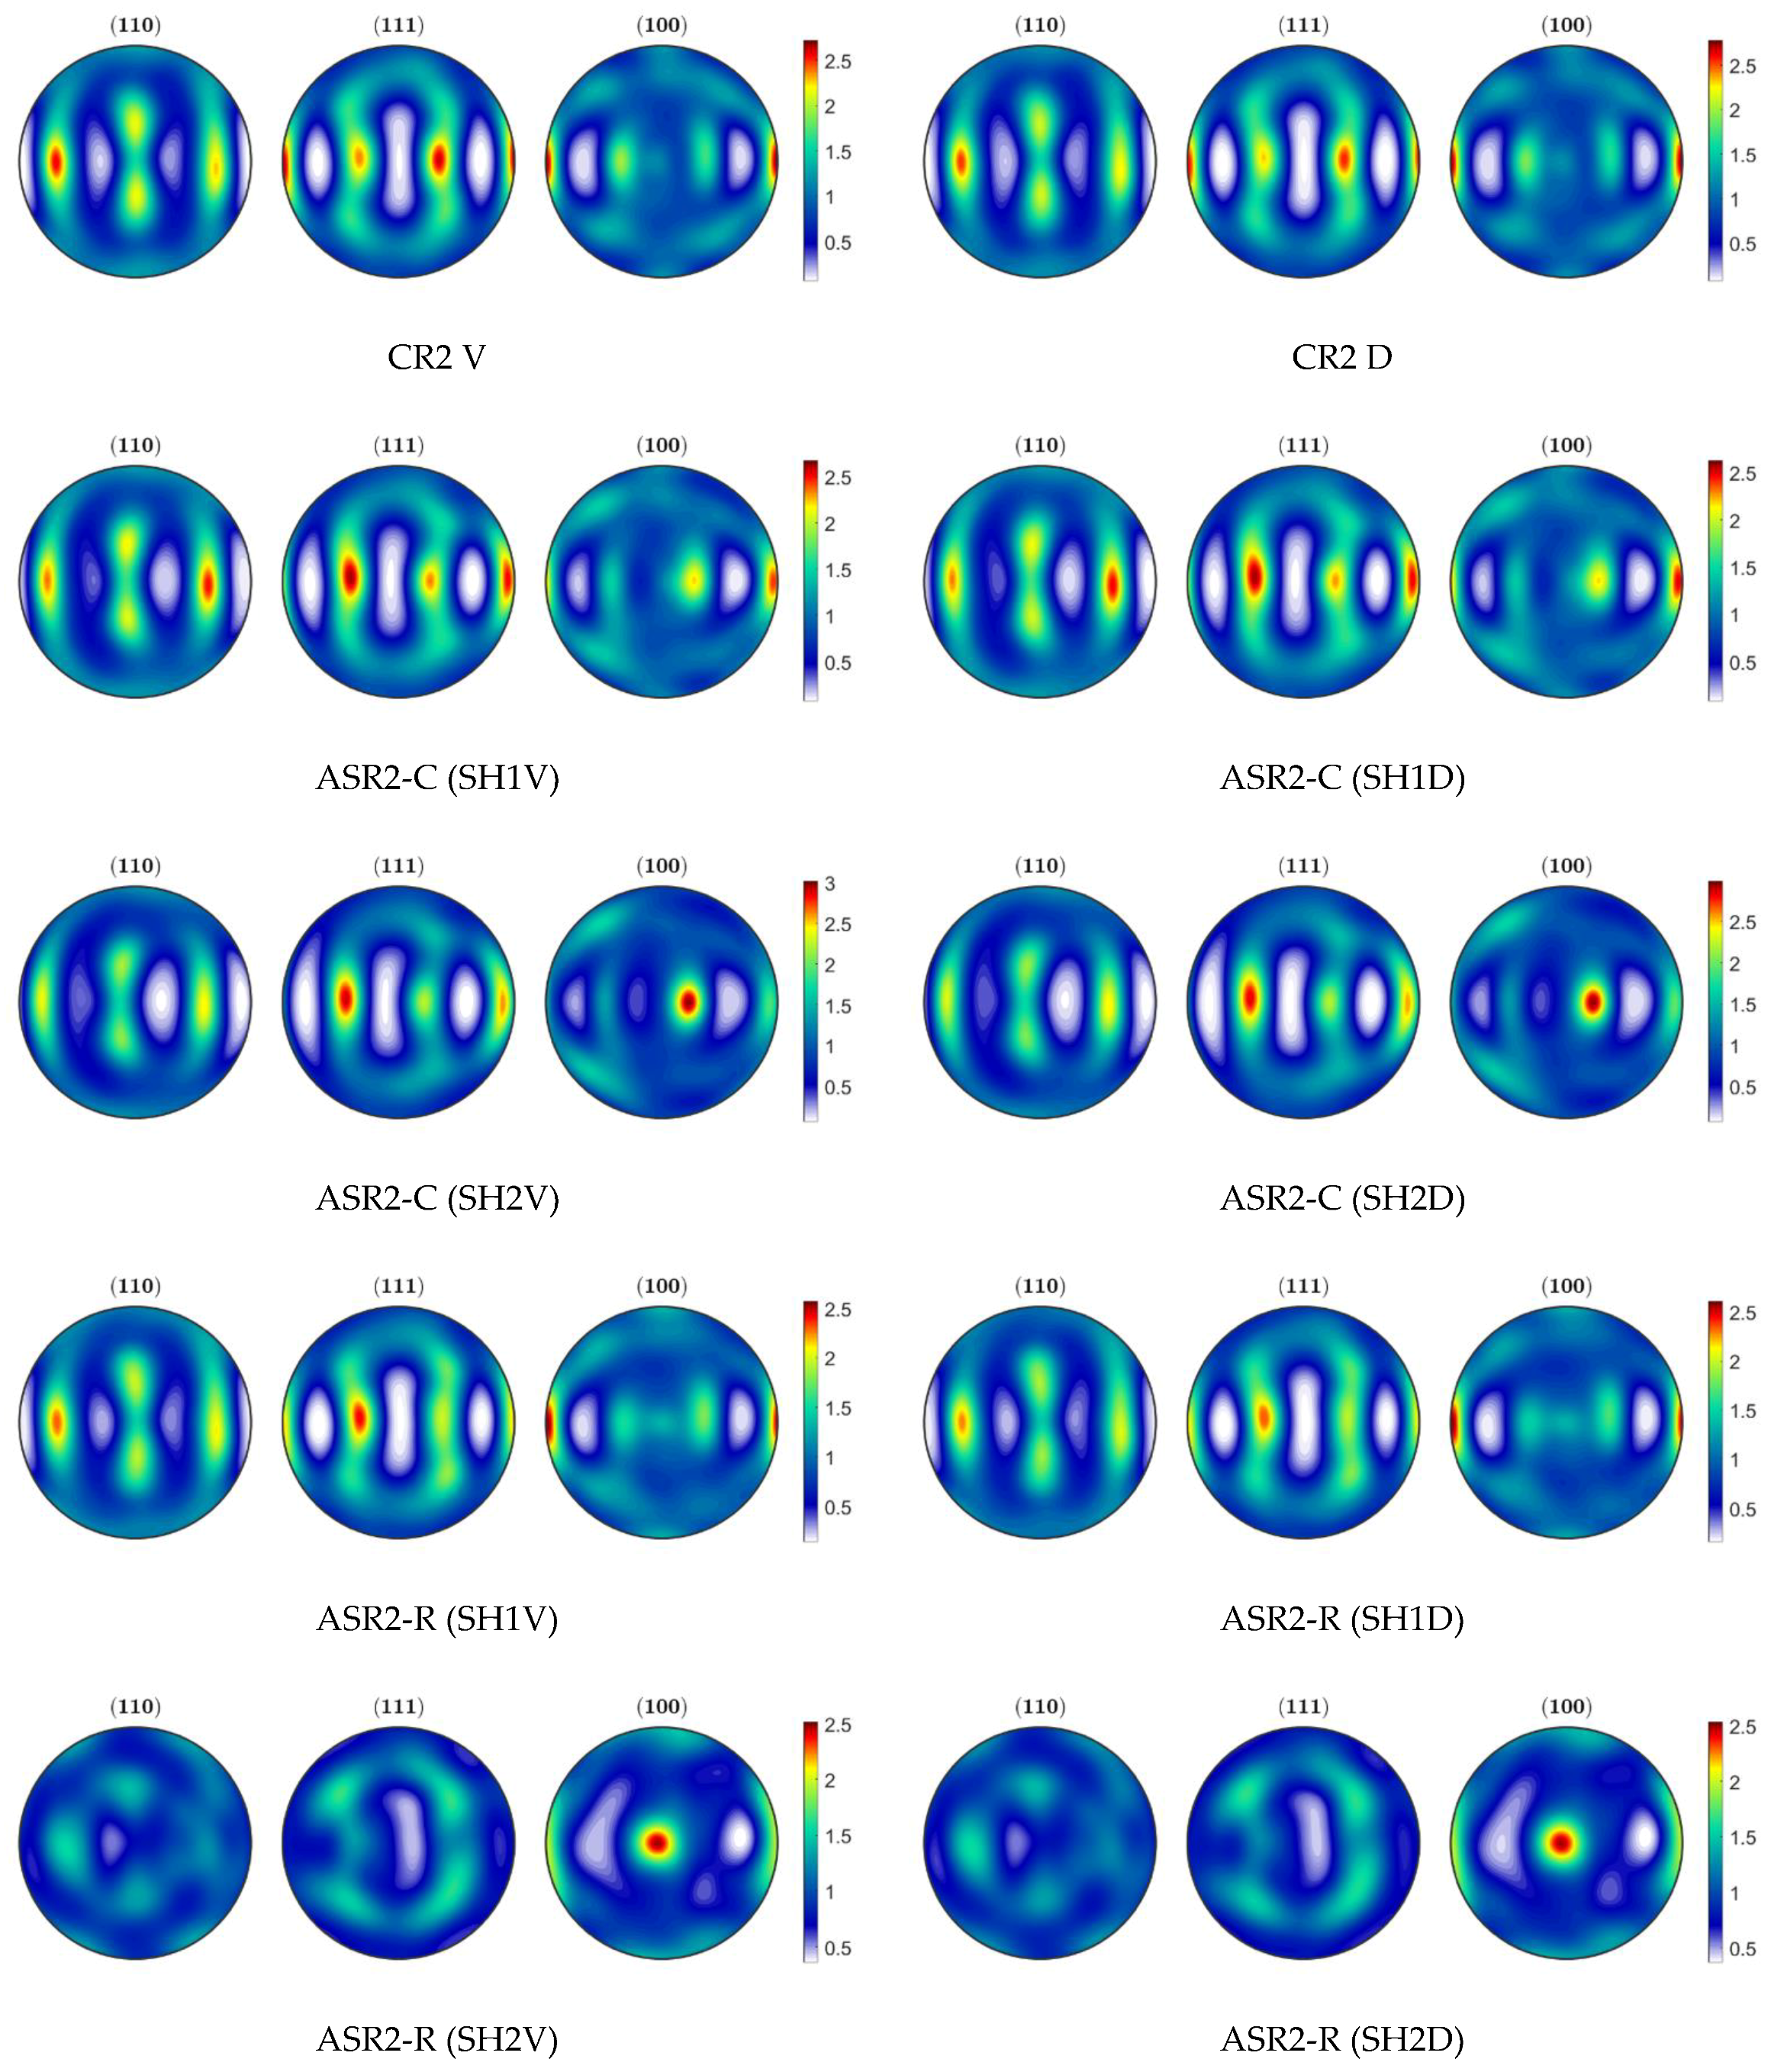
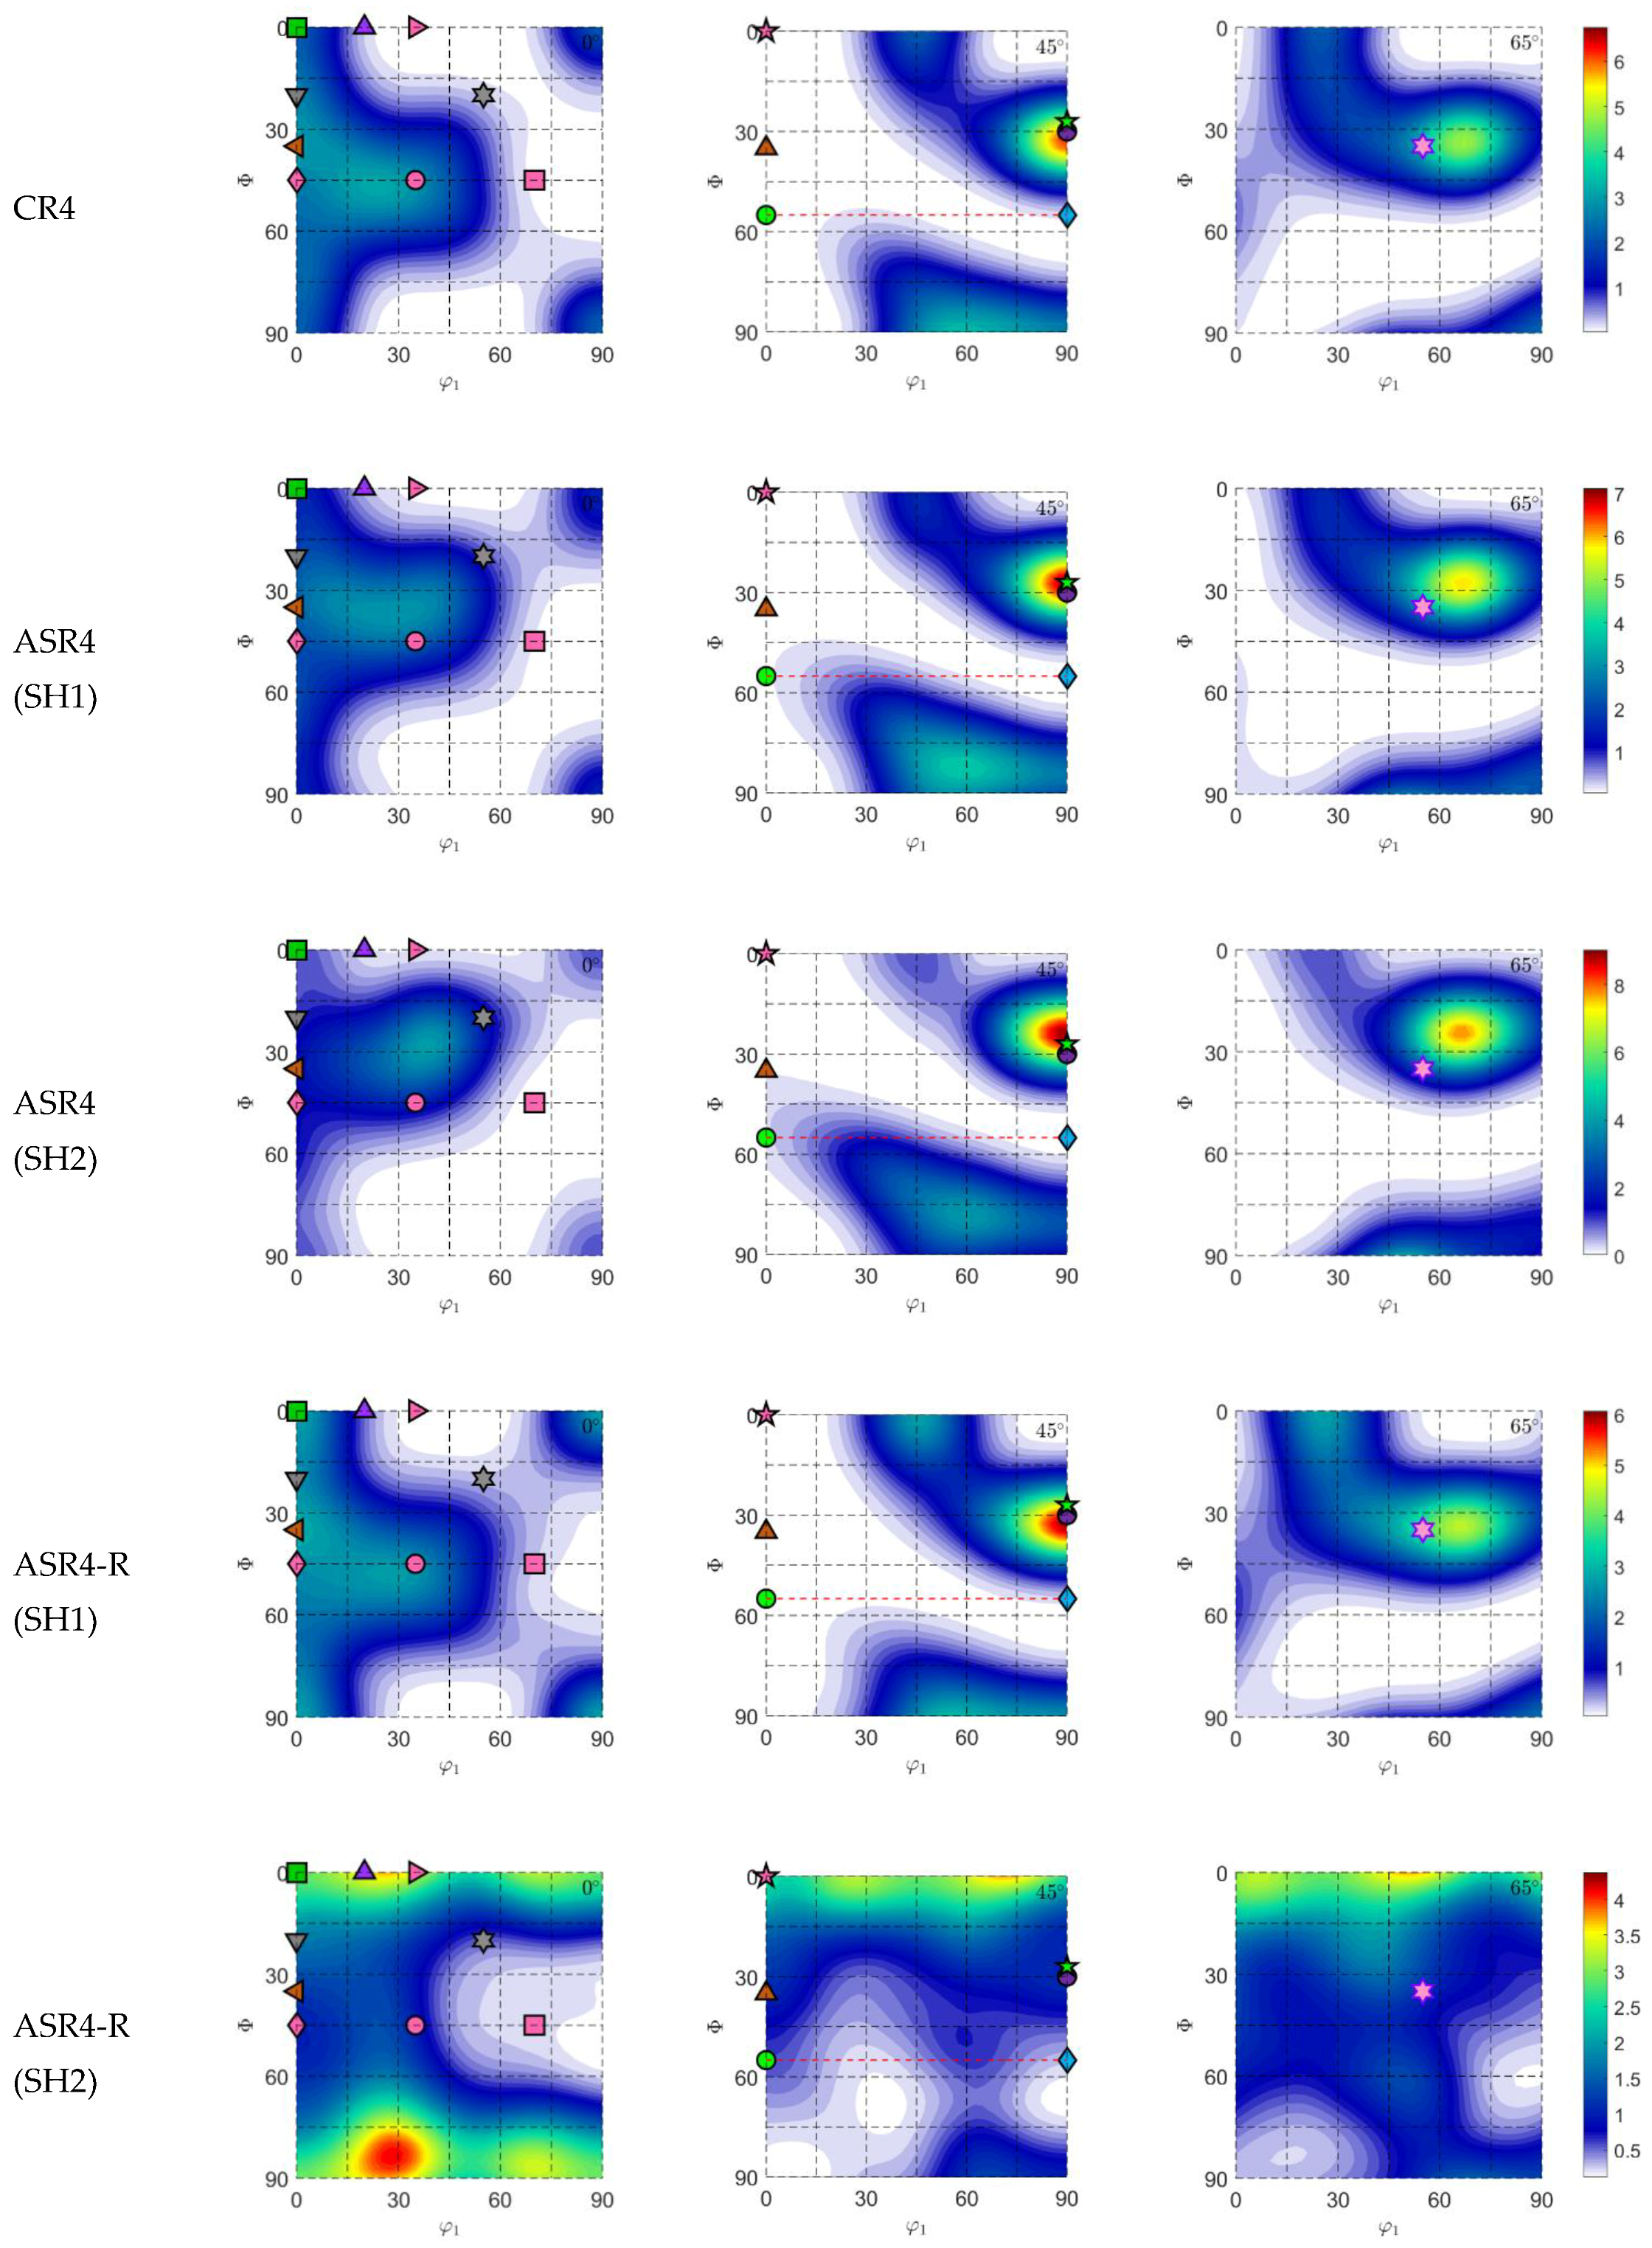
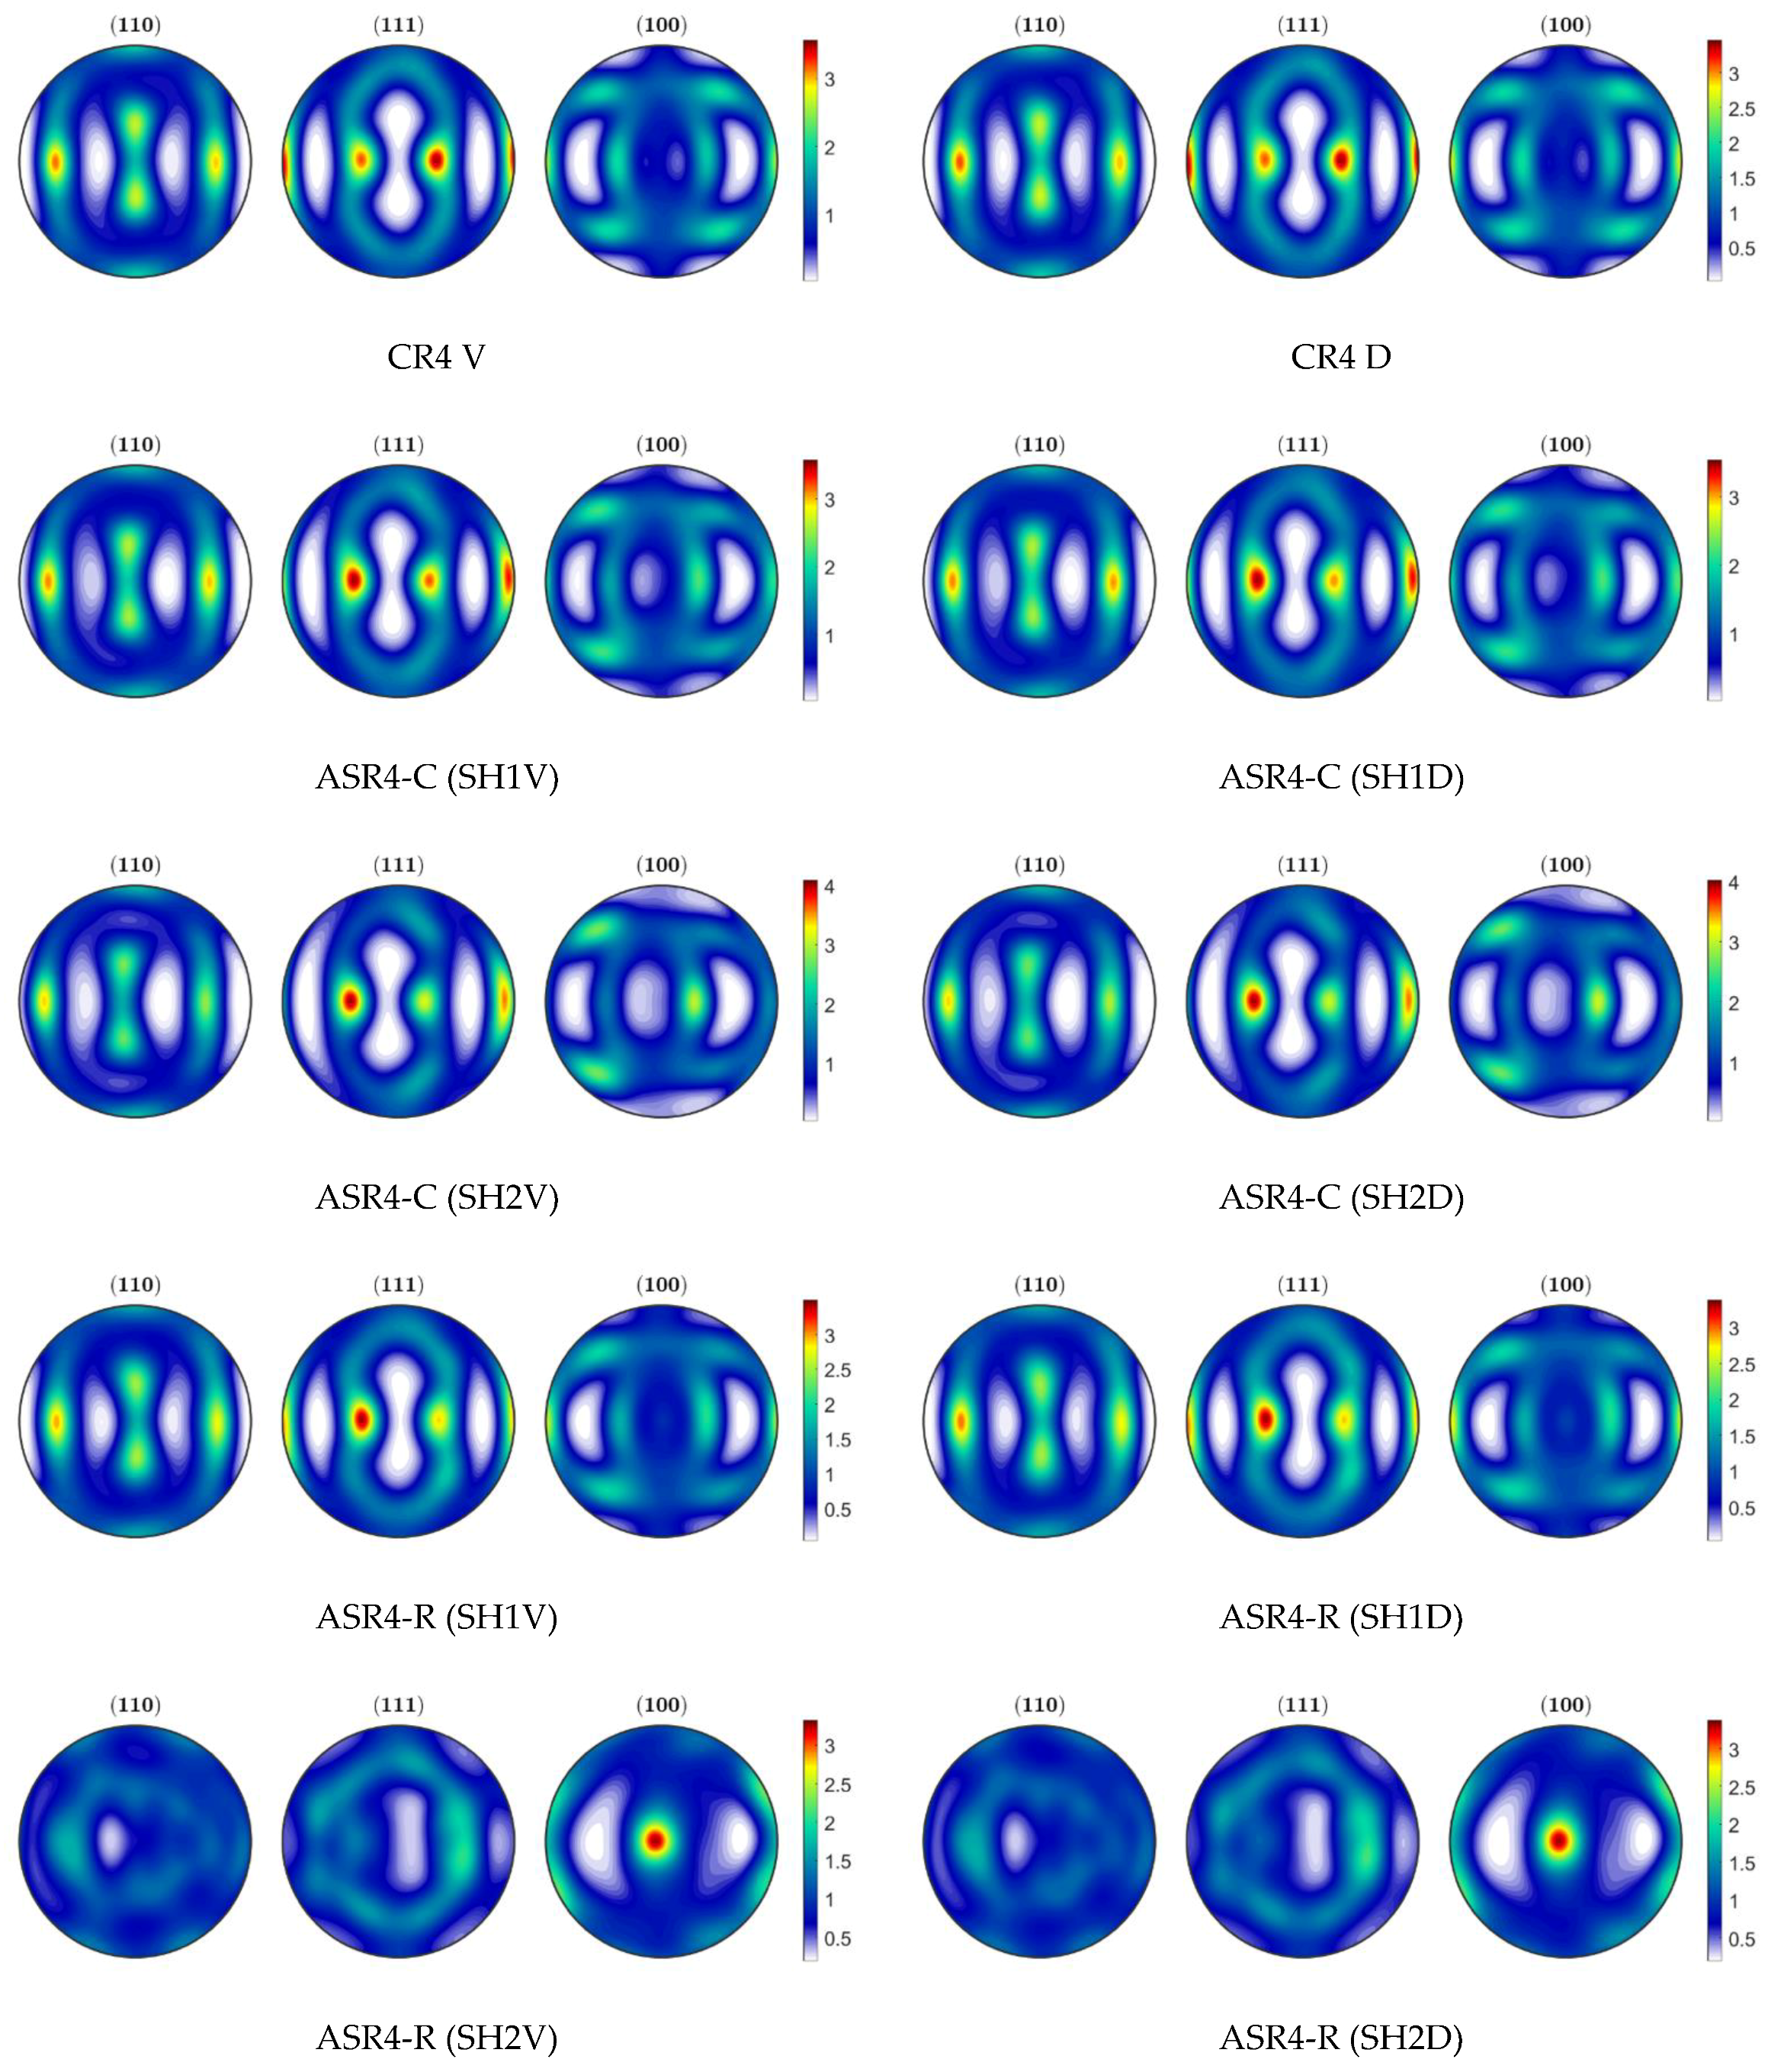
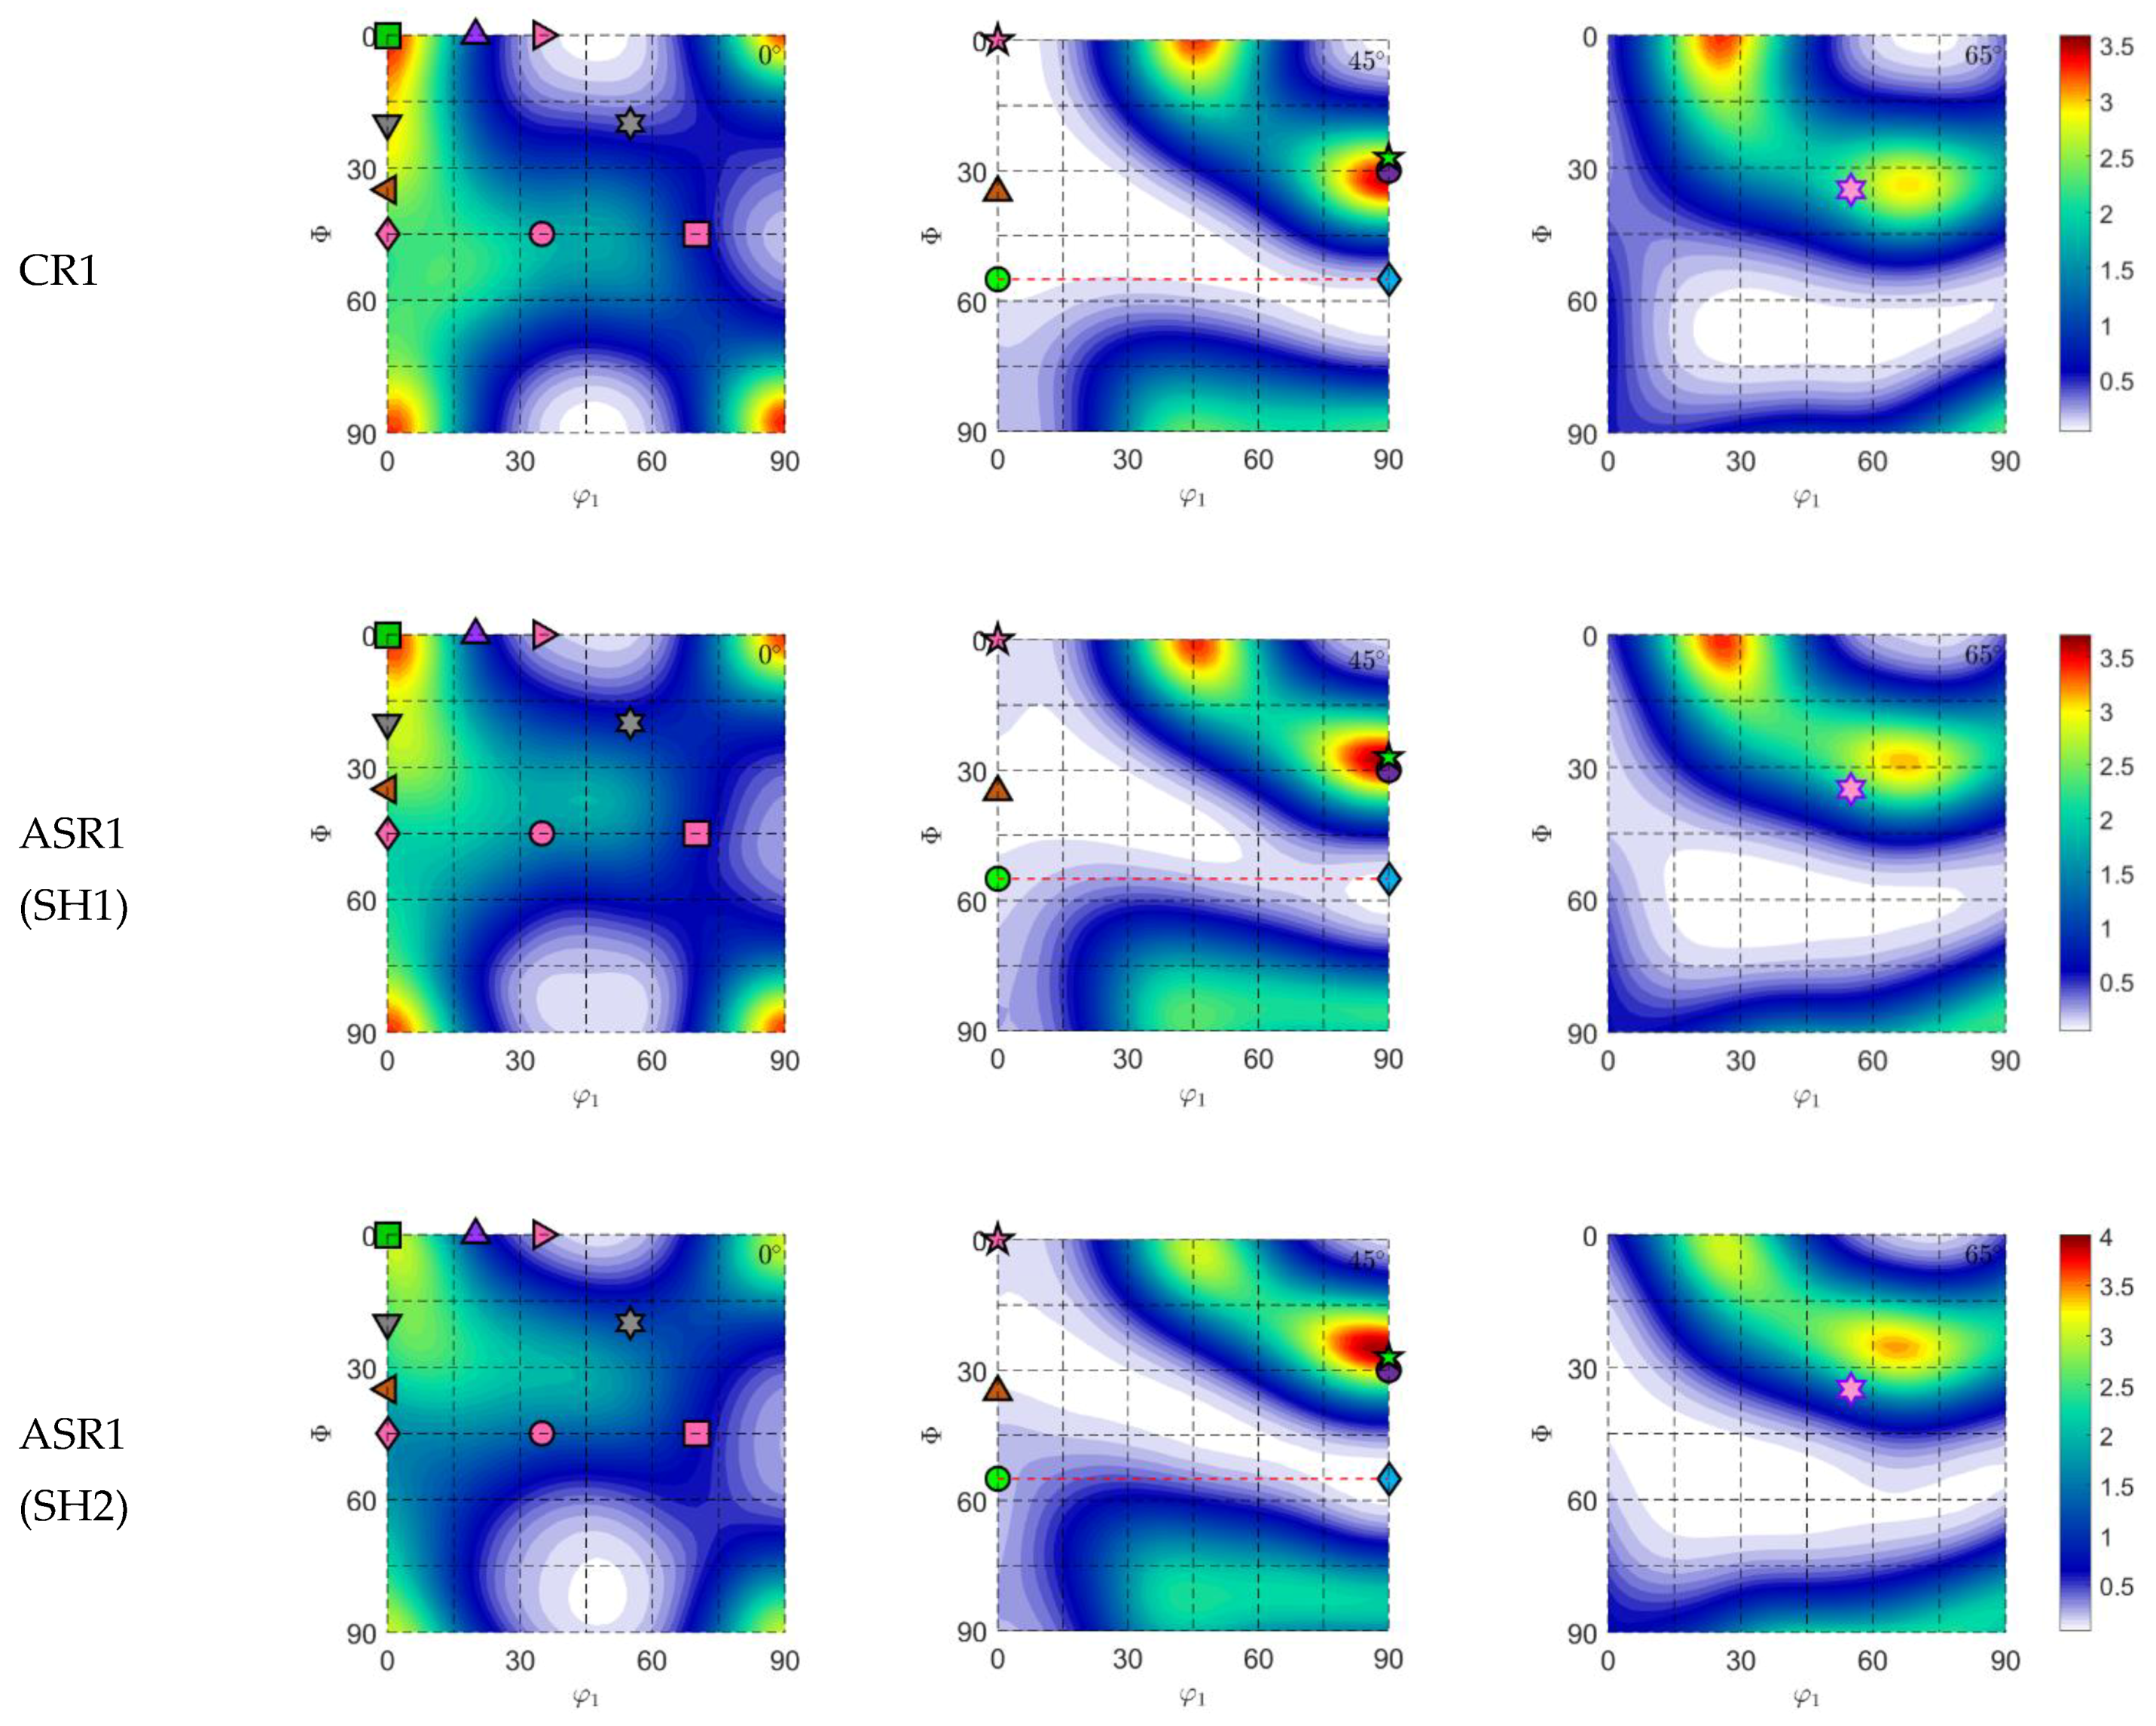
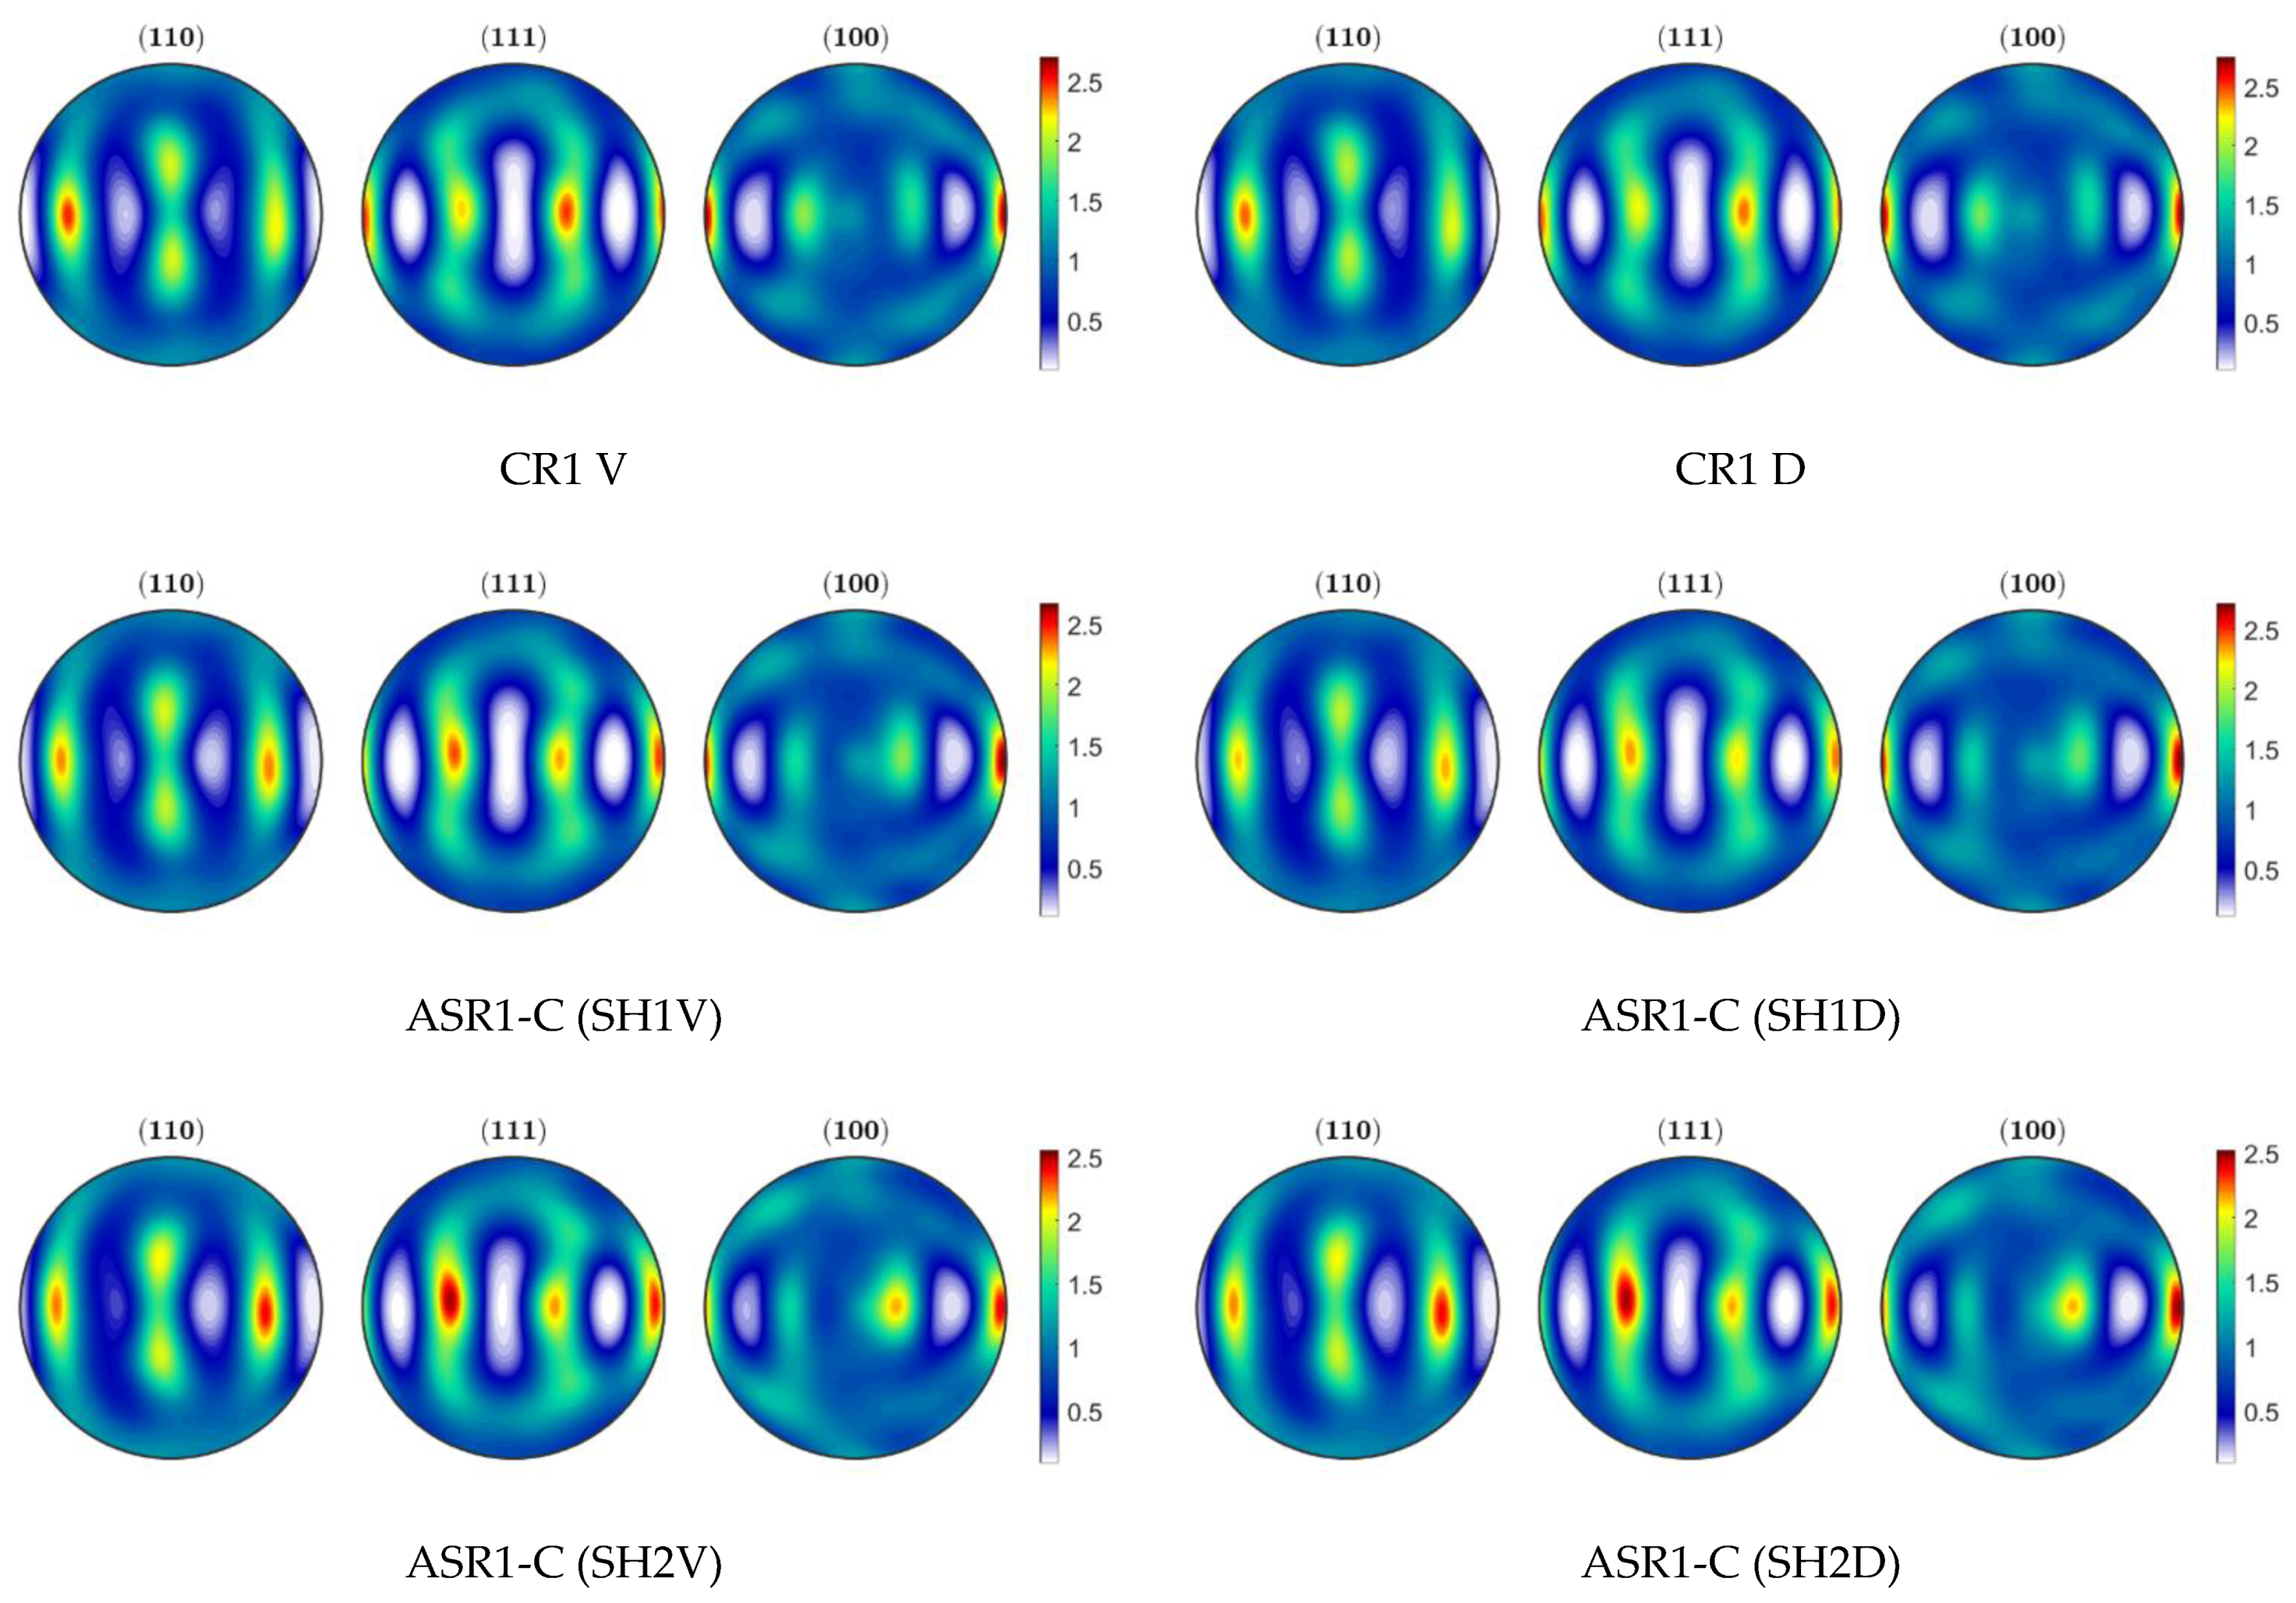
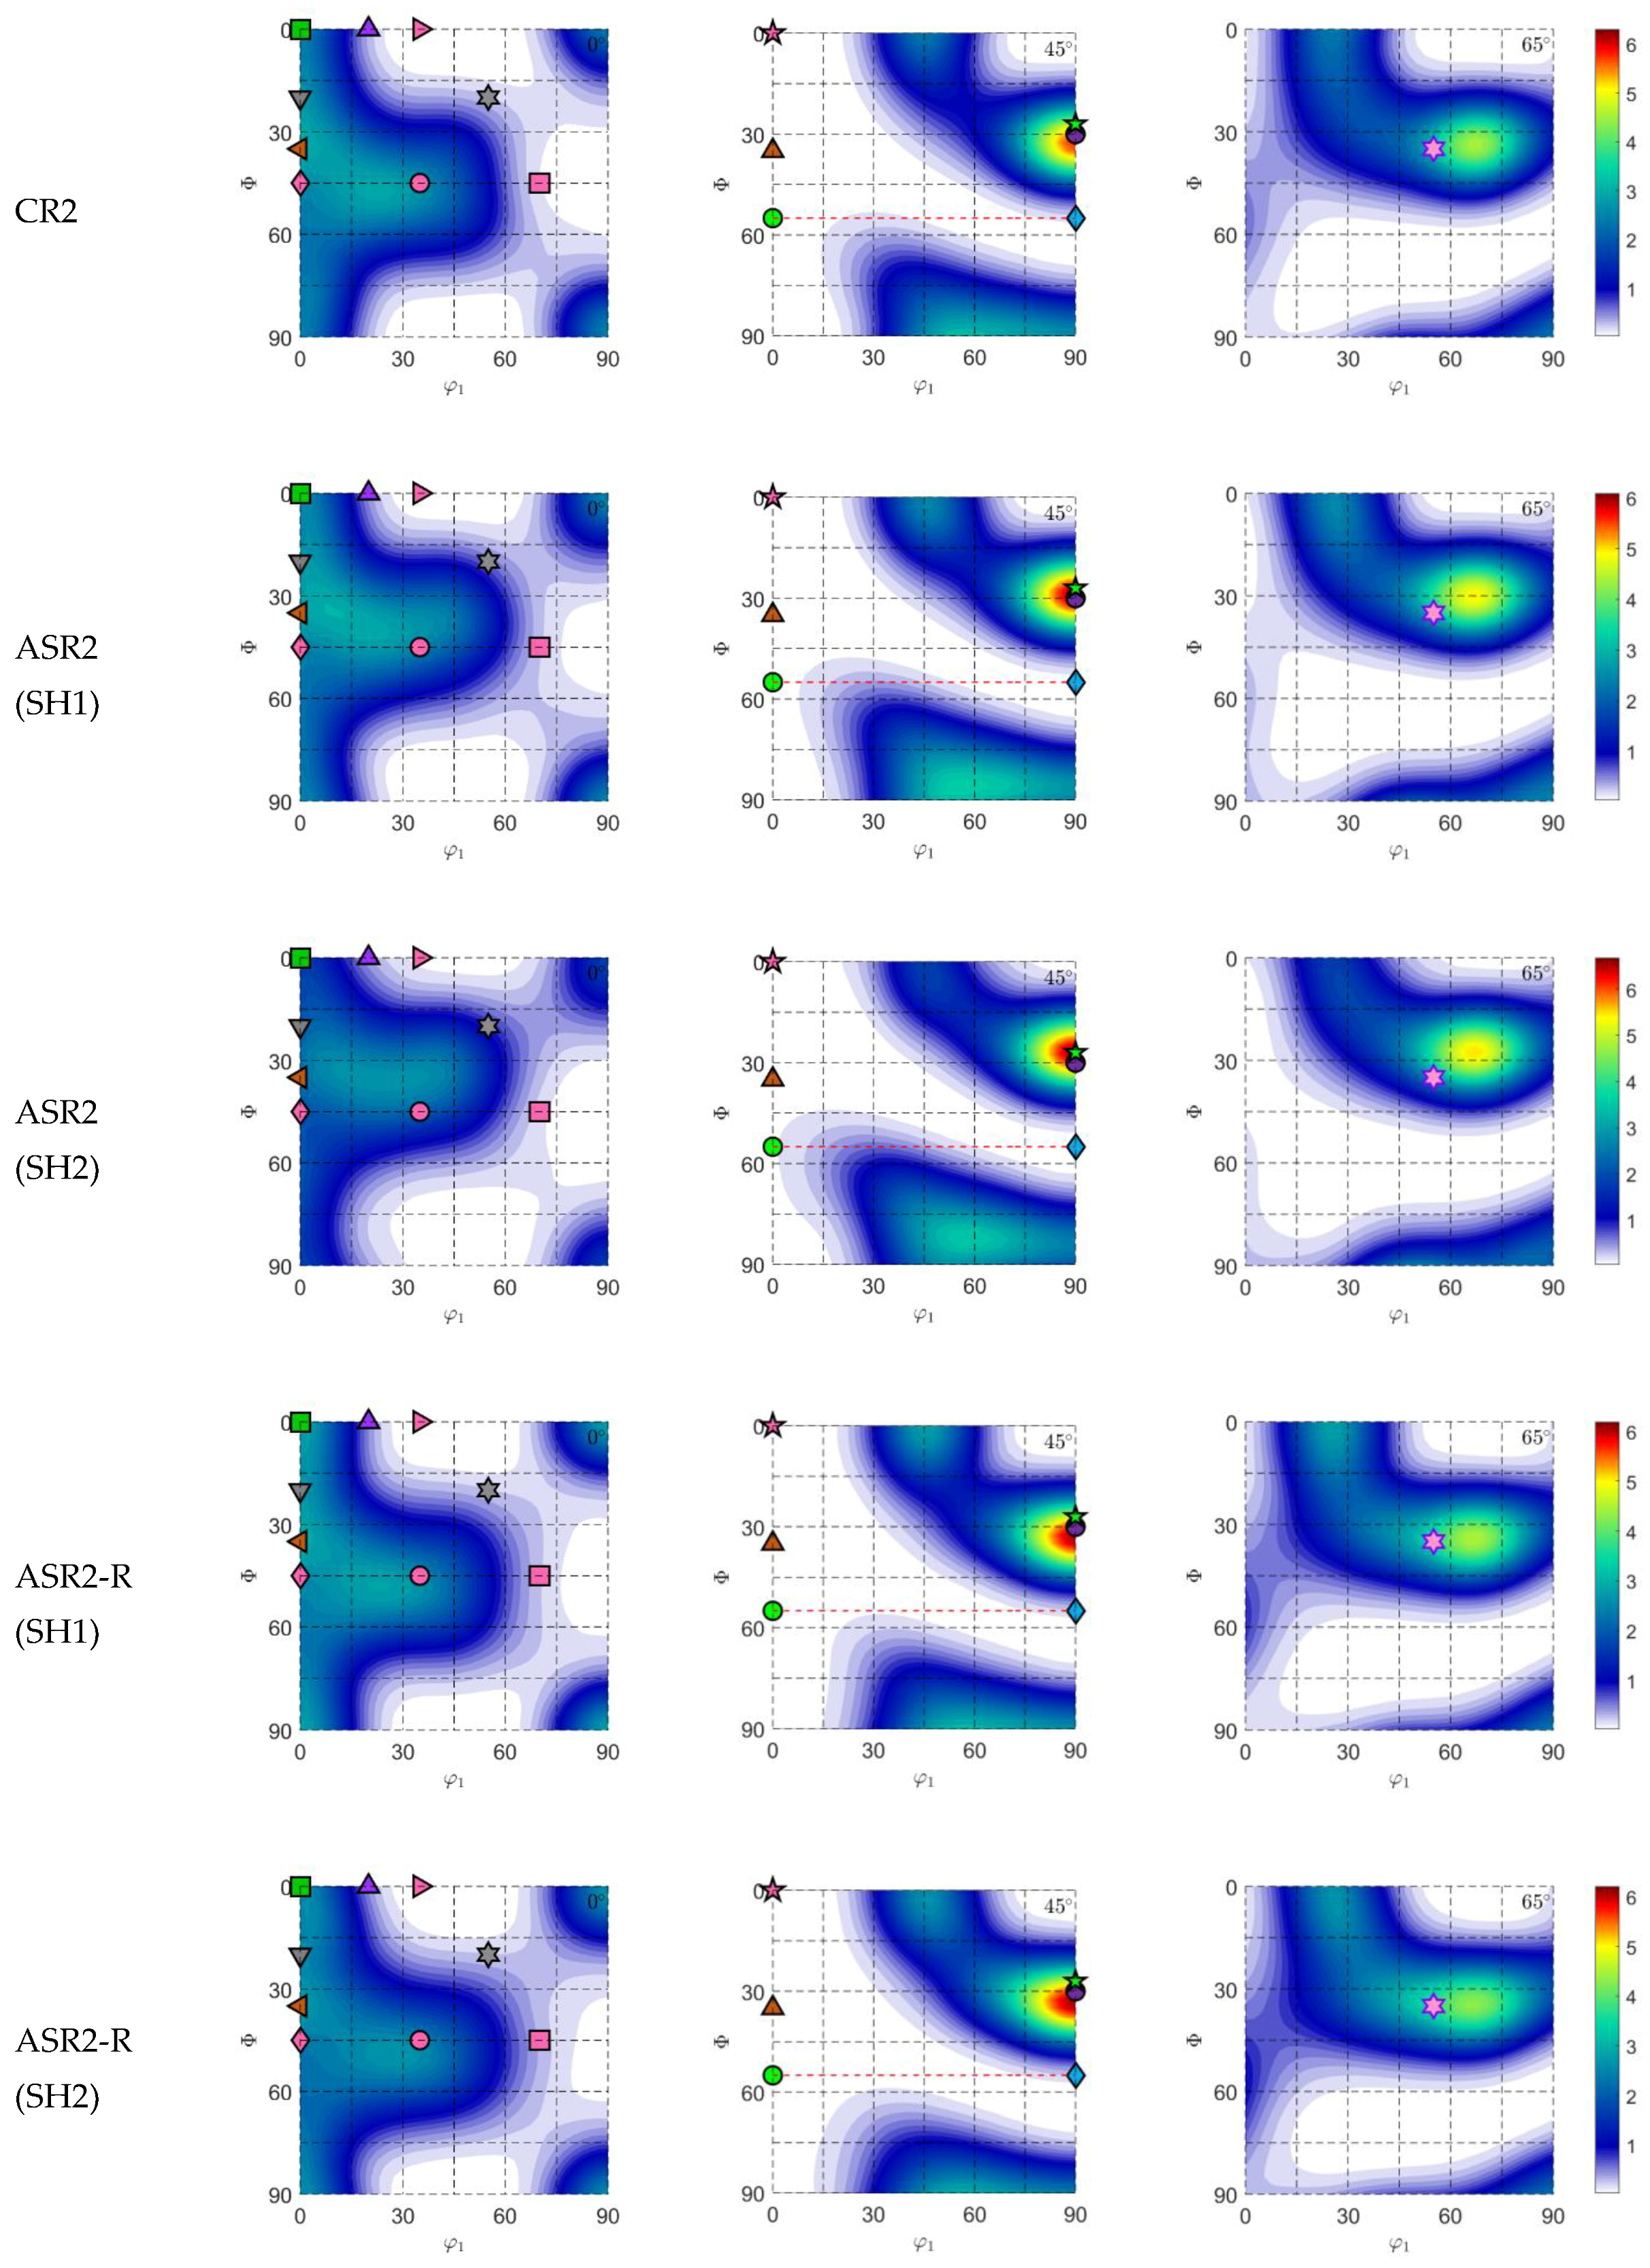
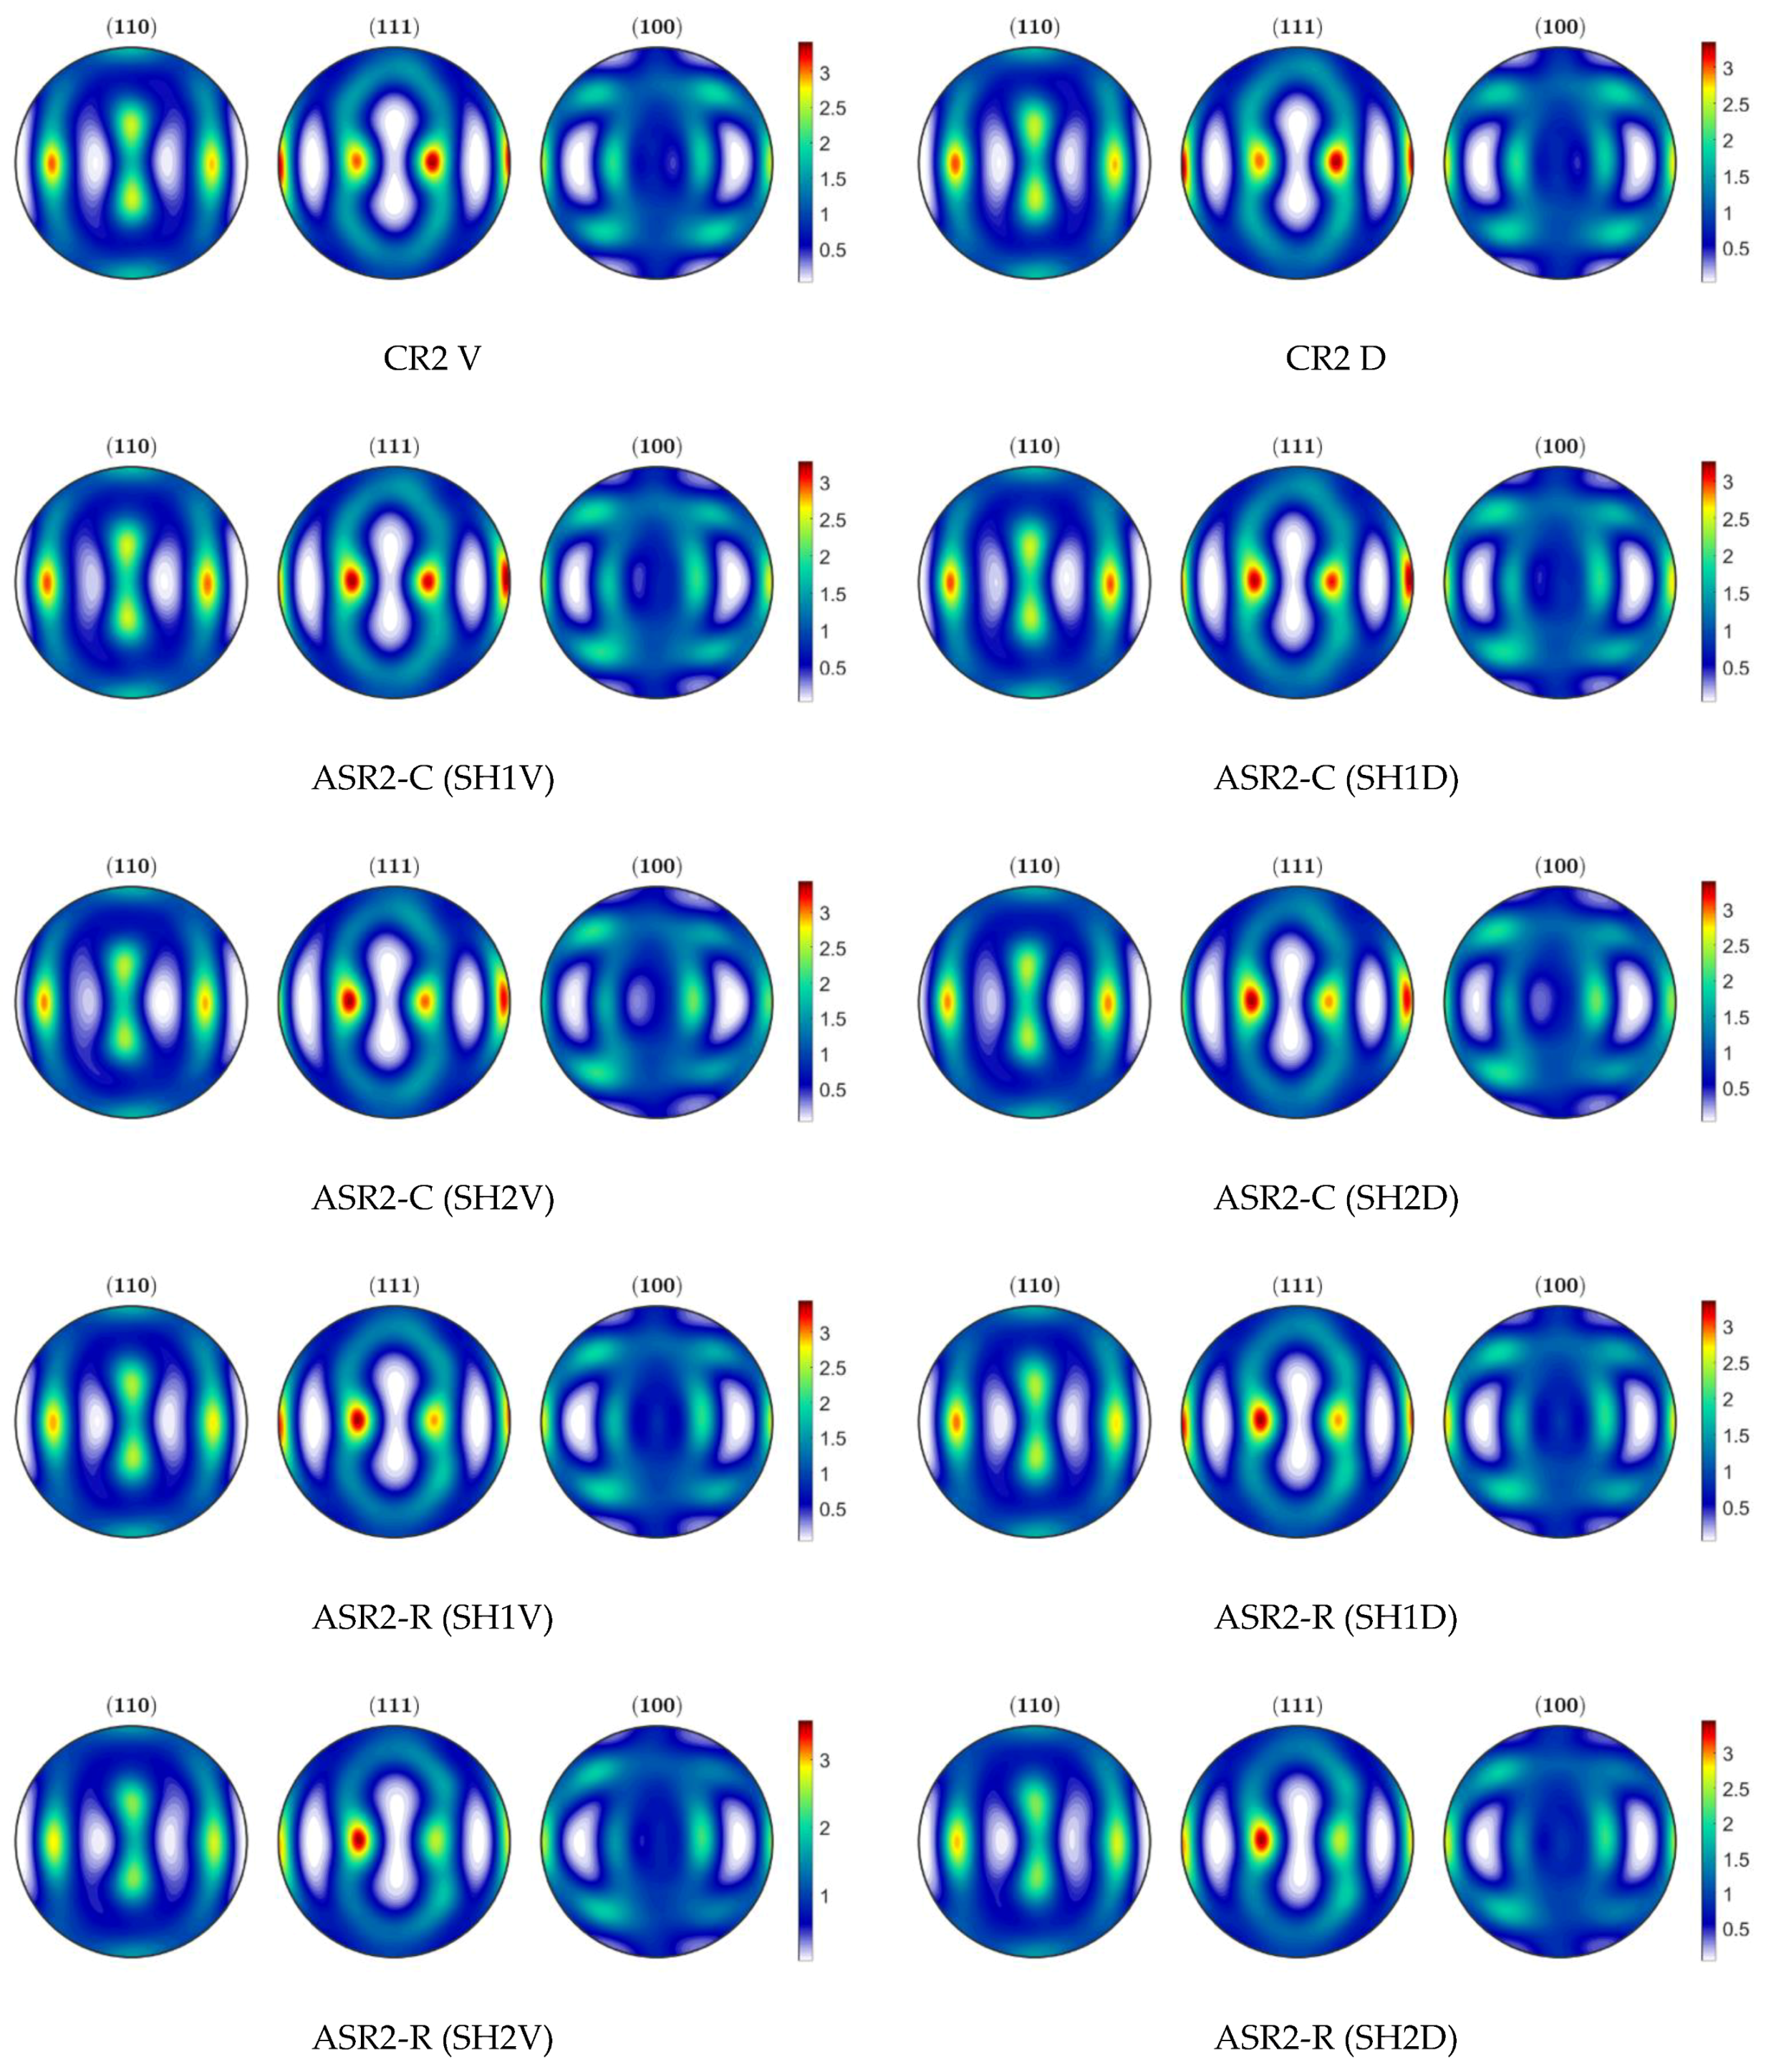
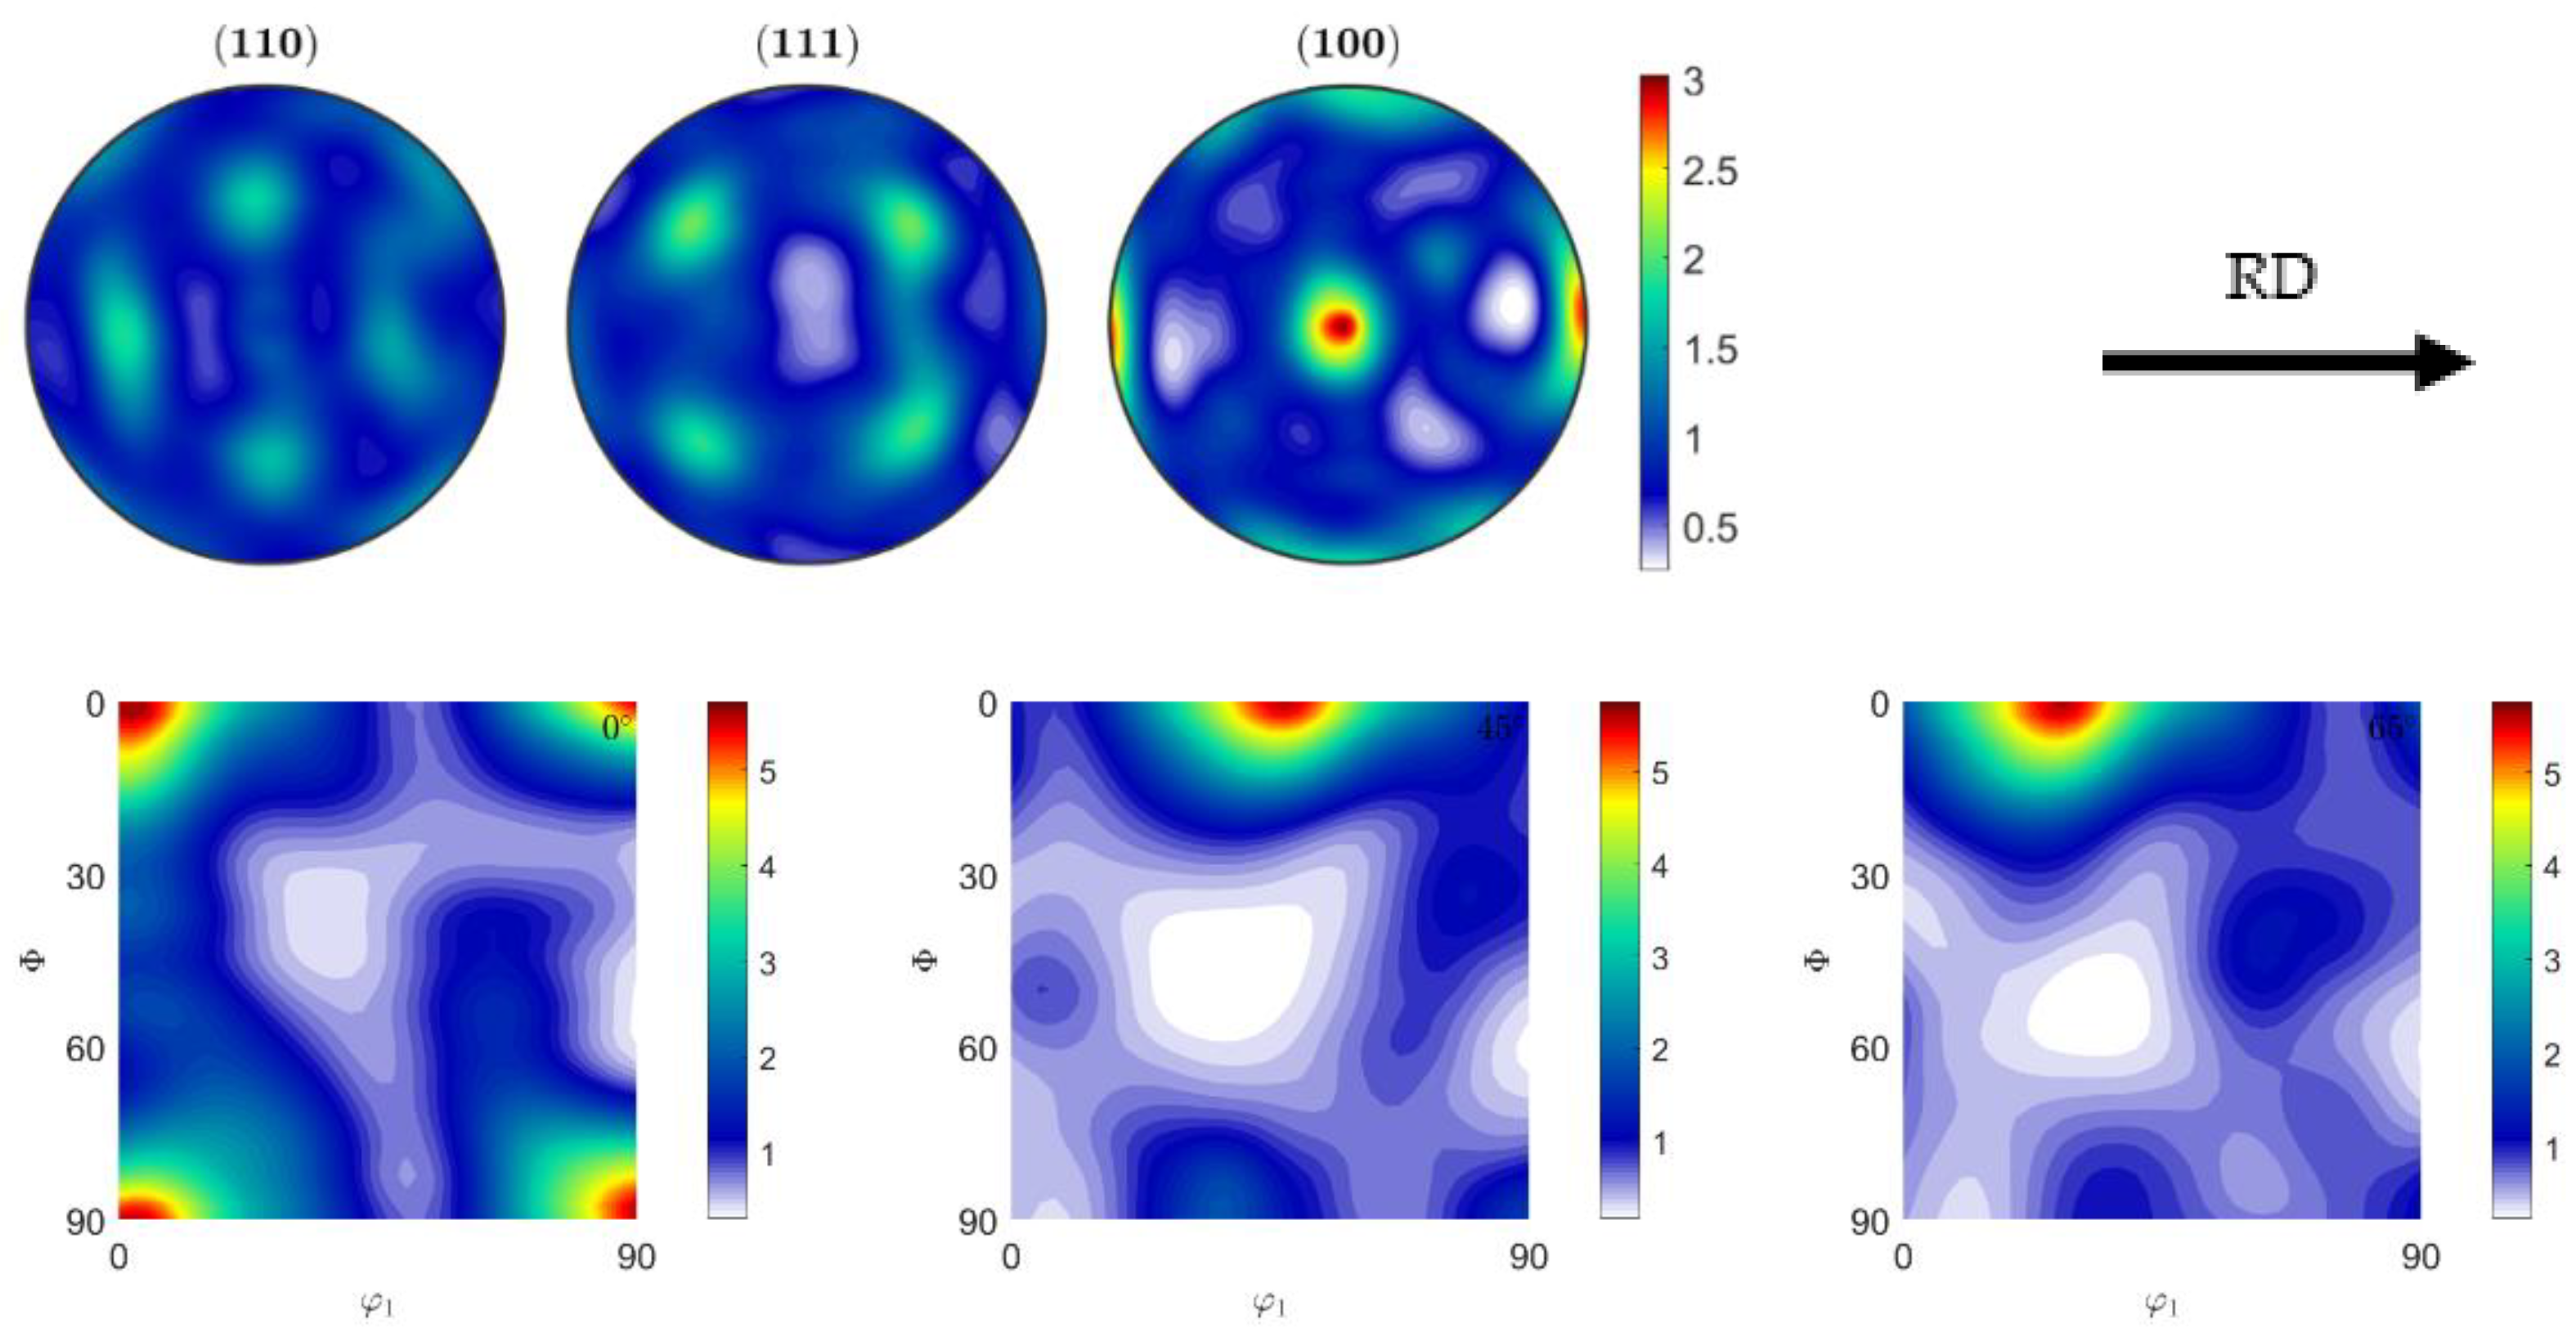
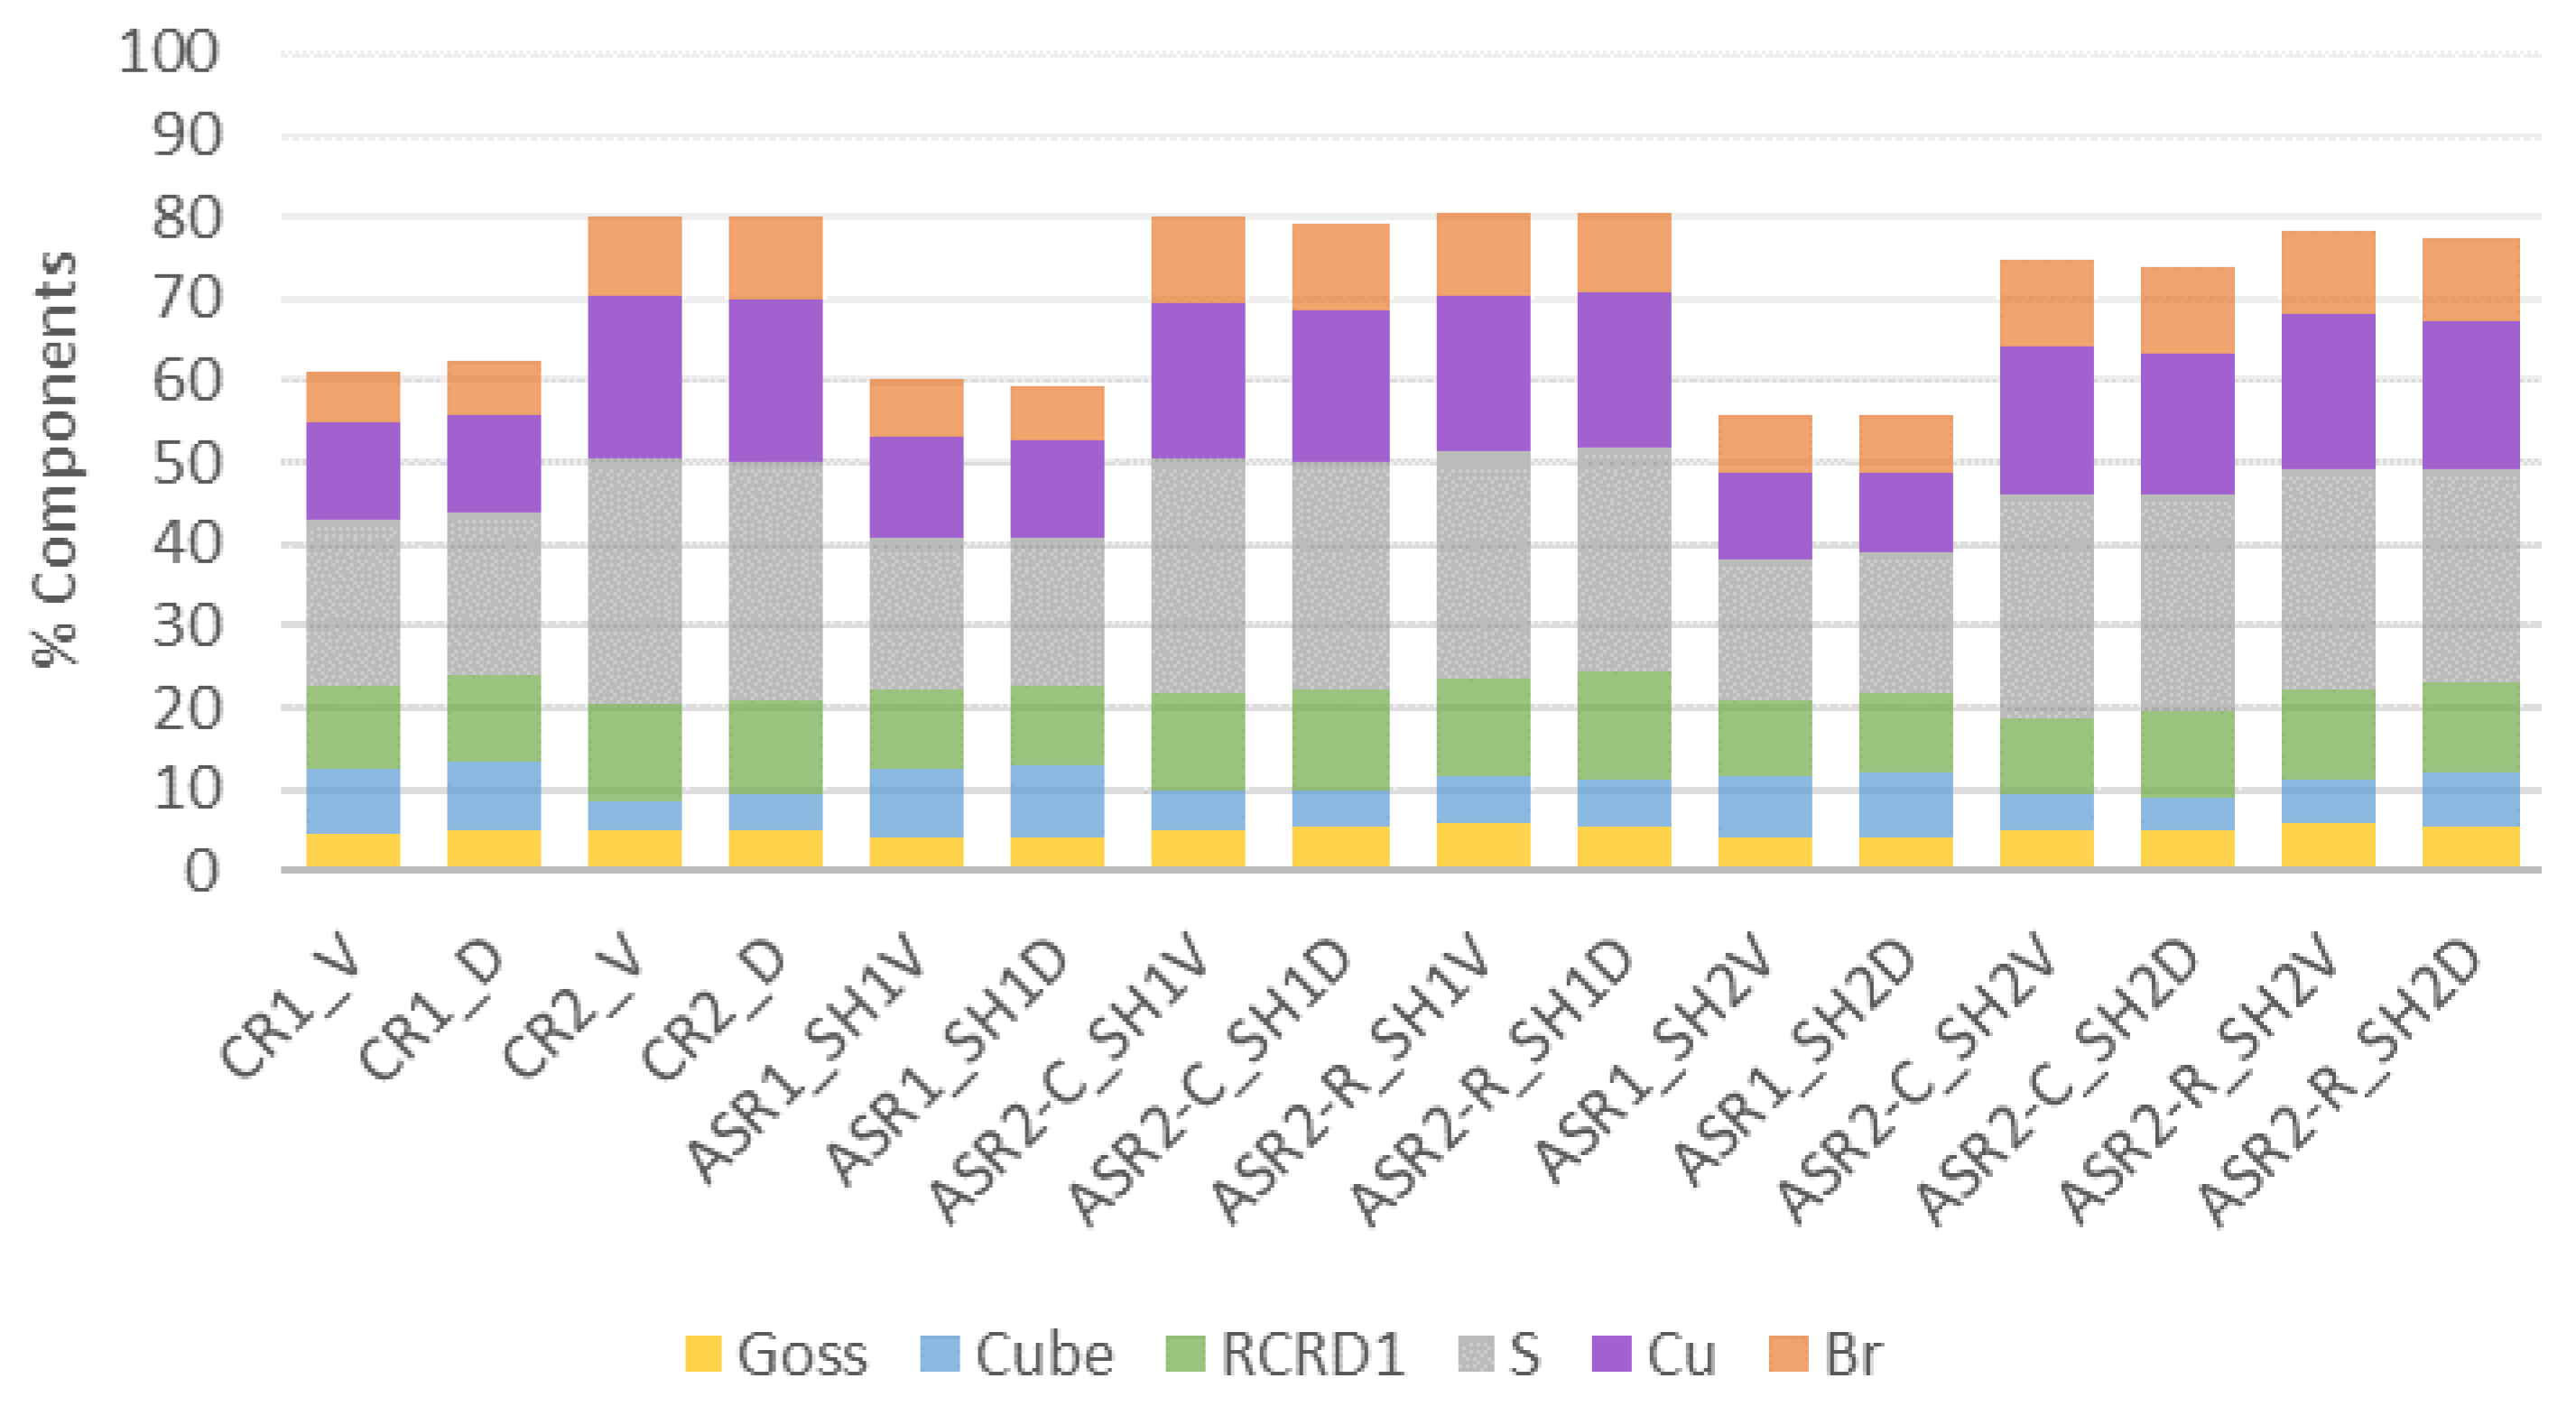
3.3. Textures
4. Conclusions
- There is no substantial difference between the Voce-type and DDR model results. The discrepancies in the mechanical behavior may be explained by the fitting curves, which diverge for strain values greater than 0.2. The texture orientations given by both models are almost identical.
- The ASR-C simulations indicate increased yield stress and improved drawability. However, the planar anisotropy follows the same trend, indicating earing formation during metal forming such as deep drawing.
- The simulated ASR-R process for lower prescribed shear strain increases the normal anisotropy and makes the material more isotropic. However, a slight decrease in the material strength can be noticed.
- The ASR-R simulations for higher prescribed shear strain revealed shear orientations development. However, it compromises the material strength and drawability. Additionally, the results indicate a more isotropic material.
- Overall, the results suggest that the planar anisotropy increase is due to the reduction of the Cube component, although not necessarily due to a higher intensity in the gamma fiber region.
- The mechanical response predicted by the VPSC has a very significant dependence on the hardening rate and texture evolution during the numerical analysis. Under certain circumstances, the texture evolution may cause an undesired softening effect as verified in the ASR-R results.
Author Contributions
Funding
Data Availability Statement
Acknowledgments
Conflicts of Interest
Appendix A


References
- Miki, Y.; Noguchi, O.; Ueno, Y.; Suzuki, Y.; Koyama, K.; Komatsubara, T. Improvement of Deep Drawability of Al-Mg-Si Alloy Sheets for Automotive Panel by Asymmetric Warm Rolling. In Proceedings of the 12th International Conference on Aluminium Alloys, Yokohama, Japan, 5–9 September 2010. [Google Scholar]
- Vincze, G.; Simões, F.J.P.; Butuc, M.C. Asymmetrical Rolling of Aluminum Alloys and Steels: A Review. Metals 2020, 10, 1126. [Google Scholar] [CrossRef]
- Wroński, S.; Wierzbanowski, K.; Bacroix, B.; Chauveau, T.; Wróbel, M.; Rauch, A.; Montheillet, F.; Wroński, M. Texture heterogeneity of asymmetrically cold rolled low carbon steel. Arch. Metall. Mater. 2009, 54, 89–102. [Google Scholar]
- Wronski, M.; Wierzbanowski, K.; Bacroix, B.; Lipinski, P. Asymmetric rolling textures of aluminium studied with crystalline model implemented into FEM. In IOP Conference Series: Materials Science and Engineering; IOP Publishing: Bristol, UK, 2015; Volume 82. [Google Scholar] [CrossRef] [Green Version]
- Wronski, M.; Wierzbanowski, K.; Wronski, S.; Bacroix, B.; Lipinski, P. Experimental and finite element analysis of asymmetric rolling of 6061 aluminum alloy using two-scale elasto-plastic constitutive relation. Arch. Metall. Mater. 2017, 62, 1991–1999. [Google Scholar] [CrossRef] [Green Version]
- Shore, D.; Van Houtte, P.; Roose, D.; Van Bael, A. Multiscale modelling of asymmetric rolling with an anisotropic constitutive law. Comptes Rendus-Mec. 2018, 346, 724–742. [Google Scholar] [CrossRef]
- Tam, N.N.; Nakamura, Y.; Terao, T.; Kuramae, H.; Nakamachi, E.; Sakamoto, H.; Morimoto, H. Asymmetrie rolling process simulations by using dynamic explicit crystallographic homogenized elasto/viscoplastic finite element method. J. Soc. Mater. Sci. Jpn. 2008, 57, 583–589. [Google Scholar] [CrossRef] [Green Version]
- Nakamachi, E.; Kuramae, H.; Sakamoto, H.; Morimoto, H. Process metallurgy design of aluminum alloy sheet rolling by using two-scale finite element analysis and optimization algorithm. Int. J. Mech. Sci. 2010, 52, 146–157. [Google Scholar] [CrossRef]
- Kuramae, H.; Sakamoto, H.; Morimoto, H.; Nakamachi, E. Process metallurgy design for high-formability aluminum alloy sheet metal generation by using two-scale FEM. Procedia Eng. 2011, 10, 2250–2255. [Google Scholar] [CrossRef] [Green Version]
- Molinari, A.; Canova, G.R.; Ahzi, S. A self consistent approach of the large deformation polycrystal viscoplasticity. Acta Metall. 1987, 35, 2983–2994. [Google Scholar] [CrossRef]
- Lebensohn, R.A.; Tomé, C.N. A self-consistent anisotropic approach for the simulation of plastic deformation and texture development of polycrystals: Application to zirconium alloys. Acta Metall. Mater. 1993, 41, 2611–2624. [Google Scholar] [CrossRef]
- Lebensohn, R.A.; Tomé, C.N. A self-consistent viscoplastic model: Prediction of rolling textures of anisotropic polycrystals. Mater. Sci. Eng. A 1994, 175, 71–82. [Google Scholar] [CrossRef] [Green Version]
- Tamimi, S.; Correia, J.P.; Lopes, A.B.; Ahzi, S.; Barlat, F.; Gracio, J.J. Asymmetric rolling of thin AA-5182 sheets: Modelling and experiments. Mater. Sci. Eng. A 2014, 603, 150–159. [Google Scholar] [CrossRef]
- de Almeida Gracio, J.J.; Vincze, G.; Yoon, J.W.; Cardoso, R.P.R.; Rauch, E.F.; Barlat, F.G. Modeling the Effect of Asymmetric Rolling on Mechanical Properties of Al-Mg Alloys. Steel Res. Int. 2015, 86, 922–931. [Google Scholar] [CrossRef]
- Barlat, F.; Brem, J.C.; Yoon, J.W.; Chung, K.; Dick, R.E.; Lege, D.J.; Pourboghrat, F.; Choi, S.H.; Chu, E. Plane stress yield function for aluminum alloy sheets-Part 1: Theory. Int. J. Plast. 2003, 19, 1297–1319. [Google Scholar] [CrossRef]
- Marciniak, Z.; Kuczyński, K. Limit strains in the processes of stretch-forming sheet metal. Int. J. Mech. Sci. 1967, 9, 609–620. [Google Scholar] [CrossRef]
- Dhinwal, S.S.; Toth, L.S. Unlocking deformation path in asymmetric rolling by texture simulation. Materials 2020, 13, 101. [Google Scholar] [CrossRef] [Green Version]
- Kalidindi, S.R.; Bronkhorst, C.A.; Anand, L. Crystallographic texture evolution in bulk deformation processing of FCC metals. J. Mech. Phys. Solids 1992, 40, 537–569. [Google Scholar] [CrossRef]
- Kalidindi, S.R.; Anand, L. An approximate procedure for predicting the evolution of crystallographic texture in bulk deformation processing of fcc metals. Int. J. Mech. Sci. 1992, 34, 309–329. [Google Scholar] [CrossRef]
- Zhou, Y.; Neale, K.W.; Tóth, L.S. A modified model for simulating latent hardening during the plastic deformation of rate-dependent FCC polycrystals. Int. J. Plast. 1993, 9, 961–978. [Google Scholar] [CrossRef]
- Kitayama, K.; Tomé, C.N.; Rauch, E.F.; Gracio, J.J.; Barlat, F. A crystallographic dislocation model for describing hardening of polycrystals during strain path changes. Application to low carbon steels. Int. J. Plast. 2013, 46, 54–69. [Google Scholar] [CrossRef]
- Rauch, E.F.; Gracio, J.J.; Barlat, F.; Vincze, G. Modelling the plastic behaviour of metals under complex loading conditions. Model. Simul. Mater. Sci. Eng. 2011, 19, 035009. [Google Scholar] [CrossRef]
- Wen, W.; Borodachenkova, M.; Tomé, C.N.; Vincze, G.; Rauch, E.F.; Barlat, F.; Grácio, J.J. Mechanical behavior of Mg subjected to strain path changes: Experiments and modeling. Int. J. Plast. 2015, 73, 171–183. [Google Scholar] [CrossRef] [Green Version]
- Wen, W.; Borodachenkova, M.; Tomé, C.N.; Vincze, G.; Rauch, E.F.; Barlat, F.; Grácio, J.J. Mechanical behavior of low carbon steel subjected to strain path changes: Experiments and modeling. Acta Mater. 2016, 111, 305–314. [Google Scholar] [CrossRef] [Green Version]
- Tomé, C.N.; Lebensohn, R.A. Manual for Code Visco-Plastic Self-Consistent (VPSC), Version 7d; Los Alamos National Laboratory: Los Alamos, NM, USA, 2018.
- Bachmann, F.; Hielscher, R.; Schaeben, H. Texture analysis with MTEX- Free and open source software toolbox. Solid State Phenom. 2010, 160, 63–68. [Google Scholar] [CrossRef] [Green Version]
- Tome, C.; Canova, G.R.; Kocks, U.F.; Christodoulou, N.; Jonas, J.J. The relation between macroscopic and microscopic strain hardening in F.C.C. polycrystals. Acta Metall. 1984, 32, 1637–1653. [Google Scholar] [CrossRef]
- Inoue, H.; Takasugi, T. Texture control for improving deep drawability in rolled and annealed aluminum alloy sheets. Mater. Trans. 2007, 48, 2014–2022. [Google Scholar] [CrossRef] [Green Version]
- Wang, K.; Li, J.; Stoughton, T.B.; Carsley, J.E.; Carlson, B.E. Effect of preform annealing on plastic anisotropy of an age-hardenable Al-Mg-Si alloy. J. Mater. Process. Technol. 2018, 252, 381–388. [Google Scholar] [CrossRef]
- Kasemer, M.; Falkinger, G.; Roters, F. A numerical study of the influence of crystal plasticity modeling parameters on the plastic anisotropy of rolled aluminum sheet. Model. Simul. Mater. Sci. Eng. 2020, 28, 085005. [Google Scholar] [CrossRef]
- Kim, K.-H.H.; Lee, D.N. Analysis of deformation textures of asymmetrically rolled aluminum sheets. Acta Mater. 2001, 49, 2583–2595. [Google Scholar] [CrossRef]
- Kang, S.B.; Min, B.K.; Kim, H.W.; Wilkinson, D.S.; Kang, J. Effect of asymmetric rolling on the texture and mechanical properties of AA6111-aluminum sheet. Metall. Mater. Trans. A Phys. Metall. Mater. Sci. 2005, 36, 3141–3149. [Google Scholar] [CrossRef]
- Sidor, J.; Miroux, A.; Petrov, R.; Kestens, L. Controlling the plastic anisotropy in asymmetrically rolled aluminium sheets. Philos. Mag. 2008, 88, 3779–3792. [Google Scholar] [CrossRef]
- Lee, J.K.; Lee, D.N. Shear texture development and grain refinement in asymmetrically rolled aluminum alloy sheets by varied reduction per pass. In Materials Science Forum; Trans Tech Publications Ltd.: Freienbach, Switzerland, 2002; Volume 408–412, pp. 1419–1424. [Google Scholar]
- Lee, J.-K.; Lee, D.N. Texture control and grain refinement of AA1050 Al alloy sheets by asymmetric rolling. Int. J. Mech. Sci. 2008, 50, 869–887. [Google Scholar] [CrossRef]
- Sidor, J.; Miroux, A.; Petrov, R.; Kestens, L. Microstructural and crystallographic aspects of conventional and asymmetric rolling processes. Acta Mater. 2008, 56, 2495–2507. [Google Scholar] [CrossRef]
- Van Houtte, P.; Kanjarla, A.K.; Van Bael, A.; Seefeldt, M.; Delannay, L. Multiscale modelling of the plastic anisotropy and deformation texture of polycrystalline materials. Eur. J. Mech. A/Solids 2006, 25, 634–648. [Google Scholar] [CrossRef]
- Van Houtte, P.; Li, S.; Seefeldt, M.; Delannay, L. Deformation texture prediction: From the Taylor model to the advanced Lamel model. Int. J. Plast. 2005, 21, 589–624. [Google Scholar] [CrossRef]


| Si | Fe | Cu | Mn | Mg | Ni | Cr | Zn | Ti | Others |
|---|---|---|---|---|---|---|---|---|---|
| 0.59 | 0.48 | 0.25 | 0.11 | 0.94 | 0.00 | 0.23 | 0.11 | 0.10 | 0.15 |
| 55.5 | 80.0 | 450.0 | 0.8 |
| Constants | Values |
|---|---|
| (Elastic shear modulus) | 24.0 GPa |
| b (Burgers vector) | 2.86 × 10⁻¹⁰ |
| D (Grain size) | 10 μm |
| (Initial CRSS) | 55 MPa |
| K (Mobile to storage parameter) | 67 |
| f (Recombination parameter) | 4 |
| (Lower reversibility threshold) | 1.0 × 10¹² |
| (Lower reversibility threshold) | 7.0 × 10¹⁴ |
| (Back-stress parameter) | 0.5 |
| q (Back-stress parameter) | 2 |
| m (Recombination rate parameter) | 0.3 |
| (Dislocation–dislocation interaction) | 0.81 (S = S′) 0.60 (S ≠ S′) |
| Thickness Reduction (ND) | ||
|---|---|---|
| Simulation Processes Parameters | 20% | 30% |
| ≈0.2 | ≈0.36 | |
| ±0.6 | ±0.35 | |
| ±1.05 | ±0.6 | |
| Hardening Models | |||||
|---|---|---|---|---|---|
| Voce-Type | DDR | ||||
| Test | Pass No. | ||||
| Initial | 0 | 0.6525 | 0.165 | 0.6525 | 0.165 |
| CR | 1 | 0.6775 | 0.135 | 0.7475 | 0.175 |
| 2 | 0.7575 | 0.035 | 0.815 | 0.07 | |
| 3 | 0.8625 | 0.075 | 0.9175 | 0.045 | |
| 4 | 0.995 | 0.17 | 1.0325 | 0.155 | |
| ASR-C (SH1) | 1 | 0.6775 | 0.115 | 0.7325 | 0.145 |
| 2 | 0.76 | 0.02 | 0.8125 | 0.005 | |
| 3 | 0.8875 | 0.205 | 0.925 | 0.19 | |
| 4 | 1.0375 | 0.405 | 1.075 | 0.39 | |
| ASR-R (SH1) | 2 | 0.705 | 0.09 | 0.7575 | 0.115 |
| 3 | 0.795 | 0.03 | 0.8375 | 0.005 | |
| 4 | 0.8975 | 0.065 | 0.9325 | 0.055 | |
| ASR-C (SH2) | 1 | 0.6675 | 0.055 | 0.7125 | 0.065 |
| 2 | 0.765 | 0.25 | 0.805 | 0.23 | |
| 3 | 0.93 | 0.64 | 0.9625 | 0.615 | |
| 4 | 1.1525 | 1.055 | 1.18 | 1.06 | |
| ASR-R (SH2) | 2 | 0.5875 | 0.155 | 0.6175 | 0.135 |
| 3 | 0.565 | 0.07 | 0.59 | 0.06 | |
| 4 | 0.445 | 0.05 | 0.465 | 0.07 | |
| Hardening Models | |||||
|---|---|---|---|---|---|
| Voce-Type | DDR | ||||
| Test | Pass No. | ||||
| Initial | 0 | 0.6525 | 0.165 | 0.6525 | 0.165 |
| CR | 1 | 0.7325 | 0.065 | 0.8 | 0.1 |
| 2 | 0.9425 | 0.135 | 0.985 | 0.11 | |
| ASR-C (SH1) | 1 | 0.7425 | 0.065 | 0.8 | 0.1 |
| 2 | 0.9475 | 0.125 | 0.9925 | 0.115 | |
| ASR-R (SH1) | 2 | 0.925 | 0.09 | 0.9675 | 0.065 |
| ASR-C (SH2) | 1 | 0.7375 | 0.015 | 0.79 | 0.04 |
| 2 | 0.9775 | 0.325 | 1.015 | 0.31 | |
| ASR-R (SH2) | 2 | 0.905 | 0.09 | 0.9275 | 0.065 |
| Euler Angles (Bunge) (°) | |||||
|---|---|---|---|---|---|
| Component Name | φ1 | Φ | φ2 | {hkl}<uvw> | |
| Deformation | Brass (Br) | 35 | 45 | 0 | {011}<211> |
| S | 55 | 35 | 65 | {123}<634> | |
| Copper (Cu) | 90 | 30 | 45 | {112}<111> | |
| Dillamore (D) | 90 | 27 | 45 | {4411}<11118> | |
| Shear | Rotated Cube (RC) | 0 | 0 | 45 | {001}<110> |
| E | 0 | 55 | 45 | {111}<112> | |
| F | 90 | 55 | 45 | {111}<110> | |
| I | 0 | 35 | 45 | {112}<110> | |
| Recrystallization | Goss | 0 | 45 | 0 | {011}<001> |
| Cube | 0 | 0 | 0 | {001}<100> | |
| Rotated Cube RD1 (RCRD1) | 0 | 20 | 0 | {013}<100> | |
| Rotated Cube RD2 (RCRD2) | 0 | 35 | 0 | {023}<100> | |
| Rotated Cube ND1 (RCND1) | 20 | 0 | 0 | {001}<310> | |
| Rotated Cube ND2 (RCND2) | 35 | 0 | 0 | {001}<320> | |
| P | 70 | 45 | 0 | {011}<122> | |
| Q | 55 | 20 | 0 | {013}<231> | |
| R | 55 | 75 | 25 | {124}<211> | |
Publisher’s Note: MDPI stays neutral with regard to jurisdictional claims in published maps and institutional affiliations. |
© 2022 by the authors. Licensee MDPI, Basel, Switzerland. This article is an open access article distributed under the terms and conditions of the Creative Commons Attribution (CC BY) license (https://creativecommons.org/licenses/by/4.0/).
Share and Cite
Graça, A.; Vincze, G.; Wen, W.; Butuc, M.C.; Lopes, A.B. Numerical Study on Asymmetrical Rolled Aluminum Alloy Sheets Using the Visco-Plastic Self-Consistent (VPSC) Method. Metals 2022, 12, 979. https://doi.org/10.3390/met12060979
Graça A, Vincze G, Wen W, Butuc MC, Lopes AB. Numerical Study on Asymmetrical Rolled Aluminum Alloy Sheets Using the Visco-Plastic Self-Consistent (VPSC) Method. Metals. 2022; 12(6):979. https://doi.org/10.3390/met12060979
Chicago/Turabian StyleGraça, Ana, Gabriela Vincze, Wei Wen, Marilena C. Butuc, and Augusto B. Lopes. 2022. "Numerical Study on Asymmetrical Rolled Aluminum Alloy Sheets Using the Visco-Plastic Self-Consistent (VPSC) Method" Metals 12, no. 6: 979. https://doi.org/10.3390/met12060979