Article

Deformation Rate and Temperature Sensitivity in TWIP/TRIP VCrFeCoNi Multi-Principal Element Alloy

1
Department of Mechanical Engineering, American University of Sharjah, Sharjah P.O. Box 26666, United Arab Emirates
2
Department of Physics, American University of Sharjah, Sharjah P.O. Box 26666, United Arab Emirates
3
Department of Mechanical Engineering, Politecnico di Milano, via La Masa 1, 20156 Milano, Italy
*
Author to whom correspondence should be addressed.
Metals 2022, 12(9), 1510; https://doi.org/10.3390/met12091510
Submission received: 10 August 2022 / Revised: 6 September 2022 / Accepted: 7 September 2022 / Published: 13 September 2022
(This article belongs to the Special Issue Design and Mechanical Behavior of Martensitic Alloys)

Abstract

:
High-entropy alloys (HEAs) and medium-entropy alloys (MEAs), also sometimes referred to as multi-principal element alloys (MPEAs), present opportunities to develop new materials with outstanding mechanical properties. Through the careful selection of constituent elements along with optimized thermal processing for proper control of structure, grain size, and deformation mechanisms, many of the newly developed HEA systems exhibit superior strength and ductility levels across a wide range of temperatures, particularly at cryogenic deformation temperatures. Such a remarkable response has been attributed to the hardening capacity of many MPEAs that is achieved through the activation of deformation twinning. More recent compositions have considered phase transforming systems, which have the potential for enhanced strengthening and therefore high strength and ductility levels. However, the strain rate sensitivity of such transforming MPEAs is not well understood and requires further investigation. In this study, the tensile properties of the non-equiatomic V10Cr10Fe45Co30Ni5 MPEA were investigated at different deformation rates and temperatures ranging from 77 K (−196 °C) to 573 K (300 °C). Depending on the deformation temperature, the considered MPEA exhibits plasticity through either crystallographic slip, deformation twinning, or solid-state phase transformation. At 300 °C, only slip-mediated plasticity was observed for all the considered deformation rates. Deformation twinning was detected in samples deformed at room temperature, while face-centered cubic to body-centered cubic phase transformation became more favorable at cryogenic deformation temperatures. The trends are nonlinear with twinning-induced plasticity (TWIP) favored at the intermediate deformation rate, while transformation-induced plasticity (TRIP) was observed, although limited, only at the slowest deformation rate. For all the considered deformation rates at cryogenic deformation temperature, a significant TRIP activity was always detected. The extent of TRIP, however, was dependent on the deformation rate. Increasing the deformation rate is not conducive to TRIP and thus hinders the hardening capacity.

1. Introduction

The need to develop new materials with enhanced properties has fueled major research activities to overcome existing limitations. Metals and metallic alloys are of particular importance due to their desirable properties and wide use in practical applications [1]. Although engineering properties through composition control and heat treatment has been well-practiced for hundreds of years, significant developments and advancements were enabled in the last century through an enhanced and deeper understanding of the microstructural features and deformation mechanisms that control the material response. Various systems with enhanced and superior properties were developed: for example, Ni-based super-alloys that are optimized for high-temperature applications [2], Maraging steels which exhibit high strength and toughness levels [3], twinning-induced [4,5,6,7,8], and transformation-induced plasticity steels [9] (TWIP and TRIP) where high strength and ductility levels are attained through the additional hardening introduced through the activation of these two important deformation mechanisms [10]. Generally speaking, the use of a single principal element, in addition to alloying elements at lower percentages, has been the common alloy design methodology in the aforementioned systems and in virtually all structural alloys. Despite the notable advances made utilizing this alloying principle, recent efforts have ventured outside these well-established guidelines in an attempt to achieve new alloy systems with superior properties [11].
The recent development of high-entropy alloys (HEAs) and medium-entropy alloys (MEAs), also known as multi-principal element alloys (MPEAs), has challenged the well-known alloy design principle, which relies on the use of predominantly a single alloying element [12,13,14,15,16,17,18,19,20,21,22,23,24,25,26]. A wide range of and resulting crystal structures have been reported, including FCC (Face-Centered-Cubic), BCC (Body-Centered-Cubic), HCP (Hexagonal Close-Packed), or a mixture of them [11,17,27,28,29,30]. The earlier compositions, sometimes referred to as first-generation HEAs, were focused on single-phase structures. However, more recent works have also considered compositions with dual or multi-phase microstructures, also known as the second generation of HEAs. Various MPEAs show exceptional fatigue and fracture resistance with high strength and ductility at cryogenic temperatures. For example, the well-known and heavily investigated HEA, equiatomic CoCrFeMnNi, also referred to as the Cantor alloy [31,32,33,34,35], exhibits exceptional strength, ductility, and toughness levels, all at the same time at low temperatures (e.g., 77 K or liquid nitrogen temperature). The MEA systems of CoCrNi [36,37,38,39,40,41,42,43,44,45] and CoVNi [46] have also shown exceptional mechanical properties across a wide range of temperatures, including cryogenic. Such desirable properties have been linked to the high strain-hardening capacity in these systems enabled by mechanical twinning, which delays the onset of necking and allows for excellent ductility.
Revealing the fundamental reasons for the remarkable mechanical properties of HEAs and MEAs has been the subject of many studies. In this regard, the staking fault energy (SFE) has seen to play a major role in influencing the deformation mechanism [47]. As the SFE decreases, the plasticity mechanism changes from dislocation glide to dislocation glide in conjunction with twinning and phase transformation [48,49,50]. TWIP and TRIP are observed in many alloys including high-Mn TRIP and TWIP steels [7,9]. Many MPEAs show TWIP at cryogenic temperatures, which explains the enhanced ductility. Some of the newly developed HEAs exhibit combined TWIP and TRIP effects, depending on the deformation temperature. The activation of twinning and/or phase transformation during plastic deformation enables additional hardening, increases strength levels, and eventually results in enhanced ductility. The FCC-HCP transforming compositions comprise the majority of MPEs exhibiting TRIP (e.g., Fe40Mn40Co10Cr10, Cr20Mn24Fe30Co20Ni6, and Cr20Mn15Fe34Co20Ni11) [35,51,52]. In addition to the FCC-HCP TRIP alloys, unique and interesting FCC-BCC TRIP HEAs have recently been reported for a limited number of compositions. For instance, the non-equiatomic Fe45Co30Cr10V10Ni5-xMnx (x = 0, 2.5, and 5 at.%) HEA and more recently the V10Fe45Co30Cr10Ni5 alloy both exhibited FCC-BCC TRIP effect at cryogenic temperatures [10,53,54,55,56,57]. It should be emphasized here that the FCC to BCC martensitic transformation that dominated the response at cryogenic temperatures took place while still maintaining high ductility levels, despite the presence of the BCC phase. In comparison, most of the reported HEAs with BCC structure (e.g., AlCoCrFeNi HEA) and some refractory HEA (Nb25Mo25Ta25W25 and V20Nb20Mo20Ta20W20) generally exhibited inferior ductility compared to their FCC counterpart (e.g., Cantor, CoCrNi, and CoVNi). In addition to temperature, deformation rate also plays a role in dictating the dominant deformation mechanism. For example, changing the deformation rate from quasi-static (10×−3/s) to dynamic (10×3/s) rate causes a reduction of TRIP and an increase of TWIP at both room and cryogenic temperatures in V10Cr10Fe45Co30Ni5 HEA [56]. Understanding the hardening effects associated with introducing the BCC phase and its temperature and deformation rate dependance is important to optimize the mechanical properties of these alloys and assist in the efforts aimed to resolve the ductility issues in BCC HEAs in general.
As discussed above, the resulting mechanical properties and the underlying deformation mechanisms are strongly dependent on the deformation temperature and strains rate. Such effects are amplified in the case of TWIP and TRIP and can therefore lead to significantly different responses compared to slip-dominated materials. Other factors, including grain size [53], composition [48,54], and crystal structure [58], are also known to influence the mechanical properties, including the strain rate sensitivity. In the case of the recently developed VCrFeCoNi, which again exhibits interesting TWIP/TRIP effects with a unique FCC to BCC transformation, studies conducted at cryogenic and room temperatures, both quasi-static and dynamic loading conditions, revealed pronounced strain rate sensitivity. However, only a limited number of rates were considered. As this work will show, the strain-rate dependence is more complex and exhibits nonlinear dependence with intermediate deformation rates, potentially resulting in higher strength levels compared to higher deformation rates. In addition, the effect of deformation temperature is also explored from cryogenic to elevated temperatures. It is generally expected that increasing the deformation rates is more conducive to TWIP. Nevertheless, such relation is also dependent on the strain rate and exhibits a nonlinear relation (e.g., intermediate rates showing higher levels of TWIP than higher rates). This work aims to shed further quantitative insight into these aspects, focusing on the resulting mechanical properties and the changes in the dominant deformation mechanisms at different deformation temperatures and rates.

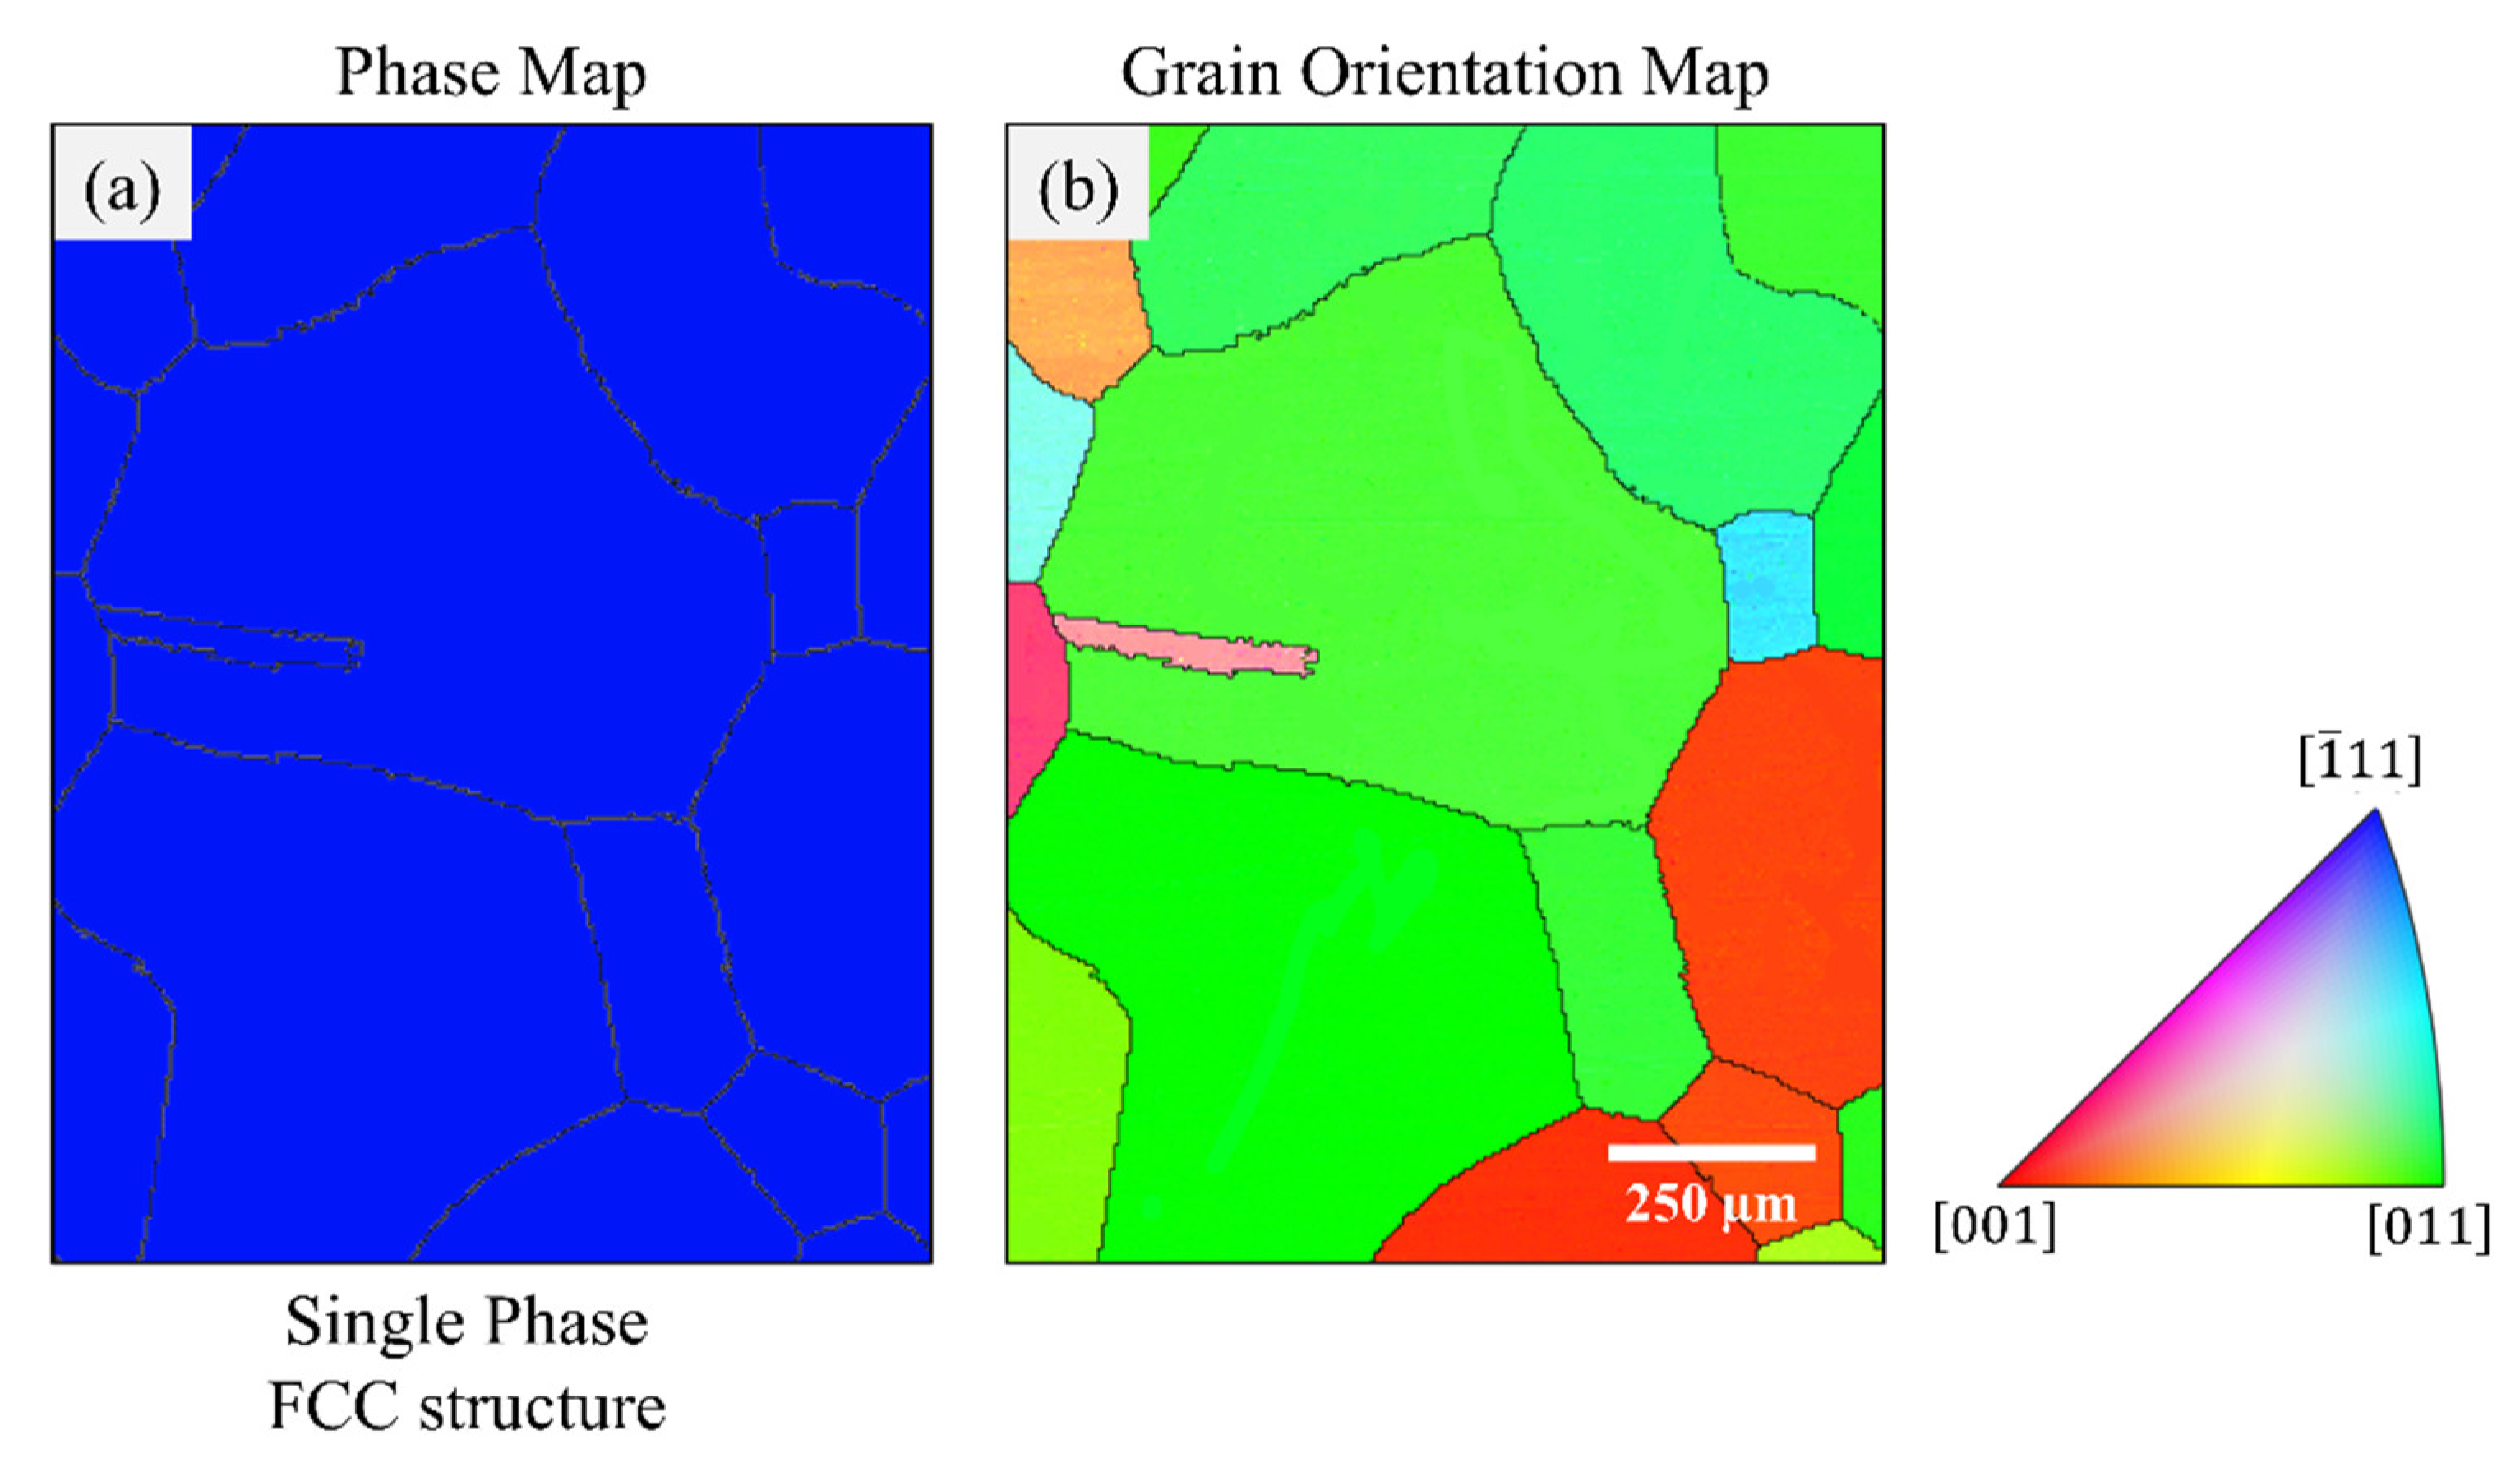
2. Materials and Methods

An HEA ingot with a non-equiatomic composition of V10Fe45Co30Cr10Ni5 (at.%) was prepared by arc melting using pure elements (purity >99.5 wt.%). Following casting, the ingot was homogenized at 1200 °C for 24 h in an Argon atmosphere. For proper control of grain size, 3 mm thick sheets were machined from the homogenized ingot and subsequently cold rolled to a final thickness of 1.1 mm (i.e., 65.5% CW). Dog-bone-shaped tensile samples with a gauge length of 8 mm, a cross-section width of 3 mm, and a thickness of 1.1 mm were machined from the rolled sheets. Prior to loading, all samples were heat-treated at 1050 °C for 20 min, followed by water quenching. To prevent oxidation during the high temperature solution treatment, samples were encapsulated in quartz tubes with an inert Ar atmosphere. The resulting microstructure following homogenization was characterized using energy dispersive spectroscopy (EDS—Oxford Instruments, Abingdon, UK), X-ray diffraction (XRD—Malvern Panalytical X’pert3 powder X-ray diffraction, Malvern, UK), and electron-backscatter diffraction (EBSD—Oxford Instruments, Abingdon, UK).
Figure 1 show the EDS and XRD results collected from a solution-treated sample (not rolled). The elemental maps presented in Figure 1a point to a homogeneous composition with no segregation. The resulting chemical composition is summarized in Figure 1b. The XRD data reported in Figure 1c reveal a single-phase FCC structure. This was further confirmed using EBSD, as noted from the phase map presented in Figure 2a. The EBSD grain orientation map shown in Figure 2b was collected prior to rolling and shows a relatively large grain size and a non-ideal grain size distribution.
Following homogenization, rolling, and solution treatment, the microstructure exhibited mainly an FCC crystal structure along with potentially some limited BCC regions (Figure 3a). The grain size and distribution were (Figure 3b) finer and more homogeneous compared to the results obtained from non-rolled specimens (Figure 2). All the reported mechanical properties assessed were obtained from specimens that had the same initial microstructure as reported in Figure 3.
Tensile experiments were conducted at different temperatures and deformation rates using a universal testing machine equipped with an environmental chamber (Instron, Norwood, MA, USA). Three different strain rates were considered, 1.32 × 10⁻³/s (1 mm/min. crosshead speed), 0.66/s (500 mm/min crosshead speed), and 1.32/s (1000 mm/min, which is the maximum achievable speed in the utilized setup). For each strain rate, specimens were tested at room temperature (RT, 293 K), cryogenic temperature 77 K, and a high temperature of 573 K (the maximum attainable temperature for the utilized environmental chamber). The considered conditions are explained schematically in Figure 4. For the RT experiments, optical images were captured during deformation using a high-resolution camera connected to VIC-snap with a capture rate of 1 image per 500 ms (milliseconds). VIC-2D 6 commercial software from Correlated Solutions (Irmo, SC, USA) was used to measure the displacement fields and calculate the associated strains. During the tests at 77 K, the specimen along with the grips were submerged in a liquid nitrogen (LN) bath and soaked for about 5 min prior to load application. For the experiments conducted at 300 °C, an environmental chamber was utilized for heating. The loading was initiated after a 20 min soaking time at 300 °C. For each of the considered conditions, at least three samples were tested.

3. Results and Discussion

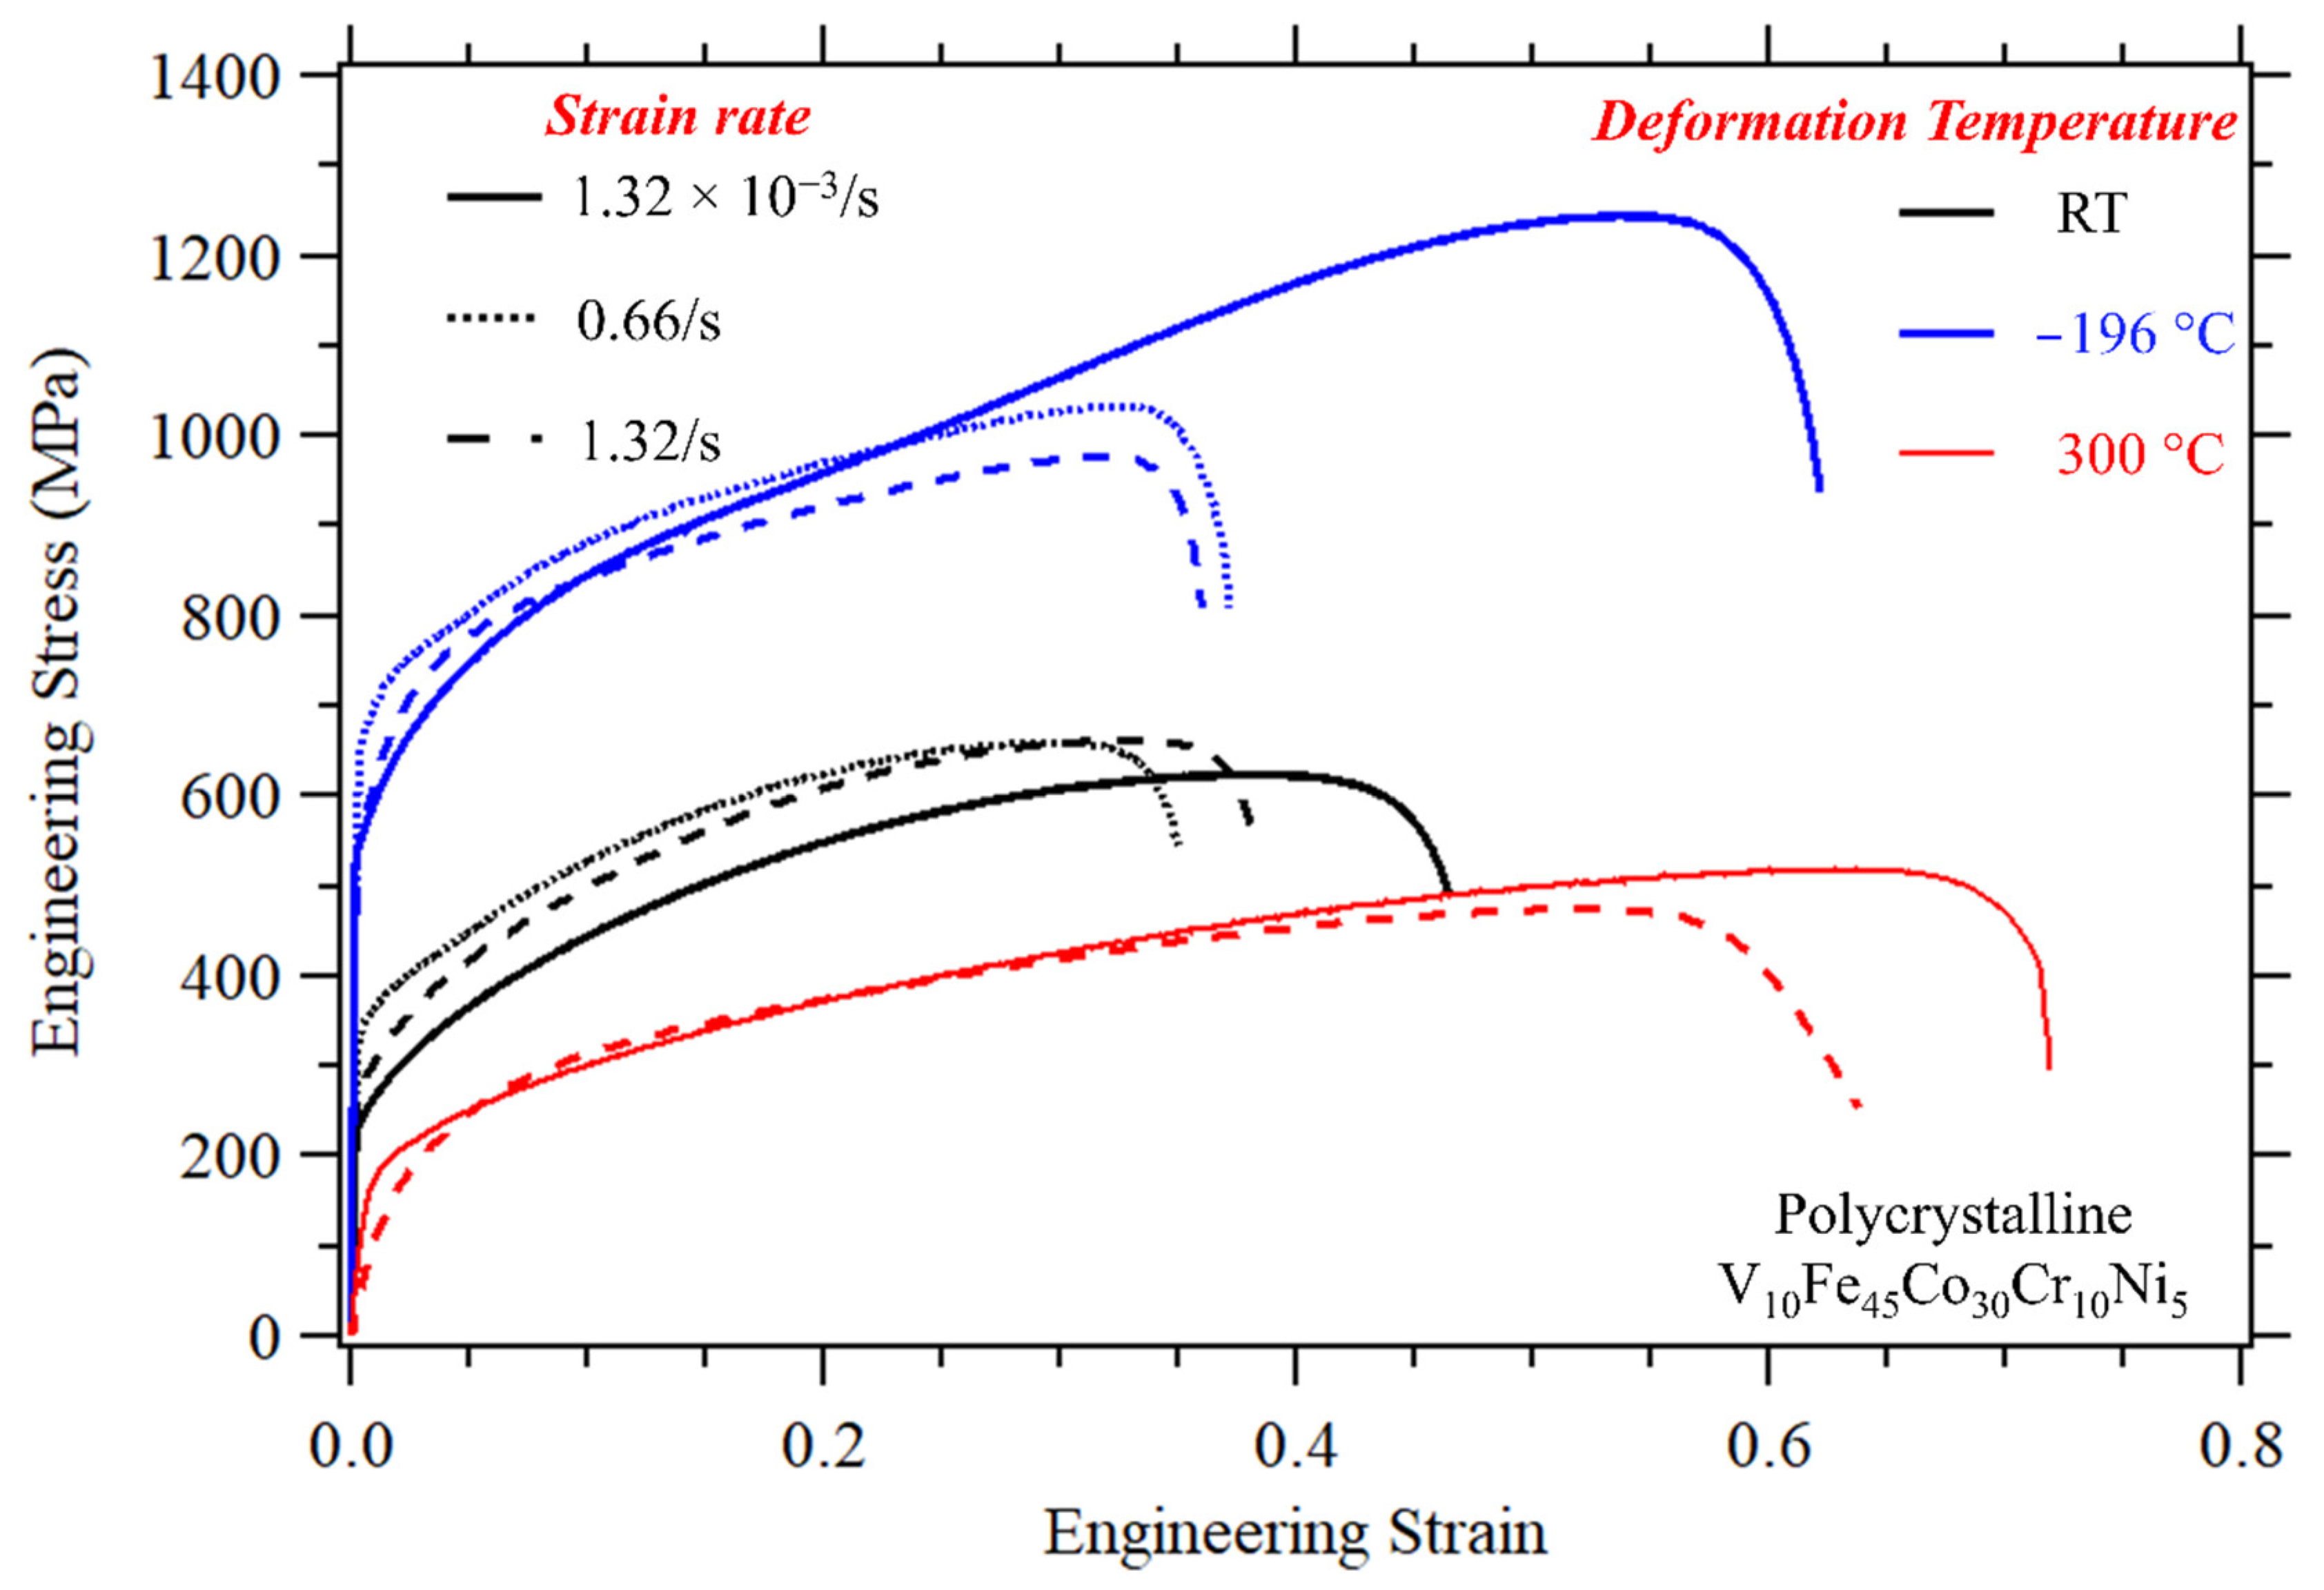
3.1. Tensile Mechanical Properties

As explained above, three different deformation temperatures and strain rates were considered in this study. For each condition, three different specimens were loaded in tension. Representative engineering stress-strain curves are shown in Figure 5, one for each of the considered deformation temperatures and strain rates. Considering the response at RT, the results clearly indicate that the highest ductility was achieved at the slowest strain rate of 1.32 × 10⁻³/s. When comparing the yield strength (0.2% offset) obtained from the different deformation rates at RT, a linear correlation between the deformation rate and the resulting yield strength was not observed. The highest yield strength was measured at the intermediate rate (0.66/s) with slower (1.32 × 10⁻³/s) and faster rates (1.32/s), resulting in lower yield strengths. For the ultimate tensile strength (UTS), the attained strength levels did not differ significantly at different deformation rates (all RT). It should be noted here that in all of the considered specimens, increasing the deformation strain rate to either 0.66/s or 1.32/s resulted in reduced ductility. However, the percentage in ductility reduction was dependent on the deformation temperature, with the largest drop observed at 77 K.
Decreasing the deformation temperature to 77 K (blue curves) resulted in a significant increase in both strength and ductility. The effect was more pronounced at the slow deformation rate of 1.32 × 10⁻³/s, which resulted in the highest strength levels in all of the considered conditions with superior ductility. Similar to the results obtained at RT, the highest yield strength at 77 K was again obtained at the intermediate deformation strain rate of 0.66 / s . However, as the ductility differed significantly between the samples tested at 77 K compared to the RT specimens, a large difference in the UTS was also observed. Aided by the high ductility and hardening levels at the 1.32 × 10⁻³/s strain rate, the UTS reached noticeably higher magnitudes (an impressive 1.2 GPa with ductility exceeding 50%).
Increasing the deformation temperature to 300 °C (red curves in Figure 5) resulted in enhanced ductility levels; however, this was accompanied by a significant strength reduction. Due to the limited number of available specimens, only two deformation rates were considered at this temperature. After increasing the strain rate, the expected reduction in ductility was observed consistently across all temperatures. However, unlike the results obtained at RT and 77 K, both the yield strength and UTS dropped compared to the slow strain rate results. This aspect is discussed further in Section 3.2.
Table 1 summarizes the mechanical properties of the studied HEA at all deformation temperatures and strain rates. The samples deformed under cryogenic temperature and a strain rate of 1.32 × 10⁻³/s gave the highest UTS of around 1225 MPa and ductility of 62.2%, while samples deformed under the high temperature of 300 °C and strain rate of 1.32 × 10⁻³/s gave the highest ductility of 71.5%. To further highlight the effects of deformation temperature and strain rate on the obtained mechanical properties, the RT and slow strain rate results were used as control conditions and the relative change in strength and ductility were calculated. The results are presented in the last four columns in Table 2.

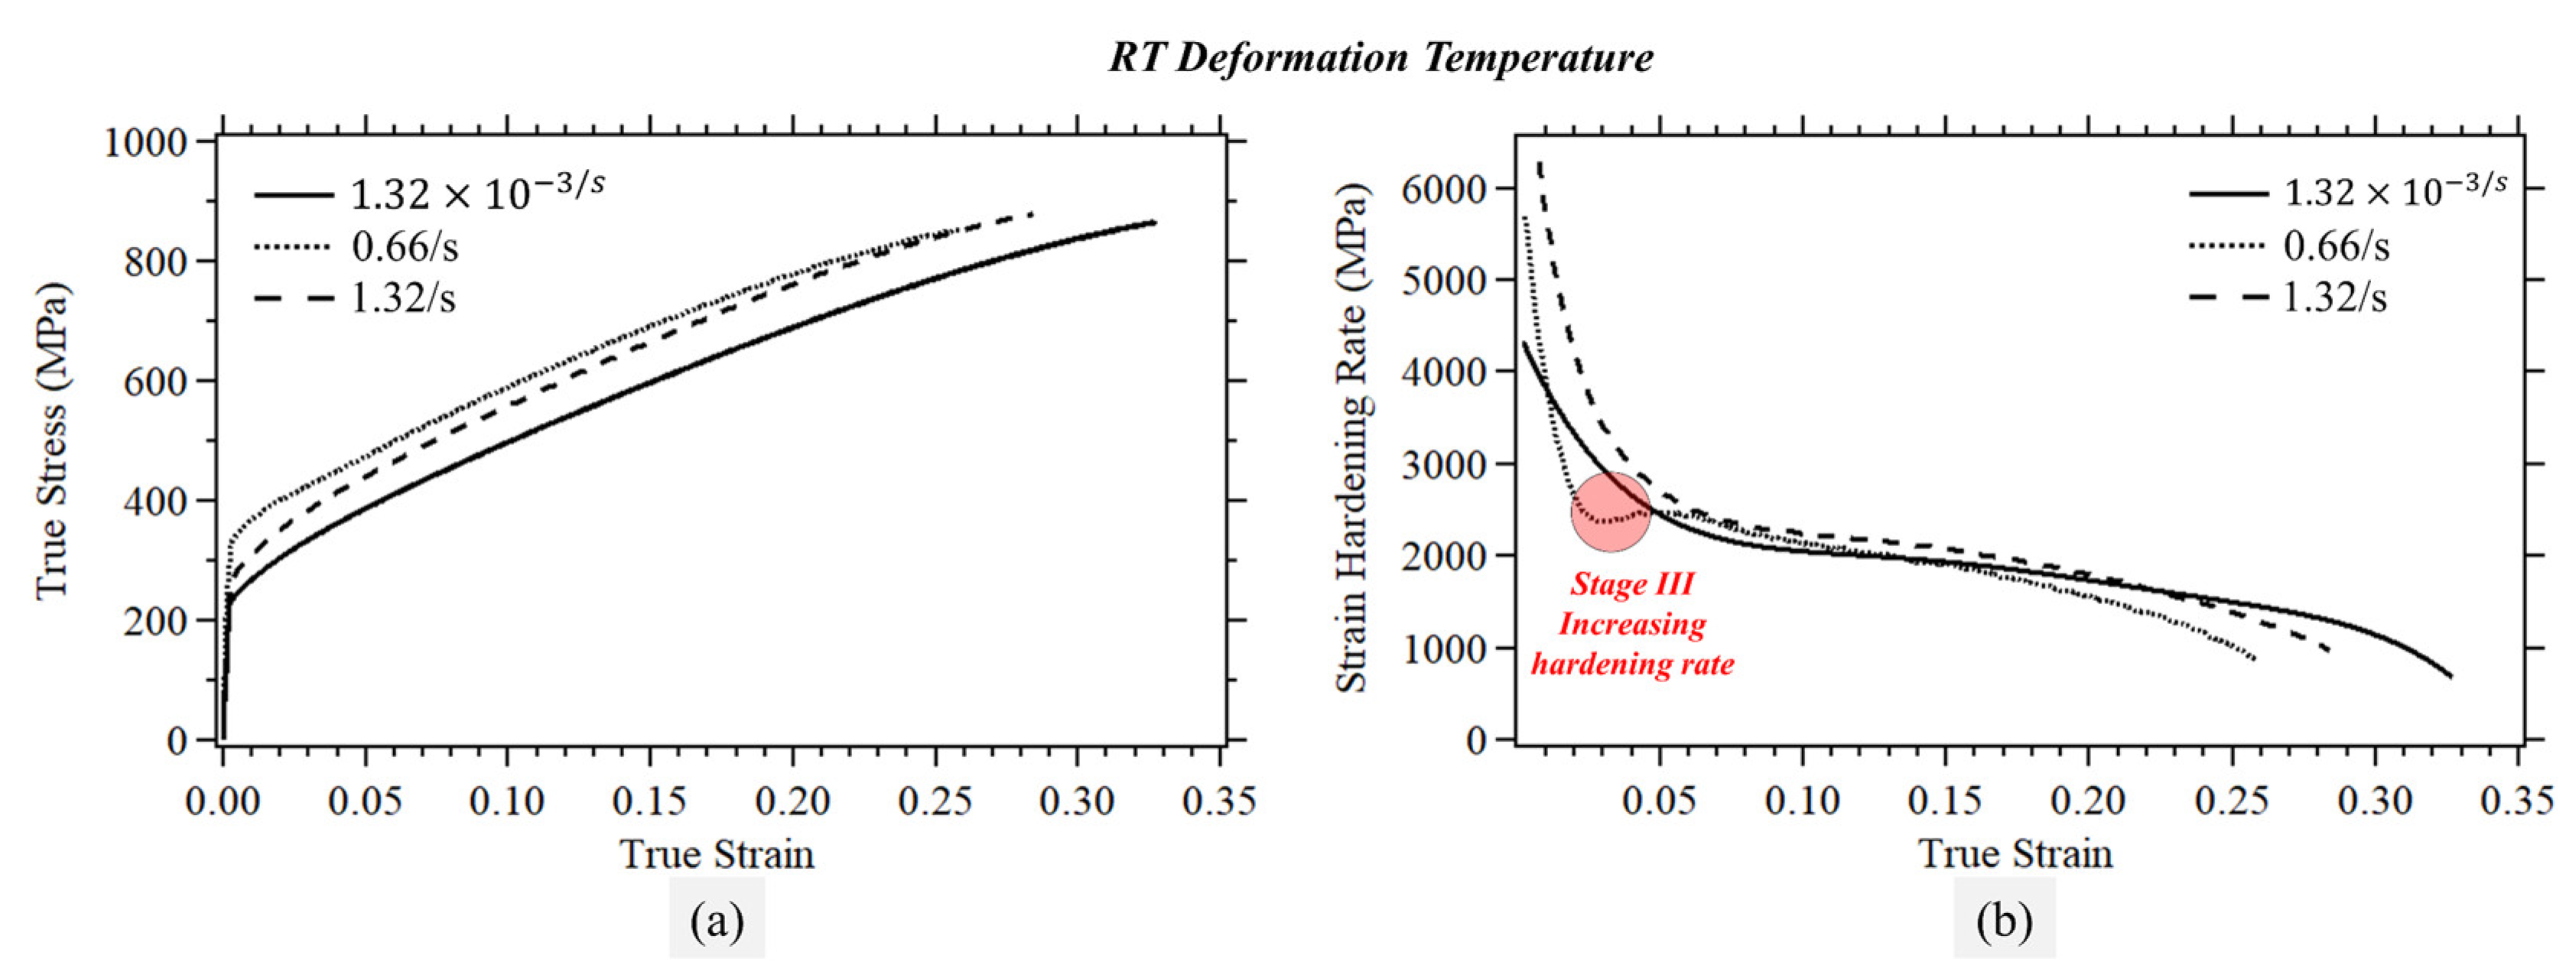
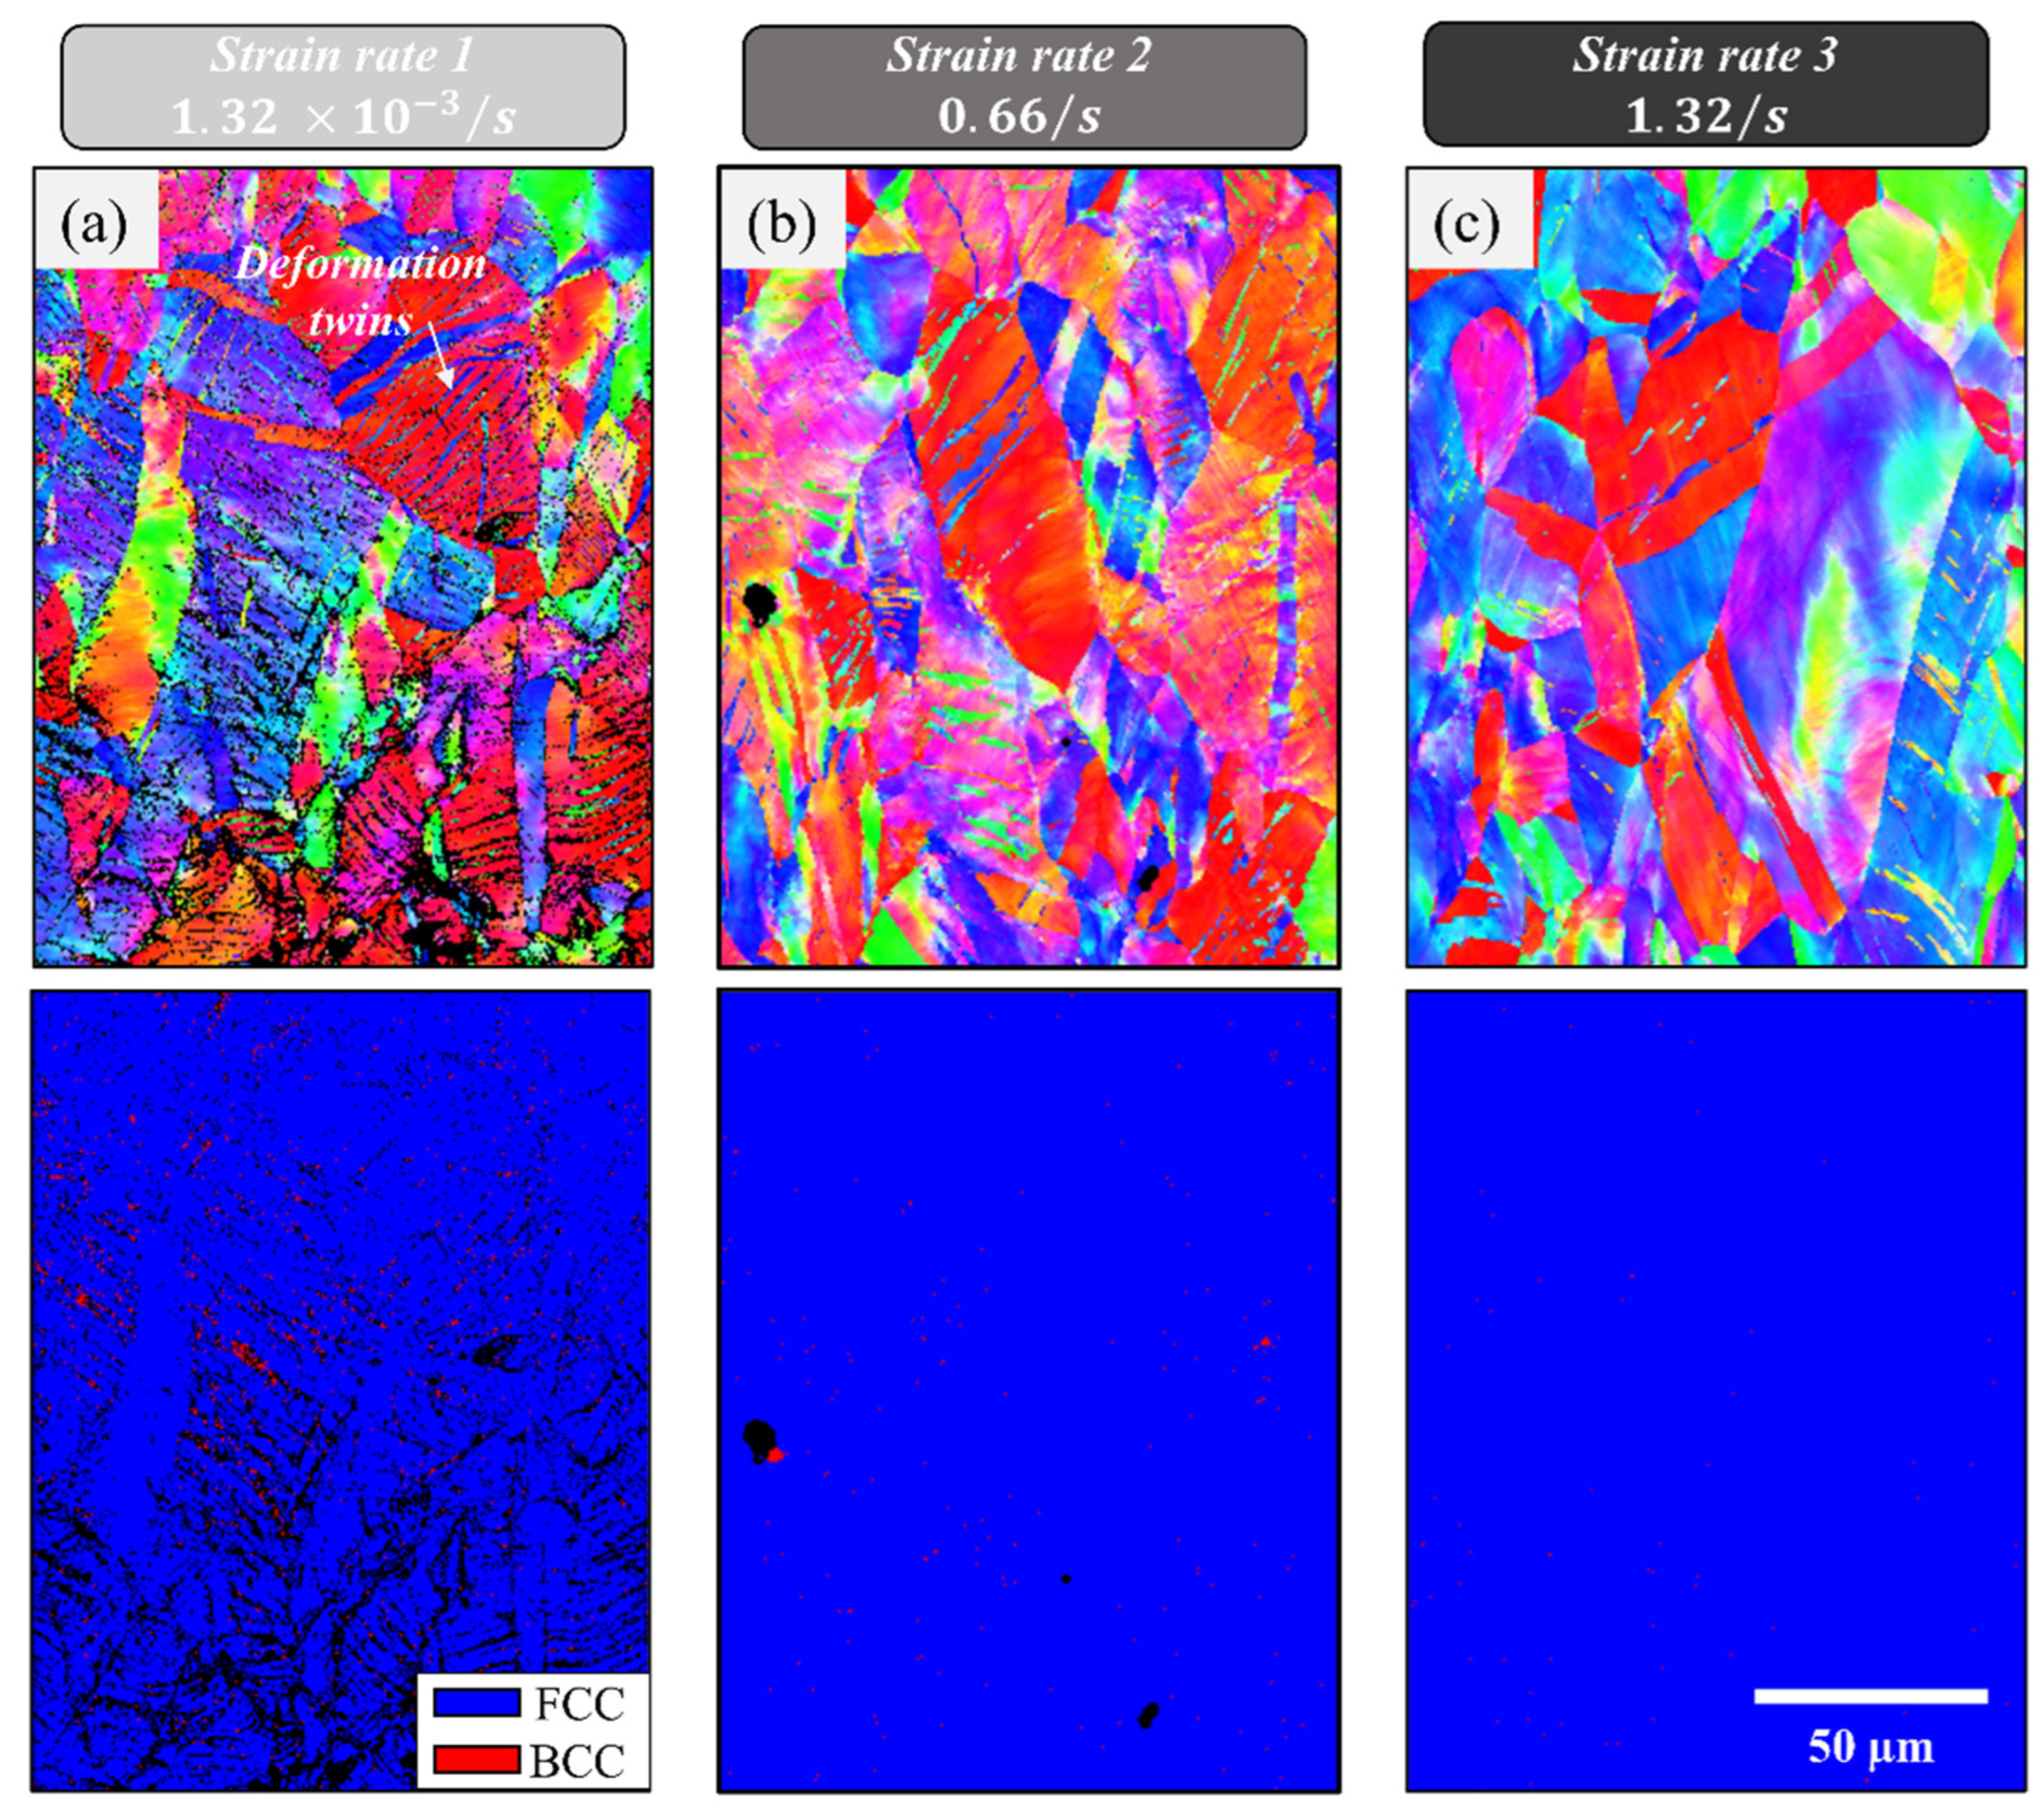
3.2. Strain Hardening—TWIP/TRIP Effects

Strain hardening develops in the material due to plastic strain accumulation. Various aspects influence this phenomenon, including dislocation multiplication and dislocation interface interaction (e.g., grain boundaries and phase boundaries). For example, the TWIP effect introduces additional interfaces (i.e., twin boundaries) that act as obstacles for dislocation motion, increasing strength, and hardening levels. A similar effect takes place in the case of TRIP due to the introduction of phase boundaries [59]. As the investigated material in this study exhibits TWIP and TRIP depending on the deformation temperature [10,56], quantifying the hardening level for the different considered conditions is extremely important. The hardening responses of the investigated samples can be better quantified by calculating the material hardening rates dσ/dε.
Figure 6 shows representative true stress–strain curves with the corresponding strain-hardening rates for the RT deformation conditions. For the 1.32 × 10 3 / s (slowest) and 1.32 / s strain rates (fastest), the hardening rate experienced rapid reduction with deformation (Stage I) followed by a slower decay rate in Stage II. Such a response is typically observed when dislocation glide (i.e., slip) is the dominant deformation mechanism [60]. The corresponding EBSD results shown in Figure 7 point to pronounced slip activity. However, in the case of the slow deformation rate ( 1.32 × 10 3 / s ), very limited TWIP was detected through EBSD, as shown in Figure 7a. In addition, TRIP was also observed, as shown by the small BCC regions in the phase map presented in Figure 7a and Figure 8. TRIP was not detected for the other deformation rates. In previous work on the VCrFeCoNi MPEA, TRIP has also shown strain-rate dependence (secondary effect) in addition to deformation temperature dependence (primary) [56]. It should be emphasized here that the deformation was still dominated by slip with limited transformation at only slower deformation rates. Limited TWIP activity was also seen for the fastest deformation rate ( 1.32 / s ).
The intermediate deformation rate ( 0.66 / s —RT deformation) stands out in this material and exhibits a notably different response compared to the other deformation rates (faster and slower). As shown in Figure 6b, the hardening rate curve shows evidence of Stage III, where the strain-hardening rate increases following Stage II. The presence of this stage is a clear indication of TWIP and/or TRIP effects while its absence points to slip dominance. The increase in hardening rates is attributed to the reduction in slip length due to the additional interfaces generated by TWIP/TRIP. This response is similar to the Hall–Petch effect associated with grain boundary strengthening. The EBSD grain orientation and phase maps presented in Figure 7b and Figure 8 point to a lack of TRIP but significant slip and TWIP activities. Note that the strength levels for this case were higher compared to the other considered deformation rates but with slightly lower ductility (see Figure 5). Clearly, the results presented here for RT deformation highlight the complexity of interactions taking place and affecting the plastic response and activated deformation mechanisms. The trends are nonlinear with TWIP favored at the intermediate deformation rate while TRIP was observed, although limited, only at the slowest deformation rate. All observations and major results for the RT deformation conditions are summarized in Figure 8.
Figure 9 shows fractographs collected from all the specimens deformed at RT. In all cases, ductile dimples can be observed for all the deformation strain rates. However, there are some flat regions marked with arrows which indicate potential failure due to the grain boundary sliding at these conditions. Although all samples show ductile dimples on the fracture surfaces, the 1.32 × 10⁻³/s and 1.32/s deformation rates (i.e., the slowest and fastest) exhibit slightly less fibrous surfaces compared to the features observed for the intermediate strain rate (0.66/s).
Figure 10 shows representative true stress–strain curves with the corresponding strain-hardening rates for the samples loaded at cryogenic temperature (−196 °C-LN). The slowest ( 1.32 × 10 3 / s ) and intermediate deformation rates ( 0.66 / s ) show clear evidence of increased hardening rates (Stage III) following the initial and rapid drop in strain hardening through Stages I and II. Such a response is, again, typical in TWIP/TRIP alloys. The XRD results presented in Figure 11a point to a reduction in the FCC phase volume fraction along with dominance of BCC. This suggests significant TRIP activity, which was further confirmed through EBSD analysis. It should be noted here that the Stage III region, both the strain window where amplification in hardening rates is observed and the attained hardening levels, depends on the deformation rate. The effect is more pronounced for the 1.32 × 10 3 / s case compared to the other strain rates, which explains the significantly higher strength and ductility levels for this condition (i.e., superior strain-hardening capacity). Stage III is relatively limited for the intermediate deformation rate ( 0.66 / s ) and almost absent for the fastest rate. The strength and ductility levels for the 0.66 / s (i.e., the case exhibiting clear Stage III) were higher compared to the 1.32 / s case where Stage III was barley visible. However, the difference was not significant, as shown in Table 1.
The grain orientation and phase maps presented in Figure 11 confirm the significant contribution of TRIP at this deformation temperature. For all the considered deformation rates, a significant volume fraction of the BCC phase was detected. The extent of TRIP (BCC phase) was, however, dependent on the deformation rate. As highlighted in Figure 11b, at the slowest considered deformation rate ( 1.32 × 10 3 / s ), almost the entire sample transformed to BCC. The significant TRIP in this case allowed for pronounced hardening (Figure 10b) and consequently, superior strength and ductility levels, the best among all the considered samples. For the other deformation rates, both exhibited significant TRIP, with the sample deformed at the fastest rate ( 1.32 / s ) showing slightly less BCC volume fraction compared to the sample deformed at the intermediate rate of 0.66 / s (63% compared to 71% BCC volume fraction). Clearly, increasing the deformation rate is not conducive to TRIP and thus hinders the hardening capacity. Jo et al. also observed a significant reduction in the BCC volume fraction (almost 50% reduction) at an ultra-high deformation rate of 1500 / s compared to quasi-static loading conditions [56]. The results presented in this study highlight that even at slower deformation rates, a significant impact and hindrance of TRIP can be expected in this material system. As detailed above in Figure 5 and Table 1, this adversely impacts the resulting mechanical properties in terms of strength and ductility levels. A summary of the observations and major results for the cryogenic deformation temperature conditions is shown in Figure 12.
Figure 13 shows fractographs collected from all the specimens deformed at −196 °C. Similar to the specimens deformed at RT and due to the ductile nature of the considered MPEA, ductile dimples can be observed for all the deformation strain rates. However, the fracture surfaces for the cryogenic deformation temperature are more fibrous, exhibiting smaller dimples at a higher density, which is not surprising, given the higher strength levels observed in this case. This is particularly obvious for the slowest deformation rate, which, as explained above, exhibited the highest strength and ductility levels due to extensive TRIP.
As for the elevated temperature conditions, Figure 14 shows representative true stress-strain curves with the corresponding strain-hardening rates. Only two deformation rates are shown here due to a limited number of available specimens. Compared to either the RT or cryogenic deformation temperatures, the cases presented here exhibit no signs of Stage III, which suggests slip dominance and absence of either TRIP (unlikely given limited TRIP observation even at RT) or TWIP. Increasing the deformation temperatures reduces slip resistance with generally limited impact on the critical resolved shear stress to initiate deformation twinning. However, it should be noted here that deformation rate also impacts the tendency of the material to deform by twinning. Unfortunately, this was not possible to examine in this study, but is an objective that is worthy of further investigation.
The EBSD grain orientation and phase maps shown in Figure 15 confirm slip dominance and the absence of large-scale TRIP and TWIP activities. This obviously can’t rule out any nano-scale twinning, which would require TEM analysis to detect. However, pronounced twinning, as in the case shown for the RT and intermediate strain rate condition, can be ruled out with high level of confidence. It should be emphasized here that the significant increase in deformation rate did not induce pronounced differences in terms of strength and ductility. As the considered system is shown to mainly exhibit different properties following the activation of either TWIP (at certain deformation rates and RT) or TRIP (at cryogenic temperatures with strain-rate dependence), the relatively small differences observed at 300 °C following deformation rate change is not surprising, given the lack of TWIP/TRIP.
A summary of the observations and major results for the elevated deformation temperature conditions is shown in Figure 16. Moreover, fractography from samples deformed at the two considered rates is shown in Figure 17. Ductile dimples were also detected in this case, but they lack the dull and fibrous appearance visible in the specimens deformed at RT and LN. This indicates that the samples did not exhibit high strength magnitudes, which is consistent with the stress-strain results.

4. Conclusions

In this work, the V10Fe45Co30Cr10Ni5 TWIP/TRIP MPEA was investigated under tension at different deformation rates (1.32 × 10⁻³/s to 1.32/s, 1000 times faster) and deformation temperatures, extending from cryogenic (−196 °C) to elevated (300 °C). The mechanical properties were evaluated and compared for all the considered conditions. EBSD and XRD analysis were also conducted to shed light onto the dominant deformation mechanisms (i.e., slip, TWIP, and TRIP). The results were analyzed in terms of the mechanical properties, strength, ductility, and hardening rates, with the aim to provide a deeper understanding of how deformation rate and temperature affect the plasticity mechanism and, consequently, the attained strength and ductility levels in this novel and unique MPEA. The work supports the following conclusions:
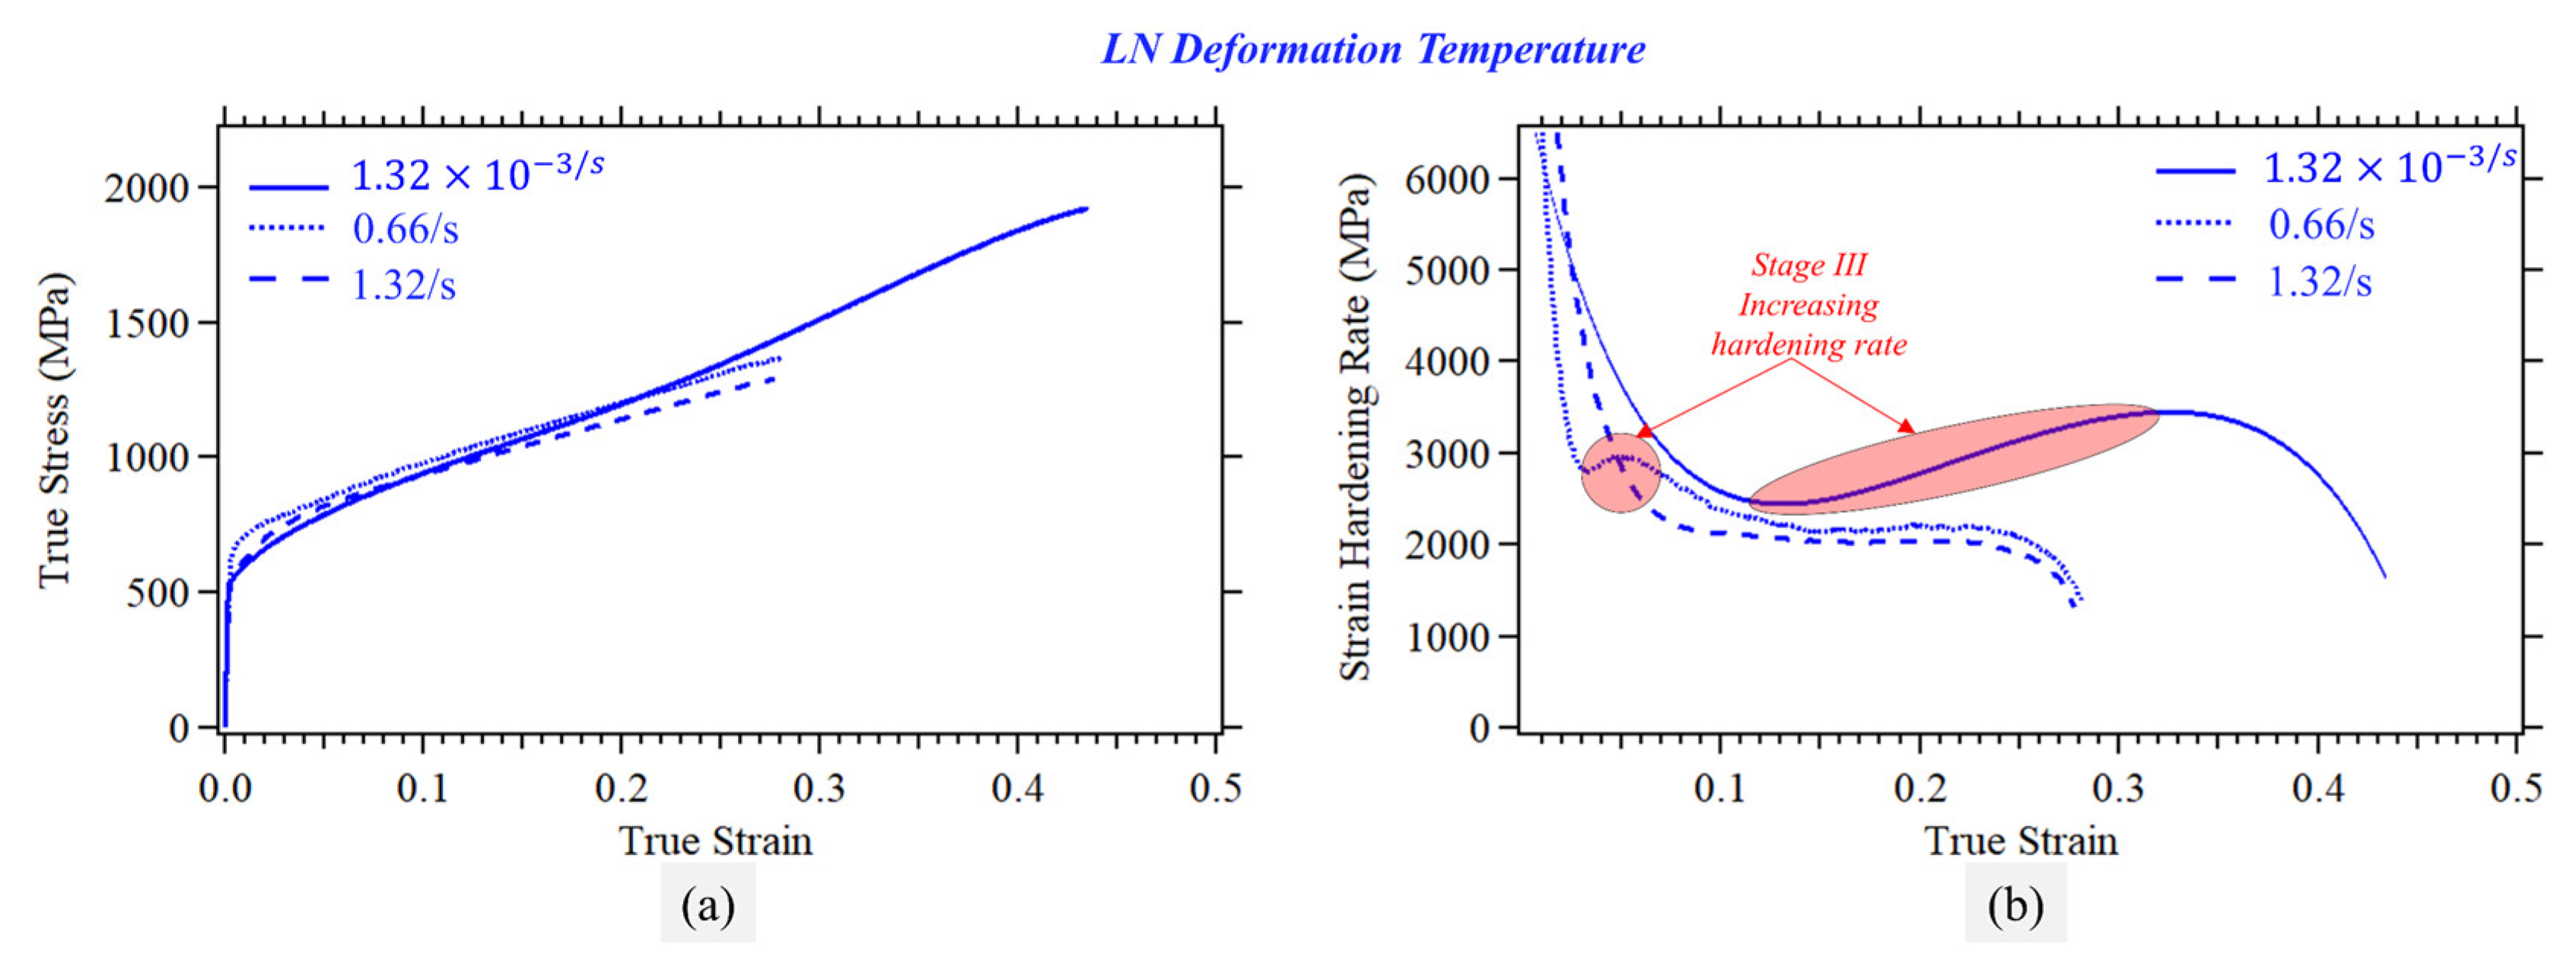
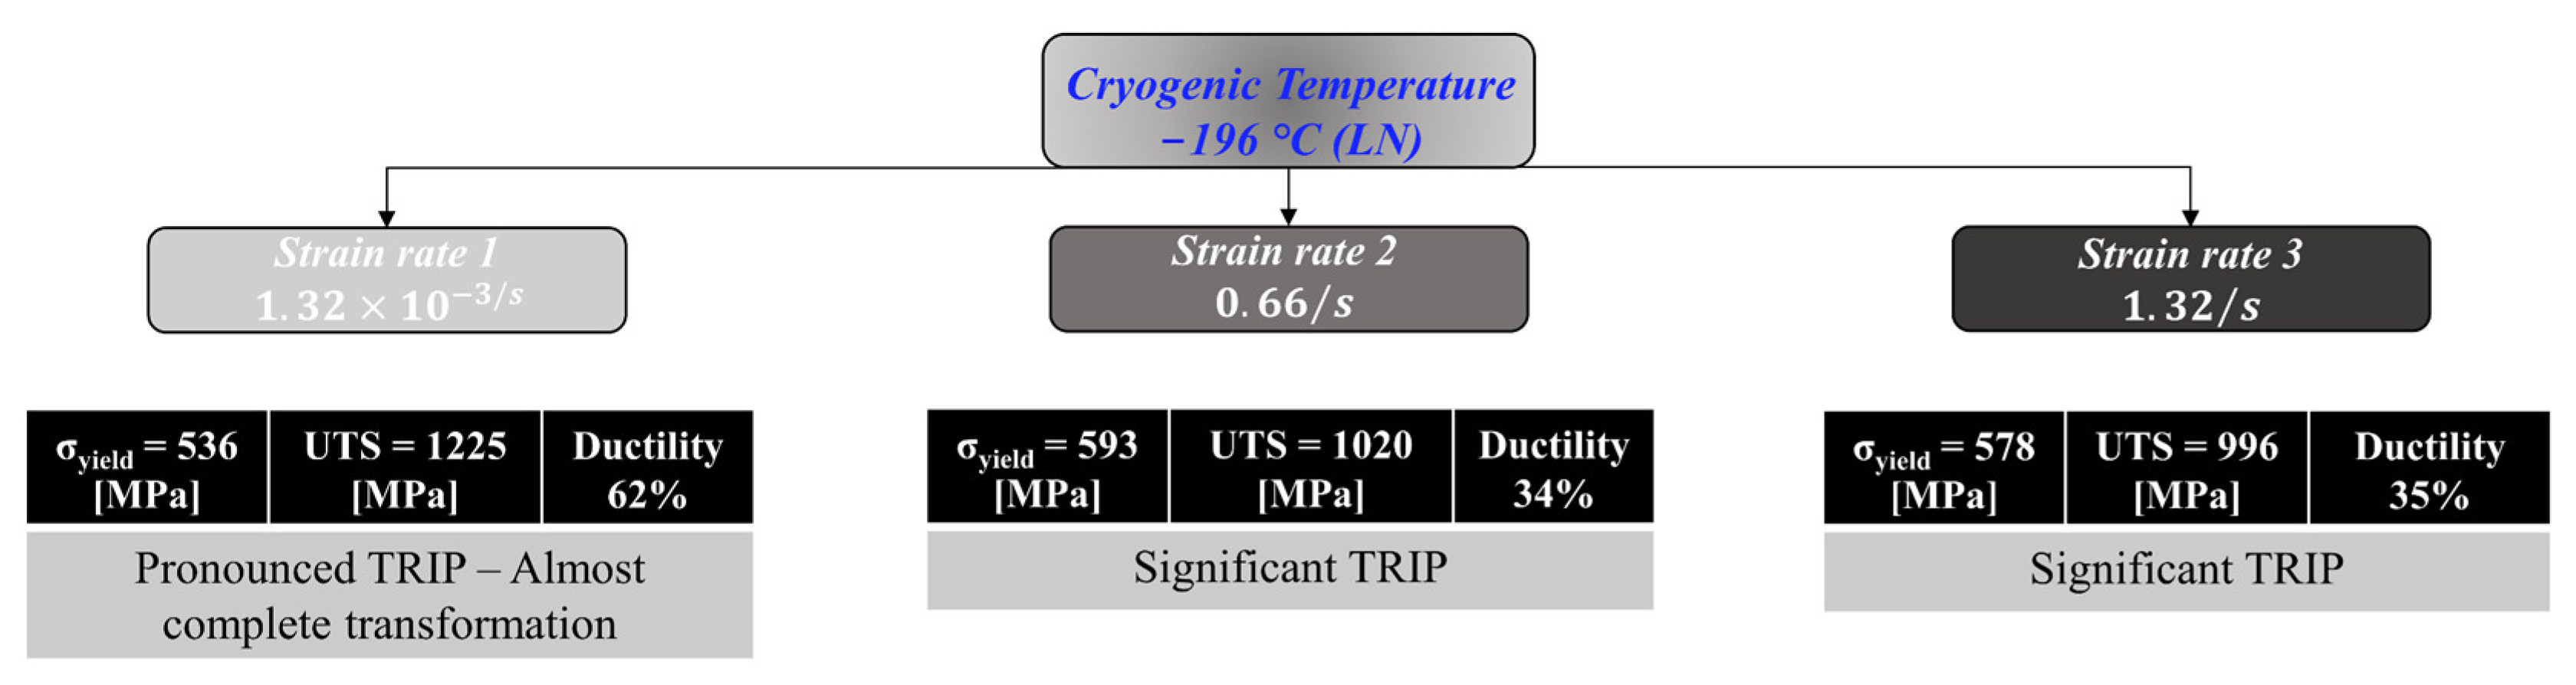
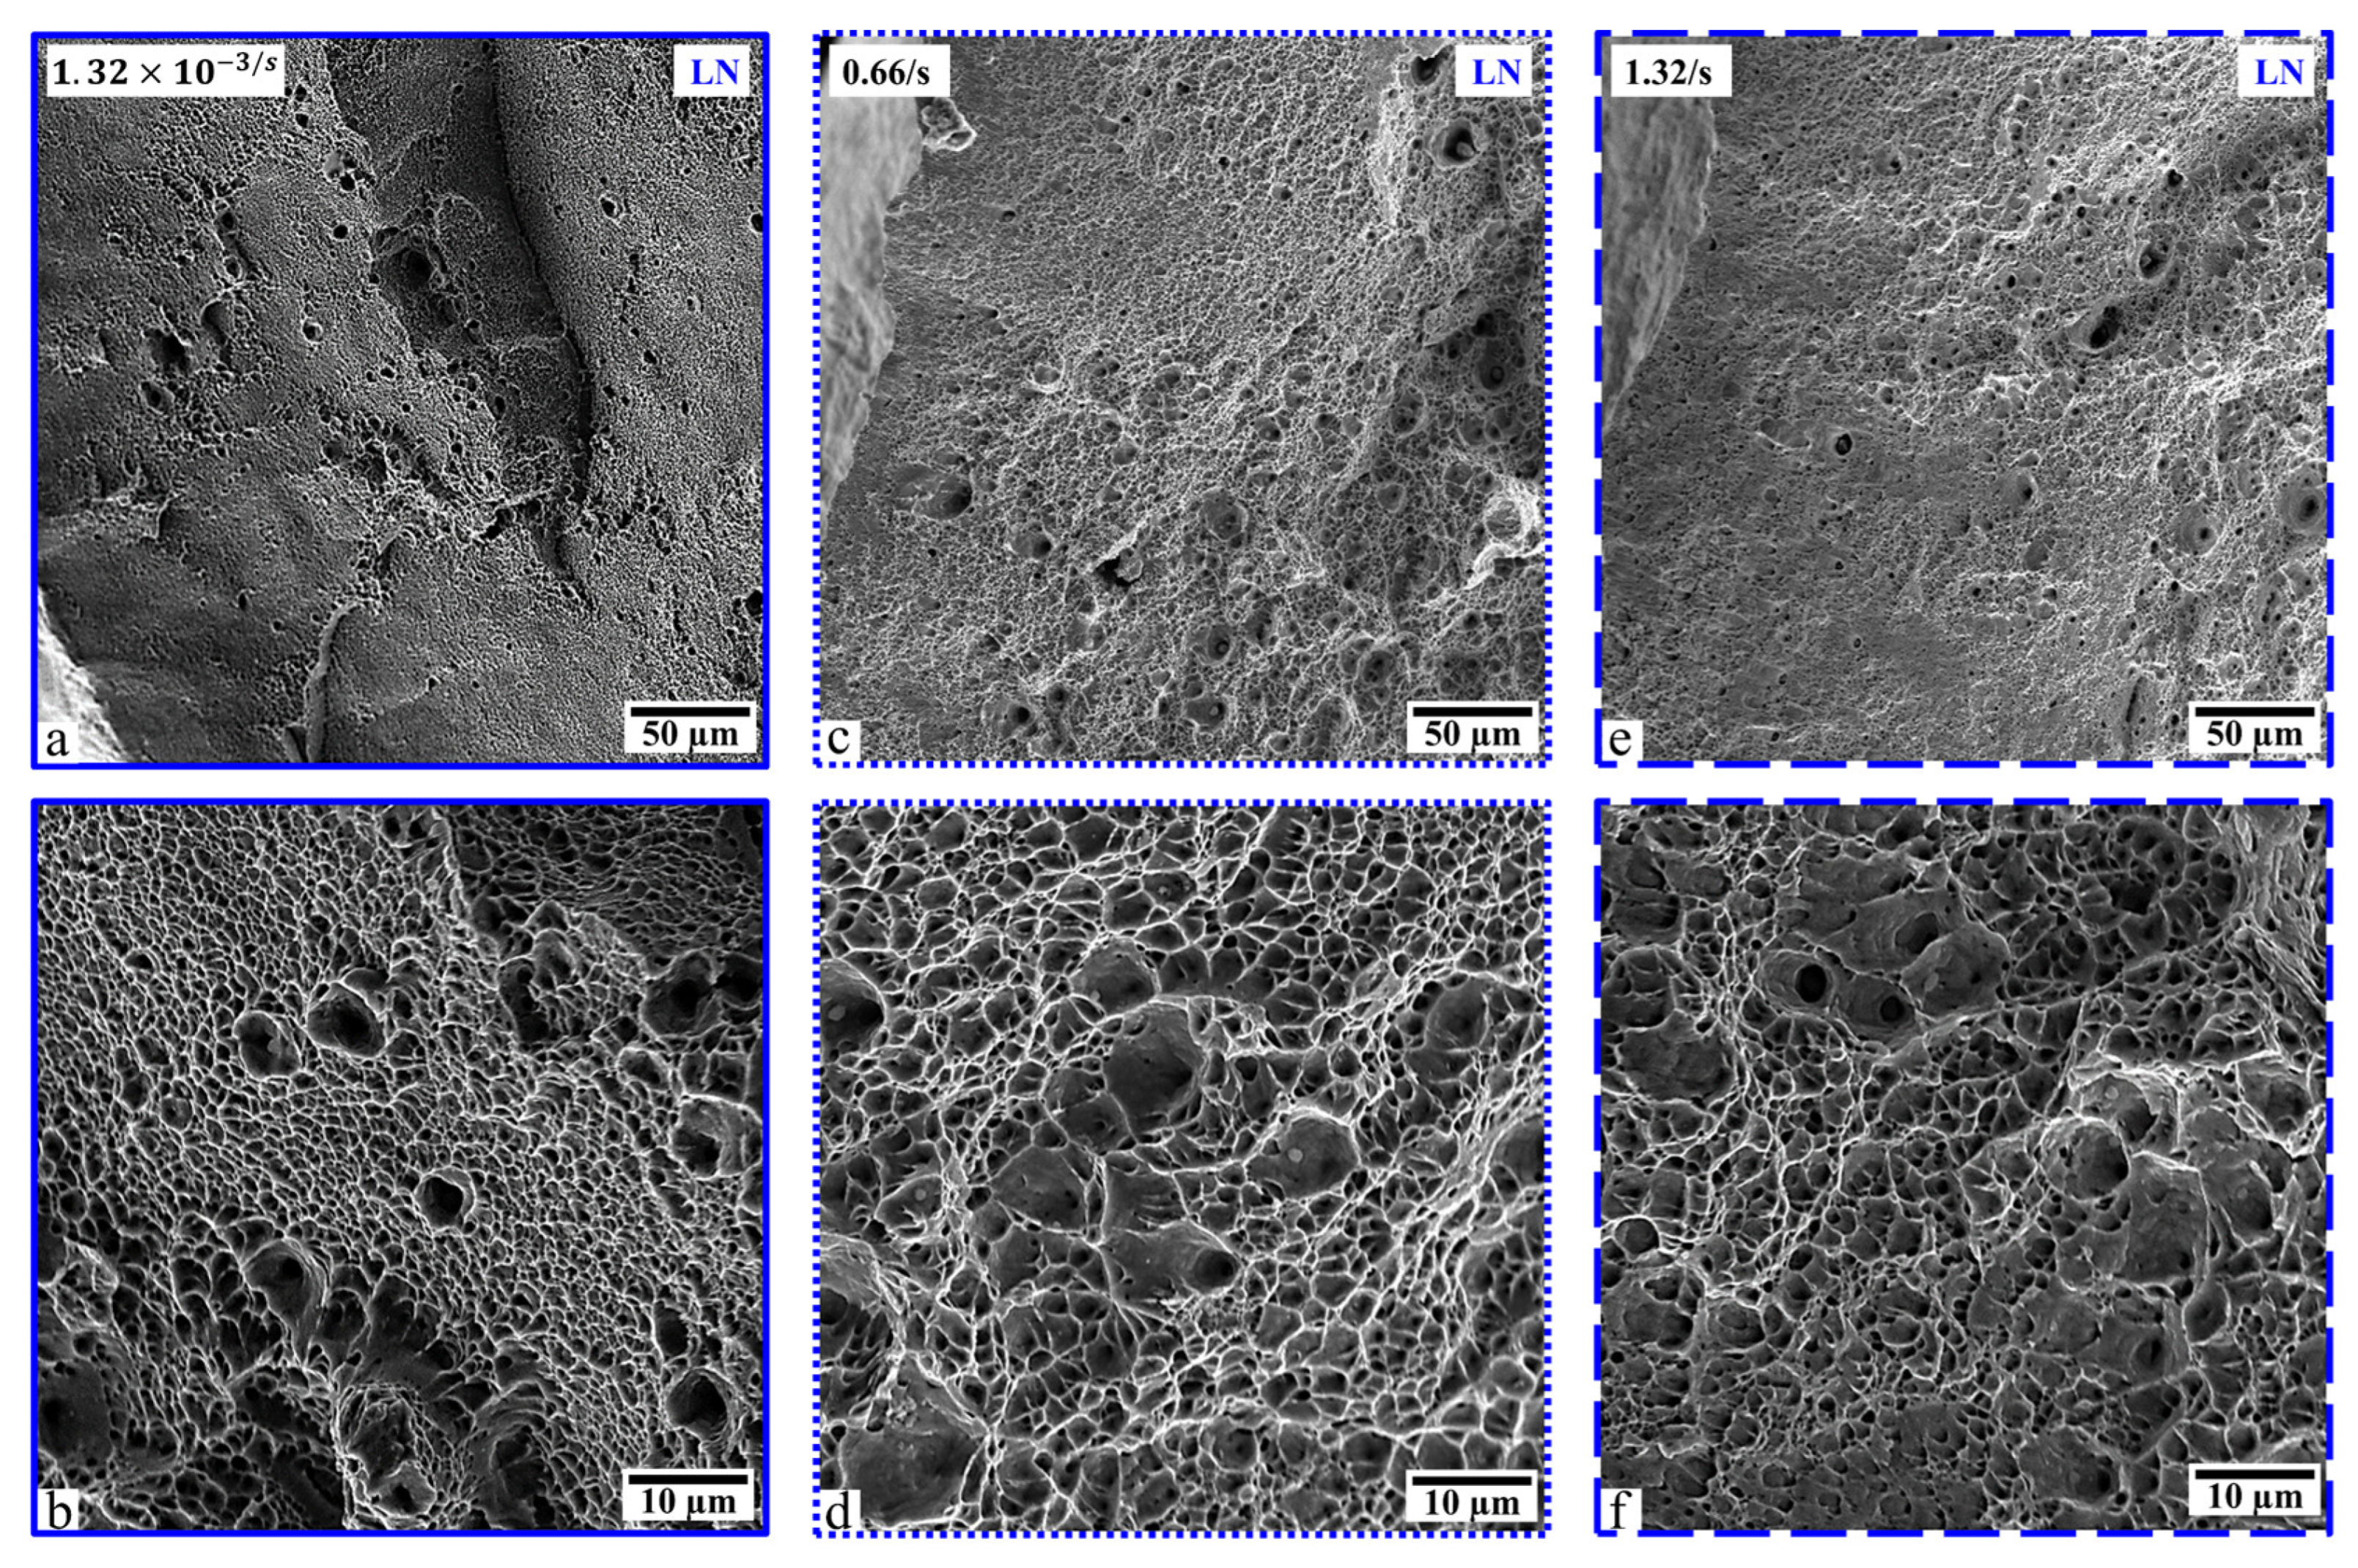
  • The highest ultimate tensile strength (UTS) of 1225 MPa along with superior ductility of 62.2% was achieved at cryogenic temperature and slow deformation rate. Extensive phase transformation (TRIP—almost complete FCC to BCC) induced significant hardening, allowing for superior strength and ductility magnitudes compared to all other deformation conditions.
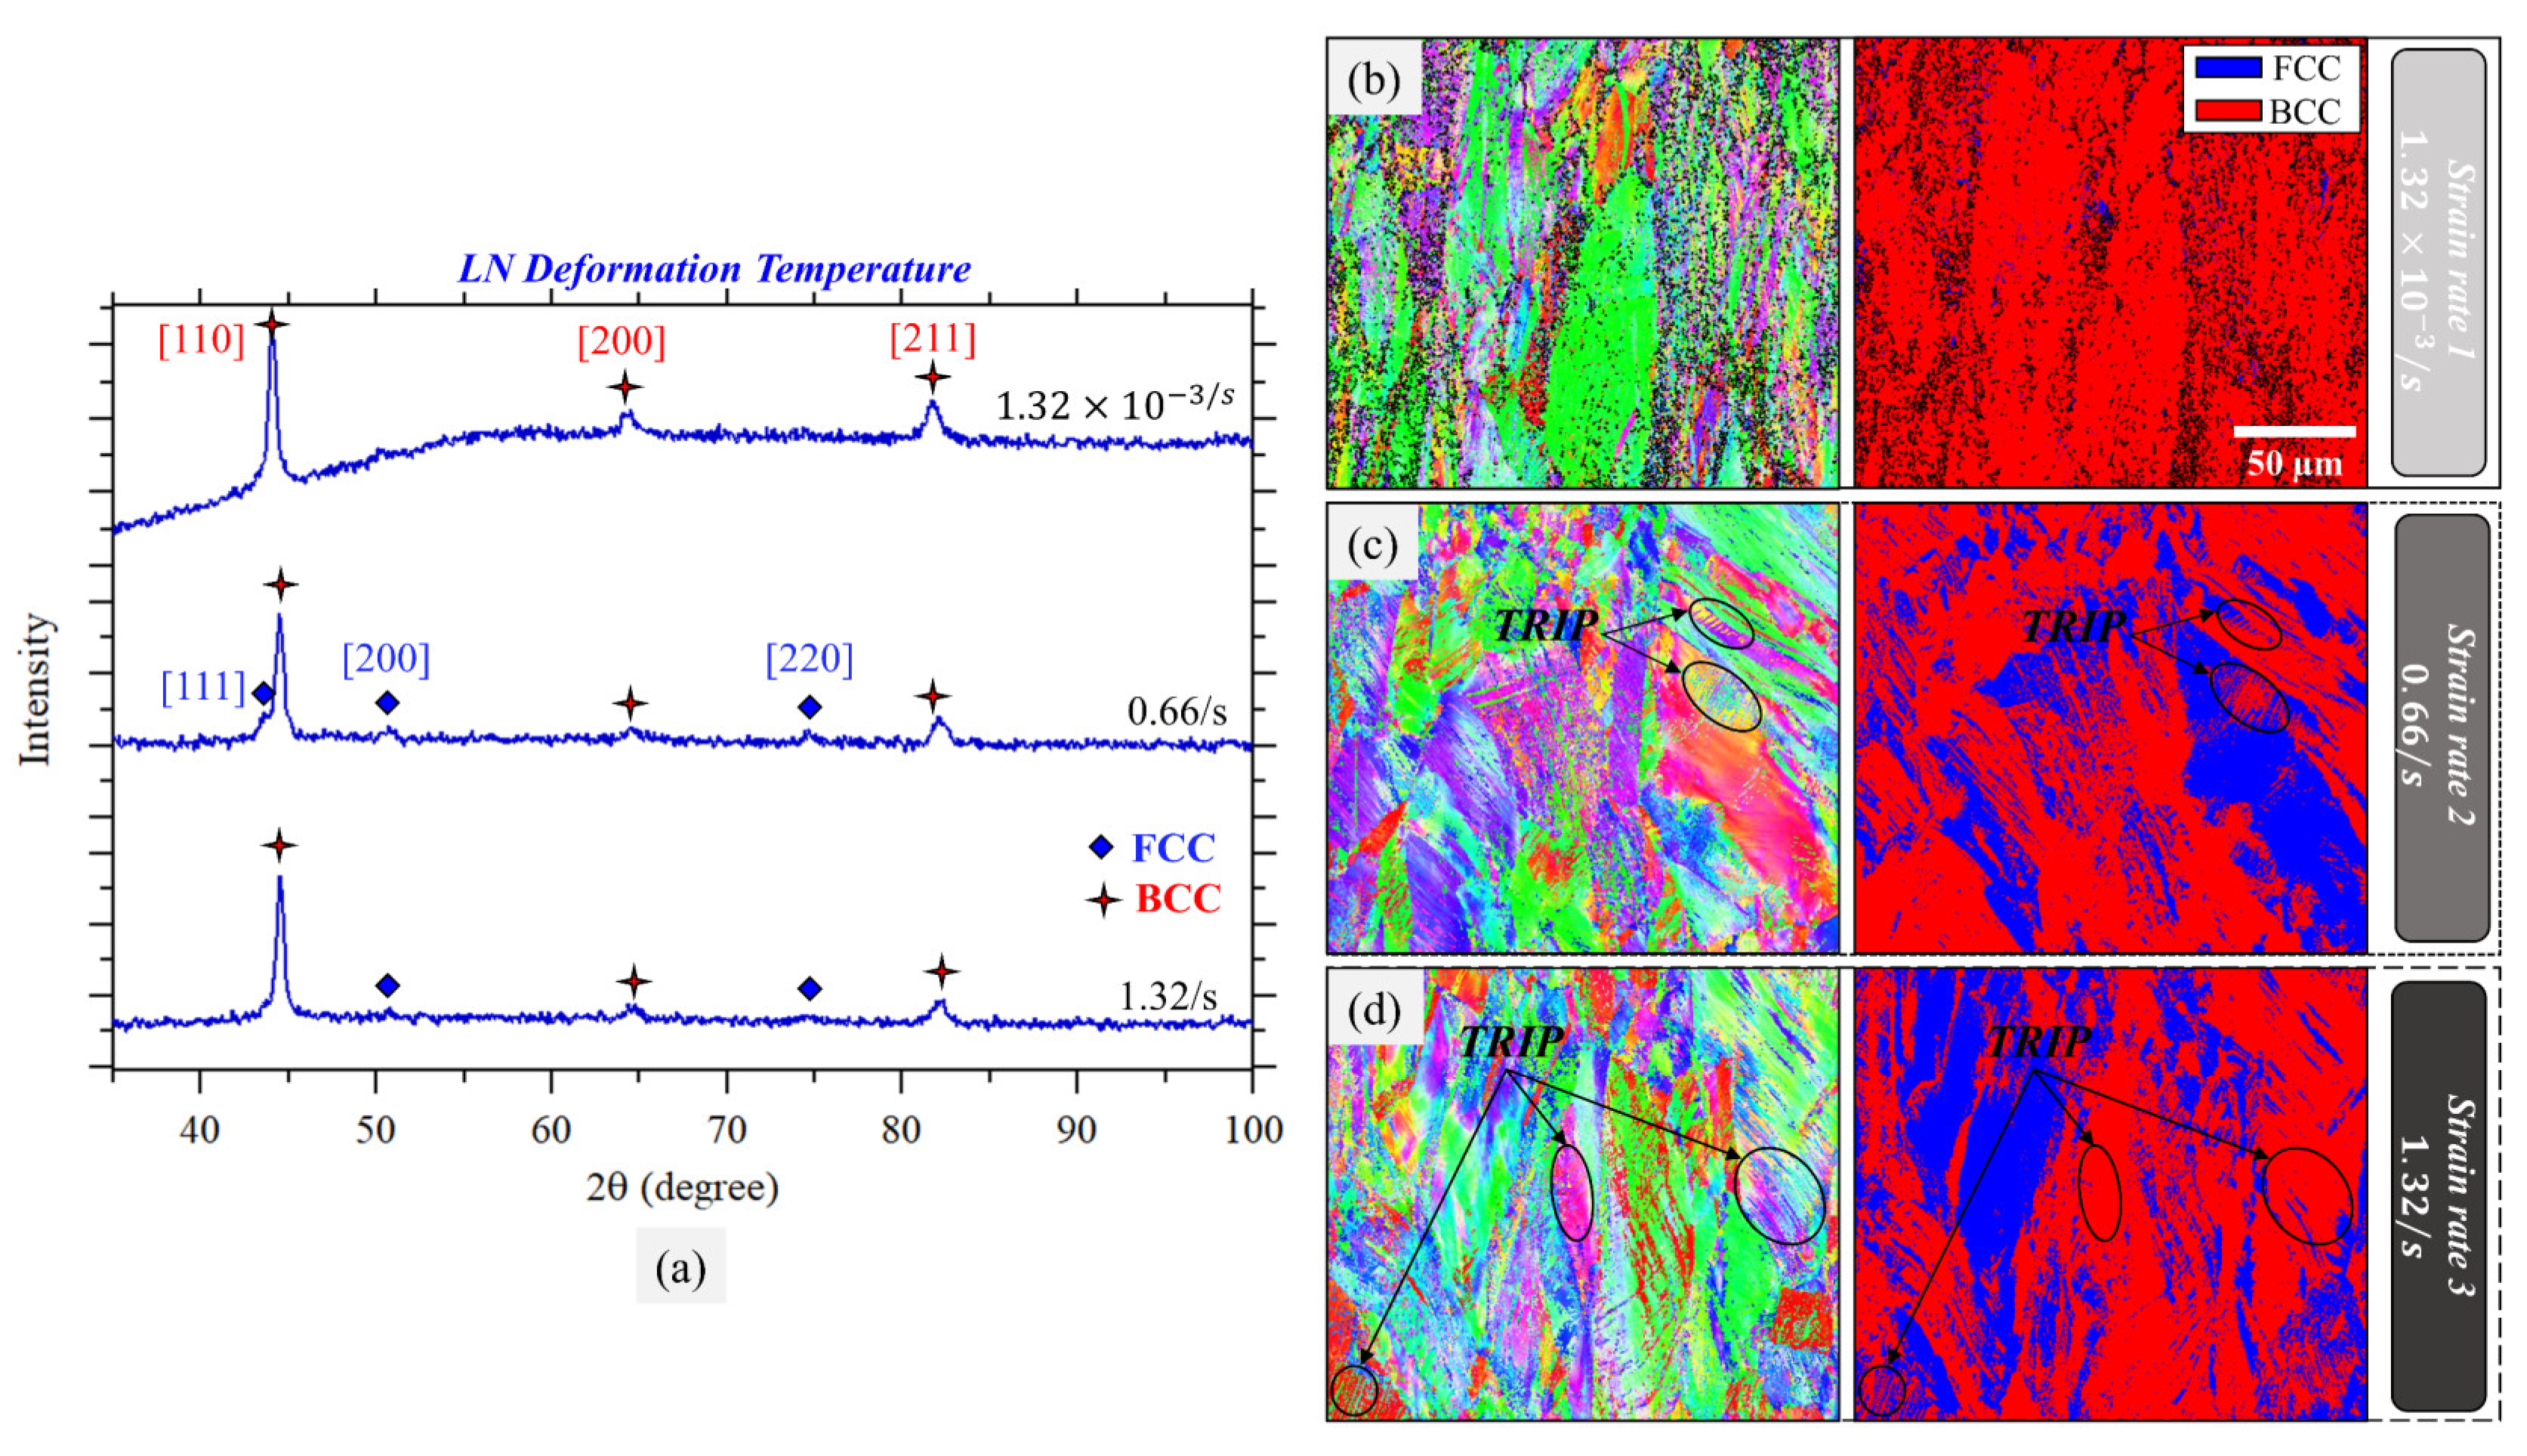
  • For all the considered deformation rates at the cryogenic deformation temperature, a significant TRIP activity was always detected. The extent of TRIP (FCC to BCC phase transformation), however, was dependent on the deformation rate. Increasing the deformation rate is not conducive to TRIP and thus hinders the hardening capacity.
  • For deformation at room temperature, the mechanical properties were relatively less affected by deformation rate. The impact at cryogenic temperature was significantly more pronounced.
  • TWIP was only detected in samples deformed at RT. The results presented here for RT deformation highlight the complexity of interactions taking place and affecting the plastic response and activated deformation mechanisms. The trends are nonlinear with TWIP favored at the intermediate deformation rate while TRIP was observed, although limited, only at the slowest deformation rate. The highest yield strength was measured at this intermediate rate (0.66/s) with slower (1.32 × 10⁻³/s) and faster rates (1.32/s), resulting in lower yield strengths.
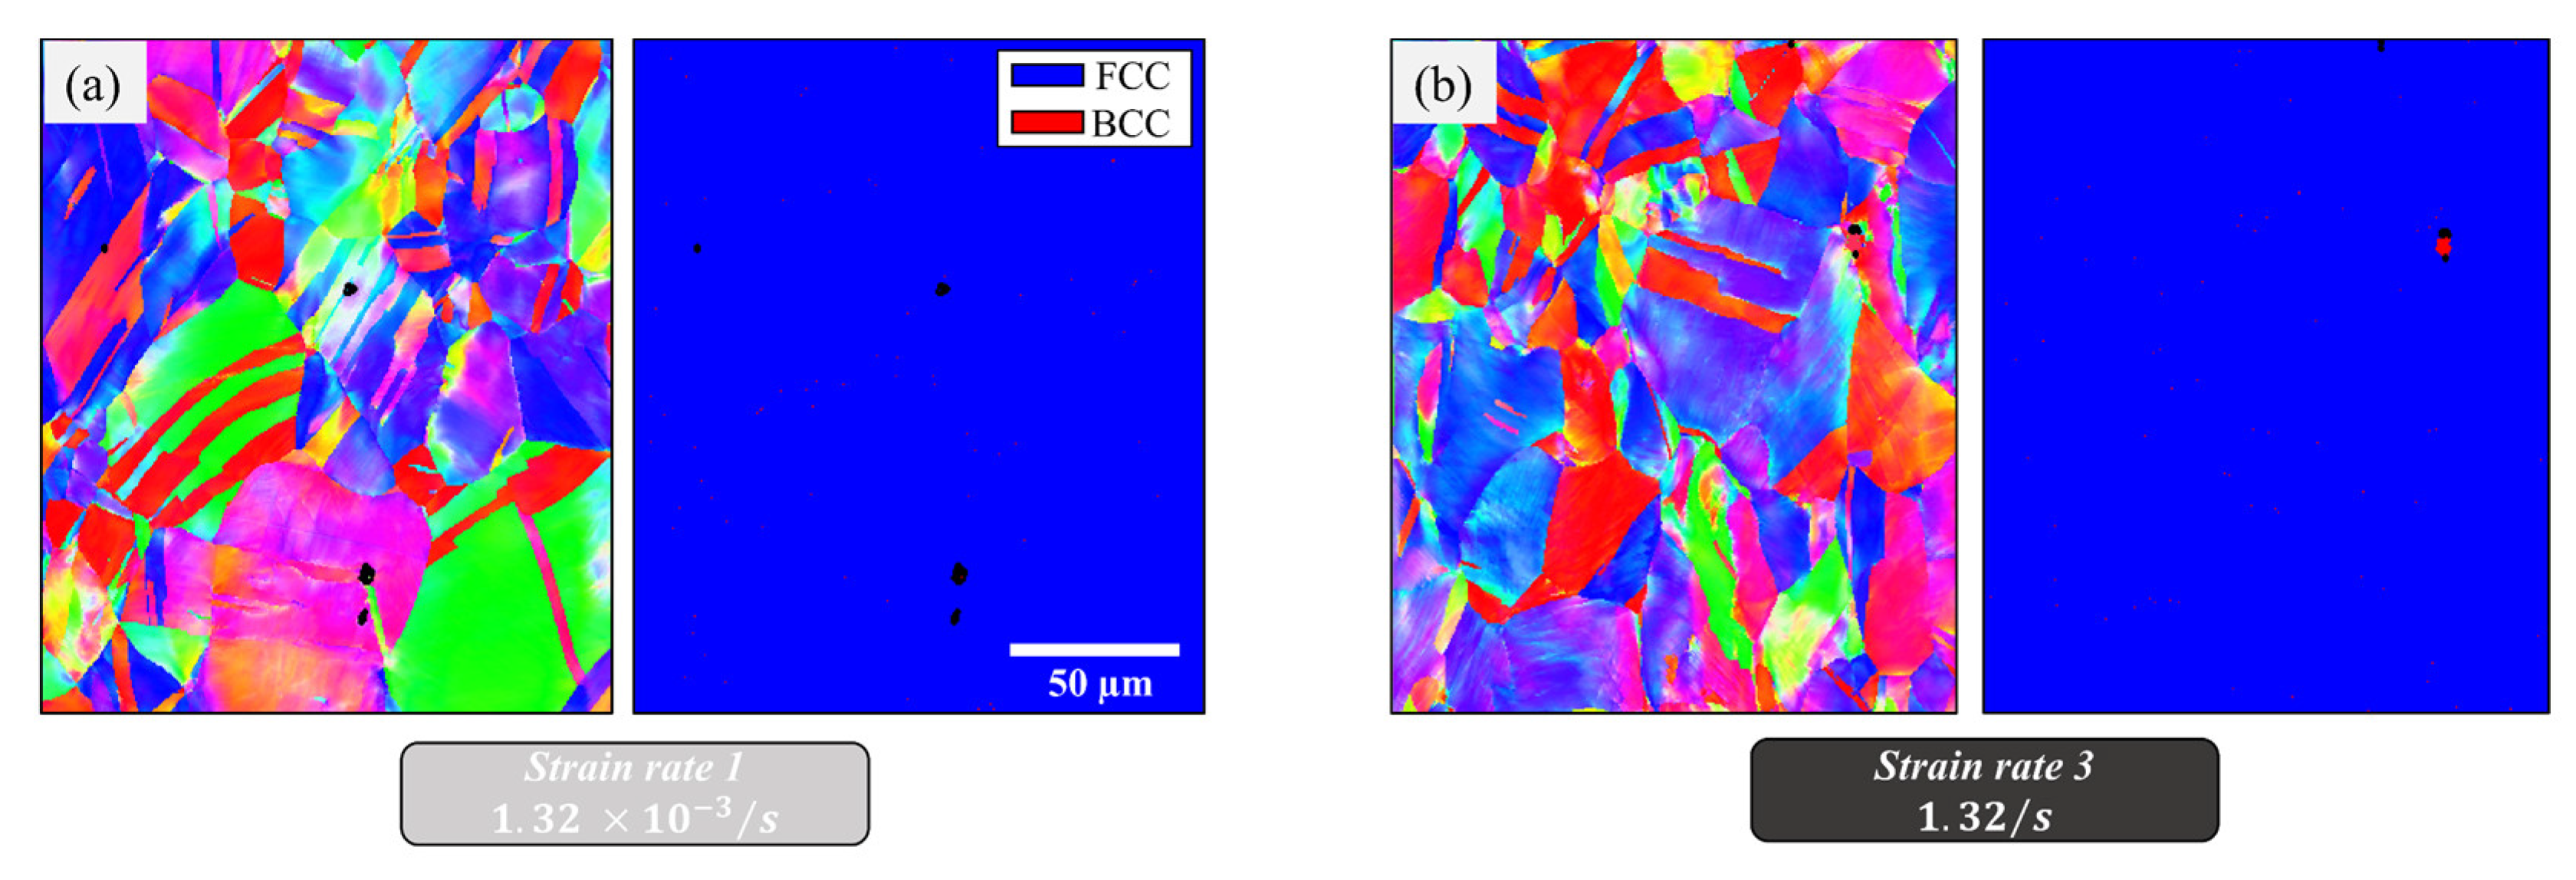
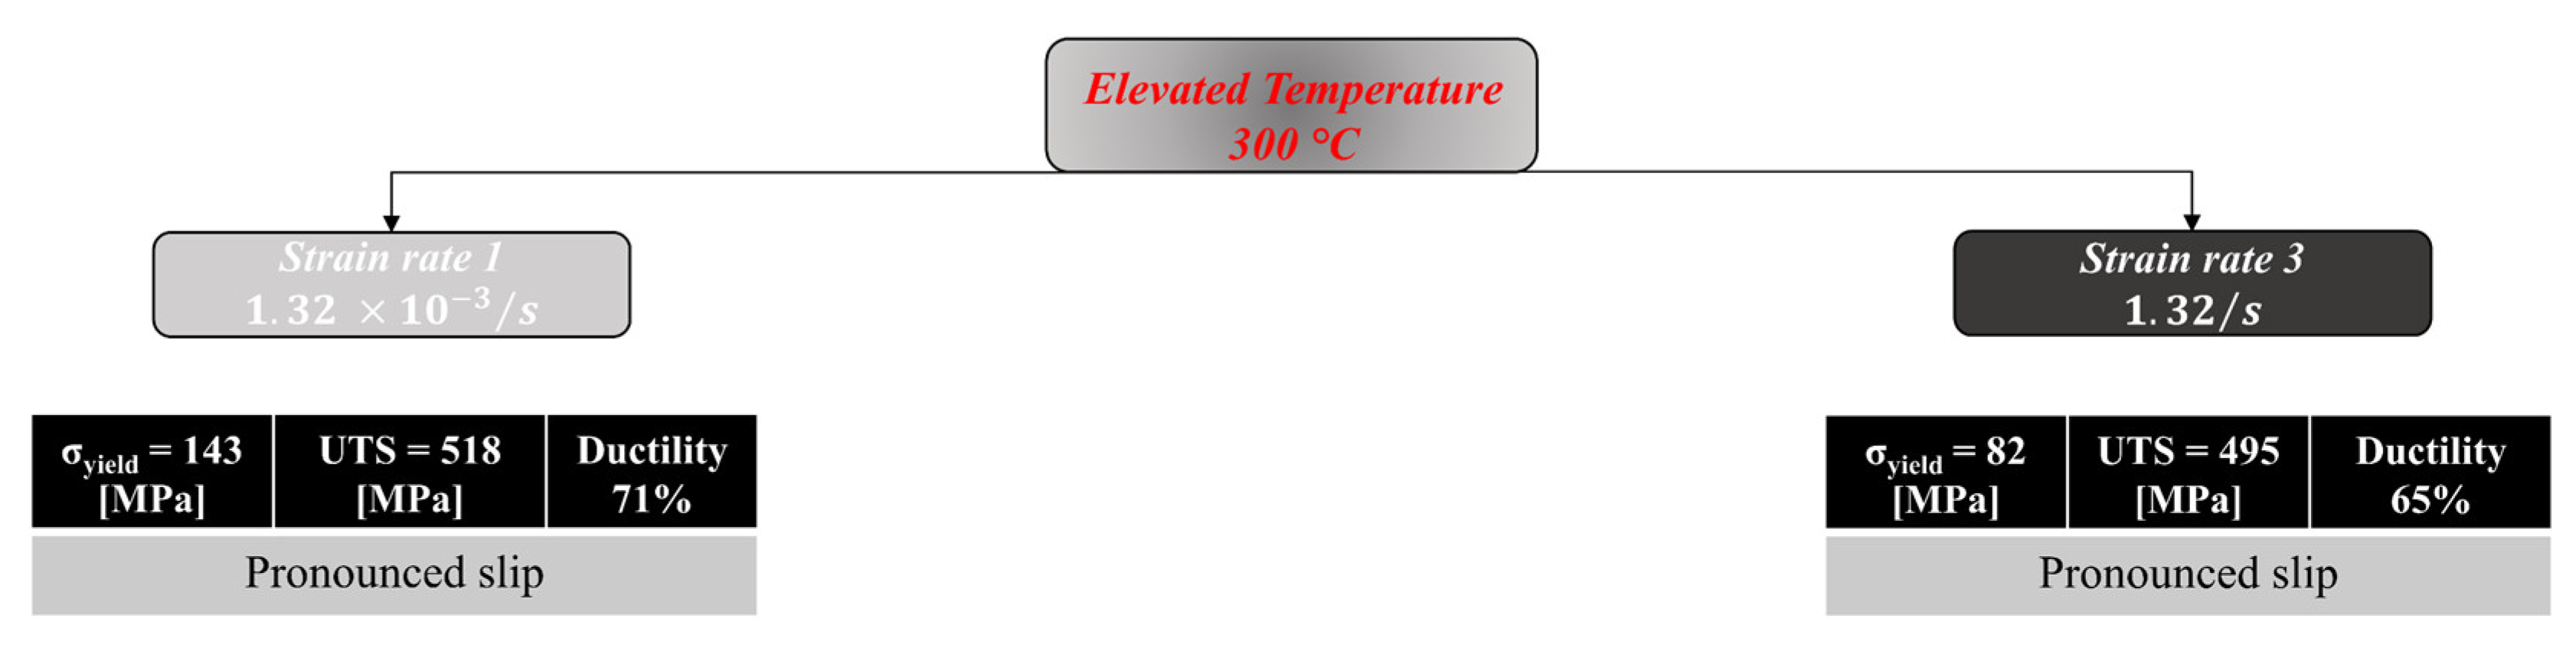
  • Increasing the deformation temperature to 300 °C resulted in enhanced ductility levels; however, this was accompanied by a significant strength reduction. By increasing the deformation strain rate, the expected reduction in ductility was observed consistently across all temperatures. However, unlike the results obtained at RT and 77 K, both the yield and UTS dropped compared to the slow strain rate results.
  • Compared to either the RT or cryogenic deformation temperatures, the material deformed at 300 °C exhibited no signs of Stage III hardening and slip-dominated response. No signs of either TWIP or TRIP were detected in this case. As the considered system is shown to mainly exhibit different properties following the activation of either TWIP (at certain deformation rates and RT) or TRIP (at cryogenic temperatures with strain-rate dependence), a relatively less significant deformation rates impact was observed at this deformation temperature given the lack of TWIP/TRIP.

Author Contributions

Conceptualization, W.A.; methodology, W.A.; validation, all authors; formal analysis, all authors; data curation, O.E.B.; writing—original draft preparation, W.A. and O.E.B.; writing—review and editing, M.A., L.P., R.C. and M.E.; supervision, W.A. and M.A.; project administration, W.A.; funding acquisition, W.A. All authors have read and agreed to the published version of the manuscript.

Funding

This study was financially supported by the American University of Sharjah, United Arab Emirates, through the Office of Research (FRG22-E-E46). The work in this paper was supported, in part, by the Open Access Program from the American University of Sharjah.

Institutional Review Board Statement

Not applicable.

Informed Consent Statement

Not applicable.

Data Availability Statement

The data that support the findings of this study are available from the corresponding author upon reasonable request.

Conflicts of Interest

The authors declare no conflict of interest. The funders had no role in the design of the study; in the collection, analyses, or interpretation of data; in the writing of the manuscript; or in the decision to publish the results. This paper represents the opinions of the author(s) and does not mean to represent the position or opinions of the American University of Sharjah.

References

  1. Soutsos, M.; Domone, P. Metals and Alloys. Constr. Mater. Their Nat. Behav. Fifth Ed. 2006, 71–132. [Google Scholar] [CrossRef]
  2. Reed, R.C.; Rae, C.M.F. Physical Metallurgy of the Nickel-Based Superalloys. Phys. Metall. Fifth Ed. 2014, 1, 2215–2290. [Google Scholar] [CrossRef]
  3. Garrison, W.M.; Banerjee, M.K. Martensitic Non-Stainless Steels: High Strength and High Alloy. Ref. Modul. Mater. Sci. Mater. Eng. 2018, 5197–5202. [Google Scholar] [CrossRef]
  4. De Cooman, B.C.; Estrin, Y.; Kim, S.K. Twinning-Induced Plasticity (TWIP) Steels. Acta Mater. 2018, 142, 283–362. [Google Scholar] [CrossRef]
  5. Barbier, D.; Gey, N.; Allain, S.; Bozzolo, N.; Humbert, M. Analysis of the Tensile Behavior of a TWIP Steel Based on the Texture and Microstructure Evolutions. Mater. Sci. Eng. A 2009, 500, 196–206. [Google Scholar] [CrossRef]
  6. Zhao, G.; Xu, X.; Dye, D.; Rivera-díaz-del-castillo, P.E.J. Acta Materialia Microstructural Evolution and Strain-Hardening in TWIP Ti Alloys. Acta Mater. 2020, 183, 155–164. [Google Scholar] [CrossRef]
  7. De Cooman, B.C. High Mn TWIP Steel and Medium Mn Steel. Automot. Steels Des. Metall. Process. Appl. 2017, 317–385. [Google Scholar] [CrossRef]
  8. Koyama, M. Twinning-Induced Plasticity (TWIP) Steel. Encycl. Mater. Met. Alloy. 2022, 142, 95–105. [Google Scholar] [CrossRef]
  9. Soleimani, M.; Kalhor, A.; Mirzadeh, H. Transformation-Induced Plasticity (TRIP) in Advanced Steels: A Review. Mater. Sci. Eng. A 2020, 795, 140023. [Google Scholar] [CrossRef]
  10. Abuzaid, W.; Egilmez, M.; Chumlyakov, Y.I. TWIP—TRIP Effect in Single Crystalline VFeCoCrNi Multi-Principle Element Alloy. Scr. Mater. 2021, 194, 113637. [Google Scholar] [CrossRef]
  11. Zhang, Y.; Beijing, T. History of High-Entropy Materials; Springer: Singapore, 2019; ISBN 9789811385261. [Google Scholar]
  12. Mishra, R.S.; Haridas, R.S.; Agrawal, P. High Entropy Alloys—Tunability of Deformation Mechanisms through Integration of Compositional and Microstructural Domains. Mater. Sci. Eng. A 2021, 812, 141085. [Google Scholar] [CrossRef]
  13. Chen, T.; Wong, M.; Shun, T.; Yeh, J. Nanostructured Nitride Films of Multi-Element High-Entropy Alloys by Reactive DC Sputtering. Surf. Coat. Technol. 2005, 200, 1361–1365. [Google Scholar] [CrossRef]
  14. Diao, H.Y.; Feng, R.; Dahmen, K.A.; Liaw, P.K. Fundamental Deformation Behavior in High-Entropy Alloys: An Overview. Curr. Opin. Solid State Mater. Sci. 2017, 21, 252–266. [Google Scholar] [CrossRef]
  15. Gao, M.C.; Yeh, J.-W.; Liaw, P.K.; Zhang, Y. High-Entropy Alloys: Fundamentals and Applications; Springer: Berlin/Heidelberg, Germany, 2016; ISBN 3319270133. [Google Scholar]
  16. Murty, B.S.; Yeh, J.-W.; Ranganathan, S.; Bhattacharjee, P.P. High-Entropy Alloys; Elsevier: Amsterdam, The Netherlands, 2019; ISBN 0128160683. [Google Scholar]
  17. Miracle, D.B.; Senkov, O.N. A Critical Review of High Entropy Alloys and Related Concepts. Acta Mater. 2017, 122, 448–511. [Google Scholar] [CrossRef]
  18. Li, Z.; Zhao, S.; Ritchie, R.O.; Meyers, M.A. Mechanical Properties of High-Entropy Alloys with Emphasis on Face-Centered Cubic Alloys. Prog. Mater. Sci. 2019, 102, 296–345. [Google Scholar] [CrossRef]
  19. Lyu, Z.; Fan, X.; Lee, C.; Wang, S.-Y.; Feng, R.; Liaw, P.K. Fundamental Understanding of Mechanical Behavior of High-Entropy Alloys at Low Temperatures: A Review. J. Mater. Res. 2018, 33, 2998–3010. [Google Scholar] [CrossRef]
  20. Pickering, E.J.; Jones, N.G. High-Entropy Alloys: A Critical Assessment of Their Founding Principles and Future Prospects. Int. Mater. Rev. 2016, 61, 183–202. [Google Scholar] [CrossRef]
  21. Yeh, J.-W.; Chen, S.-K.; Lin, S.-J.; Gan, J.-Y.; Chin, T.-S.; Shun, T.-T.; Tsau, C.-H.; Chang, S.-Y. Nanostructured High-Entropy Alloys with Multiple Principal Elements: Novel Alloy Design Concepts and Outcomes. Adv. Eng. Mater. 2004, 6, 299–303. [Google Scholar] [CrossRef]
  22. Zhang, Y.; Zuo, T.T.; Tang, Z.; Gao, M.C.; Dahmen, K.A.; Liaw, P.K.; Lu, Z.P. Microstructures and Properties of High-Entropy Alloys. Prog. Mater. Sci. 2014, 61, 1–93. [Google Scholar] [CrossRef]
  23. Tsai, M.-H.; Yeh, J.-W. High-Entropy Alloys: A Critical Review. Mater. Res. Lett. 2014, 2, 107–123. [Google Scholar] [CrossRef]
  24. Yeh, J.-W. Alloy Design Strategies and Future Trends in High-Entropy Alloys. JOM 2013, 65, 1759–1771. [Google Scholar] [CrossRef]
  25. Ye, Y.F.; Wang, Q.; Lu, J.; Liu, C.T.; Yang, Y. High-Entropy Alloy: Challenges and Prospects. Mater. Today 2016, 19, 349–362. [Google Scholar] [CrossRef]
  26. Cantor, B. Multicomponent and High Entropy Alloys. Entropy 2014, 16, 4749–4768. [Google Scholar] [CrossRef]
  27. Rivera-Díaz-Del-Castillo, P.E.J.; Fu, H. Strengthening Mechanisms in High-Entropy Alloys: Perspectives for Alloy Design. J. Mater. Res. 2018, 33, 2970–2982. [Google Scholar] [CrossRef]
  28. George, E.P.; Curtin, W.A.; Tasan, C.C. High Entropy Alloys: A Focused Review of Mechanical Properties and Deformation Mechanisms. Acta Mater. 2020, 188, 435–474. [Google Scholar] [CrossRef]
  29. Gludovatz, B.; George, E.P.; Ritchie, R.O. Processing, Microstructure and Mechanical Properties of the CrMnFeCoNi High-Entropy Alloy. JOM 2015, 67, 2262–2270. [Google Scholar] [CrossRef]
  30. George, E.P.; Raabe, D.; Ritchie, R.O. High-Entropy Alloys. Nat. Rev. Mater. 2019, 4, 515–534. [Google Scholar] [CrossRef]
  31. Laplanche, G.; Kostka, A.; Horst, O.M.; Eggeler, G.; George, E.P. Microstructure Evolution and Critical Stress for Twinning in the CrMnFeCoNi High-Entropy Alloy. Acta Mater. 2016, 118, 152–163. [Google Scholar] [CrossRef]
  32. Wu, Y.; Bönisch, M.; Alkan, S.; Abuzaid, W.; Sehitoglu, H. Experimental Determination of Latent Hardening Coefficients in FeMnNiCoCr. Int. J. Plast. 2018, 105, 239–260. [Google Scholar] [CrossRef]
  33. Bönisch, M.; Wu, Y.; Sehitoglu, H. Hardening by Slip-Twin and Twin-Twin Interactions in FeMnNiCoCr. Acta Mater. 2018, 153, 391–403. [Google Scholar] [CrossRef]
  34. Cantor, B.; Chang, I.T.H.; Knight, P.; Vincent, A.J.B. Microstructural Development in Equiatomic Multicomponent Alloys. Mater. Sci. Eng. A 2004, 375–377, 213–218. [Google Scholar] [CrossRef]
  35. Abuzaid, W.; Sehitoglu, H. Critical Resolved Shear Stress for Slip and Twin Nucleation in Single Crystalline FeNiCoCrMn High Entropy Alloy. Mater. Charact. 2017, 129, 288–299. [Google Scholar] [CrossRef]
  36. Abuzaid, W.; Patriarca, L. A Study on Slip Activation for a Coarse-Grained and Single Crystalline CoCrNi Medium Entropy Alloy. Intermetallics 2020, 117, 106682. [Google Scholar] [CrossRef]
  37. Laplanche, G.; Kostka, A.; Reinhart, C.; Hunfeld, J.; Eggeler, G.; George, E.P. Reasons for the Superior Mechanical Properties of Medium-Entropy CrCoNi Compared to High-Entropy CrMnFeCoNi. Acta Mater. 2017, 128, 292–303. [Google Scholar] [CrossRef]
  38. Yoshida, S.; Bhattacharjee, T.; Bai, Y.; Tsuji, N. Friction Stress and Hall-Petch Relationship in CoCrNi Equi-Atomic Medium Entropy Alloy Processed by Severe Plastic Deformation and Subsequent Annealing. Scr. Mater. 2017, 134, 33–36. [Google Scholar] [CrossRef]
  39. Gludovatz, B.; Hohenwarter, A.; Catoor, D.; Chang, E.H.; George, E.P.; Ritchie, R.O. A Fracture-Resistant High-Entropy Alloy for Cryogenic Applications. Science 2014, 345, 1153–1158. [Google Scholar] [CrossRef]
  40. Wu, Z.; Bei, H.; Pharr, G.M.; George, E.P. Temperature Dependence of the Mechanical Properties of Equiatomic Solid Solution Alloys with Face-Centered Cubic Crystal Structures. Acta Mater. 2014, 81, 428–441. [Google Scholar] [CrossRef]
  41. Moravcik, I.; Cizek, J.; Kovacova, Z.; Nejezchlebova, J.; Kitzmantel, M.; Neubauer, E.; Kubena, I.; Hornik, V.; Dlouhy, I. Mechanical and Microstructural Characterization of Powder Metallurgy CoCrNi Medium Entropy Alloy. Mater. Sci. Eng. A 2017, 701, 370–380. [Google Scholar] [CrossRef]
  42. Slone, C.E.; Chakraborty, S.; Miao, J.; George, E.P.; Mills, M.J.; Niezgoda, S.R. Influence of Deformation Induced Nanoscale Twinning and FCC-HCP Transformation on Hardening and Texture Development in Medium-Entropy CrCoNi Alloy. Acta Mater. 2018, 158, 38–52. [Google Scholar] [CrossRef]
  43. Zhao, Y.L.; Yang, T.; Tong, Y.; Wang, J.; Luan, J.H.; Jiao, Z.B.; Chen, D.; Yang, Y.; Hu, A.; Liu, C.T.; et al. Heterogeneous Precipitation Behavior and Stacking-Fault-Mediated Deformation in a CoCrNi-Based Medium-Entropy Alloy. Acta Mater. 2017, 138, 72–82. [Google Scholar] [CrossRef]
  44. Gludovatz, B.; Hohenwarter, A.; Thurston, K.V.S.; Bei, H.; Wu, Z.; George, E.P.; Ritchie, R.O. Exceptional Damage-Tolerance of a Medium-Entropy Alloy CrCoNi at Cryogenic Temperatures. Nat. Commun. 2016, 7, 10602. [Google Scholar] [CrossRef] [PubMed]
  45. Miao, J.; Slone, C.E.; Smith, T.M.; Niu, C.; Bei, H.; Ghazisaeidi, M.; Pharr, G.M.; Mills, M.J. The Evolution of the Deformation Substructure in a Ni-Co-Cr Equiatomic Solid Solution Alloy. Acta Mater. 2017, 132, 35–48. [Google Scholar] [CrossRef]
  46. Sohn, S.S.; da Silva, A.K.; Ikeda, Y.; Körmann, F.; Lu, W.; Choi, W.S.; Gault, B.; Ponge, D.; Neugebauer, J.; Raabe, D. Ultrastrong Medium-Entropy Single-Phase Alloys Designed via Severe Lattice Distortion. Adv. Mater. 2019, 31, 1807142. [Google Scholar] [CrossRef] [PubMed]
  47. He, Z.F.; Jia, N.; Wang, H.W.; Liu, Y.; Li, D.Y.; Shen, Y.F. The Effect of Strain Rate on Mechanical Properties and Microstructure of a Metastable FeMnCoCr High Entropy Alloy. Mater. Sci. Eng. A 2020, 776, 138982. [Google Scholar] [CrossRef]
  48. Pierce, D.T.; Jiménez, J.A.; Bentley, J.; Raabe, D.; Wittig, J.E. The Influence of Stacking Fault Energy on the Microstructural and Strain-Hardening Evolution of Fe-Mn-Al-Si Steels during Tensile Deformation. Acta Mater. 2015, 100, 178–190. [Google Scholar] [CrossRef]
  49. Deng, Y.; Tasan, C.C.; Pradeep, K.G.; Springer, H.; Kostka, A.; Raabe, D. ScienceDirect Design of a Twinning-Induced Plasticity High Entropy Alloy. Acta Mater. 2015, 94, 124–133. [Google Scholar] [CrossRef]
  50. Curtze, S.; Kuokkala, V.T.; Oikari, A.; Talonen, J.; Hänninen, H. Thermodynamic Modeling of the Stacking Fault Energy of Austenitic Steels. Acta Mater. 2011, 59, 1068–1076. [Google Scholar] [CrossRef]
  51. Wu, X.; Mayweg, D.; Ponge, D.; Li, Z. Microstructure and Deformation Behavior of Two TWIP/TRIP High Entropy Alloys upon Grain Refinement. Mater. Sci. Eng. A 2021, 802, 140661. [Google Scholar] [CrossRef]
  52. Li, Z.; Körmann, F.; Grabowski, B.; Neugebauer, J.; Raabe, D. Ab Initio Assisted Design of Quinary Dual-Phase High-Entropy Alloys with Transformation-Induced Plasticity. Acta Mater. 2017, 136, 262–270. [Google Scholar] [CrossRef]
  53. He, Z.F.; Jia, N.; Ma, D.; Yan, H.L.; Li, Z.M.; Raabe, D. Joint Contribution of Transformation and Twinning to the High Strength-Ductility Combination of a FeMnCoCr High Entropy Alloy at Cryogenic Temperatures. Mater. Sci. Eng. A 2019, 759, 437–447. [Google Scholar] [CrossRef]
  54. Jo, Y.H.; Choi, W.M.; Kim, D.G.; Zargaran, A.; Sohn, S.S.; Kim, H.S.; Lee, B.J.; Kim, N.J.; Lee, S. FCC to BCC Transformation-Induced Plasticity Based on Thermodynamic Phase Stability in Novel V10Cr10Fe45CoxNi35−x Medium-Entropy Alloys. Sci. Rep. 2019, 9, 2948. [Google Scholar] [CrossRef] [PubMed]
  55. Jo, Y.H.; Yang, J.; Doh, K.Y.; An, W.; Kim, D.W.; Sung, H.; Lee, D.; Kim, H.S.; Sohn, S.S.; Lee, S. Analysis of Damage-Tolerance of TRIP-Assisted V10Cr10Fe45Co30Ni5 High-Entropy Alloy at Room and Cryogenic Temperatures. J. Alloys Compd. 2020, 844, 156090. [Google Scholar] [CrossRef]
  56. Jo, Y.H.; Kim, D.G.; Jo, M.C.; Doh, K.Y.; Sohn, S.S.; Lee, D.; Kim, H.S.; Lee, B.J.; Lee, S. Effects of Deformation–Induced BCC Martensitic Transformation and Twinning on Impact Toughness and Dynamic Tensile Response in Metastable VCrFeCoNi High–Entropy Alloy. J. Alloys Compd. 2019, 785, 1056–1067. [Google Scholar] [CrossRef]
  57. Yang, J.; Hee, Y.; Woong, D.; Choi, W.; Seop, H.; Lee, B.; Su, S.; Lee, S. Materials Science & Engineering A Effects of Transformation-Induced Plasticity (TRIP) on Tensile Property Improvement of Fe45Co30Cr10V10Ni5-xMnx High-Entropy Alloys. Mater. Sci. Eng. A 2020, 772, 138809. [Google Scholar] [CrossRef]
  58. Xiao, Y.; Kozak, R.; Haché, M.J.R.; Steurer, W.; Spolenak, R.; Wheeler, J.M.; Zou, Y. Micro-Compression Studies of Face-Centered Cubic and Body-Centered Cubic High-Entropy Alloys: Size-Dependent Strength, Strain Rate Sensitivity, and Activation Volumes. Mater. Sci. Eng. A 2020, 790, 139429. [Google Scholar] [CrossRef]
  59. Becker, H.; Pantleon, W. Work-Hardening Stages and Deformation Mechanism Maps during Tensile Deformation of Commercially Pure Titanium. Comput. Mater. Sci. 2013, 76, 52–59. [Google Scholar] [CrossRef]
  60. Dong, Y.; Sun, Z.; Xia, H.; Feng, J.; Du, J.; Fang, W.; Liu, B.; Wang, G.; Li, L.; Zhang, X.; et al. The Influence of Warm Rolling Reduction on Microstructure Evolution, Tensile Deformation Mechanism and Mechanical Properties of an Fe-30Mn-4Si-2Al TRIP/TWIP Steel. Metals 2018, 8, 742. [Google Scholar] [CrossRef] [Green Version]
Figure 1. (a) EDX maps of Fe, Co, Cr, V, and Ni confirming the ingot’s homogeneity. (b) The nominal composition in wt.% and at.%. (c) XRD analysis of a specimen following homogenization and solution heat treatments. The results point to a single FCC phase with a lattice parameter a   = 3.58   .
Metals 12 01510 g001
Figure 2. (a) EBSD phase map showing a single FCC phase following homogenization and solution heat treatments. (b) The corresponding grain orientation map.
Metals 12 01510 g002
Figure 3. (a) EBSD phase map following homogenization, rolling, and solution heat treatment. (b) The corresponding grain orientation map.
Metals 12 01510 g003
Figure 4. Schematic detailing the considered deformation temperatures and strain rates in this work. All experiments were conducted under tension.
Metals 12 01510 g004
Figure 5. Representative stress–strain curves of V10Fe45Co30Cr10Ni5 samples deformed at three considered temperatures and strain rates.
Metals 12 01510 g005
Figure 6. (a) Representative true stress–true strain curves of V10Fe45Co30Cr10Ni5 samples deformed at RT. (b) The corresponding strain-hardening rate.
Metals 12 01510 g006
Figure 7. (a) EBSD grain orientation and phase maps of a sample deformed at RT and 1.32 × 10⁻³/s deformation rate. (b) RT and 0.66/s deformation rate. (c) RT and 1.32/s deformation rate.
Metals 12 01510 g007
Figure 8. The dominant deformation mechanisms and summary of the mechanical properties for the room-temperature deformation conditions.
Metals 12 01510 g008
Figure 9. Fractographs of tensile specimens deformed at RT at a rate of 1.32 × 10⁻³/s (a,b), 0.66/s (c,d), and 1.32/s (e,f). The red arrow point to flat fracture regions.
Metals 12 01510 g009
Figure 10. (a) Representative true stress-true strain curves of V10Fe45Co30Cr10Ni5 samples deformed at −196 °C. (b) The corresponding strain-hardening rate.
Metals 12 01510 g010
Figure 11. (a) XRD analysis collected from fractured samples deformed at −196 °C and the three considered deformation rates. (b) EBSD grain orientation and phase maps of a sample deformed at −196 °C and 1.32 × 10⁻³/s deformation rate. (c) −196 °C and 0.66/s deformation rate. (d) −196 °C and 1.32/s deformation rate.
Metals 12 01510 g011
Figure 12. The dominant deformation mechanisms and summary of the mechanical properties for the cryogenic deformation conditions.
Metals 12 01510 g012
Figure 13. Fractographs of tensile specimens deformed at −196 °C at a rate of 1.32 × 10⁻³/s (a,b), 0.66/s (c,d), and 1.32/s (e,f).
Metals 12 01510 g013
Figure 14. (a) Representative true stress–true strain curves of V10Fe45Co30Cr10Ni5 samples deformed at 300 °C. (b) The corresponding strain-hardening rate.
Metals 12 01510 g014
Figure 15. (a) EBSD grain orientation and phase maps of a sample deformed at 300 °C and 1.32 × 10⁻³/s deformation rate. (b) 300 °C and 1.32/s deformation rate.
Metals 12 01510 g015
Figure 16. The dominant deformation mechanisms and summary of the mechanical properties for the elevated temperature deformation conditions.
Metals 12 01510 g016
Figure 17. Fractographs of tensile specimens deformed at 300 °C at a rate of 1.32 × 10⁻³/s (a,b), and 1.32/s (c,d). The red arrow point to flat fracture regions.
Metals 12 01510 g017
Table 1. Summary of the obtained mechanical properties.
ConditionDeformation Temp.Deformation Strain RateYield Strength (MPa)UTS (MPa)
Slow-RTRT1.32 × 10−3/s245.7 ± 15.4617.5 ± 21.9
Intermediate-RTRT0.66/s335.1 ± 1.5646.02 ± 19.08
Fast-RTRT1.32/s287.6 ± 37.7649.6 ± 14.6
Slow-LNLN1.32 × 10−3/s535.8 ± 18.11224.8 ± 29.06
Intermediate-LNLN0.66/s593.2 ± 54.91020.5 ± 16.3
Fast-LNLN1.32/s577.7 ± 30.9995.9 ± 54.5
Slow-300 °C300 °C1.32 × 10−3/s143.3 ± 51.6518.5 ± 10.6
Fast-300 °C300 °C1.32/s82.4 ± 49.1494.9 ± 28.4
Table 2. Effect of deformation temperature and deformation rate on strength and ductility.
ConditionDef. Temp.Ductility (%)Change in Strength Due to Temp. ChangeChange in Ductility Due to Temp. ChangeChange in Strength Due to Rate ChangeChange in Ductility Due to Rate Change
Slow-RTRT47.6 ± 2.8Ref. TempRef. Temp--
Intermediate
RT
RT35.5 ± 0.2Ref. TempRef. Temp4.6%−25.4%
Fast-RTRT40 ± 1.5Ref. TempRef. Temp5.1%−16.5%
Slow-LNLN62.2 ± 0.08598.3%30.6%--
Intermediate
LN
LN34.5 ± 2.957.9%−3%−16.6%−44.58%
Fast-LNLN35 ± 253.3%−11.9%−18.6%−43.7%
Slow-300 °C300 °C71.5 ± 4.4−16.03%50.3%
Fast-300 °C300 °C65.4 ± 3.5−23.8%64.5%−4.5% −8.6%
Publisher’s Note: MDPI stays neutral with regard to jurisdictional claims in published maps and institutional affiliations.

