Article

Microstructure Change, Nano-Hardness and Surface Modification of CN-G01 Beryllium Induced by Helium Ions

1
Institute of Modern Physics, Chinese Academy of Sciences, Lanzhou 730000, China
2
School of Nuclear Science and Technology, University of Chinese Academy of Sciences, Beijing 100049, China
3
Southwestern Institute of Physics, Chengdu 610225, China
*
Authors to whom correspondence should be addressed.
Metals 2023, 13(1), 60; https://doi.org/10.3390/met13010060
Submission received: 22 November 2022 / Revised: 13 December 2022 / Accepted: 22 December 2022 / Published: 25 December 2022

Abstract

:
The helium effects in Chinese developed CN-G01 beryllium are important issues for its use in nuclear energy systems. In this work, the CN-G01 beryllium samples were irradiated with helium ions to fluences of 5.0 × 10¹⁶ ions/cm2 to 1.0 × 10¹⁸ ions/cm2 at room temperature and investigated by techniques of scanning electron microscopy (SEM), transmission electron microscopy (TEM) and nano-indentation. It was found that the irradiation induced hardening of beryllium and the nano-hardness of the samples increased with increasing fluence of 5.0 × 10¹⁶ ions/cm2 to 1.0 × 10¹⁷ ions/cm2. When the fluence reached 5.0 × 10¹⁷ ions/cm2 and 1.0 × 10¹⁸ ions/cm2, helium irradiation induced serious surface blistering and its burst. TEM observation found that helium bubbles in the damage peak region became visible when the fluence reached 1.0 × 10¹⁷ ions/cm2. With increasing fluence, helium bubbles became larger and connected into large cracks. The underlying physical mechanisms are discussed based on the helium behavior at low temperatures and the contributions of helium induced defects. This work will provide some new understanding on the irradiation resistance of CN-G01 beryllium and the helium effects in beryllium at low temperatures.

1. Introduction

Due to its many outstanding physical and mechanical properties, beryllium is extensively used in a wide variety of nuclear facilities [1]. For example, it can be used as a plasma facing material (PFM) for the Joint European Torus (JET) [2] and the International Thermonuclear Experimental Reactor (ITER) [1,3]; it has been accepted as a neutron multiplier material in the helium-cooled pebble bed (HCPB) design concept for the tritium-breeding blanket of the demonstration fusion power plant (DEMO) [4]; it is also an excellent material for particle-beam windows in neutrino production targets of the “Neutrinos at the Main Injector” (NuMI) beamline [5], and a material for different target components in a new generation of proton accelerator driven particle sources [1]. Therefore, beryllium with different grades have been developed, such as S-65C vacuum hot pressed (VHP) from Brush Wellman, DShG-200 from the Russian Federation, TGP-56FW from Russia and CN-G01 from China [6,7]. The CN-G01 beryllium was successfully developed by China in 2005. Its basic physical and thermo-mechanical properties of the CN-G01 have satisfied the ITER requirements [7]. However, its evaluation of irradiation resistance is small.
The studies on the irradiation resistance of beryllium are mainly concerned with the irradiation damage and high helium production. The helium production rate is about 670 appm/dpa (atomic parts per million/displacement per atom) and the total helium production is about 25,700 appm for beryllium in fusion reactors [8]. The helium accumulation rate is up to 4000 appm/dpa in high energy proton irradiation environments, for example in neutrino sources [5]. Available experimental data on radiation damage effects in beryllium are mostly collected from materials irradiated by fission reactor neutrons [3,8,9,10,11]. They found irradiation induced microstructural change. Klimenkov et al investigated the bubble formation in beryllium after neutron irradiation went up to 3000–5900 appm helium [3,8]. Zimber et al studied the bubbles in beryllium after neutron irradiation to about 34 dpa and 5524 appm He [9]. They found the most important microstructures were the bubble formation at high temperatures. The shape of the bubble is spherical at 643 K and changes to the fat hexagonal prism at higher irradiation temperatures of 660–923 K [3,8,9]. Bubble size increases with irradiation temperature [3,8,9]. The density of bubbles decreases with irradiation temperatures [8]. In addition to the microstructural response, significant changes in the properties of beryllium have also been found [1,10]. After helium ion implantation to 0.1 dpa and average He content of 2000 appm, the hardness of S-200-F and S-65 grades increased by about 60% for the 200 °C irradiation and 100% for the 50 °C irradiation [1]. After neutron irradiation of (0.7–13.1) × 1022 cm−2 (E > 0.1 MeV) at 200 °C, four beryllium grades (TE-56, TE-30, TIP, DIP) produced in Russia showed significant degradation of properties, such as the increase of micro-hardness by up to 6500–8600 MPa, deterioration of strength up to 20–100 MPa after tensile tests and up to 100–800 MPa after compression tests [10]. The formation of nano-sized helium bubbles is believed to be one of the main hardening mechanisms of beryllium irradiated at low temperatures [5]. Meanwhile, these studies show that beryllium with different grades or impurity content present different properties and response of microstructure evolution and mechanical properties to irradiation [1,10,12]. The properties of S-65 beryllium exhibited higher radiation stability, e.g., smaller irradiation-induced hardening than the lower purity grade S-200-F beryllium [1]. Beryllium with higher content of BeO showed lower swelling under high temperature irradiation [12]. Therefore, the applicability of the previous data for other beryllium grades or other nuclear applications is uncertain because of different beryllium grades, different irradiation temperature region or no sufficient levels of transmutation-produced helium (lower than 6000 appm).
Therefore, the investigation on the irradiation resistance of CN-G01 beryllium is important and necessary for its use in nuclear systems, especially the helium effects on its mechanical properties and microstructures. Helium induced surface morphology of CN-G01 beryllium has been conducted recently, but it does not study the mechanical properties and microstructure of helium bubbles [12]. In this paper, the microstructure, surface modification and nano-hardness changes induced by helium irradiation in CN-G01 beryllium are studied at different fluences. The helium irradiation temperature is room temperature, which is close to the lower limit of expected irradiation temperature for beryllium used in fusion reactors and beam-window [1,5]. The microstructure and surface modification are observed by TEM (transmission electron microscope) and SEM (scanning electron microscope), respectively. The mechanical properties are measured by nano-indentation technology for the filmy helium irradiation layer. This paper is structured as follows. First, the investigated beryllium grades, irradiation conditions, the TEM, SEM and nano-dentation hardness experiments are described. Then, the surface morphology, microstructure change and nano-indentation hardness of the implanted layers are shown and discussed based on the helium behavior at low temperatures, and the meaning of this work for the use of CN-G01 beryllium is discussed.

2. Materials and Methods

The material studied in this study was CN-G01 beryllium supplied from CNMC Ningxia Orient Group Co. Ltd, Shizuishan, China. It was manufactured by the vacuum hot-pressing approach. The major chemical composition of CN-G01 beryllium is given in Table 1. The purity of CN-G01 beryllium is higher than 99% in weight percentage. Before He implantation, the samples were mechanically polished to mirror-like surfaces. He ions with an energy of 180 keV were perpendicularly implanted into the polished samples at the 320 kV Multi-Discipline Research Platform for Highly Charged Ions in Institute of Modern Physics, Chinese Academy of sciences (IMP, CAS), Lanzhou, China. The ion beams were swept in two perpendicular directions to ensure a uniform distribution. The ion flux was about 4.4 × 10¹³~5.4 × 10¹³ ions/cm2/s. The ion fluences were 5.0 × 10¹⁶ ions/cm2, 1.0 × 10¹⁷ ions/cm2, 5.0 × 10¹⁷ ions/cm2 and 1.0 × 10¹⁸ ions/cm2. The implantation temperature was room temperature (RT).
The theoretical results of dpa levels and helium concentrations of the implanted samples were calculated with SRIM (The stopping and Range of Ions in Matter) [13] and are shown in Figure 1. The displacement energy of beryllium was set to 37 eV as calculated in Reference [14]. As recommended in Reference [15], both the surface energy and binding energy were set to be 0 eV. Meanwhile we selected the mode of “Ion Distribution and Quick Calculation of Damage”. It can be seen from Figure 1 that the depths of peak dpa and the peak helium atom concentration are about 900 and 950 nm from the surface, respectively. The cross sections of peak dpa and the peak helium atom concentration are 1.13 × 10⁻¹⁷ dpa/(ions/cm2) and 5.85 × 10⁻¹⁷ He atoms %/(ions/cm2), respectively. The peak dpa and helium concentration for the specimen with different fluences are given in Table 2. It shows that the peak dpa range is 0.565~11.3 dpa and the peak He concentration range is 2.93~58.5%.
After helium implantation, the surface morphology was observed by FESEM (Nano-SEM 450, FEI Company, Hillsboro, OR, USA). The microstructure observation was carried out with cross-sectional TEM samples, which were prepared by using a FIB device. The cross-sectional TEM foils were prepared in both areas with surface blister and areas without surface blister, for samples with 5.0 × 10¹⁷ ions/cm2, and 1.0 × 10¹⁸ ions/cm2. The TEM investigation of the microstructure in beryllium was in a FEI Tecnai F20 TEM (FEI Company, Hillsboro, OR, USA) equipped with a double-tilt goniometer stage and operated at 200 kV with a field emission gun. Nano-indentation tests (NIT) were carried out to obtain the mechanical properties by using an Agilent Nano Indenter G200 (Agilent Technologies Inc., Santa Clara, CA, USA) with a Berkovich tip (20 nm in radius) in the continuous stiffness mode (CSM). The indenter was normal to the sample’s surface. Six indentations were carried out in each sample. Each indentation was set to be 2 um in depth and 30 um apart in order to avoid any overlap of the deformation region caused by other indentations.

3. Results and Discussion

3.1. Surface and Sub-Surface Morphologies

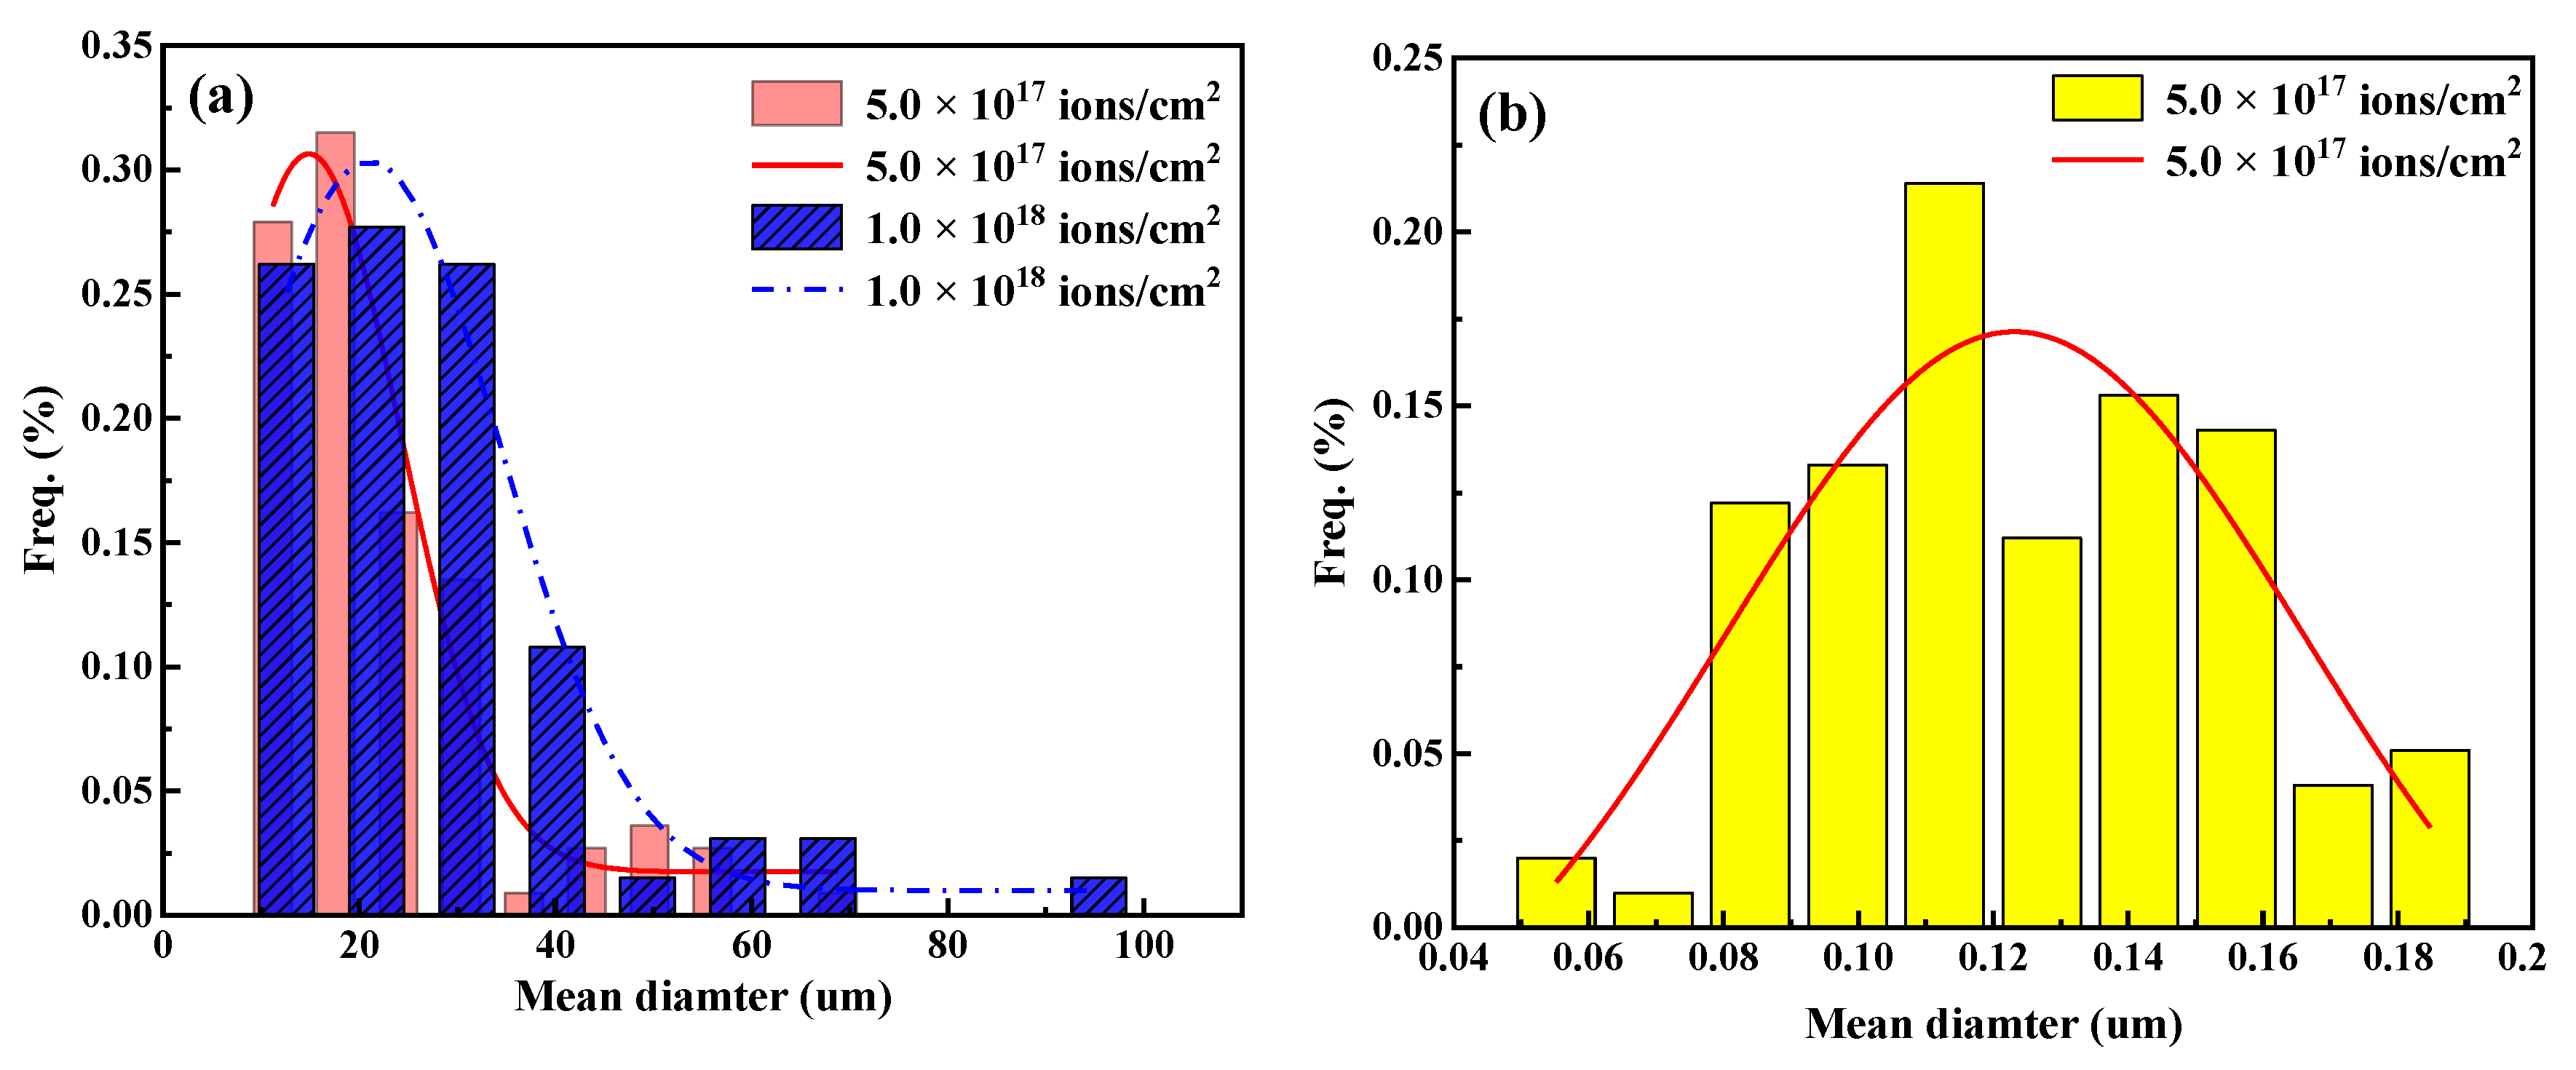
Figure 2 shows the surface morphology of the un-implanted sample and implanted samples with fluences of 5.0 × 10¹⁶ ions/cm2 to 1.0 × 10¹⁸ ions/cm2, under different magnifications. These pictures were taken under electronic beams perpendicular to the surface. Figure 2a–e show the pictures at a larger magnification. Figure 2a’,d’,e’ show the morphologies at a lower magnification. It can be seen from Figure 2b,c that when the implantation fluences are 5.0 × 10¹⁶ ions/cm2 and 1.0 × 10¹⁷ ions/cm2, surface morphologies do not change. When the implantation fluence increases to 5.0 × 10¹⁷ ions/cm2 and more, surface morphology changes significantly. At the lower magnification, as shown in Figure 2d’,e’, serious blistering occurs as indicated by yellow arrows and some of the blisters burst as indicated by red arrows. It should be noted that we do not indicate all the blisters by arrows. The shapes of the blisters are not perfect circles. The sizes of blisters were from 8 um to ~100 um and the average size is about 15 ± 1.8 um as given in Figure 3a. With increasing implantation fluences to 1.0 × 10¹⁸ ions/cm2, the average size of a blister increases to about 21 ± 1.4 um, and the burst fraction of blisters also increases. Similar blister and exfoliation were observed in steel with a high helium fluence at RT [16] and beryllium at higher temperatures [17]. If we zoom in on the picture, some nano-sized blisters were observed on the surface of the sample with fluence of 5.0 × 10¹⁷ ions/cm2, as indicated by black arrows in Figure 2d. It should be noted that we do not indicate all the nano-sized blisters by arrows. Its size distribution statistics on many pictures are shown in Figure 3. The size range of the blister is 49~192 nm and the average size is about 124 nm, much smaller than the blisters shown in Figure 2d’,e’. When increasing fluences to 1.0 × 10¹⁸ ions/cm2, the density of nano-sized blisters drops drastically and can only be observed occasionally as shown in Figure 2e. They are mostly bigger ones clustered by multiple nano-sized blisters.
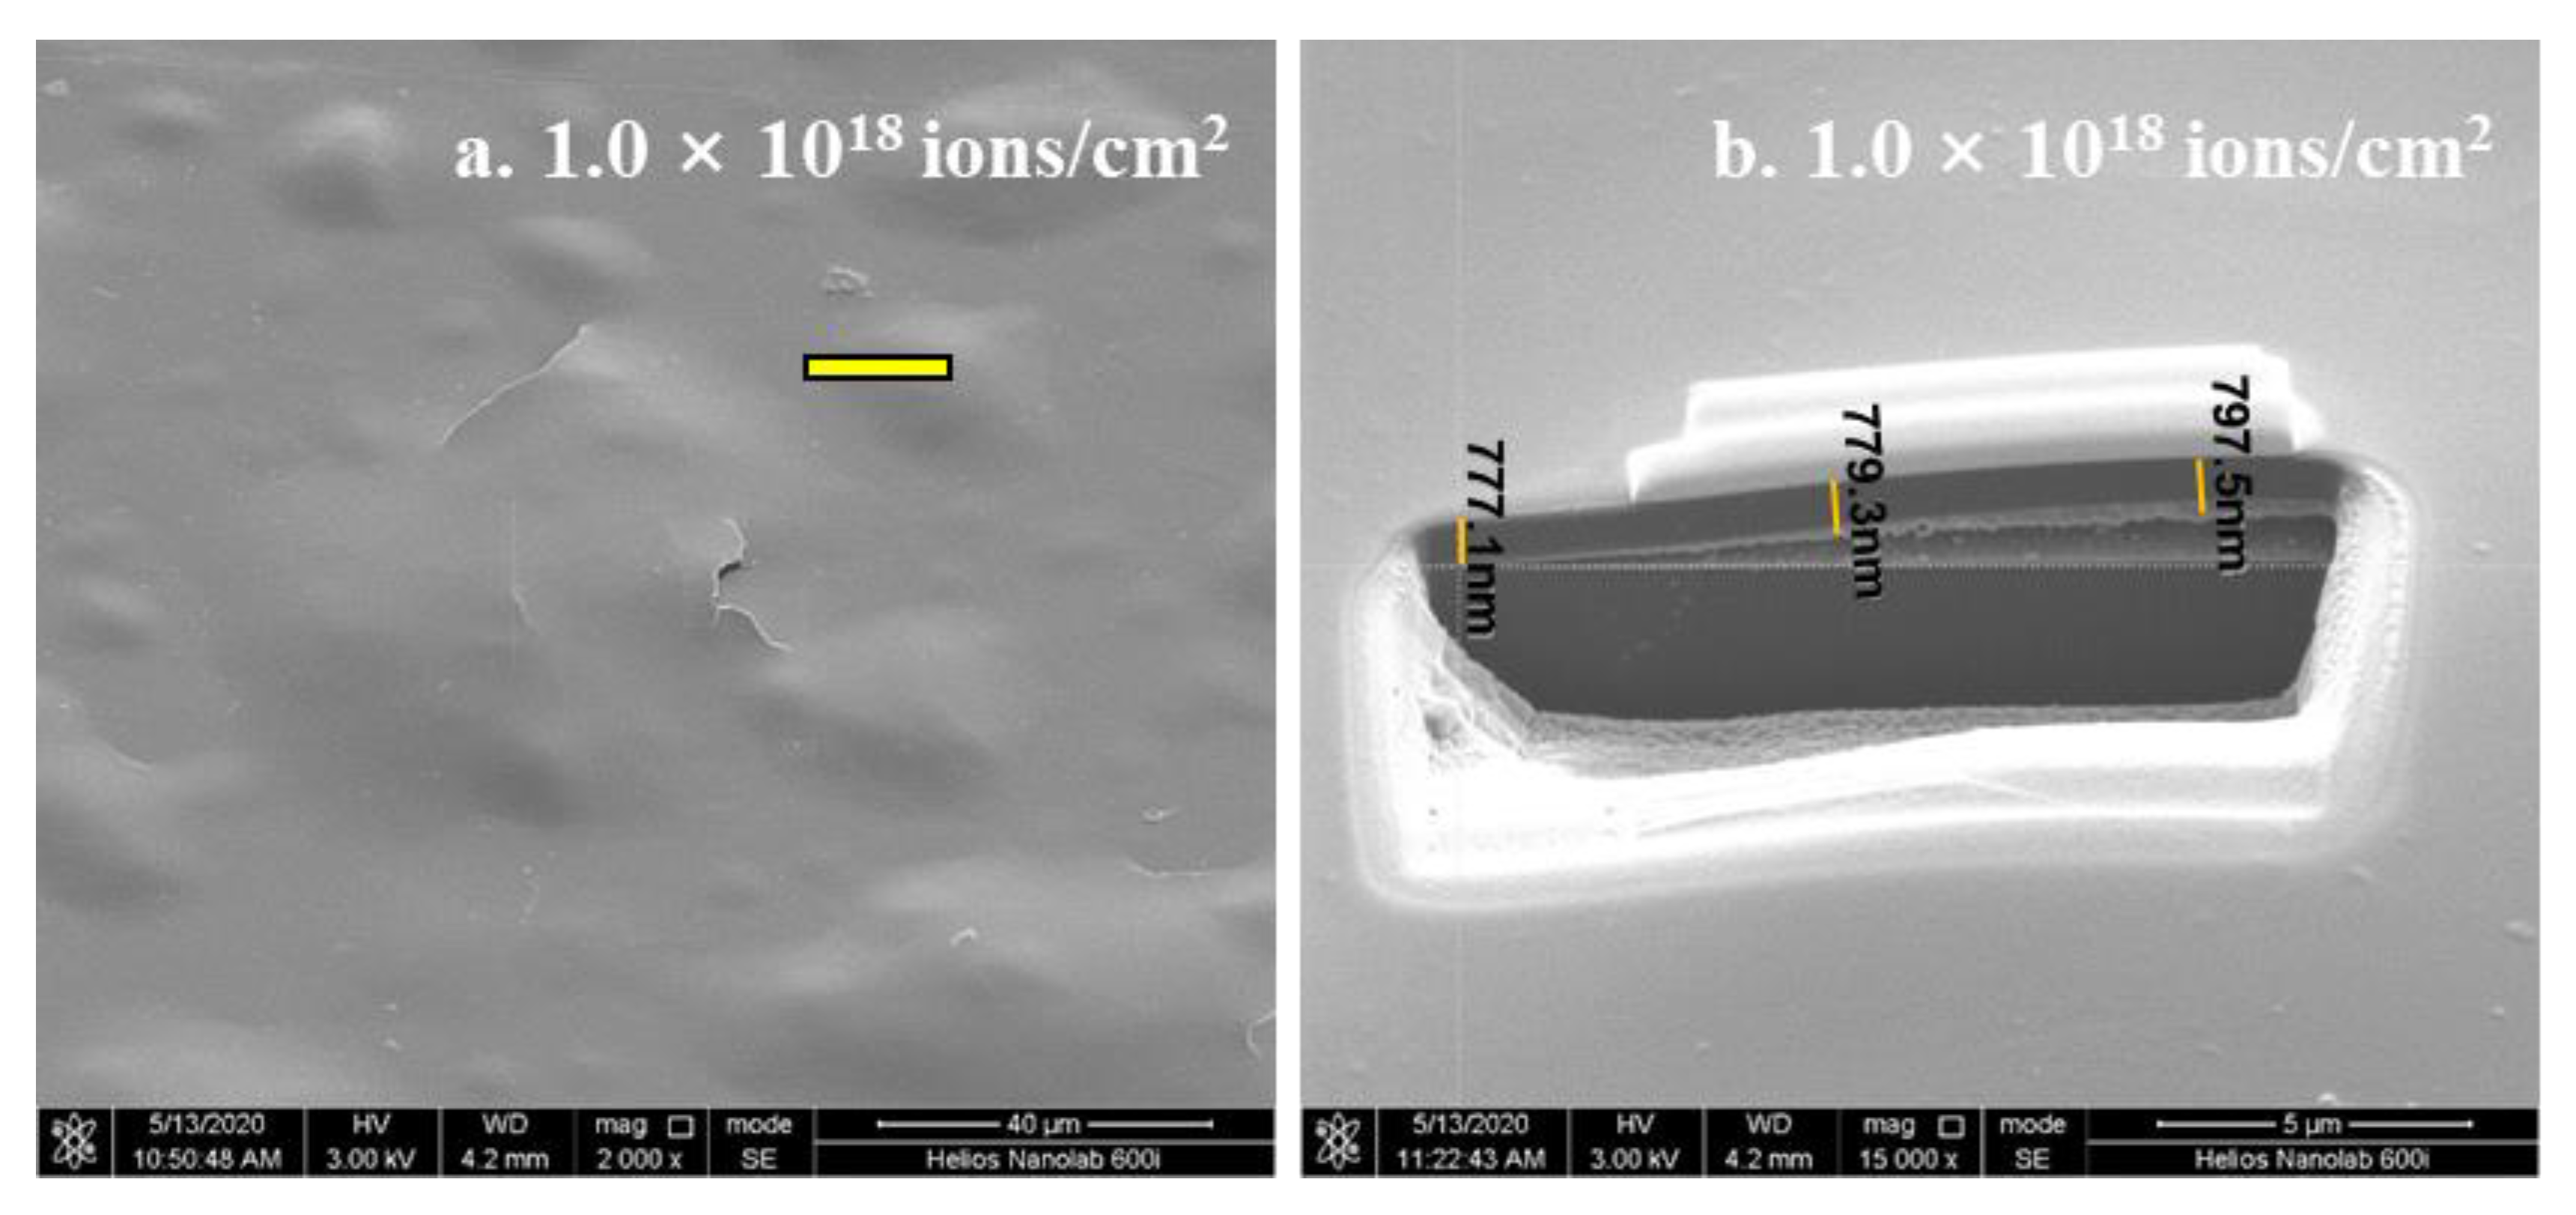
In order to understand the intrinsic cause of blistering, the sub-surface morphology observation of the blister was conducted with the cross-sectional SEM and obtained in Figure 4b. This picture was taken under a tilt angle of 52°. A long crack can be seen under the blister. The blister’s skin width is about 990 nm (equaling to ~780 nm/sin 52°), which is in accordance with the depth of the helium deposition peak zone as calculated with SRIM. This suggests that the blister and its burst relate to the helium in the damage peak zones.
Usually, the reasons for the blistering phenomenon may be multifaceted, such as high implantation fluence, surface condition, and subsequent ion bombardment and so on. In this work, there are two major reasons. One is the sub-surface condition after different surface polishing methods. Comparing our work with reference [18], the CN-G01 beryllium grade was the same, while it showed only some small blisters but no large blisters and their burst after the same fluences (5.0 × 10¹⁷ ions/cm2 and 1.0 × 10¹⁸ ions/cm2) at the same implantation temperature of RT. The only difference is the surface polishing method between the mechanical polishing in this work and chemical polishing in reference [18]. Mechanical polishing of surface leads to a harder and greater strained layer than chemical polishing, which would lead to a more serious surface modification after irradiation. This can explain the differences of observed surface between this work and reported work [18]. Another difference, and the most important one, is the high implantation fluence, which introduces a high He concentration in the peak region. In this work, when the fluence is 5.0 × 10¹⁷ ions/cm2 and 1.0 × 10¹⁸ ions/cm2, the peak He concentration reaches as high as 29.3 and 58.5%. The large amount of helium atoms would induce bubble formation and is followed by blisters. The inter-bubble fracture is a typical blistering mechanism proposed by Evans [19]. If the stress between bubbles is larger than the yield strength of the material, some large bubbles could be merged into huge bubbles (or internal crack) with several micrometers in diameter and the surface will blister. The diameter of the blister is usually more than 10 times the peak depth and in this work the times are about 15~23. The nano-sized blisters observed at 5.0 × 10¹⁷ ions/cm2 may be due to the merged bubbles, which are not accidentally under this condition of He concentration. With continuous ion bombardment, more helium atoms are absorbed by bubbles and bubbles grow larger to form larger blisters. This is probably the reason for the larger blisters and fewer nano-sized blisters at fluence of 1.0 × 10¹⁸ ions/cm2. If the pressure in the blister is large enough, some blisters will rupture and strip off. If the ion fluence is larger, the subsequent generation of blisters would form in the exfoliated surface [20], which was not observed in this study. Usually, if the temperature is higher, the surface would change more obviously. The surface blistering is adverse to the nuclear facilities and not expected during its service. In this work, blistering was observed for the fluence of 5.0 × 10¹⁷ ions/cm2 (29.3% He), while not observed for the fluence of 1.0 × 10¹⁷ ions/cm2 (5.85% He). Therefore, it is better that the accumulated He concentration must be below 29.3% at any temperatures for the use of CN-G01 beryllium. Nevertheless, we do not know what would happen on the beryllium surface when the He concentration is between 5.85% and 29.3%. Therefore, the highest acceptable He concentration for its service can not be given in this work.

3.2. Microstructure Evolution of Helium Implanted Beryllium

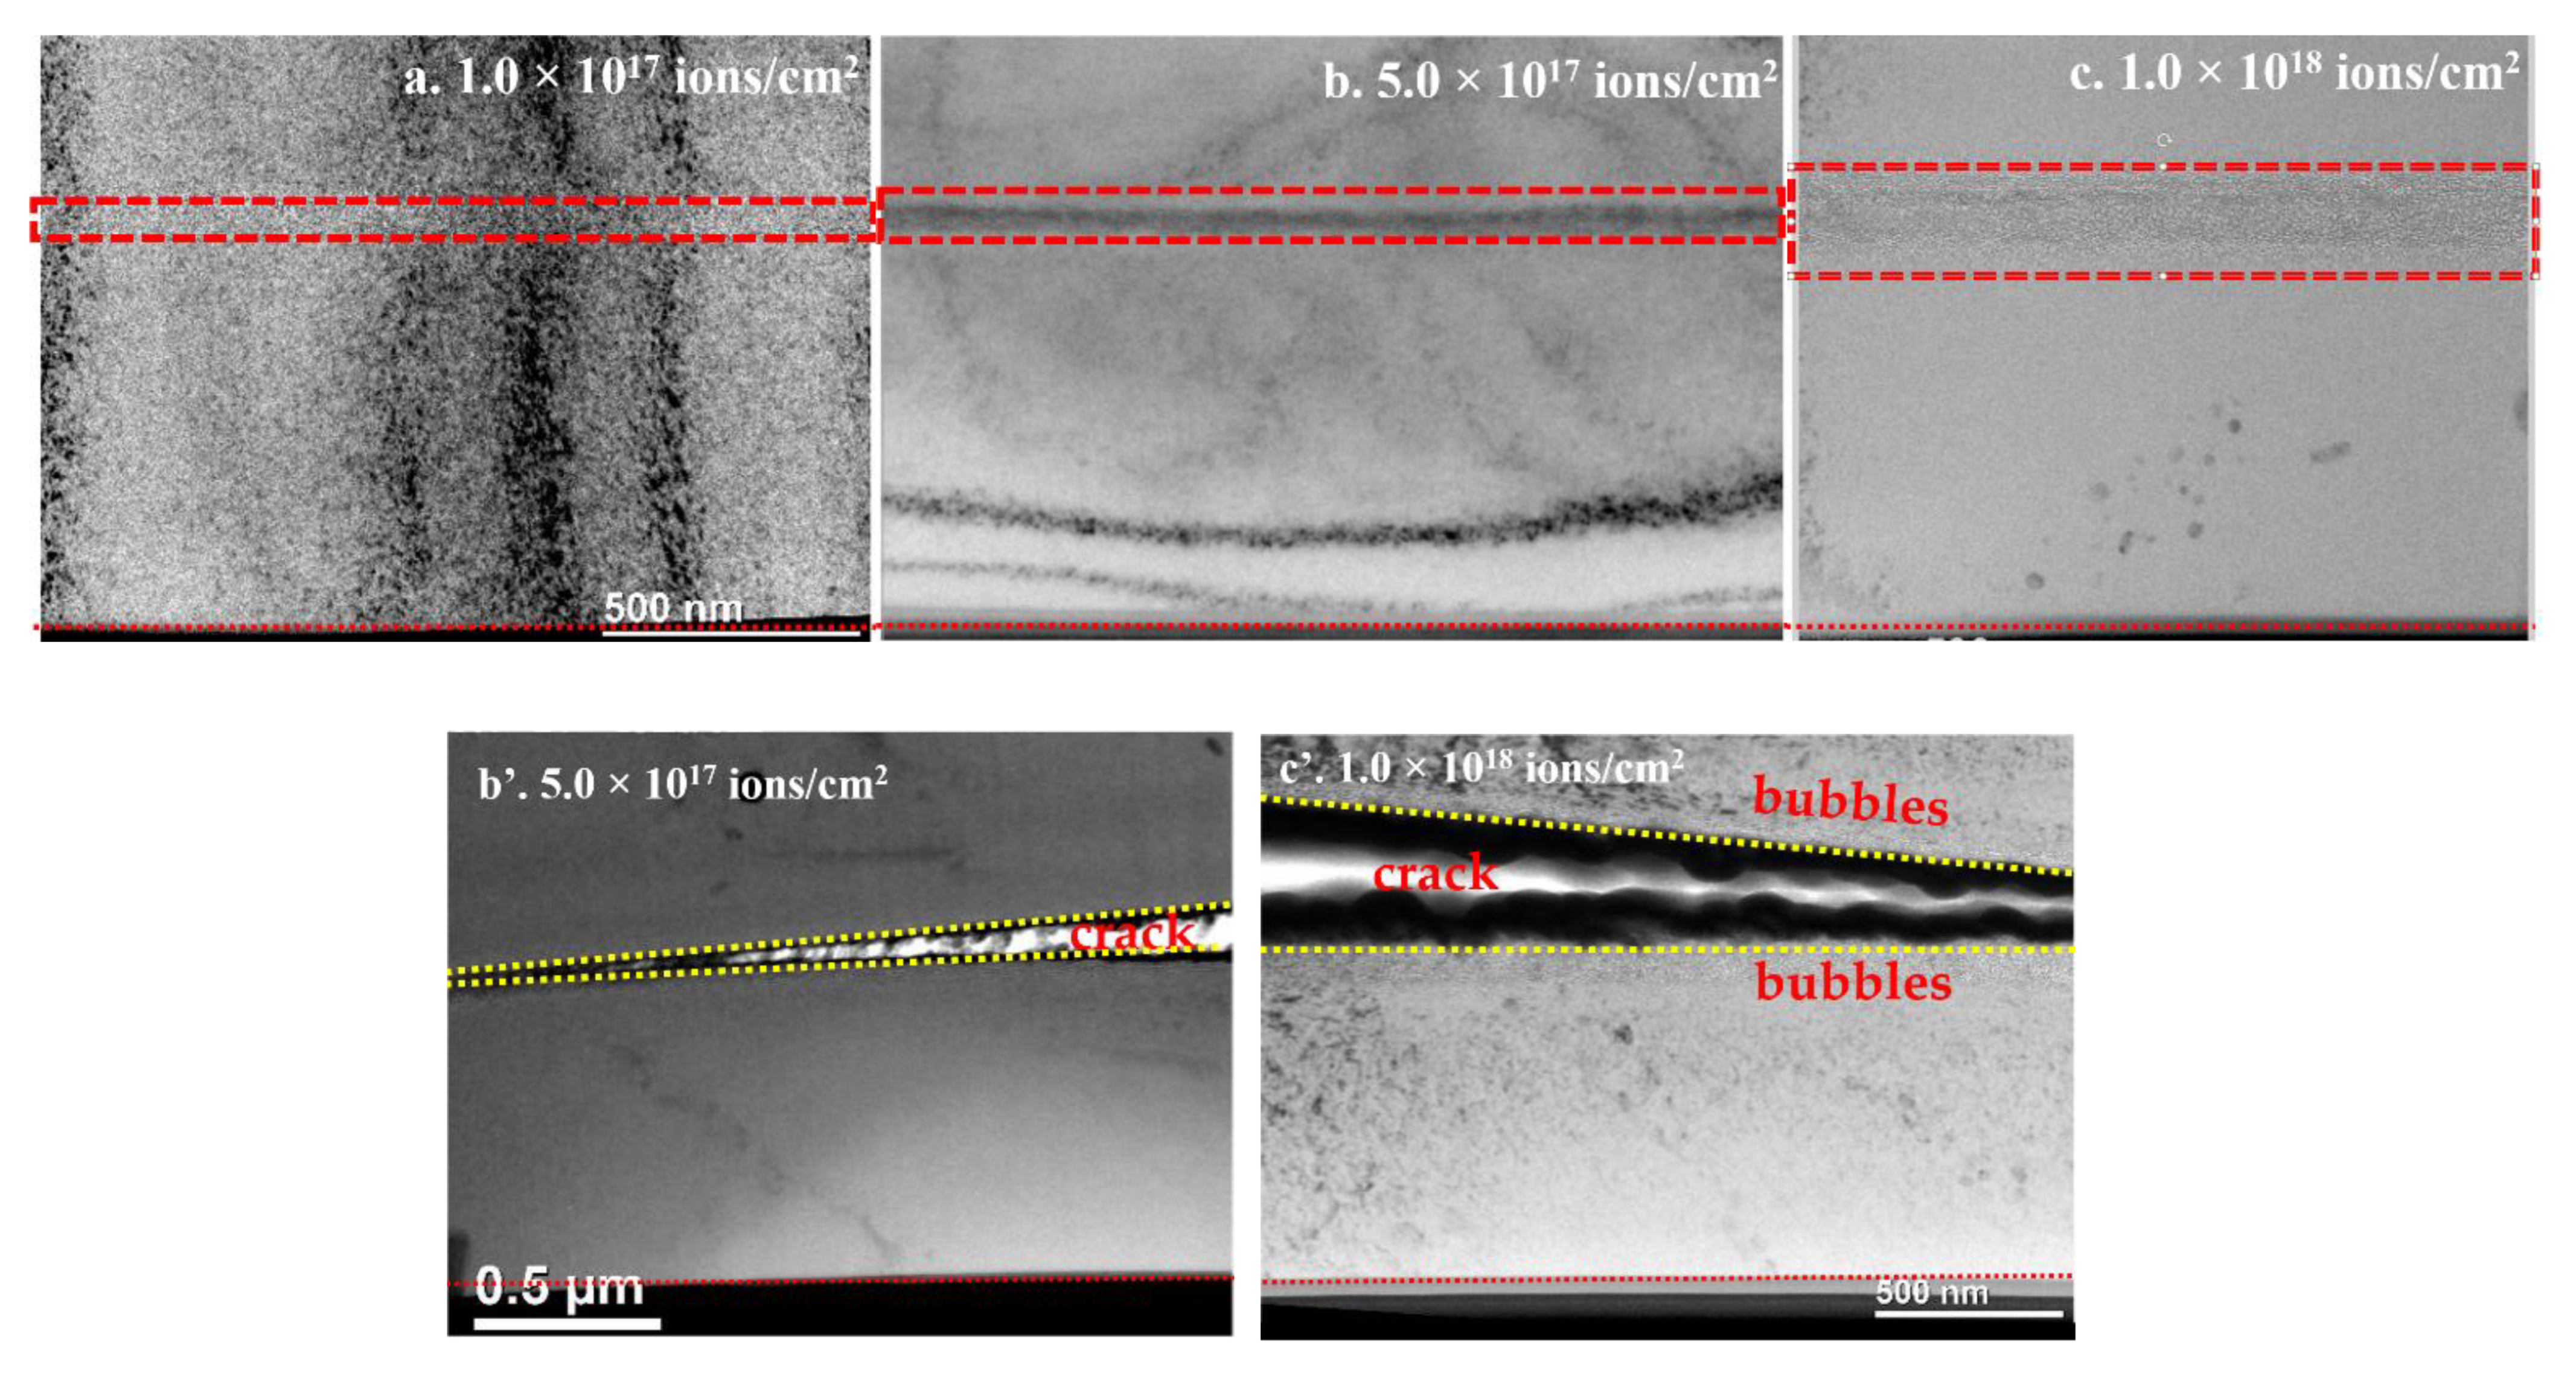
Figure 5 shows the helium implantation induced microstructure changes in beryllium below the implantation surface. No obvious damage zone can be observed under a fluence of 5.0 × 10¹⁶ ions/cm2, which indicates that there are no TEM discriminable helium related defects in this sample. Therefore, the TEM image is not shown here. After helium implantation to 1.0 × 10¹⁷ ions/cm2 and more, significant damage zones can be seen and shown in Figure 5. It indicates that the threshold He fluence for helium bubble formation is between 5 × 10¹⁶ ions/cm2 and 1.0 × 10¹⁷ ions/cm2, which is the same as that in reported studies of beryllium [9,10]. Considering there were blisters on the surface of the samples with fluences of 5.0 × 10¹⁷ ions/cm2 and 1.0 × 10¹⁸ ions/cm2 as given in Figure 2d’,e’, the microstructures under surfaces with and without blisters were both observed. Figure 5b,c show the microstructures without surface blister. It can be seen that the significant damage zone containing a great number of helium bubbles is in the damage peak zone, of about 800–1000 nm from the surface, as shown by a red rectangle in Figure 5a–c. It is in accordance with the SRIM calculation results. Detailed measurement shows that the depth regions of damage peak with dense helium bubbles are about 790–870 nm, 840–950 nm and 790–1000 nm in the samples implanted to 1.0 × 10¹⁷ ions/cm2, 5.0 × 10¹⁷ ions/cm2 and 1.0 × 10¹⁸ ions/cm2, respectively. Therefore, the width of the dense helium bubble zone in samples with fluences of 1.0 × 10¹⁷ ions/cm2, 5.0 × 10¹⁷ ions/cm2, and 1.0 × 10¹⁸ ions/cm2 are 80 nm, 110 nm, and 210 nm, respectively. This indicates that the width of the damage peak zones increases with increasing fluences. It is mainly related with the size or density increase of helium bubbles, which usually induces irradiation swelling [1,11], as well as the increased widths of damage zones. Figure 5 b’,c’ show the microstructures with surface blisters. Long cracks have been found and shown between two yellow dashed lines in Figure 5b’,c’, which is in accordance with the cross-sectional SEM results showed in Figure 4b. In addition to the cracks, helium bubbles along both sides of the cracks are also obviously seen. It indicates the surface deforms in the middle of the damage peak region to induce blisters or exfoliation. It should be noted that the black contrast in the crack in Figure 5b’,c’ was Pt, which was induced by FIB cutting.
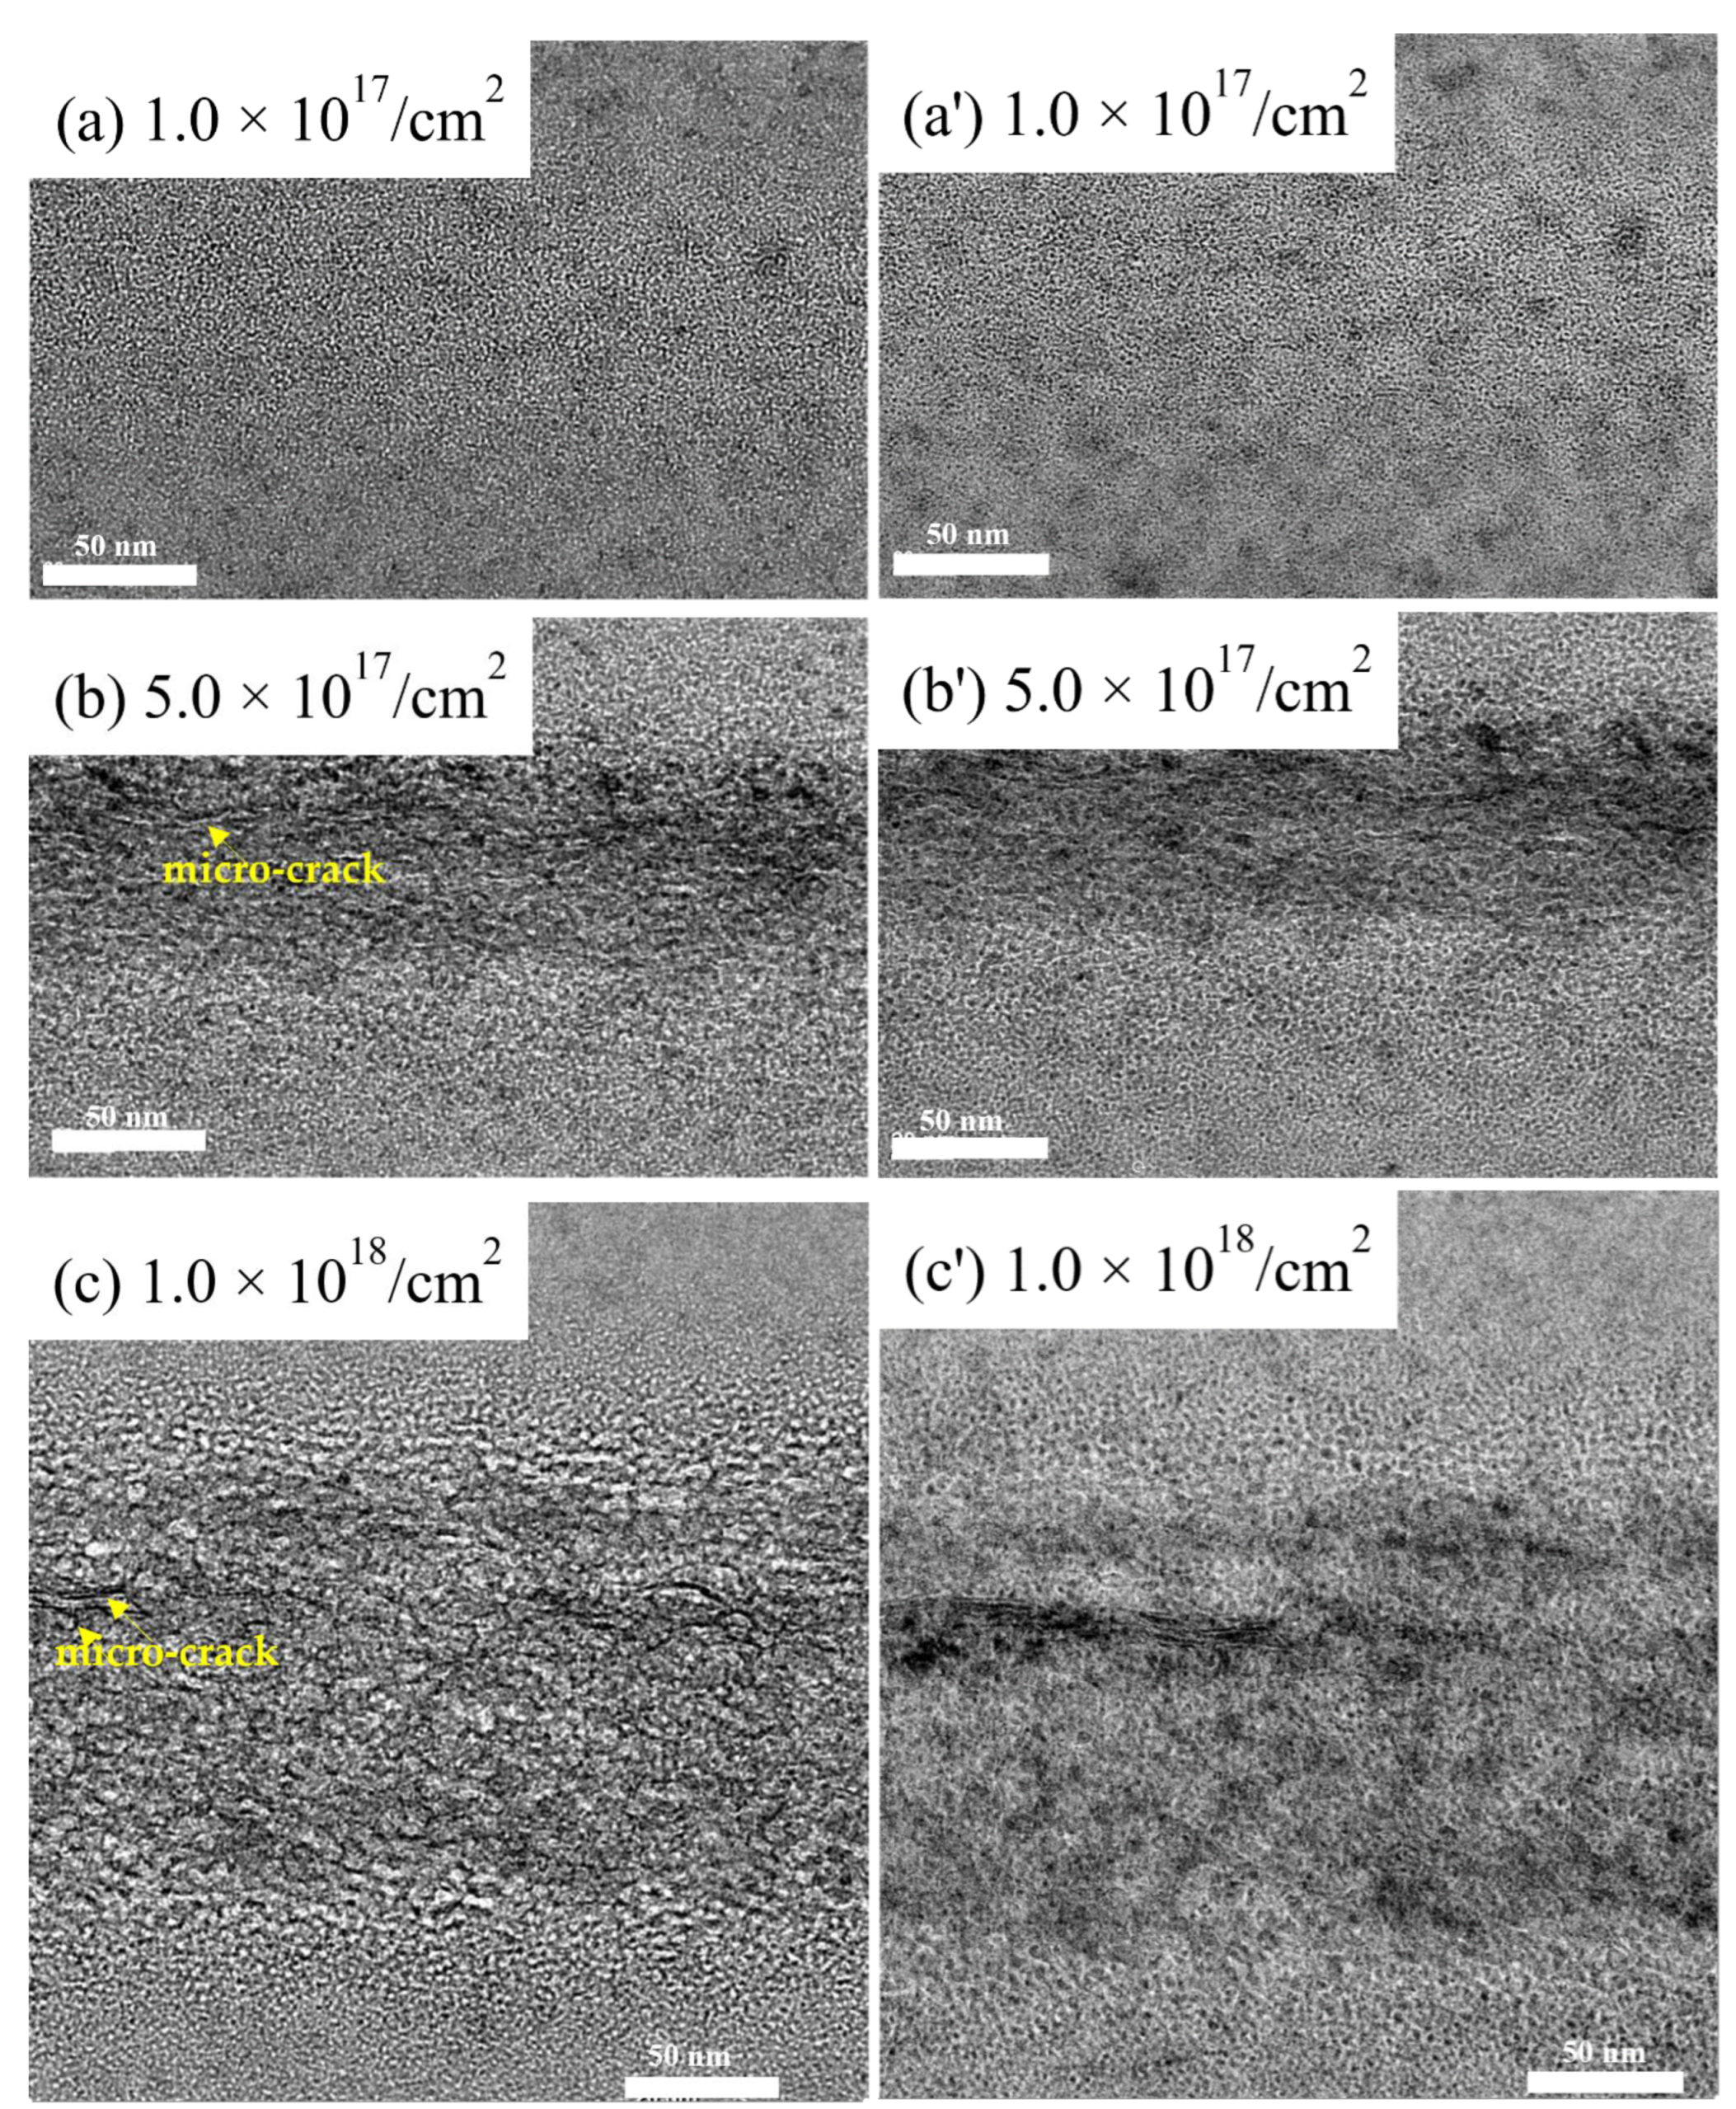
Detailed observation of significant damage zones was conducted and it was found there were no obvious differences in the helium bubbles between areas with and without surface blisters. Therefore, detailed observation in areas without a blister is given in Figure 6, which presents the typical helium bubble morphologies under focus and over focus in different implanted samples for comparison. It can be seen from Figure 6a,a’, at 1.0 × 10¹⁷ ions/cm2, that the tiny helium bubbles are as small as about 0.5nm in average diameter and the density is about 3.8 × 1024 /m3. Most of them locate all alone. It can be seen from Figure 6b,b’,c,c’, when the implantation fluence increases, helium bubbles combine together and become larger. The size of helium bubbles depends on the distance from the surface and has a peak-like distribution because of the non-uniform distribution of helium concentration and dpa. At the peak center, bubbles connect each other into larger bubbles (up to 10 nm) and micro-cracks. The extension of the micro-cracks induced the long crack formation in Figure 5b’,c’ and the surface blister. However, in this work there are no gas bubbles in the shape of thin hexagonal prisms as observed at high temperatures [3,8,9], since the low implantation temperature.
In addition to the significant damage zones, the microstructures in other damage zones were also observed. It is found that there are helium bubbles in the whole damage region of the sample with the largest fluence of 1.0 × 10¹⁸ ions/cm2 as given in Figure 7. The size of helium bubbles in the first 700 nm is much smaller than those in the damage peak region, and there is no obvious depth distribution difference in the first 700 nm. This is in accordance with the uniform depth distribution of helium concentration given in Figure 1.
The above phenomena can be explained based on the helium behavior in beryllium at low temperatures. During helium implantation, a large number of vacancies and deposited helium atoms were induced firstly. The solubility of helium in α-Be is very low due to its high formation energies in Be (~5.6 eV [21,22,23]). The diffusion energy of helium atoms in beryllium is relatively low (~0.1eV based on first-principles calculations [22,24], 0.6 ± 0.2 eV based on the molecular dynamic simulation [25] and experiments [26]). Therefore, the interstitial helium atoms easily diffuse two-dimensionally at low temperatures [21] and would result in the formation and growth of helium bubbles. At room temperature, which is in the low temperature region (T < 0.2 Tm, Tm is the melting temperature), the primary bubble formation is a type of athermal process and there are mainly two nucleation and growth mechanisms of helium bubbles. The first is di-atomic nucleation and self-trapping. Similar to many other metals, helium atoms in beryllium attract each other with a binding energy of 0.83 eV for in-basal-plane pair and 1.35 eV for out-of-basal plane pairs [27]. The second is vacancy trapping. A lot of vacancies (V) were generated during the irradiation process. They would capture the helium atoms to form He-V complexes because of the high binding energy between vacancy and helium (for He-V, 3.1 eV [25]). Normally, this will result in the very quick and efficient capture of interstitially dissolved helium atoms by vacancies and He-V complexes. In this work, He-V nucleation would dominate near the surface; the “di-atomic nucleation” would be more important with increasing depth especially near the end of the irradiation range where the He/V ratios are larger. In addition to the two mechanisms, impurities might be expected to work as nucleation sites for helium bubbles as well [3], but it was not observed in this study. With increasing fluence, the nucleated di-atomic or He-V complexes grow larger by capturing more helium atoms and vacancies or by extruding self-interstitial atoms. Helium bubbles become observable after enough fluence, especially in the damage peak zone with a higher damage than other zones. The size of helium bubbles (~0.5 nm) in the sample irradiated to 1.0 × 10¹⁷ ions/cm2 was similar to that reported in References [17,28] under a similar irradiation condition, but smaller than those reported by P.P. Liu et al [29], in which the bubbles were about 2.7 nm. One possible reason could be the surface sink effects. Comparing our work with reference [29], the irradiation conditions are both RT and 1.0 × 10¹⁷ ions/cm2, but a difference is bulk sample in our work and thin-foil sample in reference [29]. In reference [29], because the implantation was performed with lower energy ions directly on TEM thin-foil, self-interstitial atoms could diffuse to the thin-foil surface and were absorbed by surface sinks. Therefore, recombination of interstitials and vacancies cannot be fully achieved and a higher concentration of vacancies inside the thin-foil was left [30]. The abundance of vacancies can result in the larger bubble size in reference [29].
With further increasing fluences, the size or inner pressure of helium bubbles increases, which leads to the connection of helium bubbles or inter-bubble fracture, and then the formation of platelets or micro-cracks at a higher fluence. As a result of the highest helium concentration and displacement damage in the damage peak center, it is easier for the platelets or micro-cracks to develop in the damage peak center. When more and more helium bubbles fractured or connected to each other, the platelets or micro-cracks in the damage peak center would evolve into long cracks with bubbles on both sides of the crack as shown in Figure 5b’,c’. Meanwhile, the higher inner pressure in the crack would deform the surface morphology and result in the surface blisters as shown in above SEM results.

3.3. Nano-Indentation Test

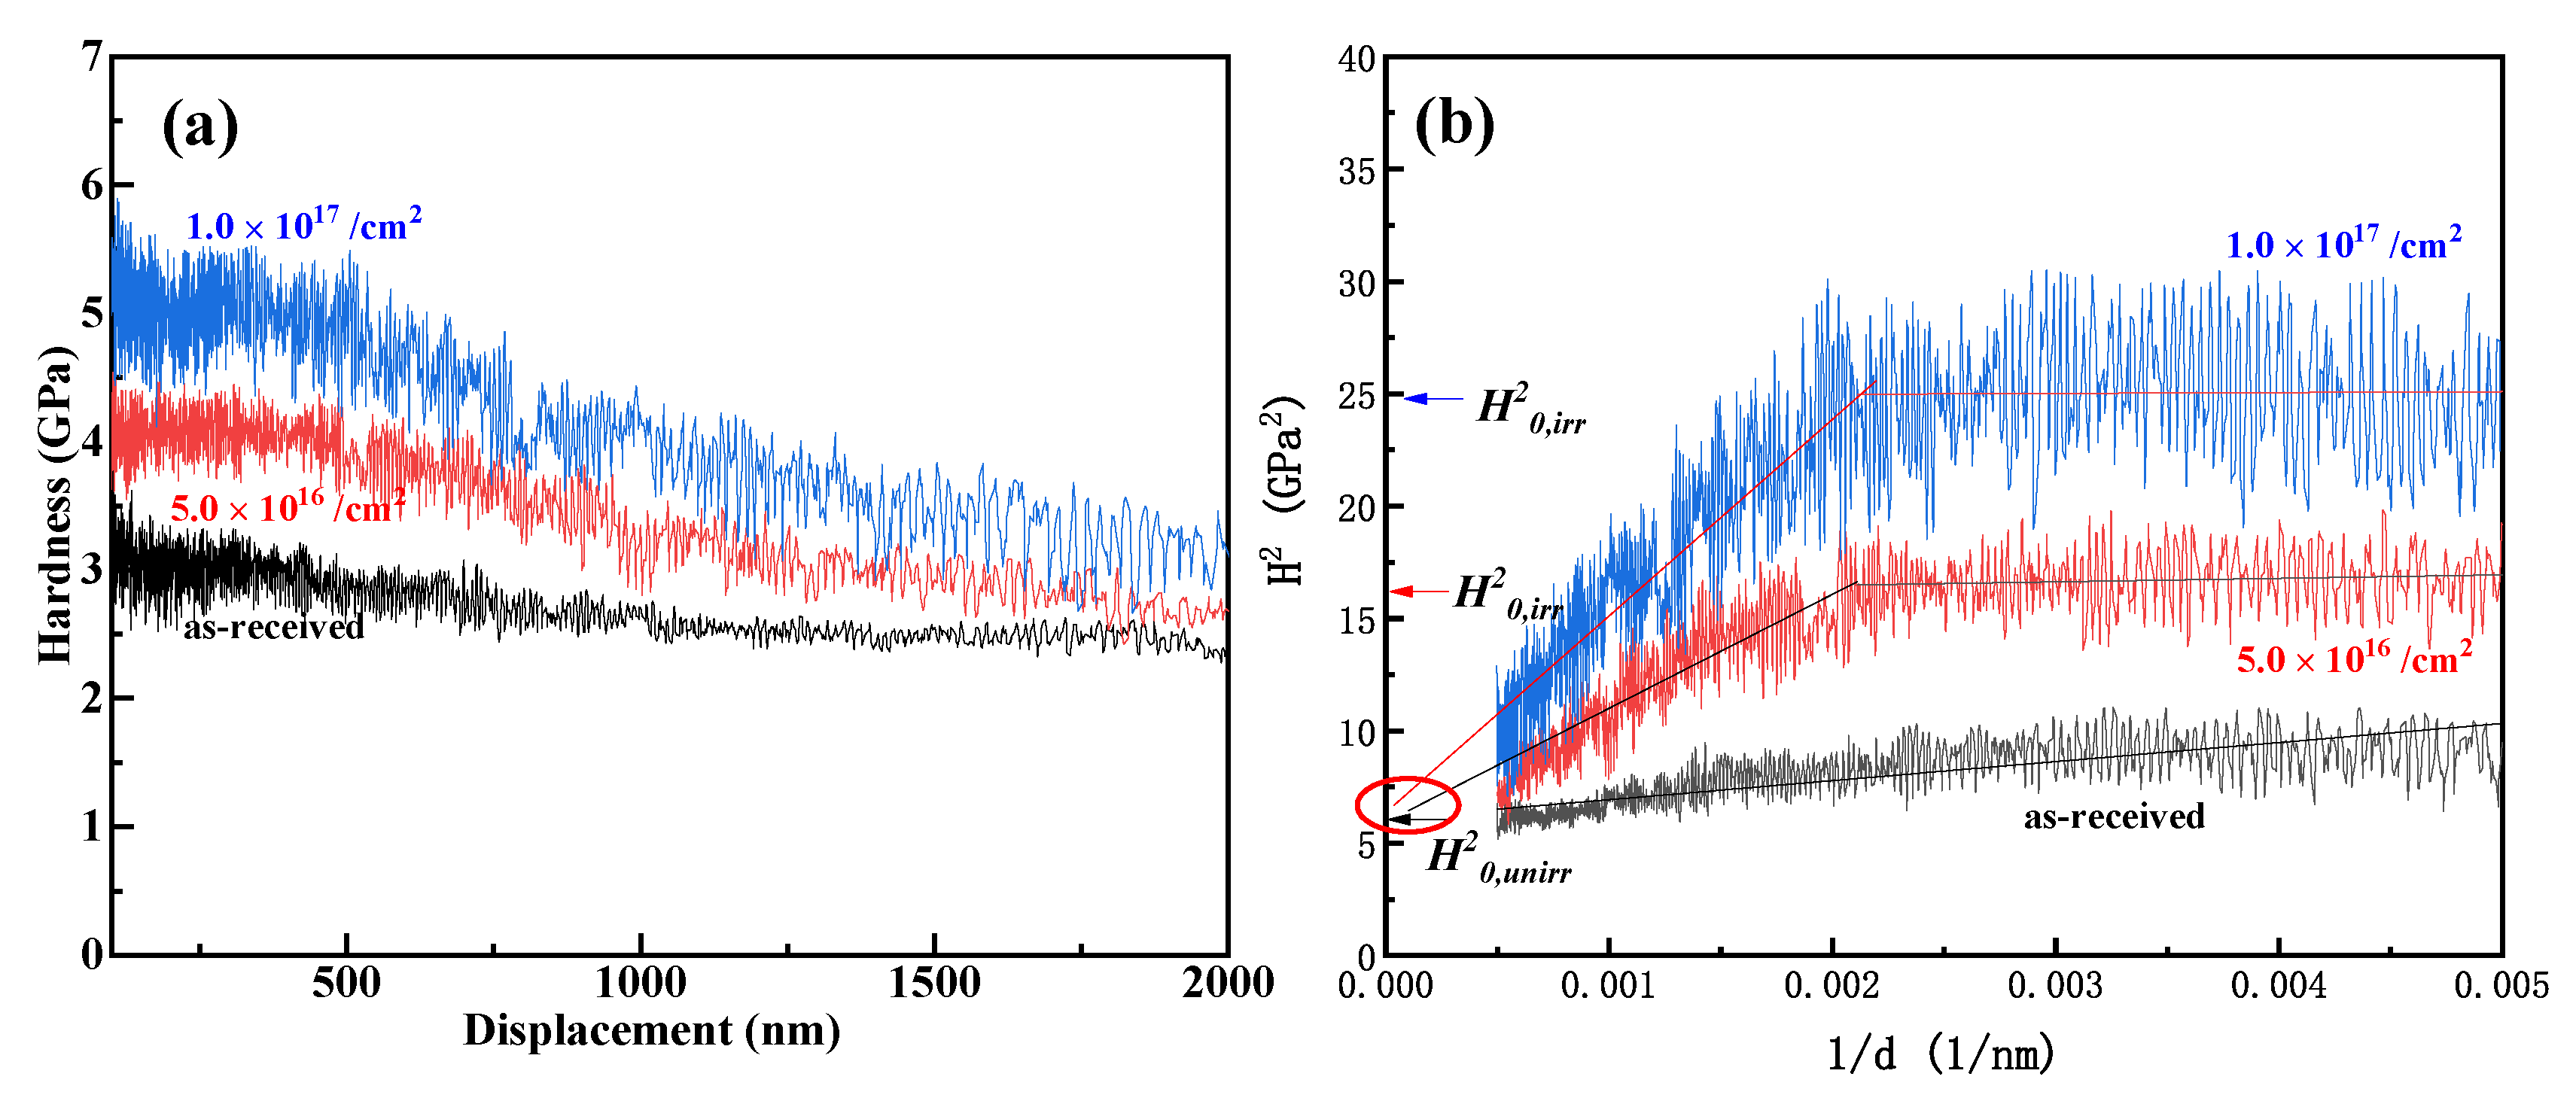
Figure 8a presents the nano-hardness profiles of the as-received and helium irradiated samples at fluences of 5.0 × 10¹⁶ ions/cm2 and 1.0 × 10¹⁷ ions/cm2 measured with the nano-indentation test. When the fluences are 5.0 × 10¹⁷ ions/cm2 and 1.0 × 10¹⁸ ions/cm2, the nano-indentation tests could not be performed because blisters and exfoliation occurred on the surface as shown in the above SEM results. Due to the uncertainty of indenter geometry and testing artifacts, hardness data between the surface and 100 nm are not reliable. Thus, we take the values at the depth deeper than 100 nm for analysis. The hardness of the as-received sample shows a trend of decrease with increasing depth which is the indentation size effect (ISE) [31]. The measured hardness (H) can be expressed as the following function:
H = H 0 1 + h * d
in which, H 0 is the hardness at infinite depths (i.e., macroscopic hardness or nominal hardness), h* is a characteristic length which depends on the material and the shape of indenter tip, and d is the indent depth.
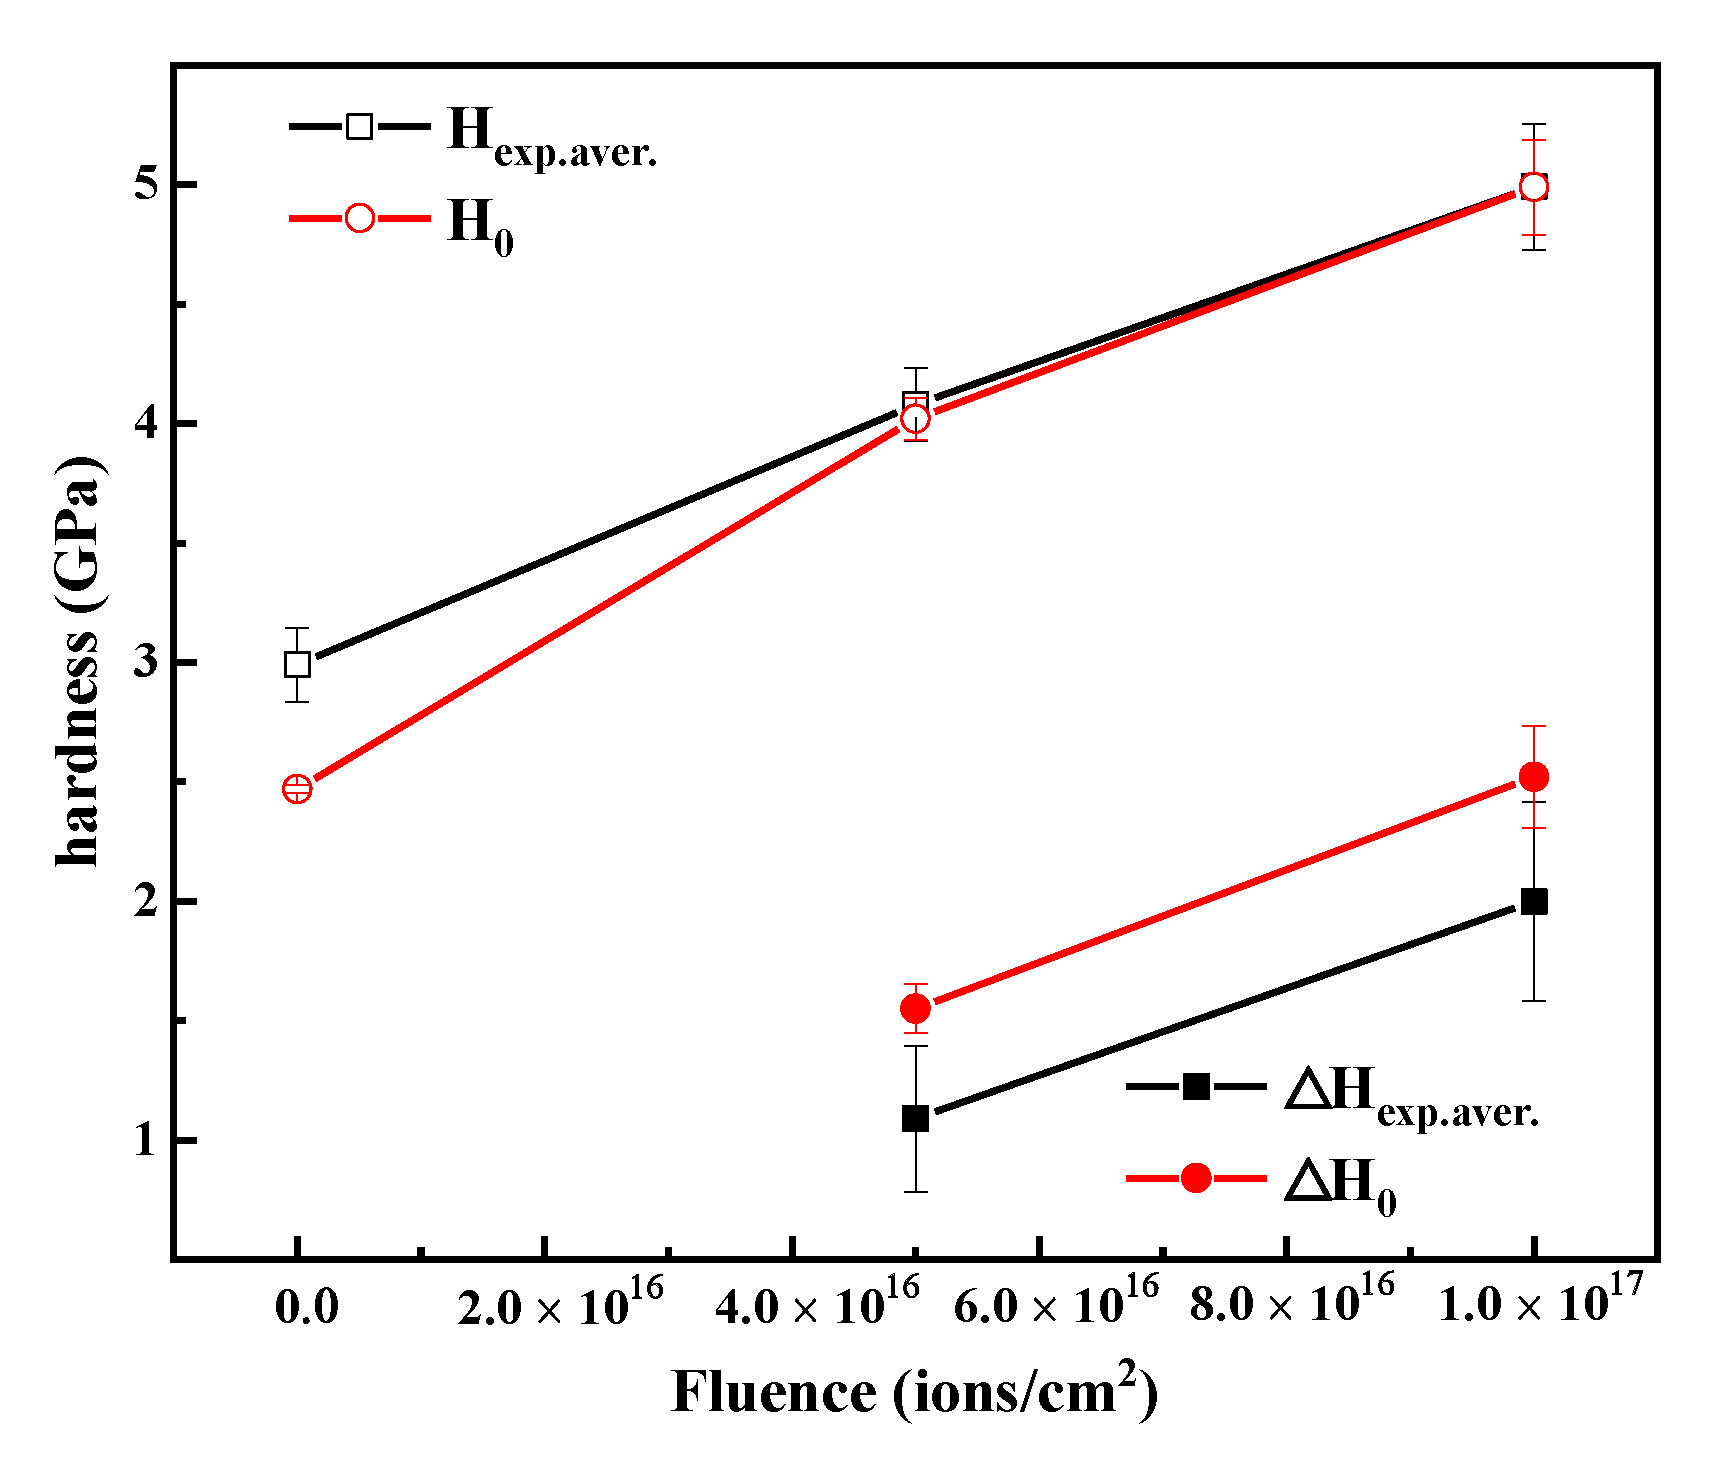
To remove the ISE, the nominal hardness H 0 can been evaluated with the Kasada method [32]. The H2 vs. 1/d plots and corresponding fitted lines are given in Figure 8b. For the un-irradiated sample, it showed a linear relation between H2 and 1/d when deeper than 200 nm, which can be explained through ISE. Thus, the nominal hardness of the un-implanted sample (H0,unirr) can be calculated as 2.47 ± 0.016 GPa, which is similar to the microhardness of un-irradiated beryllium in reference [10]. After helium irradiation, the hardness values of the samples are higher than that of the un-irradiated sample, and the hardness increases with increasing fluences, as given in Figure 8a. Meanwhile, the hardness data of irradiated samples are plotted as H2 versus 1/d curves in Figure 8b which gives a bilinear relation as found in various irradiated materials [32,33]. The intercepts of the unirradiated region of the irradiated samples and the unirradiated sample are shown with a black arrow in a red circle in Figure 8b. It can be seen that the three intercepts are similar, which indicates the uniformity of the original samples. The intercepts corresponding to the irradiated regions of the irradiated samples are shown by red and blue arrows in Figure 8b. They are higher than the intercepts of the unirradiated sample or the unirradiated regions of the irradiated samples. It indicates the formation of a hard layer above the matrix in irradiated samples. The nominal hardness (H0,irr) of the irradiation induced hard layer can be obtained by fitting the H2 data in the range from 0.002 1/nm (i.e. 500 nm) to 0.005 1/nm (i.e. 200 nm), which probably corresponds to the irradiation layer (~1000 nm), because the radius of a plastic deformation zone produced by the indenter can be 2~5 times the indentation depth [34]. The calculated H0,irr and h* are given in Table 3. Meanwhile, we find the direct measured hardness values between 200 nm and 500 nm change little with depth, so they are averaged to obtain the average hardness (Hexp. aver.). For the unirradiated sample, the H0 is lower than Hexp.aver.. However, for the irradiated samples, the H0 equals to Hexp.aver.. It suggests there are other effects such as hard layer effect in the irradiated samples, in addition to the ISE. The hard layer effect can be induced by the helium implantation zone. The hard layer effect would cause the increase of hardness with depth and the ISE would cause the decrease of hardness with depth. The synergistic effects of these result in the uniform hardness distribution and then the same H0,irr and Hexp.aver. in irradiated samples. The hardness increments of the irradiated samples relative to the un-irradiated samples, Δ H0 and Δ Hexp. aver., are calculated and given in Table 3 and Figure 9. The characteristic length of the irradiated layers changes. With increasing fluences, H0, Hexp.aver., Δ H0 and Δ Hexp.aver. increase.
According to the dispersed barrier-hardening (DBH) model [35], the yield strength or the hardness related with the type, number density, and size of defects is calculated with the following formulas:
Δ H = 3 Δ σ y
Δ σ y = α M μ N d
where, M = 4.3, μ = 132.8 GPa and b = 0.228 nm are the Taylor factor, shear modulus and Burgers vector, respectively [1], N is the number density and d is the average diameter of obstacles. α is the dimensionless strength factor. The increase of hardness is related with the irradiation induced defects, which would be obstacles of dislocation movement. Helium irradiation would induce simple helium and vacancy clusters, He-V complexes, helium bubbles and dislocation loops [1] which are all possible hardening sources. The obstacle strength factors of small defects including He-V complexes, bubbles and dislocation loops are similar and all lower than 0.25 [1]. For the sample with 5.0 × 10¹⁶ ions/cm2, no helium bubbles were observed with TEM. However, there must be many He-V complexes and dislocation loops in the irradiated layer, which induce the hardening. For the sample with 1.0 × 10¹⁷ ions/cm2, there are large numbers of helium bubbles observed in the damage peak zones, as shown in the above TEM results. Based on the above formula and the helium bubble results for the sample of 1.0 × 10¹⁷ ions/cm2, if α = 0.15, then Δ H = 2.55 GPa. Compared to the experimental data in Table 3, this estimation implies that the hardness increase should mainly originate from the implantation induced helium bubbles in damage peak zones. With increasing fluences, the evolution from TEM invisible He-V complexes to visible helium bubbles indicates the increase in defect size, which would result in the hardness increase. After removing the ISE, the nominal hardness increases about 63% and 102% for the samples at 5.0 × 10¹⁶ ions/cm2 (2.93% helium atoms) and 1.0 × 10¹⁷ ions/cm2 (5.85% helium atoms), respectively. The corresponding yield strength increase values are about 0.57 GPa and 1.56 GPa, respectively, which are larger than the ultimate tensile strength of original beryllium [6]. However, the yield strength increase would be much less at higher temperatures. As reported in reference [1], when the implantation temperature increases from 50 °C to 200 °C, the hardness of helium implanted beryllium would decrease obviously by about 40% of the as-received sample. We can infer that at high temperatures of 200 °C, the hardness increase may decrease to about 23% and 63% of the as-received sample when the He concentration reached 2.93% and 5.85%. That is the hardness increase values are 0.57 GPa and 1.56 GPa, respectively, and the yield strength increase would be 0.19 GPa and 0.52 GPa. Of course, the mechanical properties at high temperatures should be conducted in future research.

4. Summary

In this work, effects of helium ion implantation in China developed CN-G01 beryllium were studied at room temperature under fluences of 5.0 × 10¹⁶ ions/cm2 to 1.0 × 10¹⁸ ions/cm2. SEM, TEM and NIT were used to investigate the surface morphology, microstructure change and mechanical property, respectively. The nano-hardness of the samples increased about 63% and 102% for the sample with 5.0 × 10¹⁶ ions/cm2 and 1.0 × 10¹⁷ ions/cm2. It is mainly caused by the high density He-related defects including He-V complexes and small bubbles observed by TEM. When the fluence reached 5.0 × 10¹⁷ ions/cm2 or larger, serious surface blister and blister burst was observed. With increasing fluences, blisters became larger, and more blisters started to burst and even exfoliated. The surface modification can also be interpreted by the internal microstructure evolution. TEM results showed that when the fluence reached 1.0 × 10¹⁷ ions/cm2, some tiny but dense helium bubbles formed. With increasing fluences to 5.0 × 10¹⁷ ions/cm2 and 1.0 × 10¹⁸ ions/cm2, helium bubbles became larger or connected into micro-cracks and long cracks, which resulted in serious blistering, burst and even exfoliation on the surface. In addition, with increasing fluences, the distance from the surface and the width of the damage peak zones increase due to the growth of helium bubbles. These results will facilitate our understanding of the CN-G01 beryllium in irradiation resistance and the high content helium effects on beryllium.

Author Contributions

Conceptualization, M.C. and L.P.; methodology, M.C. and Y.Z.; software, M.C.; validation, M.C., T.S. and P.J.; formal analysis, M.C. and T.S.; investigation, M.C. and P.J.; resources, X.L. and B.G.; data curation, M.C.; writing—original draft preparation, M.C.; writing—review and editing, M.C.; visualization, M.C.; supervision, Z.W. and Y.F.; project administration, M.C. and Y.F.; funding acquisition, M.C. and Y.F. All authors have read and agreed to the published version of the manuscript.

Funding

This work is supported by the National Natural Science Foundation of China under Grant No. 12175288, the Sichuan Province Science and Technology Program (2018JZ0014), the Joint Funds of the National Natural Science Foundation of China under Grant No. U1832206.

Data Availability Statement

The datasets collected and analyzed during the current study are available from the corresponding author on reasonable request.

Acknowledgments

The authors gratefully acknowledge the staff of 320 kV Multi-Discipline Research Platform for Highly Charged Ions in the Institute of Modern Physics, Chinese Academy of sciences, Lanzhou, China.

Conflicts of Interest

The authors declare no conflict of interest.

References

  1. Kuksenko, V.; Lunev, A.; Darnbrough, E.; Densham, C.; Hurh, P.; Roberts, S. Radiation induced hardening of beryllium during low temperature He implantation. J. Nucl. Mater. 2021, 555, 153130. [Google Scholar] [CrossRef]
  2. Deksnis, E.B.; Peacock, A.T.; Altmann, H.; Ibbot, C.; Falter, H.D. Beryllium plasma-facing components: JET experience. Fusion Eng. Des. 1997, 37, 515–530. [Google Scholar] [CrossRef]
  3. Klimenkov, M.; Vladimirov, P.; Jäntsch, U.; Kuksenko, V.; Rolli, R.; Möslang, A.; Zimber, N. New insights into microstructure of irradiated beryllium based on experiments and computer simulations. Sci. Rep. 2020, 10, 8042. [Google Scholar] [CrossRef] [PubMed]
  4. Giancarli, L.M.; Barabash, V.; Campbell, D.J.; Chiocchio, S.; Cordier, J.J.; Dammann, A. Progress and challenges of the ITER TBM Program from the IO perspective. Fusion Eng. Des. 2016, 109, 1491–1497. [Google Scholar] [CrossRef]
  5. Kuksenko, V.; Ammigan, K.; Hartsell, B.; Densham, C.; Hurh, P.; Roberts, S. Irradiation effects in beryllium exposed to high energy protons of the NuMI neutrino source. J. Nucl. Mater. 2017, 490, 260–271. [Google Scholar] [CrossRef] [Green Version]
  6. Barabash, V.; Eaton, R.; Hirai, T.; Kupriyanov, I.; Nikolaev, G.; Wang, Z.; Linke, J. Summary of beryllium qualification activity for ITER first-wall applications. Phys. Scr. 2011, 14007. [Google Scholar] [CrossRef]
  7. Liu, X.; Chen, J.; Lian, Y.; Wu, J.; Xu, Z.; Zhang, N.; Zhong, J. Vacuum hot-pressed beryllium and TiC dispersion strengthened tungsten alloy developments for ITER and future fusion reactors. J. Nucl. Mater. 2013, 442, S309–S312. [Google Scholar] [CrossRef]
  8. Klimenkov, M.; Chakin, V.; Moeslang, A.; Rolli, R. TEM study of beryllium pebbles after neutron irradiation up to 3000 appm helium production. J. Nucl. Mater. 2013, 443, 409–416. [Google Scholar] [CrossRef]
  9. Zimber, N.; Vladimirov, P.; Klimenkov, M.; Kuksenko, V. Investigation of a high-dose irradiated beryllium microstructure. J. Nucl. Mater. 2020, 540, 152374. [Google Scholar] [CrossRef]
  10. Chakin, V.P.; Posevin, A.; Kupriyanov, I. Swelling, mechanical properties and microstructure of beryllium irradiated at 200 degrees C up to extremely high neutron doses. J. Nucl. Mater. 2007, 367, 1377–1381. [Google Scholar] [CrossRef]
  11. Chakin, V.P.; Ostrovsky, Z. Evolution of beryllium microstructure under high-dose neutron irradiation. J. Nucl. Mater. 2002, 307, 657–663. [Google Scholar] [CrossRef]
  12. Kupriyanov, I.B.; Gorokhov, V.A.; Melder, R.R.; Ostrovsky, Z.E.; Gervash, A.A. Investigation of ITER candidate beryllium grades irradiated at high temperature. J. Nucl. Mater. 1998, 258, 808–813. [Google Scholar] [CrossRef]
  13. Ziegler, J.F.; Biersack, J.; Littmark, U. The Stopping and Range of Ions in Solids; Pergamon: Oxford, UK, 1985; Available online: http://www.srim.org (accessed on 31 January 2021).
  14. Jackson, M.L.; Fossati, P.; Grimes, R. Simulations of threshold displacement in beryllium. J. Appl. Phys. 2016, 120, 45903. [Google Scholar] [CrossRef] [Green Version]
  15. Stoller, R.E.; Toloczko, M.B.; Was, G.S.; Certain, A.G.; Dwaraknath, S.; Garner, F.A. On the use of SRIM for computing radiation damage exposure. Nucl. Instrum. Methods Phys. Res. Sect. B Beam Interact. Mater. At. 2013, 310, 75–80. [Google Scholar] [CrossRef]
  16. Liu, P.P.; Zhan, Q.; Fu, Z.Y.; Wei, Y.P.; Wang, Y.M.; Wang, F.M. Surface and internal microstructure damage of He-ion-irradiated CLAM steel studied by cross-sectional transmission electron microscopy. J. Alloy. Compd. 2015, 649, 859–864. [Google Scholar] [CrossRef]
  17. Morishita, K.; Inoue, T.; Yoshida, N. Microstructural evolution in beryllium by fusion-relevant low energy helium ion irradiation. J. Nucl. Mater. 1999, 266, 997–1002. [Google Scholar] [CrossRef]
  18. Luo, X.F.; Gong, B.; Wang, L.; Cui, M.; Feng, Y. Influence of helium ion irradiation on the morphology and microstructure of CN-G01 beryllium. Mater. Res. Express 2020, 7, 126508. [Google Scholar] [CrossRef]
  19. Evans, J.H. Inter-Bubble Fracture Mechanism of Blister Formation on Helium-Irradiated Metals. J. Nucl. Mater. 1977, 68, 129–140. [Google Scholar] [CrossRef]
  20. Gusev, V.M.; Guseva, M.I.; Martynenko, Y.V.; Mansurova, A.N.; Morosov, V.N.; Chelnokov, O.I. Helium Blistering at High Irradiation Doses. J. Nucl. Mater. 1979, 85–86, 1101–1104. [Google Scholar] [CrossRef]
  21. Yang, X.Y.; Lu, Y.; Li, M.L.; Zhang, P. First-principles study of migration and diffusion mechanisms of helium in proportional to-Be. AIP Adv. 2016, 6, 35018. [Google Scholar] [CrossRef]
  22. Zhang, P.B.; Zhao, J.; Wen, B. Retention and diffusion of H, He, O, C impurities in Be. J. Nucl. Mater. 2012, 423, 164–169. [Google Scholar] [CrossRef]
  23. Bakai, A.S.; Timoshevskii, A.; Yanchitsky, B. On chemical bonding and helium distribution in hcp beryllium. Low Temp. Phys. 2011, 37, 791–797. [Google Scholar] [CrossRef] [Green Version]
  24. Ganchenkova, M.G.; Vladimirov, P.; Borodin, V. Vacancies, interstitials and gas atoms in beryllium. J. Nucl. Mater. 2009, 386–388, 79–81. [Google Scholar] [CrossRef]
  25. Cayphas, J.M.; Hou, M.; Coheur, L. The behaviour of helium in neutron irradiated beryllium: A molecular dynamics study. J. Nucl. Mater. 1997, 246, 171–179. [Google Scholar] [CrossRef]
  26. Jung, P. Diffusion and Retention of Implanted Helium in Beryllium. J. Nucl. Mater. 1993, 202, 210–215. [Google Scholar] [CrossRef]
  27. Vladimirov, P.V.; Moeslang, A. Ab initio static and molecular dynamics studies of helium behavior in beryllium. J. Nucl. Mater. 2013, 442, S694–S698. [Google Scholar] [CrossRef]
  28. Chernikov, V.N.; Ullmaier, H.; Zakharov, A. Gas bubbles in beryllium implanted with He ions at temperatures ≤700 K and after post-implantation annealing. J. Nucl. Mater. 1998, 258, 694–699. [Google Scholar] [CrossRef]
  29. Liu, P.P.; Xue, L.W.; Yu, L.P.; Liu, J.L.; Hu, W.; Zhan, Q.; Wan, F.R. Microstructure change and swelling of helium irradiated beryllium. Fusion Eng. Des. 2019, 140, 62–66. [Google Scholar] [CrossRef]
  30. Zheng, R.Y.; Han, W. Comparative study of radiation defects in ion irradiated bulk and thin-foil tungsten. Acta Mater. 2020, 186, 162–171. [Google Scholar] [CrossRef]
  31. Nix, W.D.; Gao, H. Indentation size effects in crystalline materials: A law for strain gradient plasticity. J. Mech. Phys. Solids 1998, 46, 411–425. [Google Scholar] [CrossRef]
  32. Kasada, R.; Takayama, Y.; Yabuuchi, K.; Kimura, A. A new approach to evaluate irradiation hardening of ion-irradiated ferritic alloys by nano-indentation techniques. Fusion Eng. Des. 2011, 86, 2658–2661. [Google Scholar] [CrossRef] [Green Version]
  33. Cui, M.H.; Shen, T.L.; Zhu, H.P.; Wang, J.; Cao, X.Z.; Zhang, P. Vacancy like defects and hardening of tungsten under irradiation with He ions at 800 degrees C. Fusion Eng. Des. 2017, 121, 313–318. [Google Scholar] [CrossRef]
  34. Hosemann, P.; Kiener, D.; Wang, Y.; Maloy, S.A. Issues to consider using nano indentation on shallow ion beam irradiated materials. J. Nucl. Mater. 2012, 425, 136–139. [Google Scholar] [CrossRef]
  35. Seeger, A.K. Basic Metallurgy and Fabrication of Fuels. In Proceedings of the 2nd International Conference on Peaceful Uses of Atomic Energy, Geneva, Switzerland, 1–13 September 1958; IAEA: Vienna, Austria, 1958; Volume 6, p. 250. [Google Scholar]
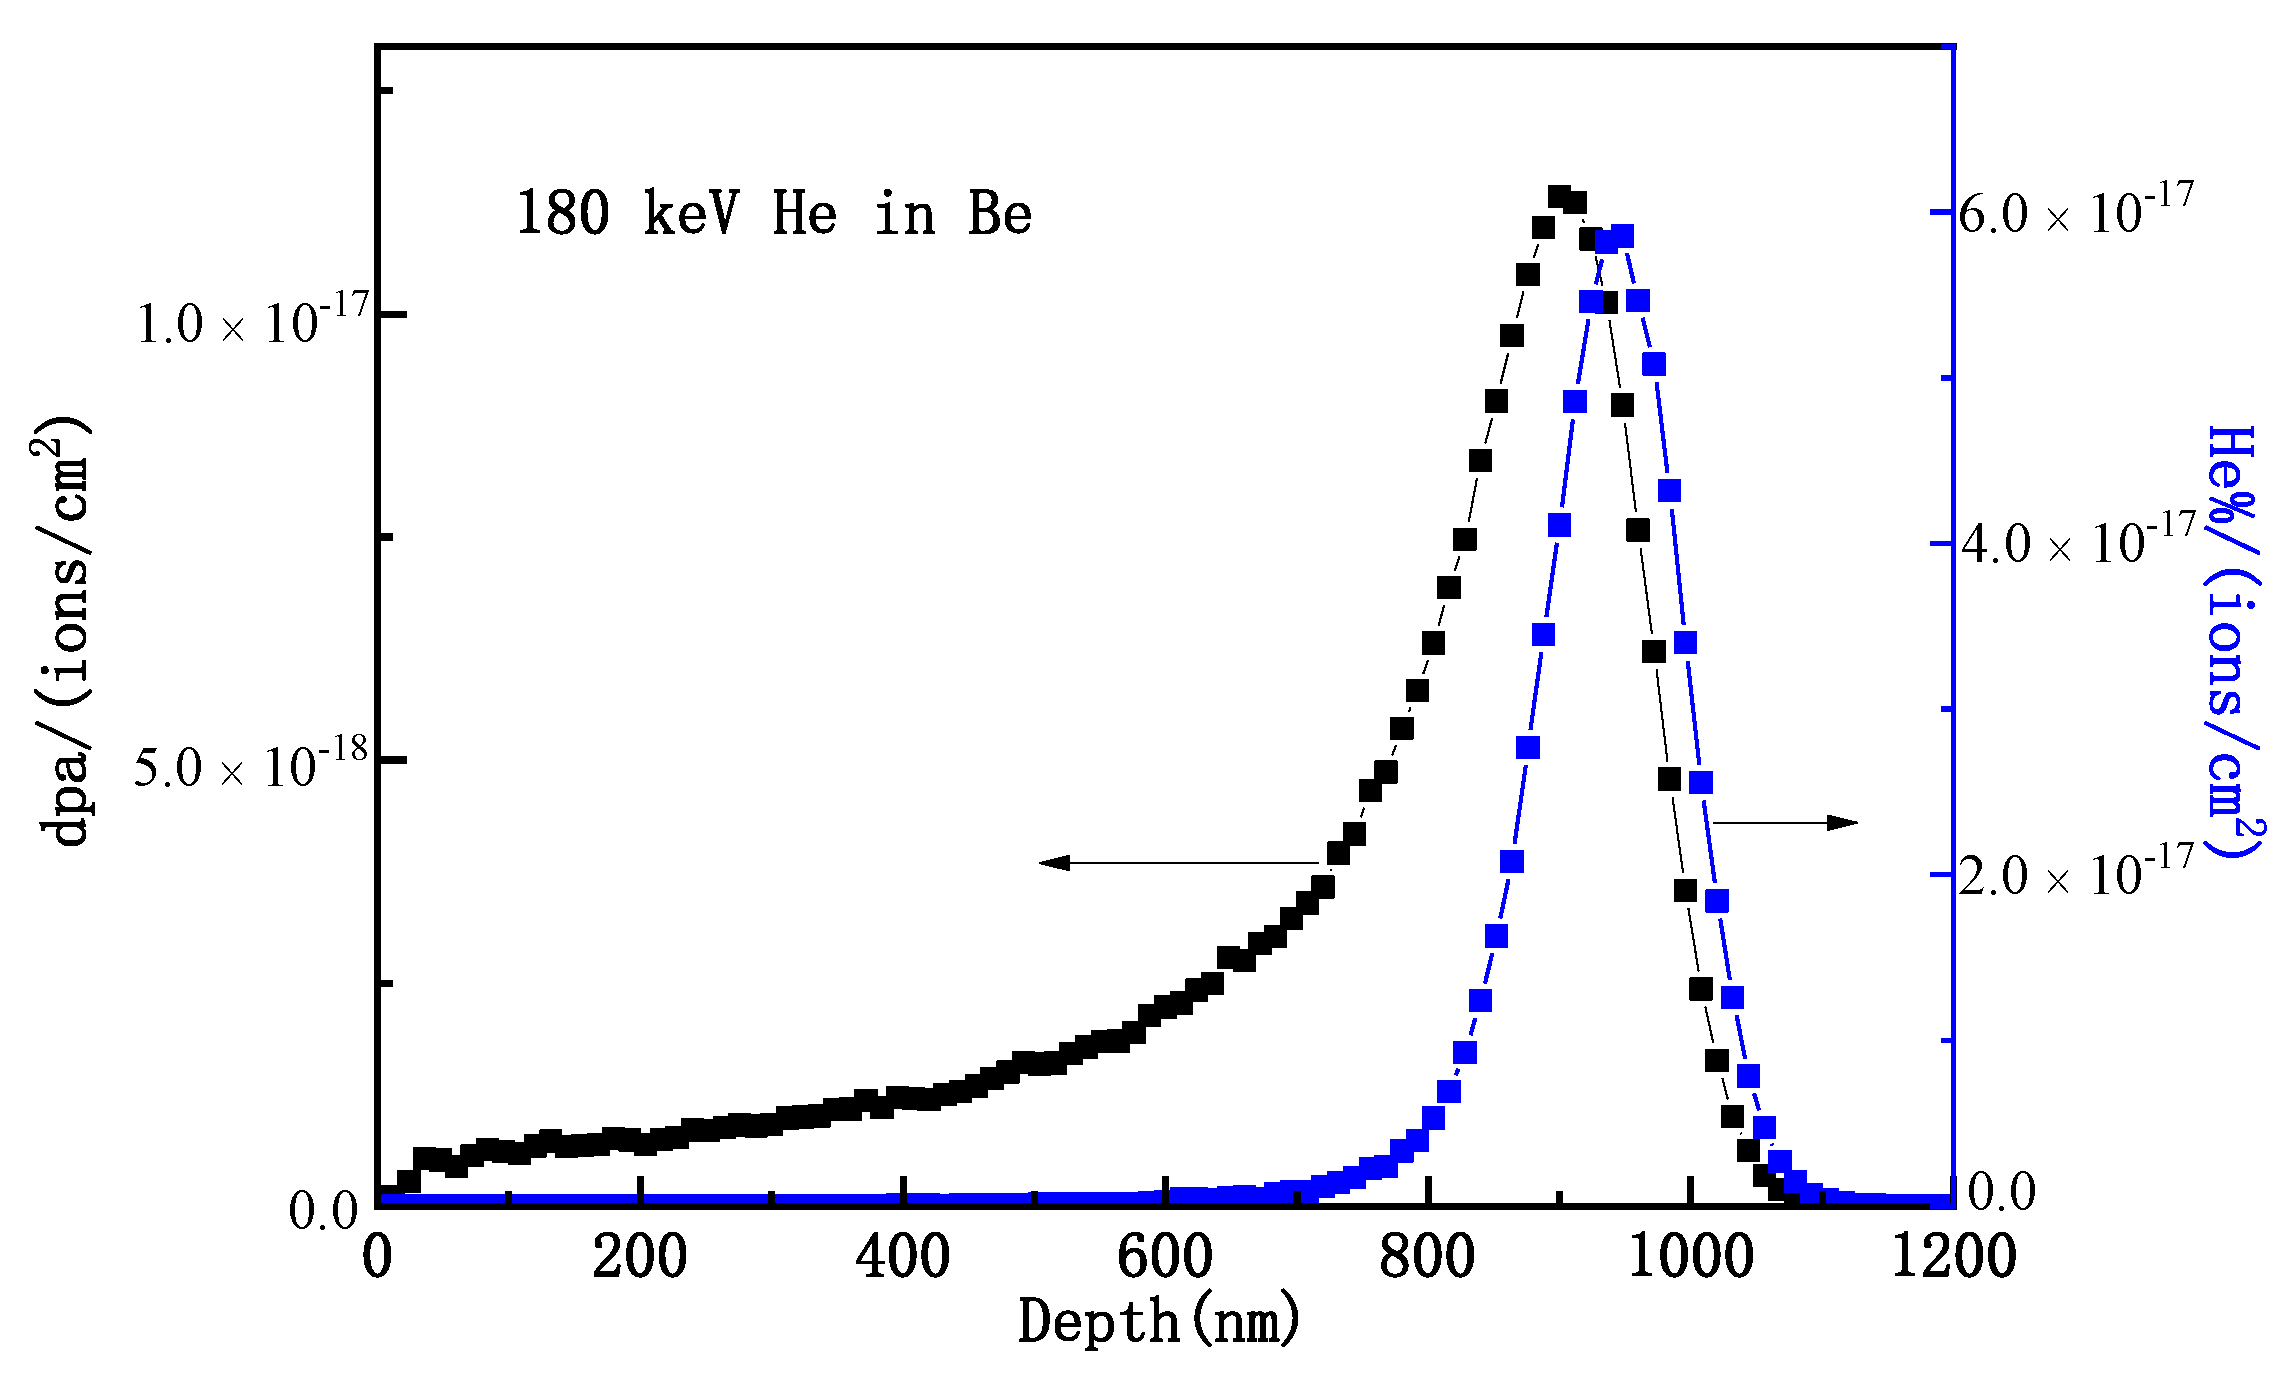
Figure 1. Cross section of dpa and helium concentration in beryllium with 180 keV helium ions calculated by SRIM.
Metals 13 00060 g001
Figure 2. SEM micrographs of un-implanted sample (a) and (a’) and helium ion implanted samples to (b) 5.0 × 10¹⁶ ions/cm2, (c) 1.0 × 10¹⁷ ions/cm2, (d,d’) 5.0 × 10¹⁷ ions/cm2, and (e,e’) 1.0 × 10¹⁸ ions/cm2. (ad) and (e) show the pictures at a larger magnification. (a’,d’,e’) show the morphologies at a lower magnification. Some blisters and their burst are pointed by arrows.
Metals 13 00060 g002
Figure 3. Size distribution of (a) blisters on the surface of the sample with 5.0 × 10¹⁷ ions/cm2 and 1.0 × 10¹⁸ ions/cm2 and (b) nano-sized blisters on the surface of the sample with 5.0 × 10¹⁷ ions/cm2.
Metals 13 00060 g003
Figure 4. (a) the blister of the sample with 1.0 × 10¹⁸ ions/cm2. (b) Cross-sectional SEM images with a title angle of 52° underneath the FIB cutting is indicated with a yellow rectangle in (a).
Metals 13 00060 g004
Figure 5. TEM graphs of the whole damage morphology in the samples implanted to 1.0 × 10¹⁷ ions/cm2 (a), 5.0 × 10¹⁷ ions/cm2 (b,b’), and 1.0 × 10¹⁸ ions/cm2 (c,c’) at RT. (b) and (c) are the microstructures under surface without blisters. (b’) and (c’) are the microstructures under surface with blisters. The surface is indicated by a red dotted line. The damage peak zones are labeled by red rectangles in (ac).
Metals 13 00060 g005
Figure 6. TEM graphs of Helium bubbles under focus (a,b,c) and over focus (a’,b’,c’) in the damage peak zones of samples implanted to (a,a’) 1.0 × 10¹⁷ ions/cm2, (b,b’) 5.0 × 10¹⁷ ions/cm2, and (c,c’) 1.0 × 10¹⁸ ions/cm2.
Metals 13 00060 g006
Figure 7. Detailed TEM observation of the whole damage region in the sample with 1.0 × 10¹⁸ ions/cm2.
Metals 13 00060 g007
Figure 8. (a) Nano-hardness profiles with depth and (b) H2 versus 1/d in as-received and helium irradiated beryllium. Arrows in (b) indicate corresponding H2 of each fitted line.
Metals 13 00060 g008
Figure 9. The change of H0, Hexp.aver., Δ H0, Δ Hexp.aver. with irradiation fluences.
Metals 13 00060 g009
Table 1. Chemical composition of CN-G01 beryllium (wt. %).
BeBeOAlCFeMgSiOthers
>990.750.0060.0600.0500.0030.009<0.04
Table 2. Peak dpa and helium concentration for the specimen with different fluences.
Fluence (Ions/cm2)5.0 × 10161.0 × 10175.0 × 10171.0 × 1018
Peak dpa0.5651.135.6511.3
Peak helium concentration (%)2.935.8529.358.5
Table 3. H0, Hexp.aver., Δ H0, Δ Hexp.aver. and h* in the unirradiated and irradiated samples.
Fluence (ion/cm2)Hexpaver (GPa) Δ Hexpaver (GPa) H0 (GPa) Δ H0 (GPa) h* (nm)
02.99 ± 0.154-2.47 ± 0.016-139.27 ± 3.069
5.0 × 10164.08 ± 0.1521.09 ± 0.3064.02 ± 0.0871.55 ± 0.1039.74 ± 3.205
1.0 × 10174.99 ± 0.2622.00 ± 0.4174.99 ± 0.1992.52 ± 0.2151.60 ± 4.591
Disclaimer/Publisher’s Note: The statements, opinions and data contained in all publications are solely those of the individual author(s) and contributor(s) and not of MDPI and/or the editor(s). MDPI and/or the editor(s) disclaim responsibility for any injury to people or property resulting from any ideas, methods, instructions or products referred to in the content.