Abstract
High porosity phenomena of U-10Mo fuel foil appear in the U–Mo/Al monolithic fuel plate under deep burnup. In this study, the fuel skeleton creep-based bubble growth model is further improved with the intrusion effect of solid fission products, multiplying the reduction factor in the bubble volume to obtain the bubble pressure. With the locally enhanced irradiation creep of the Mo-depleted region considered, a simulation of the thermo-mechanical coupling behaviors of the monolithic fuel plate L1P7A0 is carried out, based on the commercial finite element (FE) analysis code ABAQUS. A fission-induced creep rate coefficient of 250 × 10−22 mm3/(fission·MPa) is identified for the Mo-depleted region, with the predictions of porosity and the thickness deformation of U–Mo fuel foil agreeing well with the experimental data. The research results indicate that: (1) the locally enhanced fuel skeleton creep ability is responsible for the higher porosities near the U–Mo/Zr interface; (2) the entrance of solid fission products into the fission bubbles at high burnup is the dominant factor in inducing high porosity in the regions of the most heavily irradiated fuel foil, especially near the fuel foil edge bearing the elevated external hydrostatic pressures; (3) with the intrusion effect of solid fission products considered, the prediction of the porosity increases from ~15% to ~35% near the fuel foil edge; (4) the intrusion of solid fission products leads to extra differences between the bubble pressure and the external pressure, and simultaneously results in the strengthened fuel skeleton creep deformation contributions to the bubble growth.
1. Introduction
Different from other energy sources [1,2,3], nuclear energy is a clean energy source, which plays a significant role in the de-carbonization strategy and energy crisis [4]. U–10Mo/Al monolithic fuel plates consist of U–10Mo fuel foil, Al alloy cladding and a Zr diffusion barrier layer, regarded as the most potential candidates for advanced research and test reactors due to their high uranium density and stable irradiation performance [5,6,7]. The post-irradiation examination indicates that the porosities near the U–Mo/Zr interface are higher than those of the other parts, with gradually expanding differences with the fission density [8,9,10]. In particular, a porosity of ~32% for the irradiated fuel plate L1P7A0 [8] appears near the fuel foil edge subjected to enhanced constraints, with a maximum of ~35% surrounding the U–Mo/Zr interface. This high porosity results in mechanical property deterioration [11,12,13], becoming an important potential fracture mechanism of fuel foil [8,9,10].
The Mo-depleted zone near the U–10Mo/Zr interface has been observed in the microstructural analysis of the as-fabricated U–10Mo monolithic fuel plate [9,10], with the presence of the phase. It is known that the fuels dominated by easily trigger high fission gas swelling [9]. In addition, the concentration of the Mo element affects the thermo-mechanical properties of U–Mo alloys, including the elastic parameters [14,15,16], the thermal conductivity [15,16], the tensile strength [14,15] and the creep behaviors [15,17]. At lower Mo concentrations, the Young’s modulus and tensile strength of un-irradiated U–Mo alloys are reduced [14], and the thermal conductivity and creep rate increase [15,16,17]. Consequently, the local depletion of Mo is responsible for occurrences of cracking and enlarged porosity near the U–Mo/Zr interface of the irradiated U–10Mo monolithic fuel plate [10]. However, the simulation and analysis of the thermo-mechanical coupling behaviors with the Mo-depleted effects involved near the U–Mo/Zr interface have not been reported.
It can be obtained from the available simulation results that the influences of elastic parameters and thermal conductivity on the thermo-mechanical behaviors of fuel plates are slight [18]. According to the fuel skeleton creep-influenced volume growth model for U–10Mo fuels [19], it is understandable that the bubble volume growth could be strengthened by the augmented irradiation creep rate coefficient of the Mo-depleted zone, due to its enhanced creep deformation ability [15,17]. The measured porosity values of the irradiated fuel plate L1P7A0 [8] cannot be predicted by the available fission gas swelling models [19,20,21], and the predictions under high burnup levels would be much lower than the experimental data near the fuel foil edge due to the cladding constraint-induced high hydrostatic pressure. As a result, the high porosity phenomena of U–Mo fuel foil under deep burnup would have some other influencing factors. The post-irradiation examination [8] demonstrates that the solid fission product Neodymium (Nd) intruded into the fission gas bubbles is proposed as the driver of fission bubble interconnection under deep burnup. The intrusion of solid fission products into the bubbles occupies the volume of fission gas atoms, leading to higher bubble pressures and possibly inducing additional bubble growth [19]. Hence, it is necessary to combine the relevant experimental data to improve the newly developed bubble growth model [19], involving the important intrusion effect of solid fission products. Thus, further numerical simulation of the irradiation-induced thermo-mechanical behaviors of monolithic fuel plates should be performed, to reveal the mechanism of high porosity near the U–Mo/Zr interface and fuel foil edge.
In this study, the fuel skeleton creep-based bubble growth model is further improved to allow for the intrusion effect of solid fission products. With the locally enhanced irradiation creep characteristics of the Mo-depleted region fully considered, the irradiation-induced thermo-mechanical behaviors of monolithic fuel plates are numerically investigated. The irradiation creep coefficient of the Mo-depleted region is identified by making the predictions of porosity match the experimental data. The mechanism of high porosity in the heavily irradiated U–10Mo fuel foil is discussed.
2. Improved Fuel Skeleton Creep-Based Volume Growth Model for U–Mo Fuels
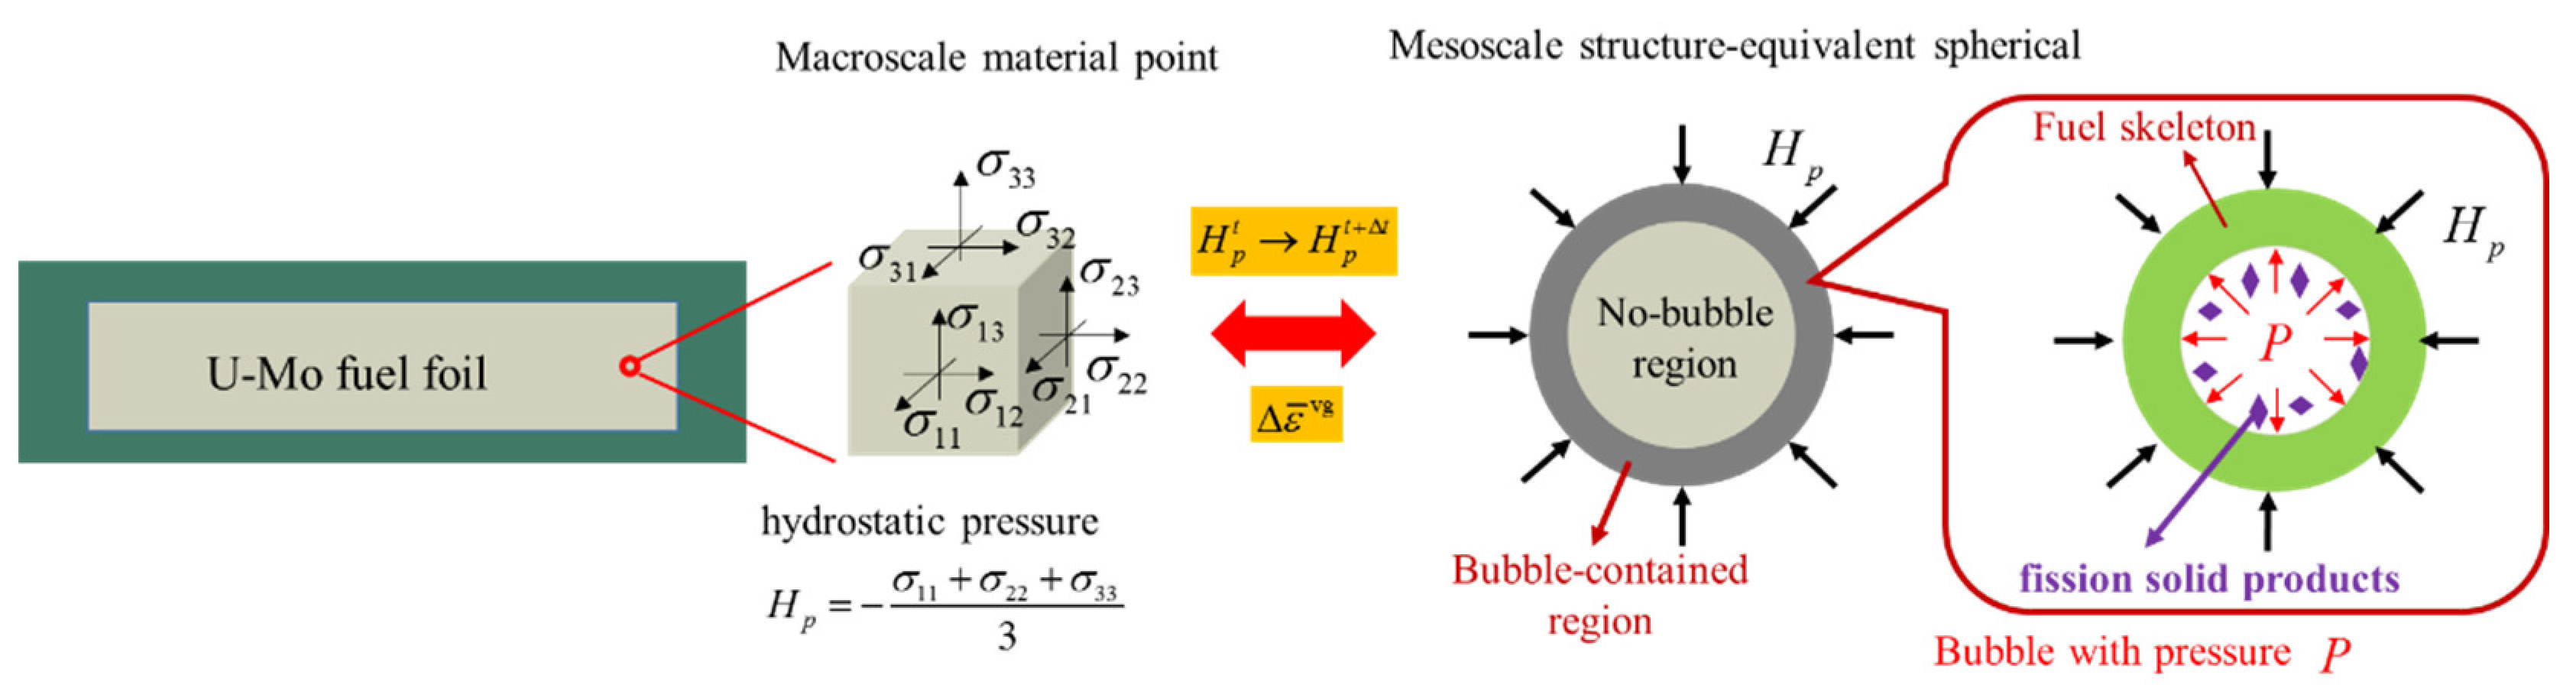
The fuel skeleton creep-based volume growth strain increment model for U–Mo fuels was developed in our previous work [19], based on the equivalent spherical model as shown in Figure 1. The homogenized volume growth strain increment was obtained with a multi-scale correlation method, including the contributions of thermal expansion, fission solid swelling and fission-induced creep of the fuel skeleton, expressed as: [19]
where is the current volume fraction of the bubble-contained region [19]; and are the logarithmic strain increments of the fuel skeleton, induced by the solid fission products and the thermal expansion; denotes the local strain increment contributed from the fuel skeleton creep for the bubble-contained region. These strain increments were obtained using: [19]
where is the thermal expansion-induced volumetric strain [19]; is the volumetric strain, induced by the solid fission products [19]; is the creep rate coefficient of U–Mo fuel skeleton in mm3/(fission·MPa); is the fuel fission rate in fission/(mm3·s); is the time increment in s; is the bubble pressure in MPa; is the macroscale external hydrostatic pressure in MPa for porous fuels; and is the local porosity of the bubble-contained region at time t, expressed as: [19]
where denotes the original volume of the equivalent spherical grain; is the volume fraction of the recrystallized zone [21]; is the volume fraction of the bubble-contained region in the rest of the un-recrystallized zone [19]; and is the bubble volume in a grain at time .
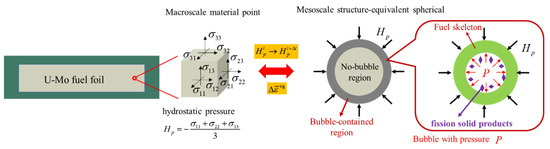
Figure 1.
The sketch of the multi-scale equivalent spherical model.
It is noted that the local strain increment is dependent on the creep rate coefficient of the fuel skeleton and the pressure difference between the bubble pressure and the macroscale hydrostatic pressure. It was mentioned in Section 1 that the solid fission product Nd would intrude into the fission gas bubbles. Hence, due to the intrusion of Nd [8], the space where the fission gas atoms reside is condensed, enlarging the bubble pressure and changing the solid fission product contribution, as shown in Figure 1. In fact, a part of solid fission product contribution is transferred to the bubble growth, represented by , and the original contribution should therefore be adjusted. Given that the predicted results of the total irradiation swelling [19] agree well with the experimental data [22], when the fission density is lower than ~7 × 1027 fission/m3, the improved models for the bubble pressure and fission solid swelling in the study are displayed as:
where is the Boltzmann constant; is the temperature in K; is the fitting parameter [23]; is the van der Waals constant for a Xe atom [19]; is the number of fission gas atoms in all the bubbles of the equivalent spherical grain [19,20]; is the fission density in 1027 fission/m3; is the reduction factor of the actual bubble volume; and is the factor to describe the intrusion of the solid fission product into the gas bubbles.
As a result, the bubble volume , macroscale porosity and local porosity for the porous fuels can be updated as: [19]
Detailed information on the idea and derivation process for the volume growth strain model can be found in ref. [19].
3. Finite Element Modeling of the In-Pile Thermo-Mechanical Coupling Behaviors in the Fuel Plate L1P7A0
3.1. Finite Element Model
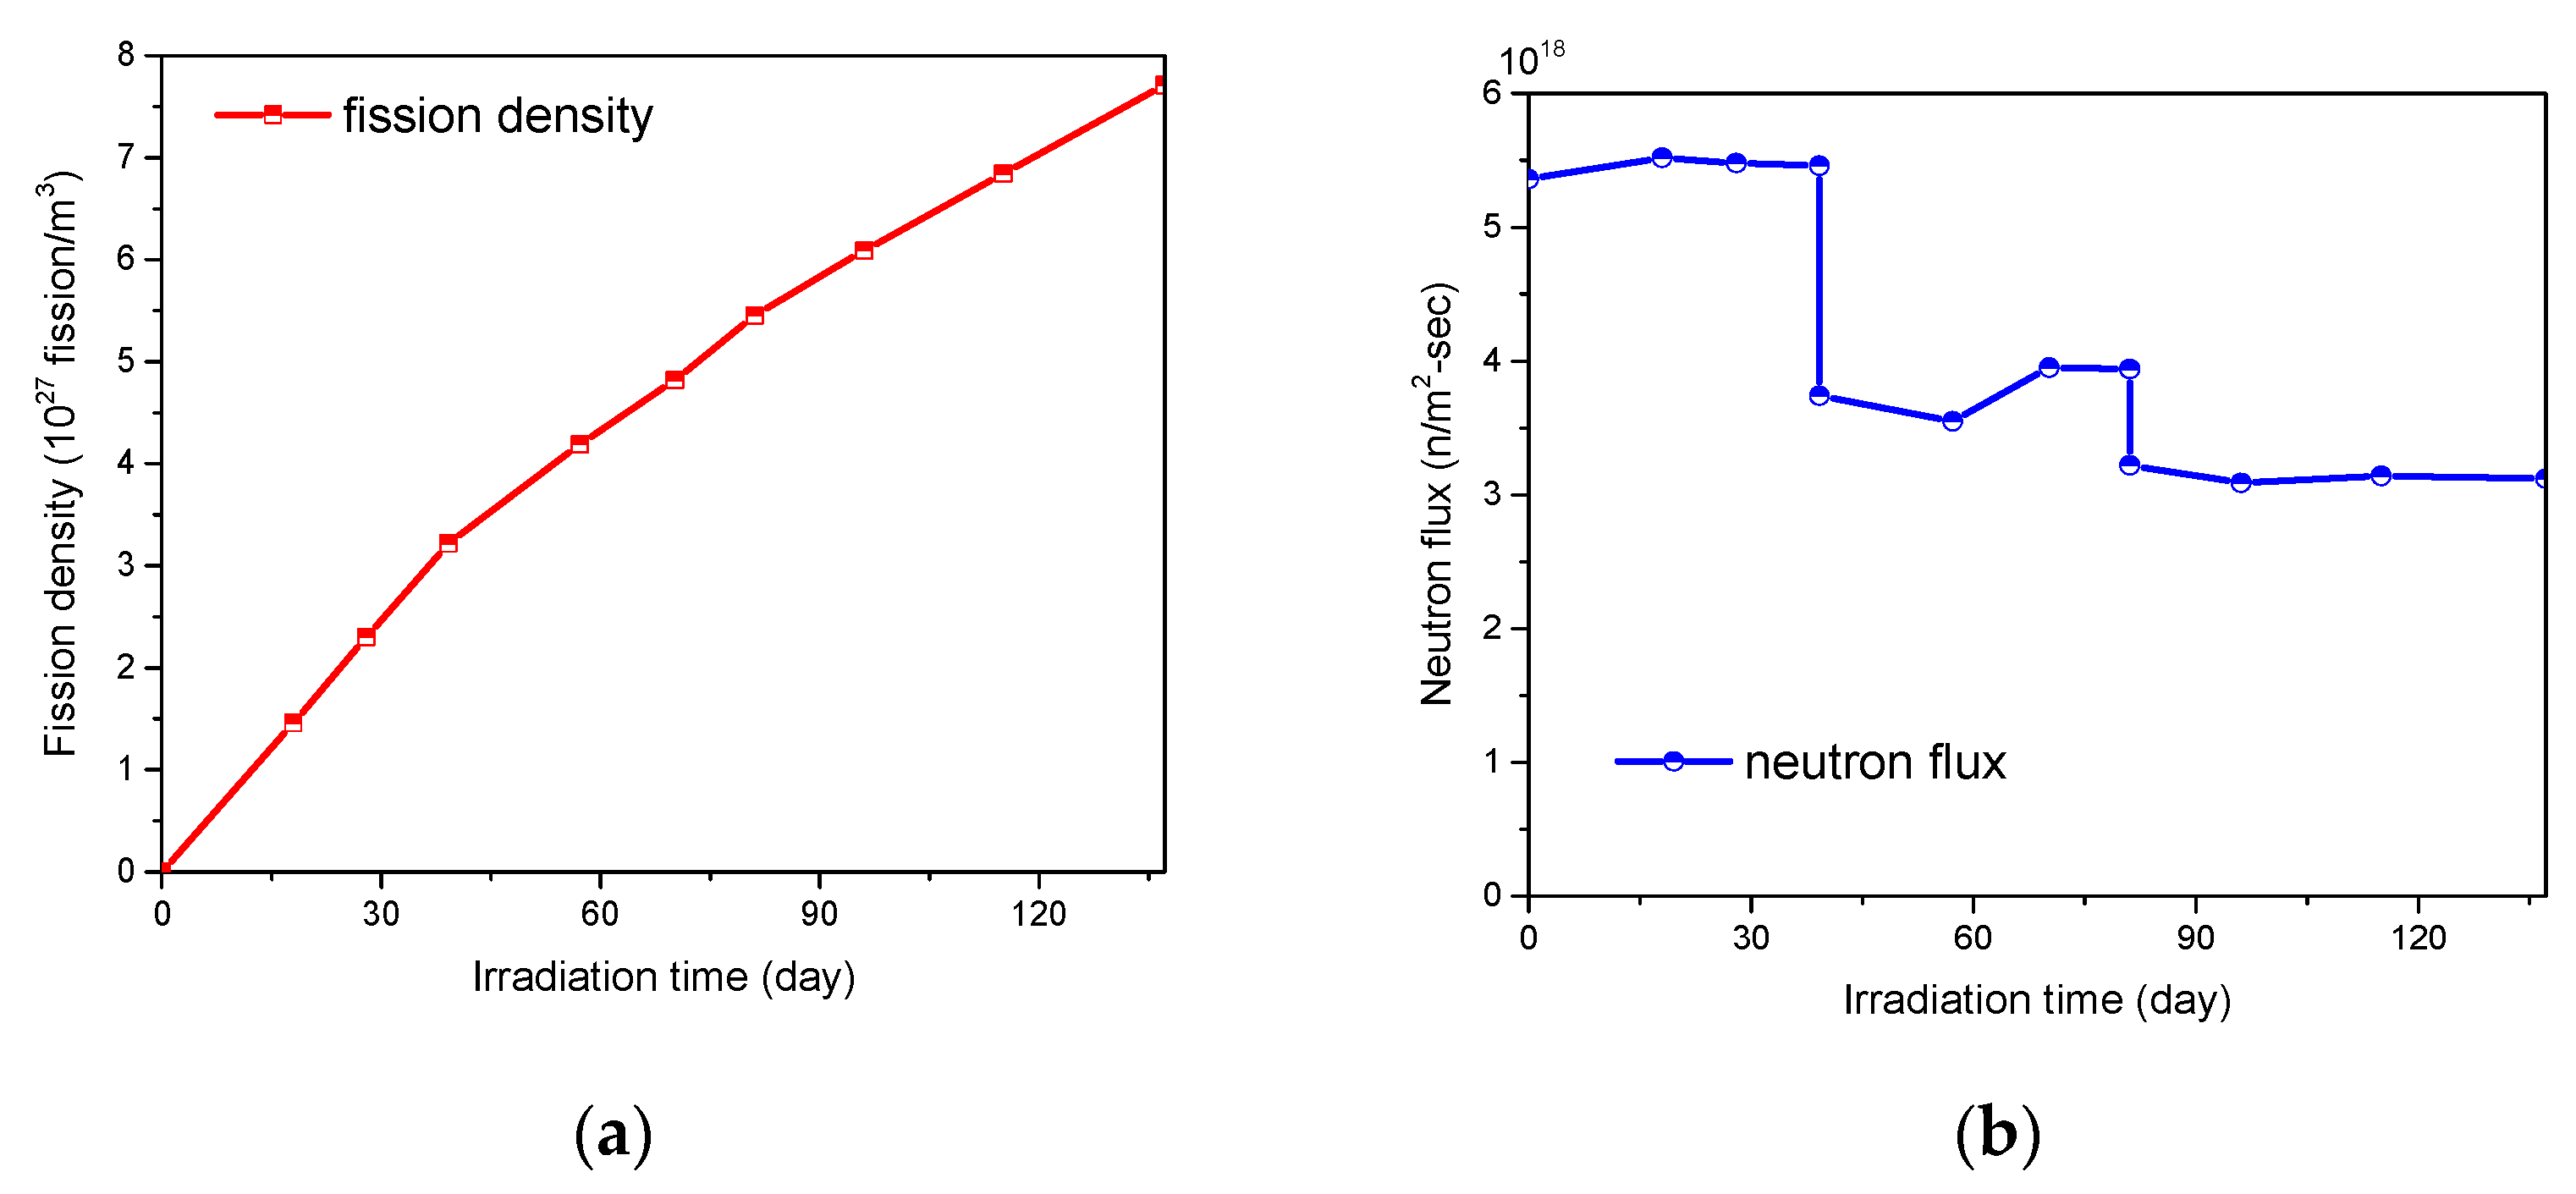
The fuel plate L1P7A0, consisting of the U–Mo fuel foil, Al alloy cladding and Zr alloy diffusion barrier in the RERTE-12 campaign, was chosen to be simulated [24]. The U–10Mo fuel foil was prepared using hot rolling followed by cold rolling [25]. The Zr diffusion barrier layers were co-rolled on both surfaces of the fuel foil using a hot co-rolling process [25]. Then, the Al cladding was subsequently bonded to the fuel foil by hot isostatic pressing (HIP) [9,11,25]. Hence, the interfaces of the fuel plate were well-bonded and stable [26]. According to ref. [8], the zone with a thickness of 0.015 mm, close to the U–Mo/Zr interface, was assumed to be the Mo-depleted region, as shown in Figure 2a. According to the symmetries in the boundary conditions and geometric structure, half of the whole fuel plate was selected as the finite element model. The corresponding boundary conditions and mesh grid figure are given in Figure 2b and Figure 2c, respectively. The non-homogenous mesh grid was applied in both the length and width directions of the fuel plates, with a maximum size of 0.5 mm and minimum size of 0.15 mm. There were ten layers of cladding, two layers of the Zr alloy barrier diffusion layer, three layers of the Mo-depleted region and six layers of the U–10Mo region. The whole finite element model contained 1,082,488 nodes and 1,022,511 elements of the type C3D8RT (8-node thermally coupled brick, tri-linear displacement and temperature with reduced integration and hourglass control), satisfying convergence. It should be mentioned that the numerical convergence was controlled by the results of important stresses and strains. The average fission density and neutron flux evolutions are displayed in Figure 3, obtained according to the information in ref. [24]. The corresponding average fission rate was derived from the total average fission density and irradiation time. The local fission rates were interpolated based on the ratios of the local fission rates to the average value in the 2D Gradient Maps [24].
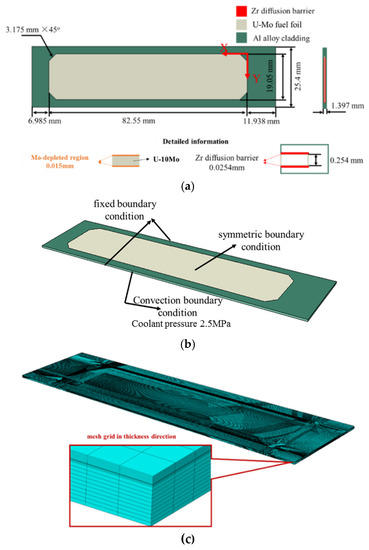
Figure 2.
(a) Dimensions of the fuel plate L1P7A0, (b) the finite element model and (c) the mesh grid.

Figure 3.
The evolution results of (a) average fission density and (b) average neutron flux of the fuel foil. (data from Ref. [25]).
3.2. Modeling Approach
To investigate the in-pile thermo-mechanical coupling behaviors of the U–10Mo/Al monolithic fuel plate and obtain the porosity of U–Mo fuel foil, a commercial finite element (FE) analysis code ABAQUS (version 6.13, Abaqus Inc., Providence, RI, USA) was utilized. Three-dimensional incremental constitutive relationships and stress update algorithms were developed for the U–Mo fuel foil, Al alloy cladding and Zr alloy diffusion barrier layers [19]. The user subroutines of UMAT and UMATHT were utilized to define their thermo-mechanical constitutive relations. The models of the thermal expansion, irradiation-affected plasticity, creep, elastic constants and thermal conductivity for the Al alloy cladding can be found in refs. [17,27,28]. Regarding the Zr alloy diffusion barrier layer, the models of thermal expansion [29], irradiation creep [29], irradiation-affected plasticity [30], irradiation growth [30], elasticity [29,31] and thermal conductivity [29] were involved.
As shown in ref. [19], in the mechanical constitutive relation for the U–Mo fuel foil, the total deformation contributions for a macroscale material point were composed of elastic strain, volume growth strain and deviatoric stress-related macroscale irradiation creep strain. It is noted that the creep deformation of the fuel skeleton results in macroscale volume growth strain, induced by the macroscale hydrostatic pressure (negative of the macroscale spherical stress). Simultaneously, the macroscale deviatoric stresses lead to the macroscale creep strains, with the macroscale irradiation creep rate related to the macroscale porosity, expressed as: [17,19,32]
where is the macroscale rate of U–Mo fuel in s−1; depicts the macroscale porosity; denotes the creep rate coefficient of U–Mo fuel skeleton in mm3/(fission·MPa); is the fission rate in fission/(mm3·s); and is the von Mises stress in MPa. Using the creep constitutive theory and the trapezoidal integration yields:
where are the macroscale creep strain components and are the deviatoric stresses.
It should be mentioned that the creep rate coefficient for the Mo-depleted region needs to be identified, as it is different from the U–10Mo creep rate coefficient of 180 × 10−22 mm3/(fission·MPa) [19,20]. The other properties of the Mo-depleted region are assumed to be consistent with those of U–10Mo alloy.
4. Results and Discussion
The creep rate coefficient for the Mo-depleted region and the model parameters of and in Equations (4) and (5) are identified by making the predictions agree well with the experimental results in ref. [8]. In this section, the calculated results of macroscale porosity and thickness deformation () are firstly presented and compared with the experimental data, with various values for the creep rate coefficient of the Mo-depleted region and the model parameters and . Subsequently, the underlying mechanism analysis of high porosity in the U–10Mo monolithic fuels at high burnup is discussed.
4.1. Predictions of the Macroscale Porosity and the Thickness Deformation for the Fuel Foil
The FE results of macroscale porosity on the 137.2th day are presented in Figure 4 for three cases. The case with = 0.4 and = −0.4 considers the intrusion of solid fission products into the gas bubbles, described with Equations (4) and (5). The case with = 1.0 and = 0.4 denotes that the volume growth strain model is identical to the one in ref. [19]. Simultaneously, the contour plots in Figure 4a,b are obtained with a larger creep rate coefficient of 250 × 10−22 mm3/(fission·MPa) for the Mo-depleted region, and those in Figure 4c are acquired with the same creep rate efficient of 180 × 10−22 mm3/(fission·MPa) for the whole fuel foil. One can find that higher macroscale porosities appear around the bottom of the fuel foil, due to the larger fission densities there. The comparison results between Figure 4a,b demonstrate that the achieved macroscale porosities for the high-burnup region are greatly affected by the intrusion of solid fission products. The maximum value in Figure 4a becomes ~45% higher than that in Figure 4b. It is known that the thickness deformation of the fuel foil is constrained by the cladding rails, resulting from the higher external hydrostatic pressures [19]. As a result, the predicted macroscale porosities in Figure 4b can be much lower. However, when the intrusion effect of solid fission products is considered, the macroscale porosities around the fuel foil edges are also considerable, implying that the increases in bubble volume are also distinct there. It can be also seen that the porosities near the U–Mo/Zr interface are evidently higher than those in the mid-plane of the fuel foil, which is consistent with the experimental phenomena [9,10]. Comparing the results in Figure 4a,b to those in Figure 4c, it can be seen that the enhanced creep rate coefficient of the Mo-depleted region leads to higher values of porosity near the U–Mo/Zr interface than the values of the mid-plane porosities. Comparing Figure 4b with Figure 4c, one can observe that the high macroscale porosities around the high-burnup region are dominated by the intrusion of solid fission products into the gas bubbles.
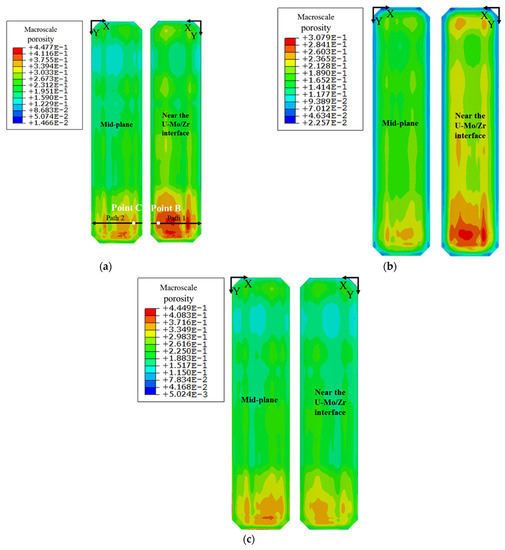
Figure 4.
The contour plots of macroscale porosity within the U–Mo fuel foil on the 137.2th day for (a) the case with = 0.4, = −0.4 and a creep rate coefficient of 250 × 10−22 mm3/(fission·MPa) for the Mo-depleted region; (b) the case with = 1.0, = 0.4 and a creep rate coefficient of 250 × 10−22 mm3/(fission·MPa) for the Mo-depleted region; and (c) the case with = 0.4, = −0.4 and the creep rate coefficient of 180 × 10−22 mm3/(fission·MPa) for the whole fuel foil.
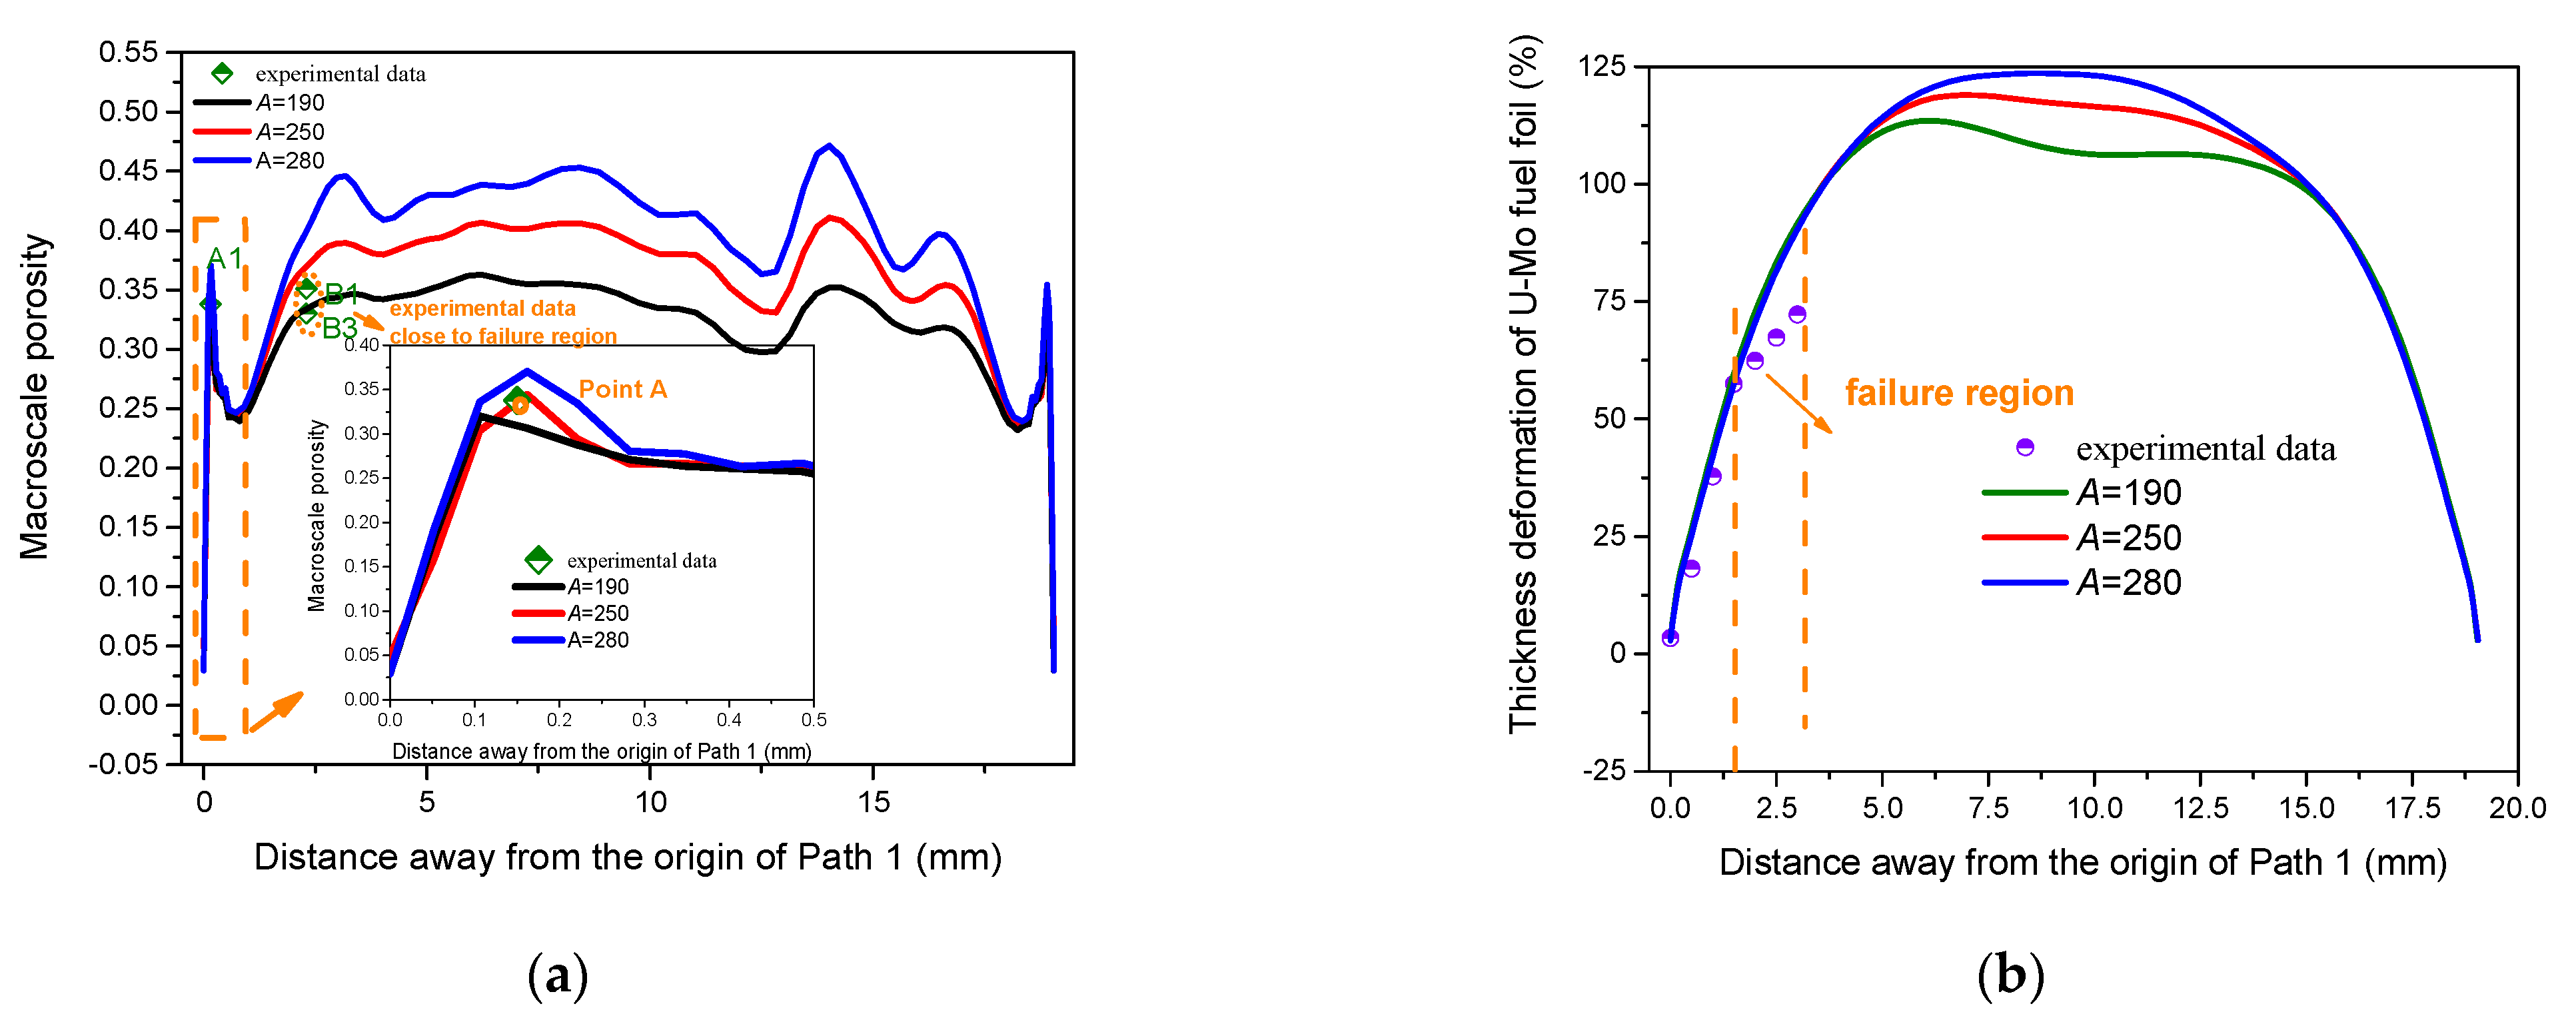
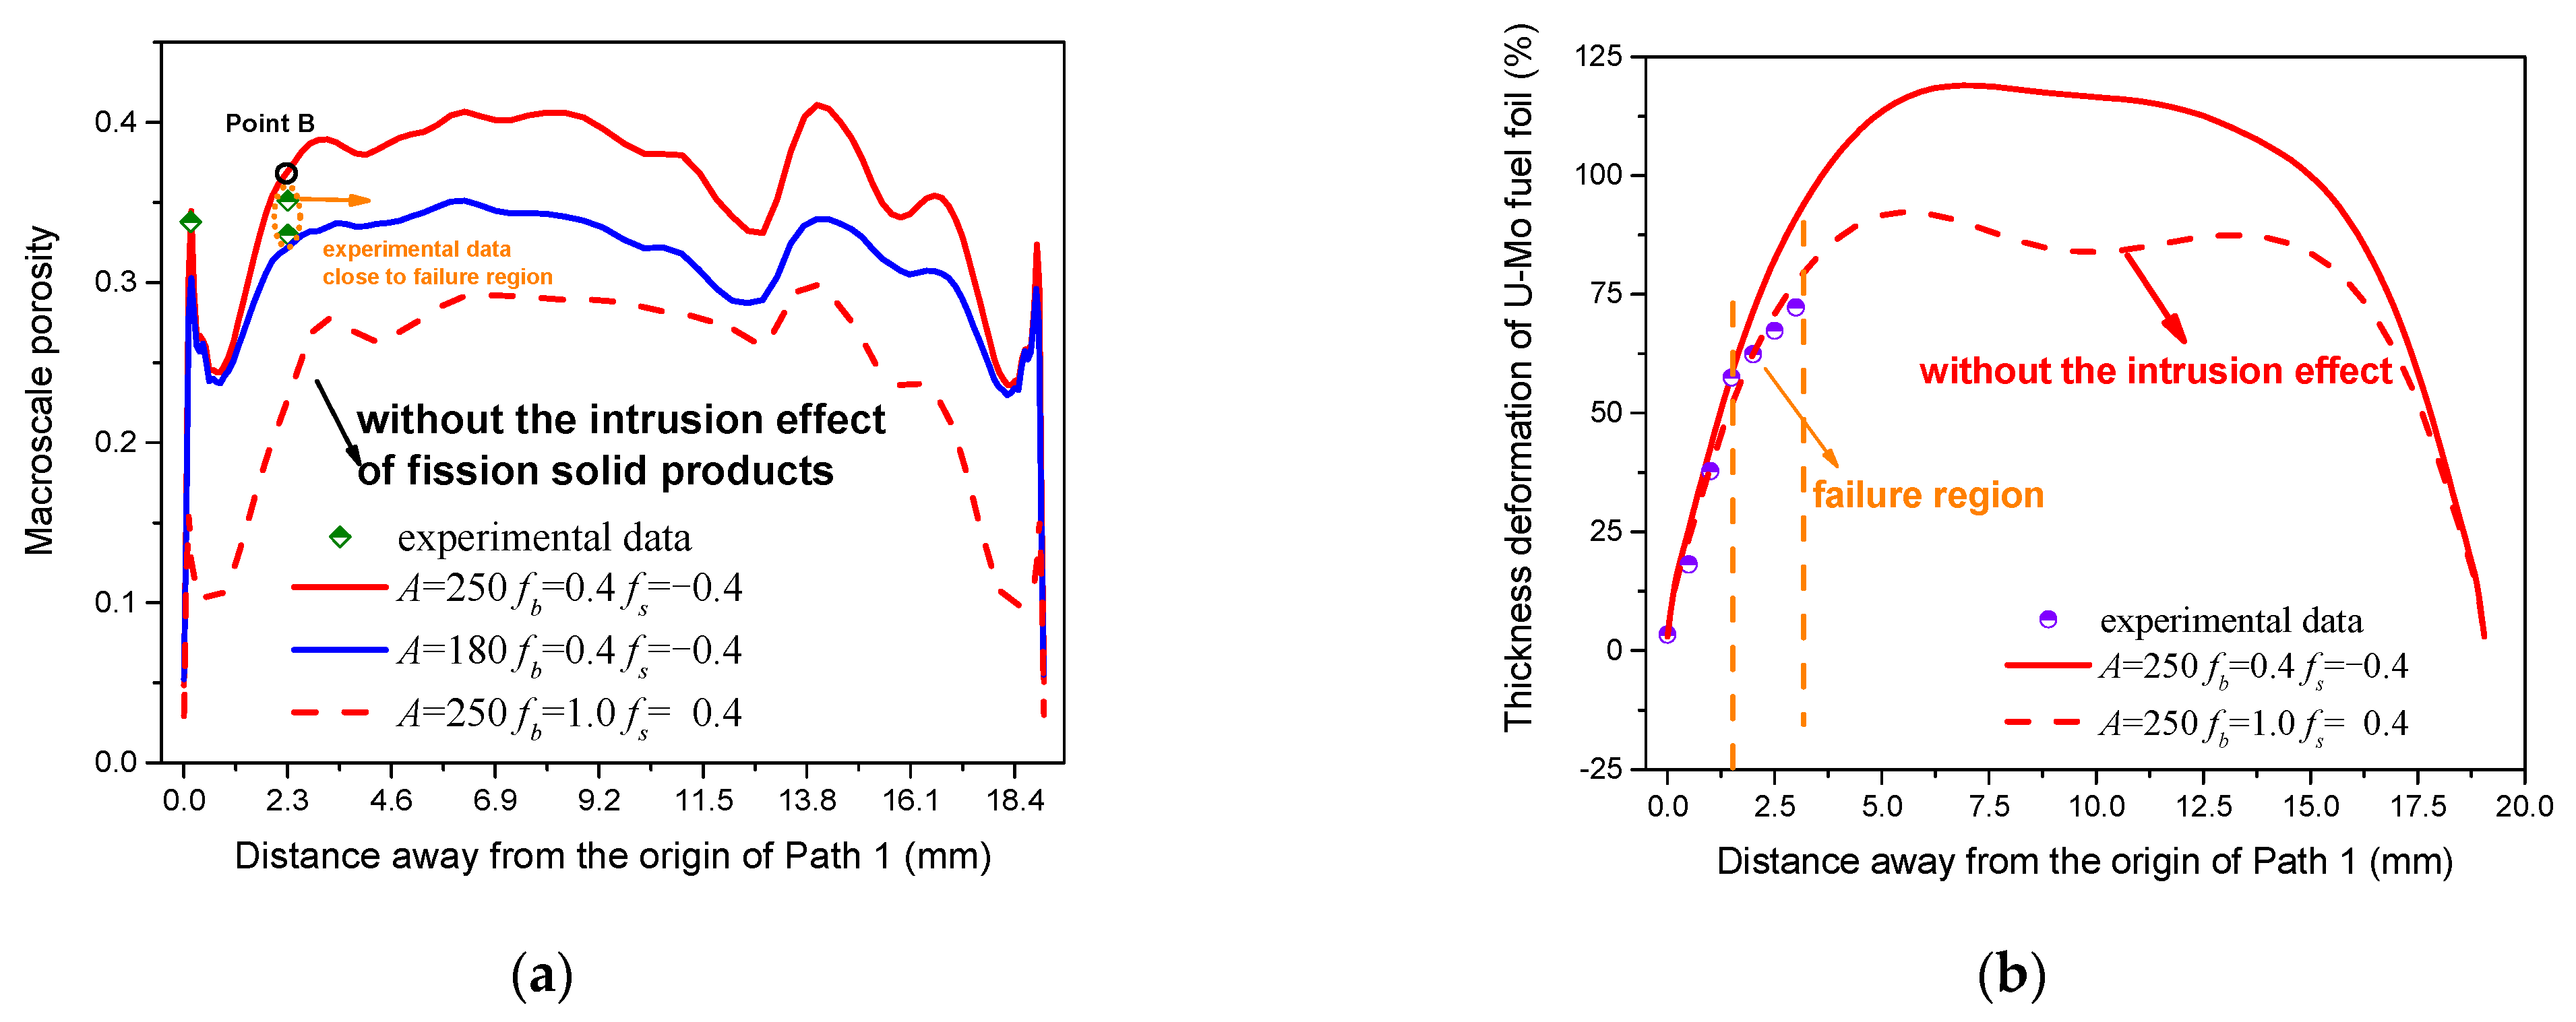
In order to compare the predictions with the experimental results, Path 1 in Figure 4a was selected to output the simulation results. Figure 5 gives the distribution results of the porosity and thickness deformation of U–Mo fuel foil on the 137.2th day along Path 1, together with the experimental data [8]. It can be seen that the predictions of porosity and thickness deformation match well with the post-irradiation examination data [8], when the creep rate coefficient for the Mo-depleted region is set as 250 × 10−22 mm3/(fission·MPa), and the parameters fb and fs are set to the values of 0.4 and −0.4, respectively. It should be mentioned that many attempts were performed, and ultimately the above values were identified. From Figure 5a, one can observe that the predicted porosities for the other two cases cannot reach the value of ~35% near the path origin [8]. Without considering the intrusion effect, this porosity prediction is a small value of ~15%, and the predictions of the other two points become much smaller than the experimental results [8]. From Figure 5b, one can observe that the thickness deformations near the path origin both agree well with the experimental data [8], excluding those across the failure region. It is noted that the predictions are affected slightly by the different creep rate coefficients for the Mo-depleted region, as displayed in Appendix A. It should be mentioned that the fracture behavior of fuel plate L1P7A0 was not taken into account in this study, therefore, the experimental results from the un-failed region close to the fuel foil edge were used to validate the improved models. The predicted results of the thickness deformation in the failure region are higher than the experimental data [8], owing to the fact that the release of fission gas atoms leads to the shrinkage of the bubble volume and the thinning of the fuel foil.
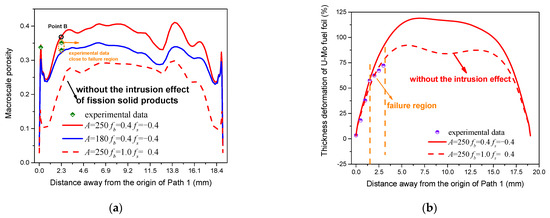
Figure 5.
Predictions of (a) the macroscale porosity and (b) the thickness deformation of U–Mo fuel foil on the 137.2th day along Path 1. (data from Ref. [8]).
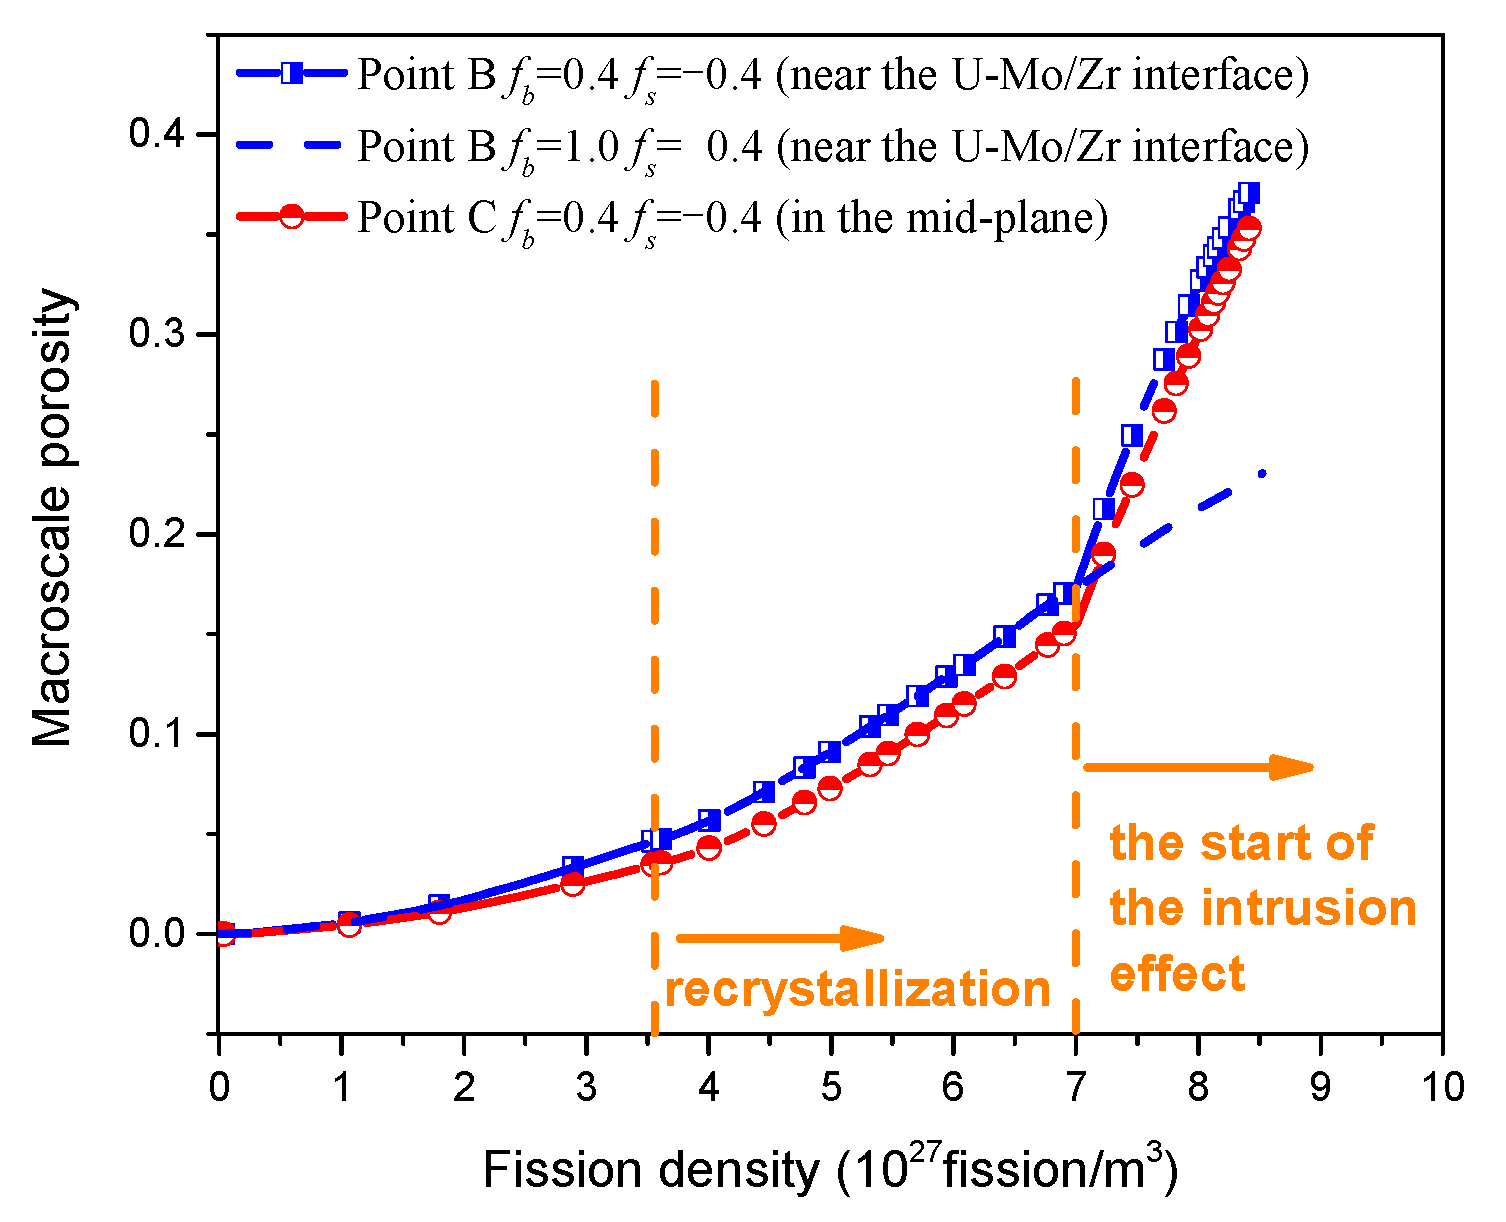
Point B and Point C in Figure 4a were chosen to output the evolution results of macroscale porosity, as shown in Figure 6. It should be mentioned that a creep rate coefficient of 250 × 10−22 mm3/(fission·MPa) is used for the Mo-depleted region. It can be seen that, for the case considering the intrusion effect of solid fission products, similar evolution results appear for the two points, with the values for Point B being a little higher than those for Point C. It can be found that the growth rates of macroscale porosity are enhanced with the increase in fission density. The rate acceleration can be found after the grain recrystallization initiation, corresponding to the acceleration of fission gas swelling. In particular, an elevated growth rate can be evidently observed at higher fission densities with the intrusion effect involved, indicating that the intrusion effect of solid fission products has a great impact on the volume growth of fission gas bubbles. Simultaneously, it can be found that the predictions without the intrusion effect at the fission densities exceeding 7 × 1027 fission/m3 are much lower, demonstrating the dominant effect of the solid fission product intrusion into the fission gas bubbles.

Figure 6.
The macroscale porosity evolution results of Point B and Point C as a function of fission density with the creep rate coefficient of 250 × 10−22 mm3/(fission·MPa) for the Mo-depleted region.
It should be mentioned that the identification of the creep rate coefficient and the model parameters of and is heavily dependent on the measured data of porosities using scanning electron microscopy (SEM). It was reported that the porosity analysis is sensitive to the SEM voltage. In the range from 5 KV to 30 KV, a relative difference about ~30% in the total porosity was recorded at a sample cut from a full-size dispersion plate irradiated at the Belgian Reactor 2 (BR2) [33]. The porosity experimental data of fuel plate L1P7A0 used in this study were measured at a voltage of 14 KV. Whether this was the optimal measurement voltage is unknown at present. However, the critical fission density of 7 × 1027 fission/m3, corresponding to the start of the intrusion effect of solid fission products, is also figured out using the available experimental data. As a result, some uncertainties in the parameters of the newly developed models may exist.
4.2. The Underlying Deformation Mechanism of Higher Porosity of the Fuel Foil at High Burnup
From Equation (8), it can be noted that the macroscale creep rate is related to the macroscale porosities (or the bubble volume), which is affected by the fission solid swelling, thermal expansion, irradiation-induced creep of fuel skeleton and the initial bubble volume, increasing with , , and the initial bubble volume, as indicated in Equation (6). Inversely, the macroscale creep behavior of U–Mo fuel foil affects the interaction between the U–Mo fuel foil and Al alloy cladding, impacting the macroscale hydrostatic pressure of the fuel foil and the creep behavior of the fuel skeleton, ultimately affecting the growth of bubbles. The degradation of elastic properties also affects the interaction among the fuel parts, impacting the stress of U–Mo fuel foil and the values of the creep rate. It is assumed that the fission rate is identical across the thickness of fuel foil. Hence, the volume growth strains induced by the solid fission products are close to each other for Point B and Point C. It should be mentioned that the temperature values in the mid-plane are evidently higher than those near the U–Mo/Zr interface, resulting in the larger initial bubble volume and local porosity of Point C. Table 1 gives the initial bubble volume and local porosity of Point B and Point C at the fission density of 1.2 × 1026 fission/m3, calculated using the model in ref. [19]. From our previous study [19], it is known that the result of plays a dominant role in the bubble growth over the other two contributions of and .

Table 1.
The initial bubble volume and local porosity of Point A and Point B.
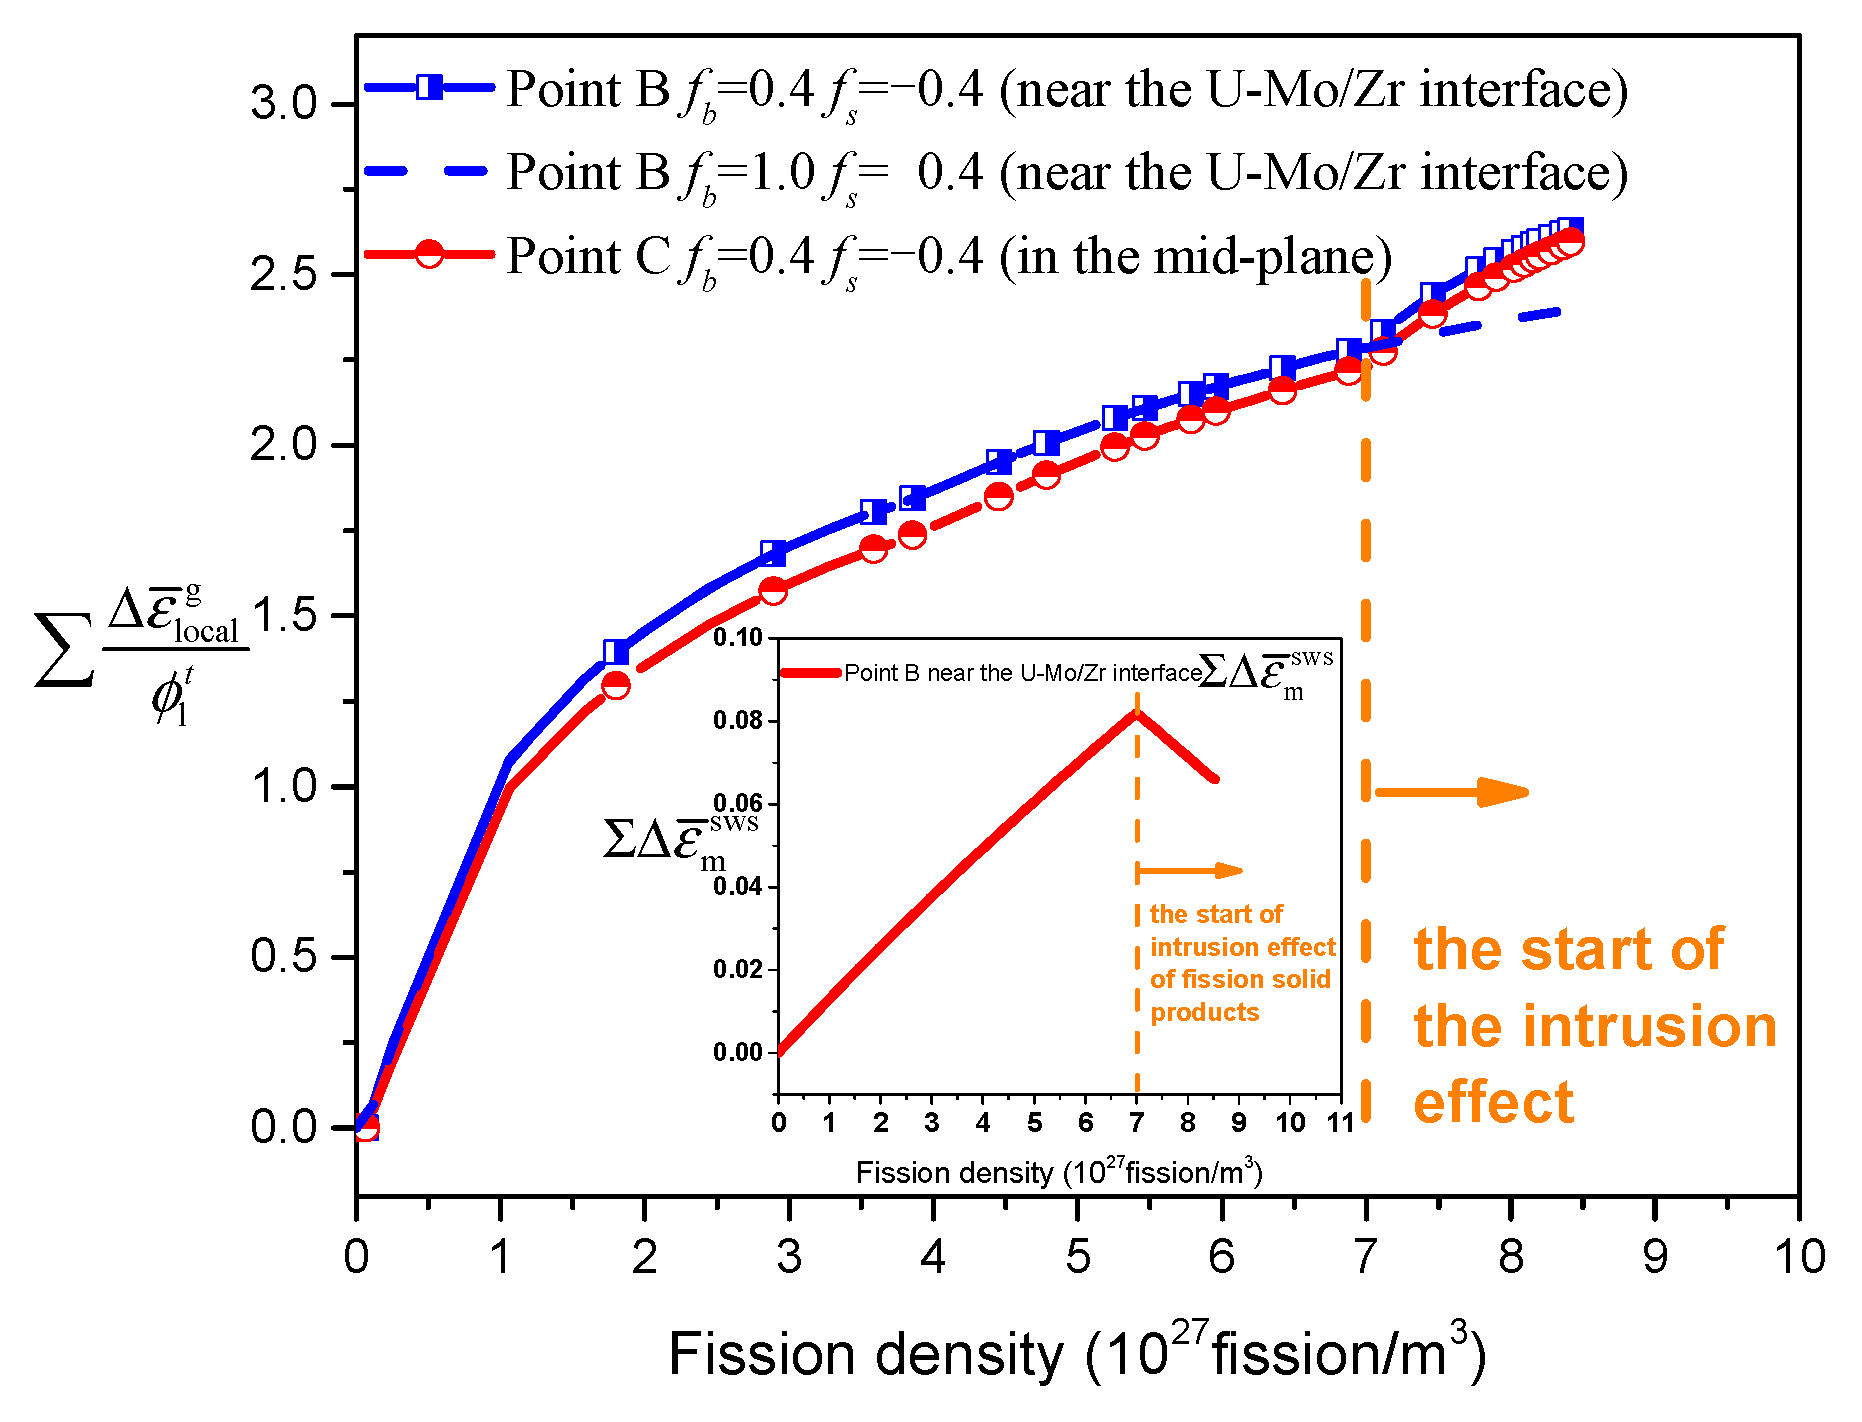
Figure 7 gives the evolution results of with the fission density for Point B and Point C. It should be mentioned that the following results are based on the creep rate coefficient of 250 × 10−22 mm3/(fission·MPa) for the Mo-depleted region. One can find that the results of show a significant increase with the fission density. Quicker growth rates appear when the fission density exceeds 7 × 1027 fission/m3, compared to those without the intrusion effect. Due to the exponential growth relationship of bubble volume with , the macroscale porosities are greatly enhanced in Figure 6, despite the reduction in at higher fission densities. It can be found that the values of are less than 0.1 from Figure 7, resulting in a much lower contribution than that from . However, the results of for Point B (near the U–Mo/Zr interface) are larger than those for Point C (in the mid-plane), leading to the relatively higher porosity near the U–Mo/Zr interface.
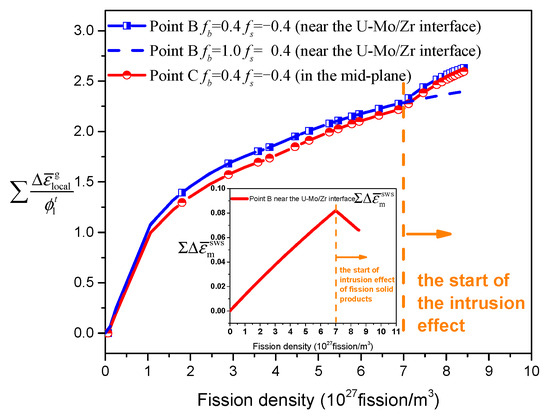
Figure 7.
The evolution results of with the fission density.
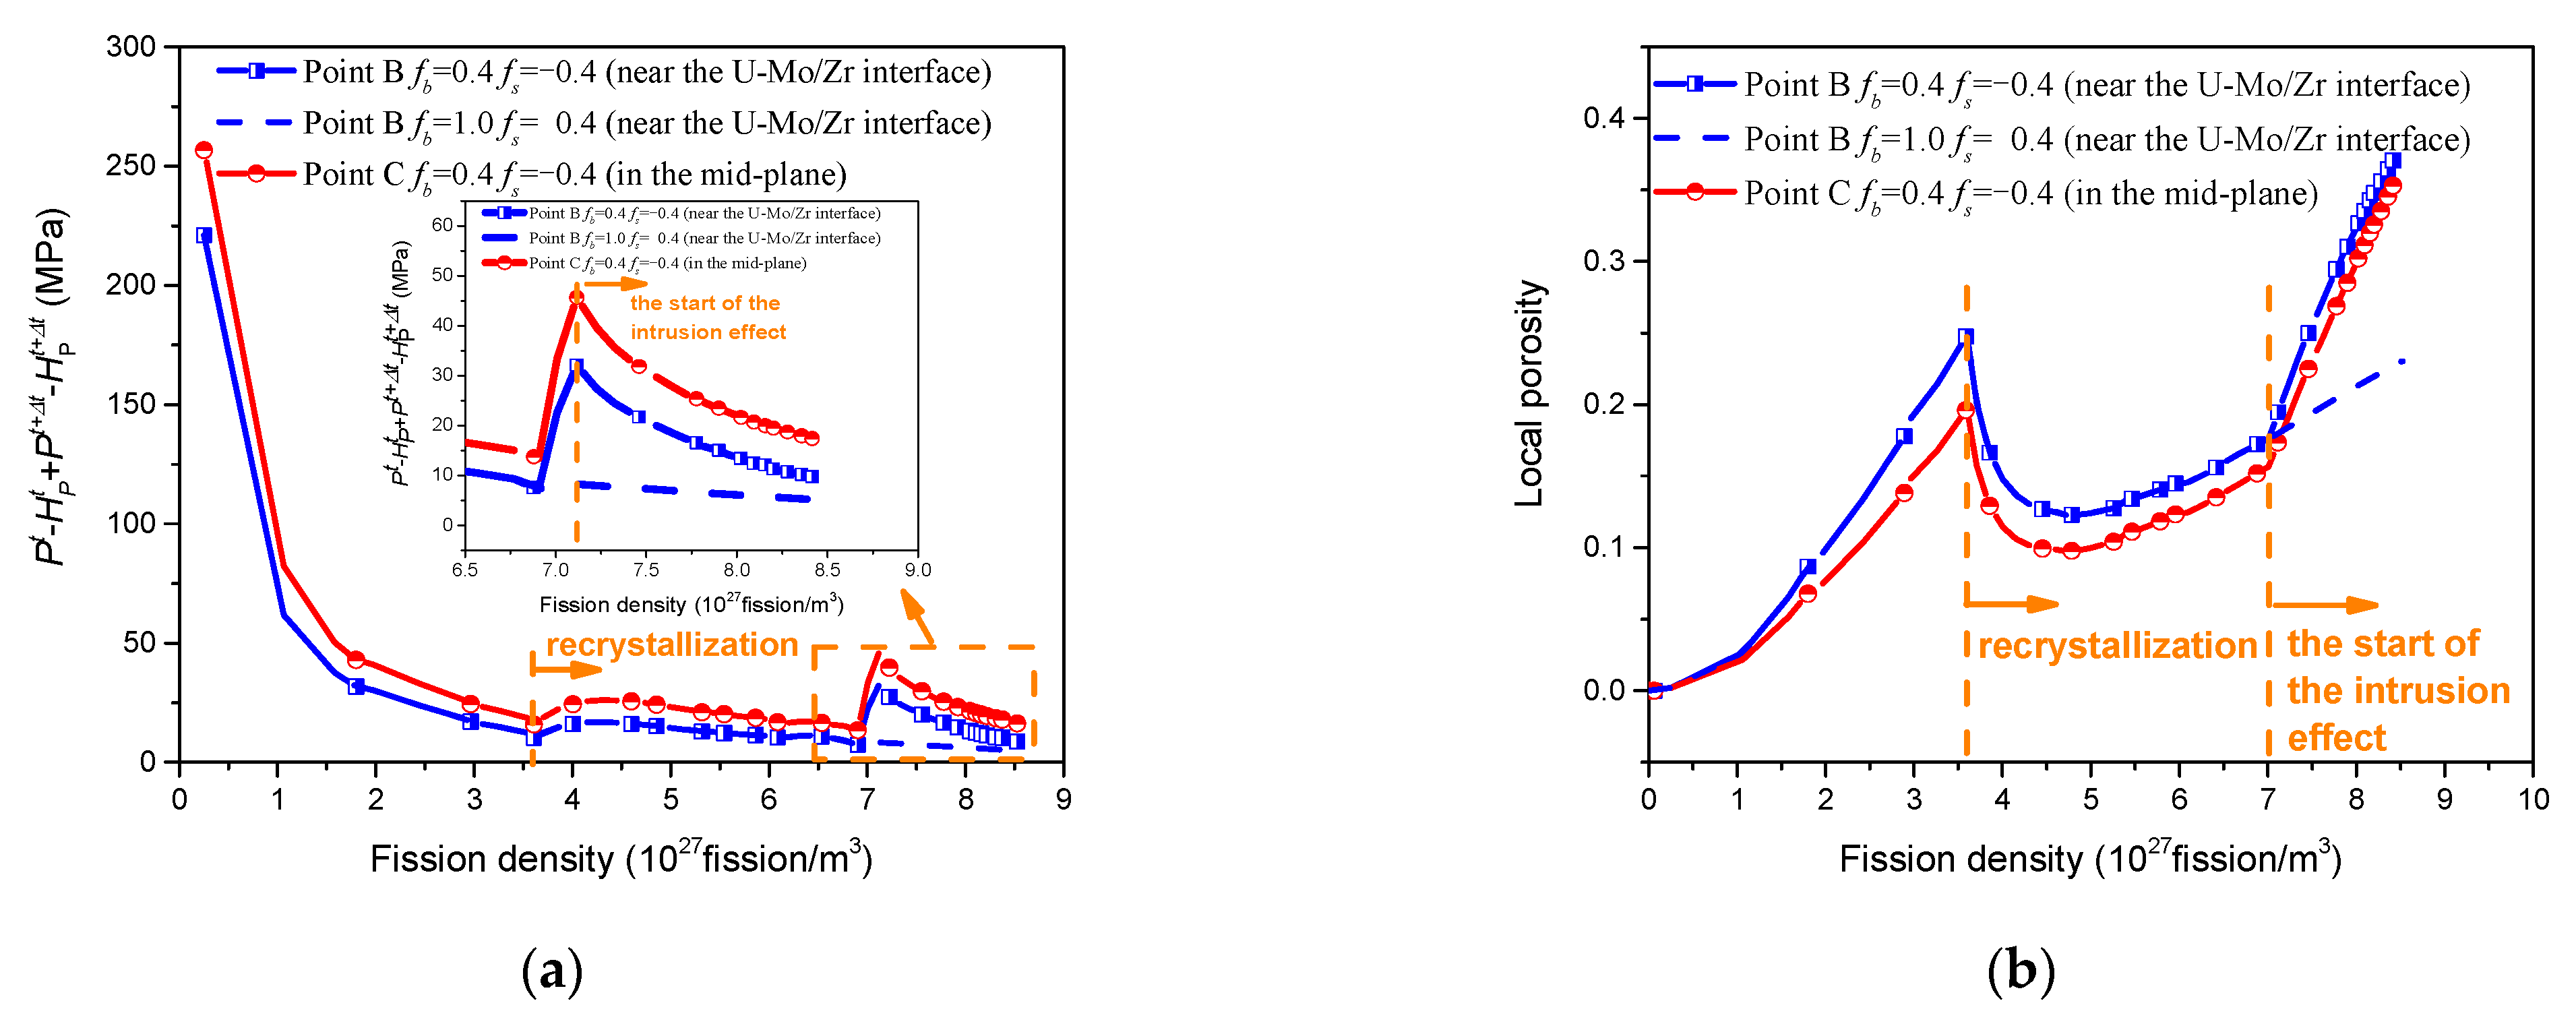
From Equation (2), it can be realized that the accumulated creep strains of are essentially dependent on the creep rate coefficient of the fuel skeleton, the local porosity and the pressure difference , having positive correlations with them. Figure 8a displays the pressure differences between the bubble pressure and the macroscale hydrostatic pressure. One can see that the pressure differences show an evident decrease before the grain recrystallization, due to the gradual increase in bubble volume. With the intrusion effect involved, the pressure differences firstly increase fast and then decrease with the fission density. The maximum value of ~35 MPa for Point B is achieved at the start of the intrusion effect, becoming nearly ~6 times greater than the value without considering the intrusion effect. Meanwhile, the local porosities are also heavily enhanced by the intrusion effect, as shown in Figure 8b, with an increase from ~0.22 to ~0.38 for Point B. The maintained larger local porosity and the higher pressure difference leads to the more rapid rise of for Point B. However, it can be found that the pressure differences for Point B (near the U–Mo/Zr interface) are lower than those for Point C (in the mid-plane), but the local porosities of Point B are always greater than those of Point C, induced by the large creep rate coefficient for Point B. It can be obtained from Equations (2) and (6) that the locally enhanced fuel skeleton creep ability for the Mo-depleted region should be responsible for the higher porosity near the U–Mo/Zr interface. It is reported that the thickness of the U–Mo/Zr interface increases after heat treatment, which influences swelling and blistering in the Mo-depleted region, as the porosity here is locally enhanced at low burnup [34]. The material properties degrade severely with the high porosity [35], possibly inducing a fracture of the fuel plate during irradiation. If the occurrence of fractures in the Mo-depleted region during manufacturing or irradiation can be lessened or suppressed, the irradiation performance of the U–10Mo fuel plate in the reactor may be more stable.
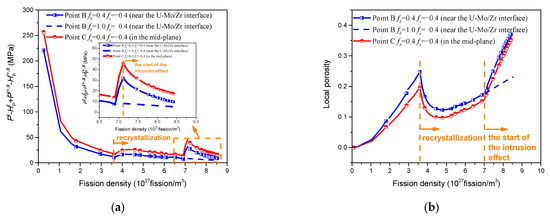
Figure 8.
The evolution results of (a) pressure difference and (b) local porosity with fission density.
Essentially, the creep deformations of materials are a kind of plastic deformation, contributed by the motion of vacancies and dislocations in microscale. The accumulation of plastic deformations may result in the formation of voids and the initiation of cracks [36,37], degrading the strength of materials. At present, the internal link between the failure and deformation behaviors of U–10Mo fuel foil during irradiation and its microscale creep behaviors is not clear yet, which requires further research.
5. Conclusions
In this study, the fuel skeleton creep-based bubble growth model is further improved with the consideration of the intrusion effect of solid fission products. With the locally enhanced irradiation creep of the Mo-depleted region considered, the irradiation-induced thermos-mechanical behaviors of monolithic fuel plate L1P7A0 are numerically investigated. The predictions of porosities and thickness deformation for U–Mo fuel foil are obtained. The mechanism of high porosity in the heavily irradiated U–10Mo fuel foil is discussed. The main conclusions can be drawn as follows:
- (1)
- The simulation results produce the best-fit creep rate coefficient of 250 × 10−22 mm3/(fission·Mpa) for the Mo-depleted region, and the parameters of fb = 0.4 and fs = −0.4 for the improved bubble growth model, by comparing the predicted results of macroscale porosities and thickness deformation of the U–Mo fuel foil with the experimental results.
- (2)
- The intrusion of solid fission products, leading to the extra differences between the bubble pressure and the external pressure, is the dominant factor to induce the high porosity in most regions of heavily irradiated fuel foil.
- (3)
- The locally enhanced fuel skeleton creep ability is responsible for the higher porosities near the U–Mo/Zr interface.
Author Contributions
Literature search, X.J., S.D. and Y.Z.; study design, X.J., S.D. and Y.Z.; figures, X.J.; data collection, X.J. and S.D.; data analysis, X.J. and S.D.; data interpretation, X.J. and S.D.; writing—original draft preparation, X.J.; writing—review and editing, S.D.; supervision, S.D. and Y.Z. All authors have read and agreed to the published version of the manuscript.
Funding
The authors are grateful for the support of the National Natural Science Foundation of China (Nos. 12102094, 12132005, 12135008), and the support of the foundation from Science and Technology on Reactor System Design Technology Laboratory (HT-KFKT-24-2021018). This study is also sponsored by the Shanghai Sailing Program (21YF1402200).
Data Availability Statement
The data that support the findings of this study are available upon reasonable request from the corresponding authors.
Conflicts of Interest
The authors declare no conflict of interest.
Appendix A
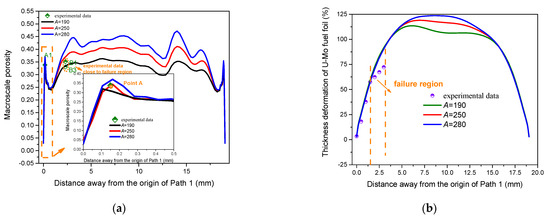
Figure A1.
Finite element simulation results of (a) macroscale porosity and (b) thickness deformation of U–Mo fuel foil on the 137.2th day with the different creep rate coefficients of the Mo-depleted region considering the intrusion effect of solid fission products.(data from Ref. [8]).
Figure A1.
Finite element simulation results of (a) macroscale porosity and (b) thickness deformation of U–Mo fuel foil on the 137.2th day with the different creep rate coefficients of the Mo-depleted region considering the intrusion effect of solid fission products.(data from Ref. [8]).
References
- Mao, S.-X.; Song, J.-Y.; Zhu, W.-S.; Li, H.-M.; Pang, J.-Y.; Dang, D.-B.; Bai, Y. Heterogeneous oxidative desulfurization of fuels using amphiphilic mesoporous phosphomolybdate-based poly(ionic liquid) over a wide temperature range. Fuel 2023, 352, 128982. [Google Scholar] [CrossRef]
- Li, N.; Xue, J.; Wu, S.; Qin, K.; Liu, N. Research on Coal and Gangue Recognition Model Based on CAM-Hardswish with Effi-cientNetV2. Appl. Sci. 2023, 13, 8887. [Google Scholar] [CrossRef]
- Pascaris, A.S.; Pearce, J.M. U.S. Greenhouse Gas Emission Bottlenecks: Prioritization of Targets for Climate Liability. Energies 2020, 13, 3932. [Google Scholar] [CrossRef]
- Wang, G.; Wang, Z.; Yun, D. Cladding Failure Modelling for Lead-Based Fast Reactors: A Review and Prospects. Metals 2023, 13, 1524. [Google Scholar] [CrossRef]
- Meyer, M.; Hofman, G.; Hayes, S.; Clark, C.; Wiencek, T.; Snelgrove, J.; Strain, R.; Kim, K.-H. Low-temperature irradiation behavior of uranium–molybdenum alloy dispersion fuel. J. Nucl. Mater. 2002, 304, 221–236. [Google Scholar] [CrossRef]
- Park, J.-M.; Kim, K.-H.; Kim, C.-K.; Meyer, M.K.; Hofman, G.L.; Strain, R.V. The irradiation behavior of atomized U-Mo alloy fuels at high temperature. Met. Mater. Int. 2001, 7, 151–157. [Google Scholar] [CrossRef]
- Lee, D.B.; Kim, K.H.; Kim, C.K. Thermal compatibility studies of unirradiated U-Mo alloys dispersed in aluminum. J. Nucl. Mater. 1997, 250, 79–82. [Google Scholar] [CrossRef]
- Smith, C.; Jue, J.-F.; Keiser, D.; Trowbridge, T.; Miller, B.; Robinson, A.; Winston, A.; Giglio, J. An investigation of the failure modes in U-10Mo monolithic fuel irradiated to high burnup. J. Nucl. Mater. 2023, 575, 154202. [Google Scholar] [CrossRef]
- Keiser, D.; Jue, J.; Miller, B.; Gan, J.; Robinson, A.; Madden, J. Observed Changes in As-Fabricated U-10Mo Monolithic Fuel Mi-crostructures after Irradiation in the Advanced Test Reactor. JOM 2017, 69, 2538–2545. [Google Scholar] [CrossRef]
- Rice, F.; Williams, W.; Robinson, A.; Harp, J.; Meyer, M.; Rabin, B. RERTR-12 Post-Irradiation Examination Summary Report; Idaho National Laboratory: Idaho Falls, ID, USA, 2015. [Google Scholar] [CrossRef]
- Schulthess, J.L.; Lloyd, W.R.; Rabin, B.; Wheeler, K.; Walters, T.W. Mechanical properties of irradiated U Mo alloy fuel. J. Nucl. Mater. 2018, 515, 91–106. [Google Scholar] [CrossRef]
- Burkes, D.E.; Casella, A.M.; Casella, A.J.; Buck, E.C.; Pool, K.N.; MacFarlan, P.J.; Edwards, M.K.; Smith, F.N. Thermal proper-ties of U-Mo alloys irradiated to moderate burnup and power. J. Nucl. Mater. 2015, 464, 331–341. [Google Scholar] [CrossRef]
- Burkes, D.E.; Schwerdt, I.J.; Huber, T.K.; Breitkreutz, H.; Reiter, C.; Petry, W.; Schulthess, J.L.; Casella, A.M.; Casella, A.J.; Buck, E.C.; et al. Thermal properties of U-Mo alloys irradiated under high fis-sion power density. J. Nucl. Mater. 2021, 547, 152823. [Google Scholar] [CrossRef]
- Burkes, D.E.; Prabhakaran, R.; Jue, J.; Rice, F.J. Mechanical Properties of DU-xMo Alloys with x = 7 to 12 Weight Percent. Metall. Mater. Trans. A 2009, 40, 1069–1079. [Google Scholar] [CrossRef]
- Leenaers, A.; Wight, J.; Berghe, S.; Ryu, H.J.; Valery, J.F. U-Mo Based Fuel System. Compr. Nucl. Mater. 2020, 5, 499–530. [Google Scholar]
- Rest, J.; Kim, Y.S.; Hofman, G.L.; Meyer, M.K.; Hayes, S.L. U-Mo Fuels Handbook; Argonne National Laboratory Report ANL-09/31; Argonne National Laboratory: Chicago, IL, USA, 2009. [Google Scholar]
- Kim, Y.S.; Hofman, G.; Cheon, J.; Robinson, A.; Wachs, D. Fission induced swelling and creep of U–Mo alloy fuel. J. Nucl. Mater. 2013, 437, 37–46. [Google Scholar] [CrossRef]
- Jian, X.; Kong, X.; Ding, S. A mesoscale stress model for irradiated U 10Mo monolithic fuels based on evolution of volume fraction/radius/internal pressure of bubbles. Nucl. Eng. Technol. 2019, 51, 1575–1588. [Google Scholar] [CrossRef]
- Jian, X.; Zhang, J.; Li, Y.; Ding, S. Skeleton-creep based bubble growth model and multi-scale mechanical constitutive model for U-10Mo fuels under irradiation. Int. J. Plast. 2023, 163, 103557. [Google Scholar] [CrossRef]
- Jian, X.; Yan, F.; Kong, X.; Li, Y.; Ding, S. Further development of the fission gas swelling model for U-10Mo fuels. J. Nucl. Mater. 2022, 565, 153769. [Google Scholar] [CrossRef]
- Rest, J. A model for the effect of the progression of irradiation-induced recrystallization from initiation to completion on swelling of UO2 and U–10Mo nuclear fuels. J. Nucl. Mater. 2005, 346, 226–232. [Google Scholar] [CrossRef]
- Kim, Y.S.; Hofman, G.; Cheon, J. Recrystallization and fission-gas-bubble swelling of U–Mo fuel. J. Nucl. Mater. 2013, 436, 14–22. [Google Scholar] [CrossRef]
- Spino, J.; Stalios, A.D.; Cruz, H.S.; Baron, D. Stereological evolution of the rim structure in PWR-fuels at prolonged irra-diation: Dependencies with burn-up and temperature. J. Nucl. Mater. 2006, 354, 66–84. [Google Scholar] [CrossRef]
- Perez, D.M.; Chang, G.S.; Wachs, D.M.; Roth, G.A.; Woolstenhulme, N.E. RERTR-12 Insertion 2 Irradiation Summary Report; Idaho National Laboratory: Idaho Falls, ID, USA, 2012. [Google Scholar] [CrossRef]
- Meyer, M.K. Investigation of the Cause of Low Blister Threshold Temperatures in the RERTR-12 and AFIP-4 Experiments; Idaho National Laboratory: Idaho Falls, ID, USA, 2012. [Google Scholar]
- Meyer, M.; Gan, J.; Jue, J.; Keiser, D.; Perez, E.; Robinson, A.; Wachs, D.; Woolstenhulme, N.; Hofman, G.; Kim, Y. Irradiation Performance of U-Mo Monolithic Fuel. Nucl. Eng. Technol. 2014, 46, 169–182. [Google Scholar] [CrossRef]
- Marchbanks, M.F. ANS Materials Databook; Oak Ridge National Laboratory: Oak Ridge, TN, USA, 1995. [Google Scholar]
- Ozaltun, H.; Shen, M.-H.H.; Medvedev, P. Assessment of residual stresses on U10Mo alloy based monolithic mini-plates during Hot Isostatic Pressing. J. Nucl. Mater. 2011, 419, 76–84. [Google Scholar] [CrossRef]
- Macdonald, P.E.; Thomson, L.B. MATPRO-version 10: A Handbook of Materials Properties for Use in the Analysis of Light Water Reactor Fuel Rod Behavior; Idaho National Laboratory: Idaho Falls, ID, USA, 1978. [Google Scholar]
- Hagrman, D.T.; Allison, C.M.; Berna, G.A. SCDAP/RELAP5/MOD 3.1 Code Manual: MATPRO; A Library of Materials Proper-ties for Light-Water-Reactor Accident Analysis, Idaho National Engineering and Environmental Laboratory: Idaho Falls, ID, USA, 2003. [Google Scholar]
- Suzuki, M.; Saitou, H. Light Water Reactor Fuel Analysis Code FEMAXI-6; Version 1; JAEA-Data/Code; Japan Atomic Energy Agency: Tsuruga-shi, Fukui, Japan, 2005. [Google Scholar]
- Dienst, W. Irradiation induced creep of ceramic nuclear fuels. J. Nucl. Mater. 1977, 65, 1–8. [Google Scholar] [CrossRef]
- Salvato, D.; Smith, C.; Ye, B.; Mei, Z.-G.; Yacout, A.; Van Eyken, J.; Miller, B.; Keiser, D.; Glagolenko, I.; Giglio, J.; et al. Impact of SEM acquisition parameters on the porosity analysis of irradiated U-Mo fuel. Nucl. Mater. Energy 2023, 36, 101469. [Google Scholar] [CrossRef]
- Di Lemma, F.; Jue, J.; Trowbridge, T.; Smith, C.; Miller, B.; Keiser, D.; Giglio, J.; Cole, J. Annealing influence on the microstructure of irradiated U-Mo monolithic fuel foils. Nucl. Mater. Energy 2023, 35, 101436. [Google Scholar] [CrossRef]
- Tang, Y.; Shan, Z.; Yin, G.; Miao, L.; Wang, S.; Zhang, Z. Low-Field Nuclear Magnetic Resonance Investigation on Early Hydra-tion Characterization of Cement Paste Mixed with Mineral Admixtures. Buildings 2023, 13, 2318. [Google Scholar] [CrossRef]
- Gao, S.; Wang, H.; Huang, H.; Kang, R. Molecular simulation of the plastic deformation and crack formation in single grit grinding of 4H-SiC single crystal. Int. J. Mech. Sci. 2023, 247, 108147. [Google Scholar] [CrossRef]
- Zhao, Y.; Liu, K.; Zhang, H.; Tian, X.; Jiang, Q.; Murugadoss, V.; Hou, H. Dislocation motion in plastic deformation of nano polycrystalline metal materials: A phase field crystal method study. Adv. Compos. Hybrid Mater. 2022, 5, 2546–2556. [Google Scholar] [CrossRef]


Disclaimer/Publisher’s Note: The statements, opinions and data contained in all publications are solely those of the individual author(s) and contributor(s) and not of MDPI and/or the editor(s). MDPI and/or the editor(s) disclaim responsibility for any injury to people or property resulting from any ideas, methods, instructions or products referred to in the content. |
© 2023 by the authors. Licensee MDPI, Basel, Switzerland. This article is an open access article distributed under the terms and conditions of the Creative Commons Attribution (CC BY) license (https://creativecommons.org/licenses/by/4.0/).