Abstract
Addressing the exceptional properties of aluminium alloy composites reinforced with graphene, this study presents an interpretable machine learning approach to aid in the rapid and efficient design of such materials. Initially, data on these composites were gathered and optimised in order to create a dataset of composition/process-property. Several machine learning algorithms were used to train various models. The SHAP method was used to interpret and select the best performing model, which happened to be the CatBoost model. The model achieved accurate predictions of hardness and tensile strength, with coefficients of determination of 0.9597 and 0.9882, respectively, and average relative errors of 6.02% and 5.01%, respectively. The results obtained from the SHAP method unveiled the correlation between the composition, process and properties of aluminium alloy composites reinforced with graphene. By comparing the predicted and experimental data in this study, all machine learning models exhibited prediction errors within 10%, confirming their ability to generalise. This study offers valuable insights and support for designing high-performance aluminium matrix composites reinforced with graphene and showcases the implementation of machine learning in materials science.
1. Introduction
Graphene is considered an ideal reinforcement for metal matrix composites due to its excellent mechanical properties [1,2]. Meanwhile, aluminium alloys have become one of the most utilised metal materials in modern industry due to their favorable plasticity and low density [3,4,5]. The idea of incorporating graphene into aluminium alloys to create graphene-reinforced aluminium matrix composites has garnered significant attention. It has been found that the inclusion of graphene in the aluminium matrix enhances the material’s strength and hardness while retaining the high ductility of the matrix. The thermal and electric conductivity of the graphene-reinforced aluminium matrix composites were also significantly improved [6,7,8,9]. As a result, such composites have significant potential for development and application in a variety of fields, including electronics, aviation, and automotive industries [10,11].
The field of graphene-reinforced aluminium matrix composites has been extensively studied so far. Mishra et al. [12] experimentally investigated the effect of graphene on the wear properties of aluminium alloys and found that graphene can make the microstructure of the material more homogeneous and improve the wear and friction properties. Lazarova et al. [13] investigated the effect of annealing heat treatments on aluminium alloys reinforced by graphene nano-sheets, and found that the effect of graphene nanosheets on the strength of aluminium alloys, due to annealing, was greater than that due to the strengthening effect of graphene and carbides. However, the properties of aluminium matrix composites are greatly influenced by both the preparation process and matrix composition. Additionally, the poor dispersion and wettability of graphene with alloys can result in agglomeration when the graphene content in the aluminium matrix is inappropriate. This hinders the formation of strong interfacial bonding. The conventional method of “stir-fry” trial and error via empirically guided experiments is laborious and time-consuming, and researching novel materials exclusively through experimental approaches would pose a significant hurdle. M.E. Isametova et al. [14] discuss the development of reliability prediction methods on the basis of experimental data and propose a statistical model for assessing reliability in terms of structural strength of polymer composite products. Suzdaltsev et al. [15] analysed recent advances in the synthesis of new metal matrix composites and concluded that new approaches to the design and synthesis of such composites are still needed to improve and optimise their structure and properties. Zhao et al. [16] used first principles to calculate various types of interfaces in graphene/aluminium matrix composites, and found that Si interfaces are prone to segregation and become a source of crack propagation. This enlightens researchers on the need to develop a new efficient design method for graphene-reinforced aluminium matrix composites at a lower cost and in a shorter time, suitable for industrial applications.
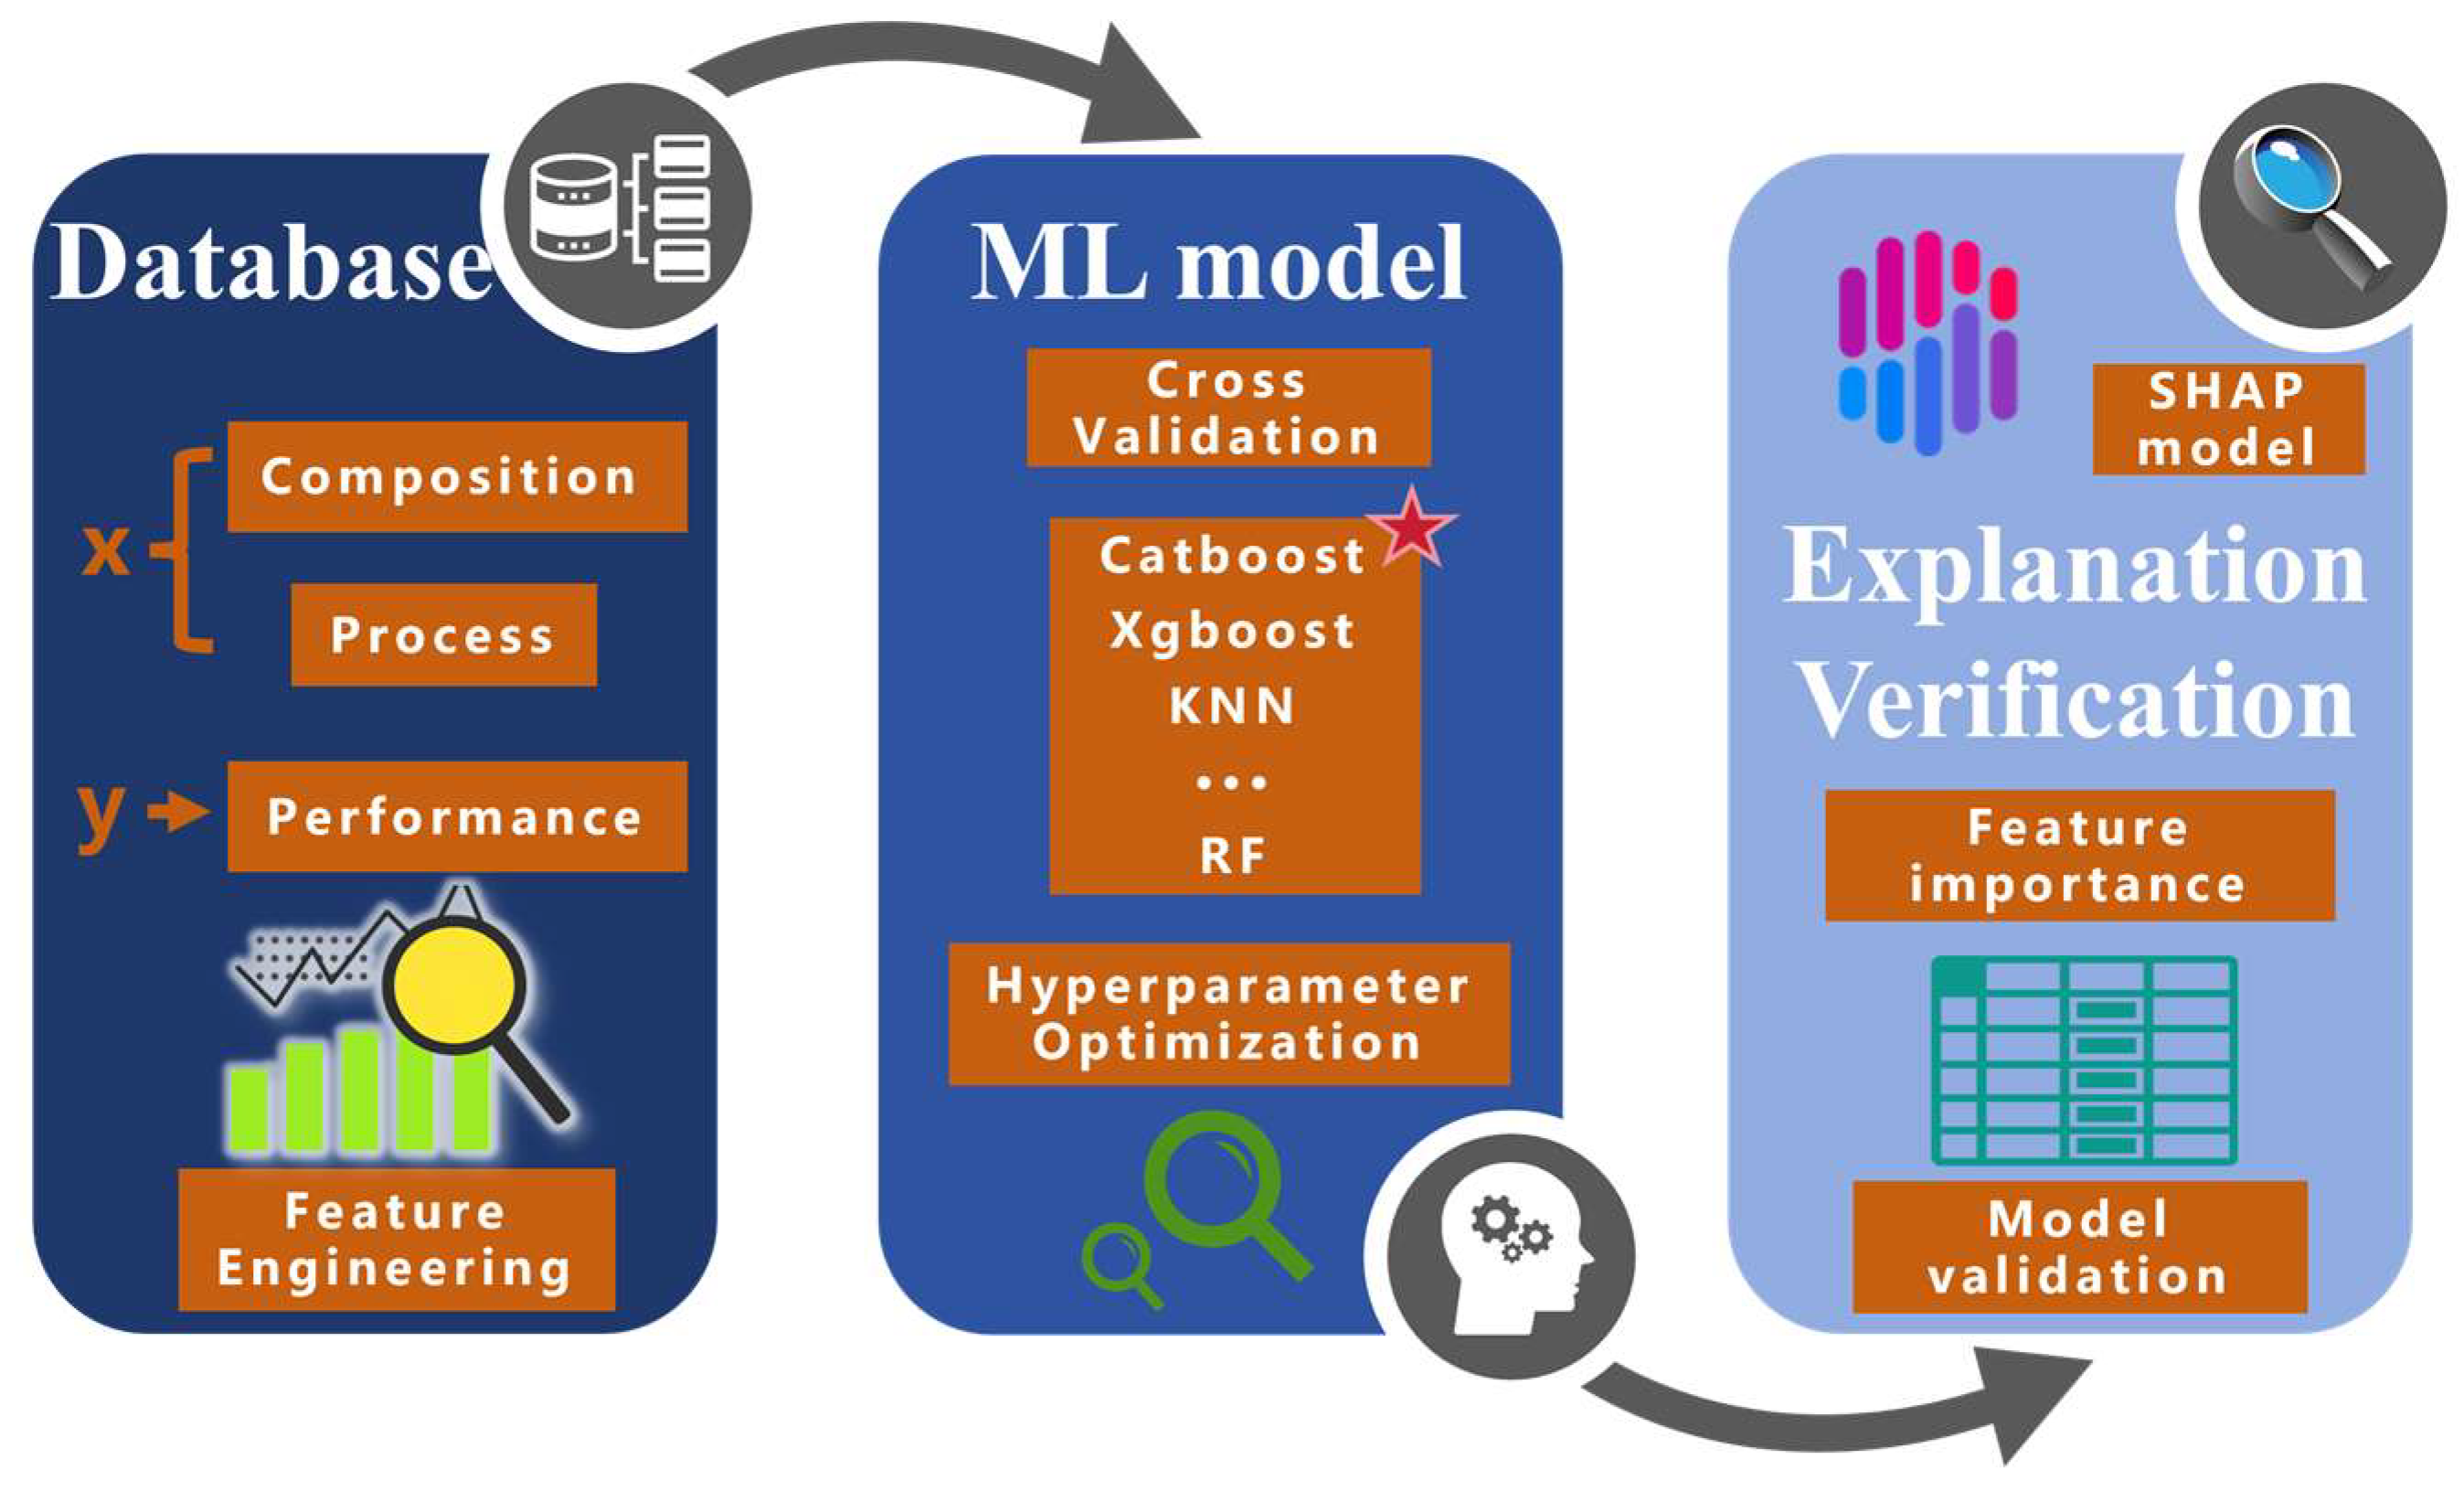
Machine learning is widely used in materials testing and design due to its powerful data processing and high predictive ability with low computational cost [17,18,19], and the technique has great potential for application in the field of graphene-reinforced aluminium matrix composites [20,21,22,23]. Chaudry et al. [24] used machine learning techniques to assist in the design of high-performance aluminium alloys, and the results showed that the gradient-enhanced tree model can effectively predict the hardness of unexplored alloys. Scientists are showing growing interest in aluminium alloy composites reinforced with graphene because of their potential applications across a range of industrial fields. However, significant shortcomings remain in the design of these composites. As shown in Figure 1, the aim of this study is to provide support for the efficient design of high-performance graphene-reinforced aluminium matrix composites and to reveal the key elements and process parameters that significantly affect the mechanical properties of graphene-reinforced aluminium matrix composites. The rest of the article is structured as follows: Section 2—Methods, describes the methodology used in this article, including the creation of the dataset, and an introduction to the machine learning model used. Section 3—Results and Discussion, presents the results derived from the feature engineering and modelling, and establishes and validates a model for predicting the mechanical properties of graphene-reinforced aluminium matrix composites, revealing the influence of each component and process factor on the properties of the composites. Section 4—Conclusions, analyses the strengths and limitations of the methodology, provides a structured conclusion and highlights the main findings and implications.
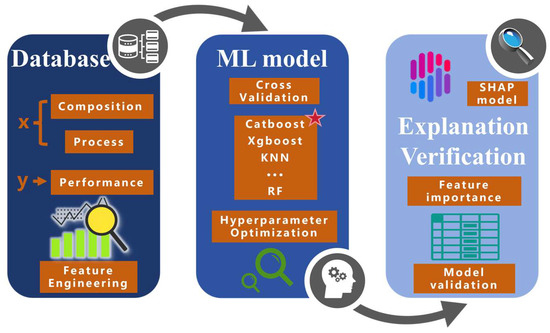
Figure 1.
Workflow of this study. The best performing algorithm is denoted by the red star.
2. Methods
2.1. Establishment and Pre-Processing of Datasets
Ball milling treatment improves the agglomeration behaviour of graphene in aluminium significantly. Furthermore, it leads to the refinement of particle size of the aluminium powder and further thinning of the graphene lamellae. Additionally, ball milling improves the interfacial wetting behaviour of graphene with aluminium. The process of ball milling results in charge transfer and electron enrichment on the surface of deformed aluminium powder, allowing for full contact between graphene and aluminium powder particles, and enhancing interfacial bonding. To ensure data comparability, we standardised the performance data to that of block samples prepared through the powder metallurgy method after ball milling.
We collected 135 datasets on graphene-reinforced aluminium matrix composites from 85 sources. The data represent mechanical properties of different aluminium alloys, with varying graphene additions, under various preparation processes. Among them, the compositional parameters comprise the compositions of matrix aluminium alloys such as Al, Cu, Mg, Mn, Zn, Cr, Si, Fe, and the use of graphene additions. The process parameters consist of ball milling and sintering conditions, including temperature, time, speed, ball-to-powder weight ratio, and milling atmospheres. The mechanical parameters encompass various factors. Selection criteria were applied in the process. Firstly, data was sourced from reputable databases such as Wiley InterScience and Elsevier ScienceDirect, ensuring current and reliable information. Secondly, block samples were prepared from ball-milled graphene flakes and aluminium alloys via powder metallurgy as a prerequisite for data selection in this article. Finally, we screened studies that used standardised test methods and provided detailed experimental conditions to ensure the reliability and consistency of the data. The Vickers hardness of the composites was measured using a micro Vickers hardness tester to ensure accuracy of the experimental results. It is recommended that the average hardness value be taken as the final value in accordance with the selected literature. To measure the tensile strength of the composites, the selected literature should use an electronic universal material testing machine at room temperature.
To ensure high-quality and consistent data, we performed the following preprocessing steps: we eliminated data with missing values or outliers using the IQR method, standardised all numerical features prior to the partial model to ensure they were on the same scale, and encoded categorical features for machine learning algorithm processing. The Spearman’s correlation coefficient is a type of rank correlation coefficient, which is better suited to nonlinear problems than Pearson’s correlation coefficient. This is because it does not require the data to adhere to a normal distribution and is less impacted by outliers. The Spearman correlation coefficient is utilised in correlation analysis to identify and eliminate features that possess a low correlation with a performance metric, consequently decreasing the model’s complexity and enhancing the predictive performance.
2.2. Machine Learning Methods
Machine learning is a subfield of artificial intelligence that allows computers to acquire experiences and knowledge without requiring explicit programming [25,26]. During this research, we employed numerous machine learning algorithms to train model including CatBoost, Gradient Boosting, Extra Trees, Random Forest, AdaBoost, Decision Tree, Extreme Gradient Boosting and K Neighbors. Of these, CatBoost is an integrated decision tree method that caters to categorical features and offers model interpretations. Meanwhile, K Neighbors is an instance-based learning approach that makes predictions by computing the distance between new data points and each data point in the training dataset. The non-parametric supervised learning method known as the “decision tree” utilises a tree-like structure to forecast target variable values for a given sample. Machine learning processes apply correlation analysis and coded classification features techniques. Additionally, concepts such as hyperparameter optimisation and cross-validation are used to strike a balance between generalisability and accuracy when dealing with small sample data [27]. To gain further insight into the predictive mechanism of the CatBoost model, we employed the SHAP technique to investigate the correlation between the composition, process, and characteristics of graphene-reinforced aluminium alloy composites.
Cross-validation aims to improve the evaluation of a model’s generalisation performance and stability. It comprehensively assesses the model’s performance by dividing the dataset into multiple sections, using some of the data for training the model and the rest for testing. This article employs the K-fold cross-validation strategy with K = 5. Hyperparameter optimisation is the process of enhancing a model’s performance by adjusting its own parameters. These parameters must be pre-set during the training process and are closely correlated with the model’s training outcomes. Different combinations of hyperparameters can significantly impact the model’s performance; thus, an optimal set of hyperparameters needs to be found to optimise the model’s performance for a specific dataset. The hyperparameter optimisation process can be accomplished by utilising methods such as lattice search and random search. The main idea of the SHAP method is to transform the prediction problem into a cooperative game problem [28,29]. The contribution of each feature is then measured by its Shapley value, which reflects the contribution of the feature to the prediction result. The SHAP method has excellent interpretability and fairness, which helps to improve the credibility of machine learning models.
3. Results and Discussion
3.1. Dataset and Feature Engineering
Powder metallurgy typically involves two steps: powder mixing and sintering. This remains the primary method for producing graphene aluminium matrix alloys, with the majority of the related literature focusing on composites obtained using this approach. Therefore, we have selected this method as the focus of our study. Ball milling during powder metallurgy enhances graphene agglomeration and wetting in aluminium, improving interfacial bonding. The properties of the final graphene aluminium matrix composites are significantly impacted by the ball milling process. To simplify the model and allow for comparison of the dataset, our study focuses on the graphene-reinforced aluminium alloy composites produced through ball milling and powder metallurgy preparation.
Correlation analysis was utilised to evaluate the association between diverse characteristics and between features and targets. The individual features in the dataset of this article are not normally distributed, and some of the data have been coded for category features, of which the correspondence of category codes for the ball mill environment is listed in Supplementary Table S1. Therefore, Spearman’s correlation coefficient was employed to address the nonlinearity issue in this study. The Spearman’s rank correlation coefficient possesses a value ranging between −1 and 1, whereby positive values point to a positive correlation and negative ones highlight a negative correlation. Moreover, the stronger the relationship, the closer the value is to positive one or negative one. The Spearman’s rank correlation coefficient remains unaffected by the scale or distribution of variables. This metric can be utilised for the analysis of X and Y, regardless of whether they are continuous, discrete, proportional, or non-proportional. The correlation analysis was conducted to explore the link between the variables and identify the optimal approach to integrate all factors for an effective and dependable model. The Spearman’s correlation coefficient between two sets of data can be calculated via the following formula:
where di denotes the difference in order and n denotes the number of data.
To visualise the correlation strength among various variables and extract underlying relationships in the data, heat maps depicting correlation coefficients were prepared. As shown in Figure 2, the correlation analysis shows that Mg, Zn, and Cu have strong positive correlations with both tensile strength and hardness, and these elemental features that are highly correlated with the output variables may be of more predictive value in the model. The absolute values of the correlation coefficients between Si and Fe and hardness, and between ball milling time and ball ratio and tensile strength are all less than 0.1, and in order to make the model as simple as possible and thus to avoid overfitting, we have considered removing the low correlation features among them. At the same time, the correlation data excluded the possibility of multicollinearity. Combined with the physical constraints, we finally determined the input feature descriptors for hardness and tensile strength: hardness descriptors are Al, Cu, Mg, Mn, Zn, Cr, graphene content, temperature, speed, ball-to-powder weight ratio and milling atmospheres. The tensile strength descriptors are Al, Cu, Mg, Mn, Zn, Cr, Si, Fe, graphene content, temperature, speed and milling atmospheres.
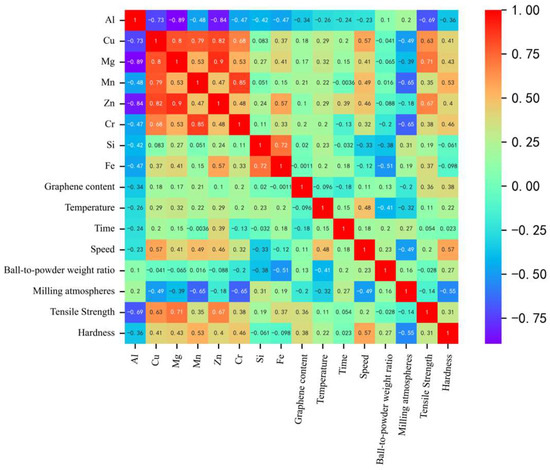
Figure 2.
Heat map for correlation analysis.
3.2. Machine Learning Model Building and Optimisation
For the issue of the small data sample, we have employed tree algorithms to model the data with minimal hyperparameters to prevent the risk of overfitting. To this end, we have utilised Catboost, a less parameterised gradient-boosting framework that adopts a symmetric decision tree structure, resulting in a simpler design. In addition, the Catboost algorithm presents innovative solutions for mitigating gradient bias and prediction shift, making it capable of extracting maximum information from data and tackling small-scale machine learning problems more effectively. This is specifically in contrast to the Greedy Target-based Statistics (Greedy TS) method, which uses the label mean as the node splitting criterion. The Catboost algorithm reduces the effect of noise and low-frequency data on the data distribution by adding a priori distribution terms, and the split node is calculated as
where p is the added prior term and a is the weighting factor.
Component descriptors and process descriptors were used as inputs in the model, with tensile strength and hardness as respective outputs. Various algorithms, such as CatBoost, Gradient Boosting Regressor, Extra Trees, Random Forest, Decision Tree, and Extreme Gradient Boosting, were employed to construct composition–process–performance machine learning models. Technical term abbreviations were explained upon first use. A 5-fold cross-validation method was utilised to obtain the average scores for the final result. In order to evaluate the performance of the different models, we introduced the root mean square error (RMSE), the mean absolute error (MAE), the mean relative percentage error (MAPE) and the coefficient of determination (R2) as evaluation criteria [30,31]. Their formulas are given in the supporting material. MSE represents the mean squared difference between the predicted and actual values. The model’s predictive accuracy improves as the MSE value becomes smaller. MAPE is the mean of the absolute percentage difference between the predicted and actual values. The model’s predictive accuracy increases with a decrease in the MAPE value. Higher R2 values indicate a better fit of the model to the data. It is worth noting that MSE magnifies the effect of the error by squaring it. MAPE is the mean of the absolute percentage difference between the predicted and actual values. MAPE is the mean of the absolute percentage difference between the predicted and actual values. R2 measures the model’s ability to fit the data, ranging from 0 to 1.
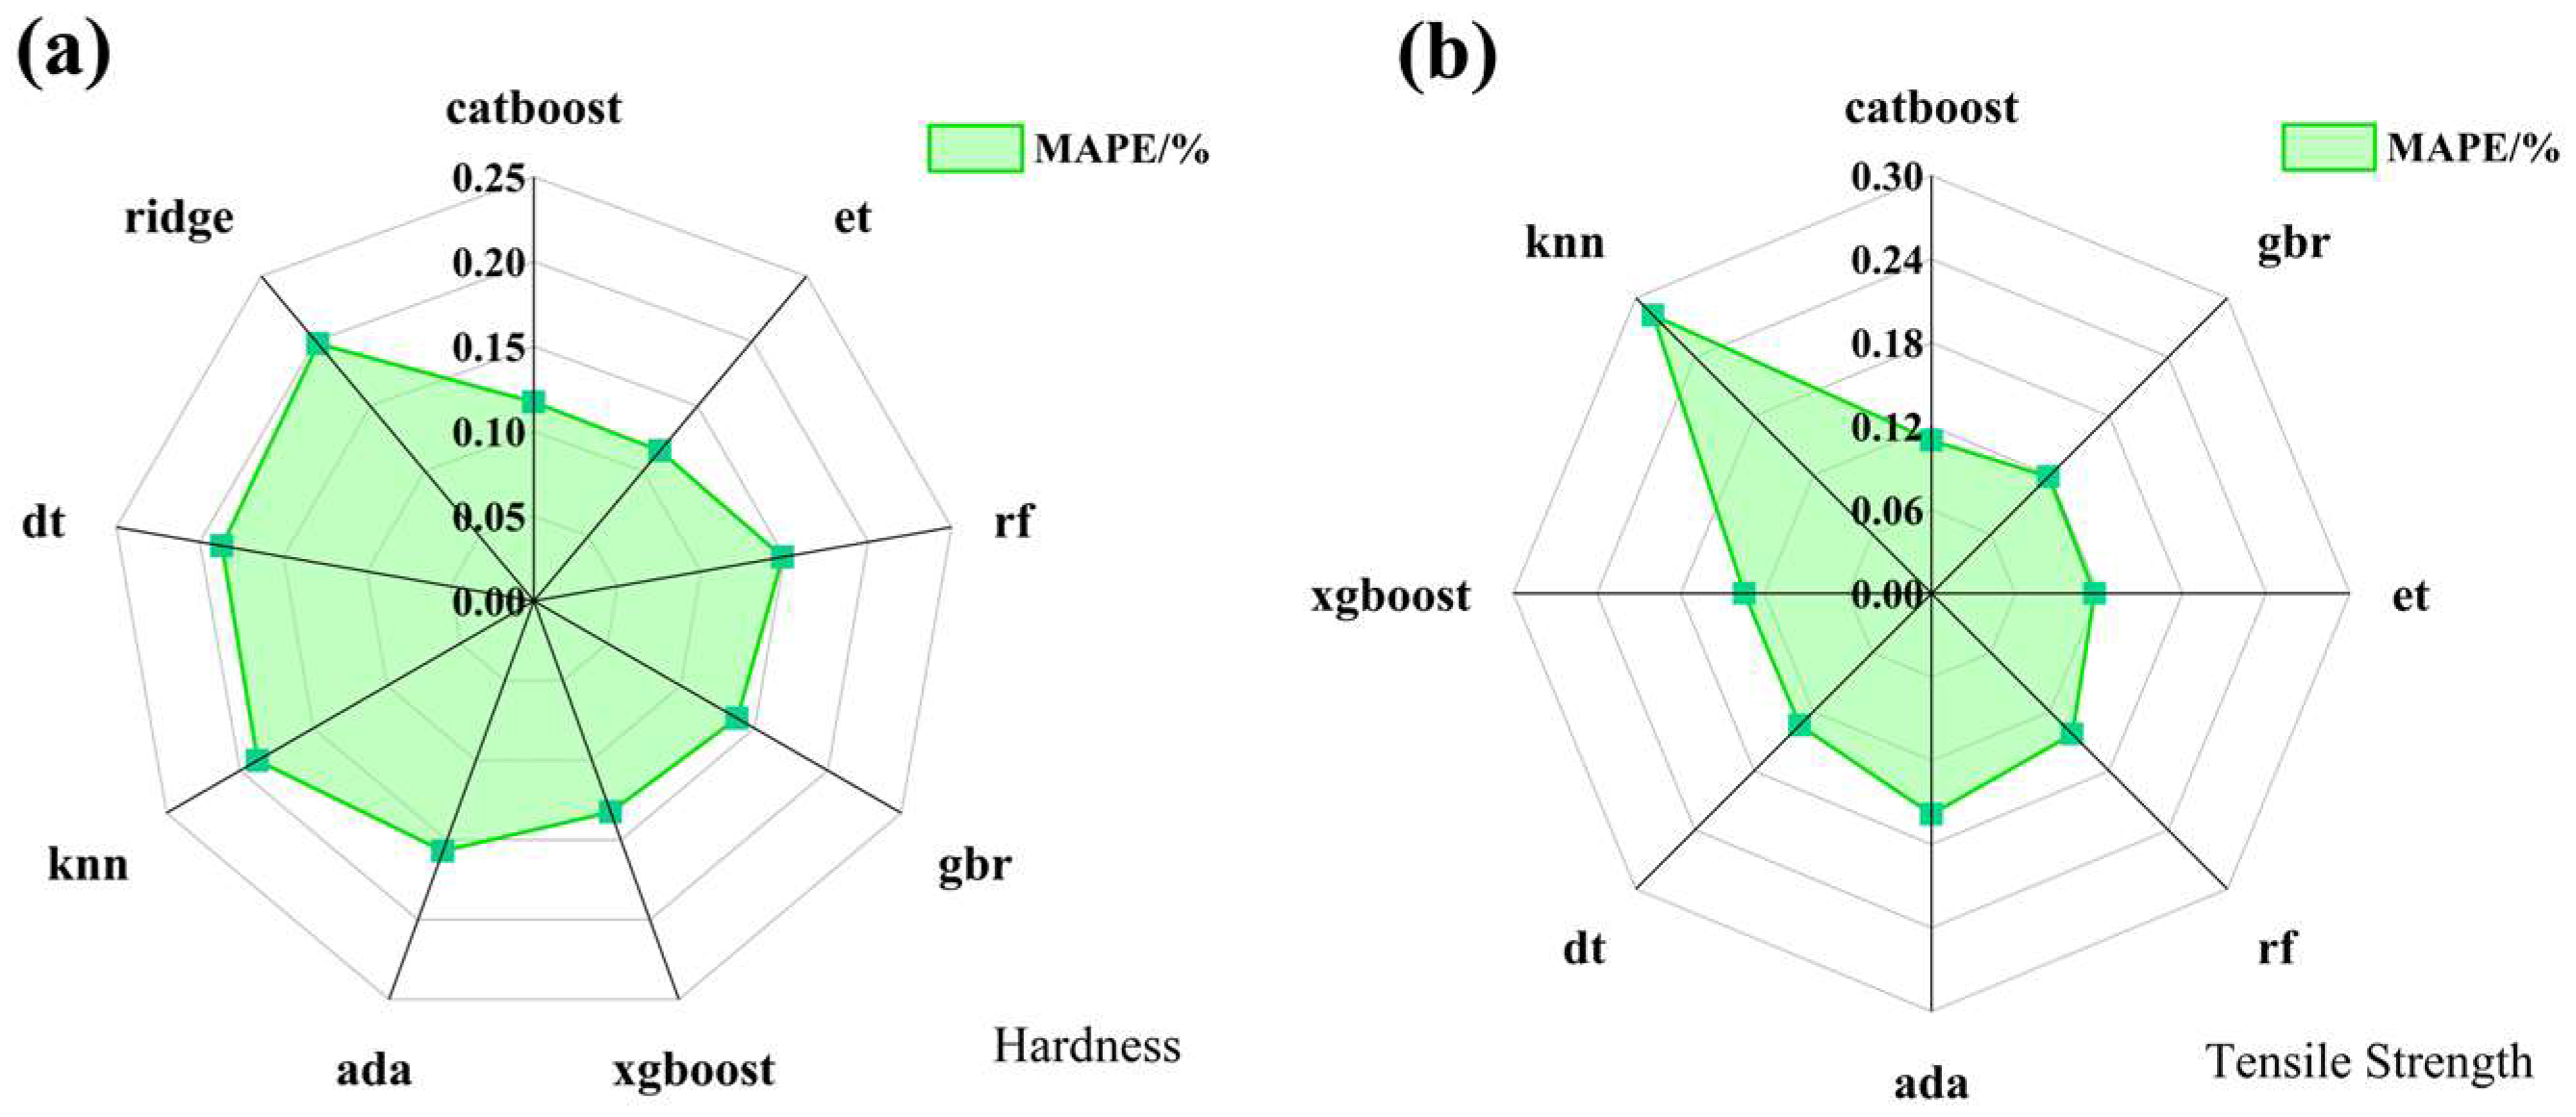
As shown in Figure 3, the Catboost algorithm outperforms the other algorithms in terms of prediction accuracy for both hardness and tensile strength in the case of 5-fold cross-validation, with an average relative error of 11.73% and 10.99%, which is a significant advantage. Other algorithms did not demonstrate the same level of accuracy. The ridge regression method exhibited subpar performance, possibly owing to the algorithm being a modified least squares estimation technique and the intricate and non-linear nature of the component-process-property relationship investigated in this study. Consequently, the accuracy of this linear approach was lower.

Figure 3.
Comparison of average relative errors of machine learning models with different algorithms. (a) Hardness; (b) Tensile strength.
The cross-validation results of all the algorithms are given in Table 1 and Table 2, and additional detailed data on the cross-validation of all the algorithms are given in Supplementary Tables S2 and S3 of the Supporting Materials. It is evident that all tree-based algorithms perform effectively on the dataset for aluminium matrix composites reinforced with graphene. When modelling the link between composition and process descriptors and tensile strength, the CatBoost algorithm achieved an 0.8992 coefficient of determination, indicating that the model is capable of explaining 89.92% of the data variation. The MAE and RMSE values of the model were quite low and it also had the smallest MAPE value. In contrast, the relationship between composition and process descriptors and hardness was modelled using the CatBoost algorithm, which achieved a coefficient of determination of 0.8599, demonstrating its excellent predictive ability for hardness. Additionally, the algorithm exhibited relatively low values of MAE and RMSE. Therefore, we selected the Catboost algorithm as the model for the subsequent machine learning stage based on the aforementioned analyses.

Table 1.
Comparison of cross-validation effects of composition–process–tensile strength models with different algorithms.
Table 2.
Comparison of cross-validation effects of composition–process–hardness models with different algorithms.
Hyperparameter optimisation enhances the model’s performance by adjusting its hyperparameters. In this study, we applied a grid search strategy to fine-tune the predefined parameters, resulting in the model achieving improved performance on a specific dataset, while avoiding overfitting and underfitting. We further optimised the parameters of the Catboost algorithm by adjusting the coefficients of the regularisation term to mitigate the risk of overfitting. After optimising as described above, we produced the ultimate machine learning model for the hardness and tensile strength of composites consisting of an aluminium matrix reinforced by graphene. The ultimate model proved to be proficient in both hardness and tensile strength prognostication, with coefficients of determination of 0.9597 and 0.9882, and MAPE of 6.02% and 5.01%, respectively. The produced models were employed in further tests to assess their accuracy and capacity for generalisation.
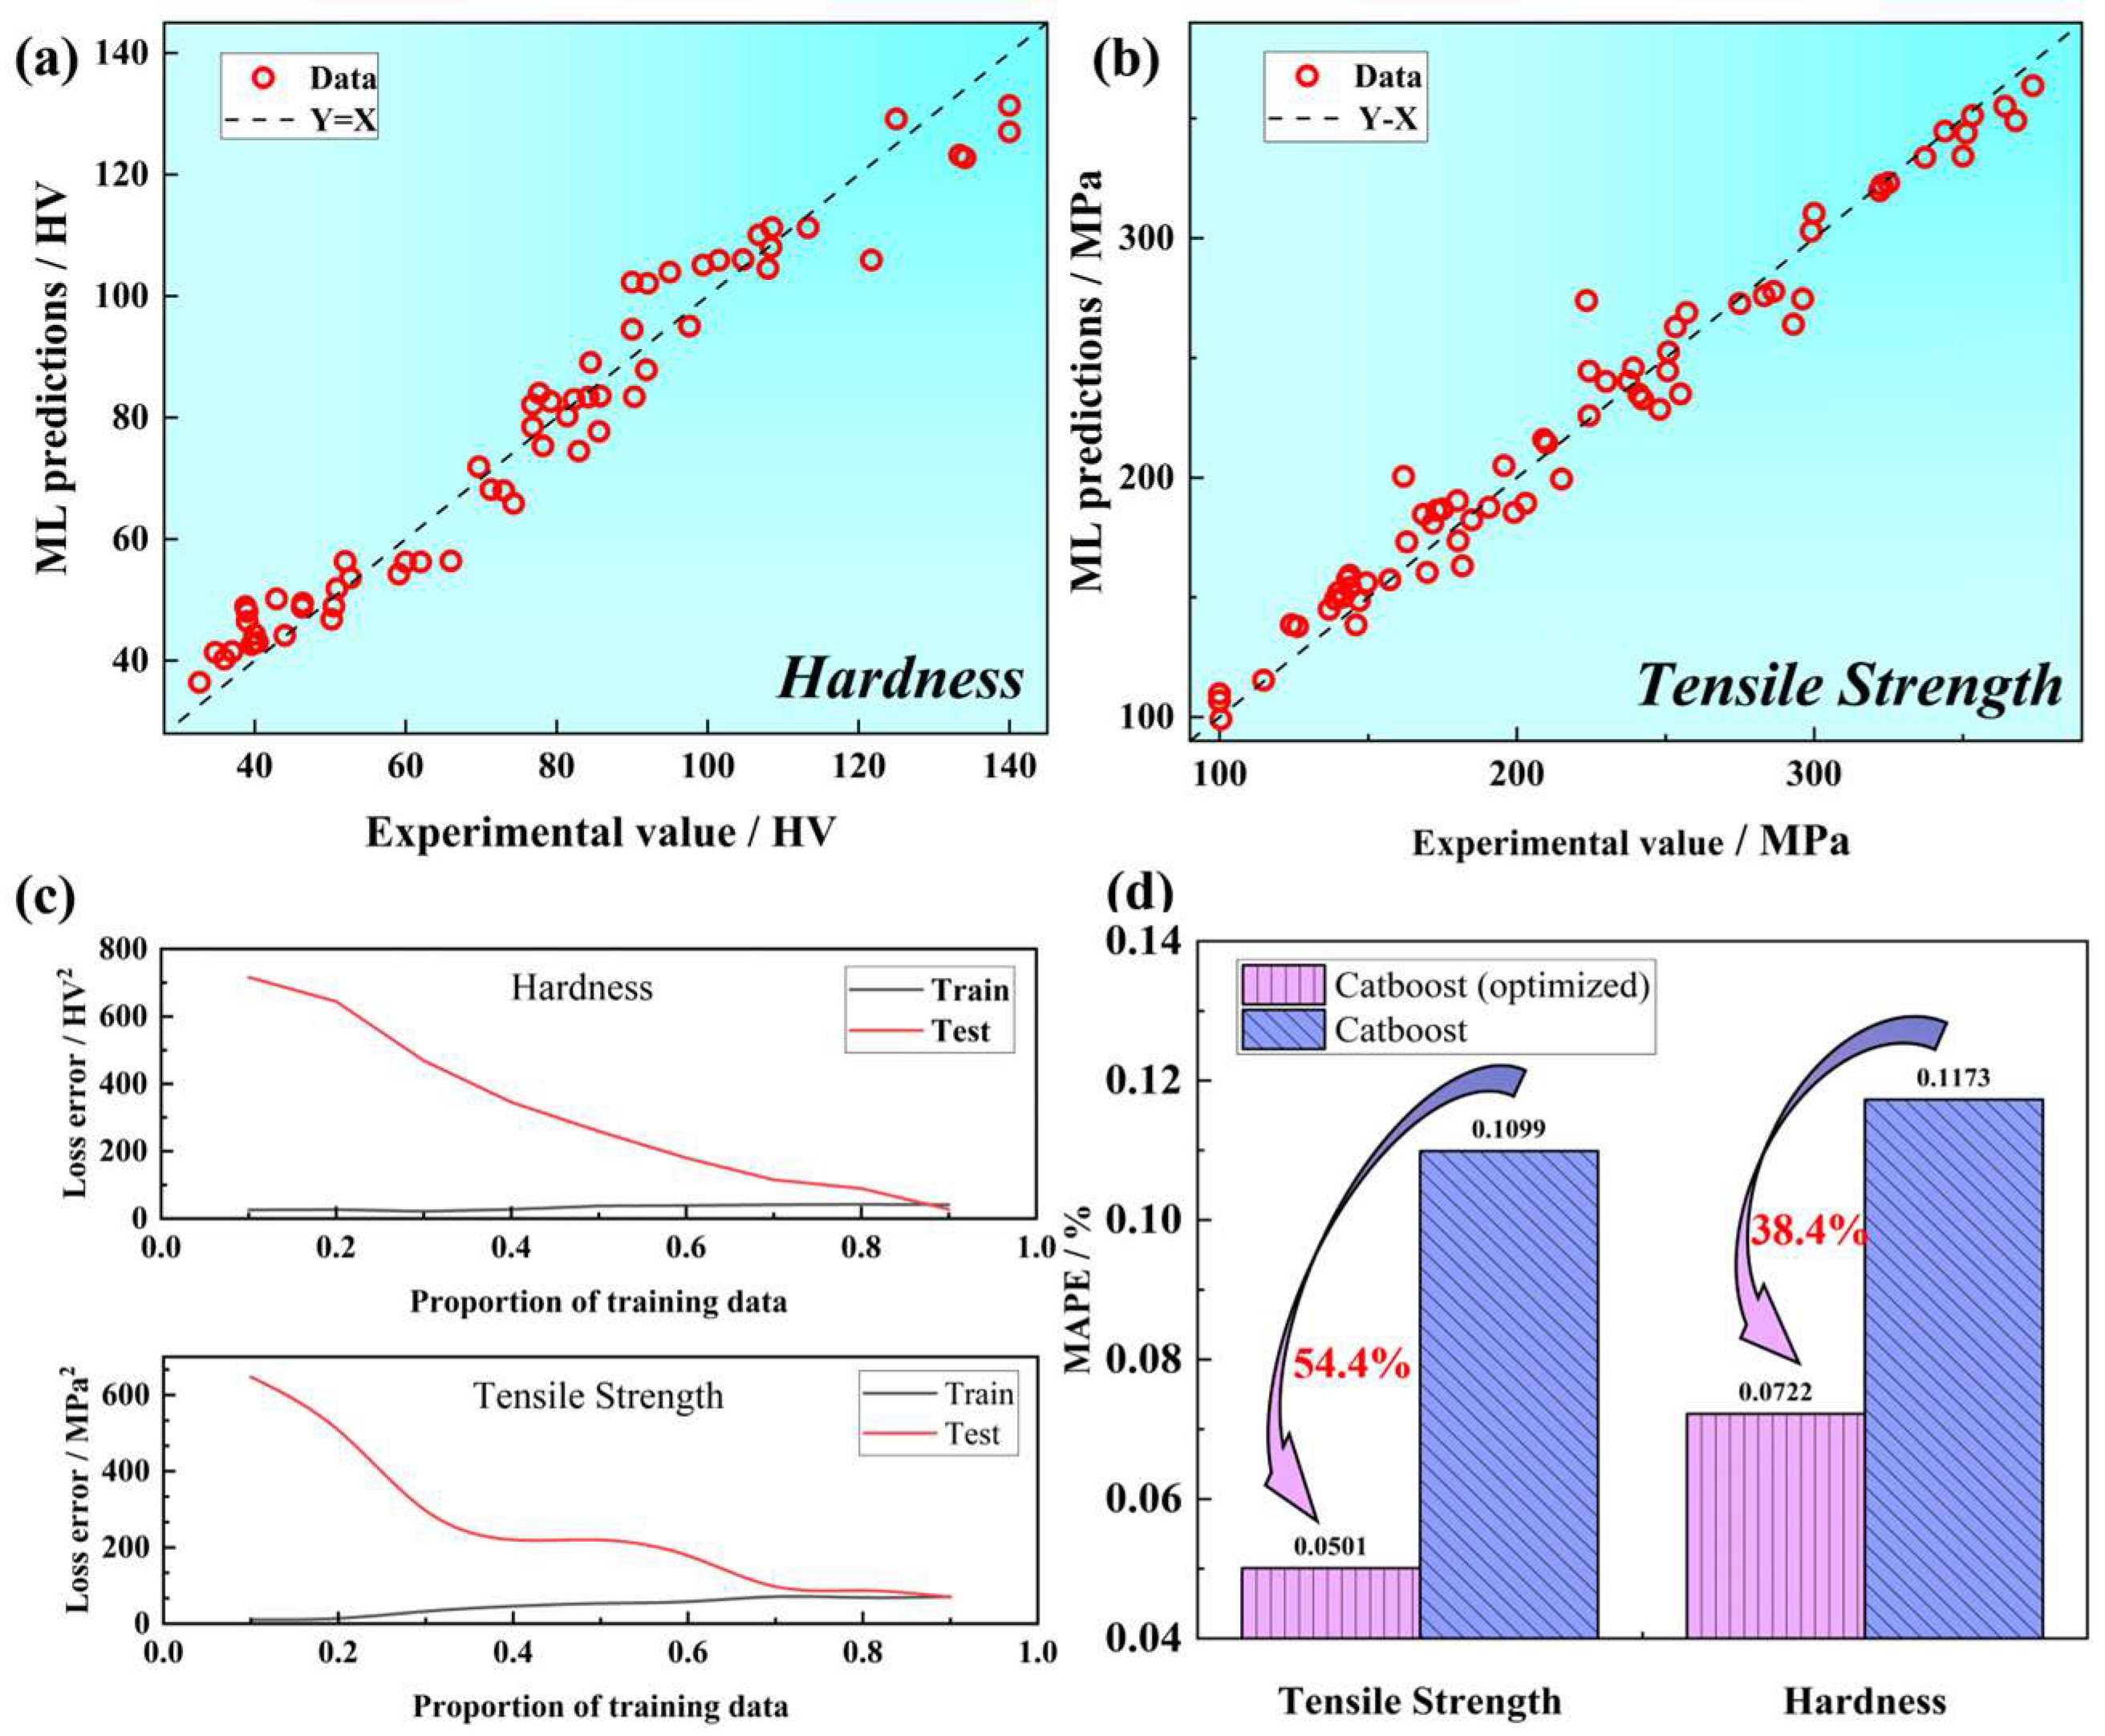
As shown in Figure 4, The regression plot illustrates the correlation between the anticipated and actual values of the two ultimate models. The regression plot illustrates the correlation between the anticipated and actual values of the two ultimate models. By using the regression plot, we can examine the efficiency of the models in making predictions. The learning curve is an instrument utilised for evaluating the convergence rate and performance of a machine learning model. It demonstrates the trend of the model’s loss on both the training and validation sets, as the size of the training data increases throughout the training process. This enables us to determine if the model suffers from overfitting or underfitting issues. The regression analysis indicates a significant correlation between the machine learning predictions of the two models and the experimental values. Additionally, the data points are uniformly distributed on both sides of Y = X, demonstrating that the models constructed fit the data accurately. The hyperparameter optimisation resulted in an over 30% reduction in MAPE for both models. The learning curves demonstrate a gradual increase in the models’ generalisability as the training set size increases. At a 90% training set size, both models achieved unity in generalisability and training accuracy.
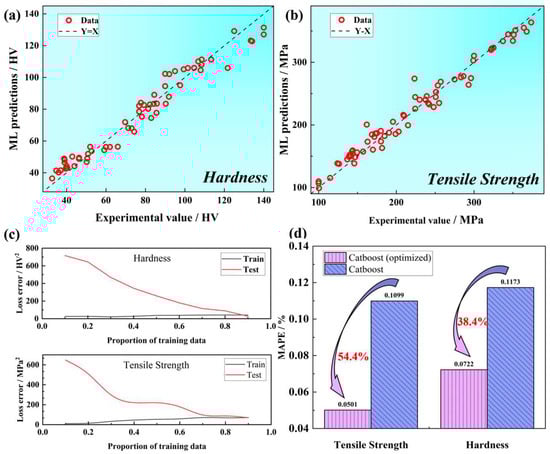
Figure 4.
Regression curves for (a) hardness and (b) tensile strength, (c) learning curves, (d) performance comparison before and after hyperparametric optimisation of Catboost model.
3.3. Interpretable Machine Learning and Validation
The ML model is also known as a “black box”, which means that the inner workings of the system are not visible, and the user can simply input data and receive the output, but cannot examine the logic that produces the result. Therefore, explaining machine learning as a black box model is essential for the development of new materials. To this end, the SHAP method was used to perform an interpretative analysis of the two optimal models to reveal the impact of each feature on the predicted target values.
The core idea of the SHAP method is based on the Shapley value in game theory and aims to assess the average size of the contribution of each feature to the model predictions. Unlike other model interpretation techniques, SHAP assigns a value to each feature that represents the feature’s impact on the predicted output by considering all possible combinations of feature values. A positive value indicates that the feature increases the predicted value of the model, while a negative value indicates a decrease. In this study, we used the SHAP method to dig deeper into the relationship between the composition, process, and properties of graphene-reinforced aluminium alloy composites with the aim of providing an intuitive and well understood in-depth model interpretation perspective.
In the SHAP summary plot, each line represents a feature with a red colour indicating a larger value and a blue colour indicating a smaller value. A point on the plot represents a sample. Technical term abbreviations are explained when first used. The average SHAP value of the feature across all instances is shown on the horizontal coordinate. The distribution of the feature’s Shapley value is shown on the y-axis with jitter to signify overlapping points. The SHAP function importance diagram displays the relative importance of every feature on the forecast outcomes. The feature importance ranking was achieved by taking the mean absolute SHAP value of a feature, with the column height increasing with higher importance.
As shown in Figure 5, it can be concluded that the contents of Mg, Cu elements, and graphene are basically positively correlated with the tensile strength; the contents of Al and Si elements show a negative correlation with the tensile strength; the content of Fe elements also significantly affects the tensile strength and shows a complex non-linear relationship, where a smaller amount of Fe elements reduces the valuation of tensile strength, but too much of the content also reduces the valuation until it exceeds a certain threshold value. Meanwhile, the graphene addition of Zn and Mg elements has the greatest effect on the tensile strength. In the prediction model of hardness, Al, Mg, and ball ratio have the greatest influence on the results, and the content of Al has a negative effect on the enhancement of hardness, while the ball ratio and Mg element, graphene content has a positive effect on the enhancement of hardness. In addition, the importance of different feature quantities varies greatly in both models, which suggests that more research should be aimed towards investigating the important elements and process parameters during the development of new graphene-reinforced aluminium matrix composites.
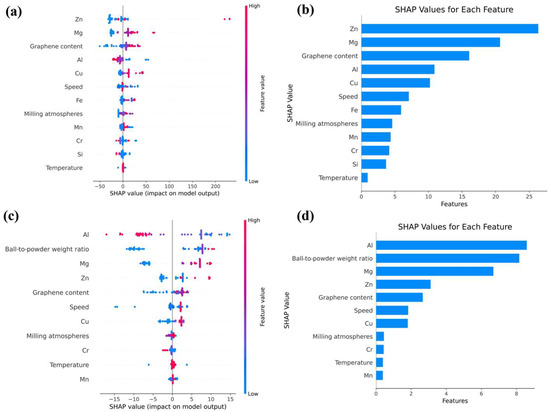
Figure 5.
SHAP summary plot and feature importance maps for (a,b) tensile strength and (c,d) hardness machine learning models.
In order to verify the accuracy and reliability of the machine learning model developed in this article, we compared the machine learning prediction results with some random experimental data in the dataset with the prediction results, as shown in Supplementary Figures S1 and S2. In addition, in order to judge the generalisation ability of the model, we compare the machine learning prediction results with the experimental results outside the dataset [32,33,34,35], as shown in Figure 6. From the above three figures, it can be seen that the machine learning prediction results have small differences with all the similar data, and the MAPE are all within 10%, regardless of whether these data are included in the dataset or not. This proves that the machine learning model established in this article can effectively achieve the prediction of mechanical properties of graphene-reinforced aluminium matrix composites.
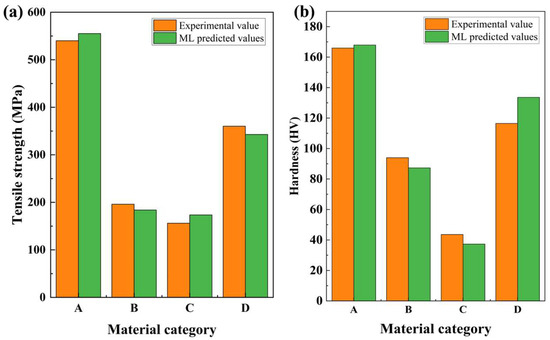
Figure 6.
Comparison of predicted values of (a) tensile strength and (b) hardness with experimental data.
The models created in this study, specifically CatBoost, display outstanding predictive prowess. The values of the coefficient of determination and mean relative error indicate the model’s accurate predictions concerning firmness and tensile strength. Implementation of the SHAP method results in a deep comprehension of the model’s working mechanism, exposing the correlation between material composition, processing, and properties. By utilising a machine learning approach, it was possible to swiftly predict the characteristics of composites consisting of graphene-reinforced aluminium alloy, thus reducing the necessity for conventional experiments. This model was able to maintain an error rate of less than 10%, highlighting its efficient adaptability to assorted data sources and categories. Nonetheless, it is important to acknowledge that the effectiveness of machine learning models relies heavily upon the quality and quantity of data available. If the training data are biased or insufficient, the model’s predictive capability may be compromised. The model’s scope is restricted to the specific data types collected in this article, which may limit its predictive power for composites that possess dissimilar material properties, compositions, or processing techniques to that of the dataset. Furthermore, environmental parameters as well as processing equipment variations that exert an impact on the traits of graphene-strengthened aluminium alloy composites are not accounted for by the model. As new materials become available and technology evolves, it is necessary to update the model in order to ensure its predictive accuracy.
4. Conclusions
The article illustrates the efficacy of machine learning models in accurately predicting the tensile strength and hardness of graphene-reinforced aluminium alloy composites. This is achieved through a meticulous analysis of data and machine learning modelling, ultimately benefitting the design of composites. Composition, process, and property data were collected for graphene-reinforced aluminium alloy composites to develop a prediction model for their composition, process, and properties. The SHAP method was used to interpret the optimal CatBoost model, which showed the effects of each compositional and process factor on the composites’ properties. The model’s generalisability was verified by comparing its results with experimental data. The study indicates that the coefficients of determination for the machine learning model predicting tensile strength and hardness are 0.9882 and 0.9597, respectively. Through comparison with experimental data, the prediction errors for both variables are 6.2% and 9.3%, correspondingly. These outcomes suggest that the method has practical application value, as well as reliability and usefulness. During the process described above, we performed comprehensive feature engineering, which involved correlation analysis and classification feature coding. To train the data effectively, we introduced advanced machine learning models, including xgboost and adaboost. Additionally, we adopted strategies such as cross-validation, hyper-parameter optimisation, and regularisation to achieve a balance between generalisability and accuracy in small-sample data. However, despite achieving satisfactory results from our model, there remains a need to construct more extensive datasets that incorporate additional material and process parameters. This will serve to bolster the generalisability and precision of the model. This study has presented a novel method for predicting and developing graphene-reinforced aluminium alloy composites that exhibit excellent properties. Key areas for further research and wider dataset requirements have been identified. The method’s implementation is expected to advance the field by improving mechanical properties of graphene-reinforced aluminium alloy composites, thereby meeting the increasing demand for the materials in a variety of industrial applications.
Supplementary Materials
The following supporting information can be downloaded at https://www.mdpi.com/article/10.3390/met13101690/s1, Table S1. Correspondence between category data and encoding in the dataset; Table S2. Detailed data on cross-validation of composition–process–hardness models for different algorithms; Table S3. Detailed data on cross-validation of composition-process-tensile strength models with different algorithms; Figure S1. Comparison of machine learning model predictions of tensile strength and hardness with experimental data from datasets; Figure S2. Comparison of machine learning model predictions for hardness with experimental data in the dataset.
Author Contributions
Conceptualization, J.X. and J.H.; software, J.X.; validation, J.H.; resources, Z.L.; data curation, Z.W. and J.C.; writing—original draft preparation, J.X.; writing—review and editing, J.X., J.H., Y.L., N.Q., M.L. and J.Z.; visualization, Y.C.; supervision, Y.L. and N.Q.; project administration, M.L. and J.Z. All authors have read and agreed to the published version of the manuscript.
Funding
This research was supported by the Science Foundation of National Key Laboratory of Science and Technology on Advanced Composites in Special Environments.
Data Availability Statement
The data supporting the findings of this study are available from the corresponding author upon reasonable request.
Conflicts of Interest
The authors declare no conflict of interest.
References
- Geim, A.K. Graphene: Status and prospects. Science 2009, 324, 1530–1534. [Google Scholar] [CrossRef]
- Soldano, C.; Mahmood, A.; Dujardin, E. Production, properties and potential of graphene. Carbon 2010, 48, 2127–2150. [Google Scholar] [CrossRef]
- Santos, M.C.; Machado, A.R.; Sales, W.F.; Barrozo, M.A.; Ezugwu, E.O. Machining of aluminum alloys: A review. Int. J. Adv. Manuf. Technol. 2016, 86, 3067–3080. [Google Scholar] [CrossRef]
- Starke, E.A., Jr.; Staley, J.T. Application of modern aluminum alloys to aircraft. Prog. Aerosp. Sci. 1996, 32, 131–172. [Google Scholar] [CrossRef]
- Miracle, D.B. Metal matrix composites–from science to technological significance. Compos. Sci. Technol. 2005, 65, 2526–2540. [Google Scholar] [CrossRef]
- Koria, C.S.; Kumar, R.; Chauhan, P.S. Reinforcement of micro and nano material with aluminum alloy (Al7075) metal matrix composite: A review. J. Phys. Conf. Ser. 2023, 2484, 012023. [Google Scholar] [CrossRef]
- Dixit, S.; Mahata, A.; Mahapatra, D.R.; Kailas, S.V.; Chattopadhyay, K. Multi-layer graphene reinforced aluminum–manufacturing of high strength composite by friction stir alloying. Compos. Part B Eng. 2018, 136, 63–71. [Google Scholar] [CrossRef]
- Palei, B.B.; Dash, T.; Biswal, S.K. Preparation of graphene reinforced aluminium composites: Investigation of microstructural, electrical conductivity and microhardness behaviour. Int. J. Mater. Prod. Technol. 2021, 62, 49–64. [Google Scholar] [CrossRef]
- Ju, J.M.; Wang, G.; Sim, K.H. Facile synthesis of graphene reinforced Al matrix composites with improved dispersion of graphene and enhanced mechanical properties. J. Alloy. Compd. 2017, 704, 585–592. [Google Scholar] [CrossRef]
- Rhee, H.; Whittington, W.R.; Oppedal, A.L.; Sherif, A.R.; King, R.L.; Kim, H.-J.; Lee, C. Mechanical properties of novel aluminum metal matrix metallic composites: Application to overhead conductors. Mater. Des. 2015, 88, 16–21. [Google Scholar] [CrossRef]
- Chen, F.; Gupta, N.; Behera, R.K.; Rohatgi, P.K. Graphene-reinforced aluminum matrix composites: A review of synthesis methods and properties. Jom 2018, 70, 837–845. [Google Scholar] [CrossRef]
- Mishra, T.K.; Kumar, P.; Jain, P. Effects of graphene content on the wear properties of aluminum matrix composites prepared by powder metallurgy route. Mater. Today Proc. 2023, in press. [Google Scholar] [CrossRef]
- Lazarova, R.; Mourdjeva, Y.; Nihtianova, D.; Stefanov, G.; Petkov, V. Fabrication and Characterization of Aluminum-Graphene Nano-Platelets—Nano-Sized Al4C3 Composite. Metals 2022, 12, 2057. [Google Scholar] [CrossRef]
- Isametova, M.E.; Nussipali, R.; Martyushev, N.V.; Martyushev, N.V.; Malozyomov, B.V.; Efremenkov, E.A. Mathematical Modeling of the Reliability of Polymer Composite Materials. Mathematics 2022, 10, 3978. [Google Scholar] [CrossRef]
- Suzdaltsev, A.; Rakhmanova, O. Special Issue on Metal-Based Composite Materials: Preparation, Structure, Properties and Applications. Appl. Sci. 2023, 13, 4799. [Google Scholar] [CrossRef]
- Zhao, Z.; Chang, S.; Wang, J.; Bai, P.; Du, W.; Zhao, W. First-Principles Study on Graphene/Mg2Si Interface of Selective Laser Melting Graphene/Aluminum Matrix Composites. Metals 2021, 11, 941. [Google Scholar] [CrossRef]
- Kordijazi, A.; Zhao, T.; Zhang, J.; Rohatgi, P. A review of application of machine learning in design, synthesis, and characterization of metal matrix composites: Current status and emerging applications. Jom 2021, 73, 2060–2074. [Google Scholar] [CrossRef]
- Hasan, M.S.; Wong, T.; Rohatgi, P.K.; Nosonovsky, M. Analysis of the friction and wear of graphene reinforced aluminum metal matrix composites using machine learning models. Tribol. Int. 2022, 170, 107527. [Google Scholar] [CrossRef]
- Juan, Y.; Dai, Y.; Yang, Y.; Zhang, J. Accelerating materials discovery using machine learning. J. Mater. Sci. Technol. 2021, 79, 178–190. [Google Scholar] [CrossRef]
- Chen, C.; Zuo, Y.; Ye, W.; Li, X.; Deng, Z.; Ong, S.P. A critical review of machine learning of energy materials. Adv. Energy Mater. 2020, 10, 1903242. [Google Scholar] [CrossRef]
- Zhang, T.; Gao, X.; Li, J.; Xiao, L.; Gao, H.; Zhao, F.; Ma, H. Progress on the application of graphene-based composites toward energetic materials: A review. Def. Technol. 2023, in press. [Google Scholar] [CrossRef]
- Chen, D.; Li, J.; Sun, K.; Fan, J. Graphene-reinforced metal matrix composites: Fabrication, properties, and challenges. Int. J. Adv. Manuf. Technol. 2023, 125, 2925–2965. [Google Scholar] [CrossRef]
- Ayub, S.; Guan, B.H.; Ahmad, F.; Javed, M.F.; Mosavi, A.; Felde, I. Preparation methods for graphene metal and polymer based composites for emi shielding materials: State of the art review of the conventional and machine learning methods. Metals 2021, 11, 1164. [Google Scholar] [CrossRef]
- Chaudry, U.M.; Hamad, K.; Abuhmed, T. Machine learning-aided design of aluminum alloys with high performance. Mater. Today Commun. 2021, 26, 101897. [Google Scholar] [CrossRef]
- Chan, C.H.; Sun, M.; Huang, B. Application of machine learning for advanced material prediction and design. EcoMat 2022, 4, e12194. [Google Scholar] [CrossRef]
- Cai, J.; Chu, X.; Xu, K.; Li, H.; Wei, J. Machine learning-driven new material discovery. Nanoscale Adv. 2020, 2, 3115–3130. [Google Scholar] [CrossRef]
- Morgan, D.; Jacobs, R. Opportunities and challenges for machine learning in materials science. Annu. Rev. Mater. Res. 2020, 50, 71–103. [Google Scholar] [CrossRef]
- Lundberg, S.M.; Lee, S.I. A unified approach to interpreting model predictions. arXiv 2017, arXiv:1705.07874. [Google Scholar]
- Lundberg, S.M.; Nair, B.; Vavilala, M.S.; Horibe, M.; Eisses, M.J.; Adams, T.; Liston, D.E.; Low, D.K.-W.; Newman, S.-F.; Kim, J.; et al. Explainable machine-learning predictions for the prevention of hypoxaemia during surgery. Nat. Biomed. Eng. 2018, 2, 749–760. [Google Scholar] [CrossRef]
- Tang, M.; Zhang, D.; Wang, D.; Deng, J.; Kong, D.; Zhang, H. Performance prediction of 2D vertically stacked MoS2-WS2 heterostructures base on first-principles theory and Pearson correlation coefficient. Appl. Surf. Sci. 2022, 596, 153498. [Google Scholar] [CrossRef]
- Chen, W.C.; Schmidt, J.N.; Yan, D.; Vohra, Y.K.; Chen, C.-C. Machine learning and evolutionary prediction of superhard BCN compounds. npj Comput. Mater. 2021, 7, 114. [Google Scholar] [CrossRef]
- Kwon, H.; Mondal, J.; AlOgab, K.A.; Sammelselg, V.; Takamichi, M.; Kawaski, A.; Leparoux, M. Graphene oxide-reinforced aluminum alloy matrix composite materials fabricated by powder metallurgy. J. Alloy. Compd. 2017, 698, 807–813. [Google Scholar] [CrossRef]
- Gamil, M.; Ahmed, M.M.Z. Investigating the thermo-mechanical properties of aluminum/graphene nano-platelets composites developed by friction stir processing. Int. J. Precis. Eng. Manuf. 2020, 21, 1539–1546. [Google Scholar] [CrossRef]
- Li, M.; Gao, H.; Liang, J.; Gu, S.; You, W.; Shu, D.; Wang, J.; Sun, B. Microstructure evolution and properties of graphene nanoplatelets reinforced aluminum matrix composites. Mater. Charact. 2018, 140, 172–178. [Google Scholar] [CrossRef]
- Han, T.; Li, J.; Zhao, N.; He, C. Microstructure and properties of copper coated graphene nanoplates reinforced Al matrix composites developed by low temperature ball milling. Carbon 2020, 159, 311–323. [Google Scholar] [CrossRef]


Disclaimer/Publisher’s Note: The statements, opinions and data contained in all publications are solely those of the individual author(s) and contributor(s) and not of MDPI and/or the editor(s). MDPI and/or the editor(s) disclaim responsibility for any injury to people or property resulting from any ideas, methods, instructions or products referred to in the content. |
© 2023 by the authors. Licensee MDPI, Basel, Switzerland. This article is an open access article distributed under the terms and conditions of the Creative Commons Attribution (CC BY) license (https://creativecommons.org/licenses/by/4.0/).