
Characterization and Prediction of Plane Strain Bendability in Advanced High-Strength Steels

Abstract
:1. Introduction
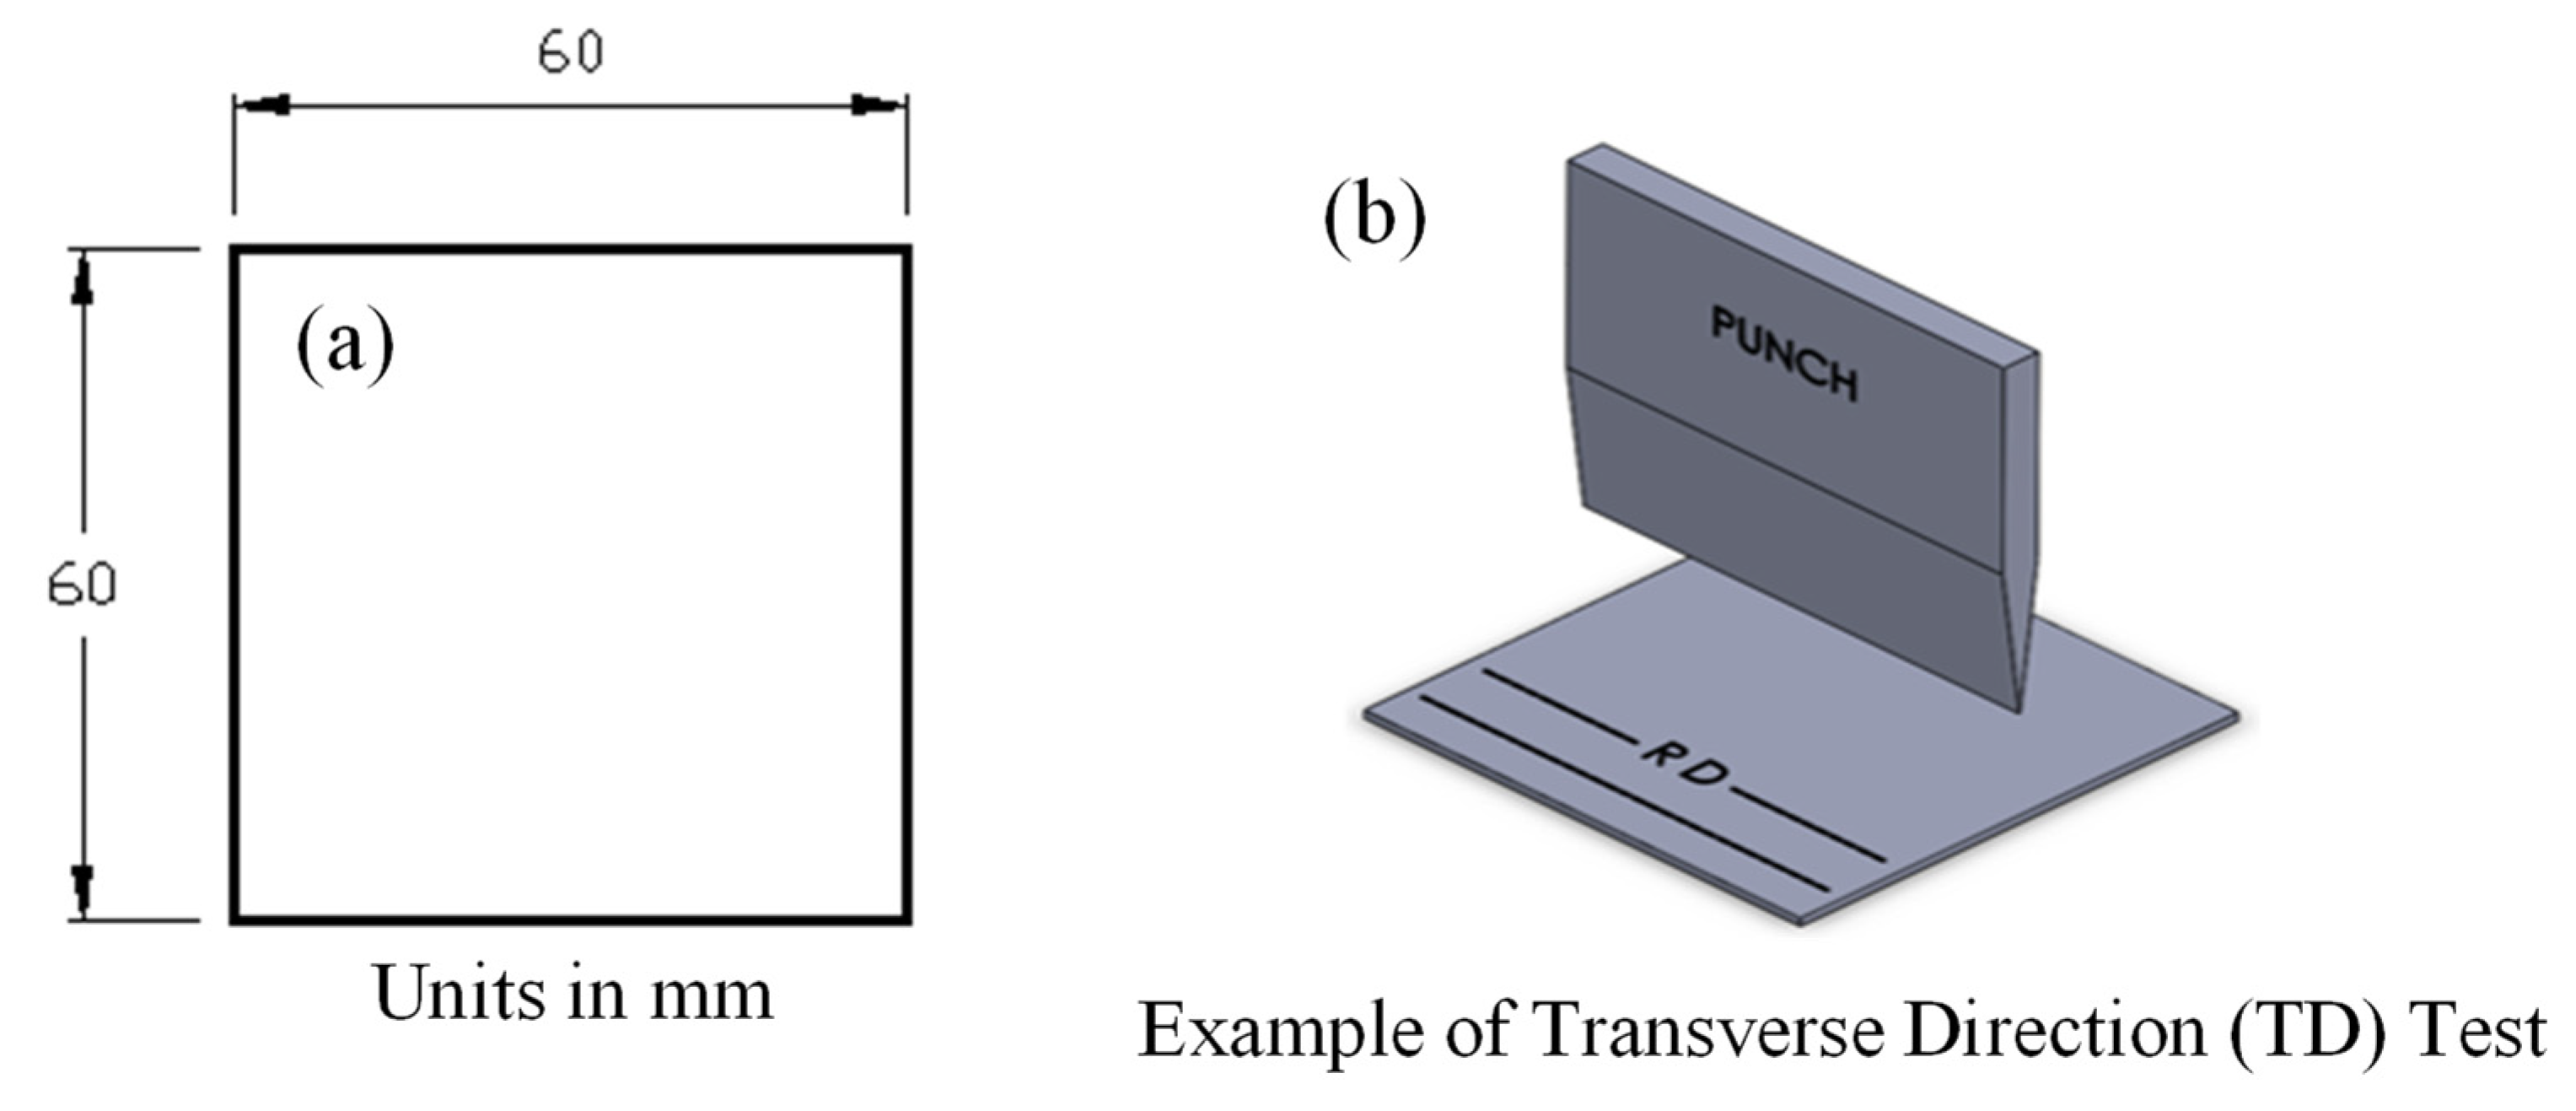
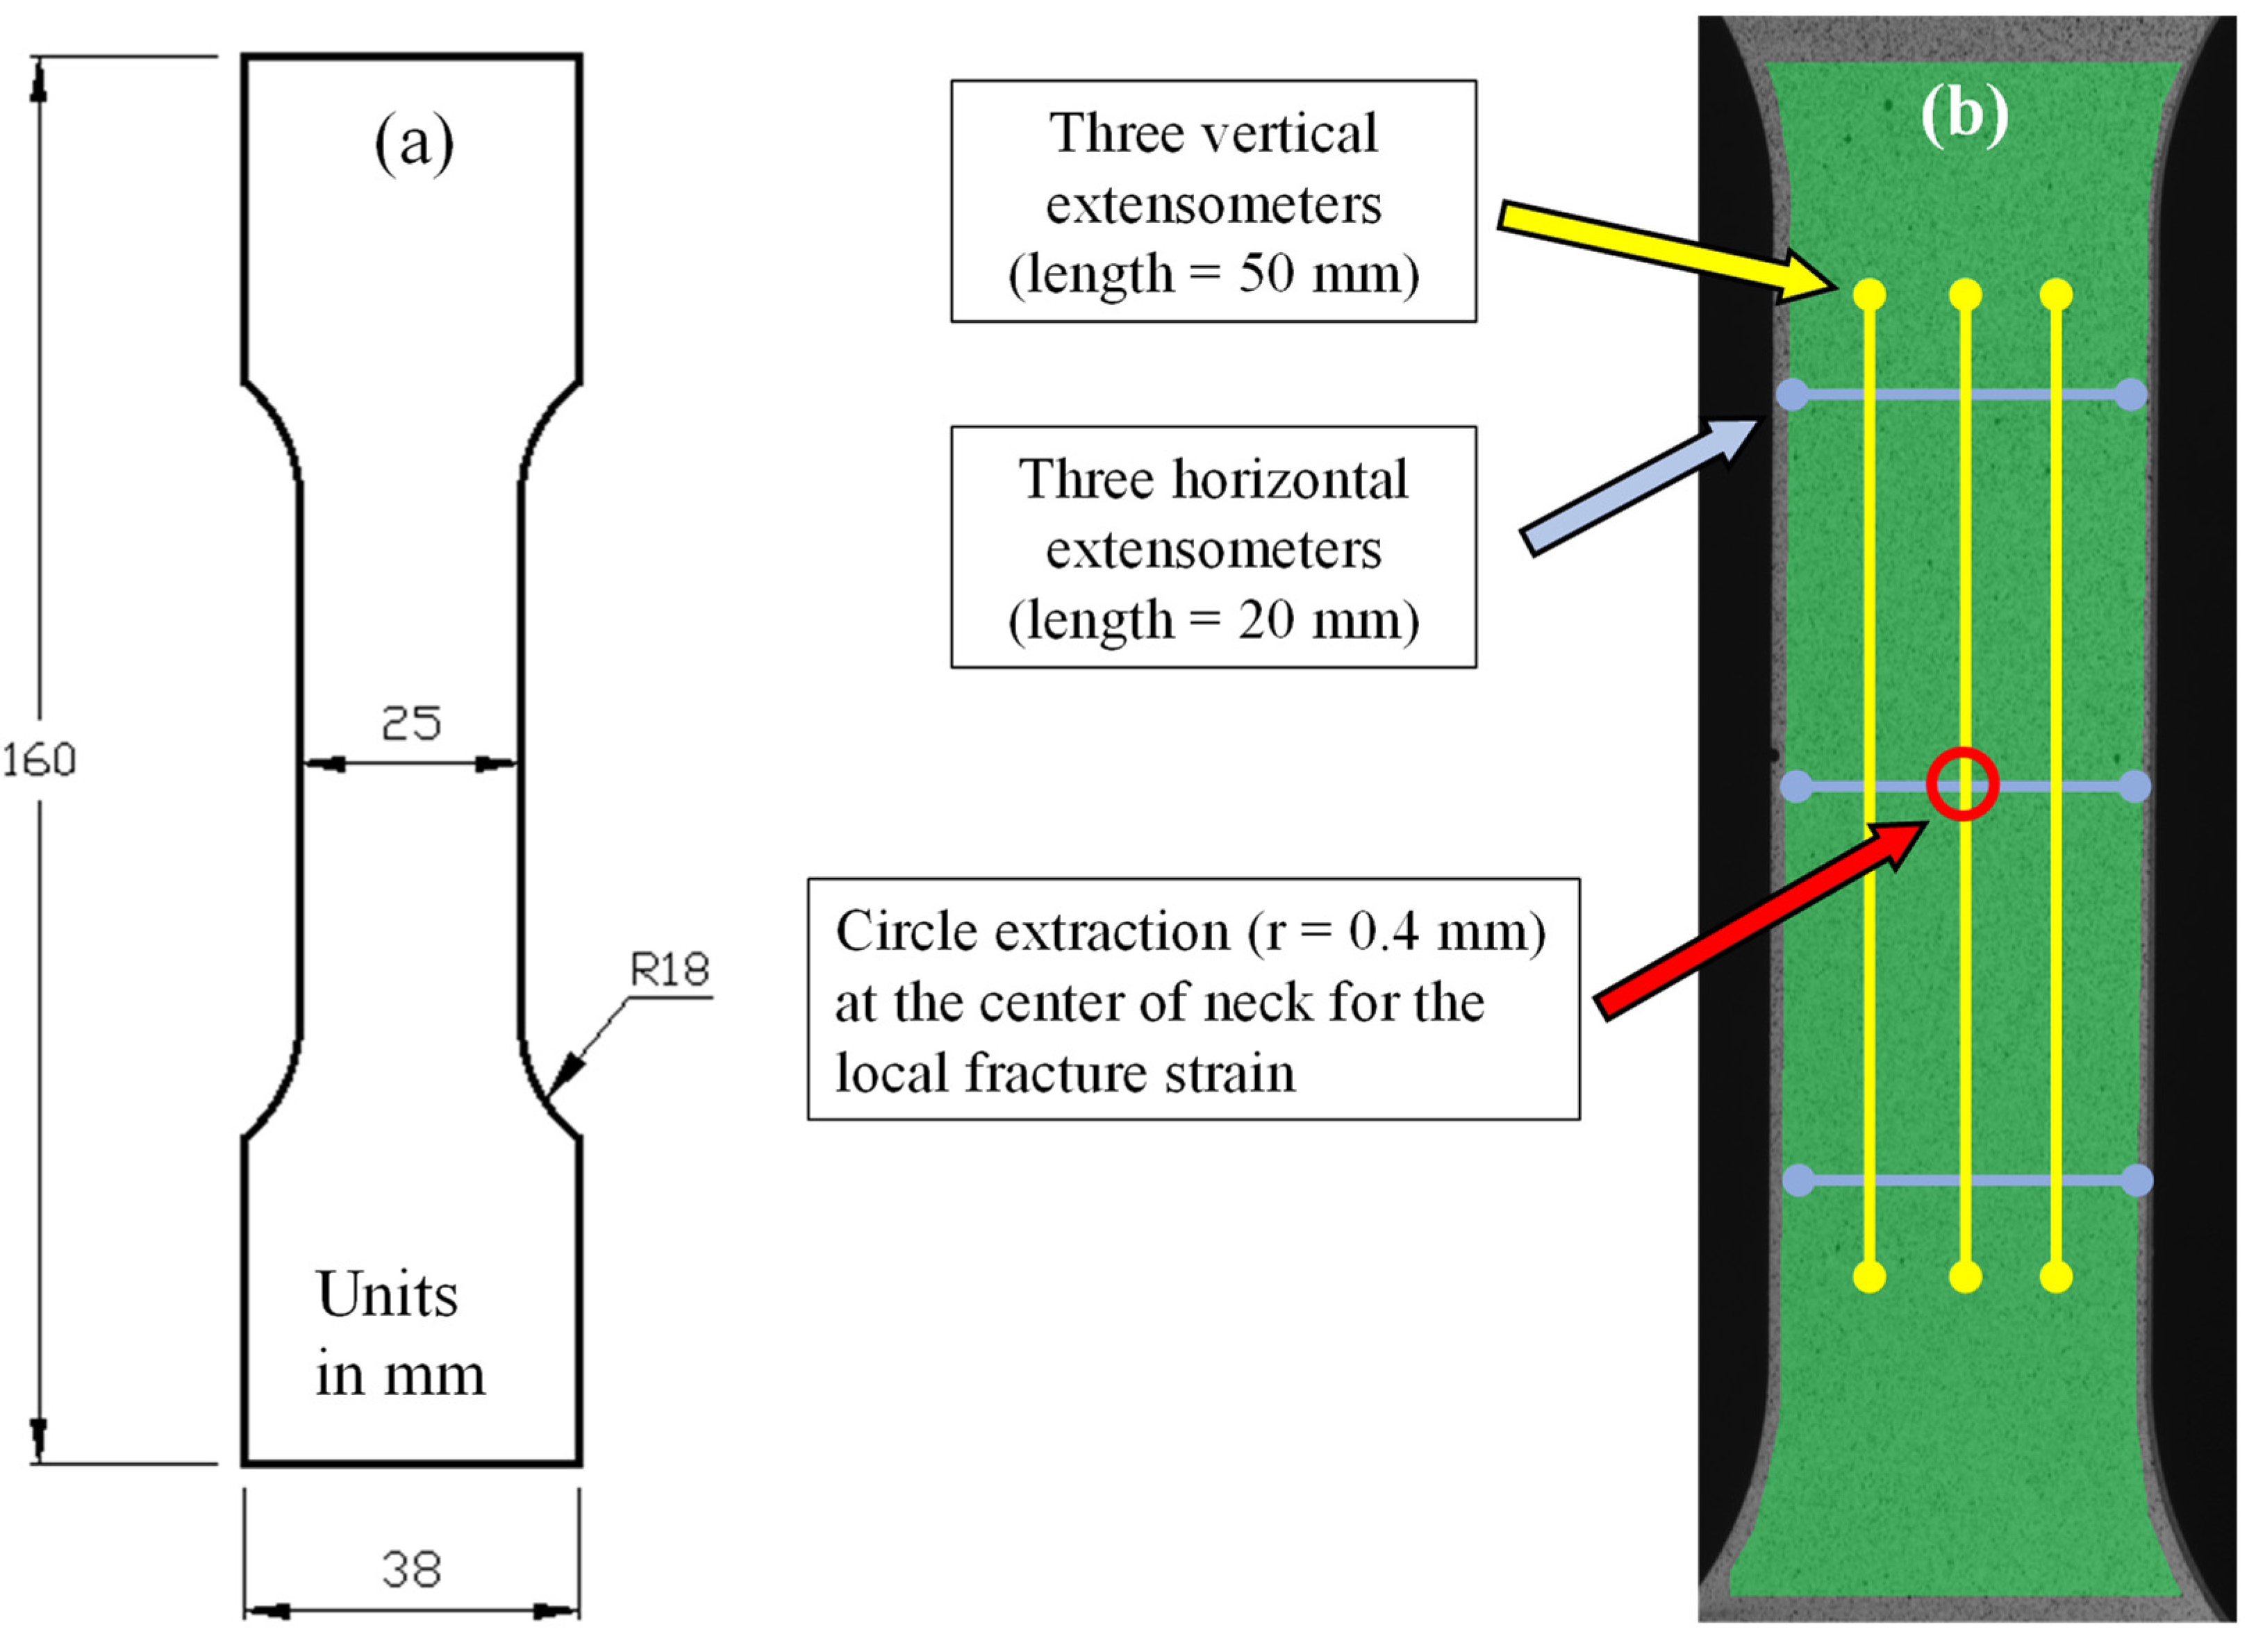
2. Experimental Setup
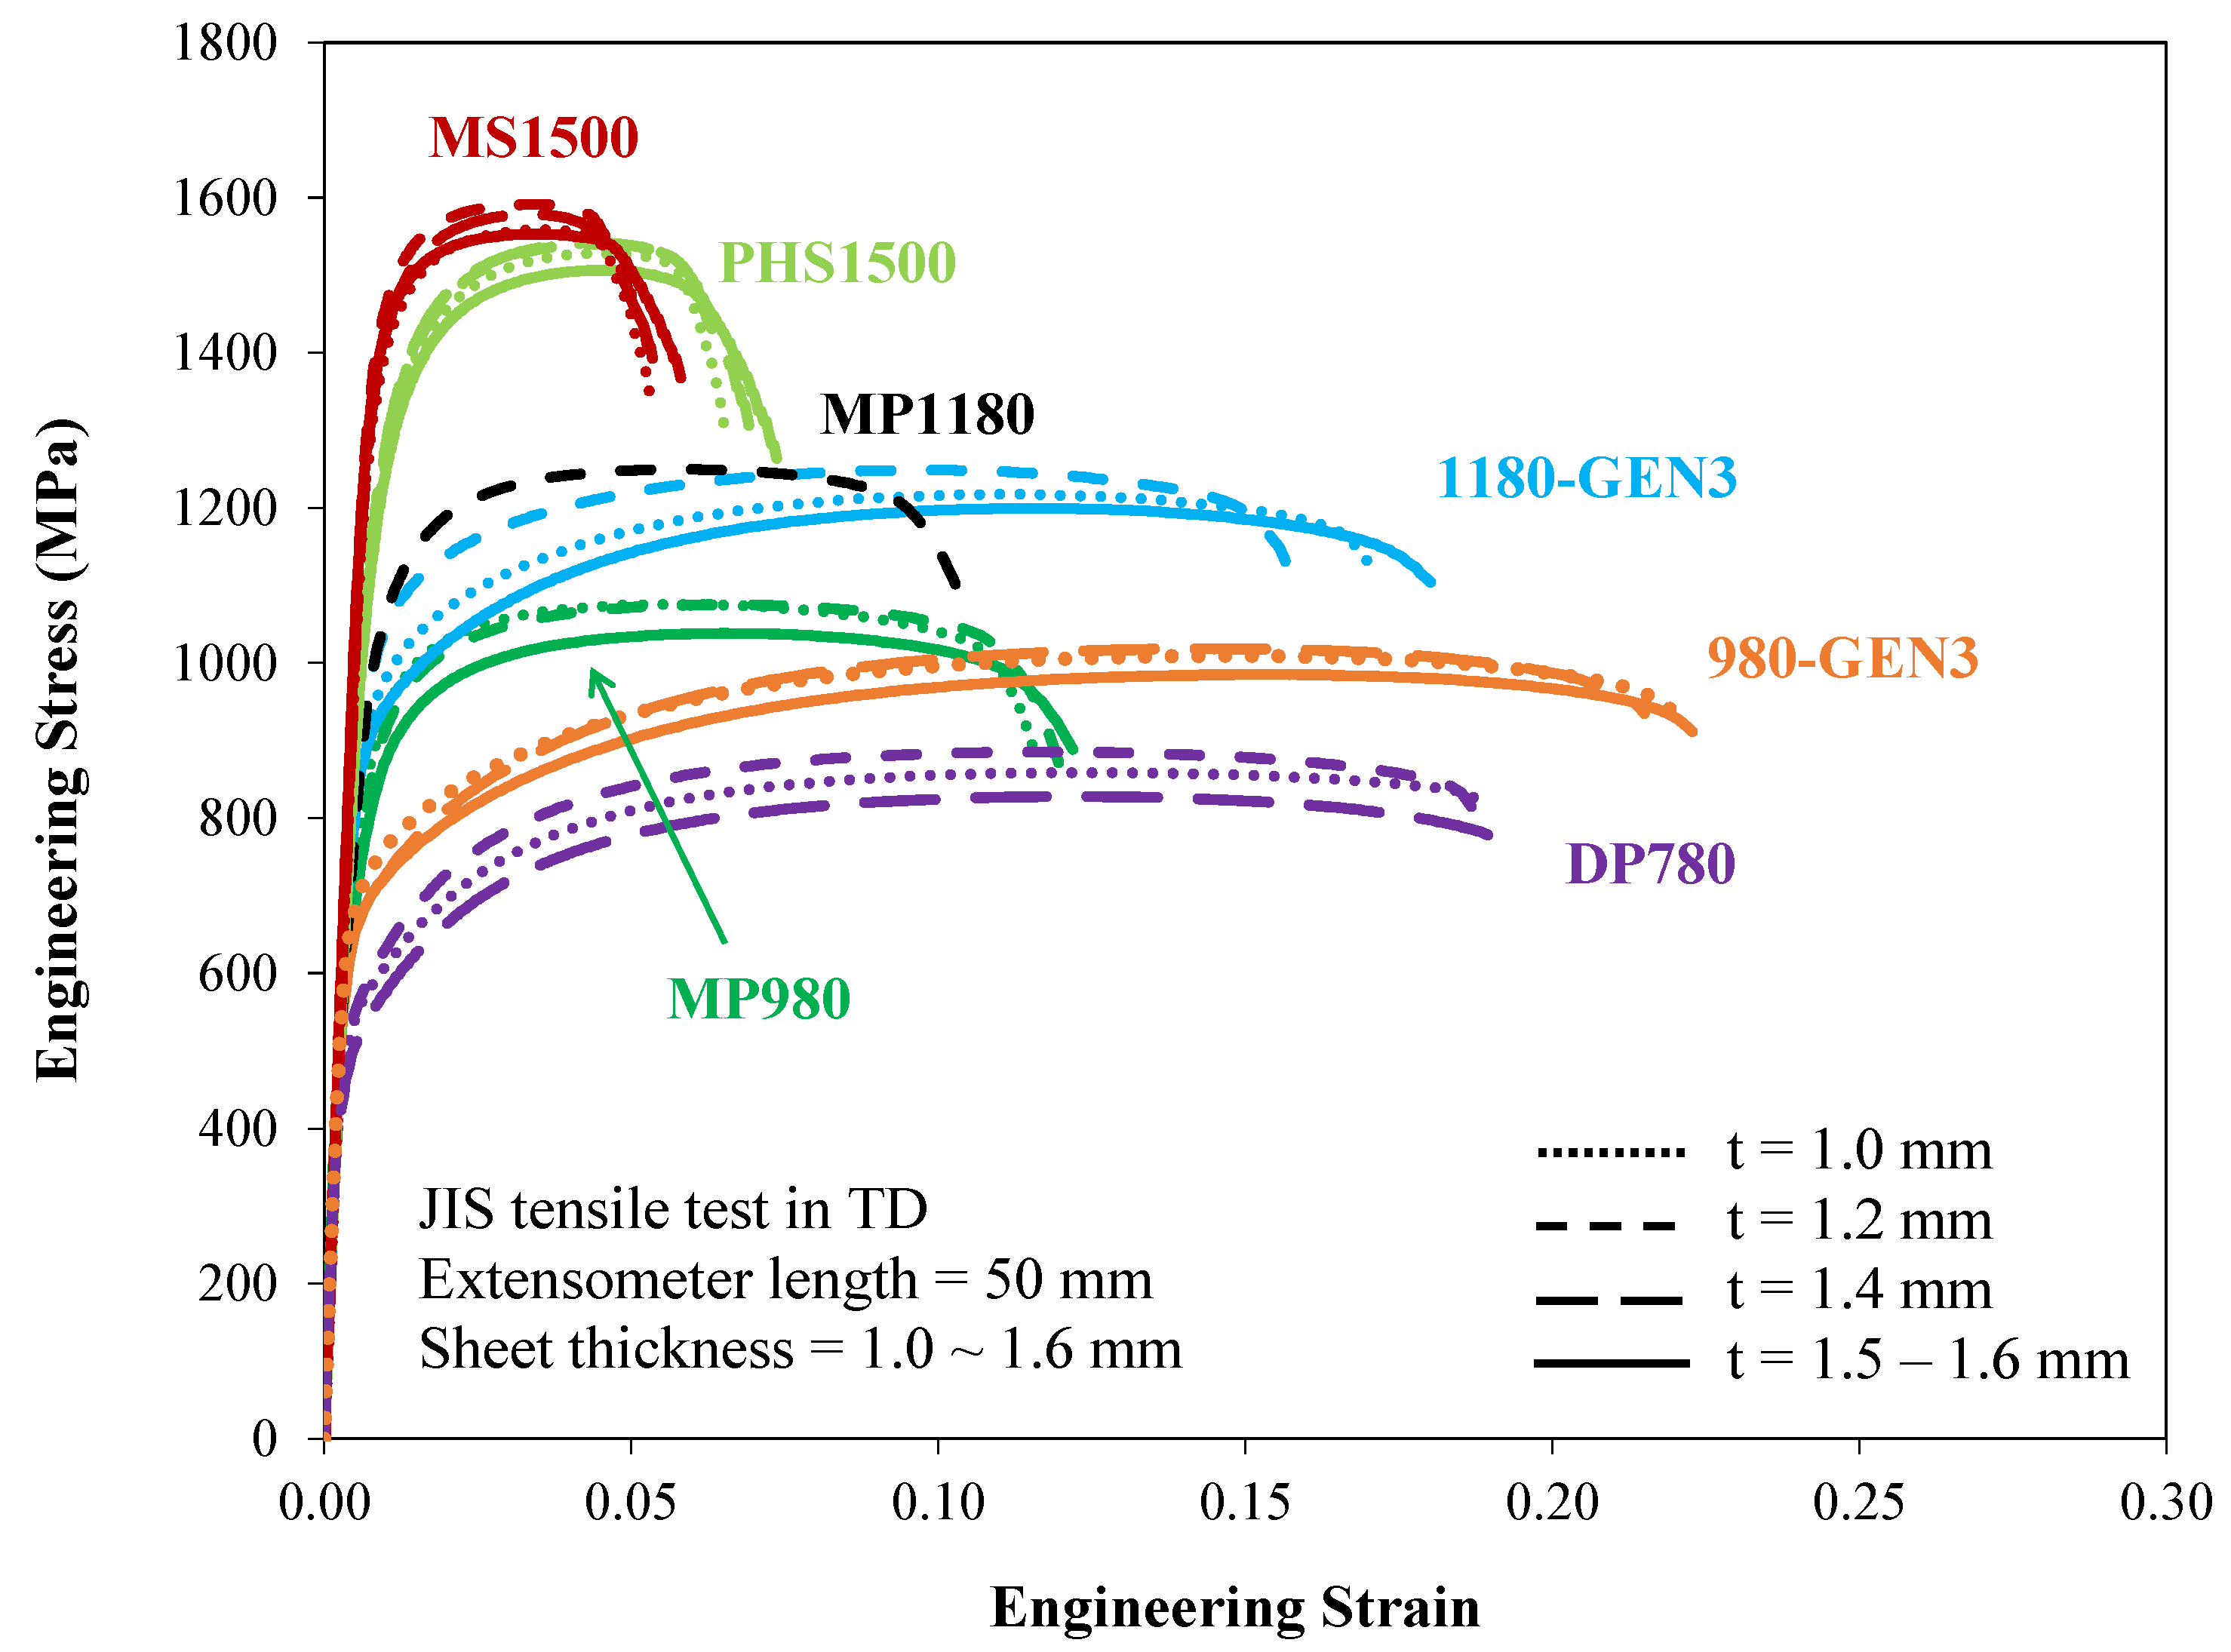
3. Material Selection
4. VDA 238-100 Bend Test: Results and Analysis
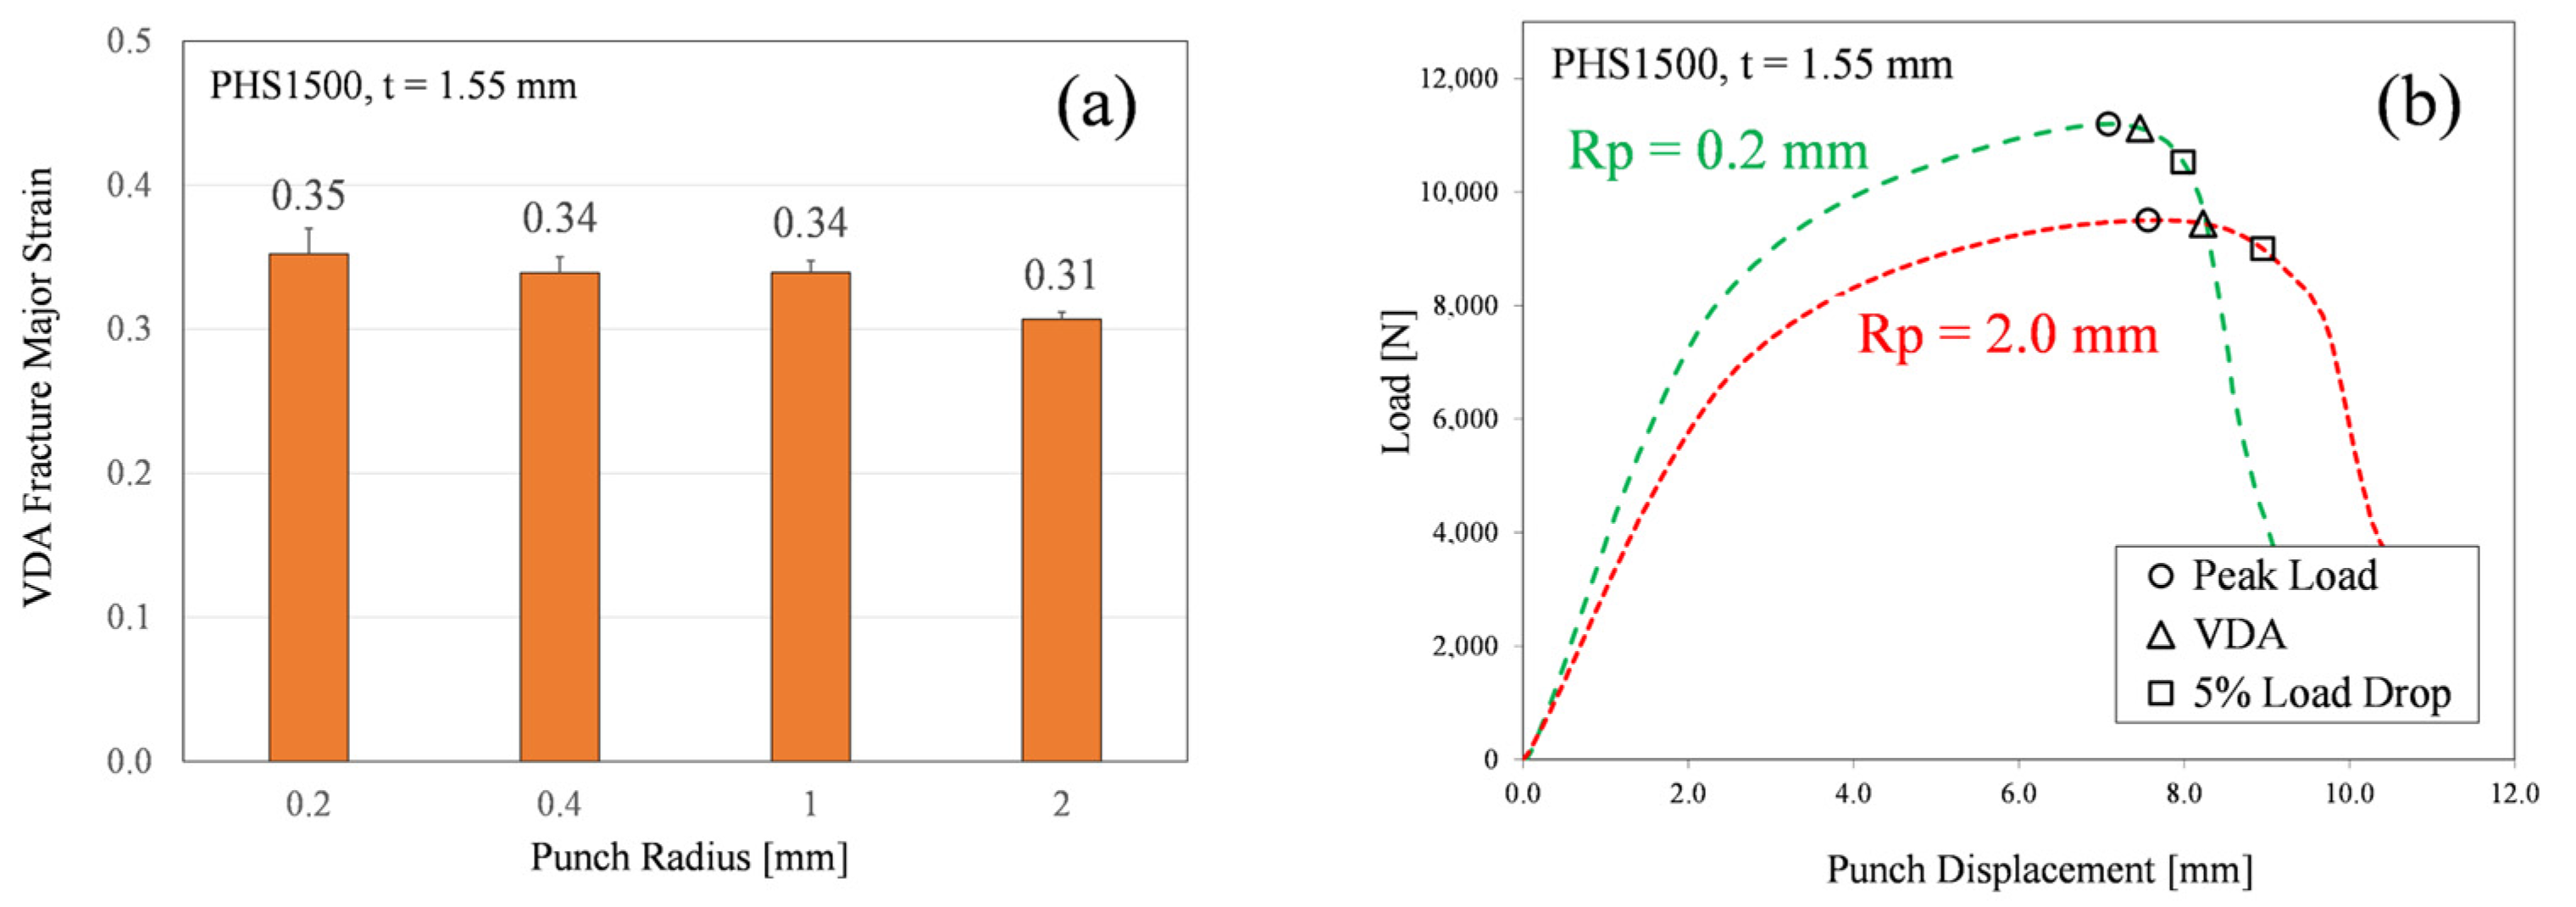
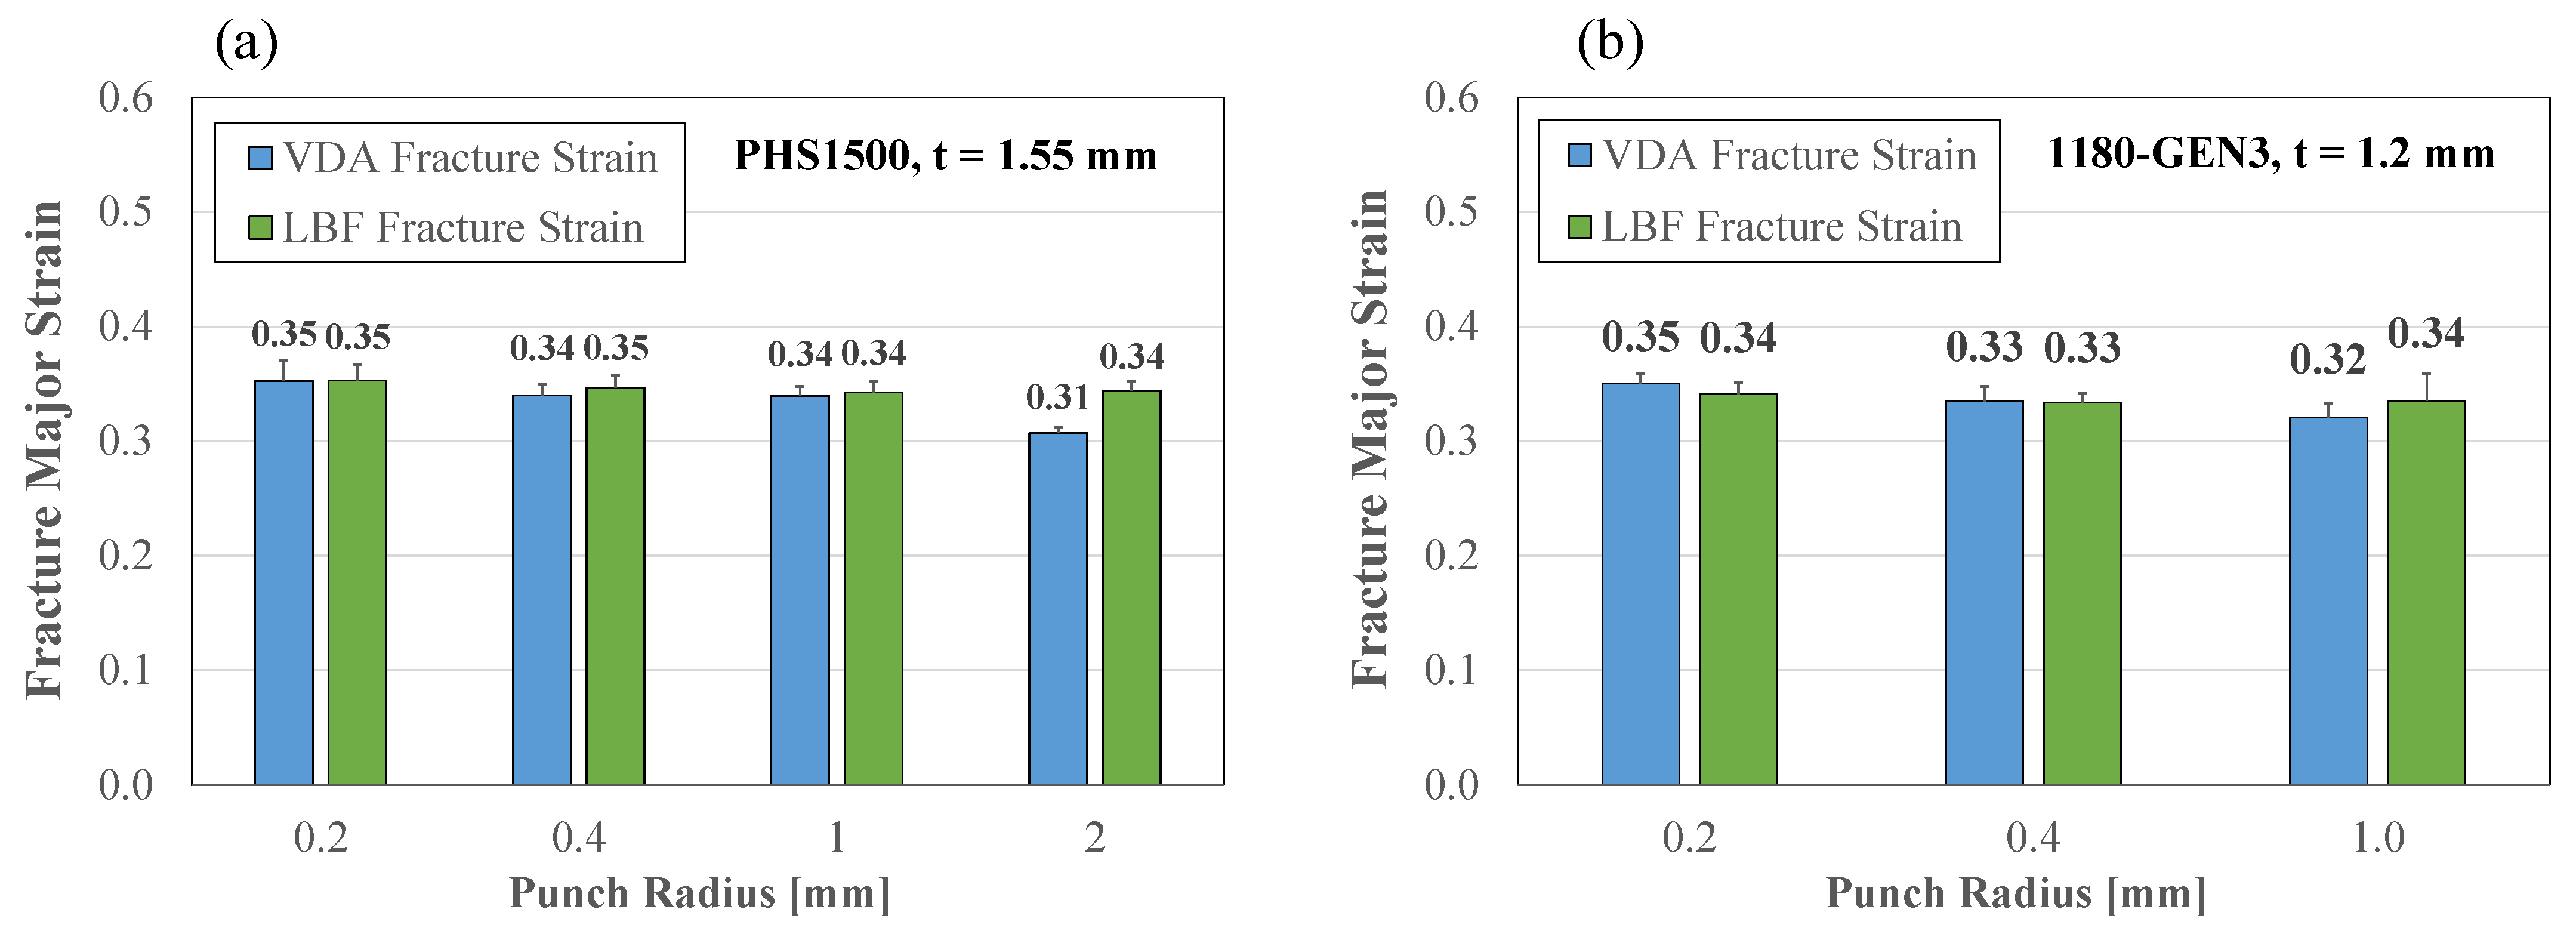
4.1. Influence of Bend Severity on Bending Performance
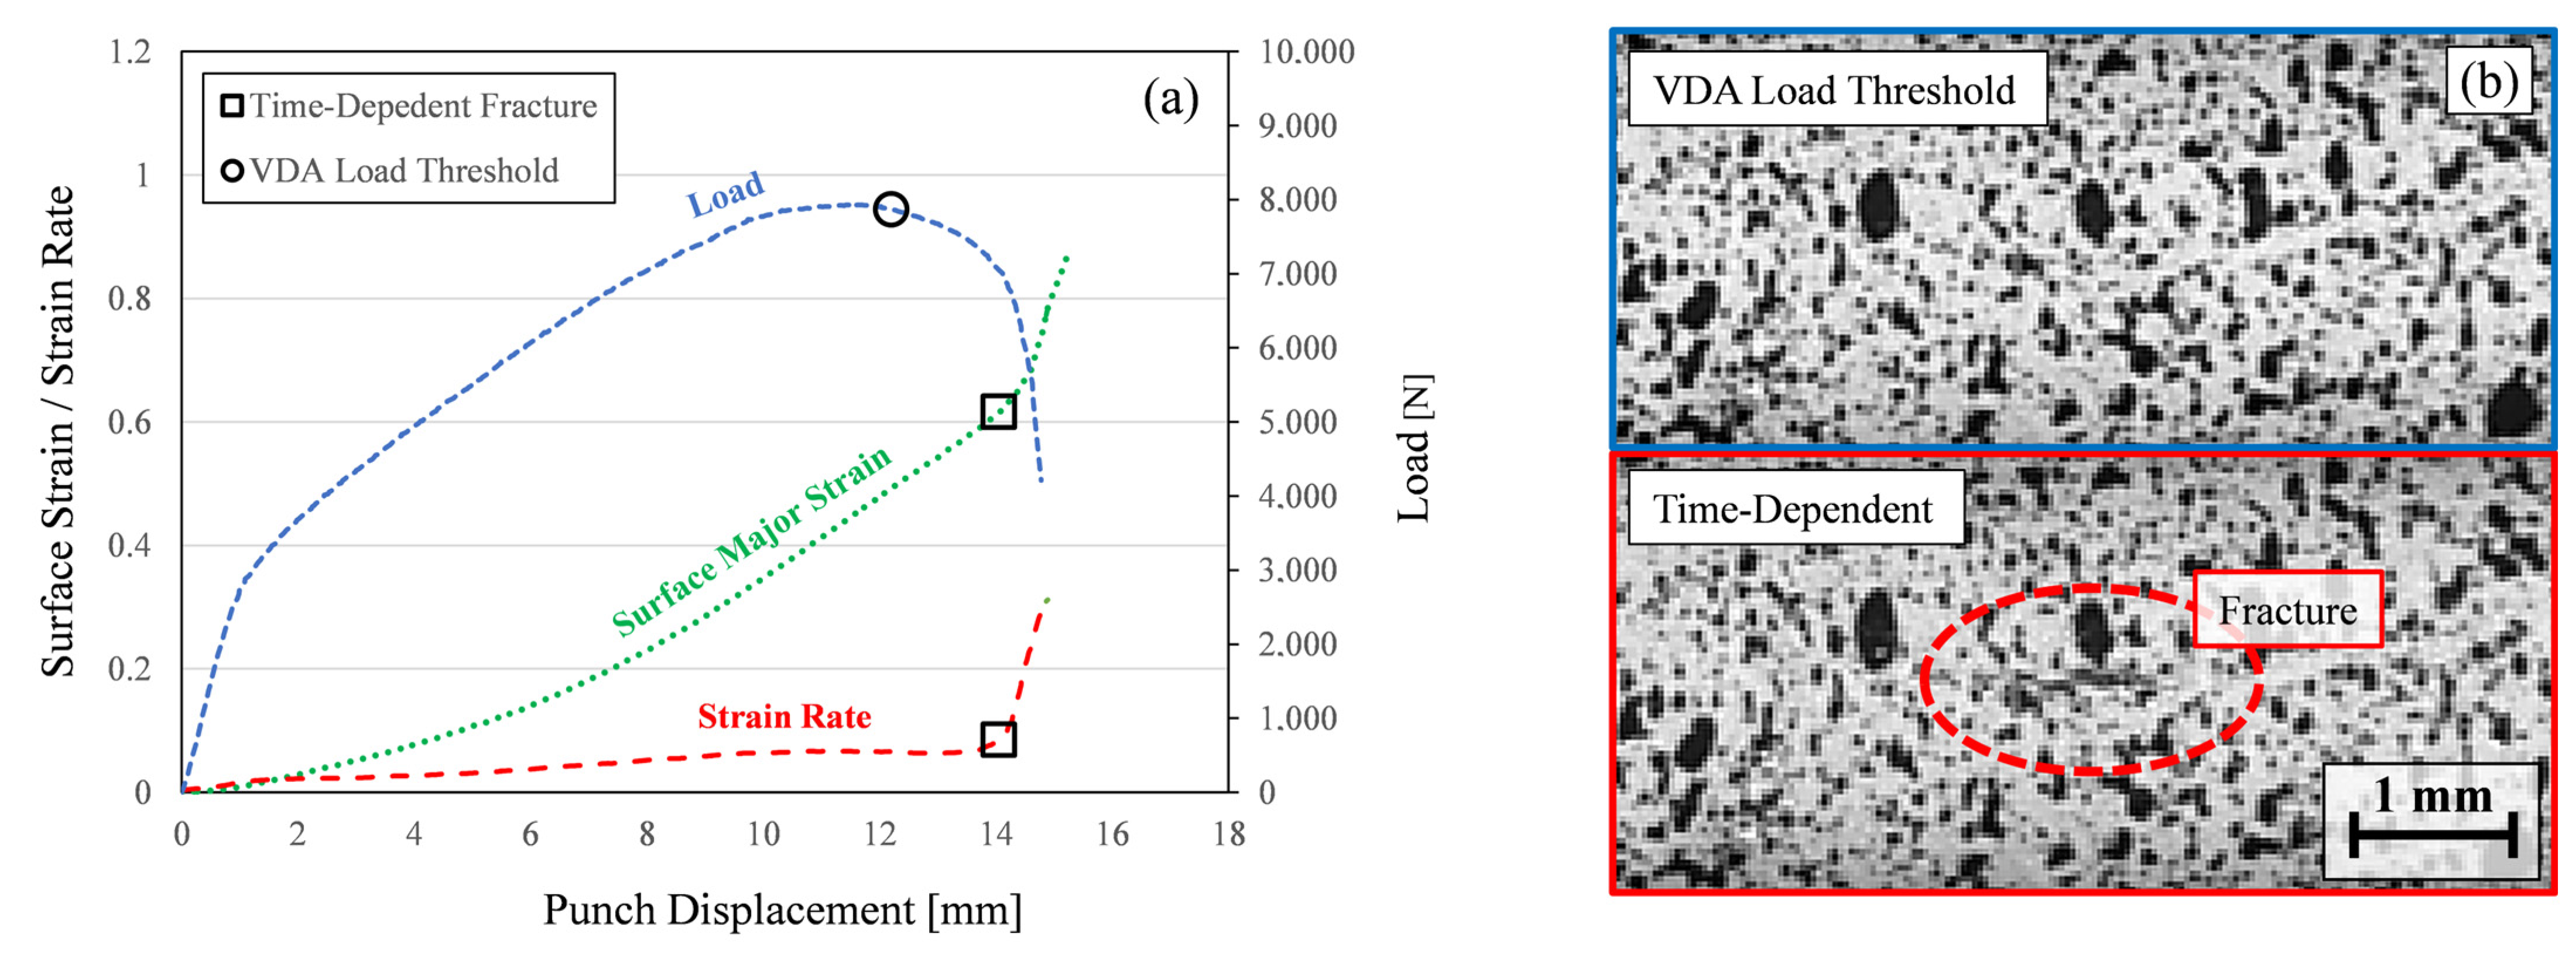
4.2. Bend Radius and Time-Dependent Analysis
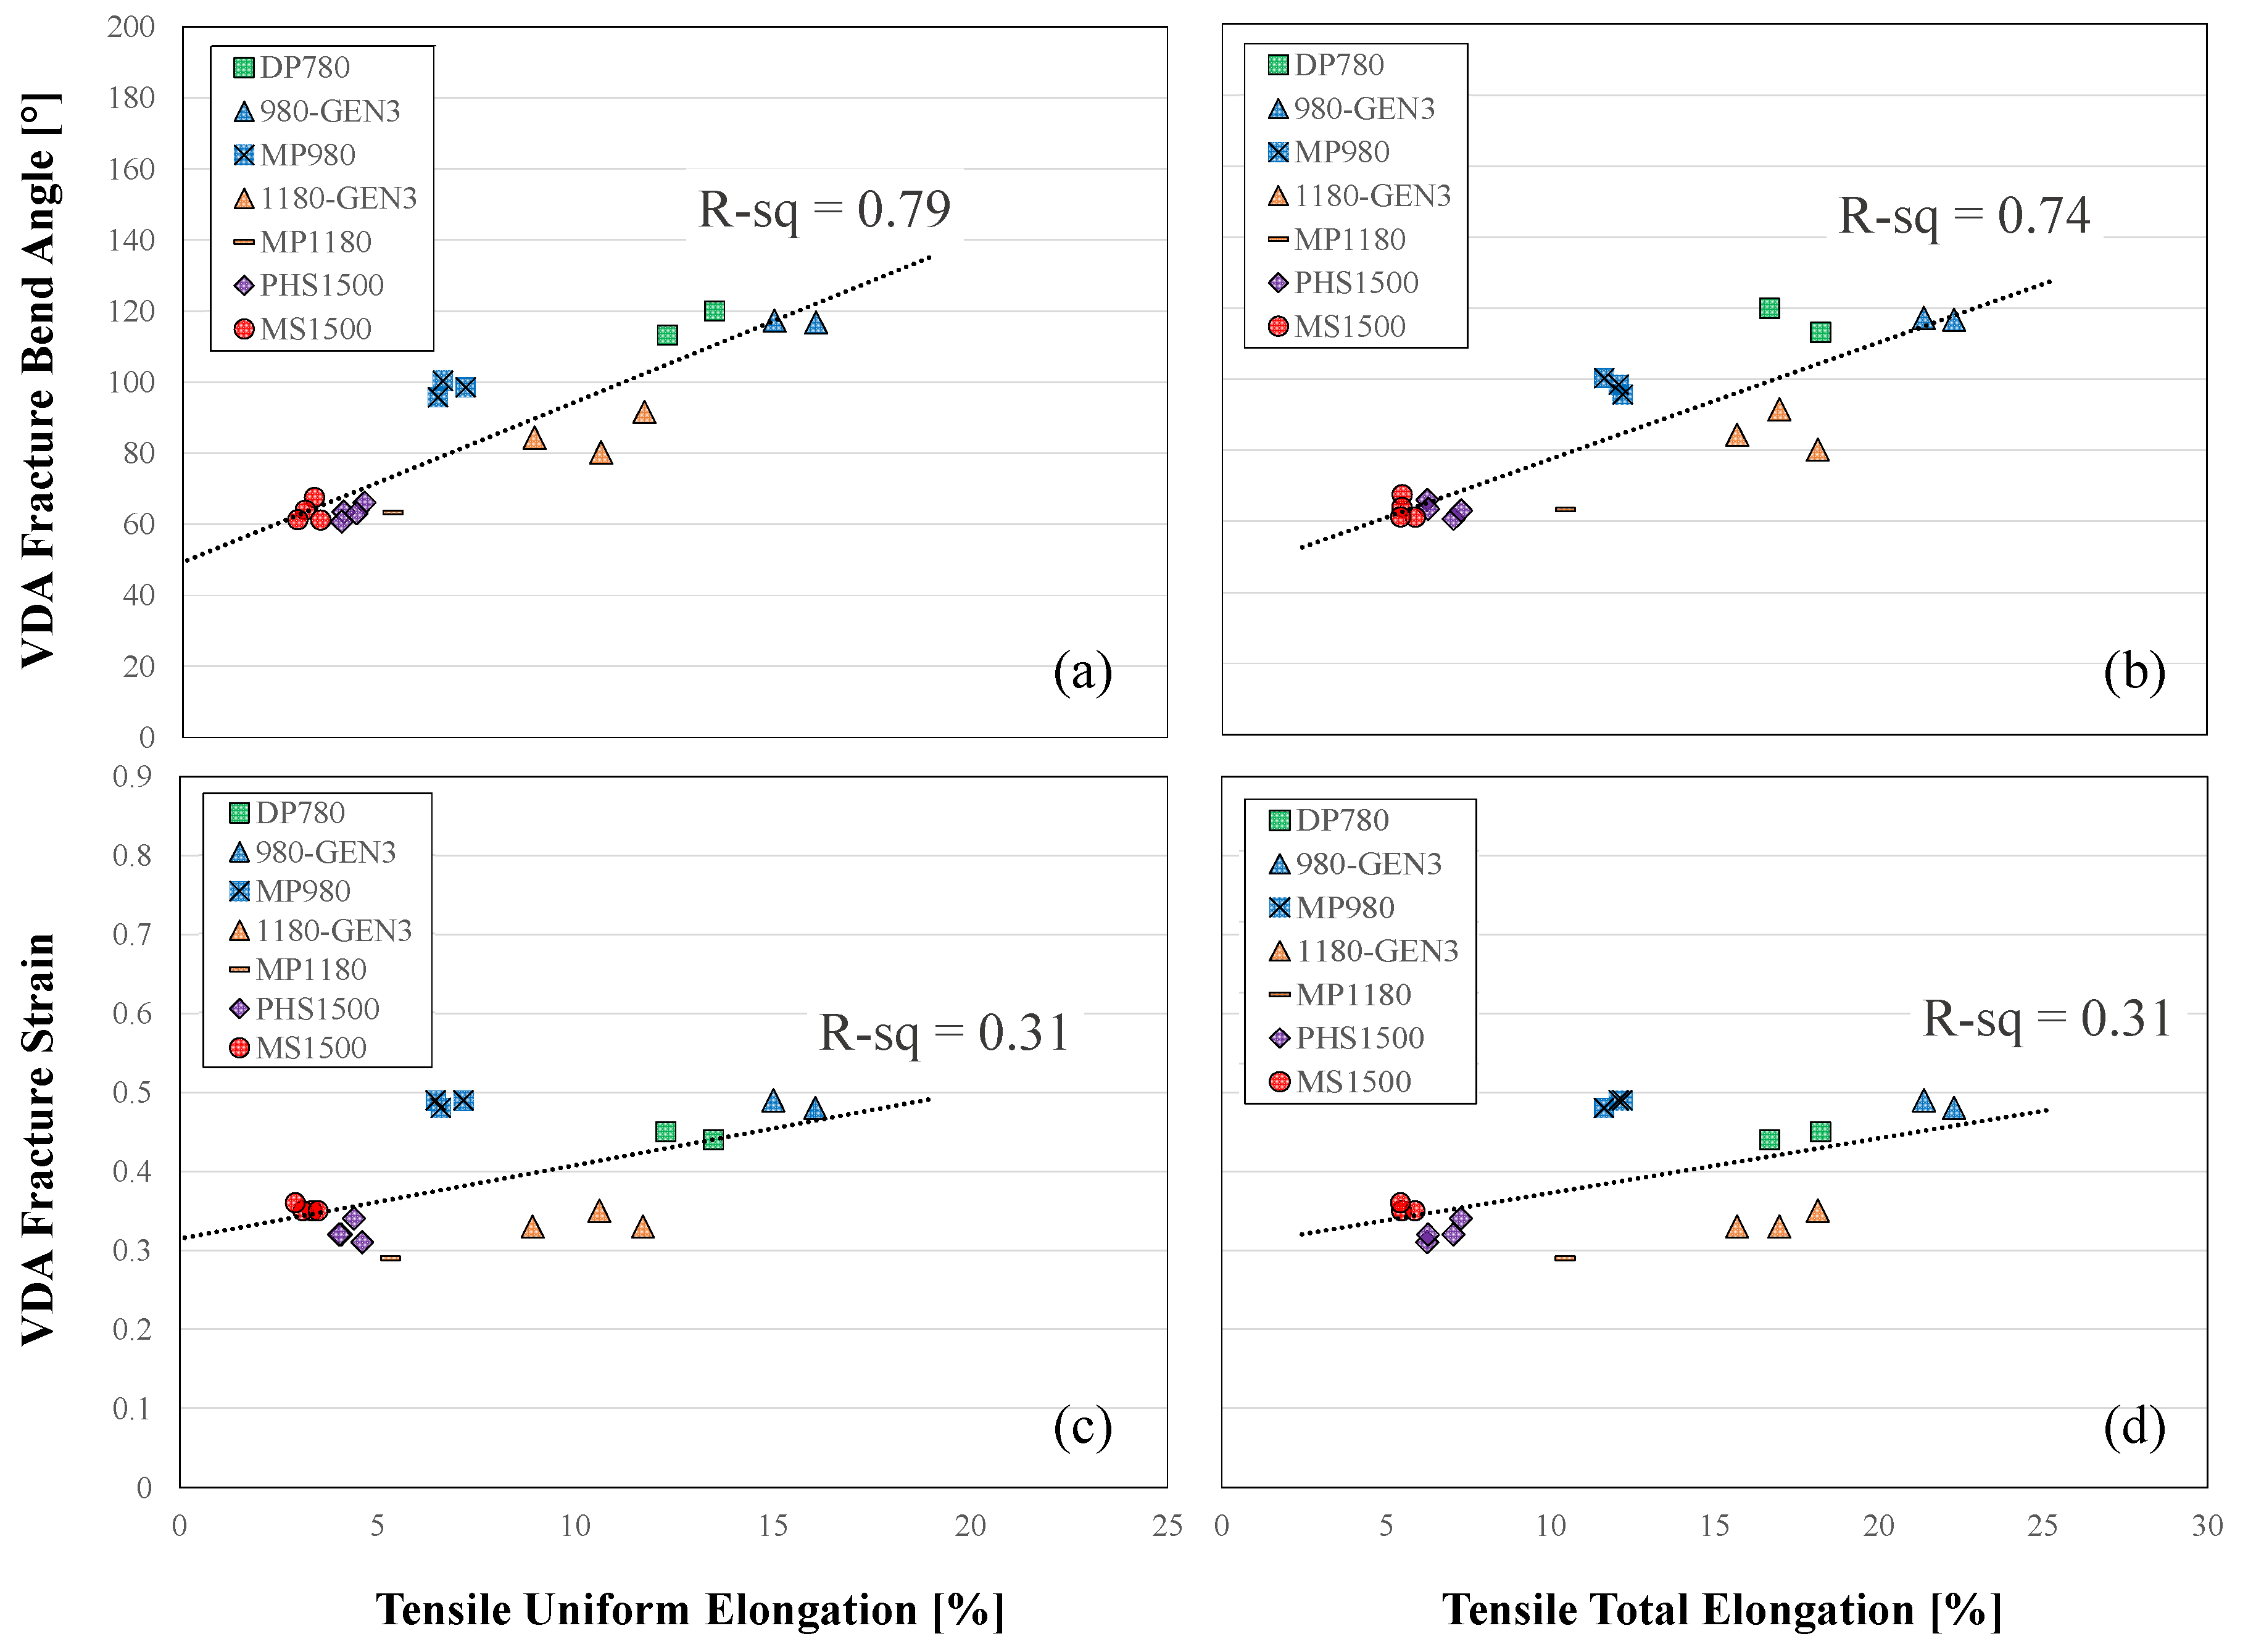
5. Evaluation of Bend Performance with Tensile Properties
6. Conclusions
- The plane strain bending fracture limit can be taken as an inherent material property. The fracture limit obtained for a grade of AHSS appears transferable between gauges if the tensile mechanical properties are comparable, implying that the microstructures are sufficiently similar. The fracture bend angle is not a unique metric, and is influenced by bend severity. The bend angle is instructive for material ranking in conditions with similar bend severities.
- The applicability of the VDA load-based analysis with a threshold of 60 N is dependent upon the imposed bend severity. Larger punches produce a flatter profile in the load curve, and can produce a mild but false dependency of the fracture strain with bend severity.
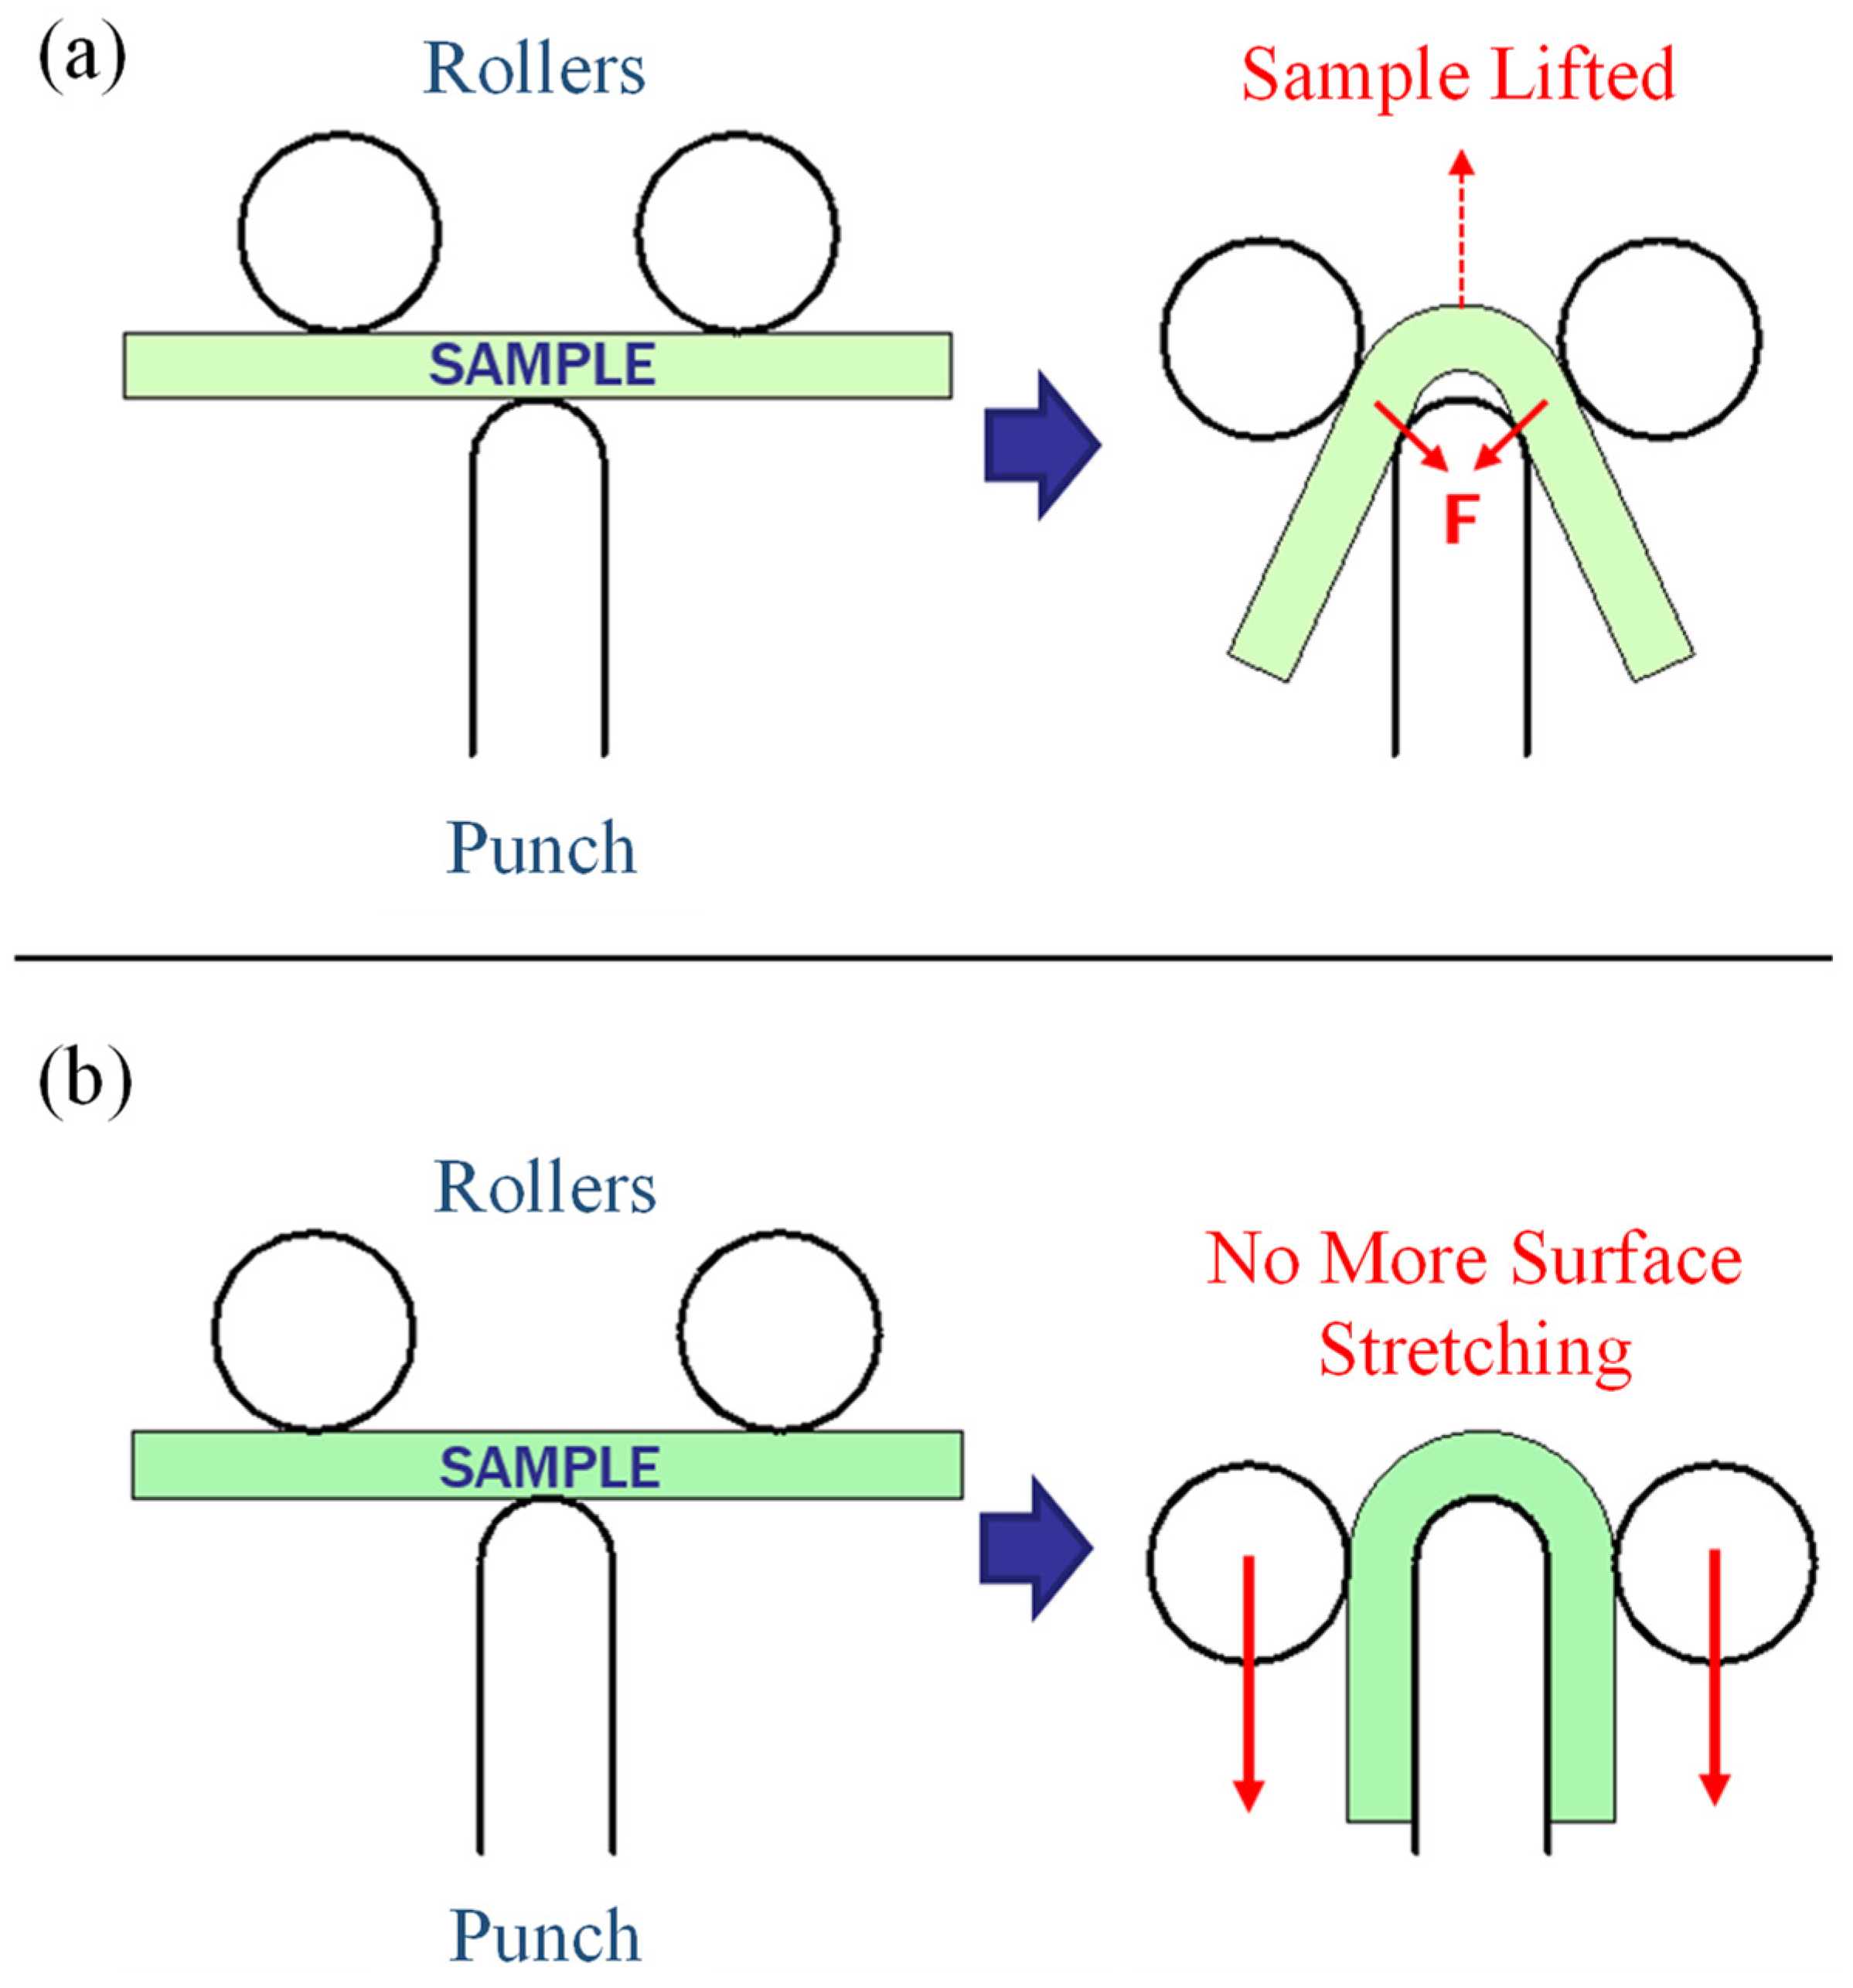
- In addition to providing the fracture strain, the use of DIC strain measurement enables the detection of punch lift-off and false positives for fractures associated with fold-over.
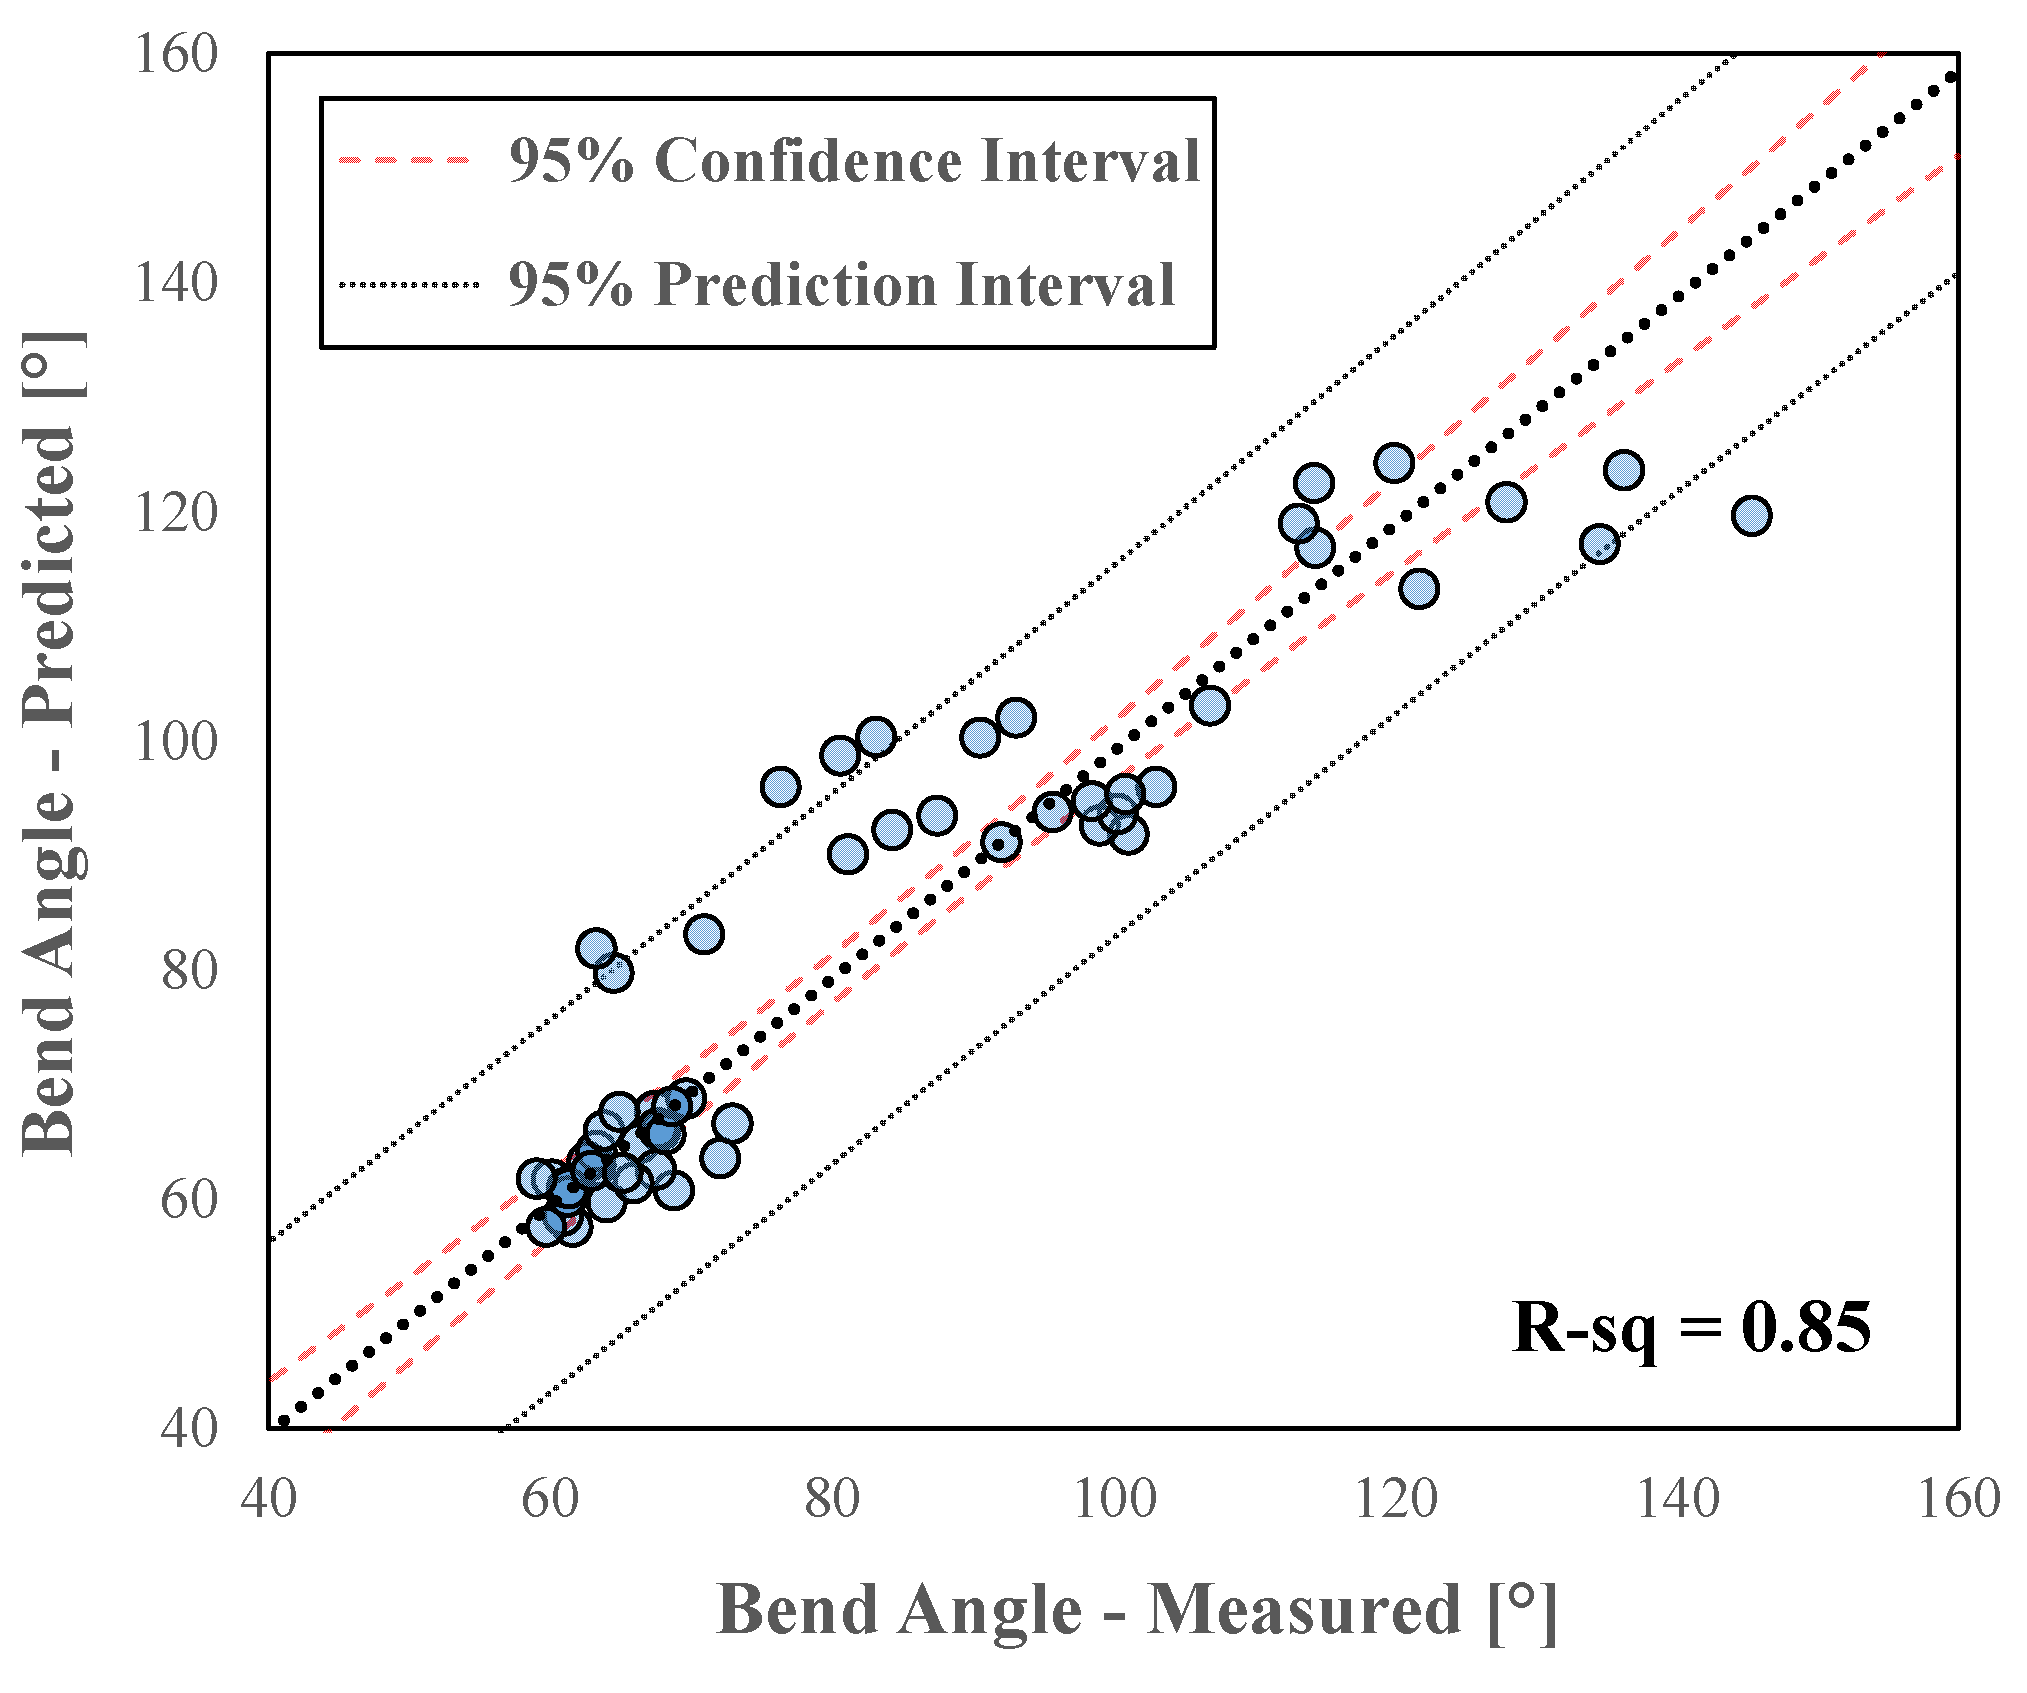
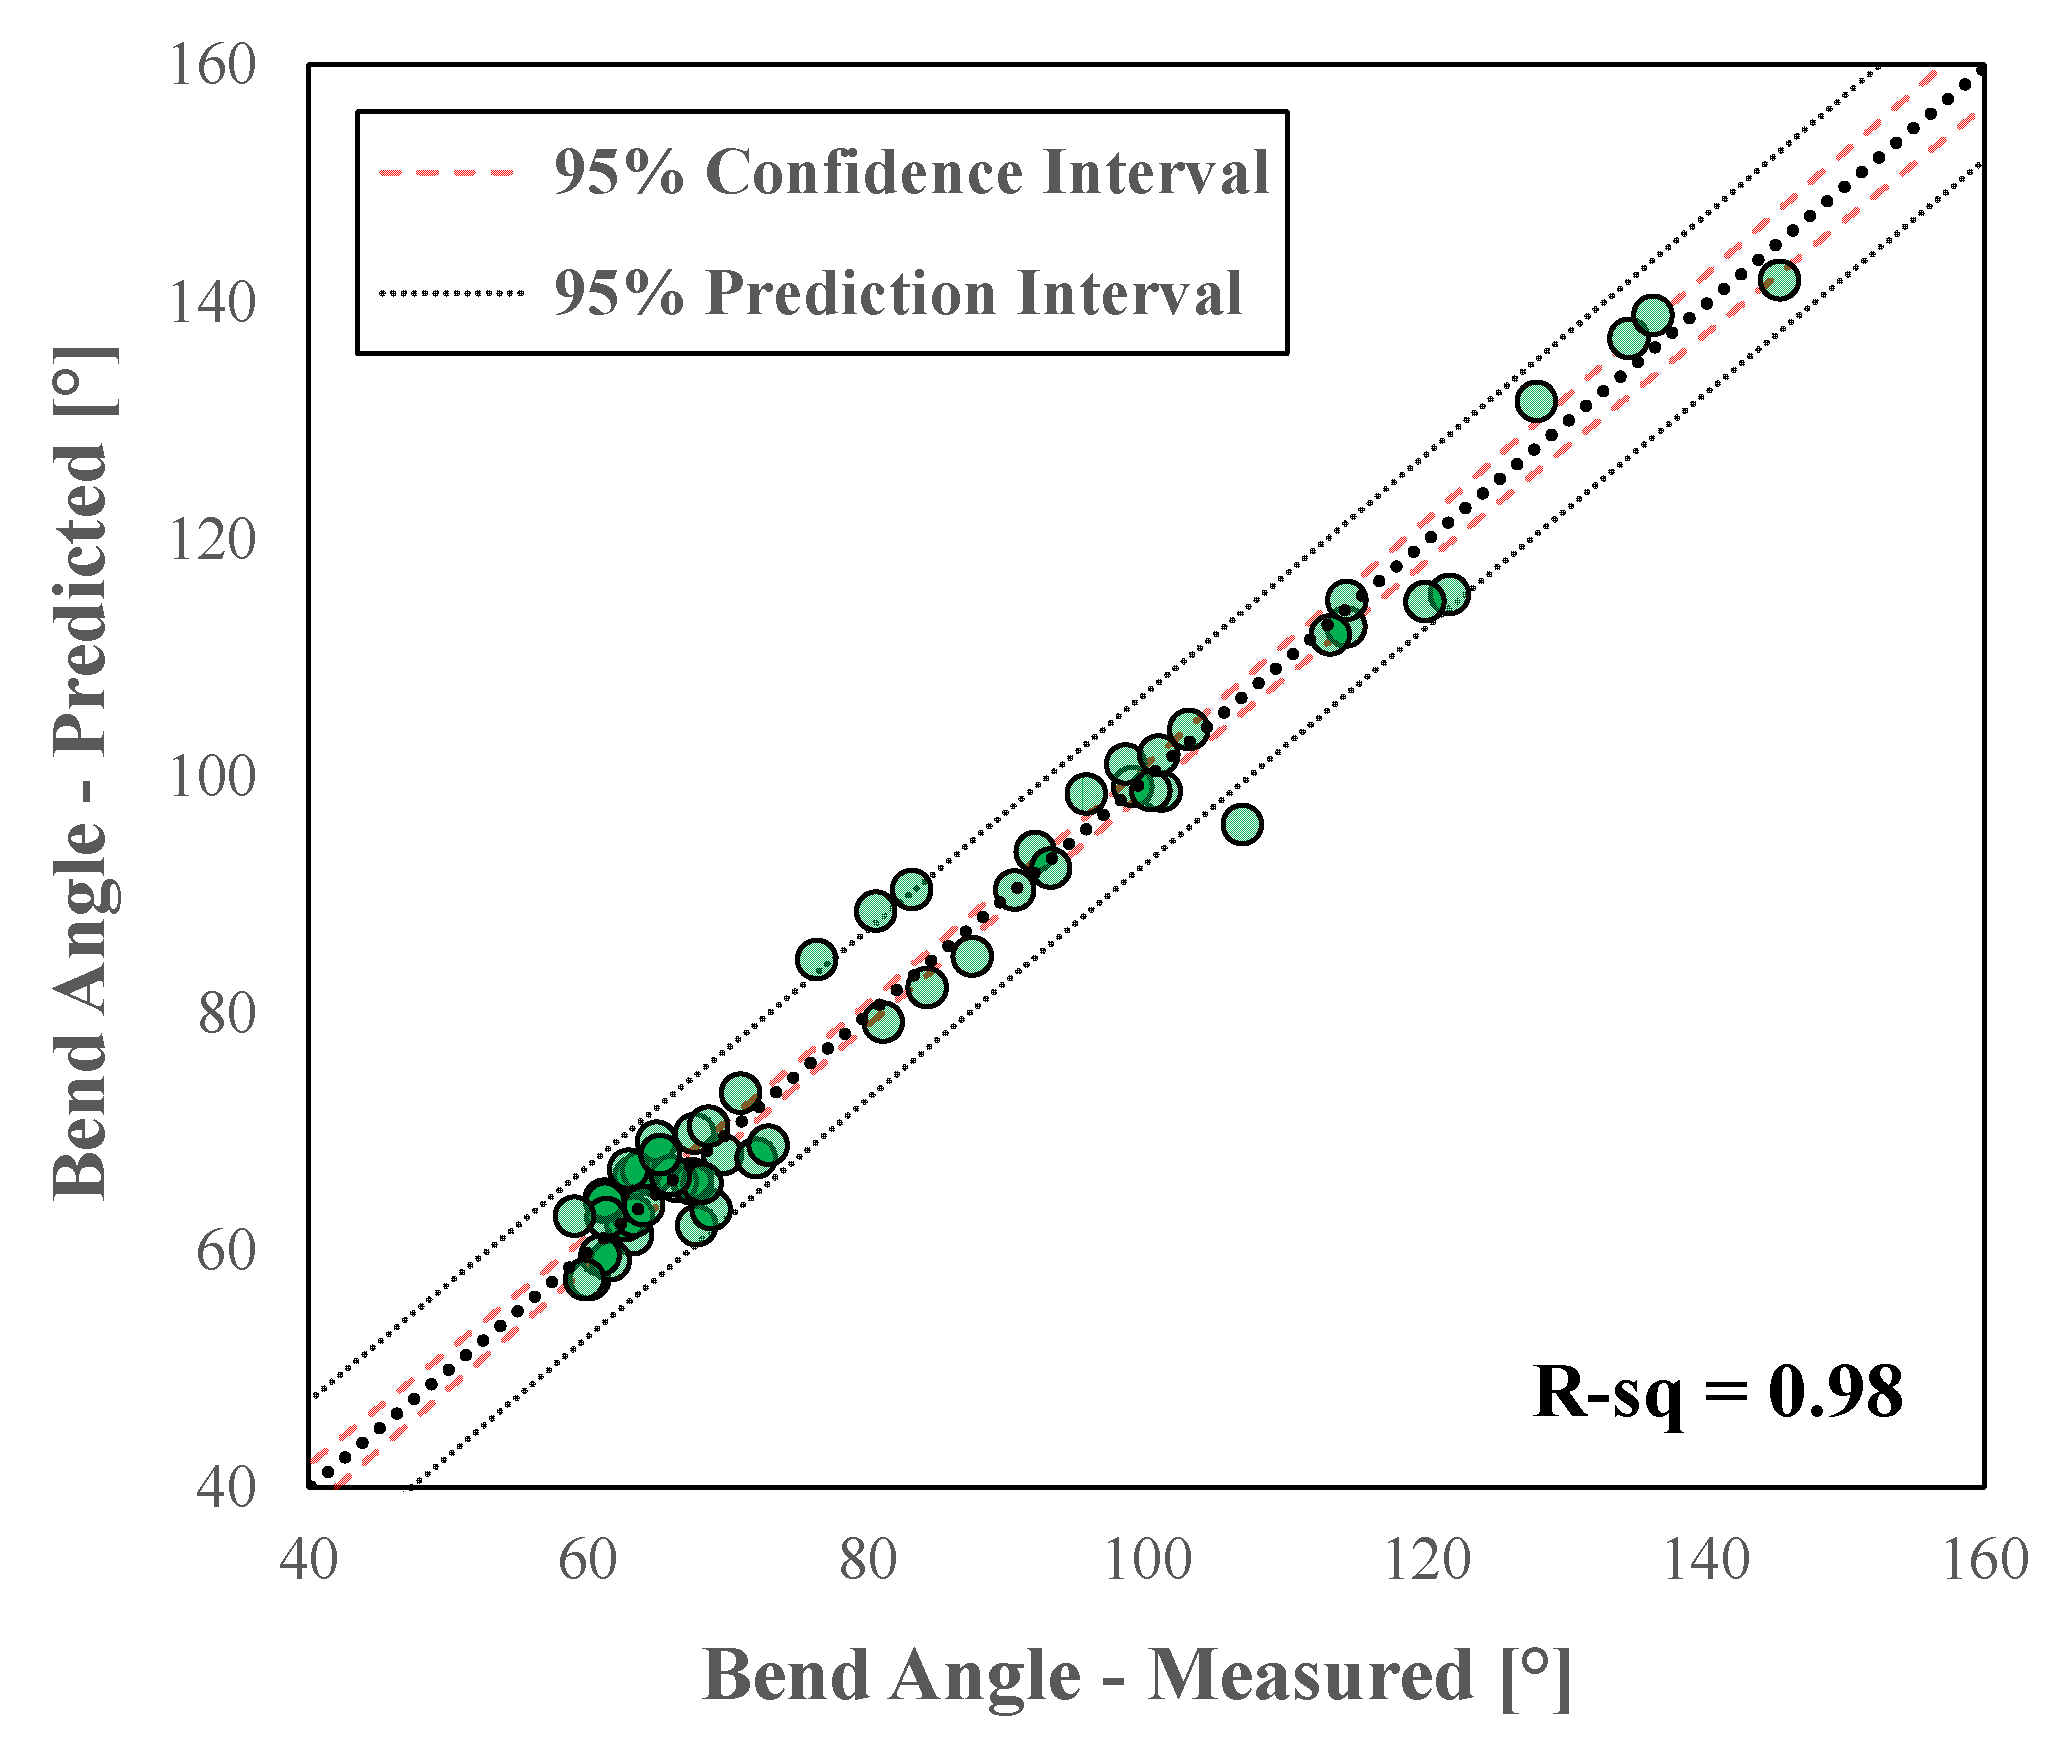
- A correlation was developed to predict the bend angle as a function of bend severity and tensile properties when the bend test data is not available. The local DIC fracture strain from tensile tests and bend severity were not significant predictors, whereas the uniform elongation and UTS were the primary predictors. This result demonstrates that tensile properties do not correspond directly with local formability, but can be estimated to first-order accuracy. The correlation for bend angle was markedly more accurate when the plane strain fracture limit was employed instead of the tensile fracture strain.
- A robust correlation was developed to predict the plane strain fracture limit as a function of the bend angle, uniform elongation, and bend severity when VDA test data with DIC is not readily available.
- The correlation developed in this study was evaluated using an independent set of data compiled from the literature consisting of 26 different test cases of AHSS with tensile strength levels ranging from 590 MPa to 1500 MPa. The model showed a strong correlation with an R-sq value of 0.86. It is recommended that analysts use the correlation to predict the mean fracture strain along with the corresponding 95% confidence and prediction intervals due to the inherent variability associated with fractures.
Author Contributions
Funding
Data Availability Statement
Acknowledgments
Conflicts of Interest
Nomenclature
| AA | Aluminum alloy | PHS | Press-hardened steel |
| AC | Air-cooled | PI | Prediction interval |
| AHSS | Advanced high-strength steel | PTFE | Polytetrafluoroethylene |
| AISI | American Iron and Steel Institute | RD | Rolling direction |
| CAE | Computer-aided engineering | Rp | Punch radius |
| CI | Confidence interval | Rr | Roller radius |
| D500 | Ductibor®500 | R-sq | Coefficient of determination |
| DIC | Digital image correlation | r-value | Lankford coefficient |
| DP | Dual-phase | S | Punch stroke |
| DQ | Die-quenched | SE | Standard error |
| FLC | Forming limit curve | t | Sheet thickness |
| GEN3 | 3rd generation | t Stat | t-statistic |
| HS | Hot stamped | TD | Transverse direction |
| ISO | International Organization for Standardization | TRIP | Transformation-induced plasticity |
| JIS | Japanese Industrial Standard | U1500 | Usibor®1500 |
| L | Roller gap | UTS | Ultimate tensile strength |
| LBF | Linear best fit | VB | VDA 238-100 bend test, or v-bend test |
| MMnS | Medium-Mn Steel | VDA | German Association of the Automotive Industry |
| MP | Multi-phase | VSGL | Virtual strain gauge length |
| MS | Martensitic steel | α | Bend angle |
| OC | Oil-cooled |
Appendix A

| Punch 1 (r = 0.2 mm) | Punch 2 (r = 0.4 mm) | Punch 3 (r = 1.0 mm) | Punch 4 (r = 2.0 mm) | ||||||
|---|---|---|---|---|---|---|---|---|---|
| Material | Thickness [mm] | Fracture Strain | Fracture Bend Angle | Fracture Strain | Fracture Bend Angle | Fracture Strain | Fracture Bend Angle | Fracture Strain | Fracture Bend Angle |
| DP780 | 1 | 0.45 ± 0.02 | 114 ± 3 | 0.44 ± 0.01 | 120 ± 2 | F L | F L | ||
| 1.2 | 0.50 ± 0.01 | 114 ± 2 | 0.45 ± 0.01 | 113 ± 3 | |||||
| 1.4 | 0.54 ± 0.01 | 122 ± 1 | F | ||||||
| 980-GEN3 | 1.4 | 0.53 ± 0.01 | 120 ± 2 | 0.49 ± 0.01 | 117 ± 2 | F L | F L | ||
| 1.6 | 0.54 ± 0.01 | 121 ± 2 | 0.48 ± 0.01 | 117 ± 2 | |||||
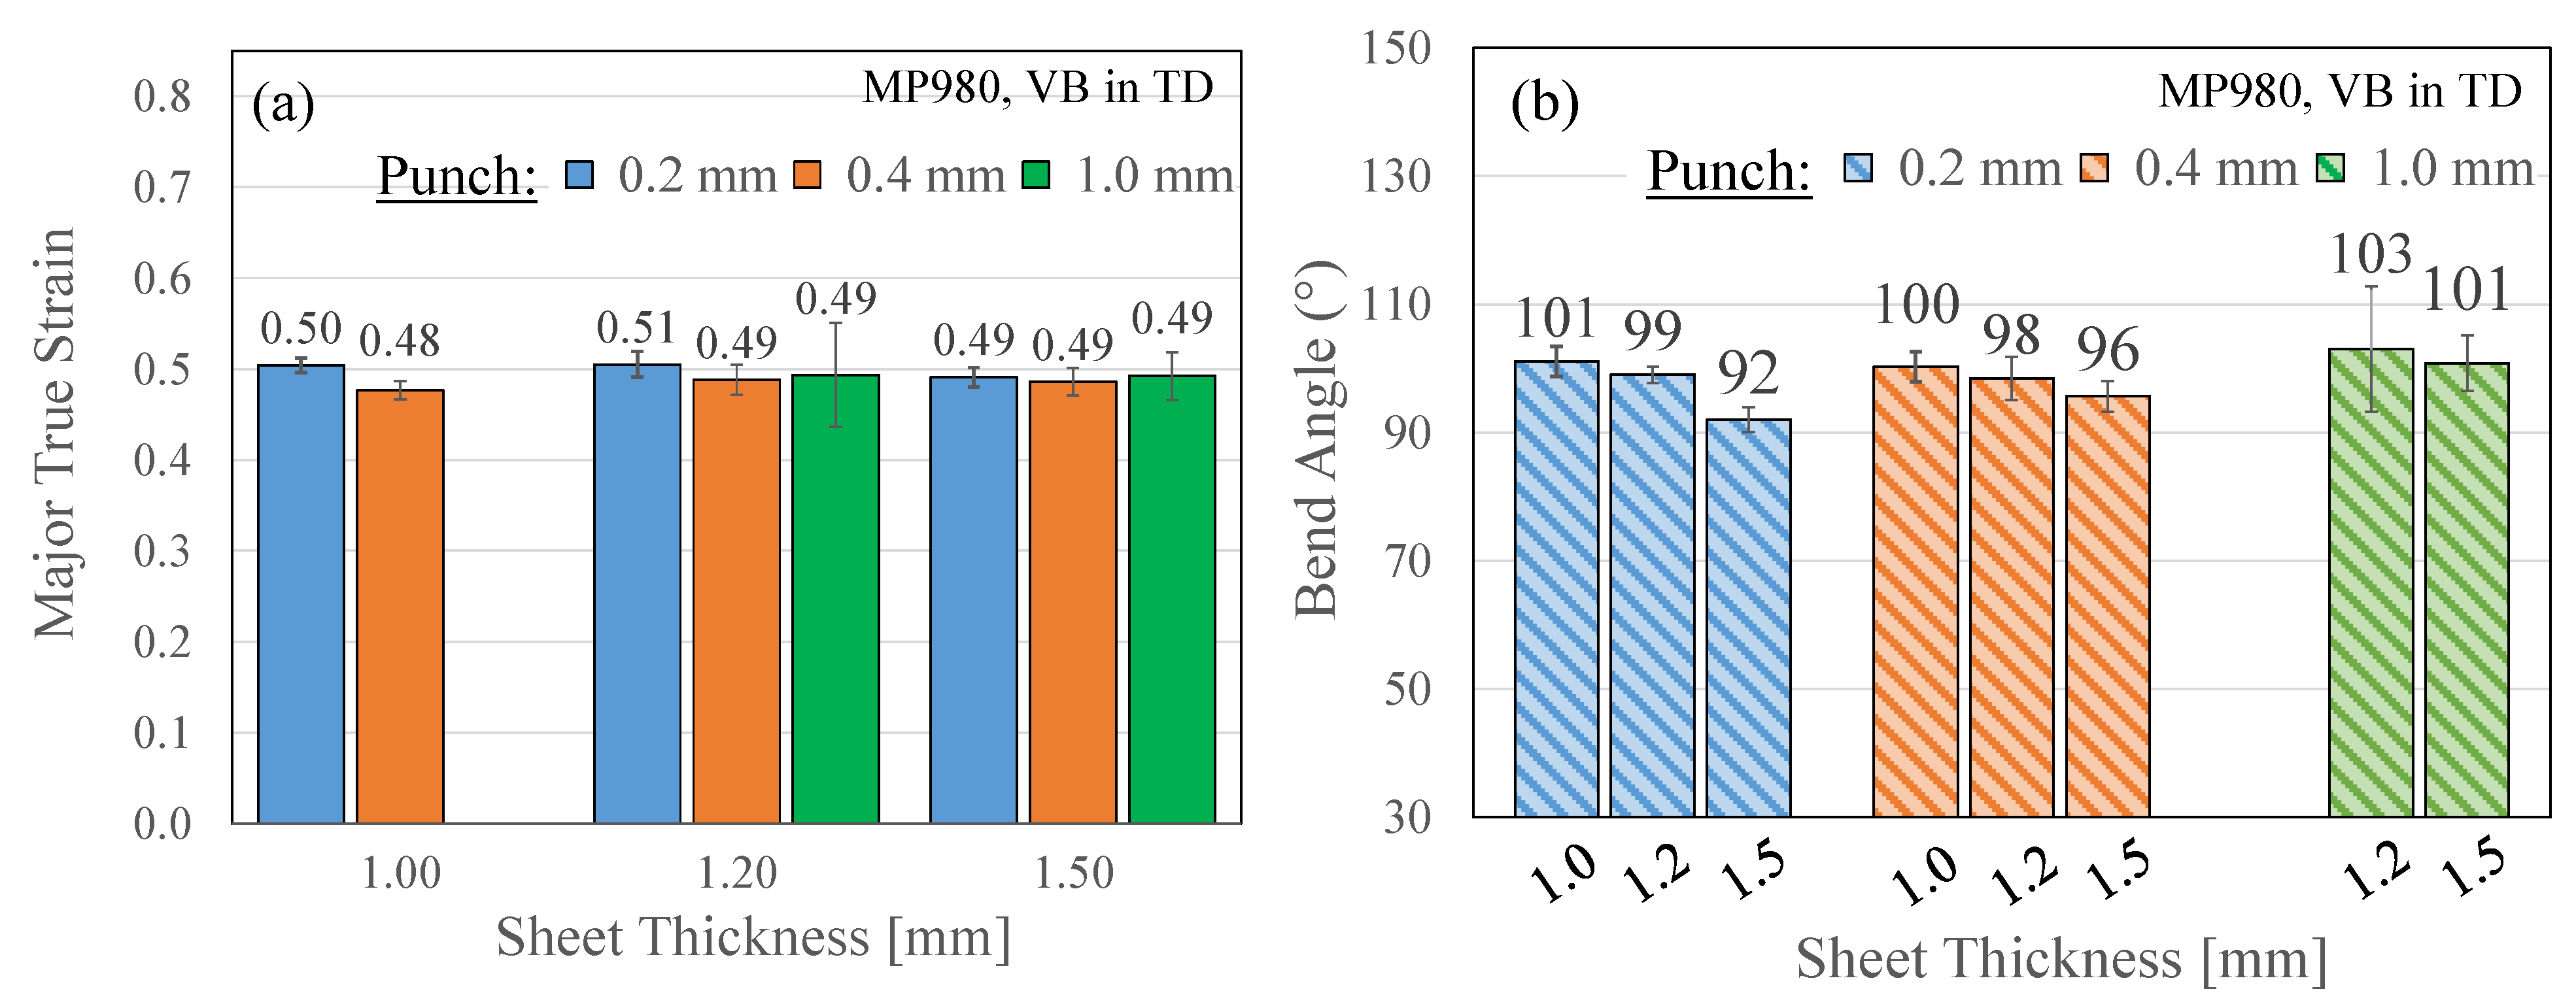
| MP980 | 1 | 0.50 ± 0.01 | 101 ± 2 | 0.48 ± 0.01 | 100 ± 2 | F/L | F L | ||
| 1.2 | 0.51 ± 0.01 | 99 ± 1 | 0.49 ± 0.02 | 98 ± 3 | 0.49 ± 0.06 | 103 ± 10 | |||
| 1.5 | 0.49 ± 0.01 | 92 ± 2 | 0.49 ± 0.01 | 96 ± 2 | 0.49 ± 0.03 | 101 ± 4 | |||
| 1180-GEN3 | 1 | 0.36 ± 0.00 | 90 ± 1 | 0.33 ± 0.01 | 92 ± 1 | 0.32 ± 0.02 | 101 ± 4 | F L | |
| 1.2 | 0.35 ± 0.01 | 82 ± 0 | 0.33 ± 0.01 | 84 ± 1 | 0.32 ± 0.01 | 85 ± 2 | |||
| 1.55 | 0.36 ± 0.01 | 77 ± 1 | 0.35 ± 0.01 | 80 ± 2 | 0.33 ± 0.01 | 81 ± 3 | |||
| MP1180 | 1.2 | 0.32 ± 0.03 | 65 ± 5 | 0.29 ± 0.03 | 63 ± 5 | 0.32 ± 0.01 | 71 ± 1 | L | |
| PHS1500 | 1 | 0.33 ± 0.01 | 68 ± 2 | 0.31 ± 0.01 | 66 ± 1 | 0.29 ± 0.01 | 66 ± 2 | L | |
| 1.2 | 0.32 ± 0.01 | 61 ± 2 | 0.32 ± 0.01 | 63 ± 2 | 0.31 ± 0.01 | 63 ± 1 | 0.29 ± 0.01 | 66 ± 2 | |
| 1.4 | 0.33 ± 0.01 | 60 ± 1 | 0.32 ± 0.01 | 61 ± 2 | 0.32 ± 0.01 | 63 ± 1 | L | ||
| 1.55 | 0.35 ± 0.02 | 62 ± 2 | 0.34 ± 0.01 | 63 ± 2 | 0.34 ± 0.01 | 64 ± 1 | 0.31 ± 0.01 | 64 ± 1 | |
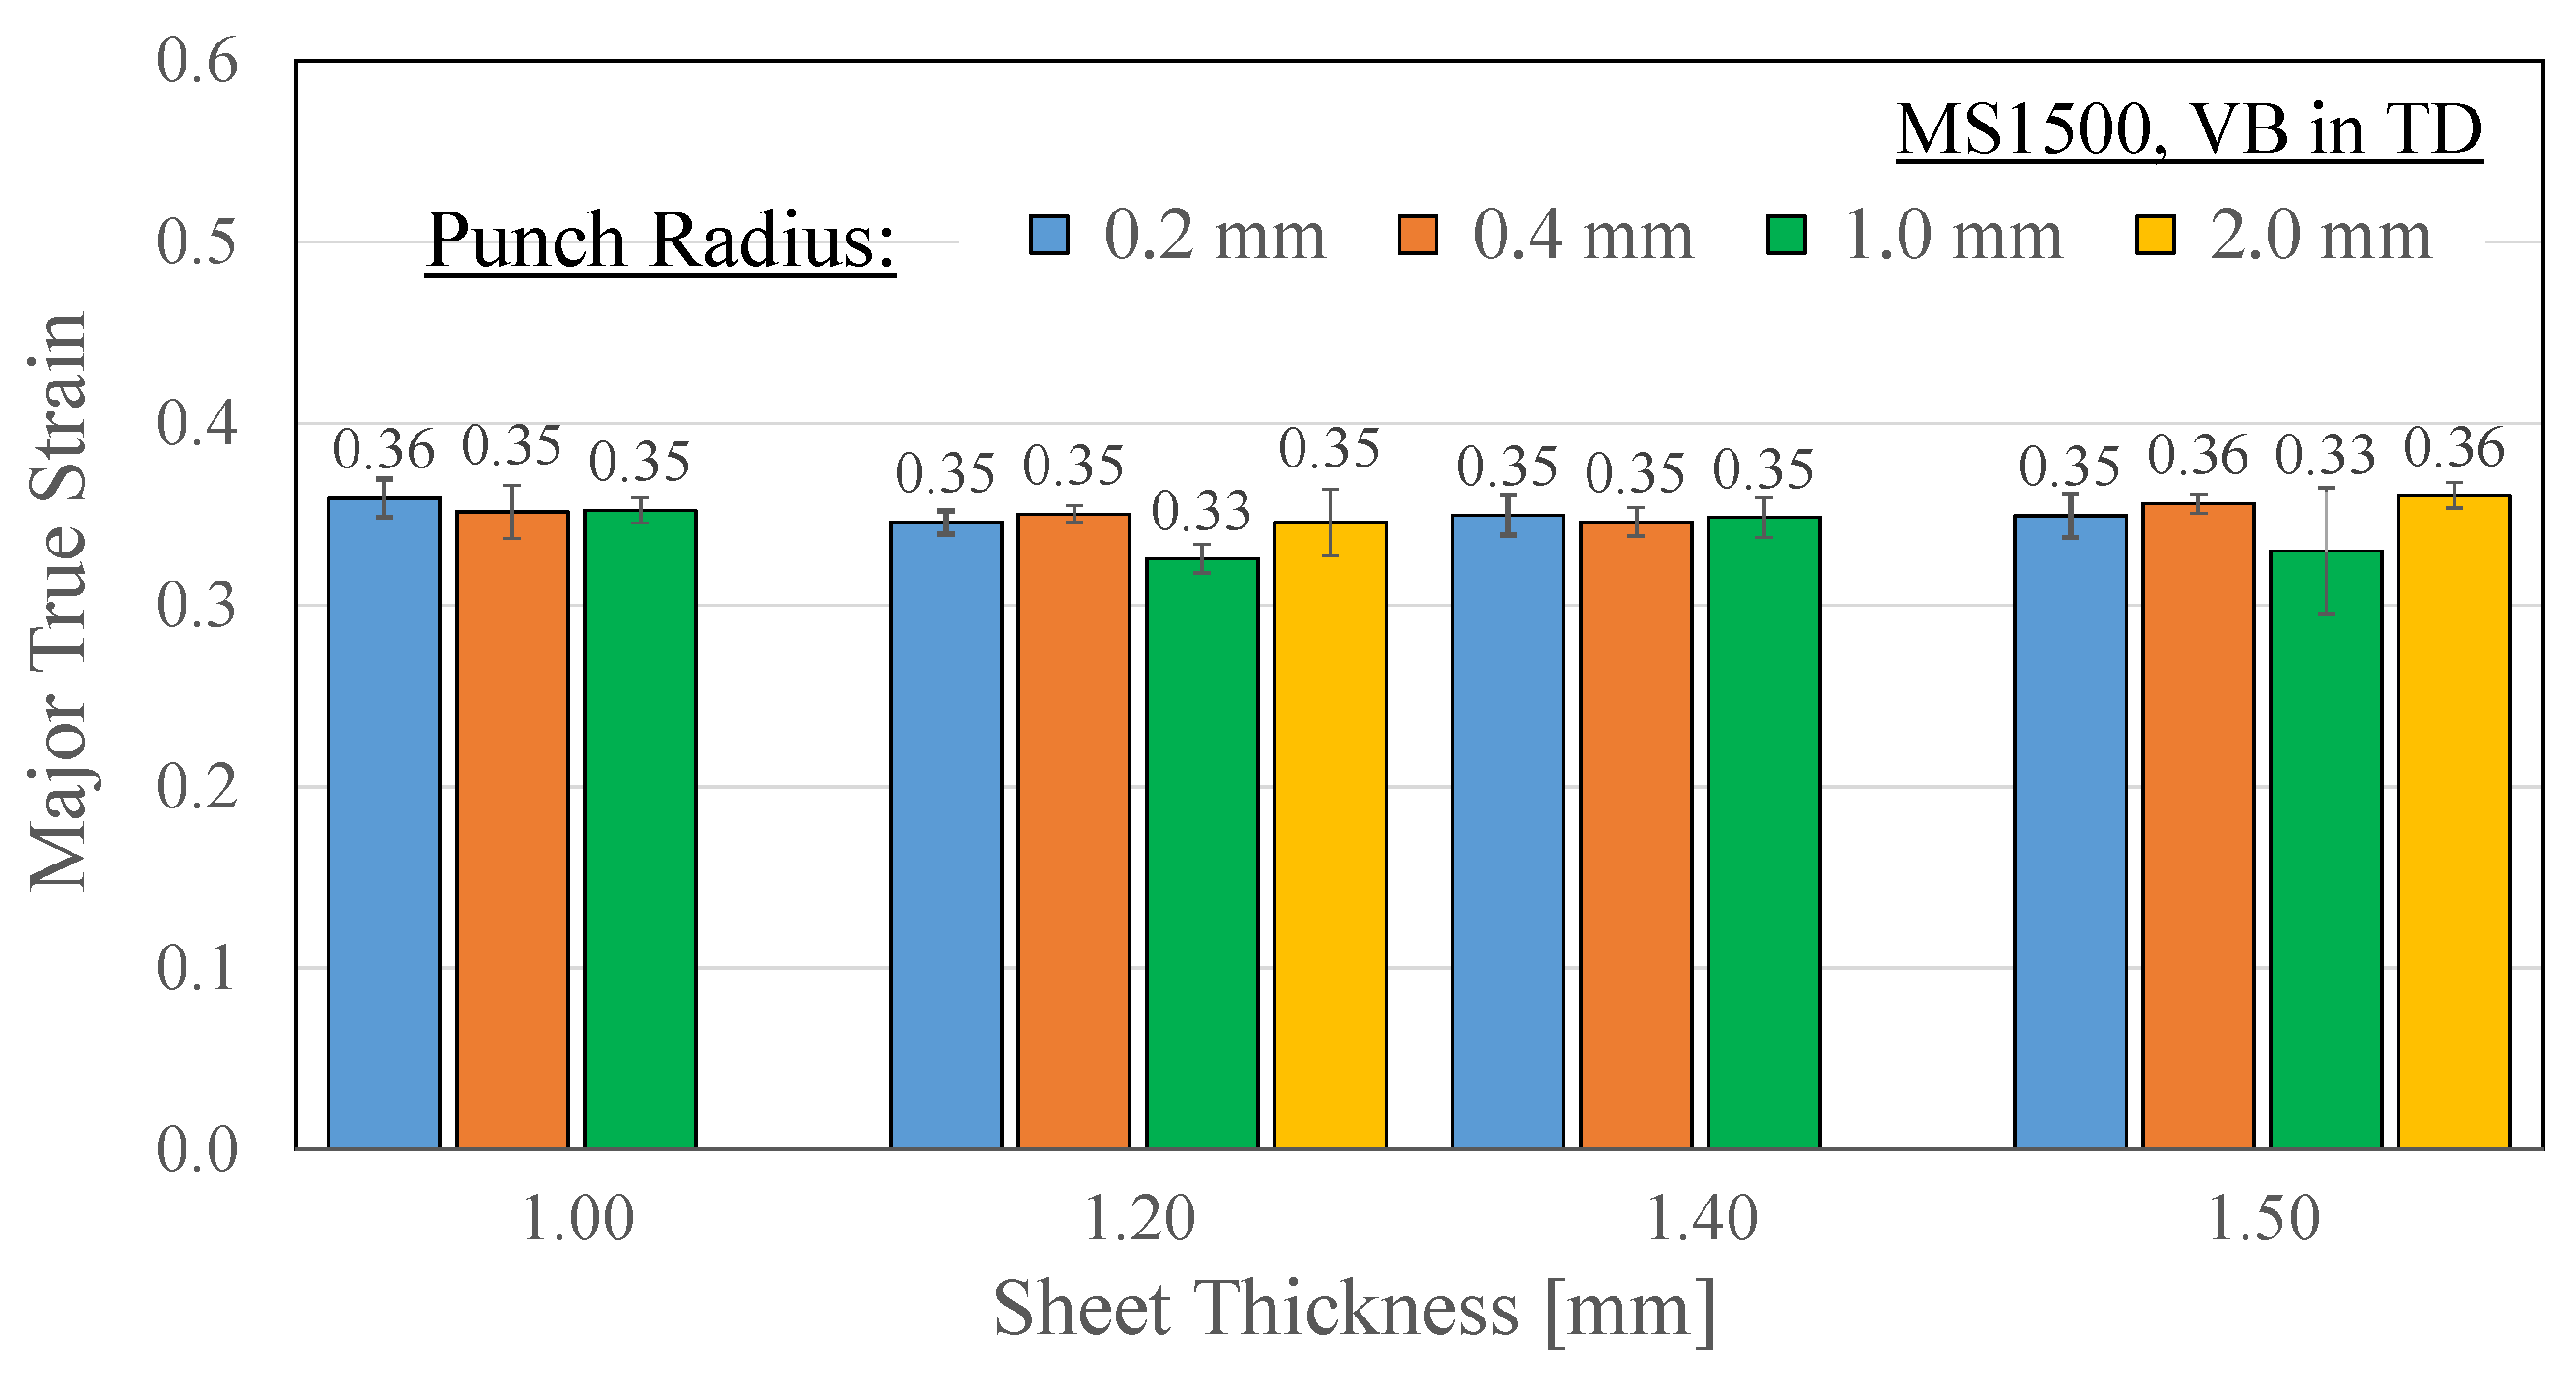
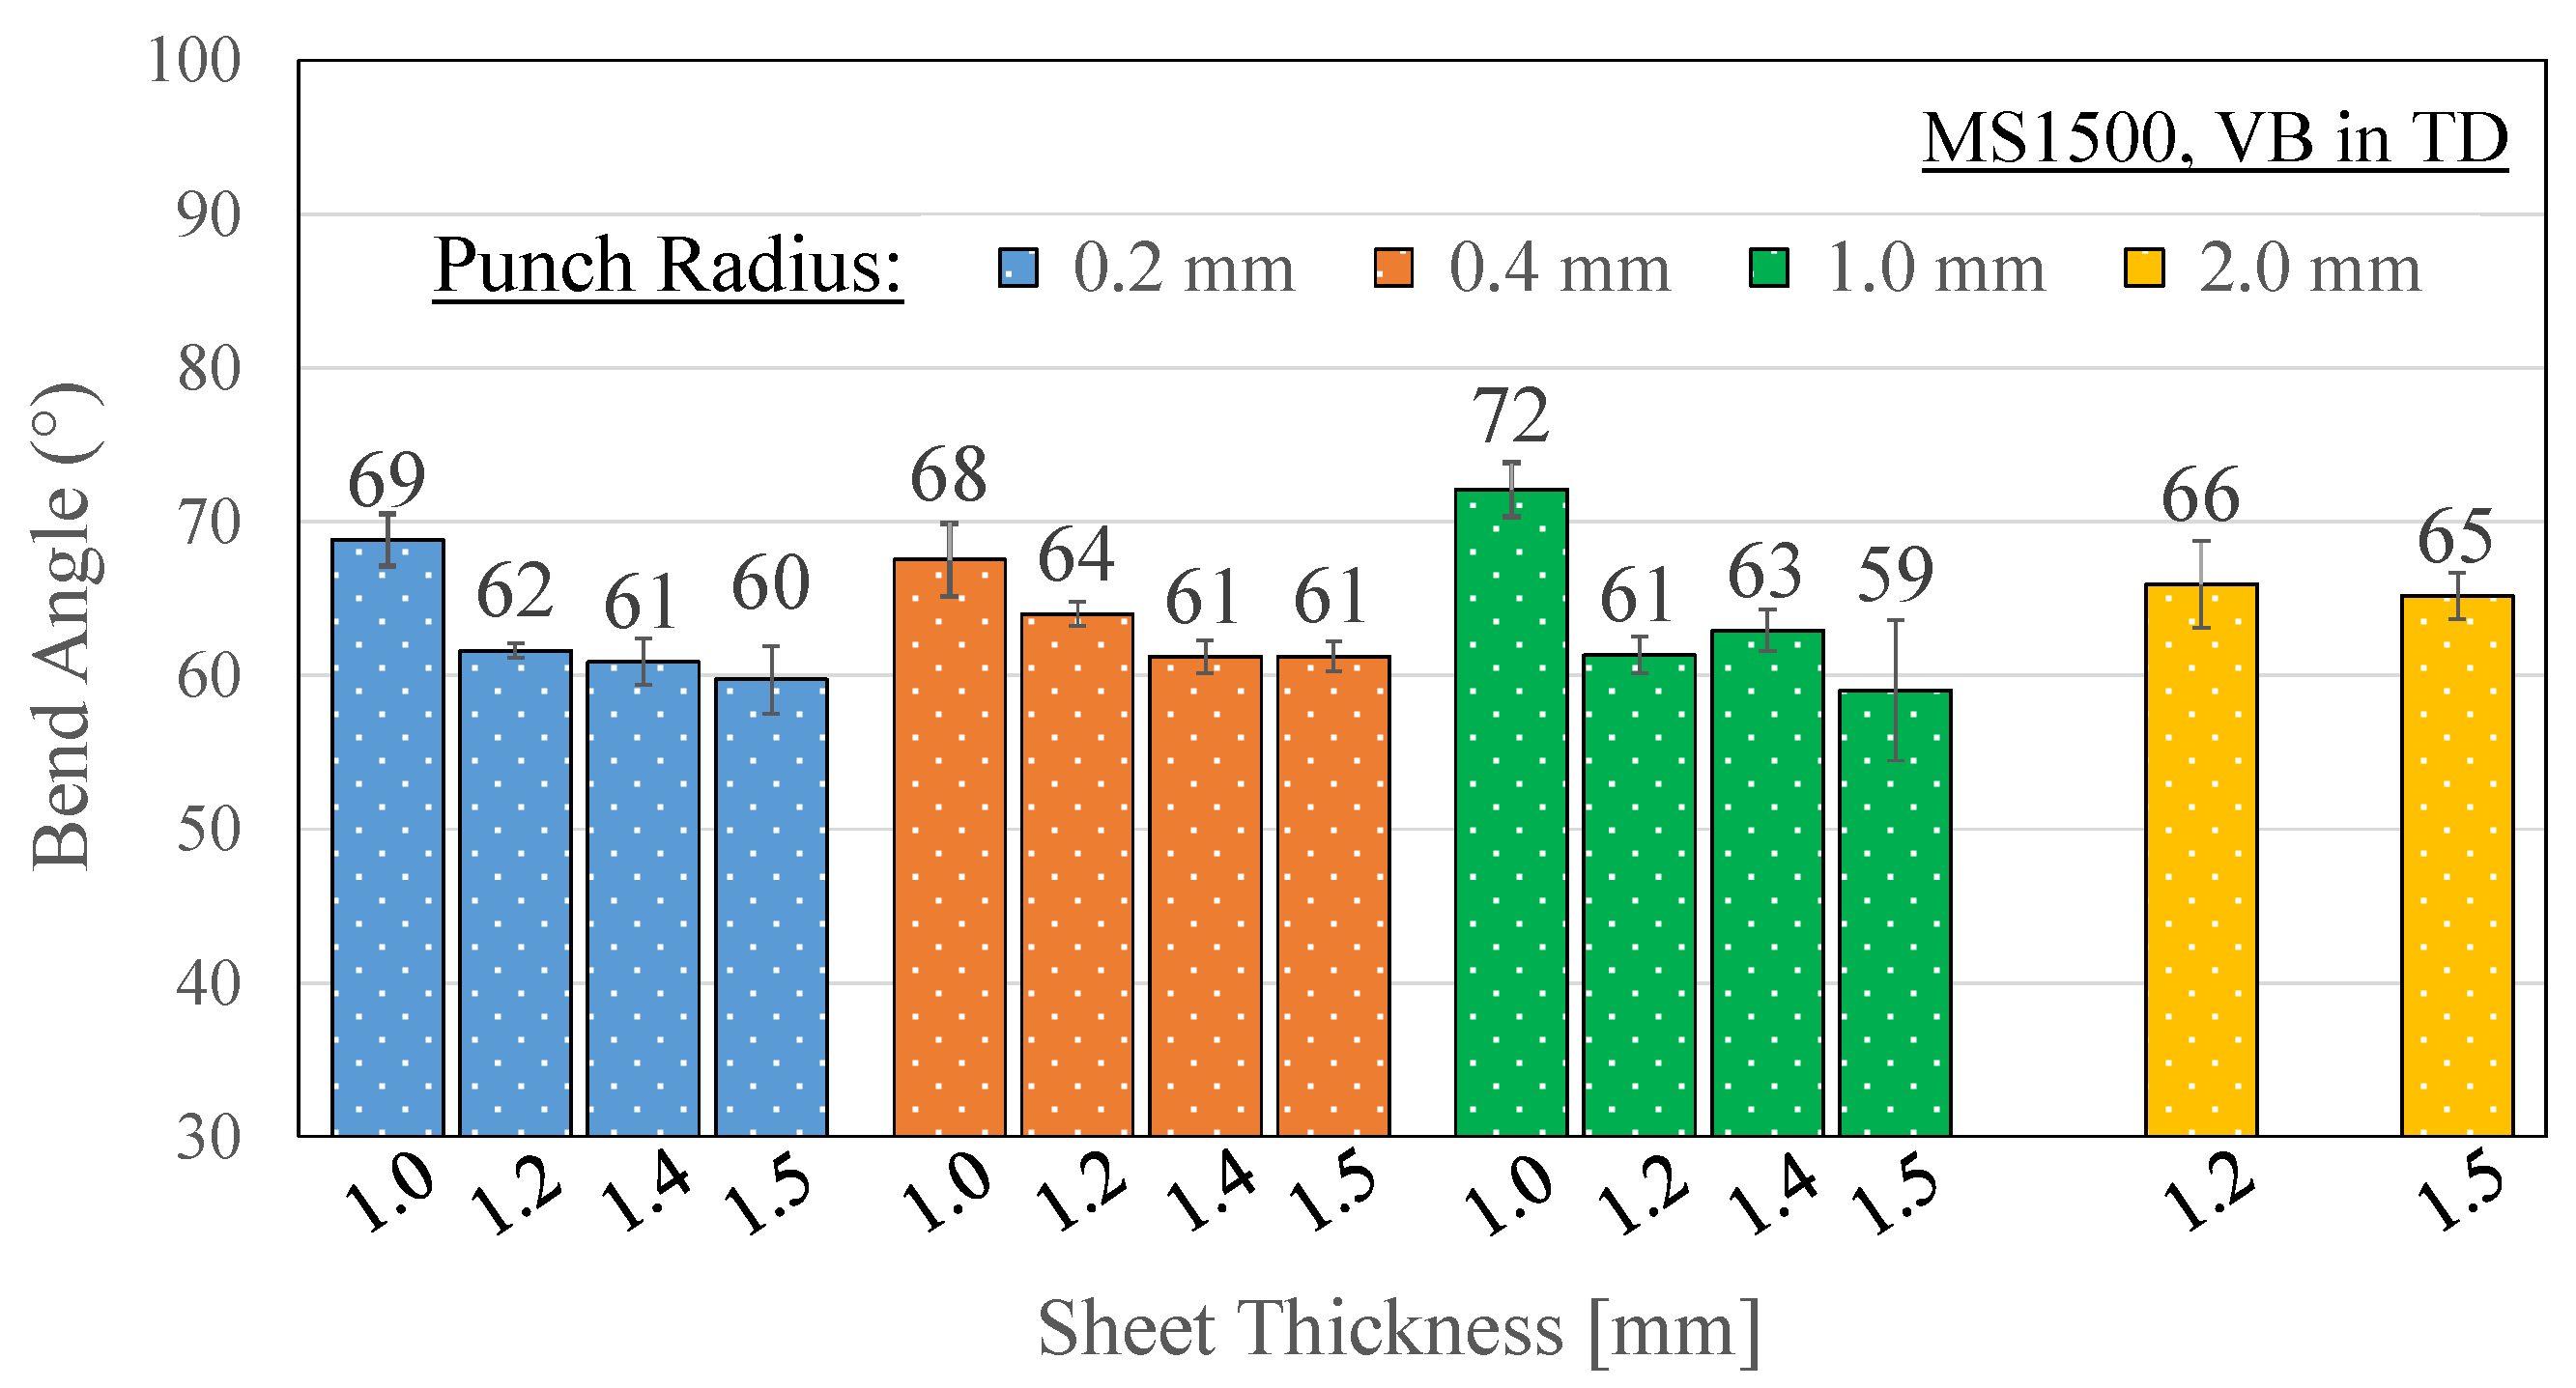
| MS1500 | 1 | 0.36 ± 0.01 | 69 ± 2 | 0.35 ± 0.01 | 68 ± 2 | 0.35 ± 0.01 | 72 ± 2 | L | |
| 1.2 | 0.35 ± 0.01 | 62 ± 0 | 0.35 ± 0.00 | 64 ± 1 | 0.33 ± 0.01 | 61 ± 1 | 0.35 ± 0.02 | 66 ± 3 | |
| 1.4 | 0.35 ± 0.01 | 61 ± 2 | 0.35 ± 0.01 | 61 ± 1 | 0.35 ± 0.01 | 63 ± 1 | L | ||
| 1.5 | 0.35 ± 0.01 | 60 ± 2 | 0.36 ± 0.01 | 61 ± 1 | 0.33 ± 0.03 | 59 ± 5 | 0.36 ± 0.01 | 65 ± 2 | |
| Punch 1 (r = 0.2 mm) | Punch 2 (r = 0.4 mm) | Punch 3 (r = 1.0 mm) | Punch 4 (r = 2.0 mm) | ||||||
|---|---|---|---|---|---|---|---|---|---|
| Material | Thickness [mm] | Fracture Strain | Fracture Bend Angle | Fracture Strain | Fracture Bend Angle | Fracture Strain | Fracture Bend Angle | Fracture Strain | Fracture Bend Angle |
| DP780 | 1 | 0.45 ± 0.02 | 114 ± 3 | 0.44 ± 0.01 | 120 ± 2 | F L | F L | ||
| 1.2 | 0.50 ± 0.01 | 114 ± 2 | 0.45± 0.01 | 113 ± 3 | |||||
| 1.4 | 0.54 ± 0.01 | 122 ± 1 | F | ||||||
| 980-GEN3 | 1.4 | 0.63 ± 0.03 | 135 ± 2 | 0.63 ± 0.02 | 145 ± 3 | F L | F L | ||
| 1.6 | 0.58 ± 0.01 | 128 ± 2 | 0.59 ± 0.02 | 136 ± 2 | |||||
| MP980 | 1 | 0.50 ± 0.01 | 101 ± 2 | 0.48 ± 0.01 | 100 ± 2 | F/L | F L | ||
| 1.2 | 0.51 ± 0.01 | 99 ± 1 | 0.49 ± 0.02 | 98 ± 3 | 0.49 ± 0.06 | 103 ± 10 | |||
| 1.5 | 0.49 ± 0.01 | 92 ± 2 | 0.49 ± 0.01 | 96 ± 2 | 0.49 ± 0.03 | 101 ± 4 | |||
| 1180-GEN3 | 1 | 0.35 ± 0.01 | 91 ± 2 | 0.34 ± 0.02 | 93 ± 1 | 0.36 ± 0.03 | 107 ± 5 | F L | |
| 1.2 | 0.34 ± 0.01 | 81 ± 1 | 0.33 ± 0.01 | 84 ± 1 | 0.34 ± 0.02 | 88 ± 3 | |||
| 1.55 | 0.36 ± 0.01 | 76 ± 1 | 0.35 ± 0.00 | 81 ± 1 | 0.34 ± 0.02 | 83 ± 4 | |||
| MP1180 | 1.2 | 0.32 ± 0.03 | 65 ± 5 | 0.29 ± 0.03 | 63 ± 5 | 0.32 ± 0.01 | 71 ± 1 | L | |
| PHS1500 | 1 | 0.32 ± 0.00 | 68 ± 0 | 0.32 ± 0.03 | 67 ± 3 | 0.32 ± 0.03 | 70 ± 4 | L | |
| 1.2 | 0.34 ± 0.02 | 63 ± 3 | 0.34 ± 0.01 | 66 ± 1 | 0.35 ± 0.00 | 68 ± 0 | 0.34 ± 0.02 | 73 ± 3 | |
| 1.4 | 0.32 ± 0.00 | 60 ± 2 | 0.32 ± 0.03 | 63 ± 0 | 0.32 ± 0.03 | 68 ± 1 | L | ||
| 1.55 | 0.35 ± 0.01 | 63 ± 1 | 0.35 ± 0.01 | 64 ± 1 | 0.34 ± 0.01 | 65 ± 1 | 0.34 ± 0.01 | 69 ± 1 | |
| MS1500 | 1 | 0.36 ± 0.01 | 69 ± 2 | 0.35 ± 0.01 | 68 ± 2 | 0.35 ± 0.01 | 72 ± 2 | L | |
| 1.2 | 0.35 ± 0.01 | 62 ± 0 | 0.35 ± 0.00 | 64 ± 1 | 0.33 ± 0.01 | 61 ± 1 | 0.35 ± 0.02 | 66 ± 3 | |
| 1.4 | 0.35 ± 0.01 | 61 ± 2 | 0.35 ± 0.01 | 61 ± 1 | 0.35 ± 0.01 | 63 ± 1 | L | ||
| 1.5 | 0.35 ± 0.01 | 60 ± 2 | 0.36 ± 0.01 | 61 ± 1 | 0.33 ± 0.03 | 59 ± 5 | 0.36 ± 0.01 | 65 ± 2 | |
| Material | UTS [MPa] | VDA Fracture True Strain | Uniform True Strain | Fracture Bend Angle [°] | Sheet Thickness [mm] | Punch Radius [mm] |
|---|---|---|---|---|---|---|
| 590R M1 [27] | 607 | 0.80 | 0.18 | 163 | 1.6 | 0.2 |
| 590R M2 [27] | 598 | 0.78 | 0.18 | 163 | 1.6 | 0.2 |
| 590R M3 [27] | 671 | 0.77 | 0.13 | 164 | 1.4 | 0.2 |
| D500 25C DQ [27] | 618 | 0.76 | 0.12 | 161 | 1.6 | 0.2 |
| D500 150C DQ [27] | 661 | 0.88 | 0.12 | 160 | 1.6 | 0.2 |
| D500 7C DQ [27] | 744 | 0.99 | 0.10 | 159 | 1.6 | 0.2 |
| DP600 [17] | 645 | 0.48 | 0.14 | 112 | 1.8 | 0.2 |
| DP980 M1 [11] | 1068 | 0.47 | 0.08 | 98 | 1.2 | 0.4 |
| DP980 M2 [11] | 998 | 0.50 | 0.06 | 90 | 1.6 | 0.4 |
| DP980 M3 [11] | 1012 | 0.50 | 0.06 | 95 | 1.4 | 0.4 |
| 980-GEN3 [18] | 991 | 0.43 | 0.10 | 110 | 1.4 | 0.4 |
| DP1180 [14] | 1216 | 0.34 | 0.07 | 74 | 1.0 | 0.4 |
| 1180-GEN3 M1 [18] | 1251 | 0.46 | 0.10 | 96 | 1.4 | 0.4 |
| 1180-GEN3 M2 [18] | 1243 | 0.28 | 0.09 | 59 | 1.4 | 0.4 |
| PHS1500 M1 [18] | 1586 | 0.27 | 0.05 | 62 | 1.2 | 0.4 |
| PHS1500 M2 [17] | 1571 | 0.27 | 0.04 | 52 | 1.6 | 0.4 |
| U1500 AC [25] | 762 | 0.44 | 0.04 | 107 | 1.2 | 0.2 |
| U1500 OC [25] | 1571 | 0.25 | 0.04 | 66 | 1.2 | 0.2 |
| U1500 25C DQ [26] | 1562 | 0.27 | 0.04 | 51 | 1.2 | 0.4 |
| U1500 25C DQ [26] | 1548 | 0.36 | 0.04 | 54 | 1.6 | 0.4 |
| U1500 400C DQ [26] | 826 | 0.59 | 0.04 | 96 | 1.2 | 0.4 |
| U1500 400C DQ [26] | 817 | 0.62 | 0.04 | 113 | 1.6 | 0.4 |
| U1500 400C DQ [26] | 754 | 0.45 | 0.04 | 84 | 1.8 | 0.2 |
| U1500 700C DQ [26] | 662 | 0.58 | 0.04 | 103 | 1.2 | 0.4 |
| U1500 700C DQ [26] | 672 | 0.64 | 0.04 | 117 | 1.6 | 0.4 |
| U1500 700C DQ [26] | 618 | 0.44 | 0.04 | 100 | 1.8 | 0.2 |
References
- Pednekar, V.; Pereira, A.; Ballard, A.; Chen, G.; Komarivelli, R.; Li, H. Structural Performance Comparison between 980MPa Generation 3 Steel and Press Hardened Steel Applied in the Body-in-White A and B-Pillar Parts; (No. 2020-01-0537); SAE Technical Paper; SAE International: Warrendale, PA, USA, 2020. [Google Scholar] [CrossRef]
- Macek, B.; Lutz, J. 3rd Generation AHSS Virtual and Physical Stamping Evaluation; (No. 2020-01-0757); SAE Technical Paper; SAE International: Warrendale, PA, USA, 2020. [Google Scholar] [CrossRef]
- Czerwinski, F. Current trends in automotive lightweighting strategies and materials. Materials 2021, 14, 6631. [Google Scholar] [CrossRef] [PubMed]
- Burd, J.T.J.; Moore, E.A.; Ezzat, H.; Kirchain, R.; Roth, R. Improvements in electric vehicle battery technology influence vehicle lightweighting and material substitution decisions. Appl. Energy 2021, 283, 116269. [Google Scholar] [CrossRef]
- Shen, F.; Wang, H.; Liu, Z.; Liu, W.; Könemann, M.; Yuan, G.; Wang, G.; Münstermann, S.; Lian, J. Local formability of medium-Mn steel. J. Mater. Process. Technol. 2022, 299, 117368. [Google Scholar] [CrossRef]
- VDA 238-100. Test Specification: Plate Bending Test for Metallic Materials; VDA: Berlin, Germany, 2017. [Google Scholar]
- Flores, P.; Tuninetti, V.; Gilles, G.; Gonry, P.; Duchêne, L.; Habraken, A.M. Accurate stress computation in plane strain tensile tests for sheet metal using experimental data. J. Mater. Process. Technol. 2010, 210, 1772–1779. [Google Scholar] [CrossRef]
- Min, J.; Stoughton, T.B.; Carsley, J.E.; Lin, J. Compensation for process-dependent effects in the determination of localized necking limits. Int. J. Mech. Sci. 2016, 117, 115–134. [Google Scholar] [CrossRef]
- Tian, H.; Brownell, B.; Baral, M.; Korkolis, Y.P. Earing in cup-drawing of anisotropic Al-6022-T4 sheets. Int. J. Mater. Form. 2017, 10, 329–343. [Google Scholar] [CrossRef]
- Hou, Z.; Song, W.; Yi, H.; Wang, J.; Min, J. Fracture Strain of Al–Si-Coated Press-Hardened Steels under Plane-Strain Bending. Materials 2022, 15, 7345. [Google Scholar] [CrossRef] [PubMed]
- Cheong, K.; Omer, K.; Butcher, C.; George, R.; Dykeman, J. Evaluation of the VDA 238-100 tight radius bending test using digital image correlation strain measurement. J. Phys. Conf. Ser. 2017, 896, 012075. [Google Scholar] [CrossRef]
- Sato, K.; Sakaidani, T.; Toji, Y.; Takajo, S.; Paton, A.; Manuela, I.; Thiessen, R. Effect of Local Ductility of Advanced High Strength Steels in 980MPa and 1180MPa Grades on Crash Performance of Automotive Structures; (No. 2023-01-0081); SAE Technical Paper; SAE International: Warrendale, PA, USA, 2023. [Google Scholar] [CrossRef]
- Roth, C.C.; Mohr, D. Ductile fracture experiments with locally proportional loading histories. Int. J. Plast. 2016, 79, 328–354. [Google Scholar] [CrossRef]
- Noder, J.; Abedini, A.; Butcher, C. Evaluation of the VDA 238-100 tight radius bend test for plane strain fracture characterization of automotive sheet metals. Exp. Mech. 2020, 60, 787–800. [Google Scholar] [CrossRef]
- Grolleau, V.; Roth, C.C.; Lafilé, V.; Galpin, B.; Mohr, D. Loading of mini-Nakazima specimens with a dihedral punch: Determining the strain to fracture for plane strain tension through stretch-bending. Int. J. Mech. Sci. 2019, 152, 329–345. [Google Scholar] [CrossRef]
- Larour, P.; Hackl, B.; Leomann, F.; Benedyk, K. Bending angle calculation in the instrumented three-point bending test. Proc. IDDRG 2012, 203–215. [Google Scholar]
- Cheong, K.; Butcher, C.; Dykeman, J. The influence of the through-thickness strain gradients on the fracture characterization of advanced high-strength steels. SAE Int. J. Mater. Manuf. 2018, 11, 541–552. [Google Scholar] [CrossRef]
- Noder, J.; Dykeman, J.; Butcher, C. New Methodologies for Fracture Detection of Automotive Steels in Tight Radius Bending: Application to the VDA 238–100 V-Bend Test. Exp. Mech. 2021, 61, 367–394. [Google Scholar] [CrossRef]
- Troive, L. New method for evaluation of bendability based on three-point-bending and the evolution of the cross-section moment. J. Phys. Conf. Ser. 2017, 896, 012006. [Google Scholar] [CrossRef]
- Cai, H.L.; Wang, J.F.; Wu, D.; Yi, H.L. A Simple Methodology to Determine Fracture Strain of Press-Hardened Steels Under Plane Strain Bending. Metall. Mater. Trans. A 2021, 52, 644–654. [Google Scholar] [CrossRef]
- Kim, J.Y.; Hance, B. The Combined Influence of Global and Local Formability on the VDA 238-100 Bending Angle in Advanced High-Strength Steels. In Proceedings of the International Automotive Body Congress, Livonia, MI, USA, 27–29 September 2022. [Google Scholar]
- ISO 12004-2:2008; Metallic Materials, Determination of Forming-Limit Curves in the Laboratory. ISO: Geneva, Switzerland, 2008.
- ISO 7438:2005; Metallic Materials, Bend Test. ISO: Geneva, Switzerland, 2005.
- Volk, W.; Hora, P. New algorithm for a robust user-independent evaluation of beginning instability for the experimental FLC determination. Int. J. Mater. Form. 2011, 4, 339–346. [Google Scholar] [CrossRef]
- Samadian, P.; ten Kortenaar, L.; Omer, K.; Butcher, C.; Worswick, M.J. Fracture characterization of tailored Usibor® 1500-AS and damage modelling based on a coupled-micromechanical-phenomenological strategy. Eng. Fract. Mech. 2020, 223, 106785. [Google Scholar] [CrossRef]
- O’Keeffe, C. Investigation of Resistance Spot Weld Failure in Tailored Hot Stamped Assemblies. Master’s Thesis, University of Waterloo, Waterloo, ON, Canada, 2018. [Google Scholar]
- Noder, J.; Samadian, P.; Dykeman, J.; Abedini, A.; Zhumagulov, A.; Worswick, M.; Butcher, C. New Methods for Fracture Detection of Automotive Steels. In Forming the Future; The Minerals, Metals & Materials Series; Springer: Berlin/Heidelberg, Germany, 2021. [Google Scholar] [CrossRef]


| Material | Sheet Thickness [mm] | |||||
|---|---|---|---|---|---|---|
| 1 | 1.2 | 1.4 | 1.5 | 1.55 | 1.6 | |
| DP780 | ✔ | ✔ | ✔ | |||
| MP980 | ✔ | ✔ | ✔ | |||
| 980-GEN3 | ✔ | ✔ | ✔ | |||
| MP1180 | ✔ | |||||
| 1180-GEN3 | ✔ | ✔ | ✔ | |||
| PHS1500 | ✔ | ✔ | ✔ | ✔ | ||
| MS1500 | ✔ | ✔ | ✔ | ✔ | ||
| Material | Thickness [mm] | Yield Stress [MPa] | UTS [MPa] | Uniform Elongation [%] | Total Elongation [%] | Average r-Value | Major Fracture Strain (DIC) | ||||||
|---|---|---|---|---|---|---|---|---|---|---|---|---|---|
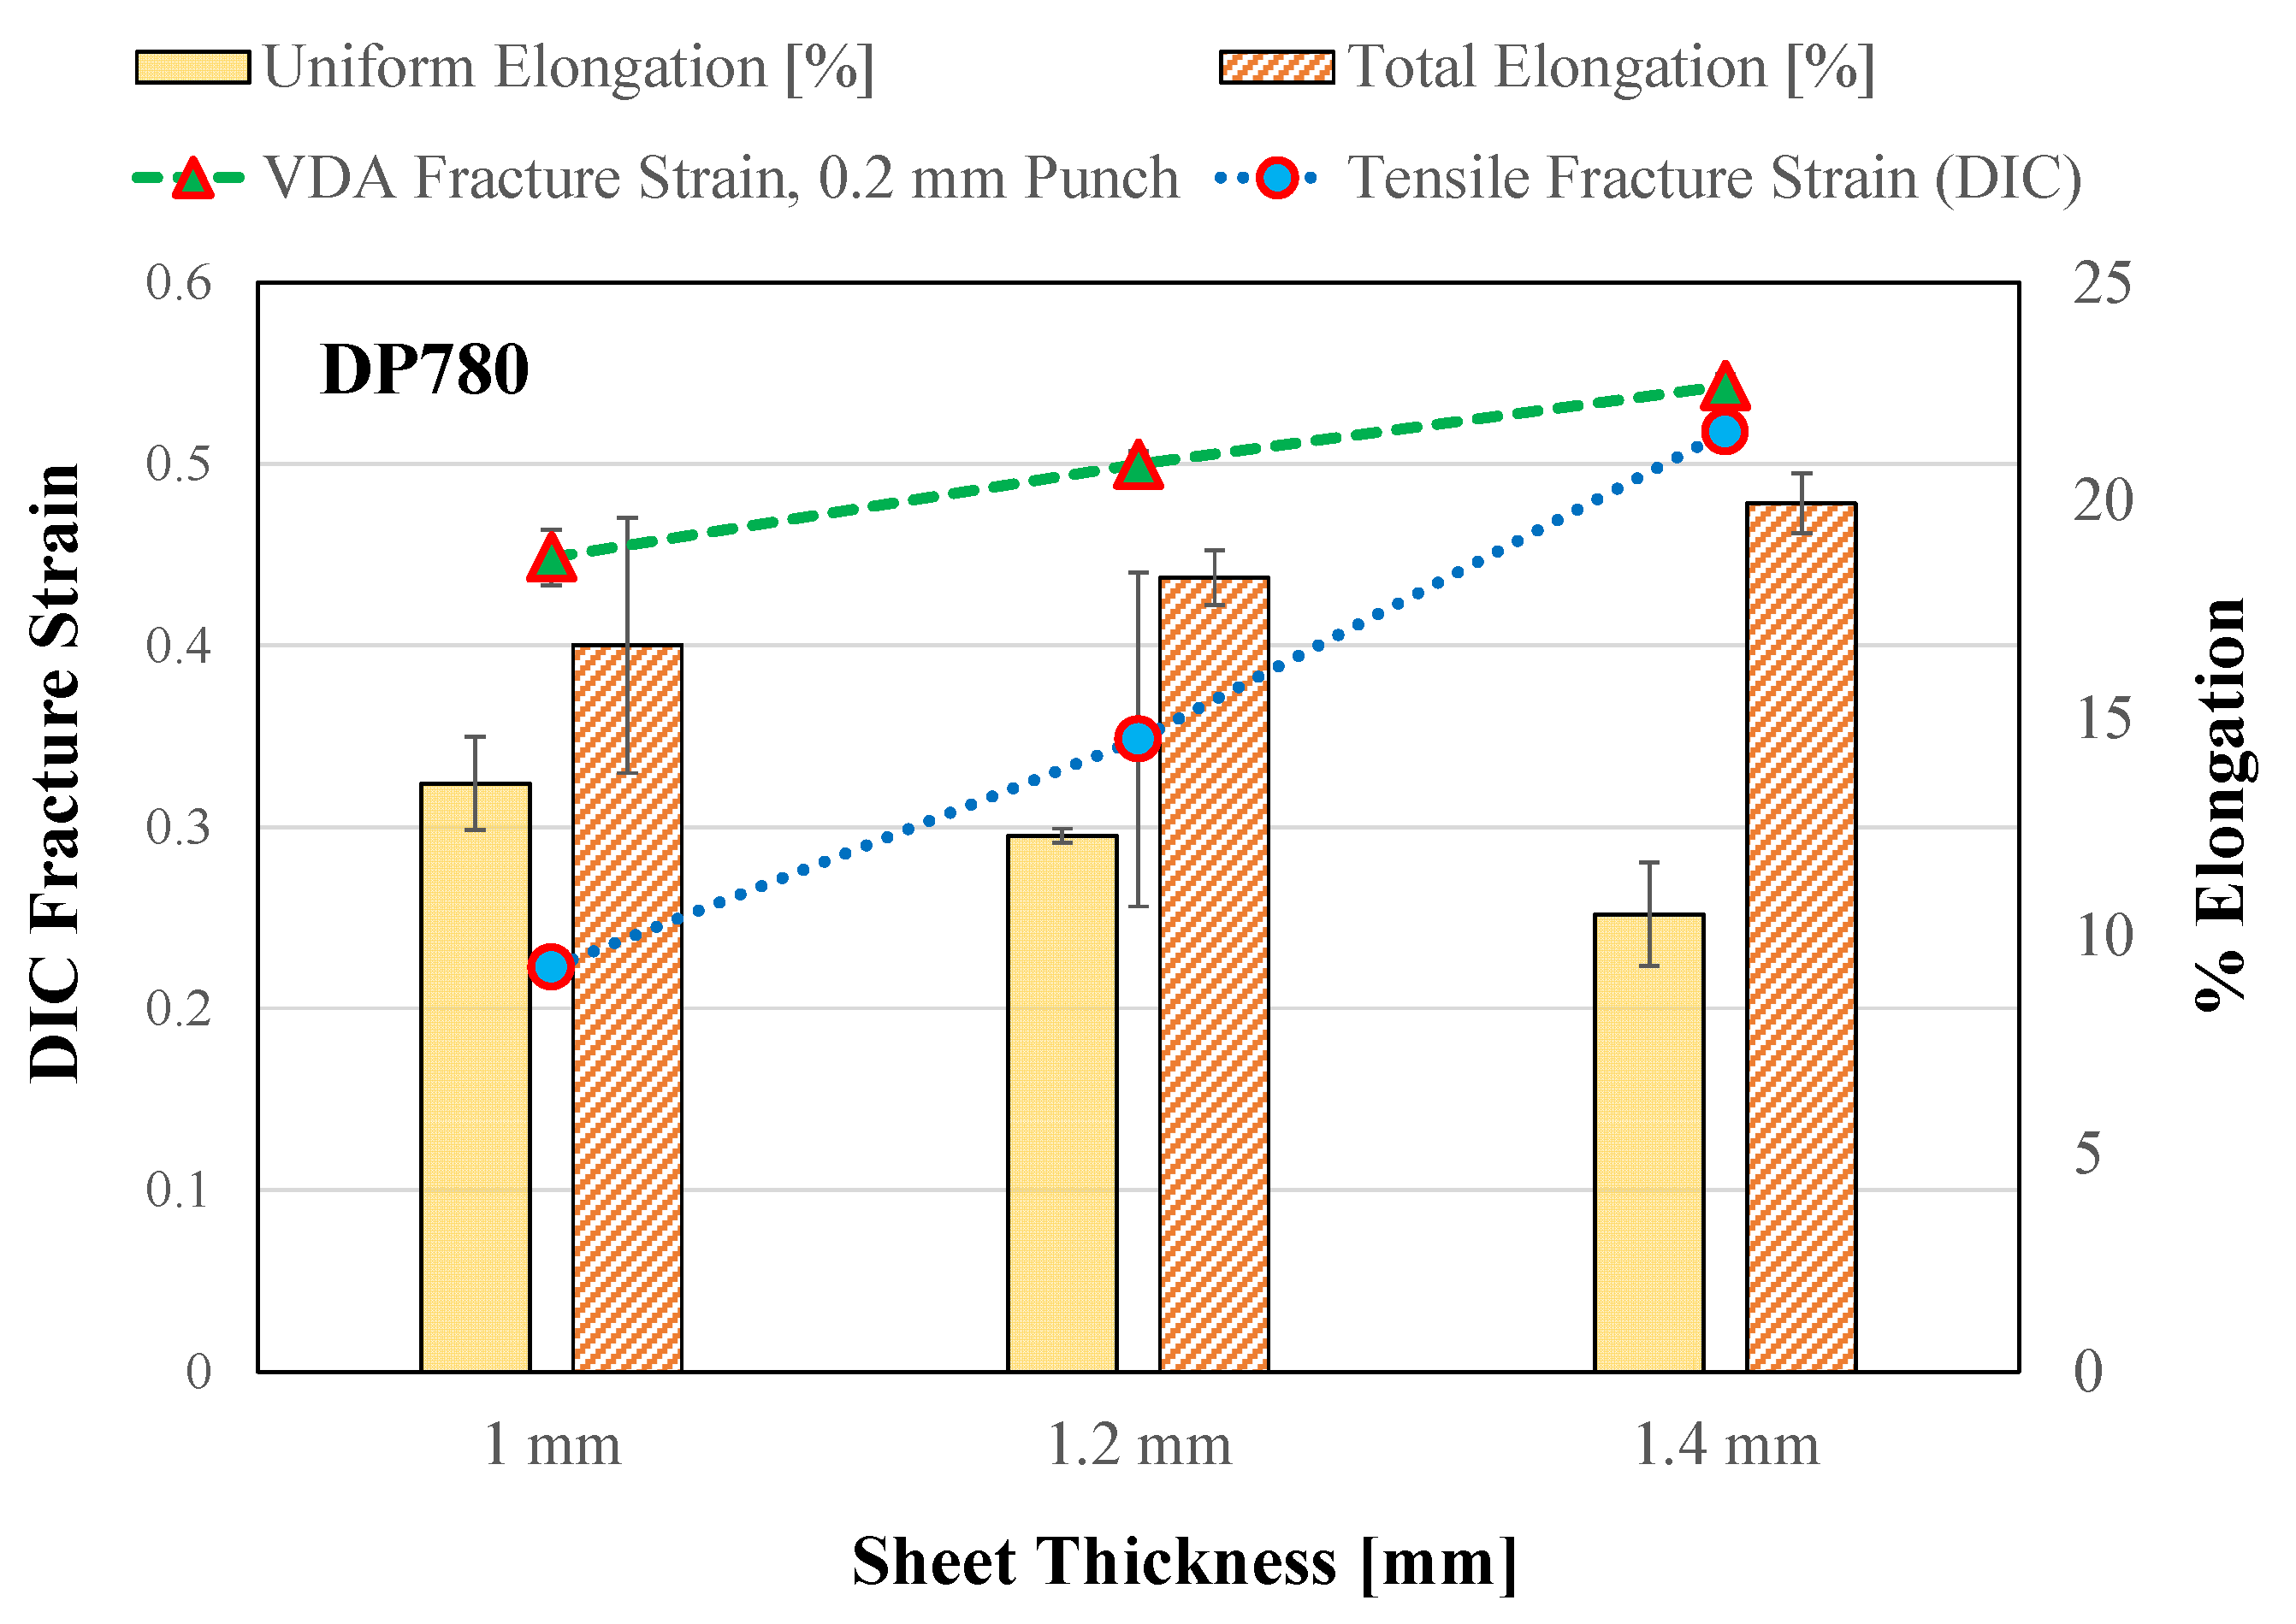
| DP780 | 1 | 528 | ±0 | 858 | ±1 | 14 | ±1 | 17 | ±3 | 0.85 | ±0.00 | 0.22 | ±0.00 |
| 1.2 | 536 | ±1 | 884 | ±1 | 12 | ±0 | 18 | ±1 | 0.90 | ±0.00 | 0.35 | ±0.09 | |
| 1.4 | 493 | ±2 | 824 | ±3 | 10 | ±1 | 20 | ±1 | 0.89 | ±0.01 | 0.52 | ±0.01 | |
| 980-GEN3 | 1 | 692 | ±5 | 1009 | ±0 | 16 | ±0 | 22 | ±0 | 0.94 | ±0.01 | 0.50 | ±0.02 |
| 1.4 | 660 | ±5 | 1017 | ±4 | 15 | ±0 | 21 | ±0 | 0.94 | ±0.00 | 0.52 | ±0.02 | |
| 1.6 | 655 | ±3 | 987 | ±2 | 16 | ±0 | 22 | ±0 | 0.92 | ±0.00 | 0.52 | ±0.02 | |
| MP980 | 1 | 788 | ±4 | 1072 | ±2 | 7 | ±0 | 12 | ±0 | 0.97 | ±0.00 | 0.55 | ±0.03 |
| 1.2 | 751 | ±1 | 1076 | ±4 | 7 | ±1 | 12 | ±1 | 0.91 | ±0.00 | 0.57 | ±0.02 | |
| 1.5 | 715 | ±4 | 1041 | ±2 | 6 | ±0 | 12 | ±0 | 0.91 | ±0.01 | 0.54 | ±0.00 | |
| 1180-GEN3 | 1 | 885 | ±3 | 1220 | ±3 | 12 | ±0 | 17 | ±0 | 1.07 | ±0.01 | 0.45 | ±0.03 |
| 1.2 | 932 | ±9 | 1248 | ±0 | 9 | ±0 | 16 | ±0 | 1.04 | ±0.01 | 0.50 | ±0.02 | |
| 1.55 | 876 | ±5 | 1199 | ±3 | 11 | ±0 | 18 | ±0 | 1.00 | ±0.01 | 0.51 | ±0.01 | |
| MP1180 | 1.2 | 911 | ±20 | 1244 | ±6 | 5 | ±1 | 10 | ±0 | 0.91 | ±0.01 | 0.45 | ±0.01 |
| PHS1500 | 1 | 1084 | ±65 | 1526 | ±4 | 5 | ±0 | 6 | ±0 | 0.81 | ±0.00 | 0.27 | ±0.02 |
| 1.2 | 1145 | ±13 | 1544 | ±10 | 4 | ±0 | 6 | ±0 | 0.86 | ±0.00 | 0.27 | ±0.06 | |
| 1.4 | 1153 | ±6 | 1542 | ±8 | 4 | ±0 | 7 | ±0 | 0.85 | ±0.00 | 0.37 | ±0.00 | |
| 1.55 | 1127 | ±45 | 1523 | ±40 | 4 | ±0 | 7 | ±0 | 0.85 | ±0.00 | 0.38 | ±0.01 | |
| MS1500 | 1 | 1352 | ±16 | 1555 | ±4 | 3 | ±0 | 5 | ±0 | 0.91 | ±0.00 | 0.26 | ±0.03 |
| 1.2 | 1421 | ±2 | 1590 | ±0 | 3 | ±0 | 5 | ±0 | 0.91 | ±0.00 | 0.32 | ±0.03 | |
| 1.4 | 1377 | ±8 | 1582 | ±4 | 3 | ±0 | 6 | ±1 | 0.90 | ±0.00 | 0.30 | ±0.03 | |
| 1.5 | 1392 | ±4 | 1552 | ±5 | 3 | ±0 | 5 | ±0 | 0.91 | ±0.00 | 0.36 | ±0.05 | |
| Material | Thickness [mm] | Punch [mm] | |||
|---|---|---|---|---|---|
| 0.2 | 0.4 | 1.0 | 2.0 | ||
| DP780 | 1 | ✔ | ✔ | F/L | F/L |
| 1.2 | ✔ | ✔ | F/L | F/L | |
| 1.4 | ✔ | F | F/L | F/L | |
| 980-GEN3 | 1 | F | F | F/L | F/L |
| 1.4 | ✔ | ✔ | F/L | F/L | |
| 1.6 | ✔ | ✔ | L | F/L | |
| MP980 | 1 | ✔ | ✔ | F/L | F/L |
| 1.2 | ✔ | ✔ | ✔ | F/L | |
| 1.5 | ✔ | ✔ | ✔ | F/L | |
| 1180-GEN3 | 1 | ✔ | ✔ | ✔ | F/L |
| 1.2 | ✔ | ✔ | ✔ | F/L | |
| 1.55 | ✔ | ✔ | ✔ | L | |
| MP1180 | 1.2 | ✔ | ✔ | ✔ | L |
| PHS1500 | 1 | ✔ | ✔ | ✔ | L |
| 1.2 | ✔ | ✔ | ✔ | ✔ | |
| 1.4 | ✔ | ✔ | ✔ | L | |
| 1.55 | ✔ | ✔ | ✔ | ✔ | |
| MS1500 | 1 | ✔ | ✔ | ✔ | L |
| 1.2 | ✔ | ✔ | ✔ | ✔ | |
| 1.4 | ✔ | ✔ | ✔ | L | |
| 1.5 | ✔ | ✔ | ✔ | ✔ | |
| Materials | DP780 | 980-GEN3 | MP980 | 1180-GEN3 | MP1180 | PHS1500 | MS1500 |
|---|---|---|---|---|---|---|---|
| Avg. % Difference | 21.0% | 10.3% | −0.6% | 12.1% | −1.2% | 20.7% | 1.1% |
| Punch Radius Range | 0.2–0.4 mm | 0.2–0.4 mm | 0.2–1.0 mm | 0.2–1.0 mm | 0.2–1.0 mm | 0.2–2.0 mm | 0.2–2.0 mm |
| Regression Analysis | |||||
| Variables | Coefficients | Standard Error | 95% CI | t Stat | p-Value |
| UTS | −0.0455 | 0.0095 | (−0.06, −0.03) | −4.78 | 1.47 × 10⁻⁵ |
| εu | 317.80 | 59.62 | (198, 437) | 5.33 | 2.15 × 10⁻⁶ |
| εDIC,fracture | −2.88 | 13.74 | (−30.46, 24.7) | −0.21 | 0.83 |
| t/Rp | −0.70 | 0.54 | (−1.77, 0.38) | −1.30 | 0.20 |
| Intercept | 125.44 | 18.72 | (88, 163) | 6.70 | 1.48 × 10⁻⁸ |
| 95% Confidence and Prediction Interval | |||||
| Significance | n | Mean | SSx | Syx | t-critical |
| 0.05 | 57 | 82.79 | 30423 | 7.99 | 2.00 |
| Regression Analysis | |||||
| Variables | Coefficients | Standard Error | 95% CI | t Stat | p-Value |
| UTS | −0.0126 | 0.0041 | (−0.0208, −0.0044) | −3.08 | 3.26 × 10⁻³ |
| εu | 299.00 | 24.69 | (249, 349) | 12.11 | 9.40 × 10⁻¹⁷ |
| εVDA | 137.35 | 8.70 | (120, 155) | 15.78 | 1.79 × 10⁻²¹ |
| t/Rp | −1.33 | 0.23 | (−1.78, −0.88) | −5.89 | 2.83 × 10⁻⁷ |
| Intercept | 30.58 | 8.53 | (13.47, 47.69) | 3.59 | 7.40 × 10⁻⁴ |
| 95% Confidence and Prediction Interval | |||||
| Significance | n | Mean | SSx | Syx | t-critical |
| 0.05 | 57 | 82.79 | 30423 | 3.53 | 2.00 |
| Regression Analysis | |||||
| Variables | Coefficients | Standard Error | 95% CI | t Stat | p-Value |
| UTS | 3.56 × 10⁻⁵ | 2.90 × 10⁻⁵ | (−2.26 × 10⁻⁵, 9.39 × 10⁻⁵) | 1.23 | 0.22 |
| εu | −1.78 | 0.20 | (−2.18, −1.37) | −8.72 | 9.40 × 10⁻¹⁷ |
| αfracture | 0.0060 | 0.0004 | (0.0053, 0.0068) | 15.78 | 1.79 × 10⁻²¹ |
| t/Rp | 0.0088 | 0.0015 | (0.0058, 0.0118) | 5.88 | 2.97 × 10⁻⁷ |
| Intercept | −0.0679 | 0.0623 | (−0.19, 0.06) | −1.09 | 0.28 |
| 95% Confidence and Prediction Interval | |||||
| Significance | n | Mean | SSx | Syx | t-critical |
| 0.05 | 57 | 0.39 | 0.43 | 0.0228 | 2.00 |
| Regression Analysis | |||||
| Variables | Coefficients | Standard Error | 95% CI | t Stat | p-Value |
| εu | −1.87 | 0.15 | (−2.17, −1.57) | −12.33 | 2.47 × 10⁻¹⁷ |
| αfracture | 0.0058 | 0.0001 | (0.0056, 0.0061) | 40.11 | 7.15 × 10−42 |
| t/Rp | 0.0087 | 0.0014 | (0.0059, 0.0114) | 6.23 | 7.36 × 10⁻⁸ |
| 95% Confidence and Prediction Interval | |||||
| Significance | n | Mean | SSx | Syx | t-critical |
| 0.05 | 57 | 0.39 | 0.43 | 0.0234 | 2.00 |
| Material | Thickness [mm] | Material Condition |
| 590R M1 − M3 | 1.4, 1.6 | 590R from different suppliers |
| D500 25C DQ | 1.6 | Ductibor®500, 25 °C die-quenched |
| D500 150C DQ | 1.6 | Ductibor®500, 150 °C die-quenched |
| D500 7C DQ | 1.6 | Ductibor®500, 7 °C die-quenched |
| DP980 M1 − M3 | 1.2, 1.4, 1.6 | DP980 from different suppliers |
| 1180-GEN3 M1 − M2 | 1.4 | 1180 3rd gen. from different suppliers |
| PHS1500 M1 − M2 | 1.2, 1.6 | Press-hardened steel from different suppliers |
| U1500 AC | 1.2 | Usibor®1500, air-cooled |
| U1500 OC | 1.2 | Usibor®1500, oil-cooled |
| U1500 25C DQ | 1.2, 1.6 | Usibor®1500, 25 °C die-quenched |
| U1500 400C DQ | 1.2, 1.6, 1.8 | Usibor®1500, 400 °C die-quenched |
| U1500 700C DQ | 1.2, 1.6, 1.8 | Usibor®1500, 700 °C die-quenched |
Disclaimer/Publisher’s Note: The statements, opinions and data contained in all publications are solely those of the individual author(s) and contributor(s) and not of MDPI and/or the editor(s). MDPI and/or the editor(s) disclaim responsibility for any injury to people or property resulting from any ideas, methods, instructions or products referred to in the content. |
© 2023 by the authors. Licensee MDPI, Basel, Switzerland. This article is an open access article distributed under the terms and conditions of the Creative Commons Attribution (CC BY) license (https://creativecommons.org/licenses/by/4.0/).
Share and Cite
Cheong, K.; Noder, J.; Zhumagulov, A.; Butcher, C. Characterization and Prediction of Plane Strain Bendability in Advanced High-Strength Steels. Metals 2023, 13, 1711. https://doi.org/10.3390/met13101711
Cheong K, Noder J, Zhumagulov A, Butcher C. Characterization and Prediction of Plane Strain Bendability in Advanced High-Strength Steels. Metals. 2023; 13(10):1711. https://doi.org/10.3390/met13101711
Chicago/Turabian StyleCheong, Kenneth, Jacqueline Noder, Amir Zhumagulov, and Clifford Butcher. 2023. "Characterization and Prediction of Plane Strain Bendability in Advanced High-Strength Steels" Metals 13, no. 10: 1711. https://doi.org/10.3390/met13101711
APA StyleCheong, K., Noder, J., Zhumagulov, A., & Butcher, C. (2023). Characterization and Prediction of Plane Strain Bendability in Advanced High-Strength Steels. Metals, 13(10), 1711. https://doi.org/10.3390/met13101711