Abstract
The current research on metallurgical remains from scientific excavations in northeast Yunnan from the Bronze Age period is insufficient. In order to study the smelting technology of the Bronze Age in north-eastern Yunnan, samples of slag and mineral excavated from the Yubei Di site in Dongchuan were examined. Based on the outcome of the characterization analysis, a simulation was executed utilizing the software Factsage 7.1 in order to generate a phase diagram that accurately portrays the melting procedure. This simulation aimed to produce the most credible representation of the phase transition by employing computational methods. Characterisation methods included Metallographic Microscopy, Scanning Electron Microscopy Energy Dispersive Spectromicropy (SEM-EDS), X-ray diffraction (XRD), and Radiocarbon Date (14C dating). The results showed that there was much copper ore left in the slag of the site. Most of these copper ores were in the form of copper ferrite or cuprous oxide. The copper ore was copper oxide ore, and metal copper particles appeared in a small amount of the slag. Most of the slags unearthed from the site of the Yubeidi site were products of sulfur-containing oxide reduction and smelting into copper. Based on the outcomes of the simulations, it was established that the slag excavated from the Yubeidi site was mainly from the reduction and smelting process of sulphur-containing copper oxide minerals into copper, without consciously adding fluxes, not having mastered the slag-making techniques for different types of copper ores, and with primitive techniques. The carbon 14 dating results show that the age of the slag was during the Spring and Autumn Period and the Warring States Period.
1. Introduction
Metallurgical archaeology is a branch of archaeology that focuses on studying ancient metal production and metalworking technologies. It involves the investigation of artefacts and structures related to metal extraction, refining, smelting, casting, and shaping. This field helps to reconstruct past cultures and civilisations, their economic activities, and technological advancements. The period of Spring and Autumn and the period of Warring States Period was the critical stages for the gradual development and rapid growth of bronze civilisation in northeast Yunnan, and its advanced smelt-ing and casting technology was also the main driving factor for Yunnan became one of the stable centres of civilisation in East Asia since the Bronze Age.
Using slag as an analytical object to study ancient metallurgical activities was first initiated by Beno Rothenberg in the 1960s [1]. The first hypothesis for copper smelting and refining was constructed by Hans-Gert. Bachmann [2], Alexandru Lupu [3], and Ronald F. Tylocate [4]. Meanwhile, metallurgists G. R. Morton and J. Wingrove published their research on medieval bloomery slag from Rome and England, determining these slags’ mineral and chemical composition [5]. F. Koucky and A. Steinberg analysed pre-historic copper slag from Cyprus [6]. The work of these early researchers laid the foundation for slag analysis research. Bachmann established the standards for slag research through his study of Timna.
Researchers have verified the ancient smelting methods from the study of the composition and microstructure of the slag. The main characterization methods are XRF, SEM-EDS and XRD [7,8,9,10]. Furthermore, the smelting of ancient Cu-As bronze was also studied through simulation experiments, in this study, the researchers considered the thermodynamic equilibrium in the reaction system for the first time [11].
Although some results have been obtained by previous researchers, the characterisation methods they used are somewhat simpler. The characterisation results were merely statistical and did not calculate the oxygen potential and slag melting point of the smelting process strictly based on metallurgical physicochemical principles. The examination of the utilisation of metals in the Yunnan Bronze Age civilisation involves the computation and simulation of ancient copper smelting processes through the analysis of slag composition. This study aims to enhance our understanding of the utilisation of metals during this historical period.
A recent analysis of metallurgical remains from the Yubeidi site intends to reveal the early metallurgical technology of northeastern Yunnan and the entire Yunnan region, thereby providing new scientific evidence for the development of metallurgy in Yunnan during the Bronze Age and its links with early civilisations and complex societies.
Computer simulation of metallurgical calculations is a method that utilises computer programs to simulate the metallurgical process in order to predict the performance of the metallurgical system and study the physical and chemical changes that occur during the metallurgical reaction process. This method can be used to research new metallurgical processes, increase metallurgical production efficiency, reduce energy consumption, and, particularly, optimise the metallurgical process and predict the performance of the metallurgical system. It can draw complex metallurgical phase diagrams based on the results of the characterisation of slag and provide important information to researchers regarding metallurgical processes.
The metal pyrometallurgy systems of non-ferrous are high-temperature, multi-phase, multi-component coupled complex reactions that involve a wide range of thermodynamic data and are tedious and time-consuming to calculate. Thermodynamic simulation software provides a simple and fast way for researchers to do this. Computer simulation of metallurgical calculations, combined with scientific analysis of slag composition based on excavated artefacts, can provide comprehensive insights into related metallurgical technologies and enable mineral accurate determination of the properties of the archaeological site.
2. Materials and Methods
2.1. The Archaeological Background of the Samples
The site is located on the west side of Provincial Road 209, 3 km west of Xiaojiang River, a tributary of the Jinsha River, at an altitude of 1400 m. The whole site is located on a high terrace behind the Yubeidi village, the geographical location and the distant view of the site are shown in Figure 1 and Figure 2.
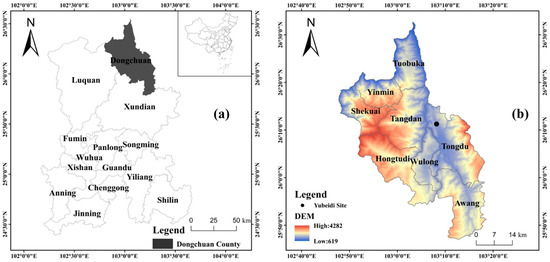
Figure 1.
(a) Location and (b) topographic map of Dongchuan County. The Yubeidi site is marked with a black spot in (b).
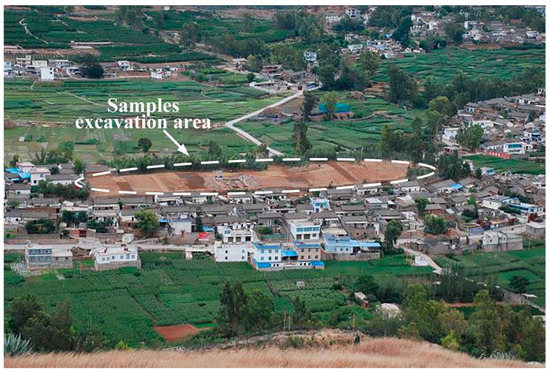
Figure 2.
Aerial view of the Yubeidi site.
Many potteries were unearthed at the site of Yubeidi, of which pottery pots accounted for the vast majority. From the combination and shape of pottery, the pottery characteristics of the Yubeidi site are significantly different from those of the Shizhaishan culture in the Dianchi basin [12], showing a strong regional nature. The unearthed pottery is shown in Figure 3.
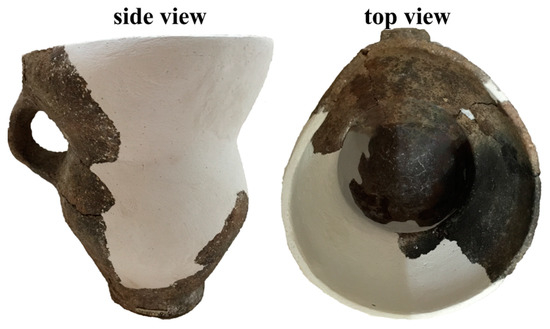
Figure 3.
Unearthed pottery from the site the Yubeidi site.
Both strata and relics contained a large amount of ash, and a large number of slags, copper minerals, and a small amount of pottery were unearthed. Although limited by the excavation area, relics such as smelting furnaces and crucibles have not been found. Some houses of different shapes may be places for craftsmen to live in, while others may be smelting and casting workshops. The tested slag and ores used are shown in Figure 4.
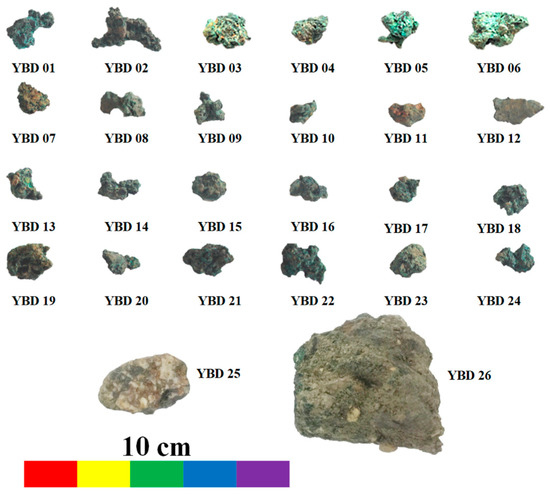
Figure 4.
Unearthed slag and ores from the site the Yubeidi site.
The 26 samples excavated from the site include 24 small, irregularly shaped green particles, which are interspersed with brown or black small particles and have many tiny pores on the surface, indicating high-temperature melting. The remaining 2 samples are larger in size, with a surface color of copper green and some vein inclusions, suggesting they have not undergone high-temperature melting.
2.2. Characterization Methods
2.2.1. Metallographic Inspection
The samples were thoroughly cleaned with distilled water, inlaid with epoxy resin, smoothed in turn with coarse to fine water sandpaper and polished with a polisher to a level suitable for metallographic observation.
Observations were made under a metallographic microscope (Leica DM4000M, Wetzlar, Germany), and the location of the critical observations were recorded. The external camera of the metallographic microscope has a resolution of 3 megapixels and takes metallographic photographs in the bright field function.
2.2.2. Scanning Electron Microscope and X-ray Energy Dispersy Spectrum (SEM-EDS)
A TESCAN VEGA 3XMU SEM (TESCAN, Brno, Czech Republic) with a Bruker Energy Dispersy Spectrum (Bruker, Billerica, MA, USA) was used to observe the matrix phase of the slag samples and the copper-bearing particles.
After metallographic testing, the surface of the sample was sprayed with carbon and then subjected to scanning electron microscopy energy spectroscopy. In this case, a scanning electron microscope, operating at 20 kV, is used in conjunction with an X-ray energy spectrometer. The composition of the slag was tested separately for matrix and inclusions and photographed under the backscatter function. Each sample was subjected to multiple face analyses depending on the homogeneity of the matrix. For inclusions and special phases, the composition was examined by point scanning. Magnification was an integer multiple of 10 where possible. Each specimen was scanned according to the degree of matrix homogeneity or the distribution of inclusions, with a scanning time of at least 60 s for each area of the field of view. The spectroscopy was a quantitative analysis without a standard sample, and the composition content was expressed as a percentage by weight (wt%). A residence time of 120 s per energy analysis was required for copper-based samples containing minor or trace elements.
2.2.3. X-ray Diffraction (XRD)
XRD allows for qualitative analysis of the physical composition of the sample. Mineral samples were hand crushed to 200 mesh for XRD analysis. The samples were prepared by hand due to sample quality and size constraints. Analysis was carried out using an Ultima IV X-ray diffraction analyser (Rigaku, Tokyo, Japan). Detector: Graphite monochromator, D/teX-Ultra high-speed detector. Test conditions: scanning voltage of 40 kV, scanning current of 40 mA, continuous scanning mode, scanning range (2θ) 10° to 90°, scanning rate 10° min−1.
2.2.4. Radiocarbon Date
The samples were first cleaned by having the soil colouration, sediment detritus, and weathered surfaces scraped off with a scalpel. After that, samples were rinsed off three times with MilliQ™-water, spun in a centrifuge, and left to dry for three days at 35 °C. Roughly grind these samples into powder smaller than 60 meshes (0.3 mm), decalcify them with 0.2 M HCl for 48 h, dehumidify them with 0.025 M NaOH for 24 h to remove modern organics and humic acids, and dehumidify them with 0.05 M HCl for 24 h to remove any CO2. The third step is to absorb it from the atmosphere. The samples were washed with deionized water (MilliQ™ water) to make them have a neutral pH and then dried for about 48 h at 35 °C. The subsamples were placed into quartz tubes, and then Ag and excess grainy CuO were added. The samples in quartz tubes were pumped to vacuum, sealed with a torch, and combusted at 850 °C in a muffle furnace for 2 h to transform the organic carbon into CO2 gas. The CO2 was then purified using a cryogenic process. Milligrams of carbon were used in the form of carbon dioxide for graphitization. About 1.0 mg C as CO2 was used for graphitization.
The C-14 data were dated by the C-14 Laboratory of the School of Archaeology and Antiquities, Peking University. Both the 14C/12C and 13C/12C isotopic ratios were measured for each graphite target, with NIST HOXI being used as the normalisation standard.
The measurement was performed using the NEC (National Electrostatics Corpo-ration) 14C-AMS (Accelerator Mass Spectrometer) with a 0.5 MV tandem accelerator and 1.5 SDH-1. The spectrometer is equipped with 134 solid ion source sample plates (134-MC-SNIC) and a gas ion source. The pre-treatment platform includes an automatic graphite target system (AGE3), a preparation of a gas phase (PC-GC), and a spec-trometry-guided preparation of a liquid phase (Prep-LC-MS). The measurement accuracy is better than 0.4%, which is equivalent to plus or minus 30 years of chronological measurement error.
2.2.5. Thermodynamic Software Simulation
Factsage 7.1 is a software used in metallurgical and materials science. It is a database that provides information on thermodynamic, electrochemical, and chemical equilibria and is used to predict the behaviour of materials and the results of metallurgical processes. The software uses thermodynamic data, reaction information, and other parameters to predict the behaviour of materials under various conditions and to calculate phase equilibria diagrams, activity diagrams, and other properties.
3. Characterization Results
3.1. Matrix Composition of Samples
After testing, the composition of the slag matrix is shown in Table 1, and the samples are overall high in Cu.

Table 1.
Chemical composition of slag from Yubeidi site.
The samples were divided into three categories based on the occurrence state of the Cu-phase and the Cu content of the slag. These were roasted oxidized copper minerals, slag with no detectable copper metal, and slag with metallic copper particles.
3.2. Microzone Composition and Metallographic Examination of Samples
3.2.1. Roasted Oxidized Copper Ore
The I category of samples contains YBD01, YBD02, YBD03, YBD06, YBD10, YBD13, and YBD19, which are all roasted copper oxide minerals.
YBD01 was mixed with incompletely burned charcoal particles and Cu2S (chalcocite) [13] particles. YBD02 contained net-like charcoal particles. YBD03 contained Cu5FeS4 (bornite) [14] particles, and the edges of the Cu5FeS4 (bornite) particles were wrapped in Cu2S (chalcocite). YBD06 contained Cu2S (chalcocite) particles. YBD10 contained CuFeS2 (chalcopyrite) [15] particles and fine Cu2S (chalcocite) particles.
Sample YBD01: The chemical composition of the sample was dominated by Cu, O, and Si, with small amounts of Ca and P, as revealed by EDS. Metal copper particles could not be detected by optical microscopy, but Cu2S (chalcocite) particles could be observed distributed in the copper oxide ore. The sample also contained incompletely burned wood charcoal particles. As shown in Figure 5.
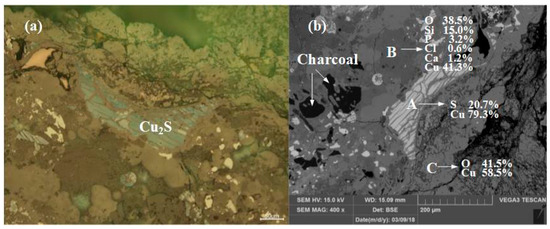
Figure 5.
Optical micrograph (a) and SEM backscattered electron image (b) of YBD01.
Sample YBD02: The EDS characterization result showed that the chemical composition of the sample was mainly Cu and O, with small amounts of Si and P. No metallic copper particles were detected under the metallographic microscope, and a network of charcoal was observed. As shown in Figure 6.
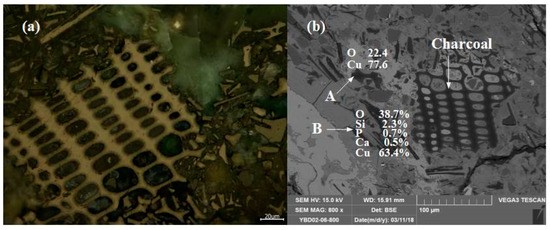
Figure 6.
Optical micrograph (a) and SEM backscattered electron image (b) of YBD02.
Sample YBD03: The EDS characterization result showed that Ca, P, and Fe were associated with the oxidized copper ore. The edge of Cu5FeS4 (chalcopyrite) was wrapped by secondary Cu2S (chalcocite), and the two ores together formed inclusions that were distributed in the oxidized copper ore. As shown in Figure 7.
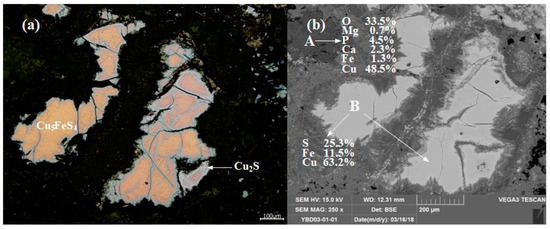
Figure 7.
Optical micrograph (a) and SEM backscattered electron image (b) of YBD03.
Sample YBD06: The EDS characterization result showed that the YBD06 sample contains only a trace amount of S. No metallic copper particles were detected under the metallographic microscope, and Cu2S (chalcopyrite) appeared as dispersed particles in the copper oxide ore. As shown in Figure 8.
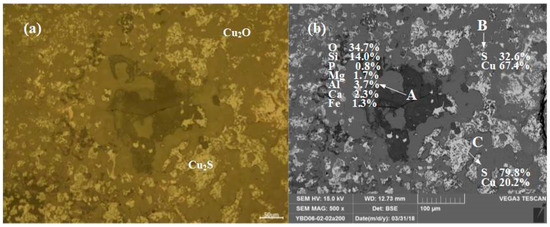
Figure 8.
Optical micrograph (a) and SEM backscattered electron image (b) of YBD06.
Sample YBD010: CuFeS2 (chalcopyrite) was distributed as larger particles within the copper oxide ore, while Cu2S (chalcocite) particles were smaller and dispersed throughout the oxide copper ore. As shown in Figure 9.
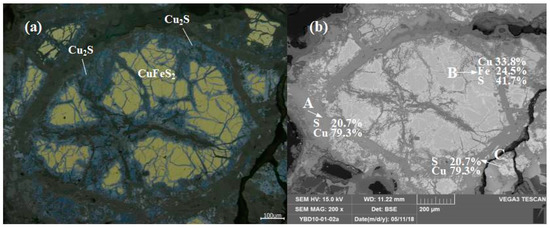
Figure 9.
Optical micrograph (a) and SEM backscattered electron image (b) of YBD10.
Sample YBD13: The EDS characterization result showed that the main component was copper oxide mineral. Among the detected phases, Cu2O (cuprite) had the highest Cu content. As shown in Figure 10.
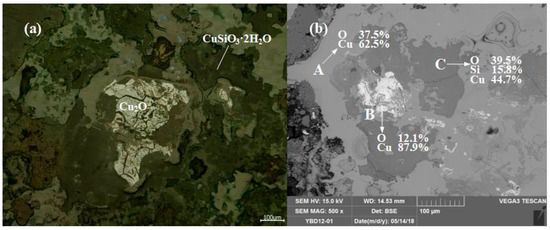
Figure 10.
Optical micrograph (a) and SEM backscattered electron image (b) of YBD13.
Sample YBD19: The main component was copper oxide mineral. Among the detected phases, Cu2O (cuprite) had the highest copper content and the boundaries between different phases were smooth. As shown in Figure 11.
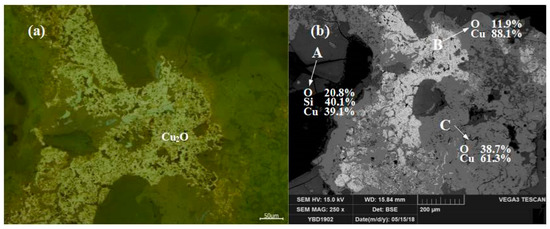
Figure 11.
Optical micrograph (a) and SEM backscattered electron image (b) of YBD19.
3.2.2. Slages without Detectable Copper Metal
The II category of samples includes YBD05, YBD07, YBD08, YBD11, YBD12, YBD21, and YBD23.
These samples were mainly copper smelting slag produced by pyrometallurgical processes. Due to the strong oxidizing atmosphere during smelting, most of the copper was oxidized and entered the slag in the form of Cu2O (cuprite) or Cu2O·Fe2O3 (delafossite) [16,17].
Sample YBD05: The crystal phases were Cu2O·Fe2O3 (delafossite) and Cu2O (cuprite). Cu2O·Fe2O3 (delafossite) crystals were well developed, while Cu2O crystals were elliptical and fill the space between Cu2O·Fe2O3 (delafossite) crystals. No metallic copper particles were detected under a metallographic microscope. As shown in Figure 12.
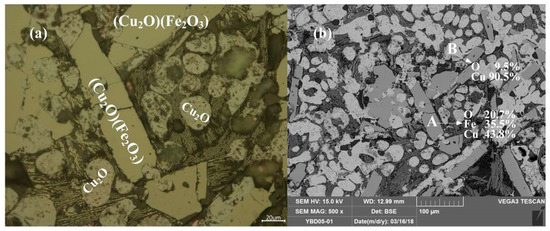
Figure 12.
Optical micrograph (a) and SEM backscattered electron image (b) of YBD05.
Sample YBD07: The backscattered electron image at a higher magnification is shown in Figure 13b. The Cu2O (cuprite) crystals were relatively large and densely distributed in the copper oxide ore. No metallic copper particles were detected under examination using optical microscopy. As shown in Figure 13.
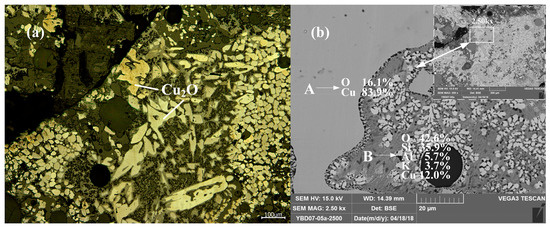
Figure 13.
Optical micrograph (a) and SEM backscattered electron image (b) of YBD07.
Sample BD08: A large amount of Cu2O·Fe2O3 (delafossite) and large blocks of Cu2O (cuprite) crystals could be detected. The Cu2O crystals were around by Cu2O·Fe2O3 (delafossite) crystals, and the crystals of the Cu2O·Fe2O3 (delafossite) phase were well developed and interwoven with each other. No metallic copper particles were detected under examination using optical microscopy. As shown in Figure 14.
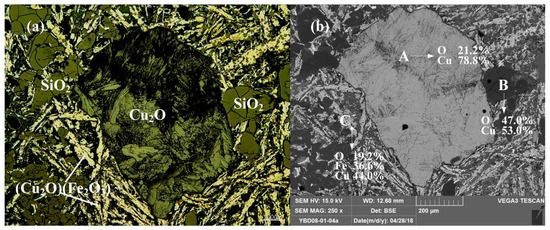
Figure 14.
Optical micrograph (a) and SEM backscattered electron image (b) of YBD08.
Sample YBD11: (Na, Mg, Fe) O·Fe2O3, Cu2O (cuprite), and CuSiO3·2H2O (chrysocolla) were detected. No metallic copper particles were observed under the metallographic microscope. No metallic copper particles were detected under examination using optical microscopy. As shown in Figure 15.
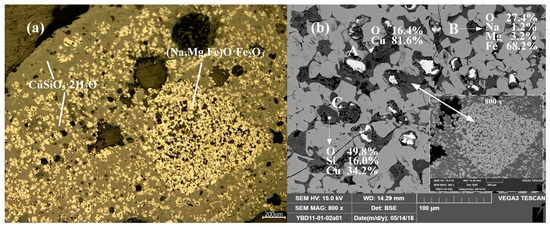
Figure 15.
Optical micrograph (a) and SEM backscattered electron image (b) of YBD11.
Sample YBD12: The copper ore in the sample were mainly needle-like crystals of Cu2O·Fe2O3 (delafossite) and large particles of Cu2O (cuprite), with traces of oxidized galena. No metallic copper particles were detected under examination using optical microscopy. As shown in Figure 16.
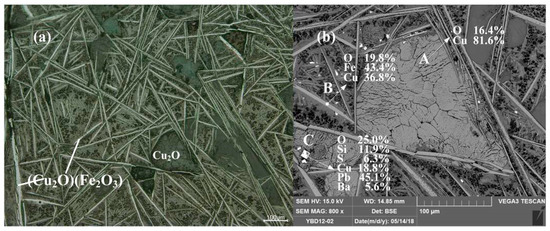
Figure 16.
Optical micrograph (a) and SEM backscattered electron image (b) of YBD12.
Sample YBD23: The main phases present in the slag were Fe3O4 (magnetite) crystals, which were densely distributed between columnar grains of 2FeO·SiO3 (fayalite). There were trace amounts of Cu2O (cuprite) present. No metallic copper particles were detected under examination using optical microscopy. As shown in Figure 17.
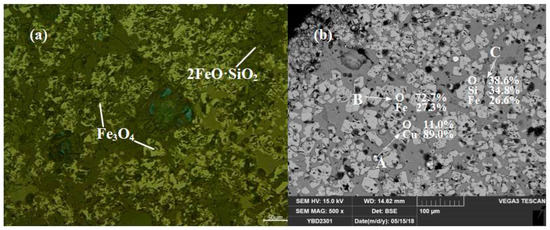
Figure 17.
Optical micrograph (a) and SEM backscattered electron image (b) of YBD21.
3.2.3. Slages with Metallic Copper Particles
The III category of samples included YBD04, YBD09, YBD14, YBD15, YBD16, YBD17, YBD18, YBD20, YBD22, and YBD24.
These samples were typical copper smelting slags, and the typical slag structure and phase composition could be detected in all of them. They contained various components, such as copper metal particles with different sizes, Cu2O (cuprite), CuO·Fe2O3 (delafossite), Fe3O4 (magnetite), and silicate slag phases.
Sample YBD04: Under the metallographic microscope, Cu2O solid solution could be detected in the metallic copper, which appeared as a darker phase. CuO·Fe2O3 (delafossite) was present in the slag phase, and EDS characterization indicated that the sample still contained incompletely reacted copper mineral. As shown in Figure 18.
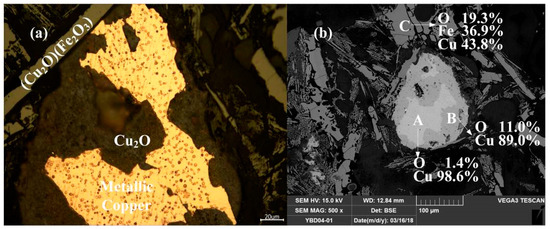
Figure 18.
Optical micrograph (a) and SEM backscattered electron image (b) of YBD04.
Sample YBD09: The backscattered electron image at a higher magnification is shown in Figure 19b. The EDS characterization indicated that the crystalline phase was 2FeO·SiO3 (fayalite), although the degree of crystallization was not high, it was still a typical slag phase structure. A small amount of SiO2 (quartz) is also distributed in the sample. Metal copper particles can be detected under a metallographic microscope. As shown in Figure 19.
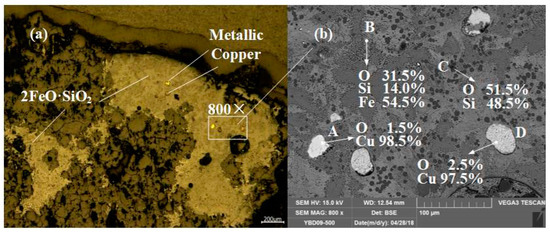
Figure 19.
Optical micrograph (a) and SEM backscattered electron image (b) of YBD09.
Sample YBD14: The sulfides contained in the sample were layered CuS (covellite) and included flaky Cu2S (chalcocite). The oxide crystals were Fe3O4 (magnetite) and the copper oxide ore. Sporadic small metallic copper particles could be detected dispersed in the slag under a metallographic microscope. As shown in Figure 20.
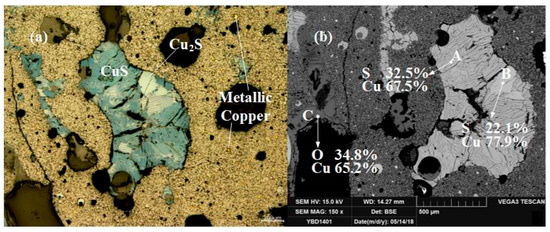
Figure 20.
Optical micrograph (a) and SEM backscattered electron image (b) of YBD14.
Sample YBD15: Copper particles coated by Cu2O (cuprite) could be detected under a metallographic microscope, and the Cu2O (cuprite) solid solution was a dark-colminerald phase. The copper particles contained numerous porous voids, and Fe3O4 (magnetite) can be detected in the slag phase. As shown in Figure 21.
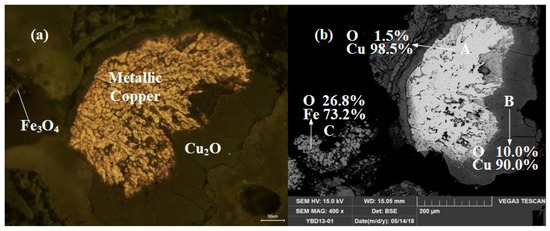
Figure 21.
Optical micrograph (a) and SEM backscattered electron image (b) of YBD15.
Sample YBD16: Metallic copper particles with Cu2O (cuprite) solid solution were visible in the field of view of the metallographic microscope, and the Cu2O (cuprite) solid solution appears dark in color. The slag matrix is a silicate containing small amounts of K, Fe, and Cu. As shown in Figure 22.
Figure 22.
Optical micrograph (a) and SEM backscattered electron image (b) of YBD16.
Sample YBD17: Under the metallographic microscope, copper particles could be detected. EDS characterization showed that the copper particles contain 1.8% O, and Cu2O solid (cuprite) solution exists in the copper particles. Fe3O4 (magnetite) was filled between 2FeO·SiO2 (fayalite) grains. As shown in Figure 23.
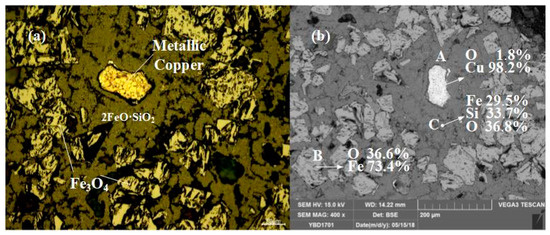
Figure 23.
Optical micrograph (a) and SEM backscattered electron image (b) of YBD17.
Sample YBD18: Under the metallographic microscope, a conglomerate of sponge copper debris could be detected, with Cu2O solid solution present. EDS characterization showed that the copper particles contained 4.6% O. The crystalline phase includes Fe-Cu silicates, which were needle-shaped and dispersed within the matrix of copper oxide ore. As shown in Figure 24.
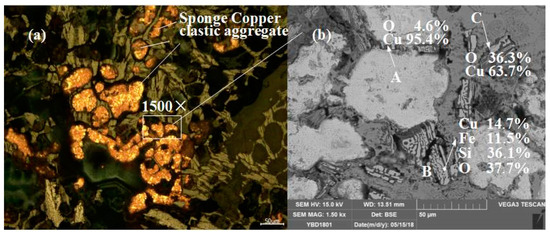
Figure 24.
Optical micrograph (a) and SEM backscattered electron image (b) of YBD18.
Sample YBD20: Under the metallographic microscope, copper particles of different sizes could be detected. The crystalline phase was Fe3O4 (magnetite), which had well-developed crystals and was granular, with edges wrapped in Cu2O·Fe2O3 (delafossite). The Fe3O4 (magnetite) nuclei are dispersed in a needle-like shape in the silicate slag. As shown in Figure 25.
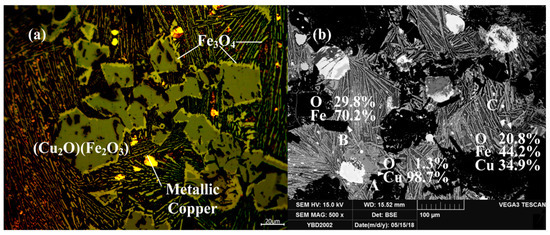
Figure 25.
Optical micrograph (a) and SEM backscattered electron image (b) of YBD20.
Sample YBD22: Metallic copper particles were detected under examination using optical microscopy enveloped by oxidized copper ore. As shown in Figure 26.
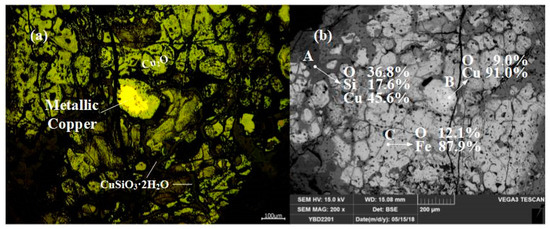
Figure 26.
Optical micrograph (a) and SEM backscattered electron image (b) of YBD22.
Sample YBD24: Metallic copper particles with α solid solution dendrite segregation could be detected under a metallographic microscope. The entire metallic copper particle was enveloped by Cu2O (cuprite). Fe3O4 (magnetite) crystals were enveloped in the slag phase by Cu2O·Fe2O3 (delafossite) and densely distributed in the silicate slag phase. As shown in Figure 27.
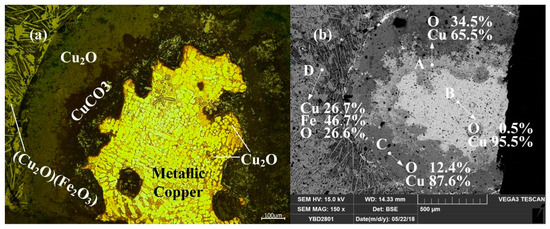
Figure 27.
Optical micrograph (a) and SEM backscattered electron image (b) of YBD24.
3.3. X-ray Diffraction Characterization Result
The XRD characterization image of the mineral is shown in Figure 28.
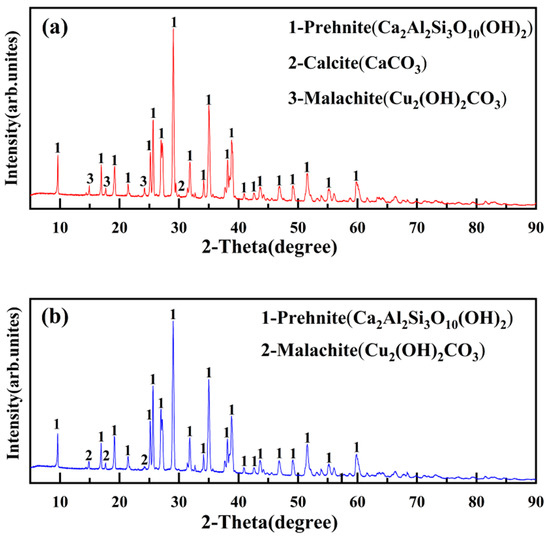
Figure 28.
XRD patterns of ore unearthed from the site of Yubeidi site. (a) XRD patterns of YBD25; (b) XRD patterns of YBD26.
According to the X-ray diffraction pattern, it can be determined that the main components of the ore are Cu2(OH)2CO3(malachite) [18], Ca2Al2Si3O10(OH)2(prehnite), and CaCO3(calcite). YBD25 and YBD26 are copper oxide ores that have not undergone roasting.
4. Analysis of Characterization Results and Discussion
It is discharged from the furnace in a molten state at the smelting temperature and solidifies outside the furnace into a dense solid, carrying with it permanently sealed smelting reaction information. Therefore, based on the characterization results of the composition and structure of slag, ancient copper smelting techniques can be reconstructed.
Different types and grades of minerals require different smelting processes. Based on literature research and the physical and chemical properties of copper metallurgy [19,20,21], it can be determined that there were three pyrometallurgical copper smelting processes that existed in ancient times:
- (1)
- Direct reduction smelting of copper oxide minerals to obtain metallic copper;
- (2)
- Smelting of copper sulfide minerals, which are theoretically desulfurized after roasting, and then subjected to reduction smelting to obtain metallic copper;
- (3)
- Smelting of copper sulfide minerals, which are subjected to multiple roasting to obtain an intermediate product called matte. The matte is then reduced and smelted to obtain metallic copper.
The slag obtained from reduction smelting is defined as reduction smelting slag. When the smelting product matter, the obtained slag is defined as matter slag.
4.1. Calculation of Cu and S Content in the Matte Slag
The difference between copper oxide mineral direct reduction smelting and matte smelting for copper enrichment lies in the different types of minerals used and the resulting products, which are characterized by differences in the occurrence and content of copper and sulfur elements [22]. Therefore, the difference between reduction slag and matte slag must also be related to the occurrence and content of copper and sulfur elements in the slag.
The calculation of matte grade is based on the following chemical reaction formula:
When smelting copper sulphide ore, if no oxygen reacts with part of iron sulfide to form iron oxides, the grade of matte will not change [23]. However, it must be noted that these reactions do not take into account the production of metallic copper or metallic copper and matte.
Matte grade is expressed as follows:
In Equation (5), ω represents the mass of Cu in matte, ω1(Fe) represents the mass of Fe in matte, and ω1(S) represents the mass of S in matte.
M0(A) is used to denote the amount of element ‘A’ in the smelting system, taking into account the situation such as Equation (6):
In Equation (6), M0(O2) represents the amount of O2 in the reaction system, M0(S) represents the amount of S in the reaction system, M0(Cu) represents the amount of Cu in the reaction system, ½M0(Cu) represents the amount of S that entered into matte in the form of Cu2S, and M0(Fe) represents the amount of Fe in the reaction system, equivalent to the amount of S required to form FeS. The matte grade can be controlled by adjusting the oxygen potential in the reaction system.
Based on Equation (6), there is sufficient O2 to react with S without considering the S content in Cu2S and FeS. In this case, Equation (7) can be obtained from Equation (3).
The meanings represented by each term in Equation (7) are equivalent to those in Equation (6).
The additional or excess amount of O2 can be expressed by Equation (8).
In Equation (8), M1(O2) represents the additional or excess amount of O2 in the reaction system, and the meanings represented by each term in Equation (8) are equivalent to those in Equation (6).
If the additional or additional O2 reacts according to Equation (4), which can be written as the following general Equation (9):
In Equation (9), M0(FeS) represents the amount of substance of Fe that enters into the matte. The meanings represented by each term in Equation (8) are equivalent to those in Equation (6).
All the FeS involved in the reaction system can be expressed using Equation (10):
In Equation (10), M1(FeS) represents all the FeS involved in the reaction system, and the meanings represented by each term in Equation (8) are equivalent to those in Equation (6).
The amount of substance of Fe entering the matte can be expressed using Equation (11):
In Equation (11), M1(Fe) represents the amount of substance of Fe that enters the matte in the reaction in the reaction system, and the meanings represented by each term in Equation (8) are equivalent to those in Equation (6).
The amount of substance of S entering the matte can be expressed using Equation (12):
Substituting Equations (11) and (12) into Equation (5), as follows:
Equation (13) can be approximately simplified to Equation (14):
The meanings represented by each term in Equations (13) and (14) are equivalent to those in Equation (6).
If the mineral is not roasted, or when the amount of oxides entering the reaction system is negligible, the matte grade can be calculated according to Equation (15):
Simplification of Equation (15) yields Equation (16):
According to Equation (16), when the limit of ω equals 0, M0(Cu) approaches 0, and only FeS enters the reaction system, corresponding to the smelting of pure FeS. When the slag contains FeS, the grade of matte slag is less than 80%, and the ratio of Cu to S content will be less than 4. When M0(Fe) approaches 0, the limit of ω equals 80%, corresponding to the smelting of pure Cu2S. Currently, the ratio of Cu content to S content in the slag is (64 × 2):32 = 4. Therefore, 4 is the maximum value for the ratio of Cu content to S content in matte slag.
As the grade of matter increases, the Cu content in the matter slag increases, and the S content decreases. Therefore, the Cu-to-S ratio in the slag also increases. That is, the ratio of Cu content to S content in the slag (Cu-to-S ratio in the slag) is directly proportional to the grade of matter slag.
4.2. Calculation of Cu and S Content in the Reduction Smelting Slag
In modern industrial production, the oxidized mineral of copper is no longer used for direct reduction and smelting into metal copper. However, according to a few similar smelting data in modern times, the copper content of reducing slag is generally high [24,25,26].
In theory, Cu in the reduction slag exists in the form of Cu and Cu2S. According to Equation (16), it can be inferred that the ratio of Cu to S in the reduction slag must be greater than 4.
In the I category samples, no typical products of furnace slags such as 2FeO·SiO2 (fayalite) or fluxes such as CaO were detected. The Cu-phases in the samples were mainly various copper oxide minerals or copper sulfide minerals. Trace amounts of S were detected in YBD01, YBD02, YBD03, YBD06, and YBD10, with the highest S content of 9% found in YBD02. Since copper minerals with S content below 30% are classified as copper oxide minerals, the samples mentioned above belong to copper oxide minerals. In YBD01 and YBD02, there were unburned reticulated charcoals, suggesting that YBD01 and YBD02 had undergone roasting.
In the II category samples, most of the copper was oxidized into Cu2O (cuprite) or formed Cu2O·Fe2O3 (delafossite) and entered into the slag, indicating that strong oxidizing conditions were present during smelting. Traces of Pb-containing inclusions were detected in sample YBD12.
In the III category samples, the metal particles in the slag were all red copper particles, and the metallic copper particles contained a small amount of Cu2O solid solution. In addition to metallic copper, the Cu-phases in the slag included Cu2O (cuprite) and Cu2O·Fe2O3 (delafossite). The slag also contained Fe3O4 (magnetite) and silicate slag. These observations suggest that a mixture of oxidizing and reducing atmospheres was present during smelting, with a weaker reducing atmosphere and a stronger oxidizing atmosphere. The crystals in the slag were disoriented and interlaced without a consistent orientation in any direction, indicating poor fluidity of the slag.
According to the characterization results of the sample, the phase diagram of CuO-FeO-SiO2-O2 at different oxygen partial pressures was calculated using the phase diagram function of FactSage 7.1, as shown in Figure 29.
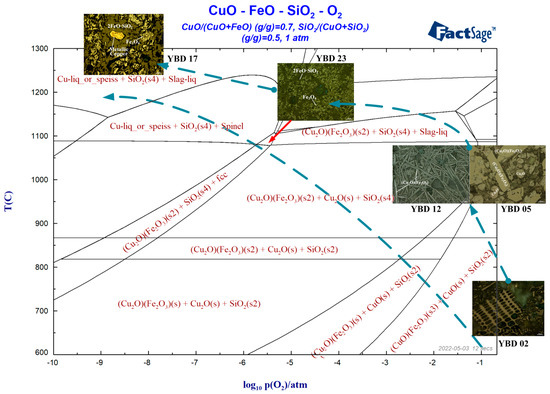
Figure 29.
Temperature–oxygen potential phase diagram of slag from Yubeidi Site.
It can be seen that the heated copper oxide ore enters the high oxygen partial pressure reduction reaction system and decomposes into CuO (tenorite) and SiO2. As the reaction proceeds, CuO (tenorite) is completely converted to Cu2O (cuprite) and reacts with Fe2O3 to form Cu2O·Fe2O3 (delafossite) at a reaction temperature exceeding 900 °C. Finally, the copper oxide mineral is reduced to metallic copper at around 1300 °C.
Many samples contain magnetite indicating the presence of oxidizing atmosphere in the smelting system [27]. However, the presence of metallic copper particles also suggests reducing conditions. Ryndina previously analyzed the slag from a site in the Northeast Balkans during the Neolithic period, which used a mixture of sulfide and oxide ores [28]. Prior to smelting, the sulfide ore was roasted under oxidizing conditions to remove all sulfur [29], a process in which sulfides are converted to oxides [30].
As shown in Figure 28, poor control of reducing atmosphere led to difficulty in reducing most of Cu2O (cuprite) or CuO (tenorite) into metallic copper. When most of the copper oxide minerals finally decomposed into Cu2O (cuprite) or CuO (tenorite), failure to timely control the oxygen partial pressure or redox potential of the reaction system resulted in the failure to obtain metallic Cu. Most of the Cu reacted with iron oxides and entered the slag as copper–iron oxides, resulting in high copper content [31,32].
The phenomenon of enriched copper in the matrix of copper smelting slag is attributed to the use of sulfur-rich oxidized ores in the red copper smelting process. The partial desulfurization of iron-rich copper during weak reducing conditions can explain the appearance of the phases mentioned above. Specifically, when the high-temperature slag is cooled, magnetite first precipitates, followed by Cu2O (tenorite). Due to poor control of the reducing atmosphere, Cu2O (tenorite) is reduced to metallic copper. If the oxygen potential of the reaction system is not controlled in a timely manner, most of the Cu2O (tenorite) will react with iron oxide to form Cu2O·Fe2O3 (delafossite), resulting in high Cu content in the slag and making it difficult to obtain metallic copper.
Based on the discrimination rules between smelted and melted copper slag, the analyzed slag samples are all direct reduction slag, mainly considered from two perspectives. Firstly, the slag system is a FeO-SiO2 system. The main phase of the slag matrix is the common 2FeO·SiO3 (fayalite) under a reducing atmosphere. However, due to the unstable metallurgical environment and strong oxidation atmosphere of these early samples, the spinel group phase is also common, such as Fe3O4 (magnetite) and Cu2O·Fe2O3 (delafossite), with crystals often appearing as quadrilaterals or polygons. Secondly, the copper particles embedded in the slag can be identified as ice copper phase, but the average sulfur content of all slag matrices is only 4.04%.
According to the XRD characterization data, it can be inferred that the ore used in the Yubeidi site smelting was copper oxide ore. This also confirms that the smelting technology used at the site was a direct reduction of copper oxide ore to obtain metallic copper.
4.3. Analysis of the Ore Origin
The Tangdan oxidized copper deposit is in Dongchuan District, Kunming City, Yunnan Province [33]. The deposit has a reserve (B + C + D grades) of approximately 1.15 million tonnes of copper metal, making it the largest independent oxidized copper deposit with proven reserves in China.
There are as many as 15 ores in the representative ore samples from the Tangdan oxidized copper deposit, including six main copper ores and two main oxide copper ores (malachite and chrysocolla), with turquoise accounting for about 80% of all oxide copper ores. There are also four main sulfide copper minerals, including chalcopyrite, bornite, chalcocite, and covellite, with chalcopyrite accounting for about 50% of all sulfide copper ores. The main gangue ores are dolomite, followed by calcite.
The local copper mineral types are consistent with the XRD characterization results. Based on this inference, the ore used for copper smelting at the Yubeidi site is highly likely to come from the nearby Tangdan copper mine.
4.4. Discussion
Two charcoal samples from the same stratum as the slag were sent to Beijing University’s radiocarbon dating laboratory for analysis. The results are shown in Table 2.
Table 2.
Radiocarbon dating results of charcoal samples from the Yubeidi site.
Historians divide the Eastern Zhou period into two stages, the Spring and Autumn period and the Warring States period, with 770–476 BC being the Spring and Autumn period and 475–221 BC being the Warring States period. The AMS dating results indicate that the absolute age of the Yubeidi Site falls within the period from the middle to the late Spring and Autumn period to the Warring States period, which is generally consistent with the archaeological typology and does not extend beyond the Warring States period. The charcoal samples and slag used for dating were excavated in H23, indicating that the smelting activity should have occurred from the late Spring and Autumn period to the Warring States period.
Apart from the Yubei site, the Guangfentou site is one of the most extensively excavated metallurgical relics of the Bronze Age in Yunnan. It is located on the Guangfentou Mountain in the Luju town of Jiangchuan district in Yunnan province and is one of the few archaeological sites of the Dian civilization (600–250 BCE) [34] discovered to date. Its history can be traced back to the Warring States period to the Western Han Dynasty [35].
The characterization results of the slag unearthed from the Guangfentou site showed the presence of a large amount of Fe3O4 (magnetite) in the slag matrix, as well as a small amount of 2FeO·SiO3 (fayalite) particles. Furthermore, there are abundant particles of white matte and Cu2O (cuprite) [36]. The presence of Cu2O (cuprite) and Fe3O4 (magnetite) indicates that the slag was formed under a strong oxidizing atmosphere.
It can be seen that the smelting slag unearthed from the Yubei and Guangfentou sites was obtained through the direct reduction of copper sulfide. The two sites used similar smelting processes. Since the Guangfentou site dates slightly later than the Yubei site, there was little room for significant improvement or innovation in smelting technology in the short term.
The Guangfentou site belongs to the Dian culture (Shizhaishan culture) in terms of archaeological cultural type, while the Yubeidi site is independent of the Dian culture. Despite the different archaeological cultural types, both sites used similar smelting techniques, indicating that there was likely technological exchange in metallurgy among different archaeological cultures in Yunnan during that time period.
5. Conclusions
- (1)
- The Yubeidi site used charcoal as fuel and high-grade copper oxide ores as raw materials to separate metal copper from vein minerals by reducing copper oxide minerals, to obtain metallic copper.
- (2)
- During the smelting process, the reduction atmosphere and smelting temperature control were poor, and most of the Cu participated in entering the slag and reacted with iron oxide to form Cu2O·Fe2O3 (delafossite) resulting in high Cu content in the slag.
- (3)
- The slag from the Yubeidi site was sticky, making it difficult to separate copper from slag, resulting in relatively low copper smelting efficiency. No calcium or silica-based fluxes were found.
Author Contributions
Data Curation, methodology, and manuscript review, S.L.; Conceptualization, funding acquisition, and supervision, X.L. and Y.L.; Funding acquisition and supervision, R.Z.; Formal analysis, writing—review, and editing S.L. All authors have read and agreed to the published version of the manuscript.
Funding
National Natural Science Foundation of China (Grant No. 51861135307); Ministry of Culture’s Intangible Cultural Heritage Department commissioned project (Project No. fy17006); Major Project of Philosophy and Social Sciences Research in Higher Education Institutions in Jiangsu Province (Project No. 2017ZDAXM006).
Institutional Review Board Statement
Not applicable.
Informed Consent Statement
Not applicable.
Data Availability Statement
Not applicable.
Acknowledgments
We would like to thank Jing Guo (School of Metallurgical and Ecological Engineering, University of Science and Technology and Beijing) for his guidance and comments on this study. And we would like to thank Zhilong Jiang (Yunnan Institute of Cultural Relics and Archaeology) for his support and encouragement.
Conflicts of Interest
The authors declare no conflict of interest.
References
- Rothenberg, B. Ancient copper industries in the Western Arabah: An archaeological survey of the Arabah, part 1. Palest. Explor. Q. 1962, 94, 5–71. [Google Scholar] [CrossRef]
- Bachmann, H.G. The Identification of Slags from Archaeological Sites; Routledge: London, UK, 2016. [Google Scholar]
- Lupu, A. Metallurgical aspects of Chalcolithic copper working at Timna (Israel). Bull. Hist. Metall. Group 1970, 4, 21–23. [Google Scholar]
- Tylecote, R.F. Metallurgy in Archaeology: A Prehistory of Metallurgy in the British Isles; Edward Arnold: London, UK, 1962. [Google Scholar]
- Morton, G.R.; Wingrove, J. Constitution of bloomery slags: Part 1: Roman. J. Iron Steel Inst. 1969, 207, 1556–1564. [Google Scholar]
- Milton, C.; Dwornik, E.J.; Finkelman, R.B.; Toulmin, P. Slag from an ancient copper smelter at Timna Israel. J. Hist. Metall. Soc. 1976, 10, 24–33. [Google Scholar]
- Liss, B.; Levy, T.E. Using X-ray Fluorescence to Examine Ancient Extractive Metallurgy Practices: A Case Study from Iron Age Khirbatal-Jariya, Jordan. J. Powder Metall. Min. 2016, 5, 1–5. [Google Scholar]
- Ankusheva, P.; Ankushev, M.N.; Alaeva, I. The Copper Smelting Furnace at the Novotemirsky Ancient Mine. Povolzhskaya Arkheologiya (Volga River Reg. Archaeol.) 2022, 1, 34–48. [Google Scholar] [CrossRef]
- Oudbashi, O.; Hessari, M. Iron Age tin bronze metallurgy at Marlik, Northern Iran: An analytical investigation. Archaeol. Anthropol. Sci. 2017, 9, 233–249. [Google Scholar] [CrossRef]
- Rademakers, F.W.; Farci, C. Reconstructing bronze production technology from ancient crucible slag: Experimental perspectives on tin oxide identification. J. Archaeol. Sci. Rep. 2018, 18, 343–355. [Google Scholar] [CrossRef]
- Haubner, R.; Strobl, S. Considerations on copper smelting from Fahlores and the metallurgy of cu-as bronzes. BHM Berg-Und Hüttenmännische Mon. 2022, 1–11. [Google Scholar] [CrossRef]
- Jiang, Z.; Xing, X.; Yang, W.; Yang, Q.; Yang, L.; Li, W.; Lu, Y. A Preliminary Research on Yubeidi Site at Dongchuan District in Kuming City, Yunnan Province. Res. China’s Front. Archaeol. 2019, 1, 95–115. (In Chinese) [Google Scholar]
- Pauporte, T.; Vedel, J. Temperature effects on copper diffusion in natural chalcocite. Solid State Ion. 1999, 116, 311–320. [Google Scholar] [CrossRef]
- Gainov, R.R.; Vagizov, F.G.; Golovanevskiy, V.A.; Ksenofontov, V.A.; Klingelhöfer, G.; Klekovkina, V.V.; Shumilova, T.G.; Pen’kov, I.N. Application of 57Fe Mössbauer spectroscopy as a tool for mining exploration of bornite (Cu5FeS4) copper ore. Hyperfine Interact. 2014, 226, 51–55. [Google Scholar] [CrossRef]
- Zand, L.; Vakylabad, A.B.; Masoumi, M.E. Homogeneous Catalytic Dissolution of Recalcitrant Chalcopyrite (CuFeS2). Top. Catal. 2022, 1–13. [Google Scholar] [CrossRef]
- Lastra-Quintero, R.; Rowlands, N.; Rao, S.R.; Finch, J.A. Characterization and separation of a copper smelter dust residue. Can. Metall. Q. 1987, 26, 85–90. [Google Scholar] [CrossRef]
- Aquino, A.; Lezzerini, M.; Giaccherini, A.; Montegrossi, G.; Di Benedetto, F. Thermochemical stability of delafossite and other relevant ternary phases in the Cu–Fe–S–O–H system. Appl. Geochem. 2020, 123, 104795. [Google Scholar] [CrossRef]
- Deng, J.; Wen, S.; Deng, J.; Wu, D.; Yang, J. Extracting copper by lactic acid from copper oxide ore and dissolution kinetics. J. Chem. Eng. Jpn. 2015, 48, 538–544. [Google Scholar] [CrossRef]
- Chiarantini, L.; Benvenuti, M.; Costagliola, P.; Fedi, M.E.; Guideri, S.; Romualdi, A. Copper production at Baratti (Populonia, southern Tuscany) in the early Etruscan period (9th–8th centuries BC). J. Archaeol. Sci. 2009, 36, 1626–1636. [Google Scholar] [CrossRef]
- Radivojević, M.; Rehren, T. Paint it black: The rise of metallurgy in the Balkans. J. Archaeol. Method Theory 2016, 23, 200–237. [Google Scholar] [CrossRef]
- Sdralia, A.M.; Kassianidou, V.; Rehren, T. Late Roman copper smelting in Polis Chrysochous, Cyprus. J. Archaeol. Sci. Rep. 2023, 48, 103889. [Google Scholar] [CrossRef]
- Rostoker, W.; Pigott, V.C.; Dvorak, J.R. Direct reduction to copper metal by oxide--sulfide mineral interaction. Archeomaterials 1989, 3, 69–87. [Google Scholar]
- Schlesinger, M.E.; King, M.J.; Sole, K.C.; Davenport, W.G. Extractive Metallurgy of Copper, 5th ed.; Elsevier: Amsterdam, The Netherlands, 2011; pp. 73–88. [Google Scholar]
- Bellemans, I.; De Wilde, E.; Moelans, N.; Verbeken, K. Metal losses in pyrometallurgical operations—A review. Adv. Colloid Interface Sci. 2018, 255, 47–63. [Google Scholar] [CrossRef] [PubMed]
- Topçu, M.A.; Rüşen, A.; Derin, B. Minimizing of copper losses to converter slag by a boron compound addition. J. Mater. Res. Technol. 2019, 8, 6244–6252. [Google Scholar] [CrossRef]
- Zivkovic, Z.; Djordjevic, P.; Mitevska, N. Contribution to the Examination of the Mechanisms of Copper Loss with the Slag in the Process of Sulfide Concentrates Smelting. Min. Metall. Explor. 2020, 37, 267–275. [Google Scholar] [CrossRef]
- Metten, B. Beitrag zur Spätbronzezeitlichen Kupfermetallurgie im Trentino (Südalpen) im Vergleich mit Anderen Prähistorischen Kupferschlacken aus dem Alpenraum. Ph.D. Thesis, Faculty of Geosciences, Ruhr-University Bochum, Bochum, Germany, 1997. [Google Scholar]
- Ryndina, N.; Indenbaum, G.; Kolosova, V. Copper production from polymetallic sulphide ores in the northeastern Balkan Eneolithic culture. J. Archaeol. Sci. 1999, 26, 1059–1068. [Google Scholar] [CrossRef]
- Tylecote, R.F. Early metallurgy in Cyprus. In The Late Bronze Age: Copper and Bronze Metallurgy at Enkomi and Kition; Muhly, J.D., Maddin, R., Karageorghis, V., Eds.; 4000–500 B.C. Pierides Foundation: Nicosia, Cyprus, 1982; pp. 81–103. [Google Scholar]
- Avetisyan, H.K. Metallurgiya Chernovoi Medi; Metallurgiya: Moscow, Russia, 1954; pp. 1–464. (In Russian) [Google Scholar]
- De Wilde, E.; Bellemans, I.; Zheng, L.; Campforts, M.; Guo, M.; Blanpain, B.; Moelans, N.; Verbeken, K. Origin and sedimentation of Cu-droplets sticking to spinel solids in pyrometallurgical slags. Mater. Sci. Technol. 2016, 32, 1911–1924. [Google Scholar] [CrossRef]
- Zhou, S.; Wei, Y.; Shi, Y.; Li, B.; Wang, H. Characterization and recovery of copper from converter copper slag via smelting separation. Metall. Mater. Trans. B 2018, 49, 2458–2468. [Google Scholar] [CrossRef]
- Deng, T.; Chen, J. Treatment of oxidized copper ores with emphasis on refractory ores. Miner. Procesing Extr. Metall. Rev. 1991, 7, 175–207. [Google Scholar] [CrossRef]
- Yao, A.; Darré, V.; Zhilong, J.; Lam, W.; Wei, Y. Bridging the time gap in the Bronze Age of Southeast Asia and Southwest China. Archaeol. Res. Asia 2020, 22, 100189. [Google Scholar] [CrossRef]
- Li, X.; Liu, R. Floatation Results and Analysis of Plant Remains from Guangfentou Site in Jiangchuan, Yunnan. Agric. Archaeol. 2016, 145, 20–27. (In Chinese) [Google Scholar]
- Zou, G.; Cui, J.; Liu, X.; Li, X.; Min, R. Investigation of early Bronze Age civilizations in Yunnan: A scientific analysis of metallurgical relics found at the Guangfentou ruins in Jiangchuan. Archaeol. Anthropol. Sci. 2019, 11, 15–31. [Google Scholar] [CrossRef]


Disclaimer/Publisher’s Note: The statements, opinions and data contained in all publications are solely those of the individual author(s) and contributor(s) and not of MDPI and/or the editor(s). MDPI and/or the editor(s) disclaim responsibility for any injury to people or property resulting from any ideas, methods, instructions or products referred to in the content. |
© 2023 by the authors. Licensee MDPI, Basel, Switzerland. This article is an open access article distributed under the terms and conditions of the Creative Commons Attribution (CC BY) license (https://creativecommons.org/licenses/by/4.0/).