Abstract
This work focuses on quantitatively investigating the relationship between creep and stress relaxation of 7050 aluminum alloy at ageing temperatures. The creep strain rates, creep exponent, n, and activation energy were extracted from both the creep and stress relaxation curves to explore the creep mechanisms. Results showed that higher applied stress promotes the creep and stress relaxation extents. The calculated creep strain rates from creep and stress relaxation curves located in similar ranges and share similar n values (n = 3.7 for creep and n = 3.5 for stress relaxation), indicating that both tests are dominated by the dislocation slip mechanism. Additionally, the n value for creep tests is a constant throughout the tests, indicating that the dominant creep mechanism is unchanged. However, the activation energy changes from 123 kJ/mol to 139 kJ/mol, possibly due to evolved dislocations. Such a new finding could provide a supporting mechanism for building constitutive equations depending on the evolved A value. Furthermore, compared to the single-stage creep ageing, no primary creep was observed in T74 multi-stage creep ageing while similar amount of total creep strains was achieved. This suggests an alternative loading sequence for creep age forming of 7050 aluminum alloy, i.e., loading at the second stage to avoid prolonged exposure to high temperatures, extend the tool life, and achieve similar amounts of inelastic deformations. Based on all the above studies, creep and stress relaxation have a certain relationship. This paper provides a theoretical basis for future research on creep ageing forming of 7050 aluminum alloy.
1. Introduction
Creep ageing forming (CAF) is a metal processing method, mainly used to manufacture large, complex integral wing panels in the aerospace field. The technique could effectively combine in-elastic forming and ageing to concurrently form and precipitate harden the target component, achieving high precision with improved mechanical properties. The forming of the component is achieved using thermally activated creep and stress relaxation at the ageing temperatures [1,2]. A widely used structural material in aircraft, aerospace, and rail transit industry, 7050 aluminum alloy has a superior strength-to-weight ratio [3]. Such material is a heat-treatable material, and annealing temperature can significantly improve fracture toughness [4], where ageing treatment can be performed to form finely and uniformly distribute precipitates, resulting in improved mechanical properties, such as good corrosion resistance and fatigue resistance [5]. This material is usually used in the aircraft’s upper wing panels, where creep ageing forming is one of the typically used techniques to form this material into complex curvature structures.
One of the key research areas relating to CAF is to develop an advanced simulation method that could accurately predict both the spring-back and the post-formed mechanical properties. For now, the generally accepted simulation route includes (1) determining the constitutive relationship of the material based on constant stress creep tests and establishing a simulation model based on evolution theory and (2) applying the uniaxial creep ageing law to complex stress state materials based on flow criteria. In the early days, Ho et al. [6] considered the effect of precipitation nucleation and growth on creep deformation of AA7010 aluminum alloy under CAF conditions and developed a new set of ageing creep constitutive equations to better fit the creep curves. To further optimize the creep ageing constitutive equation, Lin et al. [7] considered and modeled factors such as stress relaxation and precipitation hardening during the forming process, mainly used in the manufacture of complex-shaped panel components. Furthermore, Zheng et al. [8] studied the stress relaxation behaviour of 7xxx aluminum alloy, considering the microstructure evolution during the stress relaxation process to construct a multi-stage stress relaxation model, which can provide a good prediction of the residual stress distribution after CAF. In the tensile and compressive stress state, Li et al. [9] researched 2050 aluminum alloy and showed that the creep strains produced using tension under the same ageing conditions are 1.5 to 3 times that of compression. Rahmatabadi et al. [10] studied the influence of ultrasonic vibration on the formability of annealed Al5052/MgAZ31B and found that ultrasonic vibration can prompt the dislocation movement. Wang et al. [11] constructed a constitutive model for the stress relaxation ageing behaviour of AA2219 aluminum alloy. The spring-back error of the model is about 16.8% from simulation and experiment. From the existing research, we can clearly see that these studies are based on the material constitutive model. Although the research content is gradually refined, the relationship of the internal stress state, creep, and stress relaxation during the forming of the component is still not well explained, and through an in-depth study, the relationship between creep and stress relaxation under the CAF conditions needs to be further established.
Considering relevant research on the relationship between creep and stress relaxation, Guo et al. [12] established a model based on the Schlottner–Seeley procedure and creep damage equation to predict stress relaxation. The prediction result of this model is close to the experiment, which is used to predict the stress relaxation of high-temperature materials. Zhan et al. [13] studied the creep and stress relaxation behaviour of aged 7055 aluminum alloy and found that the creep and stress relaxation curves can be divided into two stages. However, the creep ageing constitutive equation cannot predict the stress relaxation ageing test results, which indicates that there is no one-to-one correspondence between creep and stress relaxation. In order to consider the effects of ageing precipitation on the creep and stress relaxation of 7075 aluminum alloy, Lihua et al. [14] fitted the secondary creep curve based on ageing stress relaxation experiment. The research indicates the steady-state stress relaxation stage can be regarded as the accumulation of creep in a minute. However, these studies were limited to the construction of relevant models to transform the creep and stress relaxation curves, and the relationship between them has not been quantified from the experiments. At present, there is still a lack of relevant research on 7050 aluminum alloys for aviation. It is urgent to study the relationship between creep and stress relaxation of 7050 aluminum alloy and further compare the relationship between them to provide a theoretical basis for the CAF process.
In this work, the relationship between creep and stress relaxation behaviour of 7050 aluminum alloy under the creep ageing forming conditions was studied. Creep strain rates were extracted from the experimental observed creep and stress relaxation curves, and the creep mechanisms were discussed based on the extracted n values. Further connection between stress relaxation and creep under T74 multi-stage ageing conditions was studied.
2. Experimental Procedures
2.1. Material and Sample Geometry
The material used in this study was wrought of 7050 aluminum alloy under T74 conditions and was cut from an aircraft upper wing panel. The alloy composition is shown in Table 1. Samples, with detailed geometries given in Figure 1, were designed based on Instron 5584 and the attached fitting [15,16,17] and manufactured with their axial direction parallel to the rolling direction.

Table 1.
Chemical composition of 7050 (wt.%).

Figure 1.
The dimensions of the sample (dimensions in mm).
2.2. Single-Stage Creep and Stress Relaxation Tests
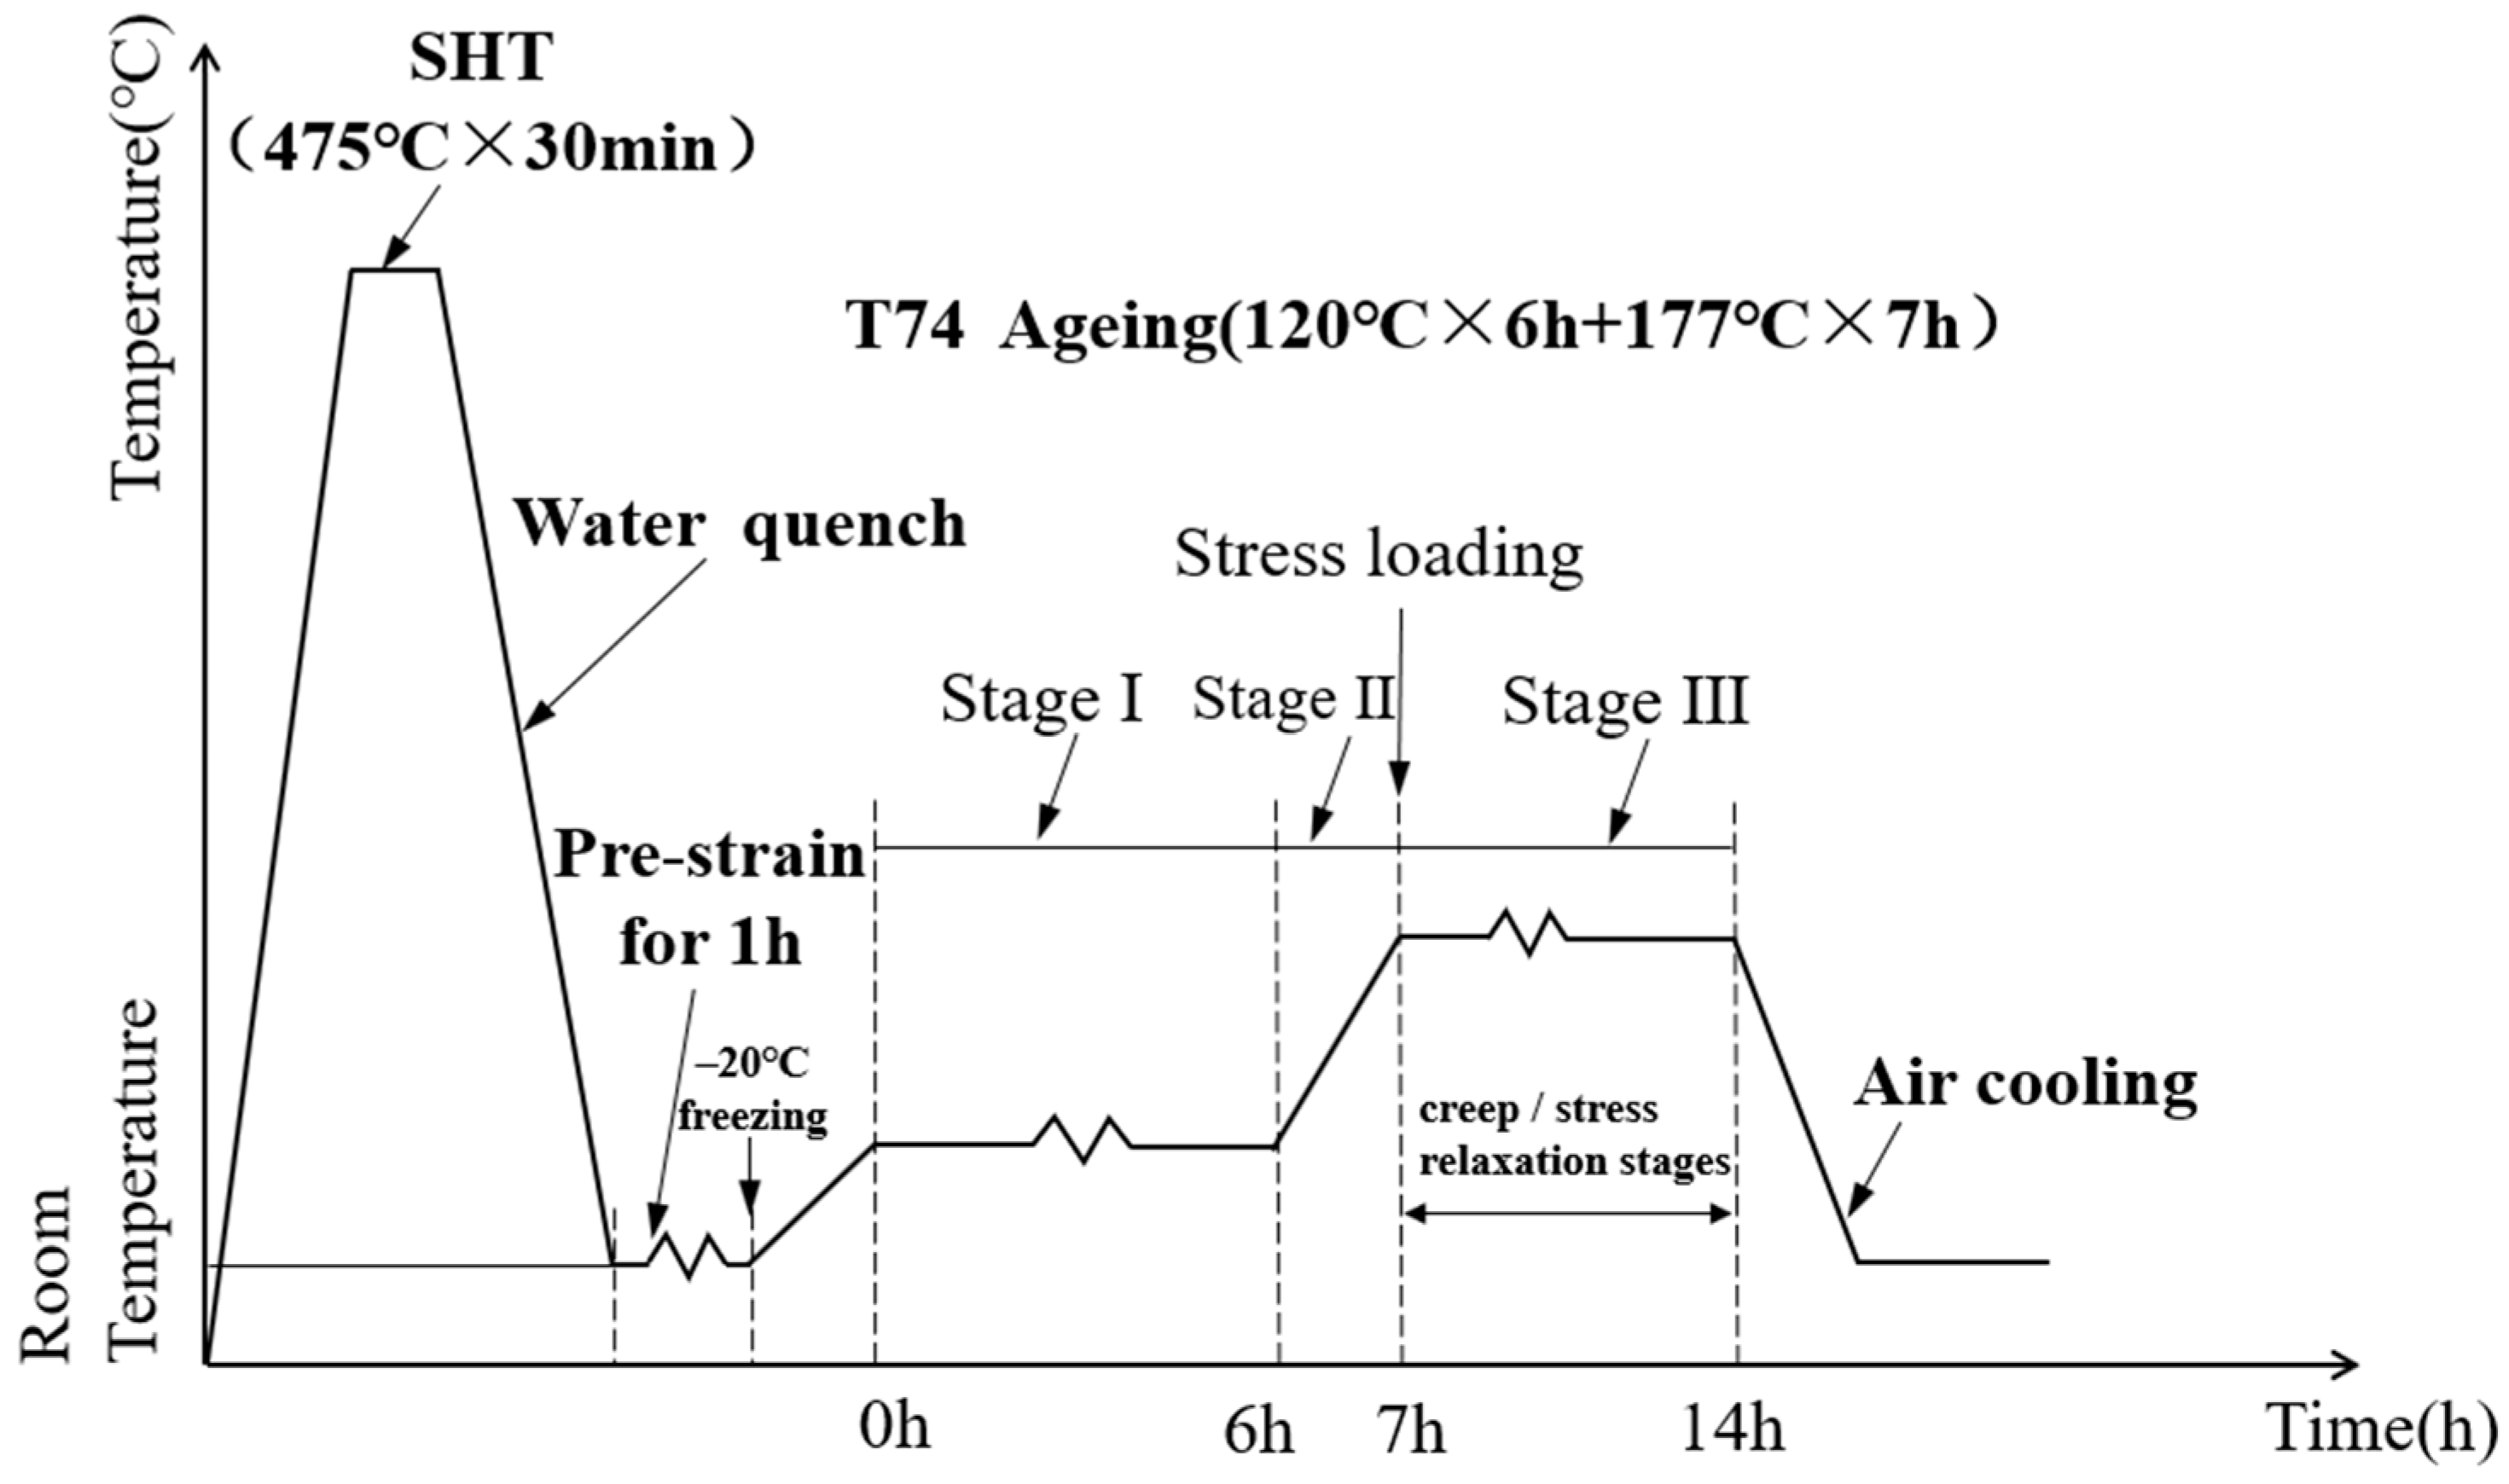
Figure 2 shows the temperature profile of the single-stage creep and stress relation ageing (177 °C × 7 h) tests. Firstly, all samples were subjected to a solution heat treatment (SHT) at 475 °C for 30 min and then to water quenching. Within one hour, a room temperature pre-deformation of 1% was carried out to simulate the component residual stress relieving stage in the industrial production line. These pre-deformed samples were then frozen at −20 °C to prevent any natural ageing [18].

Figure 2.
The schematic illustration of the temperature profile for the proposed single-stage creep and stress relaxation tests of 7050 aluminum alloy.
For creep tests, the quenched and pre-strained samples were placed in the middle of a furnace. A thermocouple was attached to the sample to record the temperature evolutions, guaranteeing that the temperature of the sample was controlled within 1 °C of the designed temperature. A capacitance gauge was connected to the sample gauge length to measure the displacement, and hence the creep strains. T74 ageing treatment was then applied, where the temperature of the samples was controlled at 120 °C lasting for 6 h followed by 177 °C lasting for 7 h. The schematic temperature profile is illustrated in Figure 2, where Stage I represents the low temperature soaking stage at 120 °C, and Stage II represents the high temperature soaking stage at 177 °C. According to [18], at the low temperature stage (i.e., 120 °C), negligible creep is activated. To eliminate any possible errors from thermal expansion, etc., and provide a clearer comparison between creep and stress relaxations, both creep and stress relaxation tests start from Stage II, where the temperature was stabled at 177 °C. Samples were loaded to different load levels, ranging from 195 MPa to 270 MPa, at the start of the second stage, when the temperature reached 177 °C, as shown in Figure 2. Constant loads were then held for 7 h, and both the creep strain and the temperature evolutions were recorded.
For stress relaxation tests, an identical temperature profile was applied to the samples. Despite applying constant strains, constant loads, ranging from 220 MPa to 315 MPa, were employed for the samples. Both stress relaxation curves and temperatures were recorded. Note that the constant strain was guaranteed from an attached extensometer to the sample to ensure the reliability of the tests.
3. Results
3.1. Single-Stage Creep and Stress Relaxation Curves
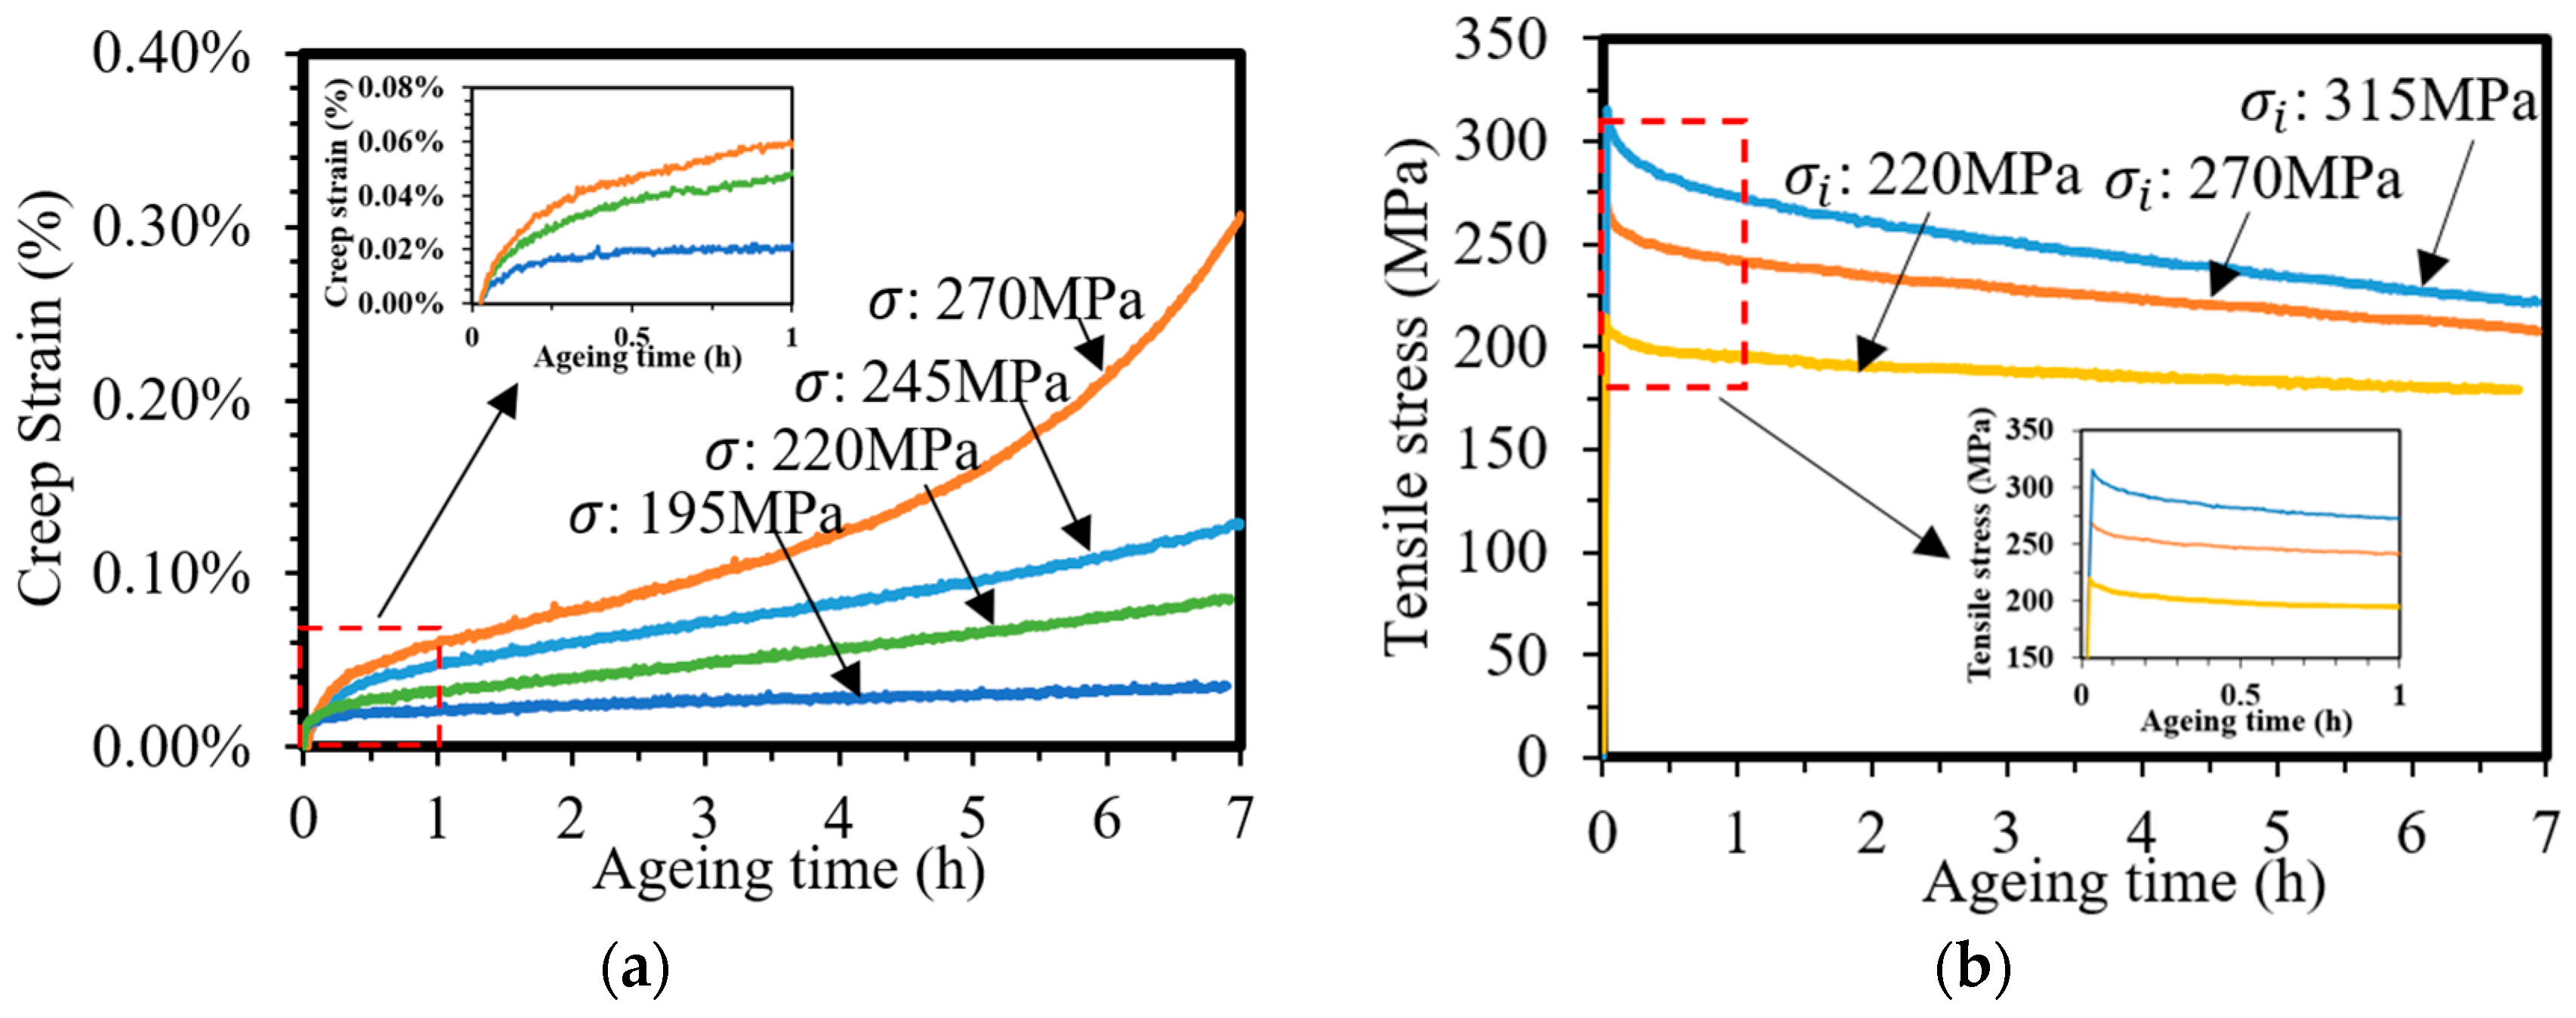
Figure 3a shows the creep curves of 7050 aluminum alloy aged at 177 °C under different stress levels. The creep curves under the stress levels of 195–245 MPa experienced a primary creep stage, and there was a fast increase in creep strains with reduced creep strain rates with time, followed by a secondary creep, i.e., steady-state creep, within 7 h. The total creep strain accumulations after the 7 h ageing treatment reached 0.10% under the stress level of 245 MPa. The primary creep, where the initial creep strain rate was high followed by a fast reduction, is attributed to the accumulation of the dislocations, as suggested by Xu et al. [19]. The subsequent decrease in strain rate was a result of the increase in deformation resistance caused by the entanglement of dislocations and dispersed phases in the matrix. For the steady-state creep region, the creep strain rate was considered a constant due to the saturation of the dislocations. While under 270 MPa, the creep curve entered the tertiary creep region after ageing for about 5 h. The existence of the tertiary creep may be attributed to the internal coalescence of the voids or the change of cross-sectional area caused by necking during creep [18]. Hence, 270 MPa is too high for the creep ageing forming process, where during ageing, non-visible voids may be formed, which will surely damage the final mechanical property of the formed parts.


Figure 3.
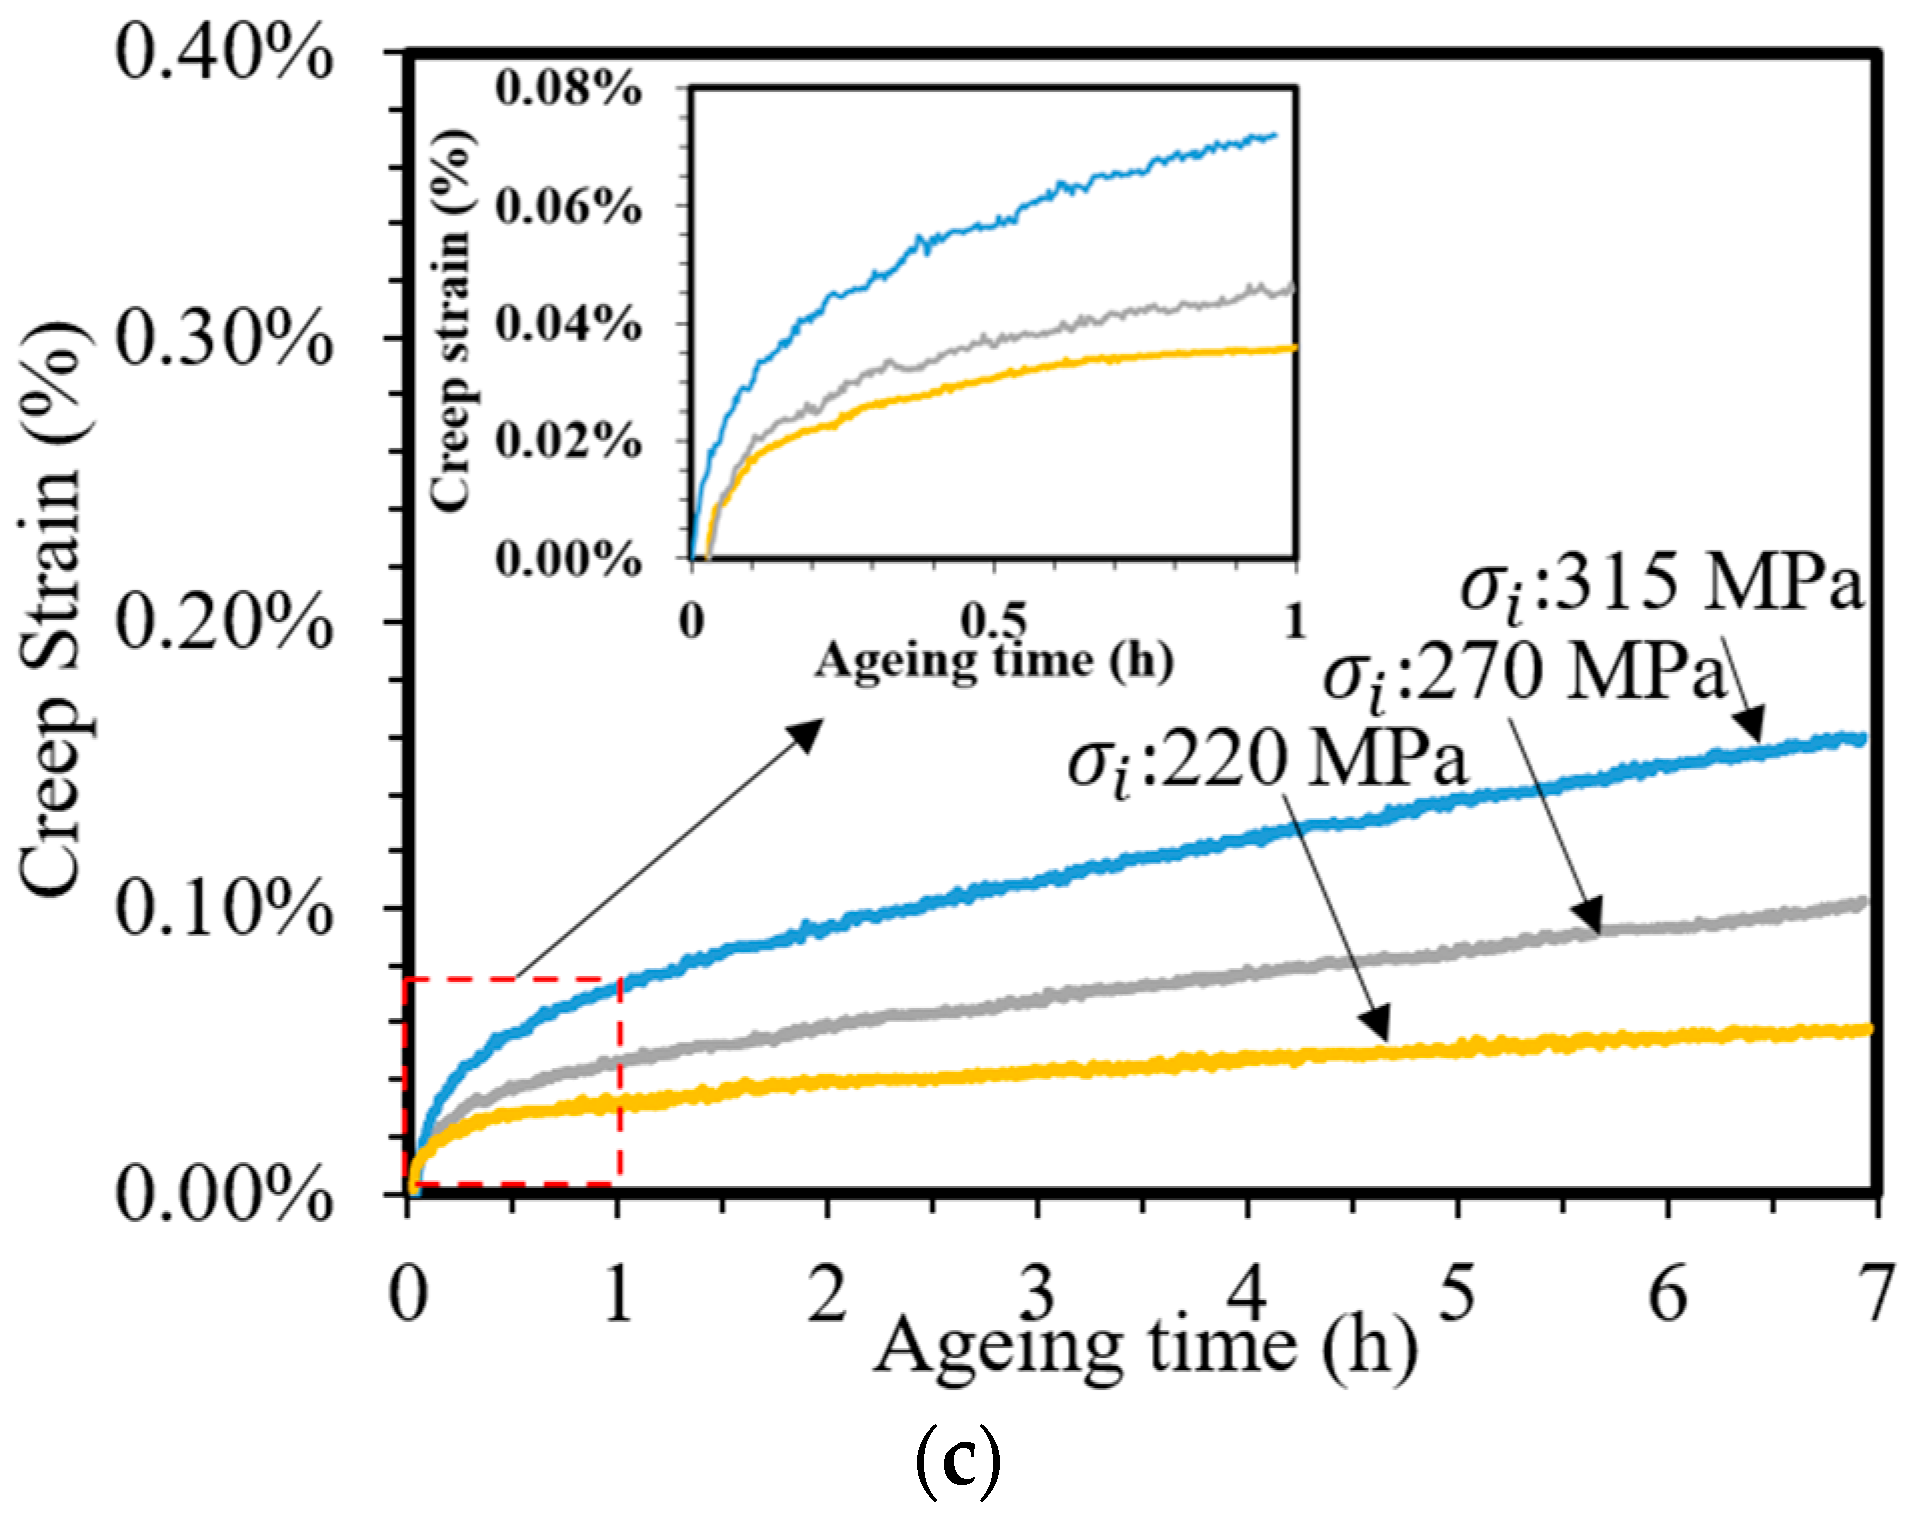
(a) Creep and (b) stress relaxation curves of 7050 aluminum alloy with various stress levels during ageing at 177 °C. (c) The creep strains extracted from the stress relaxation curves in (b) were calculated using Equation (2). Note that and represent the stress and initial stress levels during creep and stress relaxation tests, respectively.
Figure 3b shows the stress relaxation curves of 7050 aluminum alloy under different stress levels at 177 °C. The initial stresses were 220 MPa, 270 MPa, and 315 MPa. Typical stress relaxation curves, a fast decrease followed by gradually reduced stress relaxation rates with time, were observed during the ageing process. Higher initial stress led to more stress relaxation, as expected. After 7 h of stress relaxation ageing treatment, the stress levels were reduced by 18.6%, 23.3%, and 29.2%, respectively. The effect of initial stress on stress relaxation is mainly manifested in the early stage of stress relaxation. In this stage, larger initial stresses will produce large lattice spaces, and the diffusion rate of atoms will increase, resulting in easy dislocation movement and promoting stress relaxation [20]. In addition, according to the rate of stress relaxation, the stress relaxation curve can be divided into the rapid relaxation stage and the stable relaxation stage. Wang et al. [11] consider that the sample is pre-deformed before the test, and there are many movable dislocations in the alloy matrix. In the rapid relaxation stage, when the applied effective stress is large, the dislocations, vacancies, and other defects with small resistance to movement in the matrix can move, making stress decrease rapidly. Similar to creep, during the stress relaxation process, dislocation continues to form and reach a saturated value. Hence the stress relaxation curves reach the “steady-state” stage afterward. From Figure 3b, one can observe that no clear threshold stress levels could be distinguished. This is different from the traditional understanding of stress relaxation curves [21]. The absence of threshold stresses may be attributed to the continuously coarsened precipitates [22]. T74 ageing treatment is an over-ageing treatment, where at the later stage of ageing, precipitates are coarsened, leading to reduced strength and increased stress corrosion cracking resistance [3,23]. Hence, the continuously coarsened precipitates may lead to reduced creep resistance, resulting in missing the threshold stresses [24].
To enable better comparison between the creep and the stress relaxation curves, the accumulation of the creep strains from the stress relaxation curves is extracted [25]. Stress relaxation occurs under constant strain conditions, where the total strain is a sum of elastic and creep strains, as provided in Equation (1):
where represents the total strain and is a constant, represents the elastic strain, represents the strain from creep tests, is the stress value from the stress relaxation experiment, and E is the elastic modulus, which is 72 GPa for 7050 aluminum alloy [26].
With the extension of time, the elastic strains gradually transform into in-elastic ones. Hence, the creep strain from stress relaxation tests can be extracted using Equation (2):
The extracted creep strains from the stress relaxation curves under different stress relaxation conditions are presented in Figure 3c. The creep strains under 220 MPa, 270 MPa, and 315 MPa had similar trends, including accelerated creep and steady-state creep. Higher initial stress led to larger creep strain values. After 7 h of stress relaxation ageing, the total creep strains of 315 MPa, 270 MPa, and 220 MPa reached 0.16%, 0.10%, and 0.05%. This indicates that larger initial stress will produce larger lattice space in the elastic region, which is beneficial to the diffusion of atoms, accelerating the generation of creep strain.
Comparing the creep curve in Figure 3a,c, though the initial stress for the blue curve reaches 315 MPa, the creep has not entered the tertiary creep region. This indicates that stress relaxation can effectively prevent the material from entering the accelerated creep stage and prevent the material from breaking due to the accumulation of internal voids. It is believed that the major deformation mechanisms for stress relaxation include dislocation climb and grain boundary slip. The existence of dislocations provides a driving force for stress relaxation, and grain boundaries provide channels for atom diffusion, which jointly determine stress relaxation [24]. The absence of the tertiary creep region may be attributed to the continuously reduced stresses. Though the initial stress was high, before the creep could reach its tertiary region (i.e., after 4 hours creep at 270 MPa as seen in Figure 3a), the stress had already gradually reduced to a value below 270 MPa at 1 h. Therefore, the reduced stress was not able to provide sufficient energy for the formation of voids, which is believed to be the main reason for the existence of tertiary creep.
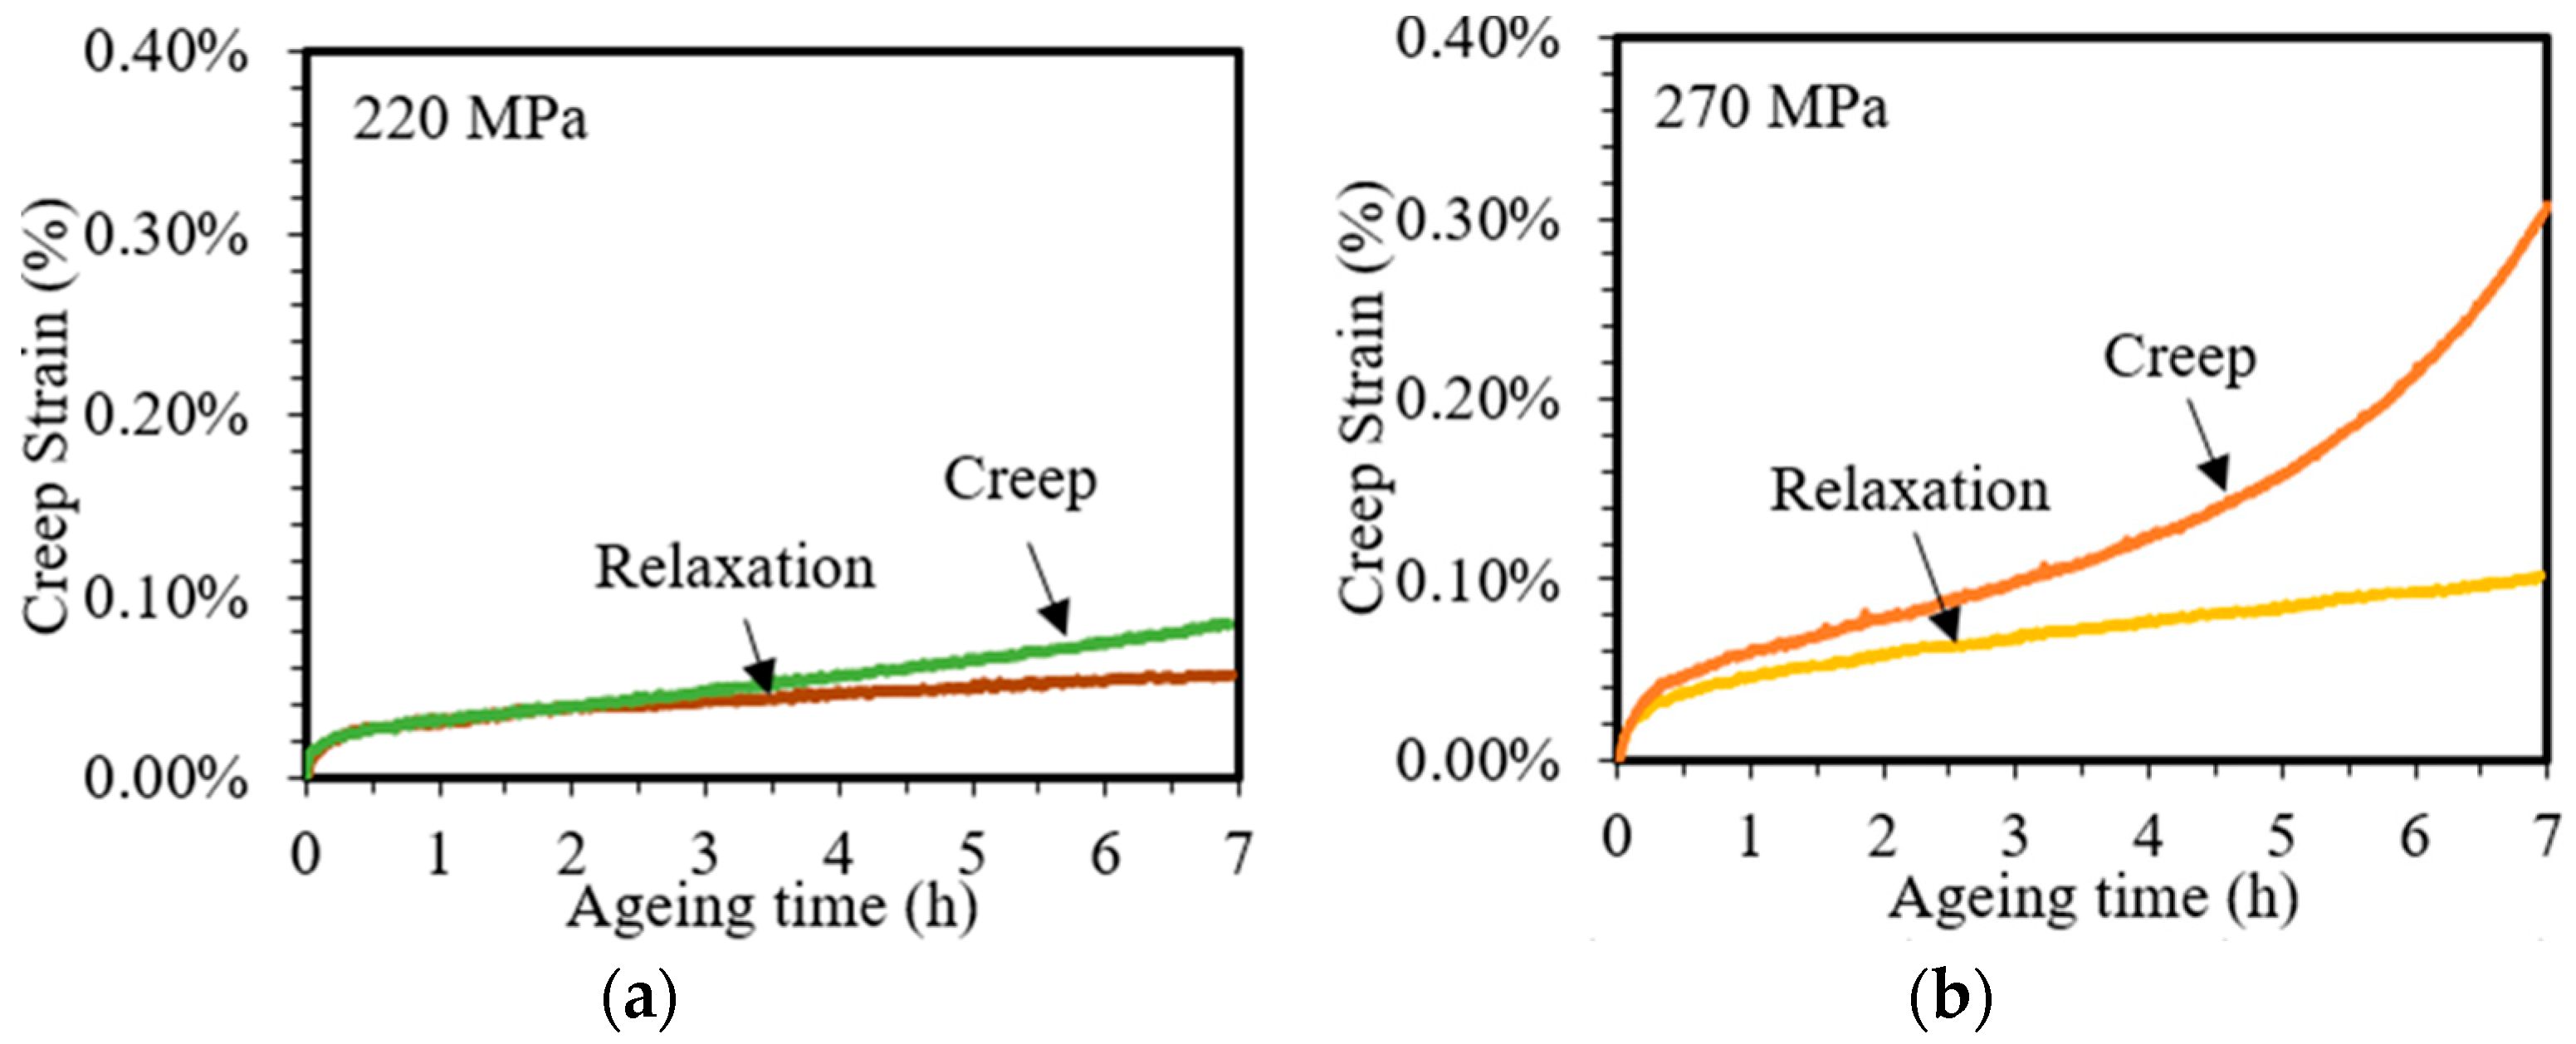
Figure 4 compares the creep strain accumulations generated from constant load creep tests and constant strain stress relaxation tests under an identical initial stress level of 220 MPa and 270 MPa. The creep strain presented from relaxation tests were calculated by substituting the measured stress into Equation (2). For clarity, 220 MPa and 270 MPa are the stress levels for creep and the initial stress levels for stress relaxation.

Figure 4.
Comparison between creep and stress relaxation curves of 7050 aluminum alloy with (a) 220 MPa and (b) 270 MPa.
Figure 4a presents the creep strain accumulations at 220 MPa; both curves stay in the steady-state creep region during the ageing time of 7 h, and the creep strain rates before 2 h are similar. The creep strain accumulations nearly coincide at the early stage before ageing for 2 h. This may be attributed to the fact that both creep and stress relaxation are activated by initial stresses, causing dislocations to move and produce similar amounts of creep. After 2 h ageing, the creep strain generation from creep tests became higher than that from stress relaxation tests. After 7 h ageing, a total creep strain of 0.086% was achieved from creep while 0.058% was achieved from stress relaxation. The lower creep strains generated from stress relaxation tests may be attributed to the reduced stress levels during stress relaxations.
There is a big difference between the creep strain accumulation curves from creep and stress relaxation tests under 270 MPa in Figure 4b. The strain from creep tests accumulations nearly coincides at the early stage. After a certain point, the creep strain generation from creep tests is higher than that from stress relaxation tests until 7 h ageing, which has an accelerated creep stage. After 7 h ageing, a total creep strain of 0.307% was achieved from creep, which is 3 times that of 0.102% from stress relaxation. This means that the creep strain accumulation curves from stress relaxation under 220–270 MPa are always in the steady-state stage, effectively avoiding material fracture and providing more stable forming for creep ageing.
3.2. Comparison of the Creep Strain Rates between Creep and Stress Relaxation
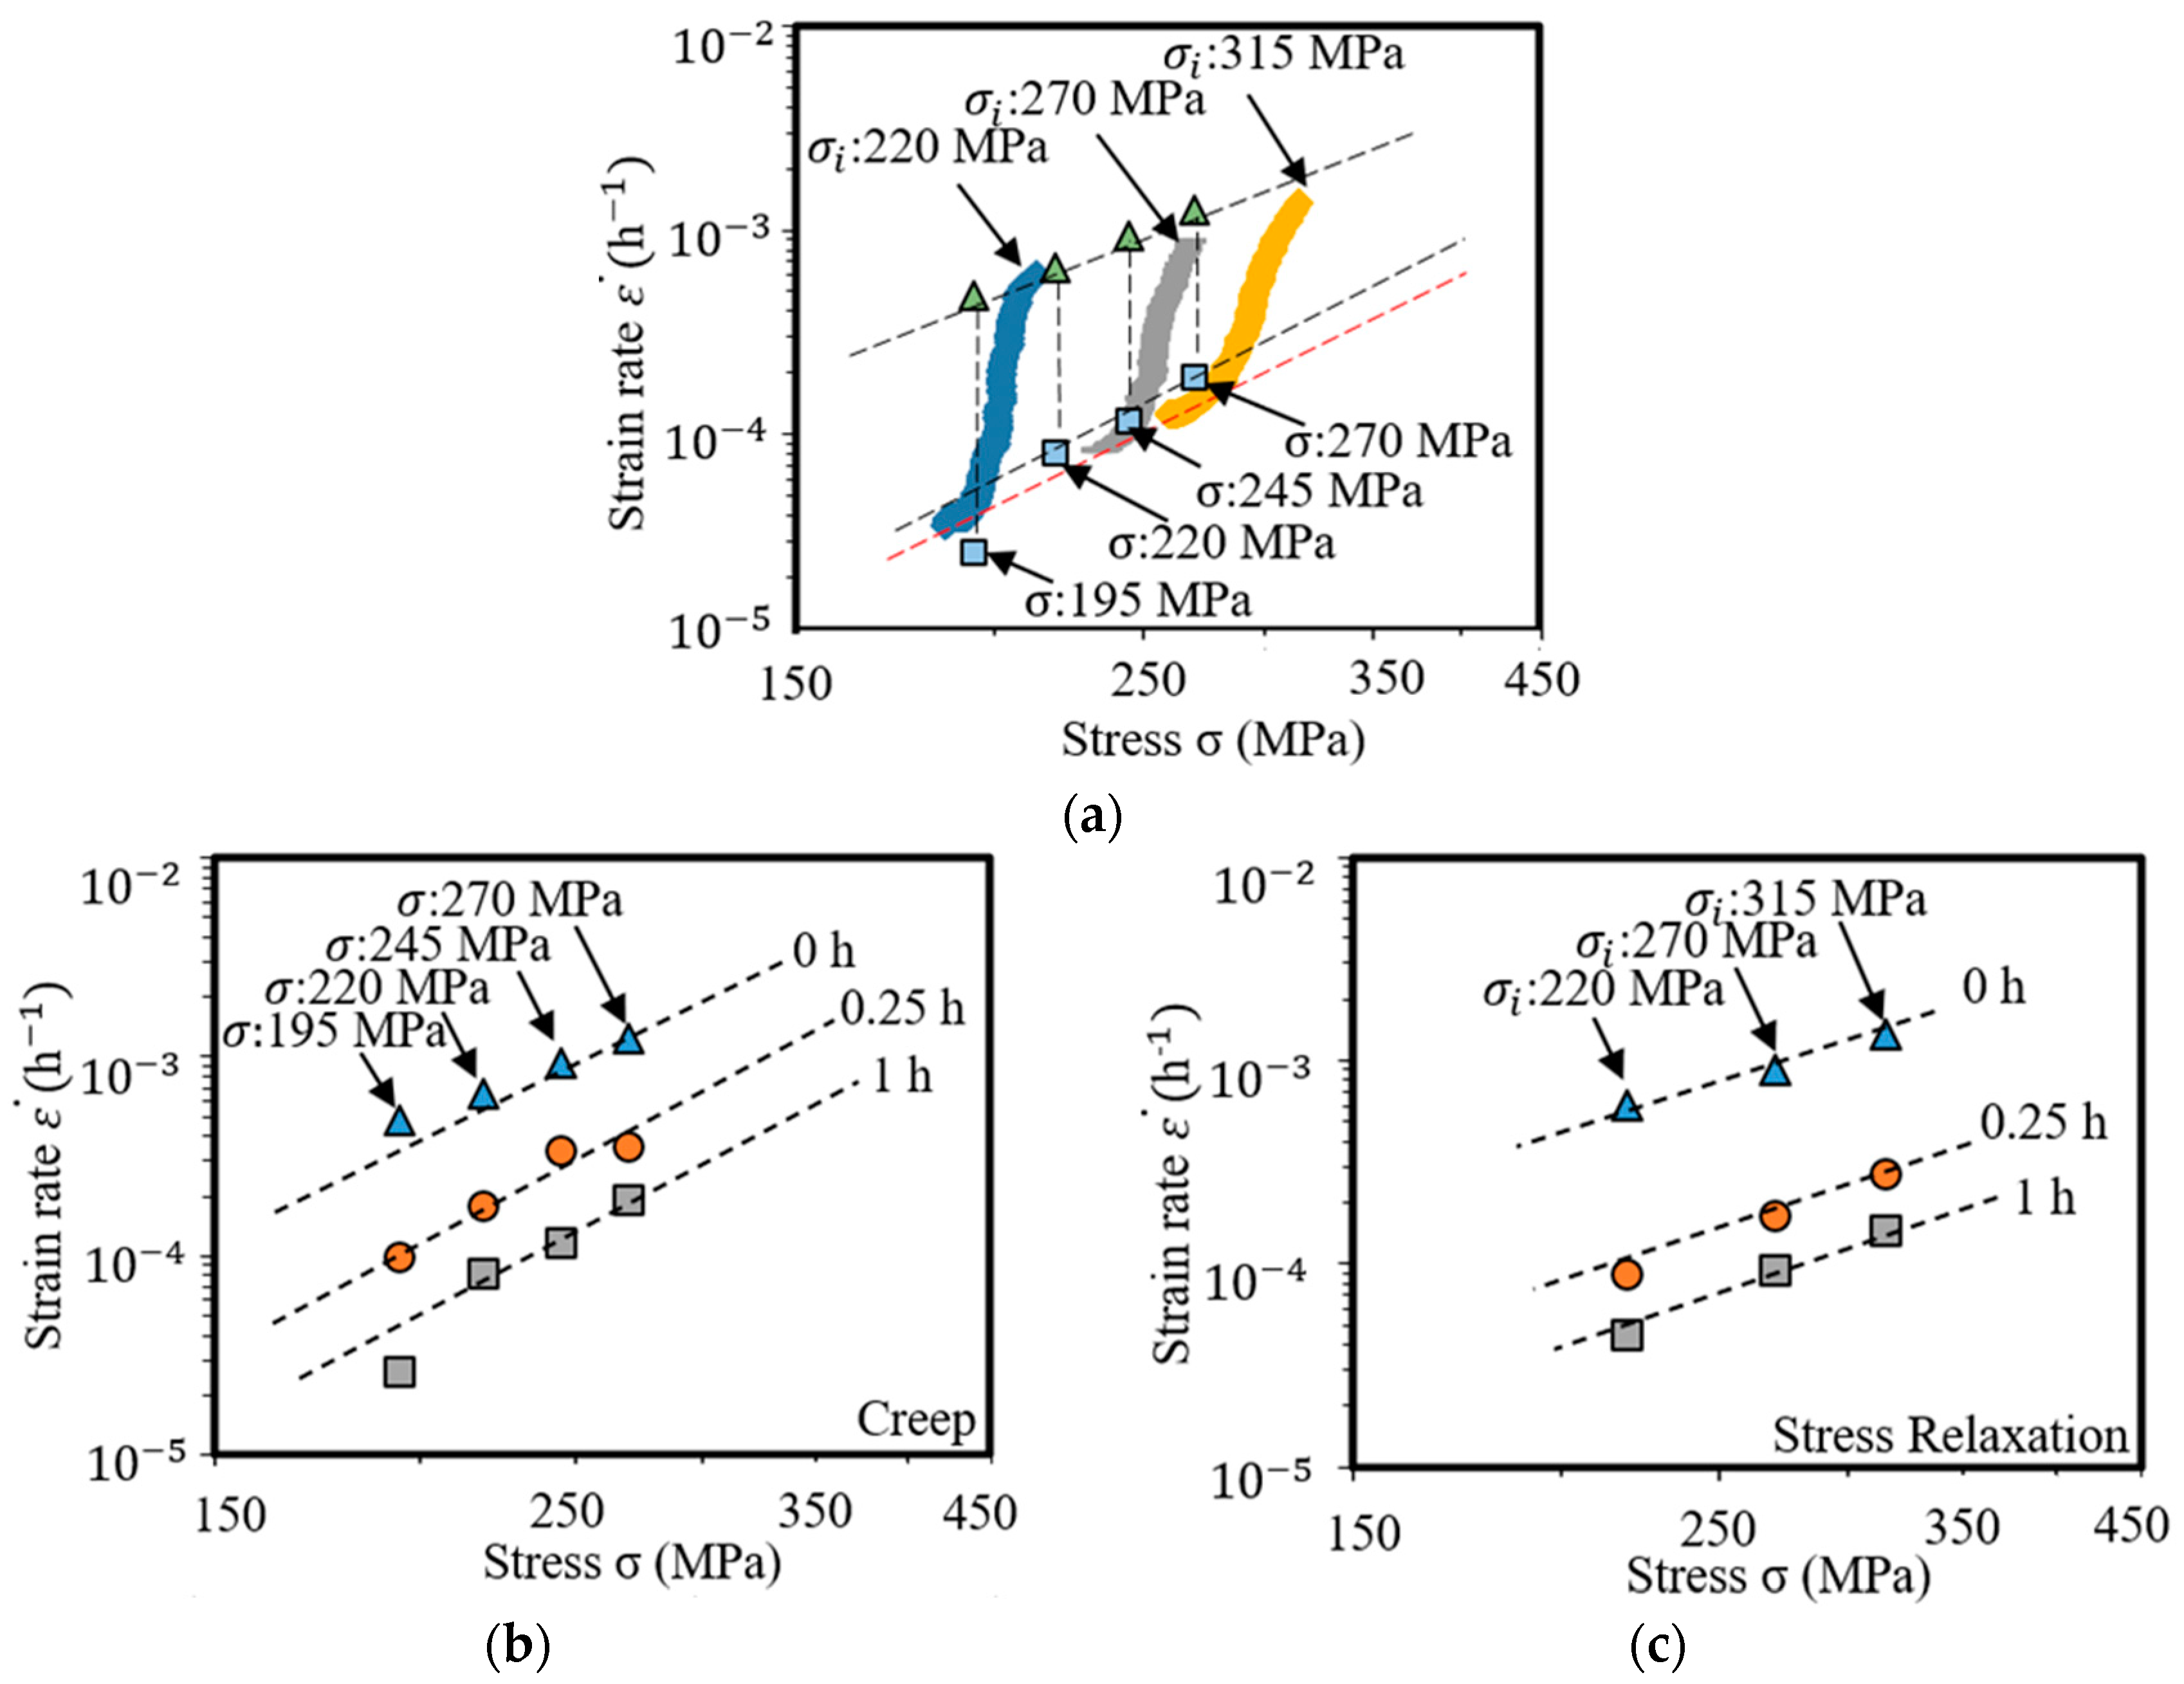
Figure 5a presents the strain rates calculated from both creep tests and stress relaxation tests under different stress levels. Polygons are strain rates from creep tests. Solid lines are strain rates from stress relaxation tests.
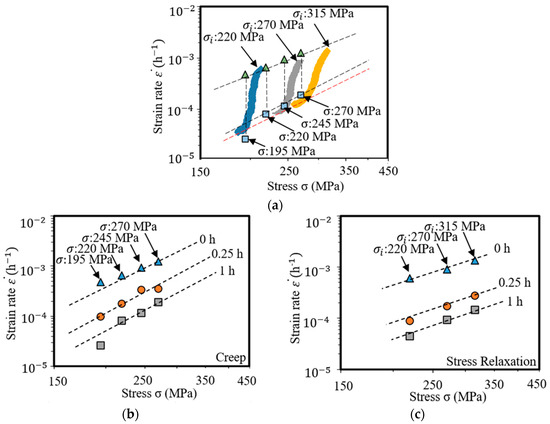
Figure 5.
(a) Strain rates vs. stress in log scales. Polygons are strain rates from creep tests. Solid lines are strain rates from stress relaxation tests in ageing extracted from Figure 3c, i.e., slope of creep strain under different stresses. (b) The initial (0 h), transient (0.25 h), and steady-state (1 h) creep strain rates are obtained from creep under different stresses. (c) The initial (0 h), transient (0.25 h), and steady-state (1 h) creep strain rates are obtained from stress relaxation under different initial stresses.
Considering the creep strain rates from the creep tests, both the maximum creep rate and the steady creep rate increased with the increase of stress. This indicates that the increase of stress accelerates the generation of creep strain [27]. Increasing the stress level from 195 MPa to 270 MPa, the steady state creep strain rates increased from 2.62 × 10⁻⁵ h−1 to 1.90 × 10⁻⁴ h−1. Under the studied stress levels, the initial creep strain rates are around 7 times higher than that of steady-state creep strain rates.
The steady-state creep strain rate is a sign that relates to the dominant creep mechanisms. The power-law relationship is one of the generally accepted ways [28] to quantitatively describe the relationship between the creep strain rate, , and stress, σ, as provided in Equations (3) and (4):
where n is the stress exponent, A is a temperature-dependent material constant that obeys the Arrhenius law, Q is the activated energy, R is the gas constant, and T is Kelvin temperature. The n value could then be determined from the slope of vs. σ plot in its log-log scale in Figure 5a.
The calculated n value is 3.7 from the steady-state creep strain rate. According to [20,29], an n value of 2–3 represents the dominant creep mechanism and is considered grain boundary sliding, while an n value of 3–4 is considered as dislocation creep. Therefore, n = 3.7 in this work indicates that under the studied temperature and stress range, the dominant mechanism is dislocation creep. With the extension of ageing time, the strain rate of the material decreases from the initial rate to the steady state rate; the extent of decrease is ~90% for all conditions. Creep strain rate evolution of creep and stress relaxation is shown in Table 2.

Table 2.
Creep strain rate of single-stage creep/stress relaxation.
Figure 5b presents the creep strain rates from creep tests, where the triangle symbol presents the initial creep strain rate, the circle symbol presents the strain rate of 0.25 h, and the square symbol presents the steady creep strain rate. Figure 5c presents the creep strain rates from stress relaxation tests, where the triangle symbol presents the initial creep strain rate, the circle symbol presents the strain rate of 0.25 h, and the square symbol presents the steady creep strain rate. It has been found that the initial creep strain rates extracted from the studied stress levels from creep and stress relaxation tests all stay along a straight line. The slope of the straight lines is similar to that for the steady-state creep strain rates. Some previous literature [8,30,31], which tried to build advanced constitutive equations based on the power-law relationship, modified the expression of the exponent, n, and enabled it to evolve in the creep process, aiming to improve the accuracy in describing the creep and stress relaxation behaviours. From the experimental results shown in Figure 5b,c, the n value is unchanged in the initial and steady-state creep region. Hence, from a constitutive modeling perspective, the evolved creep strain value with time is believed to be attributed to the evolved A values, which are related to the activation energy and described in Section 3.3 in detail.
The creep strain rates calculated from stress relaxation tests also transited from the initial strain rate to the steady strain rate. The creep strain rates decreased by ~93%, ~91%, and ~90% under stress levels of 220 MPa, 270 MPa, and 315 MPa, respectively. In addition, it has been found that the slope of the steady strain rate calculated from stress relaxation tests is close to the creep tests. The value of n (i.e., 3.5) indicates that the dominant creep mechanism in the steady state region in stress relaxation is also dislocation creep, which is the same with that from creep tests. According to Ashby et al. [32,33], the creep mechanism for metals is determined by the stress level and the temperature. Hence, the dominant creep mechanism is considered unchanged during the tests, while the dominant mechanism for stress relaxation may vary due to the continuously reduced stresses. However, from the calculated n values, one could conclude that under the studied temperature and stress levels, stress relaxation and creep share the same mechanism in the steady state region and may describe each other.
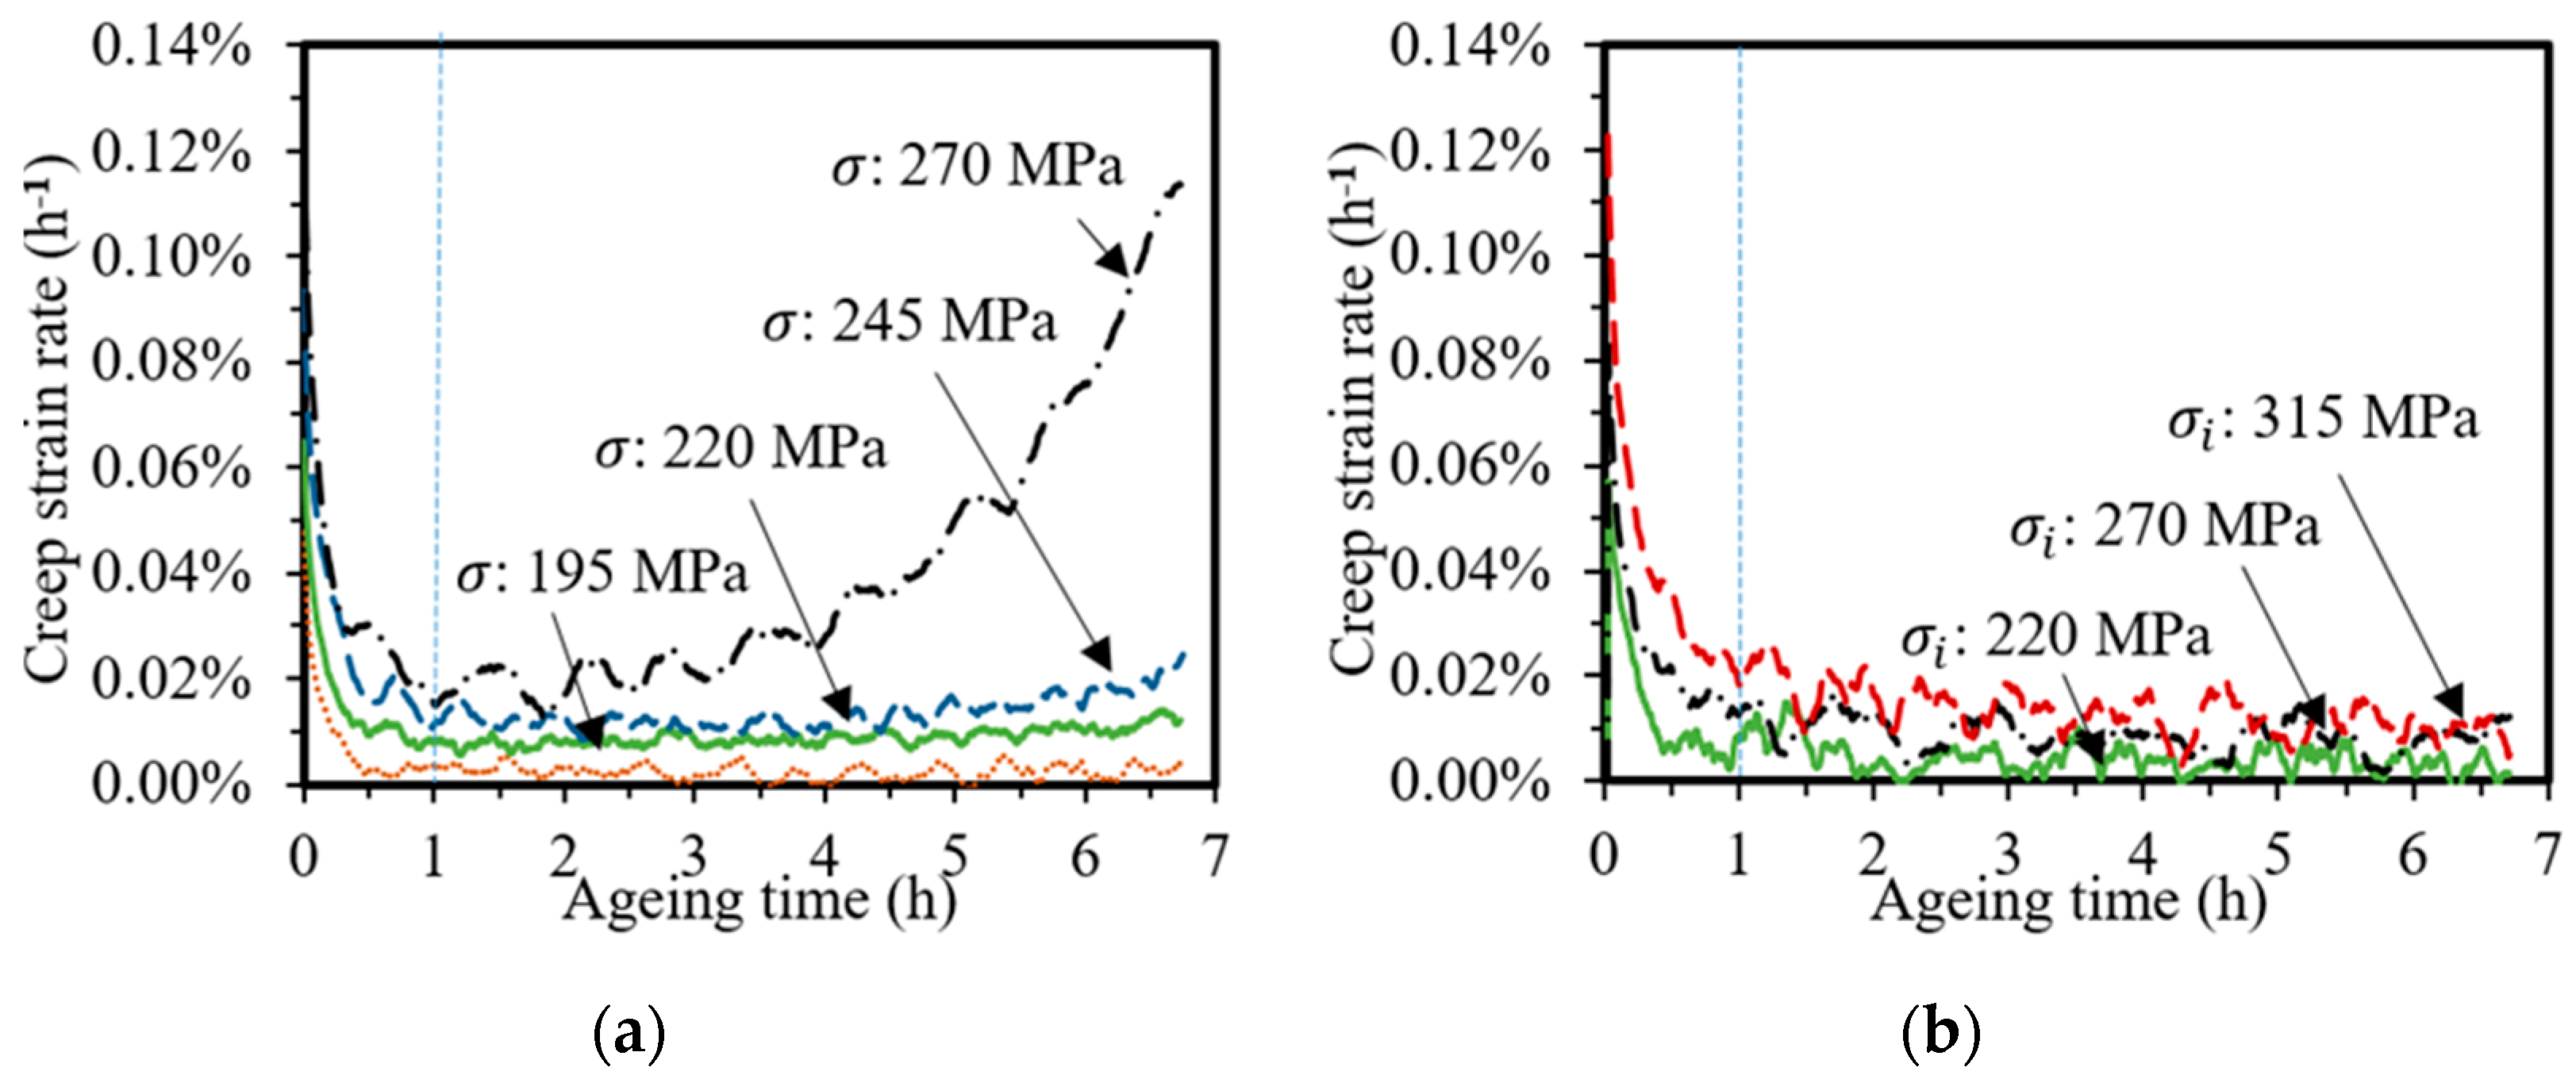
Figure 6 represents the evolution of creep strain rates in creep and stress relaxation tests during ageing at 177 °C. For clarity, 195–270 MPa are the stress levels for creep, and 220–315 MPa are the initial stress levels for stress relaxation.

Figure 6.
Creep strain rate evolution of (a) creep and (b) stress relaxations during ageing at 177 °C extracted from Figure 3a,c.
Figure 6a illustrates the creep strain rate evolution at different stress levels in creep ageing tests. A substantial decrease in the creep strain rate is observed within the first 1 h of ageing. Subsequently, the creep strain rate stays as a constant value for the stress range of 195–245 MPa, while considerably increasing for the stress of 270 MPa. The substantial decrease may be attributed to dislocations beginning to move under the action of thermal activation and stress [34]. After 1 h ageing, the creep strain evolution under 195 MPa, 220 MPa, 245 MPa, and 270 MPa all enter the steady-state creep region, while the creep strain rate at 270 MPa enters the accelerated creep stage after 2.5 h ageing. The high applied stress may rapidly induce tiny cracks caused by stress concentration at the grain boundary [34]. The creep strain evolution curves under 195 MPa, 220 MPa, and 270 MPa could be divided into two stages, i.e., deceleration creep stage and acceleration creep stage, with the time limit of 1 h (marked by the blue dotted line in Figure 7a).

Figure 7.
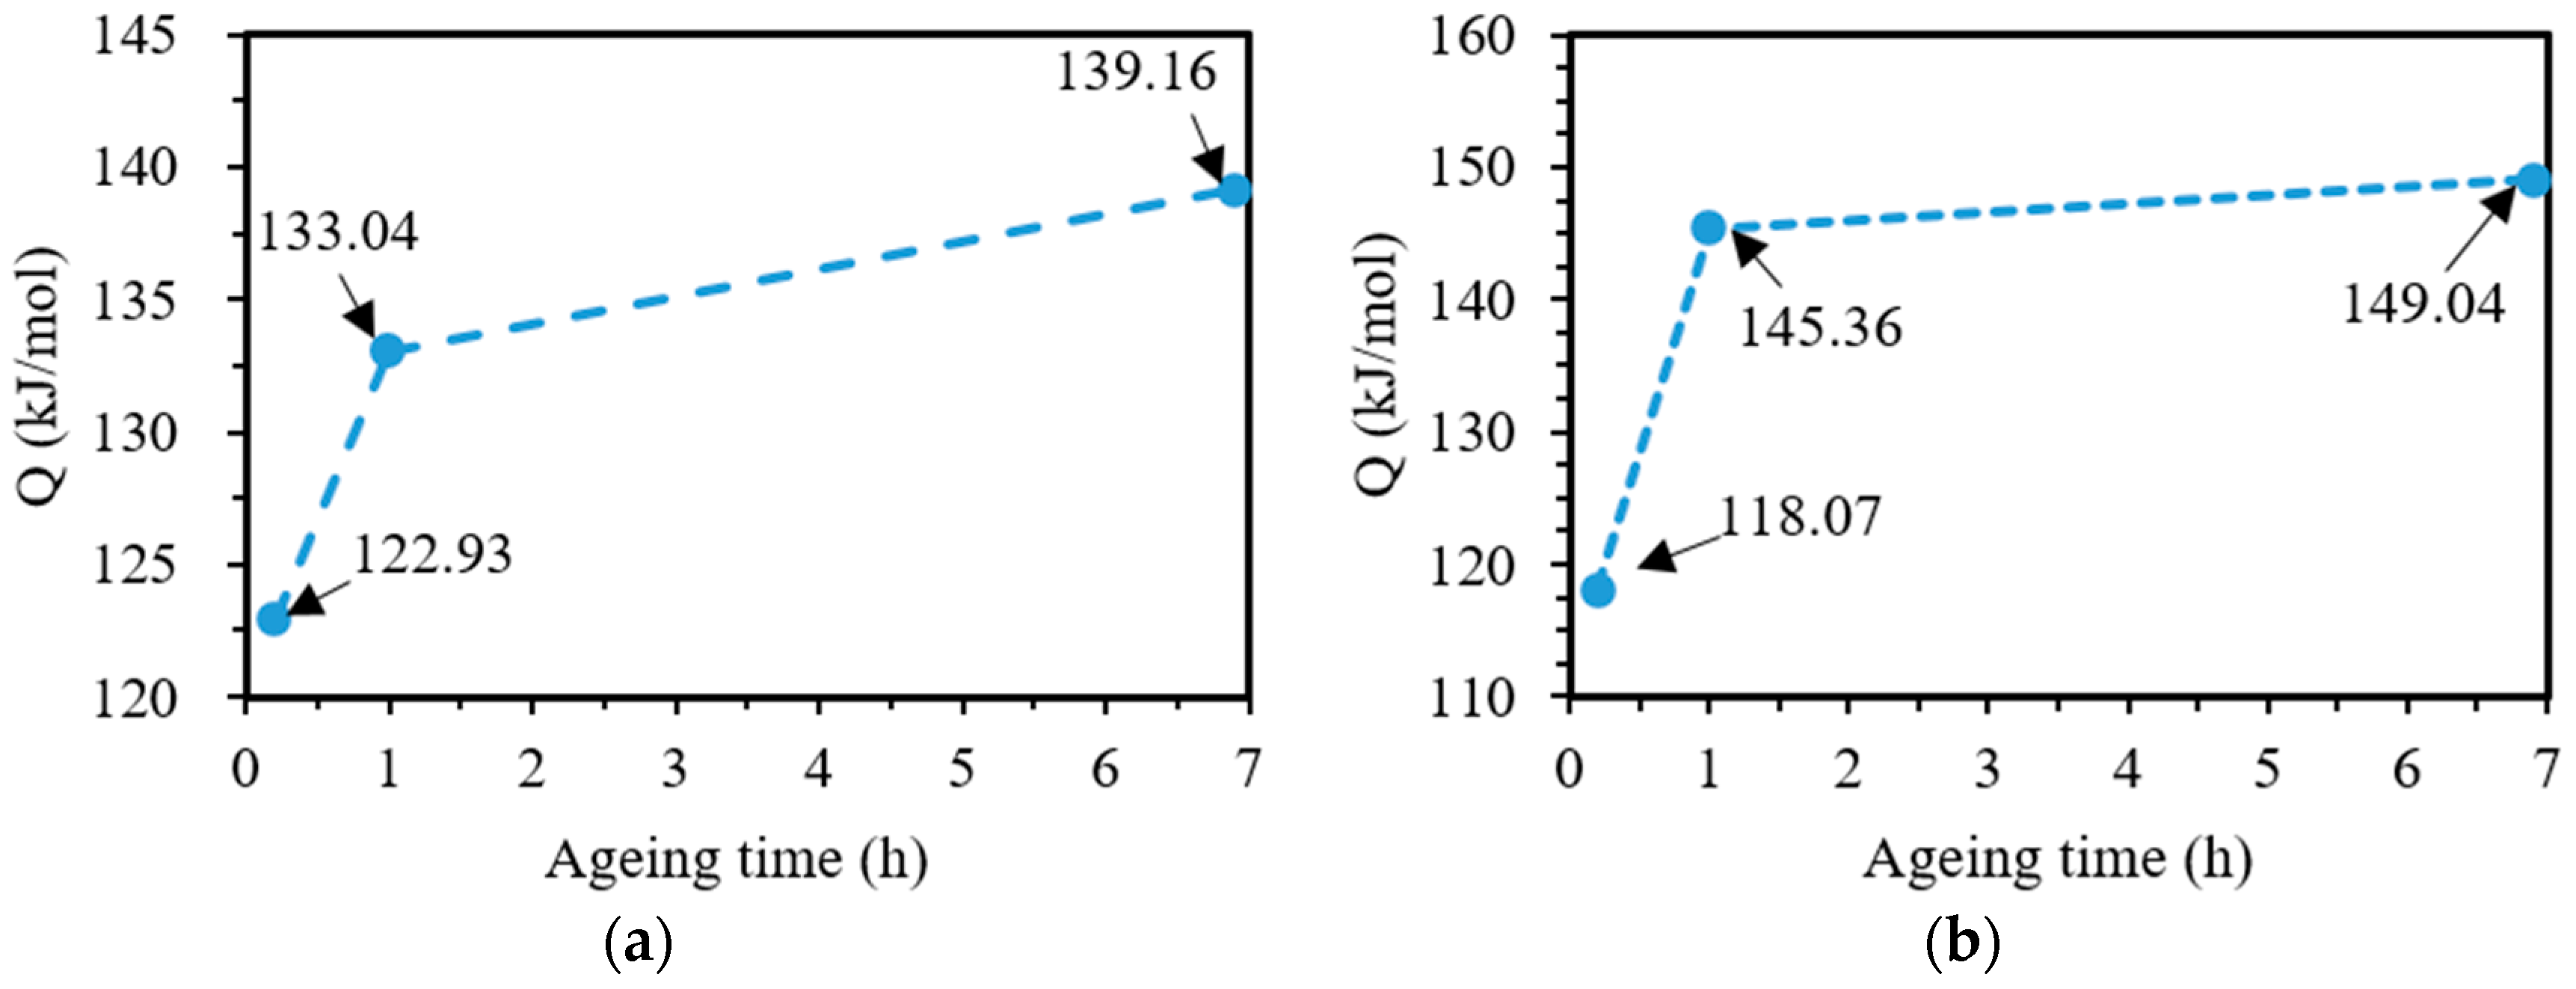
The activation energy Q evolution between (a) creep and (b) stress relaxation tests.
The creep strain evolution at different initial stresses in stress relaxation ageing tests is illustrated in Figure 6b. The creep strain rate of all curves decreases sharply in the initial stage within 1 h. At the early stage of stress relaxation, higher initial stress promotes the movement of dislocations and vacancies, which leads to a higher creep strain rate. With the rapid decrease of stress, the driving force of dislocation movement decreases. After 1 h ageing, the creep strain of all curves enters the steady-state creep. Compared with Figure 6a, although the initial stress has reached 315 MPa, the creep strain does not enter the tertiary creep region. This indicates that stress relaxation can effectively prevent the material from entering the accelerated creep stage. This phenomenon corresponds to information in Figure 3c. Therefore, the division of the creep strain evolution in stress relaxation ageing tests is similar to Figure 6a, which can be divided into two stages, i.e., deceleration creep stage and acceleration creep stage, with a time limit of 1 h (marked by the blue dotted line in Figure 6b).
3.3. Comparison of the Activation Energy between Creep and Stress Relaxation
In this section, the power-law relationship (i.e., Equations (3) and (4)) is adopted, and the activation energy Q is extracted from the creep and stress relaxation tests. Related constants were taken from literature [8], where is 15526, and T is 450 K. n is taken as 3.7, and is unchanged with creep time, as extracted from Figure 5b. The evolution of the activation energy is hence calculated for both creep and stress relaxation tests, as shown in Figure 7.
Figure 7 shows the evolved activation energy with creep time; the activation energies at the initial time for 1 h and steady-state stage are annotated on the Figure 6. As generally accepted, creep activation energy may be a constant. However, the extracted activation energy, as shown in Figure 7a, demonstrated a substantial increase within 1 h of ageing, where the Q value increased from 122.93 kJ/mol to 133.04 kJ/mol. Subsequently, the activation energy slowly increased to 139.16 kJ/mol. It has been found that the evolution of the activation energy corresponds to the lattice self-diffusion activation energy, 123.5–144.4 kJ/mol for aluminum, illustrating that the mechanism of creep is dislocation creep, which is confirmed in this work [35]. According to the research of Shi et al. [36], the activation energy for creep is related to the strain rate. The increasing strain rate increases the dislocation multiplication rate, which reduces the energy required for dislocation movement to overcome the energy barrier. In this study, it was found that decreasing to a stable creep strain rate may induce the insufficient energy of dislocation movement and the decrease of dislocation multiplication rate [37,38,39], which might affect the increased activation energy.
The activation energy of stress relaxation tests is illustrated in Figure 7b. The activation energy increased sharply to reach 145.36 kJ/mol with 1 h time; the rapid increase of activation led to the continuous decrease of stress relaxation rate. This is attributed to the relatively high effective stress and active dislocations due to the pre-strain at the early period of stress relaxation, while the second phase density is low, so the short-range resistance of dislocation movement is small, leading to low activation energy to promote the creep. The activation energy increases when the stress decreases and ageing precipitation occurs [20]. After 1 h ageing, activation energy can be slowly increased to 149.04 kJ/mol, due to the balance between dislocation resistance and effective stress. In addition, the activation energy of 7475 aluminum alloy was studied by Robey et al. [39], during whose study the stress relaxation was 134 kJ/mol, which is similar to this work. The mechanism of stress relaxation is mainly controlled by dislocation creep [25].
Based on the study of the activation energy and the stress exponent, n of creep and stress relaxation, one could conclude that the change of the strain rates during the creep and stress relaxation process is attributed to the evolved activation energy, which increases with a reduced increasing rate during creep. The n value is a constant throughout the studied creep process. This observation could be a support mechanism for building constitutive equations based on the power-law relationship for the creep and stress relaxation behaviour, where the evolution of A shall be related to dislocation density and n shall be a constant that intendent of time.
3.4. Comparison between Single- and Multi-Stage Stress Relaxation Curves
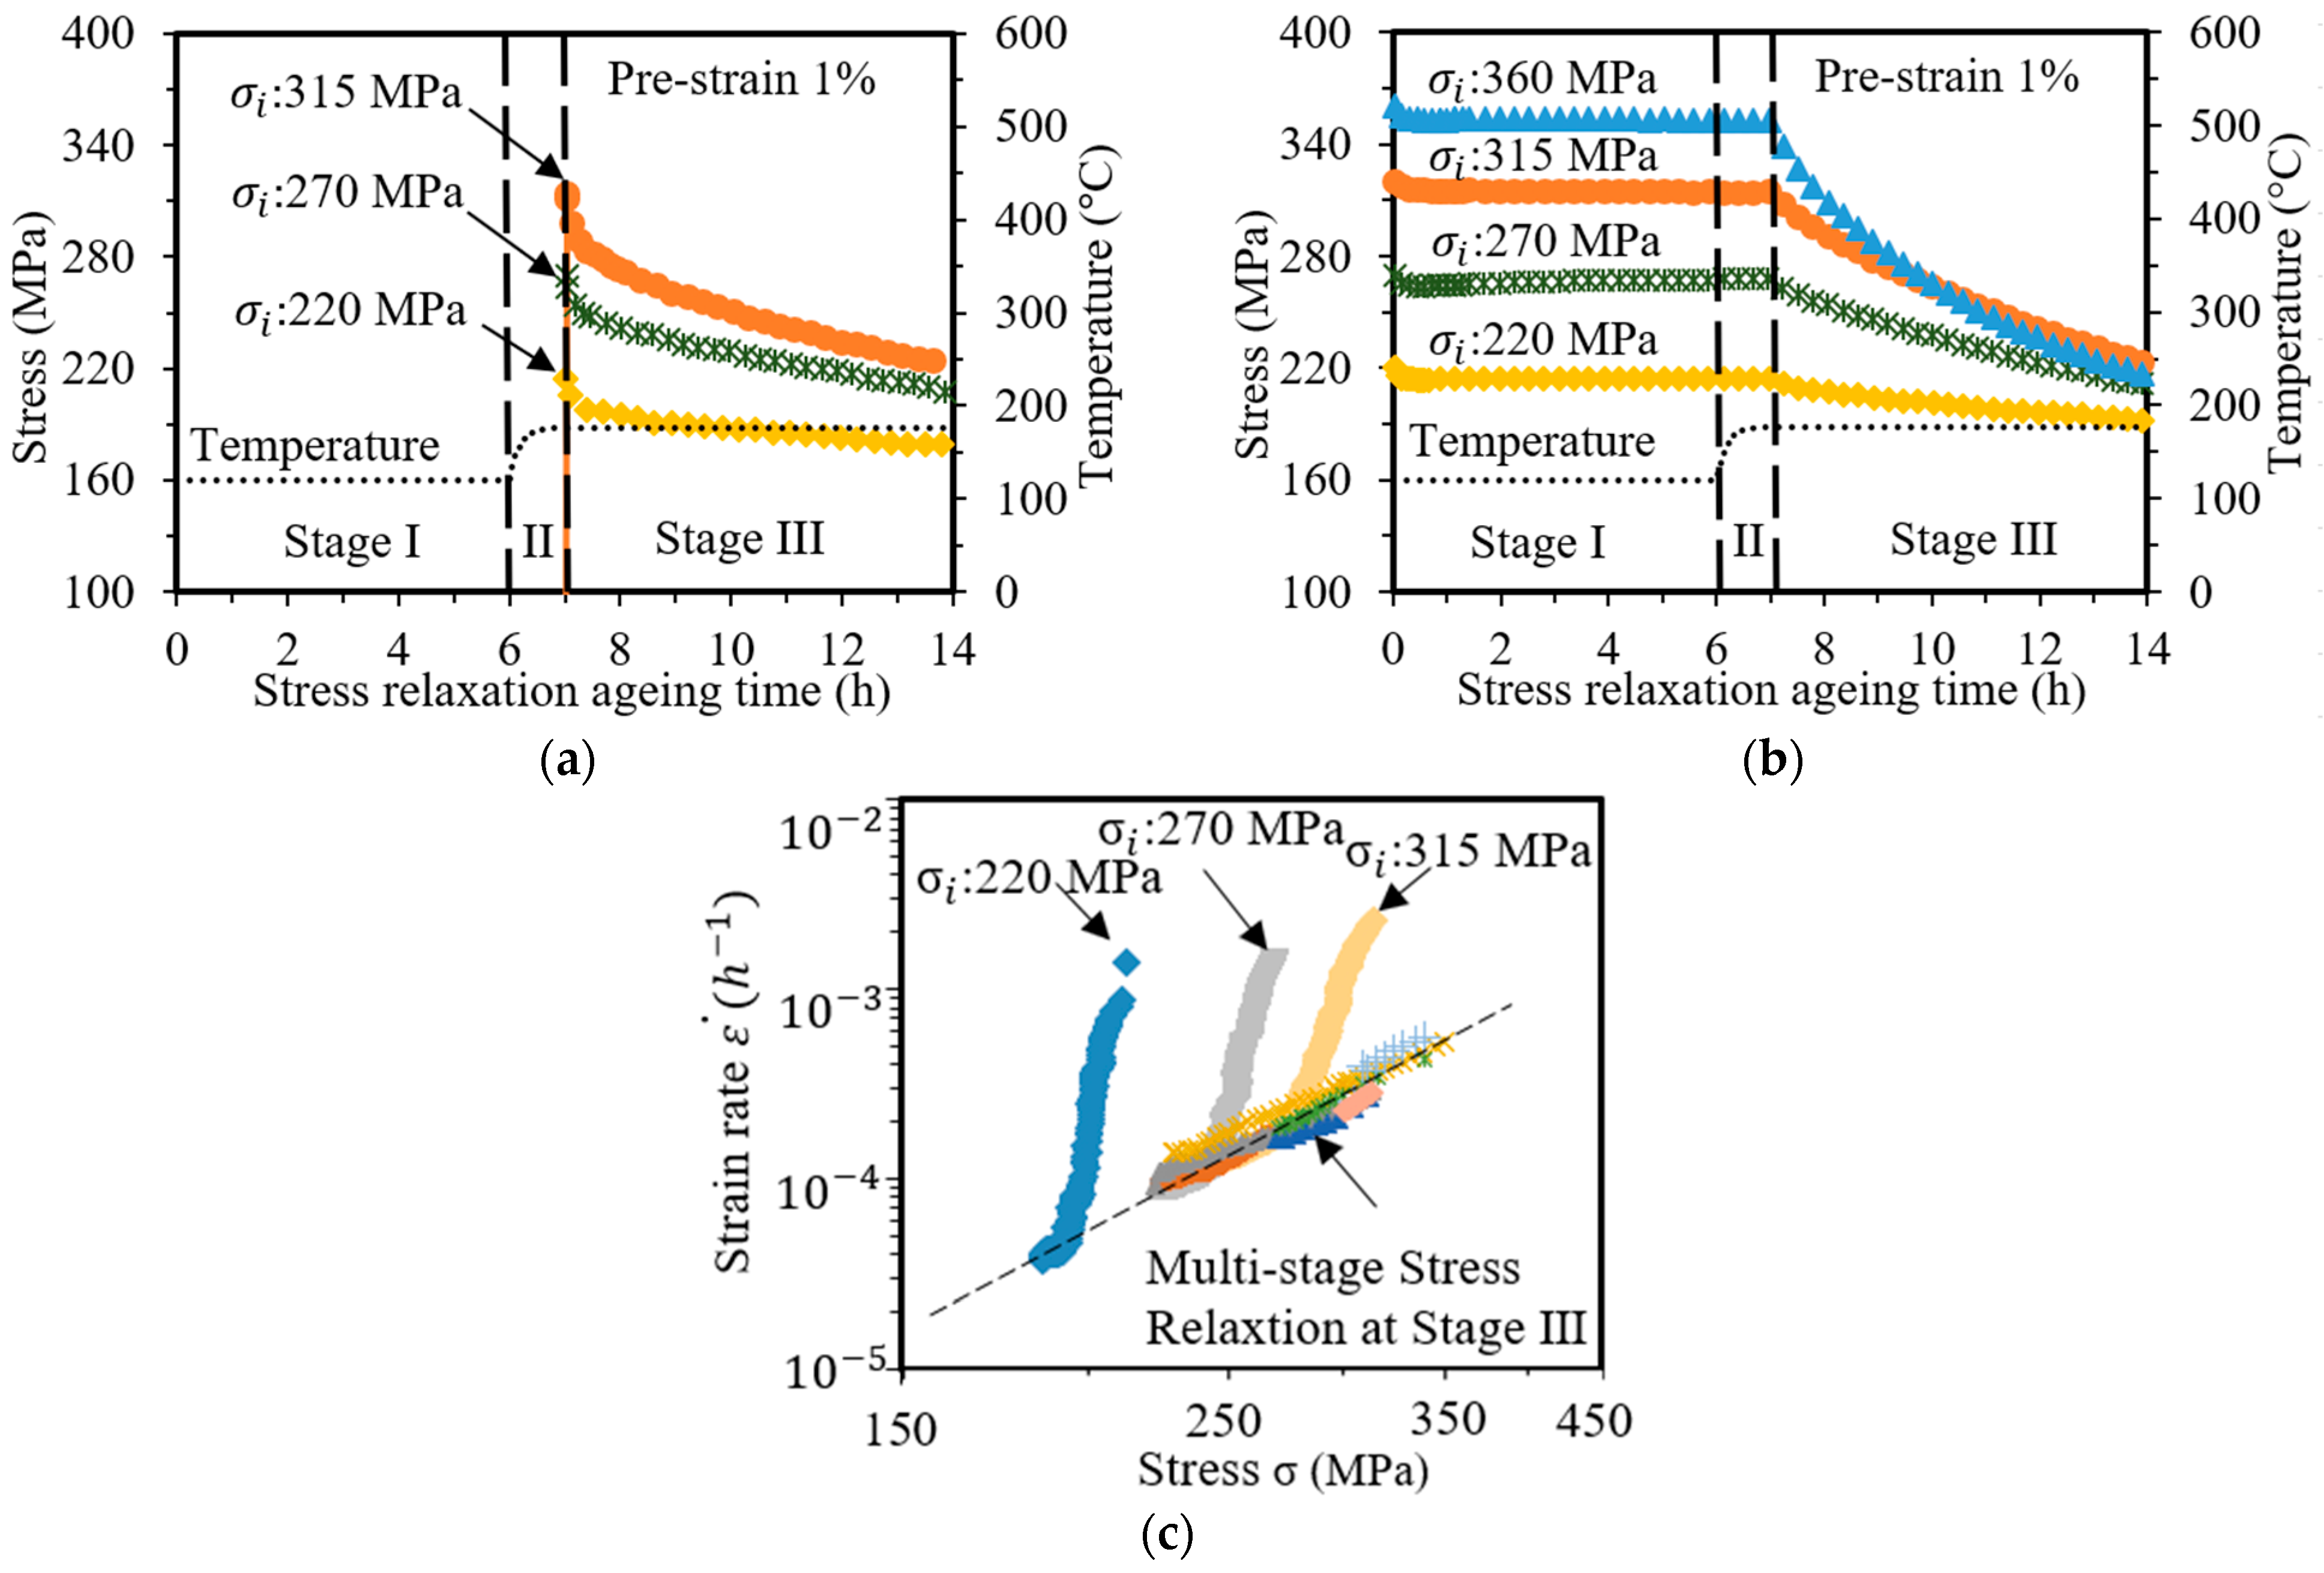
Figure 8 compares the single-stage and multi-stage stress relaxation curves of 7050 aluminum alloy with various stress levels during T74 ageing treatment. Figure 8a is the experimental result of this work, and the stress relaxation curves in Figure 8b are taken from [20]. The experimental materials and process are consistent with this work. All 7050 aluminum alloys were pre-strained by 1% before the stress relaxation tests and aged at 120 °C for 6 h followed by 177 °C for 7 h. The difference is the loading stage. The samples were loaded at the start of the Stage III (annotated in Figure 8a) for the single-stage stress-relaxation tests, where stress relaxation occurred at 177 °C for 7 h. While the samples were loaded at the beginning of Stage I (annotated in Figure 8b) for the multi-stage stress relaxation tests, where the samples were relaxed at 120 °C for 6 h followed by 177 °C for 7 h. The recorded temperature evolutions are also marked as a black line on the figure.

Figure 8.
(a) Single-stage and (b) multi-stage stress relaxation curves of 7050 aluminum alloy with various stress levels during ageing at 177 °C. (c) The calculated strain rate vs. stress. The evolution of strain rate is calculated by the slope of single-stage stress relaxation curves in (a) and multi-stage stress relaxation curves in (b). Note that the multi-stage stress relaxation curves were reprint/adapted with permission from [40], Materials Science and Engineering A; published by Elsevier, 2018.
Comparing and analyzing Figure 8a,b under the same initial stress, an obvious primary creep stage is observed in Figure 8a; the curves drop rapidly at first and then gradually become flat. Conversely, there is no obvious primary creep stage in Figure 8b; the curves are relatively flat. Notice that no obvious threshold stress is observed in the two groups of experiments. While the threshold stress existed in traditional understanding of stress relaxation, mainly manifested in the high stress index (n) and high activation energy [41], which is caused by the interaction between dislocation and the second-phase particles in the matrix [21].
Considering the stress relaxation extents, the total stress relaxation extents for the T74 multi-stage ageing are 19.5%, 21.8%, 31.4%, and 40% at the initial stresses of 220 MPa, 270 MPa, 315 MPa, and 360 MPa, respectively. Such values are similar to those for single-stage stress relaxation, which are 18.6%, 23.3%, and 29.8% at the initial stresses of 220 MPa, 270 MPa, and 315 MPa, respectively. Stress relaxation at the low temperature Stage I (i.e., 120 °C) provides negligible contributions to the stress relaxations. According to the study of Somekawa and Ashby et al. [32,42], Stage I may be dominated by grain boundary diffusion. According to Zheng et al.’s research [40], the reason for the negligible reduction in the stresses at this stage may be attributed to the insufficient thermal activation energy and the increased material strength during soaking at 120 °C, where precipitation phase particles in the alloy matrix hinder the crystallographic plane slip, and the stress relaxation resistance increases significantly. This suggests that for 7050 aluminum alloy, creep age forming could be applied at the start of the Stage III, where similar amounts of creep strains could be achieved, reducing the exposure time of the forming rig at high temperatures and potentially increasing the rig life time.
Figure 8c compares the creep strain rate vs. stress levels at 177 °C extracted from the single-stage and T74 multi-stage stress relaxation tests. For the single-stage stress relaxation tests, the strain rates were high at the start of the stress relaxation test, while they rapidly decreased. The strain rates for all three curves, i.e., = 220 MPa, 270 MPa, and 315 MPa, finally reduced to a level that is considered steady state, where they coincided linearly. On the contract, the strain rates for the multi-step stress relaxation test all coincided linearly without observing any initial creep stages. The creep strain rate of T74 multi-stage ageing varied more gently than the single-stage ageing. Note that T74 multi-stage ageing under different initial stresses lost the creep strain rate of Stage I and Stage II, only including the strain rate of Stage III entering the steady creep region. This corresponds to the fact that the stress relaxation curve in Figure 8b has no obvious initial creep stage. In addition, it can be found that the steady-state creep stage of single-stage has a linear relationship with T74 multi-stage stress relaxation; the n value is calculated to be 3.6 according to power law. It is determined that the stress relaxation mechanism of the two is dominated by the dislocation creep mechanism. Based on the study of the creep strain rate of single-stage and T74 multi-stage stress relaxation, it is known that the stress relaxation rates are similar, varying from 19% to 40%. Such analysis again suggests that loading the material directly at 177 °C could be a better choice for creep age forming, where the strain rates are higher, to trigger more creep strains that are comparable to the multi-stage stress relaxation process. This indicates that the extent of stress relaxation at 120 °C in Stage I of T74 multi-stage stress relaxation can be ignored, and the creep strain rate in Stage I disappears and enters the steady-state creep region, which leads to the total stress relaxation rate basically occurring at Stage III. Therefore, it is completely unnecessary to load at the initial stage for creep ageing forming. Instead, the material can be kept at Stage I and Stage II and then loaded in Stage III to meet the forming requirements.
4. Conclusions
In this work, the creep and stress relaxation behaviours of 7050 aluminum alloy under different stress levels were systematically studied, and the effects of single-stage ageing and T74 multi-stage ageing on stress relaxation were explored. The following conclusions are obtained:
- The stress exponent n under the steady state region for creep is 3.7, and stress relaxation is 3.5. The n value for creep tests is constant throughout the tests from primary to steady state creep, indicating that the dislocation slip mechanism is unchanged during the tests. The activation energy evolves with creep time, from 123 kJ/mol to 139 kJ/mol, possibly due to the evolved dislocations. This observation could be a support mechanism for building constitutive equations based on the power-law relationship for the creep and stress relaxation behaviour.
- Similar amount of total creep strains is observed for the single-stage and T74 multi-stage stress relaxation process, i.e., around 19%, 22%, and 30% under an initial stress of 220 MPa, 270 MPa, and 315 MPa. No primary creep region is observed for the multi-stage stress relaxation process at 177 °C. This suggests that for the creep age forming technique of 7050, the material is recommended to be loaded at the start of the second stage to reduce the exposure time of the rigs at high temperatures. The n value at the steady state region for single-stage and multi-stage stress relaxation tests is also the same, i.e., 3.6.
- Higher applied stress promotes the creep and stress relaxation extents. Under the same soaking time, the creep strain at 245 MPa is 3.5 times that at 195 MPa, and the stress relaxation rate at 315 MPa is 1.6 times of that at 220 MPa. The total creep strain achieved from stress relaxation tests is around 2/3 of that from creep tests under identical initial stress levels, if not entering tertiary creep region.
Author Contributions
The study in this paper was performed as a collaboration between all the authors. J.-H.Z., Y.J. and L.X. proposed the program of experiment and discussed the experiment’s details; J.-H.Z. and Y.J. wrote the manuscript; C.F., W.S. and Y.C. provided scientific guides and analysed relevant results. All authors have read and agreed to the published version of the manuscript.
Funding
Natural Science Foundation of China (Grant No. 52105359) and (Grant No. 92160301), and Shanghai Spaceflight Precision Machinery Institute (Grant No. SPMI2022-13).
Data Availability Statement
The raw/proceed data required to reproduce these findings cannot be shared at this time as the data also forms part of an ongoing study.
Acknowledgments
The strong support from the National Natural Science Foundation of China and Shanghai Spaceflight Precision Machinery Institute. Thanks to all the authors for efforts.
Conflicts of Interest
The authors declare no conflict of interest.
References
- Zhan, L.; Lin, J.; Dean, T.A. A review of the development of creep age forming: Experimentation, modelling and applications. Int. J. Mach. Tools Manuf. 2011, 51, 1–17. [Google Scholar] [CrossRef]
- Chen, J.F.; Zhen, L.; Jiang, J.T.; Yang, L.; Shao, W.Z.; Zhang, B.Y. Microstructures and mechanical properties of age-formed 7050 aluminum alloy. Mater. Sci. Eng. A 2012, 539, 115–123. [Google Scholar] [CrossRef]
- Dumont, D.; Deschamps, A.; Brechet, Y. On the relationship between microstructure, strength and toughness in AA7050 aluminum alloy. Mater. Sci. Eng. A 2003, 356, 326–336. [Google Scholar] [CrossRef]
- Pahlavani, M.; Marzbanrad, J.; Rahmatabadi, D.; Hashemi, R.; Bayati, A. A comprehensive study on the effect of heat treatment on the fracture behaviors and structural properties of Mg-Li alloys using RSM. Mater. Res. Express 2019, 6, 076554. [Google Scholar] [CrossRef]
- Lei, C.; Yang, H.; Li, H.; Shi, N.; Zhan, L.H. Dependences of microstructures and properties on initial tempers of creep aged 7050 aluminum alloy. J. Mater. Process. Technol. 2017, 239, 125–132. [Google Scholar] [CrossRef]
- Ho, K.C.; Lin, J.; Dean, T.A. Constitutive modelling of primary creep for age forming an aluminum alloy. J. Mater. Process. Technol. 2004, 153–154, 122–127. [Google Scholar] [CrossRef]
- Lin, J.; Ho, K.C.; Dean, T.A. An integrated process for modelling of precipitation hardening and springback in creep age-forming. Int. J. Mach. Tools Manuf. 2006, 46, 1266–1270. [Google Scholar] [CrossRef]
- Zheng, J.-H.; Davies, C.M.; Lin, J.; Pan, R.; Li, C. Constitutive modelling of a T74 multi-step creep ageing behaviour of AA7050 and its application to stress relaxation ageing in age formed aluminum components. Procedia Eng. 2017, 207, 281–286. [Google Scholar] [CrossRef]
- Li, Y.; Shi, Z.; Lin, J.; Yang, Y.L.; Huang, B.M.; Chung, T.F.; Yang, J.R. Experimental investigation of tension and compression creep-ageing behaviour of AA2050 with different initial tempers. Mater. Sci. Eng. A 2016, 657, 299–308. [Google Scholar] [CrossRef]
- Rahmatabadi, D.; Tayyebi, M.; Najafizadeh, N.; Hashemi, R.; Rajabi, M. The influence of post-annealing and ultrasonic vibration on the formability of multilayered Al5052/MgAZ31B composite. Mater. Sci. Technol. 2021, 37, 78–85. [Google Scholar] [CrossRef]
- Wang, K.; Zhan, L.-h.; Yang, Y.-l.; Ma, Z.-y.; Li, X.-c.; Liu, J. Constitutive modeling and springback prediction of stress relaxation age forming of pre-deformed 2219 aluminum alloy. Trans. Nonferrous Met. Soc. China 2019, 29, 1152–1160. [Google Scholar] [CrossRef]
- Guo, J.Q.; Tian, L.; Shi, H.C.; Meng, W.Z. Using Stress Relaxation Data to Predict Creep Behavior. Adv. Mater. Res. 2013, 842, 382–385. [Google Scholar] [CrossRef]
- Zhan, L.H.; Li, Y.G.; Huang, M.H.; Lin, J.G. Comparative Study of Creep and Stress Relaxation Behavior for 7055 Aluminum Alloy. Adv. Mater. Res. 2011, 314–316, 772–777. [Google Scholar] [CrossRef]
- Lihua, S.; Ling, Y. Research on conversion relationship between aging creep and aging stress relaxation. J. Plast. Eng. 2012, 20, 126–131. [Google Scholar] [CrossRef]
- Li, Y.; Shi, Z. A New Method to Characterize and Model Stress-Relaxation Aging Behavior of Aluminum Alloys Under Age Forming Conditions. Metall. Mater. Trans. A 2022, 53, 1345–1360. [Google Scholar] [CrossRef]
- Lyu, F.; Li, Y.; Shi, Z.; Huang, X.; Zeng, Y.; Lin, J. Stress and temperature dependence of stress relaxation ageing behaviour of an Al–Zn–Mg alloy. Mater. Sci. Eng. A 2020, 773, 138859. [Google Scholar] [CrossRef]
- Li, Y.; Lyu, F.; Shi, Z.; Zeng, Y.; Huang, X.; Lin, J. Experimental Study and Modelling of Stress Relaxation Ageing Behaviour and Post-form Mechanical Properties in Creep Age Forming of Al-Zn-Mg Alloy. In Forming the Future; Springer International Publishing: Cham, Switzerland, 2021; pp. 877–889. [Google Scholar] [CrossRef]
- Zheng, J.; Davies, C.M.; Lin, J. Comparison of creep deformation rates during load and strain controlled multi-step creep ageing tests on AA7050. In Proceedings of the 2017 of Conference, Pulau Pinang, Malaysia, 8–9 August 2017. [Google Scholar] [CrossRef]
- Xu, Y.; Zhan, L.; Li, W. Effect of pre-strain on creep aging behavior of 2524 aluminum alloy. J. Alloys Compd. 2017, 691, 564–571. [Google Scholar] [CrossRef]
- Zhan, L.; Ma, Z.; Zhang, J.; Tan, J.; Yang, Z.; Li, H. Stress relaxation ageing behaviour and constitutive modelling of a 2219 aluminum alloy under the effect of an electric pulse. J. Alloys Compd. 2016, 679, 316–323. [Google Scholar] [CrossRef]
- El-Danaf, E.A.; Baig, M. High temperature deformation characteristics of equal channel angular pressed AA6082-T6. Mater. Sci. Eng. A 2013, 565, 301–307. [Google Scholar] [CrossRef]
- Zhao, T.-S.; Zhou, J.; Zhou, J.-F.; Wu, D.-X.; Xiong, Y. Influence of pre-stretching and aging processes on comprehensive performance of aluminum alloy. Mater. Manuf. Process. 2018, 33, 1641–1647. [Google Scholar] [CrossRef]
- Guo, W.; Guo, J.; Wang, J.; Yang, M.; Li, H.; Wen, X.; Zhang, J. Evolution of precipitate microstructure during stress aging of an Al–Zn–Mg–Cu alloy. Mater. Sci. Eng. A 2015, 634, 167–175. [Google Scholar] [CrossRef]
- Yang, Y.; Zhan, L.; Liu, C.; Wang, X.; Wang, Q.; Tang, Z.; Li, G.; Huang, M.; Hu, Z. Stress-relaxation ageing behavior and microstructural evolution under varying initial stresses in an Al–Cu alloy: Experiments and modeling. Int. J. Plast. 2020, 127, 102646. [Google Scholar] [CrossRef]
- Chen, J.F.; Jiang, J.T.; Zhen, L.; Shao, W.Z. Stress relaxation behavior of an Al–Zn–Mg–Cu alloy in simulated age-forming process. J. Mater. Process. Technol. 2014, 214, 775–783. [Google Scholar] [CrossRef]
- Wang, Z.; Tian, R.Z. Manual of Aluminum and Its Processing, 3rd ed.; Central South University Press: Changsha, China, 2005. [Google Scholar]
- Zhan, L.; Lin, J.; Dean, T.A.; Huang, M. Experimental studies and constitutive modelling of the hardening of aluminum alloy 7055 under creep age forming conditions. Int. J. Mech. Sci. 2011, 53, 595–605. [Google Scholar] [CrossRef]
- Chen, X.; Zhan, L.; Ma, Z.; Xu, Y.; Zheng, Q.; Cai, Y. Study on tensile/compressive asymmetry in creep ageing behavior of Al–Cu alloy under different stress levels. J. Alloys Compd. 2020, 843, 156157. [Google Scholar] [CrossRef]
- Rong, Q.; Li, Y.; Shi, Z.; Meng, L.; Sun, X.; Sun, X.; Lin, J. Experimental investigations of stress-relaxation ageing behaviour of AA6082. Mater. Sci. Eng. A 2019, 750, 108–116. [Google Scholar] [CrossRef]
- Zhang, J.; Deng, Y.; Zhang, X. Constitutive modeling for creep age forming of heat-treatable strengthening aluminum alloys containing plate or rod shaped precipitates. Mater. Sci. Eng. A 2013, 563, 8–15. [Google Scholar] [CrossRef]
- Zuo, D.; Cao, Z.; Cao, Y.; Zheng, G. Effect of pre-stretching on microstructures and mechanical behaviors of creep-aged 7055 Al alloy and its constitutive modeling. Metals 2019, 9, 584. [Google Scholar] [CrossRef]
- Ashby, M.F. A first report on deformation-mechanism maps. Acta Metall. 1972, 20, 887–897. [Google Scholar] [CrossRef]
- Ashby, M.F. Boundary defects, and atomistic aspects of boundary sliding and diffusional creep. Surf. Sci. 1972, 31, 498–542. [Google Scholar] [CrossRef]
- Liu, C.; Yang, J.; Ma, P.; Ma, Z.; Zhan, L.; Chen, K.; Huang, M.; Li, J.; Li, Z. Large creep formability and strength–ductility synergy enabled by engineering dislocations in aluminum alloys. Int. J. Plast. 2020, 134, 102774. [Google Scholar] [CrossRef]
- Kassner, M.E. Fundamentals of Creep in Metals and Alloys; Butterworth-Heinemann: Oxford, UK, 2015. [Google Scholar]
- Shi, C.; Mao, W.; Chen, X.G. Evolution of activation energy during hot deformation of AA7150 aluminum alloy. Mater. Sci. Eng. A 2013, 571, 83–91. [Google Scholar] [CrossRef]
- Mott, N.F.; Nabarro, F. Dislocation Theory and Transient Creep. 1948. Available online: https://wiredspace.wits.ac.za/handle/10539/1195 (accessed on 31 August 2006).
- Sherby, O.D.; Lytton, J.L.; Dorn, J.E. Activation energies for creep of high-purity aluminum. Acta Metall. 1957, 5, 219–227. [Google Scholar] [CrossRef]
- Robey, R.; Prangnell, P.; Dif, R. A Comparison of the Stress Relaxation Behavior of Three Aluminum Aerospace Alloys for use in Age-Forming Applications. In Materials Forum; Institute of Materials Engineering Australasia Ltd.: Brisbane, Australia, 2004; pp. 132–138. [Google Scholar]
- Zheng, J.-H.; Pan, R.; Li, C.; Zhang, W.; Lin, J.; Davies, C.M. Experimental investigation of multi-step stress-relaxation-ageing of 7050 aluminum alloy for different pre-strained conditions. Mater. Sci. Eng. A 2018, 710, 111–120. [Google Scholar] [CrossRef]
- Evangelista, E.; Spigarelli, S.J.M.; A, m.t. Constitutive equations for creep and plasticity of aluminum alloys produced by powder metallurgy and aluminum-based metal matrix composites. Metall. Mater. Trans. A 2002, 33, 373–381. [Google Scholar] [CrossRef]
- Somekawa, H.; Hirai, K.; Watanabe, H.; Takigawa, Y.; Higashi, K. Dislocation creep behavior in Mg–Al–Zn alloys. Mater. Sci. Eng. A 2005, 407, 53–61. [Google Scholar] [CrossRef]
Disclaimer/Publisher’s Note: The statements, opinions and data contained in all publications are solely those of the individual author(s) and contributor(s) and not of MDPI and/or the editor(s). MDPI and/or the editor(s) disclaim responsibility for any injury to people or property resulting from any ideas, methods, instructions or products referred to in the content. |
© 2023 by the authors. Licensee MDPI, Basel, Switzerland. This article is an open access article distributed under the terms and conditions of the Creative Commons Attribution (CC BY) license (https://creativecommons.org/licenses/by/4.0/).


