Article

Effect of CaO-MgO-FeO-SiO2-xNa2O Slag System on Converter Dephosphorization

1
School of Metallurgy, Northeastern University, Shenyang 110819, China
2
School of Metallurgical Engineering, Xi’an University of Architecture and Technology, Xi’an 710055, China
*
Author to whom correspondence should be addressed.
Metals 2023, 13(5), 844; https://doi.org/10.3390/met13050844
Submission received: 4 April 2023 / Revised: 19 April 2023 / Accepted: 23 April 2023 / Published: 25 April 2023

Abstract

:
Na2O is an alkaline oxide, which can significantly improve the dephosphorization ability of converter slag. The effect of Na2O on the dephosphorization of converter slag was analyzed with a high-temperature dephosphorization experiment in a MoSi2 resistance furnace. We found that the dephosphorization rate increased with the increase of (Na2O) in the dephosphorization slag. The elements of Ca, Si, O, and P in the dephosphorization slag are distributed in the same area, mainly in the form of phosphate minerals, such as Ca2SiO4·0.05Ca3(PO4)2 and 6Ca2SiO4·Ca3(PO4)2. After adding Na2O, part of the Na will replace the Ca in the phosphorus-containing phase to form Ca2SiO4·Ca2Na2(PO4)2. The industrial test showed that the average dephosphorization rate in the early stage of the test heats with the CaO-MgO-FeO-SiO2-0.5%Na2O slag system could reach 62.39%, which was 19.62% higher than that of the conventional heats. The average basicity of the final slag was 0.19% lower than that of the conventional heats, while w(P2O5) increased by 0.36%, and T.Fe decreased by 0.69%. The average consumption of the slagging materials was 35.93 kg/t, which was 7.24 kg/t less than that of the conventional heats. Through thermodynamic calculation, we found that with the increase of (Na2O), the phosphorus distribution ratio between slag and steel increased significantly, the area of the liquid phase zone of the slag system increased continuously, and the viscosity decreased continuously.

1. Introduction

For most steel, phosphorus is a harmful element, and its segregation in steel will cause uneven structure, reduce the plasticity and toughness of steel, cause ‘cold brittleness’, and seriously affect its service performance [1]. Therefore, in order to meet the market demand for low-phosphorus steel, various converter dephosphorization processes have been developed by major steel mills, for example, the MURC (Multi-Refining Converter) of Nippon Steel [2], the SGRS (Slag Generation Reduced Steelmaking) of Shougang [3,4], and the BRP (BOF Refining Process) of Baosteel [5]. These processes mainly rely on the converter double slag method or the duplex method to achieve dephosphorization. Converter slag is mainly produced by the oxidation of silicon, phosphorus, iron, manganese, and other elements in molten iron and the addition of lime, dolomite, and other slagging materials. In addition, there are some other ways of formation, such as the blast furnace slag brought into the converter and the eroded converter lining [6]. In 2021, Chinese crude steel production reached 1.03 billion tons, and the byproduct converter slag in the smelting process also increases year by year. At present, about 1 billion tons of slag are stored in China, occupying a large amount of land and polluting the environment.
Reducing the amount of converter slag has important economic and ecological benefits. In this regard, metallurgical scholars are committed to developing new dephosphorization slag [7,8,9,10,11,12,13,14,15] to enhance the dephosphorization efficiency. Pak J J [8,9] studied the effect of Na2O on the dephosphorization of CaO-based steelmaking slag. Adding Na2O to CaO-SiO2 slag will increase the phosphorus distribution ratio. At 1873 K, adding 6% Na2O to CaO-saturated CaO-FeO-SiO2 slag can increase the LP by 5 times. For slag with high binary basicity due to the high activity of Na2O, even if w(Na2O) is low, the effect of Na2O on LP is also significant. Guangqiang Li [10] studied the effect of Na2O and Al2O3 on the dephosphorization of high basicity CaO-FeO-SiO2 slag under the MgO saturation condition. They found that the addition of Na2O in MgO-saturated CaO-FeO-SiO2 slag can increase the phosphate capacity of slag. When w(Na2O) increased from 0 to 1.75%, the phosphate capacity increased from 1018.37 to 1019. Jiang Diao [11] added a small amount of Na2O and Al2O3 to fluorine-free CaO-FeO-SiO2 slag to reduce the melting point and promote the dephosphorization reaction. When w(Na2O) and w(Al2O3) in the dephosphorization slag reached 0.7~3.1% and 2.5~7.9%, respectively, the dephosphorization rate could reach 81.4~90.7%. Taposhe G.I.A. [16] used CaO-Al2O3-SiO2-Na2O slag to remove phosphorus from Si-Fe alloy and found that the presence of Na2O in the slag increased the LP. Fengshan Li [17,18] found that with the increasing of Na2O, the phosphate capacity increased linearly, which showed that Na2O can significantly affect the dephosphorization capacity of slag. Xianpeng Li [19] determined the phosphorus distribution ratio between CaO-FeO-SiO2-Al2O3/Na2O/TiO2 slag and molten iron, and found that LP increased rapidly with the increasing of w(Na2O) in slag. When the w(Na2O) in slag increased by 6.94%, LP increased by 5.4 times, which indicated that Na2O could significantly improve the dephosphorization ability of slag. Zhiqiang Zhou [20] studied the effect of adding Na2O to the alkaline slag in the dephosphorization of silicon–manganese alloy at 1673 K. They found that adding a small amount of Na2O to the dephosphorization slag could increase the phosphorus distribution ratio by 0.6%, and the corresponding dephosphorization rate increased by about 10%. Xinyu Xuan [21] studied the dephosphorization effect of CaO-SiO2-FeO-Na2O-Al2O3 slag on medium- and high-phosphorus molten iron. They found that when the dephosphorization slag contained both Al2O3 and Na2O, the dephosphorization effect was better than that of Al2O3 or Na2O alone. When the w(Al2O3) in the dephosphorization slag was 4% and the w(Na2O) was 2%, the dephosphorization rate could reach 95.66%. In addition, some scholars [22,23,24] explored the effect of Na2CO3 on dephosphorization and found that it has a good dephosphorization effect and can be used as a dephosphorization agent. Ito K [25] found that the phosphate capacity of industrial waste residue treated with soda ash is very large, up to 1031. Marukawa K [26] studied the treatment effect of sodium carbonate on molten iron and found that dephosphorization and desulfurization were carried out simultaneously. The addition of Na2CO3 reduced the melting point of CaO-based slag and improved the fluidity of slag.
In summary, Na2O can effectively increase the phosphorus distribution ratio and improve the dephosphorization effect. In this paper, the effects of Na2O additions on the mineral phase structure of slag were investigated through laboratory experiments. On this basis, industrial tests were carried out in a 130 t converter. A CaO-MgO-FeO-SiO2-xNa2O slag system was added in the early stage of smelting, and the appropriate slag addition system was matched to achieve the purpose of rapid slag melting and enhanced early dephosphorization. At the same time, the effects of Na2O on the phosphorus distribution ratio between slag and steel, and the melting point and viscosity of the slag system were analyzed by thermodynamic calculation, which provided a basic theoretical reference for optimizing slag composition.

2. Experimental Method

2.1. Laboratory Experiment Scheme

2.1.1. High Temperature Dephosphorization Experimental Scheme

The iron sample used in the experiment was obtained by adding ferrophosphorus after the melting of pig iron. The composition of the pig iron was [C] = 3.31%, [Si] = 0.27%, [Mn] = 0.13%, and [P] = 0.08%, and the mass fraction of phosphorus in the ferrophosphorus was 27.1%. The dephosphorization slag was obtained by pure chemical reagents, such as CaO and SiO2, in a certain ratio (Na2O is replaced by Na2CO3).
Before the high temperature dephosphorization experiment, the initial molten iron was prepared by the pre-melting of pig iron and ferrophosphorus; the compositions are shown in Table 1. Then, the high-temperature dephosphorization experiment was carried out in the MoSi2 resistance furnace; the experimental device is shown in Figure 1. The 400 g molten iron sample was put into the magnesium oxide crucible (φ60 mm × 72 mm) of the outer-sleeve graphite crucible (φ70 mm × 100 mm) and put into the furnace. The sample was melted at 1653 K in an argon atmosphere, then 60 g of dephosphorization slag containing different amounts of Na2CO3 (the compositions are shown in Table 2) was added, followed by appropriate stirring to promote melting. After 30 min of reaction, the dephosphorization slag sample was taken with a molybdenum rod, and the molten iron sample was extracted with a quartz tube.

2.1.2. Melting Point Testing Scheme

In order to explore the effect of Na2O on the melting point of the slag system, the melting point of the CaO-MgO-FeO-SiO2-xNa2O slag system was tested with a slag melting characteristic tester. The hemispherical point temperature of the sample was defined as its melting temperature. Before the test, the samples were uniformly ground in agate mortar and mixed with anhydrous ethanol to make a 3 mm × 3 mm cylindrical sample. Each sample was heated at the same rate and tested 3 times to obtain the average.

2.1.3. Viscosity Calculation Method

Using FactSage8.1 to calculate the viscosity of the slag, we first opened the ‘Viscosity’ module. Then, we selected the component and entered its mass fraction (g) and input temperature (K), selected the viscosity unit (Pa·s), selected the ‘Melts’ melt database, and clicked the ‘Calculate’ button to calculate the relevant values.

2.2. Industrial Program

In order to improve the dephosphorization effect, the production process of a 130 t converter in a steel plant was improved, and the industrial test was carried out using CaO-MgO-FeO-SiO2-xNa2O slag. The single-slag smelting process mode was adopted. After the blowing was stable, lime, magnesium oxide ball, and sodium-containing slag were added with the appropriate slagging method. Among them, lime was added in 6~7 batches, the magnesium oxide ball was added in 2 batches, and the sodium-containing slagging material was added in 2~3 batches. Due to the erosion effect of excessive alkaline oxide on the furnace lining, the w(Na2O) in the slag was controlled at about 0.5% in the early stage of the test heats to improve the dephosphorization effect. In the later stage of smelting, the basicity of the final slag should be controlled at 2.0~2.5. In the production process, the molten iron samples were taken by sublance at the 6 min blowing and the blowing end point, respectively, to compare the dephosphorization effect of each stage. The slag samples at the end of blowing were analyzed and compared.

2.3. Analysis Method

2.3.1. Analysis Method of Molten Iron Sample

The molten iron sample was polished with 600 mesh sandpaper to remove the surface oxide, and then the debris sample was obtained with a multifunctional drilling machine. Next, the mass fractions of carbon and sulfur were detected with an infrared carbon and sulfur analyzer (instrument model LECO-CS230), and the mass fractions of silicon, manganese, and phosphorus were detected with an inductively coupled plasma emission spectrometer (ICP, instrument model PE-Avio500).

2.3.2. Analysis Method of Slag Sample

The dephosphorization slag was ground into powder with a crusher and then screened with 200-mesh sieves to obtain a slag sample with a particle size meeting the detection standard. The composition of the slag sample was detected with an X-ray fluorescence spectrometer (XRF, ZSXPrimus II), and the Na2O in the slag sample was detected by ICP. An X-ray diffractometer (XRD, Uitima IV) was used to detect and analyze the phase of the slag sample. The diffractometer used a copper target with a scanning range of 15–80° and a scanning speed of 10°/min. The morphology of the dephosphorization slag was observed with a tungsten filament scanning electron microscope (SEM, ZEISS EVO18), and the corresponding regions and locations were selected for energy dispersive spectroscopy (EDS) component surface analysis and point analysis.

3. Experimental Results

3.1. Laboratory Dephosphorization Experimental Results

The test results of the dephosphorization experiment are shown in Table 3, and the test results of the dephosphorization slag compositions are shown in Table 4. With the increasing of the w(Na2O) in the slag, the dephosphorization rate and phosphorus distribution ratio increased. After adding Na2O with a mass fraction of about 1% to the slag, the dephosphorization rate reached 76.30%, and the phosphorus distribution ratio reached 5.24, which are 4.45% and 0.19% higher, respectively, than the heat without adding Na2O, indicating that adding a small amount of Na2O can improve the dephosphorization ability of the slag.
Figure 2 shows the XRD patterns of the dephosphorization slag samples. Figure 2a indicates that the phosphorus element mainly exists in the form of phosphate phases, such as Ca2SiO4·0.05Ca3(PO4)2 and 6Ca2SiO4·Ca3(PO4)2, in the slag without Na2O. When Na2O is added to the dephosphorization slag, some Na will replace the Ca in the phosphorus-containing phase, thus forming a Ca2SiO4·Ca2Na2(PO4)2 phase and some Na3PO4 phase. Chuanming Du [27] and Kan Yu [28] also found that alkaline oxides, such as Na2O, are conducive to the formation of a phosphorus-rich solid solution in dephosphorization slag. In addition, Figure 2 shows that the addition of Na2O will also form a low-melting-point phase, such as Na2Si2O5, which can achieve rapid slag melting in the early stage of converter smelting and promote dephosphorization reactions.
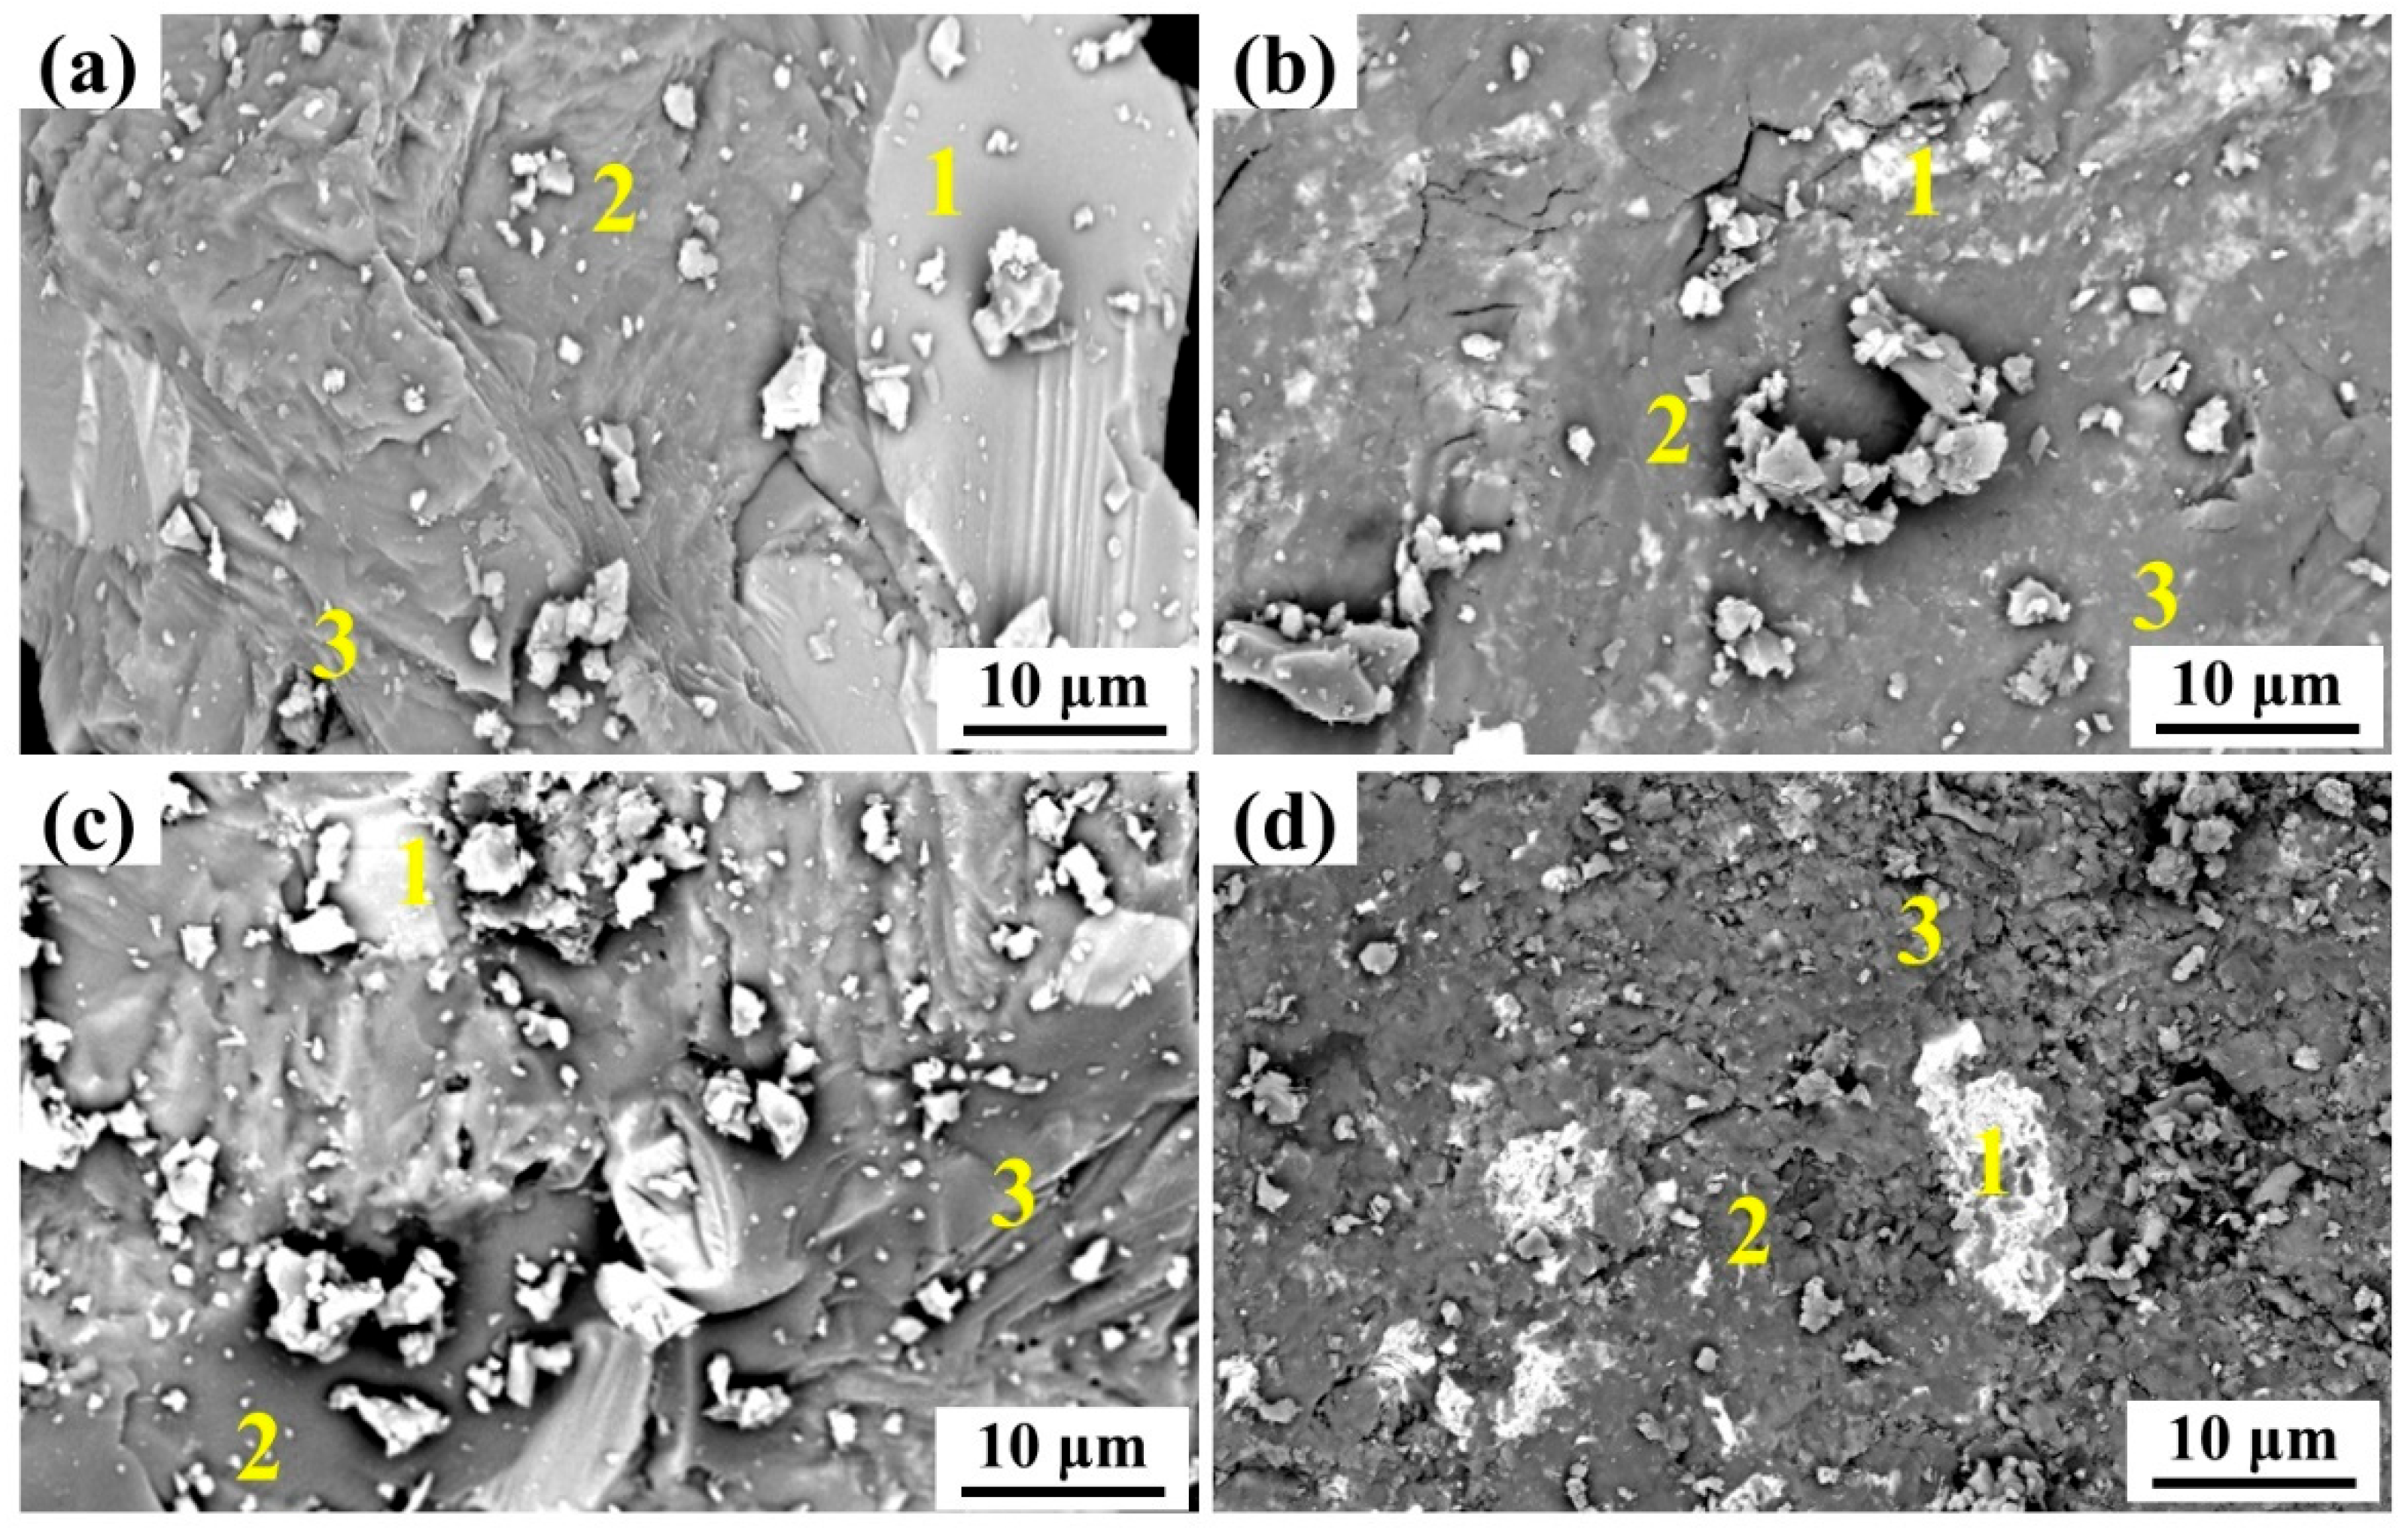
Figure 3 shows the SEM observation results of the experiment’s dephosphorization slag samples. The figure indicates that the dephosphorization slag mainly has a white area and a gray area, which is consistent with the research results of previous researchers [29,30,31]; however, they all found that the gray area can be divided into a gray phosphorus-containing area and a gray phosphorus-free area. In this regard, the energy spectrum analyzer was used to quantitatively analyze the components in different positions of the white and gray areas; the results are shown in Table 5. They indicate that there are more elements of Fe, Mg, Mn, and O in the white area 1, which is an iron-rich phase; the gray area 2 is rich in phosphorus, and its P element is greater than the other areas; and the gray area 3 is the matrix phase, with mainly the elements Ca, Si, and O.
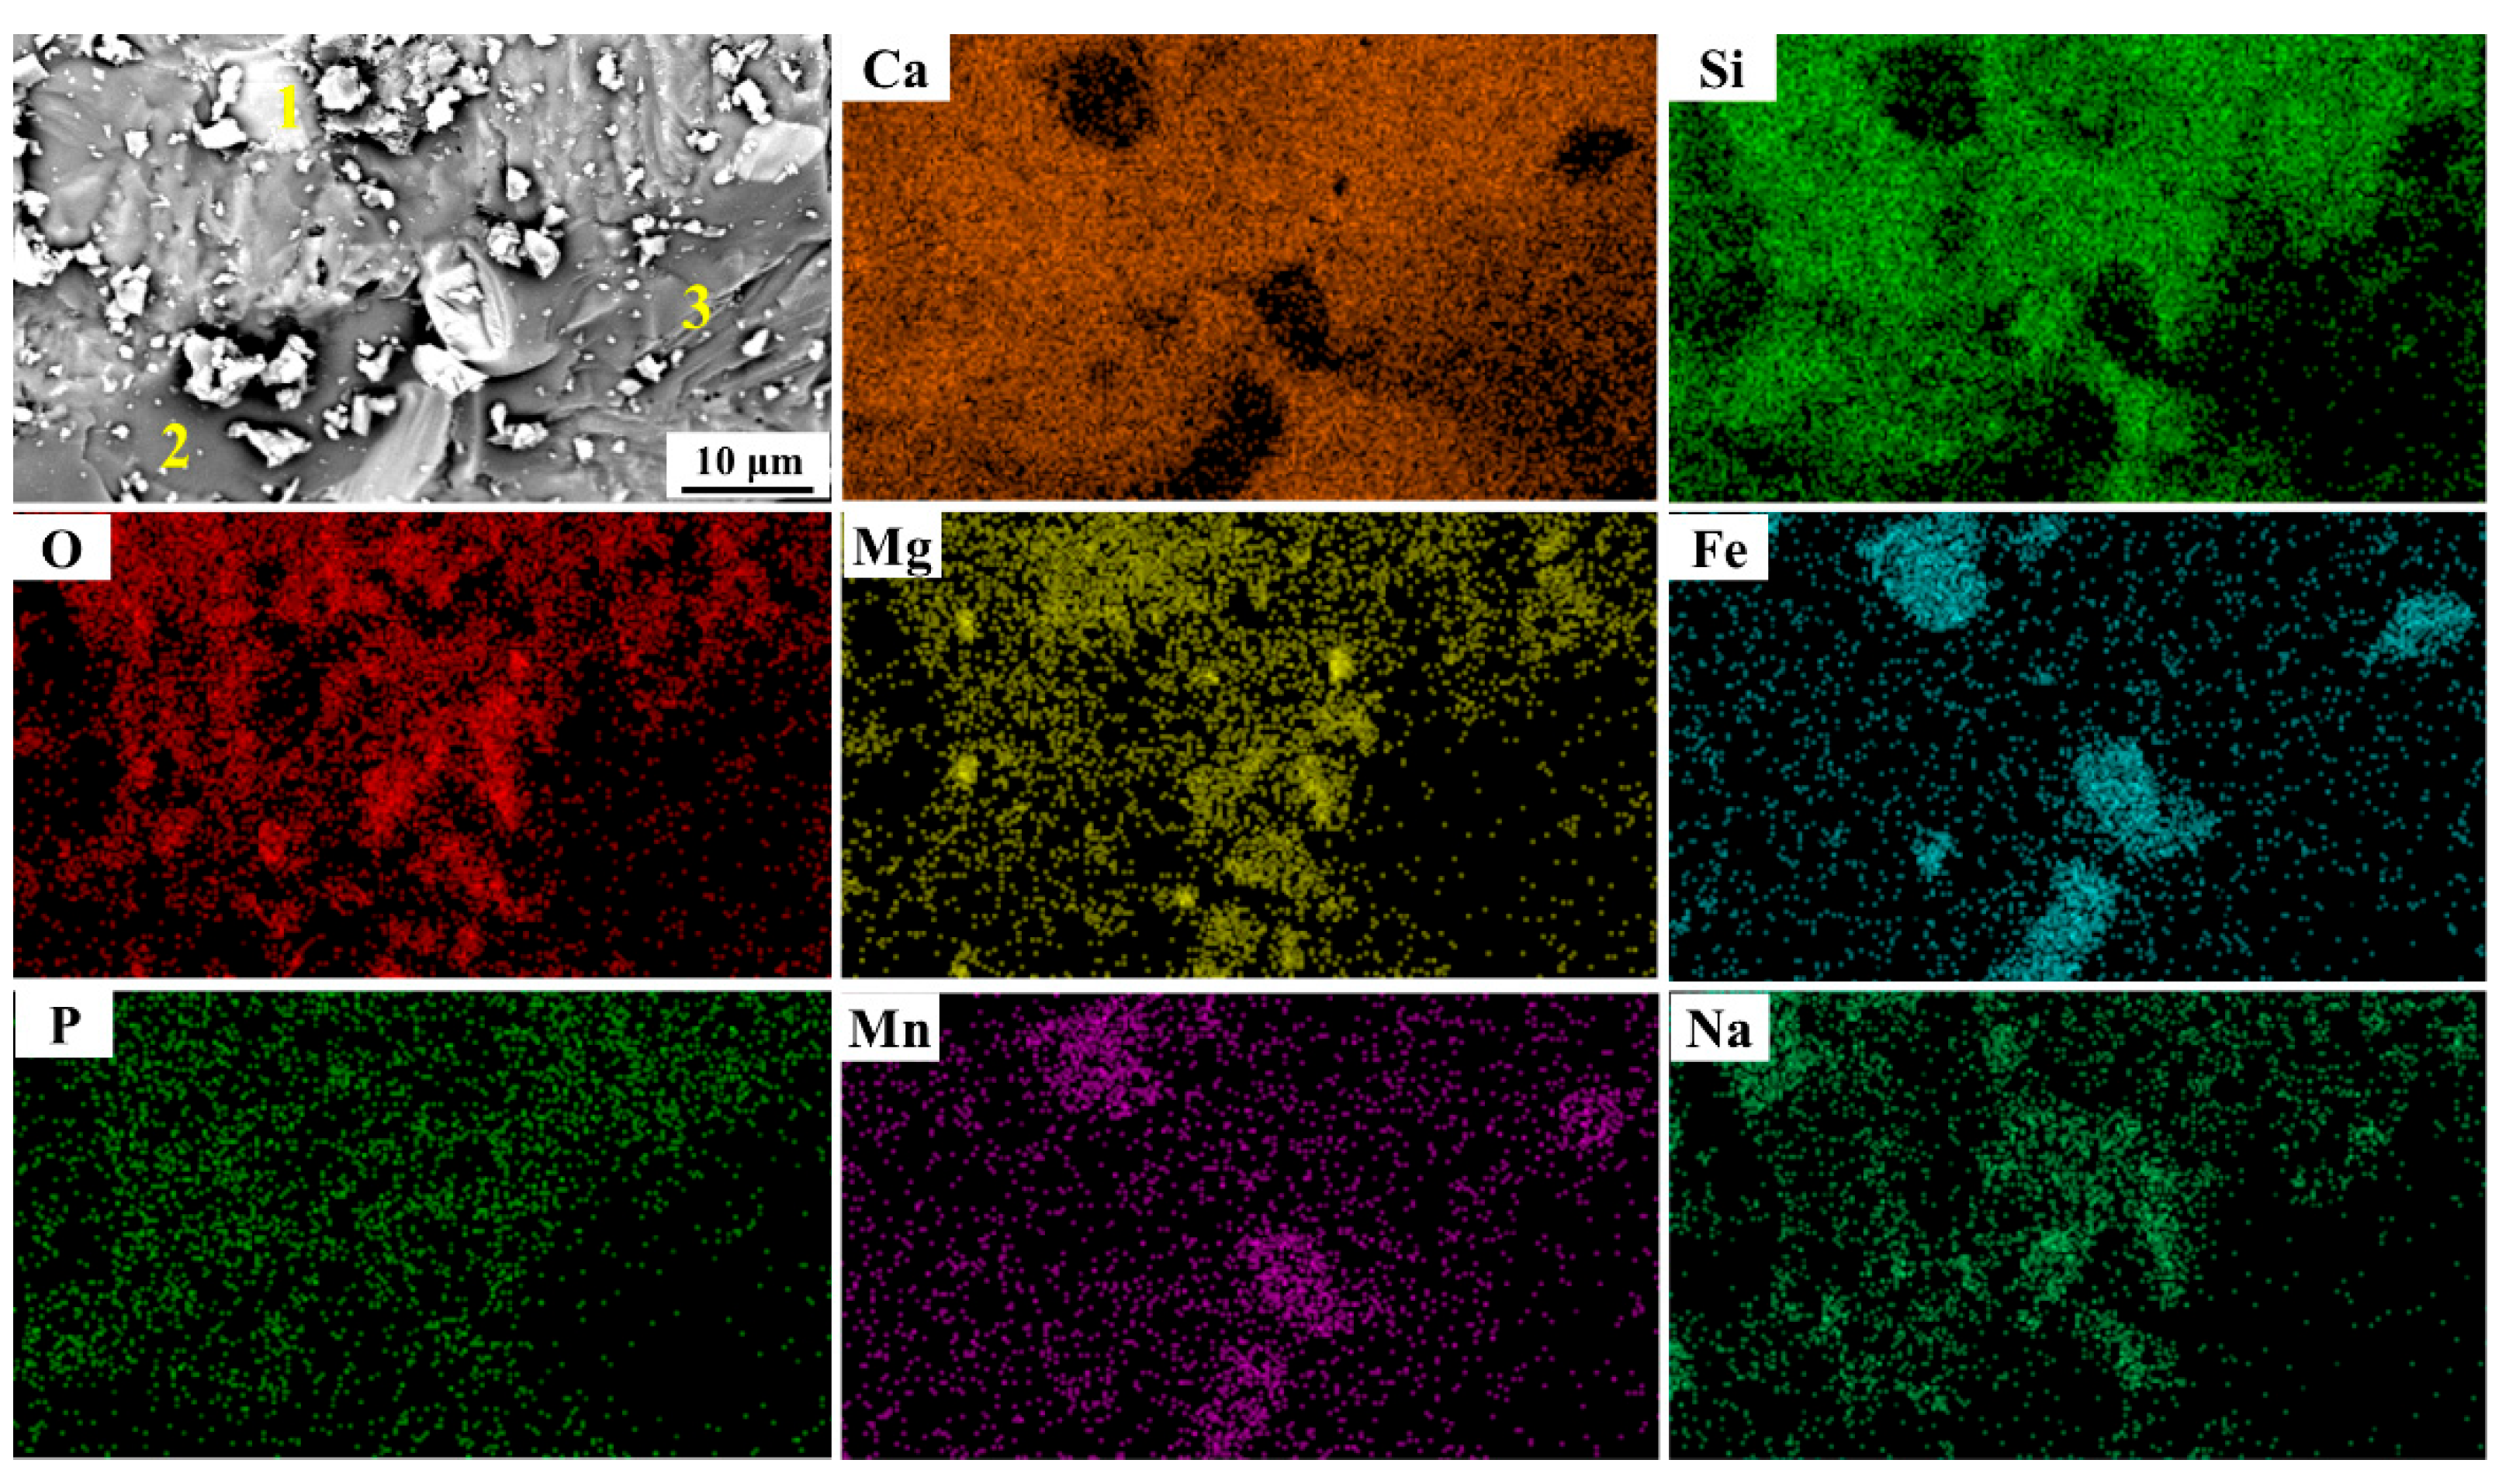
Figure 4 and Figure 5 show the element mapping analysis results of the No. 1 slag sample and the No. 3 slag sample, respectively. The distribution of each element in Figure 4 indicates that Ca, Si, O, and P are distributed in the gray area 2, which is consistent with the energy spectrum analysis results in Table 5. Combined with the XRD phase analysis results in Figure 2, these elements exist in the form of a phosphate phase. The distribution map of each element in Figure 5 indicates that after adding Na2O to the dephosphorization slag, the Na element mainly exists in the gray area containing phosphorus. Combined with the XRD analysis in Figure 2, it mainly forms a Ca2SiO4·Ca2Na2(PO4)2 phase.

3.2. Industrial Results

The phosphorus mass fraction and dephosphorization rate of the conventional heats and test heats after blowing 6 min and the end point are shown in Table 6. The composition of the molten iron used in the two production processes is the same. Table 6 shows that the average dephosphorization rate of the molten iron in the conventional heats blowing for 6 min is only 42.77%, while the test heats can reach 62.39%, and the dephosphorization rate in the early stage of the converter increased by 19.62%. In addition, the average phosphorus mass fraction of the molten iron in the test heats is 0.041%, which is 0.019% lower than that in the conventional heats.
Moreover, the average dephosphorization rate at the end of the conventional heats is 62.14%, and the average dephosphorization rate at the end of the test heats can reach 72.03%, which is a 9.89% increase. When w(Na2O) reached 0.79% in the dephosphorization slag designed by Zhiqiang Zhou [20], the dephosphorization rate increased about 10%. In addition, the average mass fraction of the phosphorus at the end of the test heats is 0.03%, which is 0.01% lower than that of the conventional heats.
The average value of the final slag compositions of the conventional and test heats is shown in Table 7. The average basicity of the final slag of the test heats is 2.31, which is 0.19% lower than that of the conventional heats. The average w(P2O5) in the final slag of the test heats is 2.83%, which is 0.36% higher than the conventional heats. The dephosphorization effect is enhanced, while reducing the consumption of materials such as lime. In addition, the average value of T.Fe in the final slag of the test heats is 14.93%, which is 0.69% lower than 15.62% of the conventional heats.
The average value of the slagging materials consumption of the conventional and test heats is shown in Table 8. The table indicates that the average lime consumption of the test heats is 26.15 kg/t, which is 6.16 kg/t lower than that of the conventional heats. The change of the magnesium oxide ball consumption is not obvious; the average consumption of dolomite decreased by 2.67 kg/t; and the consumption of sodium-containing slagging material increased by 1.54 kg/t. The average consumption of slagging materials is 35.93 kg/t, which is 7.24 kg/t lower than that of the conventional heats. In addition, the average consumption of the iron and steel material in the test heats is 1052.23 kg/t, which is 1.37 kg/t lower than that in the conventional heats.

4. Analysis and Discussion

4.1. Effect of Na2O on Dephosphorization Reaction

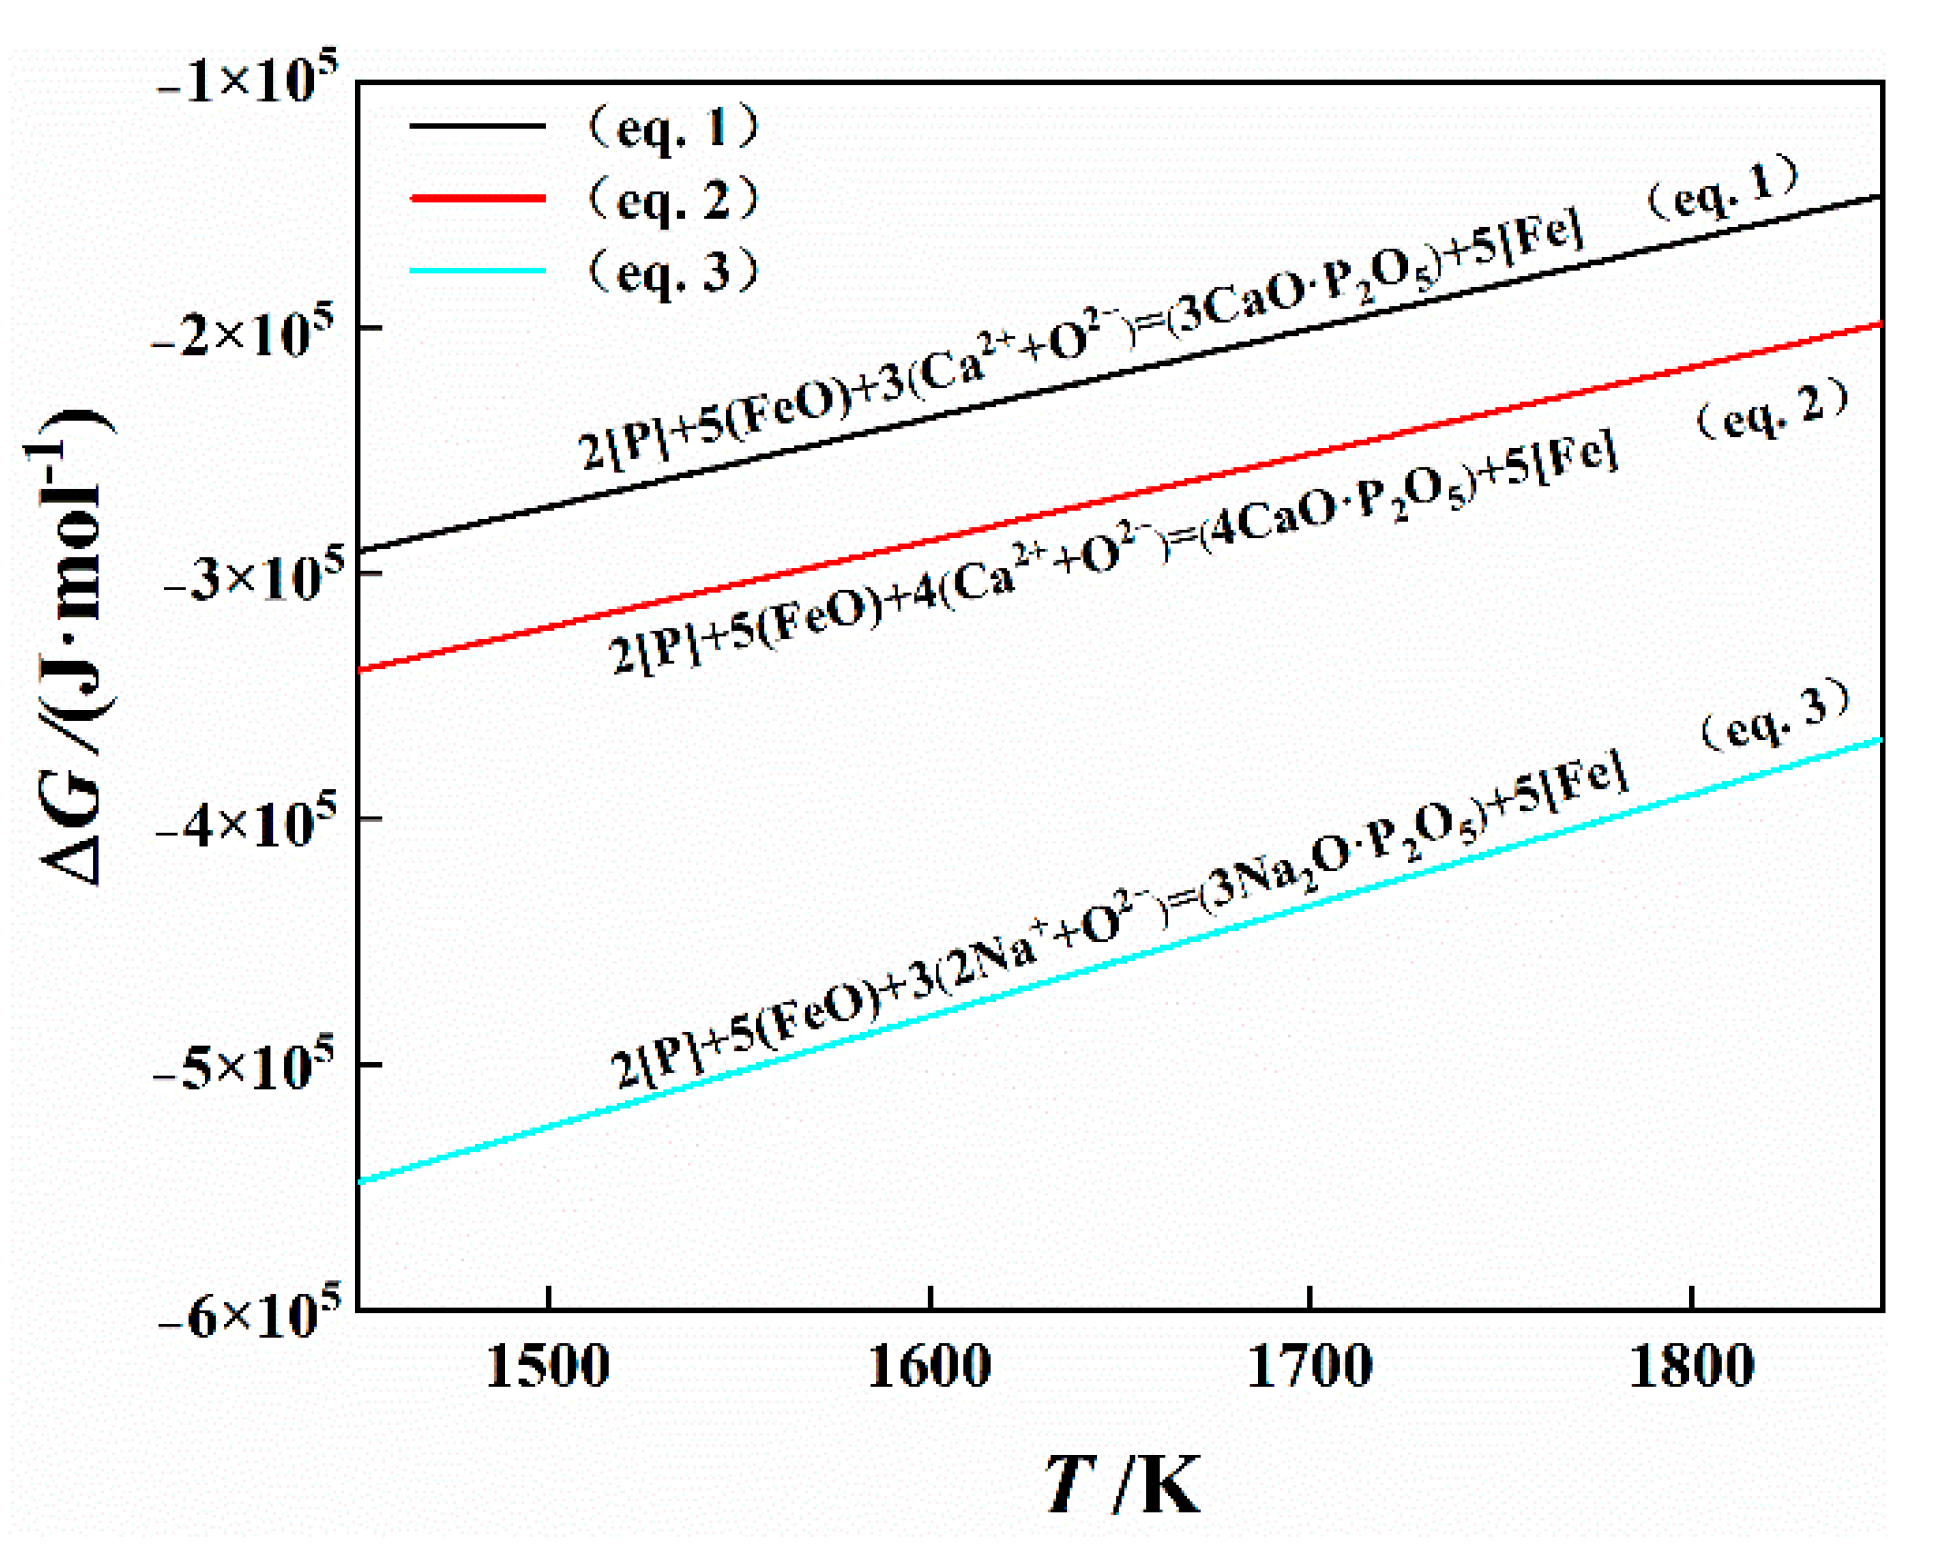
In the conventional production process of the converter, the oxidative dephosphorization reaction occurs at the steel–slag interface. The relationship between the standard Gibbs free energy and the temperature of the dephosphorization reaction equations between CaO/Na2O and molten iron [32,33,34,35] are shown in Figure 6. The figure shows that the Gibbs free energy of Equation (3) is lower than the other two reactions at the same temperature, which indicates that the dephosphorization reaction between Na2O and molten iron occurs more easily.

4.2. Effect of Na2O on Phosphorus Distribution Ratio

4.2.1. Establishment of Phosphorus Distribution Ratio Model

The phosphorus distribution ratio (LP) is one of the important parameters reflecting the dephosphorization ability of slag. As the phase diagram can accurately reflect the structure and thermodynamic properties of metallurgical melts, many scholars [36,37,38,39,40,41] used Ion and Molecule Coexistence Theory (IMCT) to characterize the physical and chemical properties of slag, and then obtained an IMCT-LP prediction model with high accuracy. Based on IMCT, a calculation model of the phosphorus distribution ratio of slag containing Na2O was established in this article, and the influence of Na2O on the phosphorus distribution ratio between slag and molten iron was discussed.
Combined with the phase diagram, we determined that the slag has the following structural units, in which the chemical reaction formula, standard Gibbs free energy, and equilibrium constant of complex molecules can be referred to [32,33,34,35].
(1)
Ions: Ca2+, Fe2+, O2-, Mn2+, Mg2+, Na+;
(2)
Simple molecules: SiO2, Al2O3, P2O5;
(3)
Complex molecule: CaO·SiO2, 2CaO·SiO2, 3CaO·SiO2, 3CaO·2SiO2, MgO·SiO2, 2MgO·SiO2, CaO·Al2O3, CaO·2Al2O3, CaO·6Al2O3, 3CaO·Al2O3, 12CaO·7Al2O3, 3Al2O3·2SiO2, 2FeO·SiO2, MnO·SiO2, 2MnO·SiO2, Na2O·Al2O3, FeO·Al2O3, MnO·Al2O3, MgO·Al2O3, 2CaO·P2O5, 3CaO·P2O5, 4CaO·P2O5, 3FeO·P2O5, 4FeO·P2O5, 3MnO·P2O5, 2MgO·P2O5, 3MgO·P2O5, 3Na2O·P2O5, CaO·MgO·SiO2, CaO·MgO·2SiO2, 2CaO·MgO·2SiO2, 3CaO·MgO·2SiO2, CaO·Al2O3·2SiO2, 2CaO·Al2O3·SiO2, Na2O·Al2O3·2SiO2, Na2O·Al2O3·6SiO2.
The total equilibrium mole number of all the structural units in 100 g slag can be calculated by the following formula:
n i = 2 n 1 + n 2 + 2 n 3 + + n c 1 + + n c 36
where n1~n6 represents the molar number of simple components under equilibrium conditions; nc1~nc36 represents the molar number in the equilibrium of 36 composite molecules; and ∑ni represents the sum of the molar numbers of each structural unit in the slag during equilibrium, mol.
Ni is defined as the mass action concentration of the structural unit i, which is equal to the ratio of the equilibrium molar number of structural unit i to the total molar number of all structural units in the equilibrium system. The expression is as follows:
N i = n i n i
We assume that the mole fractions of the initial oxides before the equilibrium of 100 g slag are b 1 = n CaO 0 , b 2 = n SiO 2 0 , b 3 = n FeO 0 , b 4 = n MnO 0 , b 5 = n MgO 0 , b 6 = n Al 2 O 3 0 , b 7 = n Na 2 O 0 , b 8 = n P 2 O 5 0 .
According to the law of the conservation of mass, the molar number of each oxide is constant before and after the reaction, and the conservation formulas can be established. Taking CaO as an example:
b 1 = ( 0.5 N 1 + K c 1 N 1 N 2 + 2 K c 2 N 1 2 N 2 + 3 K c 3 N 1 3 N 2 + 3 K c 4 N 1 3 N 2 2 + K c 7 N 1 N 6 + K c 8 N 1 N 6 2 + K c 9 N 1 N 6 6 + 3 K c 10 N 1 3 N 6 + 12 K c 11 N 1 12 N 6 7 + 2 K c 20 N 1 2 N 8 + 3 K c 21 N 1 3 N 8 + 4 K c 22 N 1 4 N 8 + K c 29 N 1 N 2 N 5 + K c 30 N 1 N 2 2 N 5 + 2 K c 31 N 1 2 N 2 2 N 5 + 3 K c 32 N 1 3 N 2 2 N 5 + K c 33 N 1 N 2 2 N 6 + 2 K c 34 N 1 2 N 2 N 6 ) n i  
When the slag is balanced, the sum of the mole fractions of all structural units is 1, and the following formula can be obtained:
N 1 + N 2 + + N 8 + N c 1 + + N c 36 = N 1 + N 2 + + N 8 + K c 1 N 1 N 2 + + K c 36 N 2 6 N 6 N 7 = 1
Calculated by MATLAB software, the values of N1~N8 and ∑ni can be determined.
There are 10 dephosphorization products in the slag. The chemical reactions, standard Gibbs free energy, and equilibrium constant [32,33,34,35] are shown in Table 9, a [ p ] = [ % P ] f p .
According to Henry’s law, when [%P] approaches 0, f P approaches 1. The calculation formula for the phosphorus distribution ratio between slag and molten iron can be obtained:
L P = ( % P 2 O 5 ) [ % P ] 2 = M P 2 O 5 N 3 5 f P 2 ( K 8 + K c 20 N 1 2 + K c 21 N 1 3 + K c 22 N 1 4 + K c 23 N 3 3 + K c 24 N 3 4 + K c 25 N 4 3 + K c 26 N 5 2 + K c 27 N 5 3 + K c 28 N 7 3 ) n i
In order to further verify the applicability and accuracy of the model, this paper refers to the measured data of the dephosphorization experiment in the relevant literature [17,42,43] and compares them with the model calculation results, as shown in Figure 7. The figure shows that the LP calculated by the model is close to the LP measured by the experiment, indicating that the calculation results of this model are highly reliable.

4.2.2. Effect of Na2O on Phosphorus Distribution Ratio

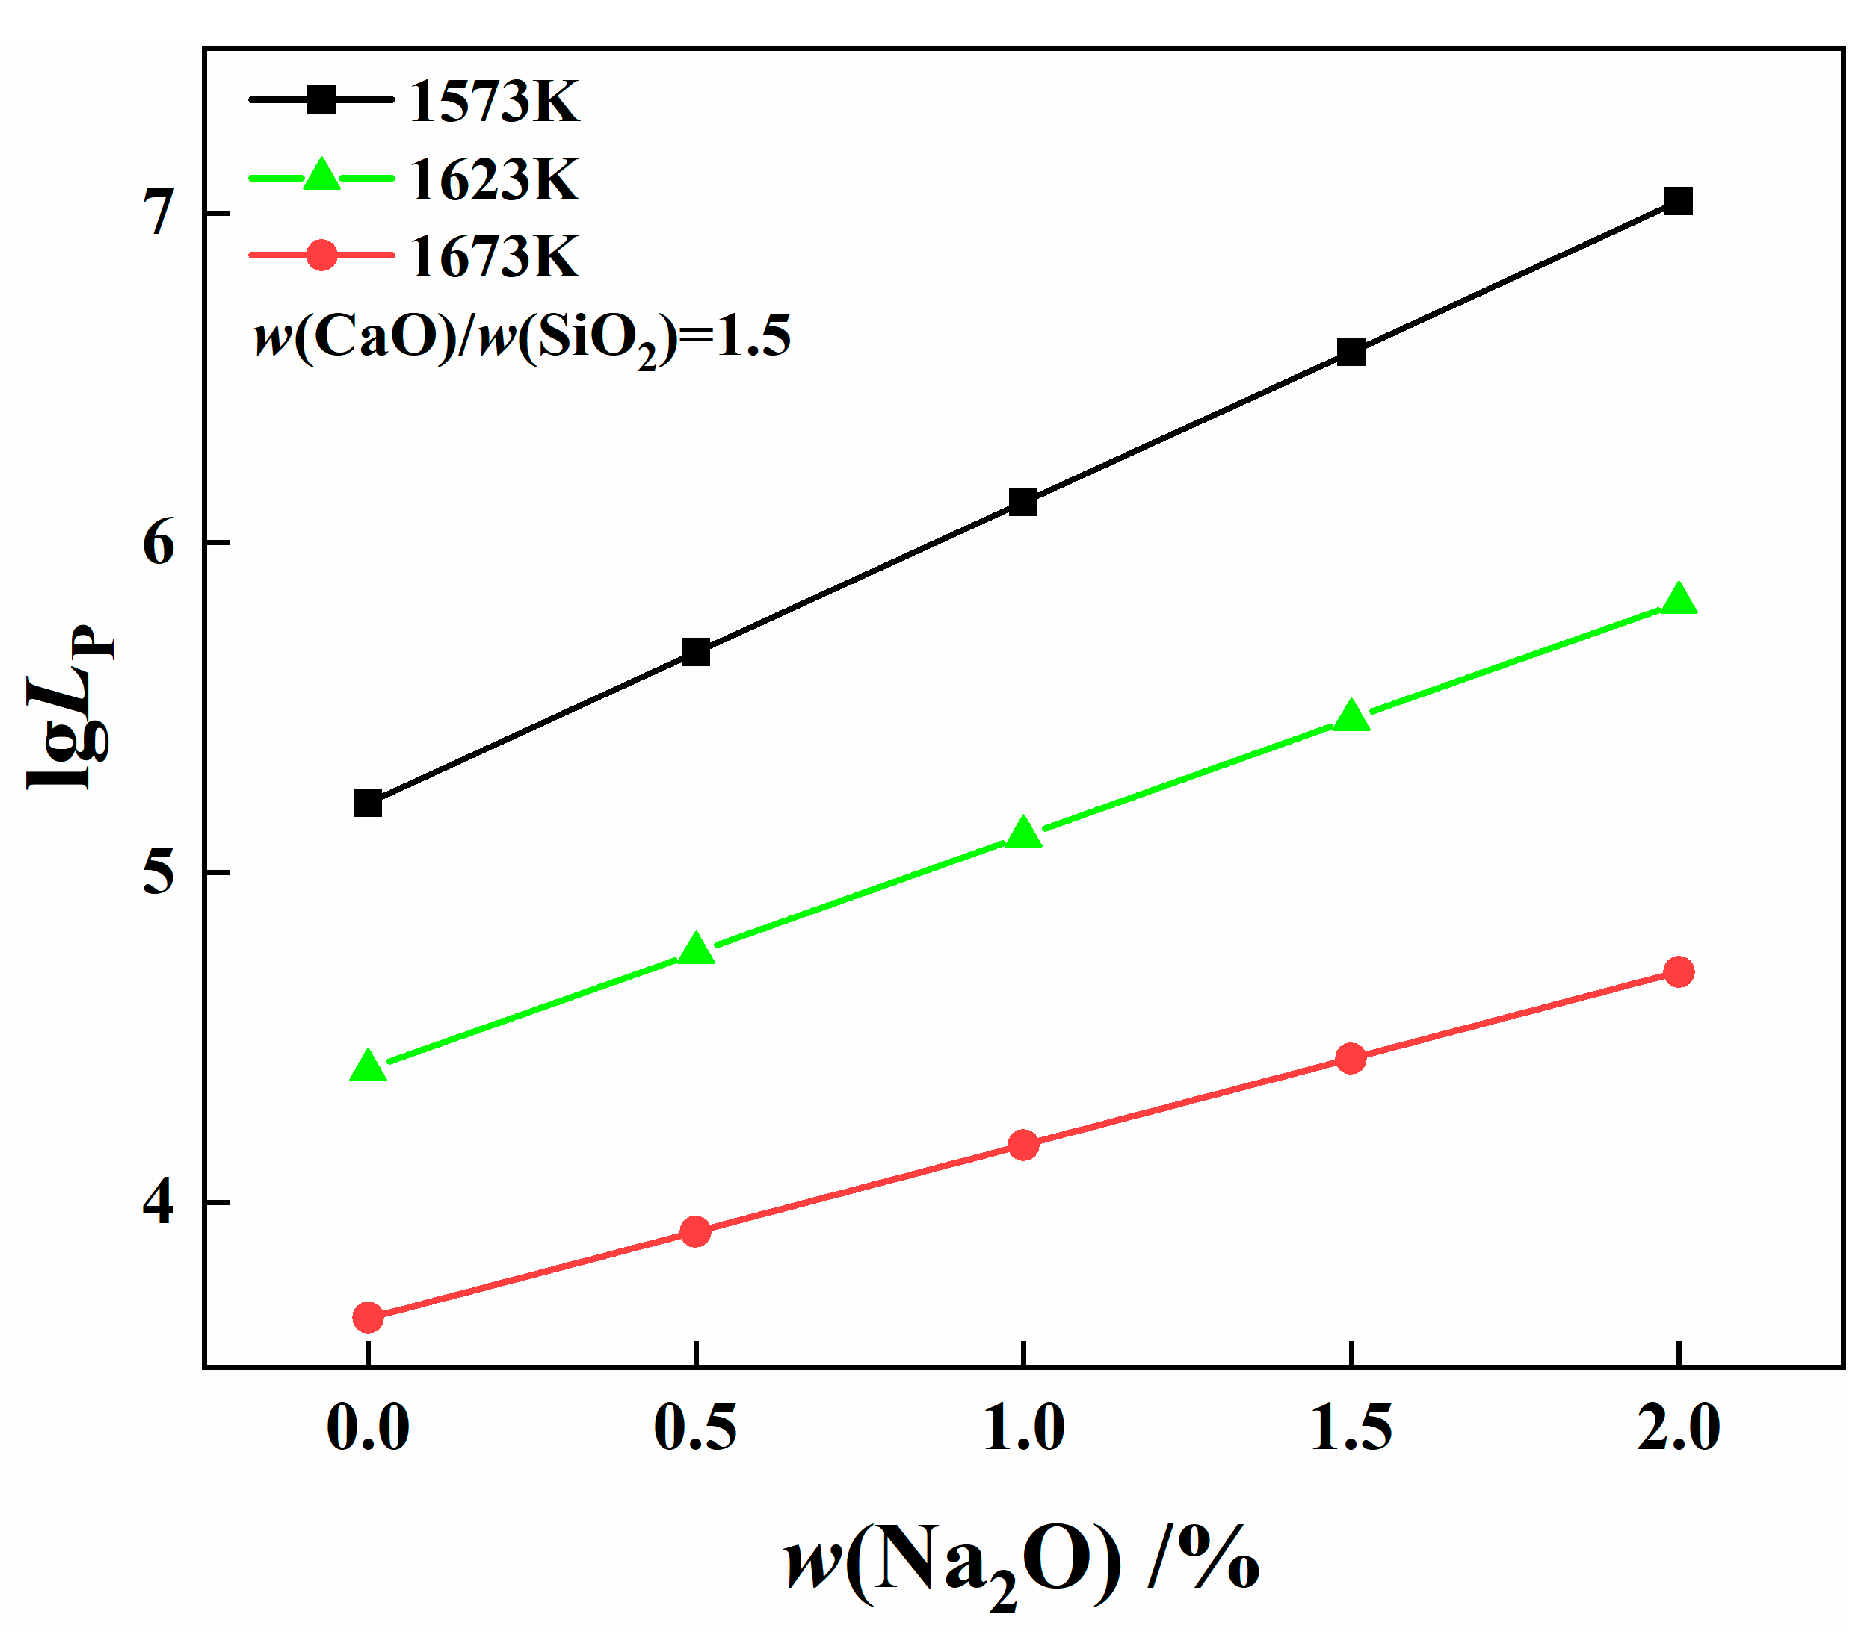
The effects of w(Na2O) on LP at 1573 K, 1623 K, and 1673 K are shown in Figure 8. The figure indicates that a small amount of Na2O can significantly improve the phosphorus distribution ratio. Free oxygen ions can promote the formation of phosphate, according to the IMCT, and the free oxygen ions in the slag are generated by the dissociation of alkaline oxides [33]. As an alkali metal element, sodium is more alkaline than CaO, and it is easier to dissociate free oxygen ions, thus it shows better dephosphorization ability. In this industrial test, using the thermodynamic conditions of dephosphorization at lower temperature in the early stage increased the w(Na2O) in slag to 0.5%, thereby ensuring the high phosphorus distribution ratio between the molten iron and slag and achieving the purpose of rapid dephosphorization in the early stage.
According to the literature [44], Na2CO3 can be used as an additive in lime-based dephosphorization flux. Na2CO3 is decomposed into Na2O and CO2 by heating, and Na2O can improve the phosphorus distribution ratio. However, Na2O is highly active in the alkaline slag, which is easy to volatilize from the slag, and volatile Na2O will cause serious corrosion to the furnace lining; therefore, the mass fraction of Na2O in slag should not be too high. Thus, the w(Na2O) in the slag was controlled less than 1.0% in these industrial trial heats.

4.3. Effect of Na2O on Physicochemical and Chemical Properties of Slag System

4.3.1. Effect of Na2O on Melting Point of Slag

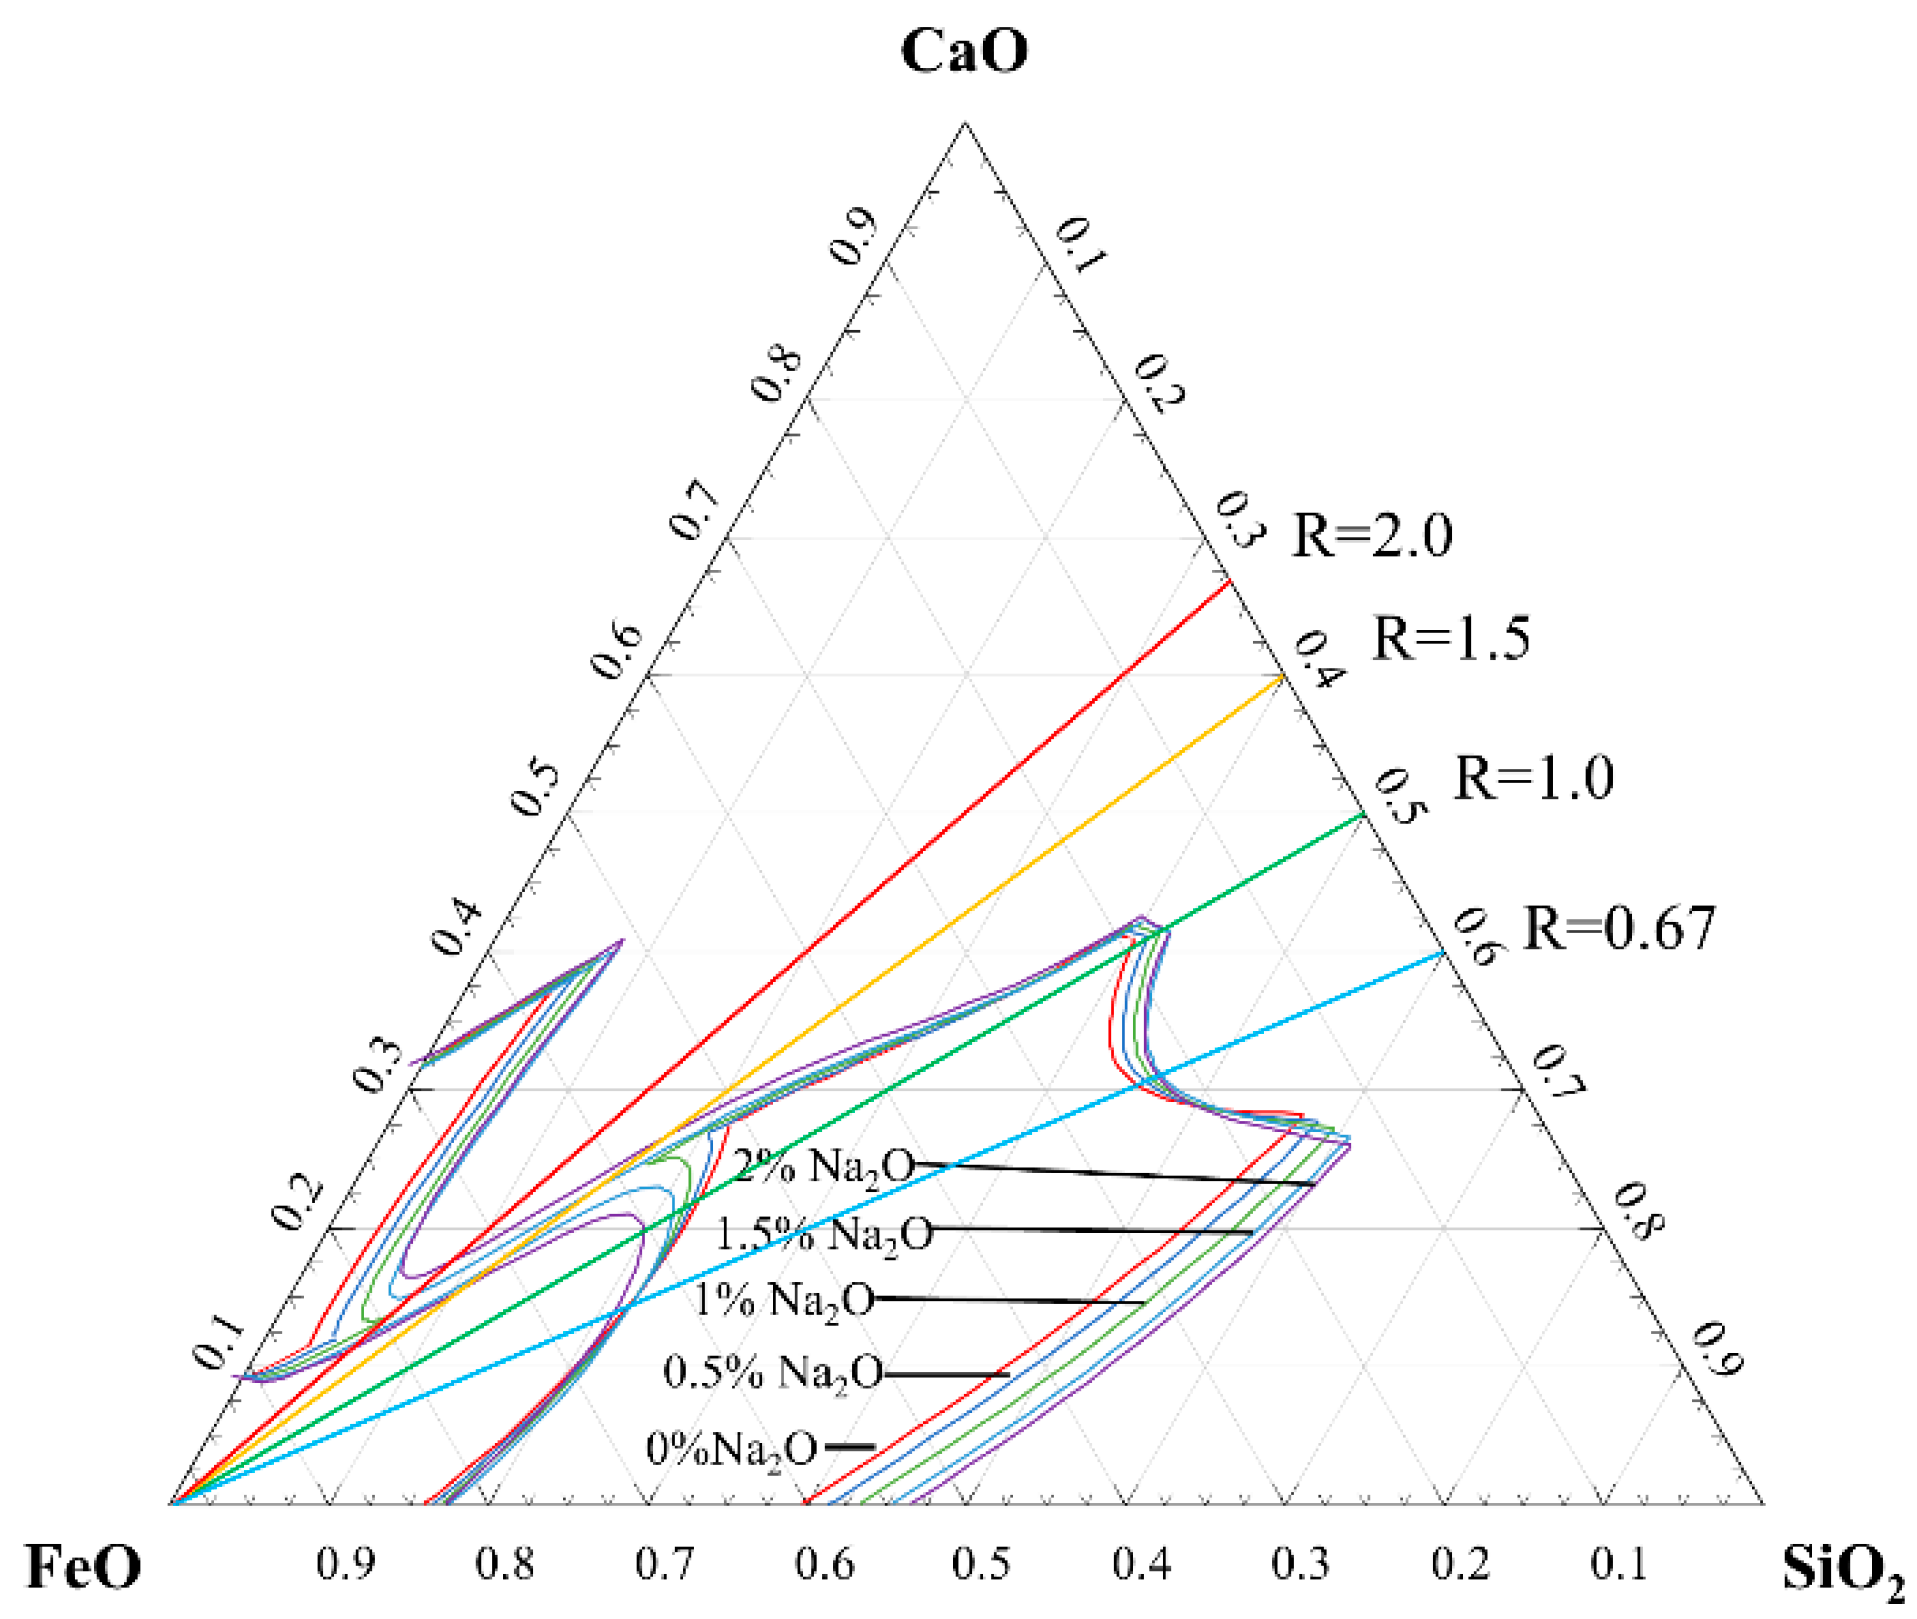
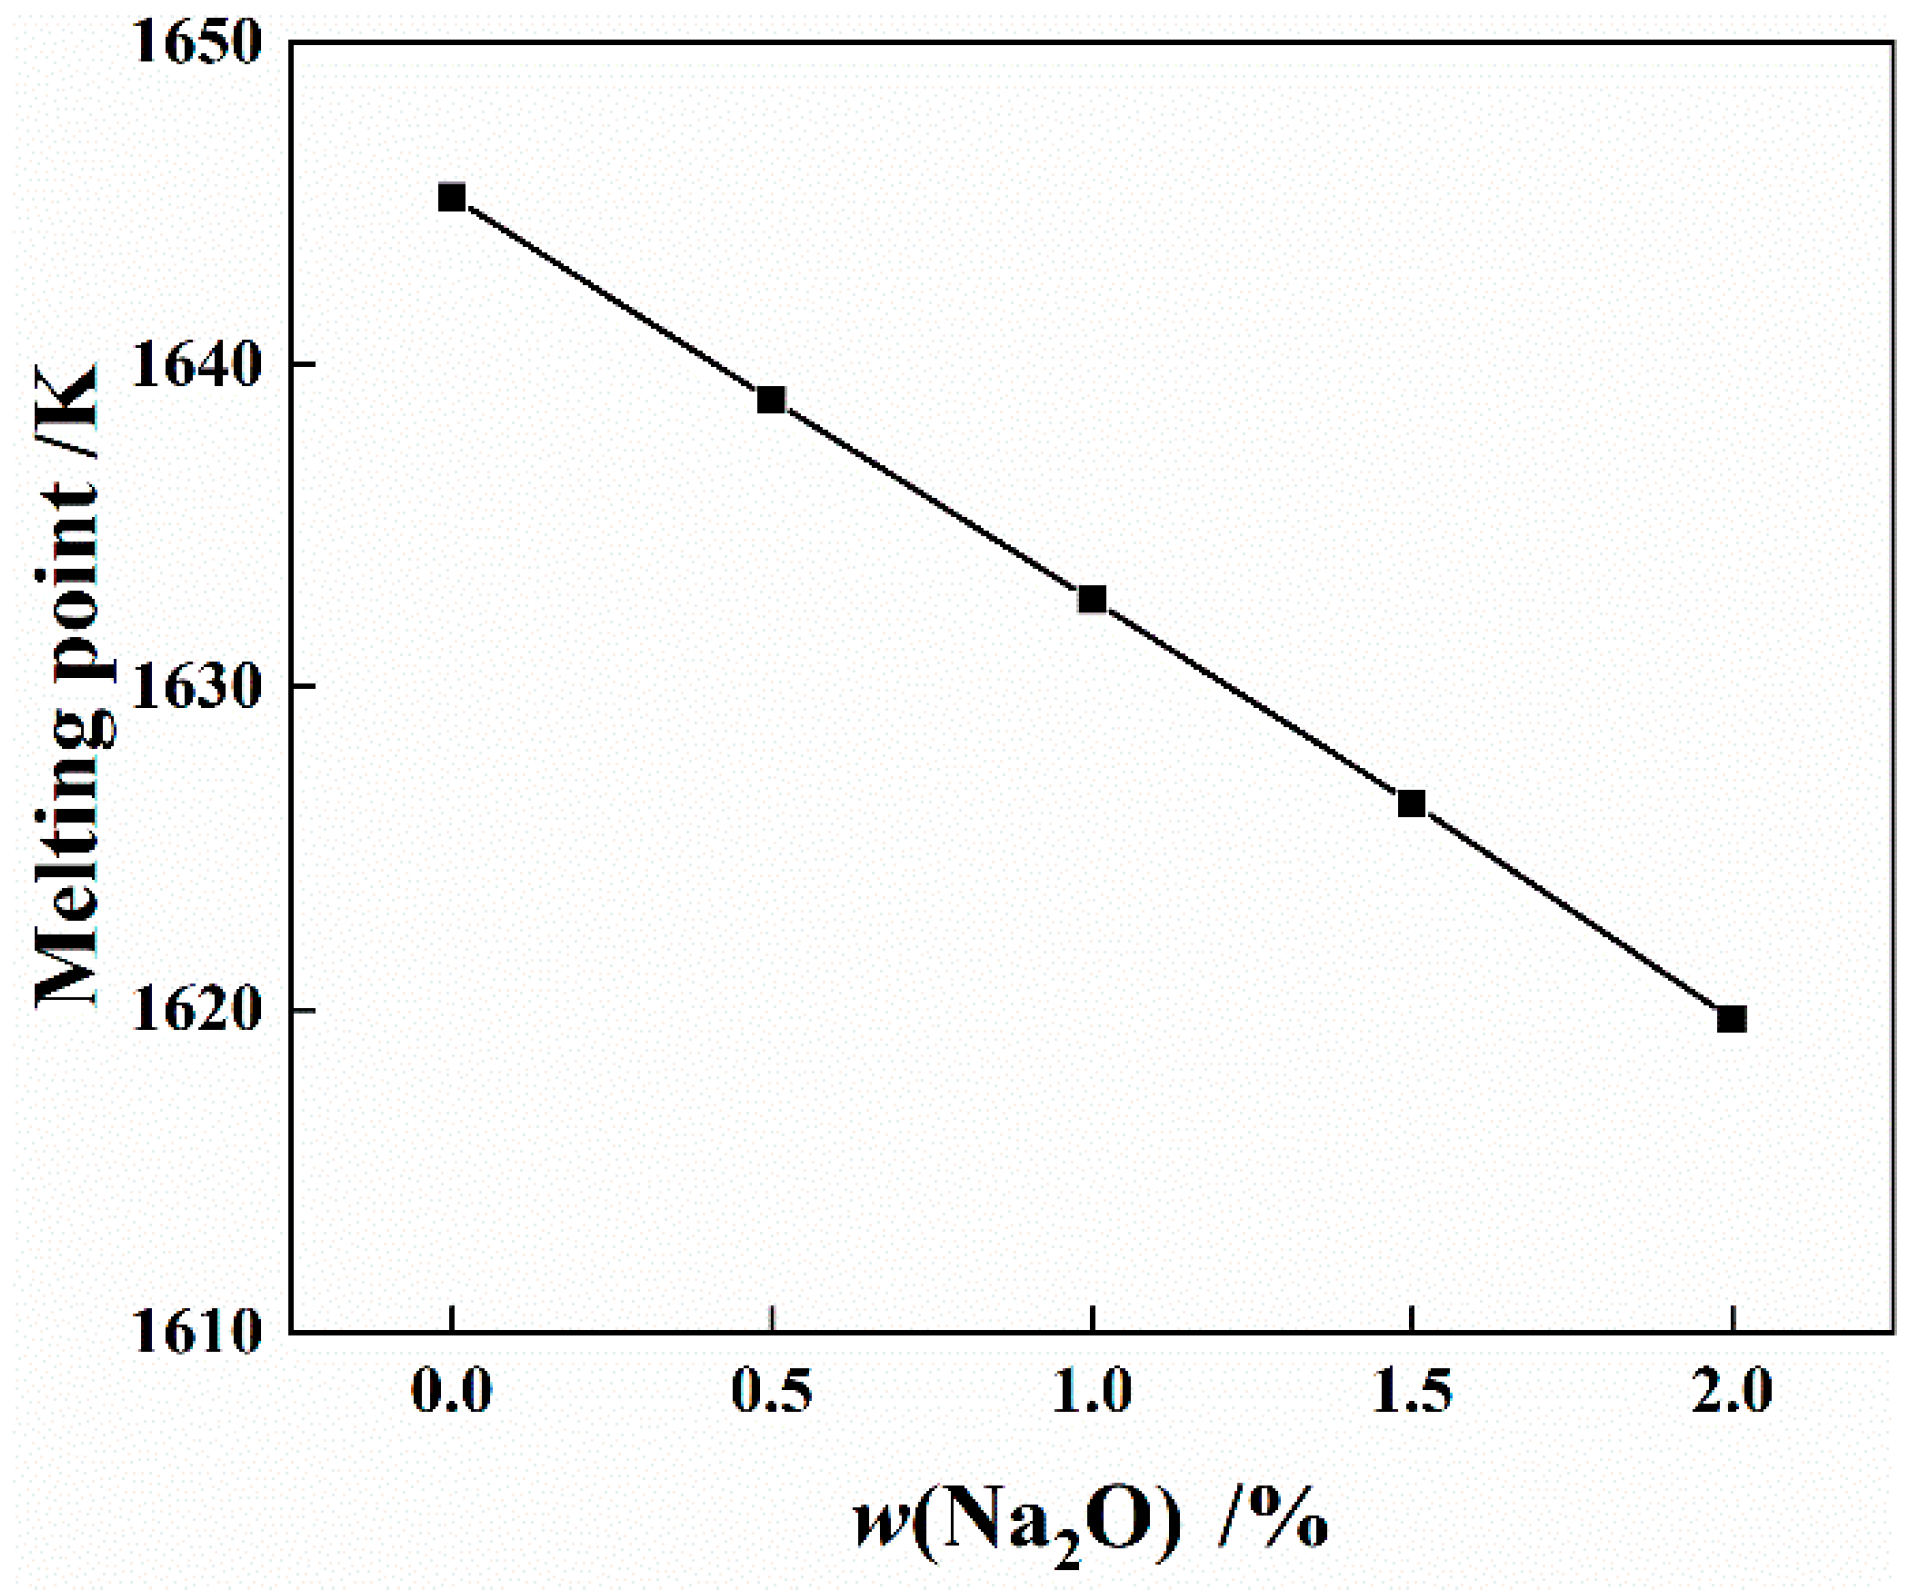
Figure 9 shows the liquid region of the CaO-FeO-SiO2 slag system at 1573 K after adding the Na2O calculated by FactSage8.1. It indicates that with the increasing of the w(Na2O) in the slag, the area of the liquid phase increases continuously, and the liquid phase region moves to the low w(FeO) region. Na2O has a great influence on the liquidus in the region of low binary basicity and has little influence in the region of high binary basicity. Figure 10 shows the experiment results of different fractions of Na2O on the melting point of the tested slag. It indicates that with the increasing of the w(Na2O) in slag, the melting point decreases continuously. When the w(Na2O) increases from 0 to 0.5%, the melting point of the tested slag decreases from 1645 K to 1639 K, which is consistent with the law measured by Jiang Diao [11]. The addition of Na2O can generate low-melting-point compounds, such as Na2Si2O5 and Na2Ca2Si3O9, in the slag, which helps to reduce the melting point of the slag [45,46], achieve rapid slag melting in the early stage of converter smelting, and promote the dephosphorization reactions.

4.3.2. Effect of Na2O on Viscosity of Slag

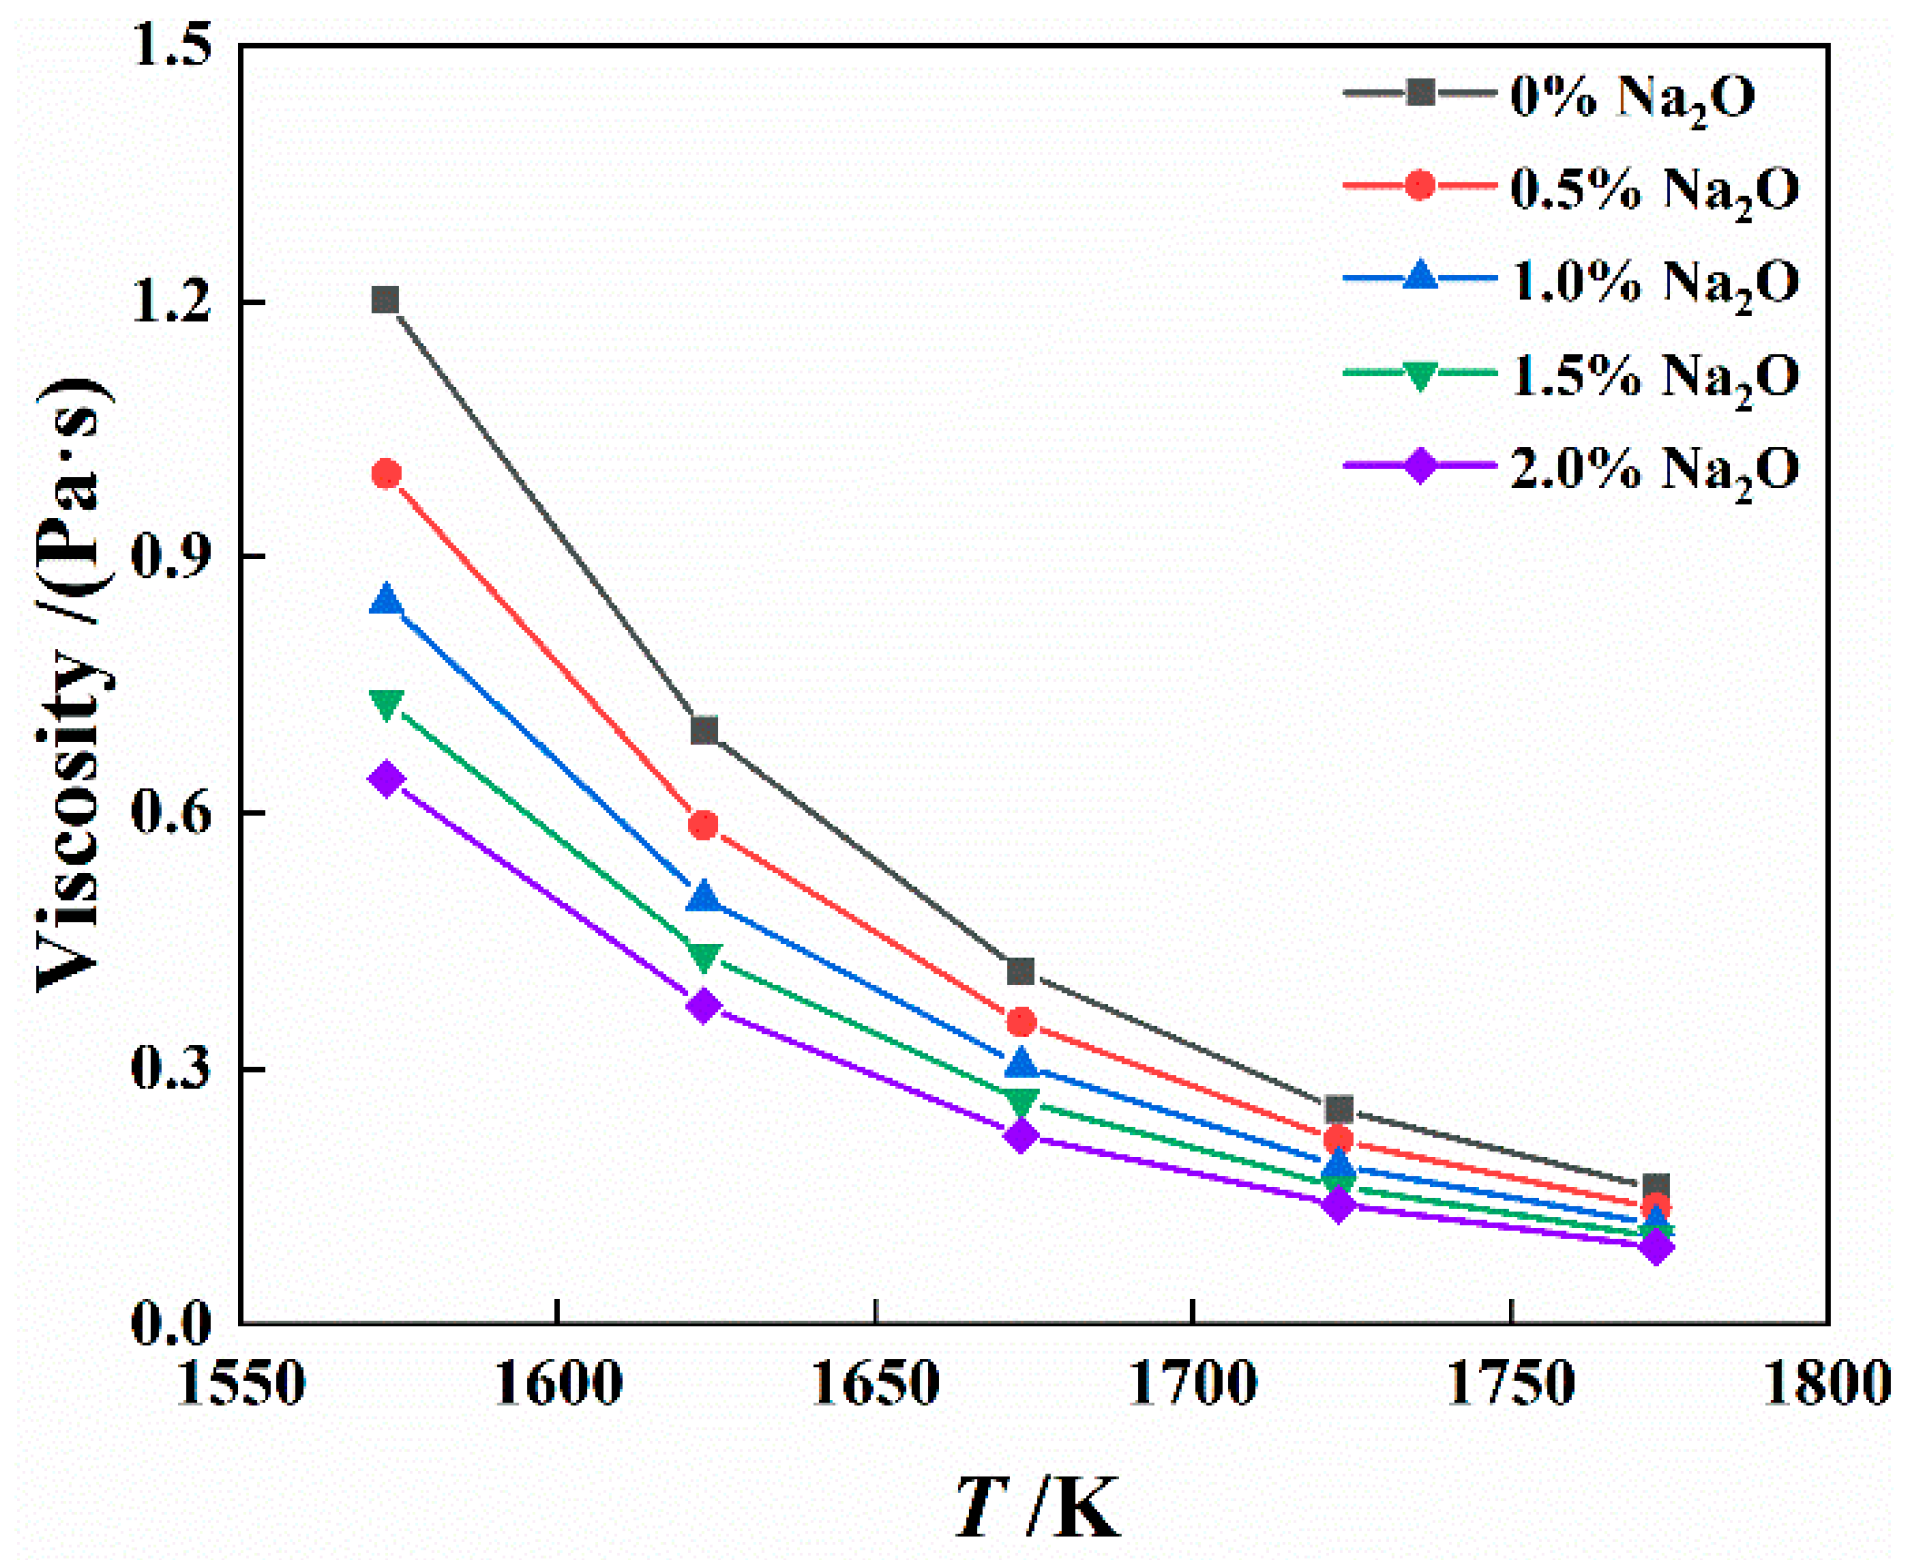
Figure 11 shows the viscosity change of the CaO-FeO-SiO2 slag after adding the Na2O calculated by FactSage8.1. It indicates that the viscosity of the slag decreases with the increasing of w(Na2O). After the viscosity of the slag is reduced, the fluidity is enhanced, the mass transfer capacity between the molten iron and slag is enhanced, and the dephosphorization reaction is promoted [47,48,49].

5. Conclusions

(1)
With the increase of w(Na2O), the dephosphorization rate increases, and the Ca, Si, O, and P elements in the dephosphorization slag are distributed in the same area, mainly in the form of phosphate minerals, such as Ca2SiO4·0.05Ca3(PO4)2 and 6Ca2SiO4·Ca3(PO4)2. After adding Na2O, part of the Na will replace the Ca in the phosphorus-containing phase, forming a Ca2SiO4·Ca2Na2(PO4)2 phase.
(2)
After adding sodium-containing slagging material, the average dephosphorization rate of blowing for 6 min and at the end point can reach 62.39% and 72.03%, which are 19.62% and 9.89% higher, respectively, than the corresponding values of the conventional heats. The average final slag basicity of the test heats is 0.19% lower than that of the conventional heats, while the average w(P2O5) of the final slag increases by 0.36%, and the average T.Fe decreases by 0.69%. The average slagging materials consumption of the test heats is 35.93 kg/t, which is 7.24 kg/t lower than that of the conventional heats.
(3)
Through thermodynamic calculation, we found that with the increase of w(Na2O), the phosphorus distribution ratio between the slag and the molten iron increases significantly, the area of the liquid phase zone of the slag system increases continuously, and the viscosity decreases continuously.

Author Contributions

Investigation, B.G. and Y.Y.; Conceptualization, B.G.; methodology, Z.J.; formal analysis, D.Z. and B.G.; Data collection, B.G. and Y.Y.; Writing—original draft, B.G.; Writing—review and editing, D.Z.; Resources, Z.J.; Supervision, D.Z. All authors have read and agreed to the published version of the manuscript.

Funding

The authors are grateful for the support from the Open Competition Scientific and Technological Research Projects of Heilongjiang Province (2022ZXJ03A02) and the Jiangxi Provincial Technical Innovation Guidance Program (20202BDH80002).

Institutional Review Board Statement

Not applicable.

Informed Consent Statement

Not applicable.

Data Availability Statement

Not applicable.

Conflicts of Interest

The authors declare no conflict of interest.

References

  1. Messier, R.W.; Li, L. Separating effects of phosphorus and sulfur in weld cracking of austenitic stainless steels for technological and economic benefits. J. Adv. Mater. 2001, 33, 3–13. [Google Scholar]
  2. Ogawa, Y.; Yano, M.; Kitamura, S.; Hirata, H. Development of the continuous dephosphorization and decarburization process using BOF. Tetsu-Hagané 2001, 87, 21–28. [Google Scholar] [CrossRef] [PubMed]
  3. Wang, X.H.; Zhu, G.S.; Li, H.B.; Lv, Y.C. Investigation on “slag remaining + double-slag” BOF steelmaking technology. Chin. Metall. 2013, 23, 40–46. [Google Scholar]
  4. Gao, S.Y.; Tian, Z.H.; Zhu, L.X.; Zhao, C.L.; Yan, Z.H.; Luo, B.G.; Wei, G. Study on the dephosphorization of hot metal in converter. Chin. J. Eng. 2011, 33, 63–67. [Google Scholar]
  5. Kang, F.; Lu, Z.X.; Jiang, X.F.; Zhong, Z.M. Research and development of BRP technology at Baosteel. Steel 2005, 3, 25–28. [Google Scholar]
  6. Zhou, C.G.; Hu, J.Z.; Ai, L.Q.; Wang, S.H.; Yang, H.Z.; Chen, H. Research progress and prospect of dephosphorization in steelmaking converter. J. Iron Steel Res. 2021, 33, 183–195. [Google Scholar]
  7. Liu, J.; Li, G.Q.; Zhu, C.Y.; Wang, C.A. Research progress in treatment of high phosphorus iron ore and dephosphorization of high phosphorus hot metal. J. Mater. Metall. 2007, 23, 173–179. [Google Scholar]
  8. Pak, J.J.; Fruehan, R.J. The effect of Na2O on dephosphorization by CaO-based steelmaking slags. Metall. Trans. B 1991, 22, 39–46. [Google Scholar] [CrossRef]
  9. Pak, J.J.; Fruehan, R.J. Soda slag system for hot metal dephosphorization. Metall. Trans. B 1986, 17, 797–804. [Google Scholar] [CrossRef]
  10. Li, G.Q.; Hamano, T.; Tsukihashi, F. The effect of Na2O and Al2O3 on dephosphorization of molten steel by high basicity MgO saturated CaO-FeOx-SiO2 slag. ISIJ Int. 2005, 45, 12–18. [Google Scholar] [CrossRef]
  11. Diao, J. Effect of Al2O3 and Na2O on dephosphorization of high phosphorus hot metal. J. Iron Steel Res. 2013, 25, 9–13. [Google Scholar]
  12. Du, C.M.; Lv, N.N.; Su, C.; Liu, W.M.; Yang, J.X.; Wang, H.C. Distribution of P2O5 between solid solution and liquid phase in dephosphorization slag of CaO-SiO2-FeO-P2O5-Na2O system. J. Iron Steel Res. Int. 2019, 26, 1162–1170. [Google Scholar] [CrossRef]
  13. Wrampelmeyer, J.C.; Dimitrov, S.; Janke, D. Dephosphorization equilibria between pure molten iron and CaO-saturated FeOn-CaO-SiO2 and FeOn-CaO-Al2O3 slags. Steel Res. 1989, 60, 539. [Google Scholar] [CrossRef]
  14. Xing, W.; Wu, L.; Li, S.Q.; Yao, L.; Liu, R.Z. Experimental study on the melting temperature characteristic of the CaO-FeO-Al2O3-SiO2 slag system. Chin. J. Eng. 2014, 36, 603–607. [Google Scholar]
  15. Zhang, H.Y.; Jiang, Z.H.; Wang, W.Z.; Liu, X.; Gu, W.B.; Wang, J. Effect of BaO and Na2O on equilibrium phosphorus content in LF refining liquid steel. Spec. Steel 2002, 1, 14–16. [Google Scholar]
  16. Taposhe, G.I.A.; Khajavi, L.T. Removal of phosphorus from Si-Fe alloy by CaO-Al2O3-SiO2-Na2O slag refining. J. Miner. Met. Mater. Soc. 2021, 73, 729–735. [Google Scholar] [CrossRef]
  17. Li, F.S.; Li, X.P.; Yang, S.F.; Zhang, Y.L. Distribution ratios of phosphorus between CaO-FeO-SiO2-Al2O3/Na2O/TiO2 slags and carbon-saturated iron. Metall. Mater. Trans. B 2017, 48, 2367–2378. [Google Scholar] [CrossRef]
  18. Li, F.S.; Li, X.P.; Zhang, Y.L.; Gao, M. Phosphate capacities of CaO-FeO-SiO2-Al2O3/Na2O/TiO2 slags. High Temp. Mater. Process. 2019, 38, 50–59. [Google Scholar] [CrossRef]
  19. Li, X.P.; Gao, J.T.; Zhang, Y.L.; Xing, L.L.; Zou, L. Distribution behavior of phosphorus between CaO-FeO-SiO2-Al2O3/Na2O/TiO2 slags and carbon-saturated iron. Steel 2017, 52, 18–23. [Google Scholar] [CrossRef]
  20. Zhou, Z.Q.; Zhu, Z.Z.; Ding, Y.C.; Zhou, S.N. Effect of Na2O on dephosphorization for high phosphorus Si-Mn alloys. Steel 2017, 52, 13–17. [Google Scholar]
  21. Xuan, X.Y.; Shi, Z.; Qi, X.; Cai, J.W. Study on dephosphorization of high-phosphorus hot metal in CaO-SiO2-FeO-Na2O-Al2O3 slag system. Min. Metall. 2015, 24, 51–54. [Google Scholar]
  22. Moriya, T.; Fujii, M. Dephosphorization and desulfurization of molten pig iron by Na2CO3. Trans. Iron Steel Inst. Jpn. 1981, 21, 732–741. [Google Scholar] [CrossRef]
  23. Maddocks, W.R.; Turkdogan, E.T. The effect of sodium oxide additions to steelmaking slags dephosphorization of steel by soda-slags. J. Iron Steel Inst. 1952, 171, 128–136. [Google Scholar]
  24. Oelsen, W. The dephosphorization and desulfurization of high-carbon iron melts with the production of water-soluble high phosphorus slags. Arch Eisenhuttenw 1965, 36, 861–871. [Google Scholar]
  25. Ito, K.; Sang, N. Phosphorus distribution between basic slags and carbon-saturated iron at hot-metal temperatures. Trans. Iron Steel Inst. Jpn. 1985, 25, 355–362. [Google Scholar] [CrossRef]
  26. Marukawa, K.; Shirota, Y.; Anezaki, S.; Hirahara, H. Refining process of molten iron by sodium carbonate. Tetsu-Hagané 1981, 67, 323. [Google Scholar] [CrossRef]
  27. Du, C.M.; Gao, X.; Ueda, S.; Kitamura, S.Y. Effect of Na2O addition on phosphorus dissolution from steelmaking slag with high P2O5 content. J. Sustain. Metall. 2017, 3, 671–682. [Google Scholar] [CrossRef]
  28. Yu, K.; Zhang, Y.L.; Li, F.S.; Gao, M. Effect of Al2O3/TiO2/Na2O on enrichment of phosphorus in P-bearing steelmaking slag. J. Iron Steel Res. Int. 2019, 26, 796–805. [Google Scholar] [CrossRef]
  29. Wang, D.Z.; Bao, Y.P.; Wang, M. Study on the enrichment behavior of phosphorus in high phosphorus converter slag. Chin. J. Eng. 2018, 40, 65–72. [Google Scholar]
  30. He, S.; Liu, Y.Q.; Lin, L.; Hou, Z.X.; Huang, F.; Hu, Y.B. Effect of Na2O on the enrichment behavior of phosphorus in the slag system CaO-SiO2-Fe2O3-P2O5. Iron Steel Vanadium Titan. 2022, 43, 140–145. [Google Scholar]
  31. Lin, L.; Bao, Y.P.; Jiang, W.; Wu, Q.F. Effect of Na2O on phosphorus enrichment and separation in P-bearing steelmaking slag. ISIJ Int. 2015, 55, 552–558. [Google Scholar] [CrossRef]
  32. Zhang, J. Computational Thermodynamics of Metallurgical Melts and Solutions; Metallurgical Industry Press: Beijing, China, 2007. [Google Scholar]
  33. Zhang, K.H.; Zhang, Y.L.; Li, F.S.; Wu, T. A thermodynamic model for calculation of sulfur distribution ratio between CaO-SiO2-Al2O3-Na2O-TiO2-(MgO) slag and carbon saturated hot metal. J. Iron Steel Res. 2018, 30, 265–272. [Google Scholar]
  34. Sun, J.L.; Liu, C.J.; Jiang, M.F. Thermodynamic model of dephosphorization of CaO-SiO2-FeO-Al2O3-Na2O-TiO2-P2O5 slag system. Iron Steel Vanadium Titan. 2021, 42, 146–151+178. [Google Scholar]
  35. Gong, W.; Jiang, Z.H.; Zhan, D.P. Intelligent information technology application association: The model of mass action concentration for slag system of CaO-SiO2-A12O3-MgO and its application. In Proceedings of the 2011 AASRI Conference on Artificial Intelligence and Industry Application (AASRI-AIIA 2011 V4), Male, Maldives, 23–24 May 2011; American Applied Sciences Research Institute: Miramar, FL, USA, 2011; p. 4. [Google Scholar]
  36. Yang, X.M.; Duan, J.P.; Shi, C.B.; Zhang, M.; Zhang, Y.L.; Wang, J.C. A thermodynamic model of phosphorus distribution ratio between CaO-SiO2-MgO-FeO-Fe2O3-MnO-Al2O3-P2O5 slags and molten steel during a top-bottom combined blown converter steelmaking process based on the ion and molecule coexistence theory. Metall. Mater. Trans. B 2011, 42, 738–770. [Google Scholar] [CrossRef]
  37. Li, P.C.; Zhang, J.L. Retraction: A prediction model of phosphorus distribution between CaO-SiO2-MgO-FeO-Fe2O3-P2O5 slags and liquid iron. ISIJ Int. 2014, 54, 756–765. [Google Scholar] [CrossRef]
  38. Zhang, J. Coexistence theory of slag structure and its application to calculation of oxidizing capability of slag melts. J. Iron Steel Res. Int. 2003, 10, 1–10. [Google Scholar]
  39. Yang, X.M.; Li, J.Y.; Zhang, M.; Chai, G.M.; Zhang, J. Prediction model of sulfide capacity for CaO-FeO-Fe2O3-Al2O3-P2O5 slags in a large variation range of oxygen potential based on the ion and molecule coexistence theory. Metall. Mater. Trans. B 2014, 45, 2118–2137. [Google Scholar] [CrossRef]
  40. Yang, X.M.; Li, J.Y.; Zhang, M.; Zhang, J. Prediction model of sulphur distribution ratio between CaO-FeO-Fe2O3-Al2O3-P2O5 slags and liquid iron over large variation range of oxygen potential during secondary refining process of molten steel based on ion and molecule coexistence theory. Ironmak. Steelmak. 2016, 43, 39–55. [Google Scholar] [CrossRef]
  41. Sun, Y.H.; Zhao, C.L.; Luo, L.; Zhao, Z.C. Calculation and analysis of slag phosphate capacity and prediction model in 300 t top and bottom-blowing converter. Chin. J. Eng. 2016, 38, 83–89. [Google Scholar]
  42. Jeoungkiu, I.M.; Morita, K.; Sano, N. Phosphorus distribution ratios between CaO-SiO2-FetO slags and carbon-saturated iron at 1573 K. ISIJ Int. 1996, 36, 517–521. [Google Scholar]
  43. Basu, S.; Lahiri, A.K.; Seetharaman, S. Phosphorus partition between liquid steel and CaO-SiO2-P2O5-MgO slag containing low FeO. Metall. Mater. Trans. B 2007, 38, 357. [Google Scholar] [CrossRef]
  44. Li, J.; Yue, K.X. Study on dephosphorizing flux containing CaO-Fe2O3-CaF2-Al2O3-Na2CO3 for hot metal pretreatment. J. Anhui Univ. Technol. (Nat. Sci. Ed.) 2003, 20, 177–180. [Google Scholar]
  45. Niekerk, W.H.V.; Dippenaar, R.J. Thermodynamic aspects of Na2O and CaF2 containing lime-based slags used for the desulphurization of hot-metal. ISIJ Int. 1993, 33, 59–65. [Google Scholar] [CrossRef]
  46. Takahira, N.; Hanao, M.; Tsukaguchi, Y. Viscosity and solidification temperature of SiO2-CaO-Na2O melts for fluorine free mould flux. ISIJ Int. 2013, 53, 818–822. [Google Scholar] [CrossRef]
  47. Sukenaga, S.; Saito, N.; Kawakami, K.; Nakashima, K. Viscosities of CaO-SiO2-Al2O3-(R2O or RO) melts. ISIJ Int. 2006, 46, 352–358. [Google Scholar] [CrossRef]
  48. Chen, C.Y.; Jiang, Z.H.; Li, Y.; Sun, M.; Chen, K.; Wang, Q.; Li, H.B. Effect of Na2O and Rb2O on inclusion removal in C96V saw wire steels using low-basicity LF (Ladle Furnace) refining slags. Metals 2018, 8, 691. [Google Scholar] [CrossRef]
  49. Kim, H.; Kim, W.H.; Park, J.H.; Min, D.J. A study on the effect of Na2O on the viscosity for ironmaking slags. Steel Res. Int. 2010, 81, 17–24. [Google Scholar] [CrossRef]
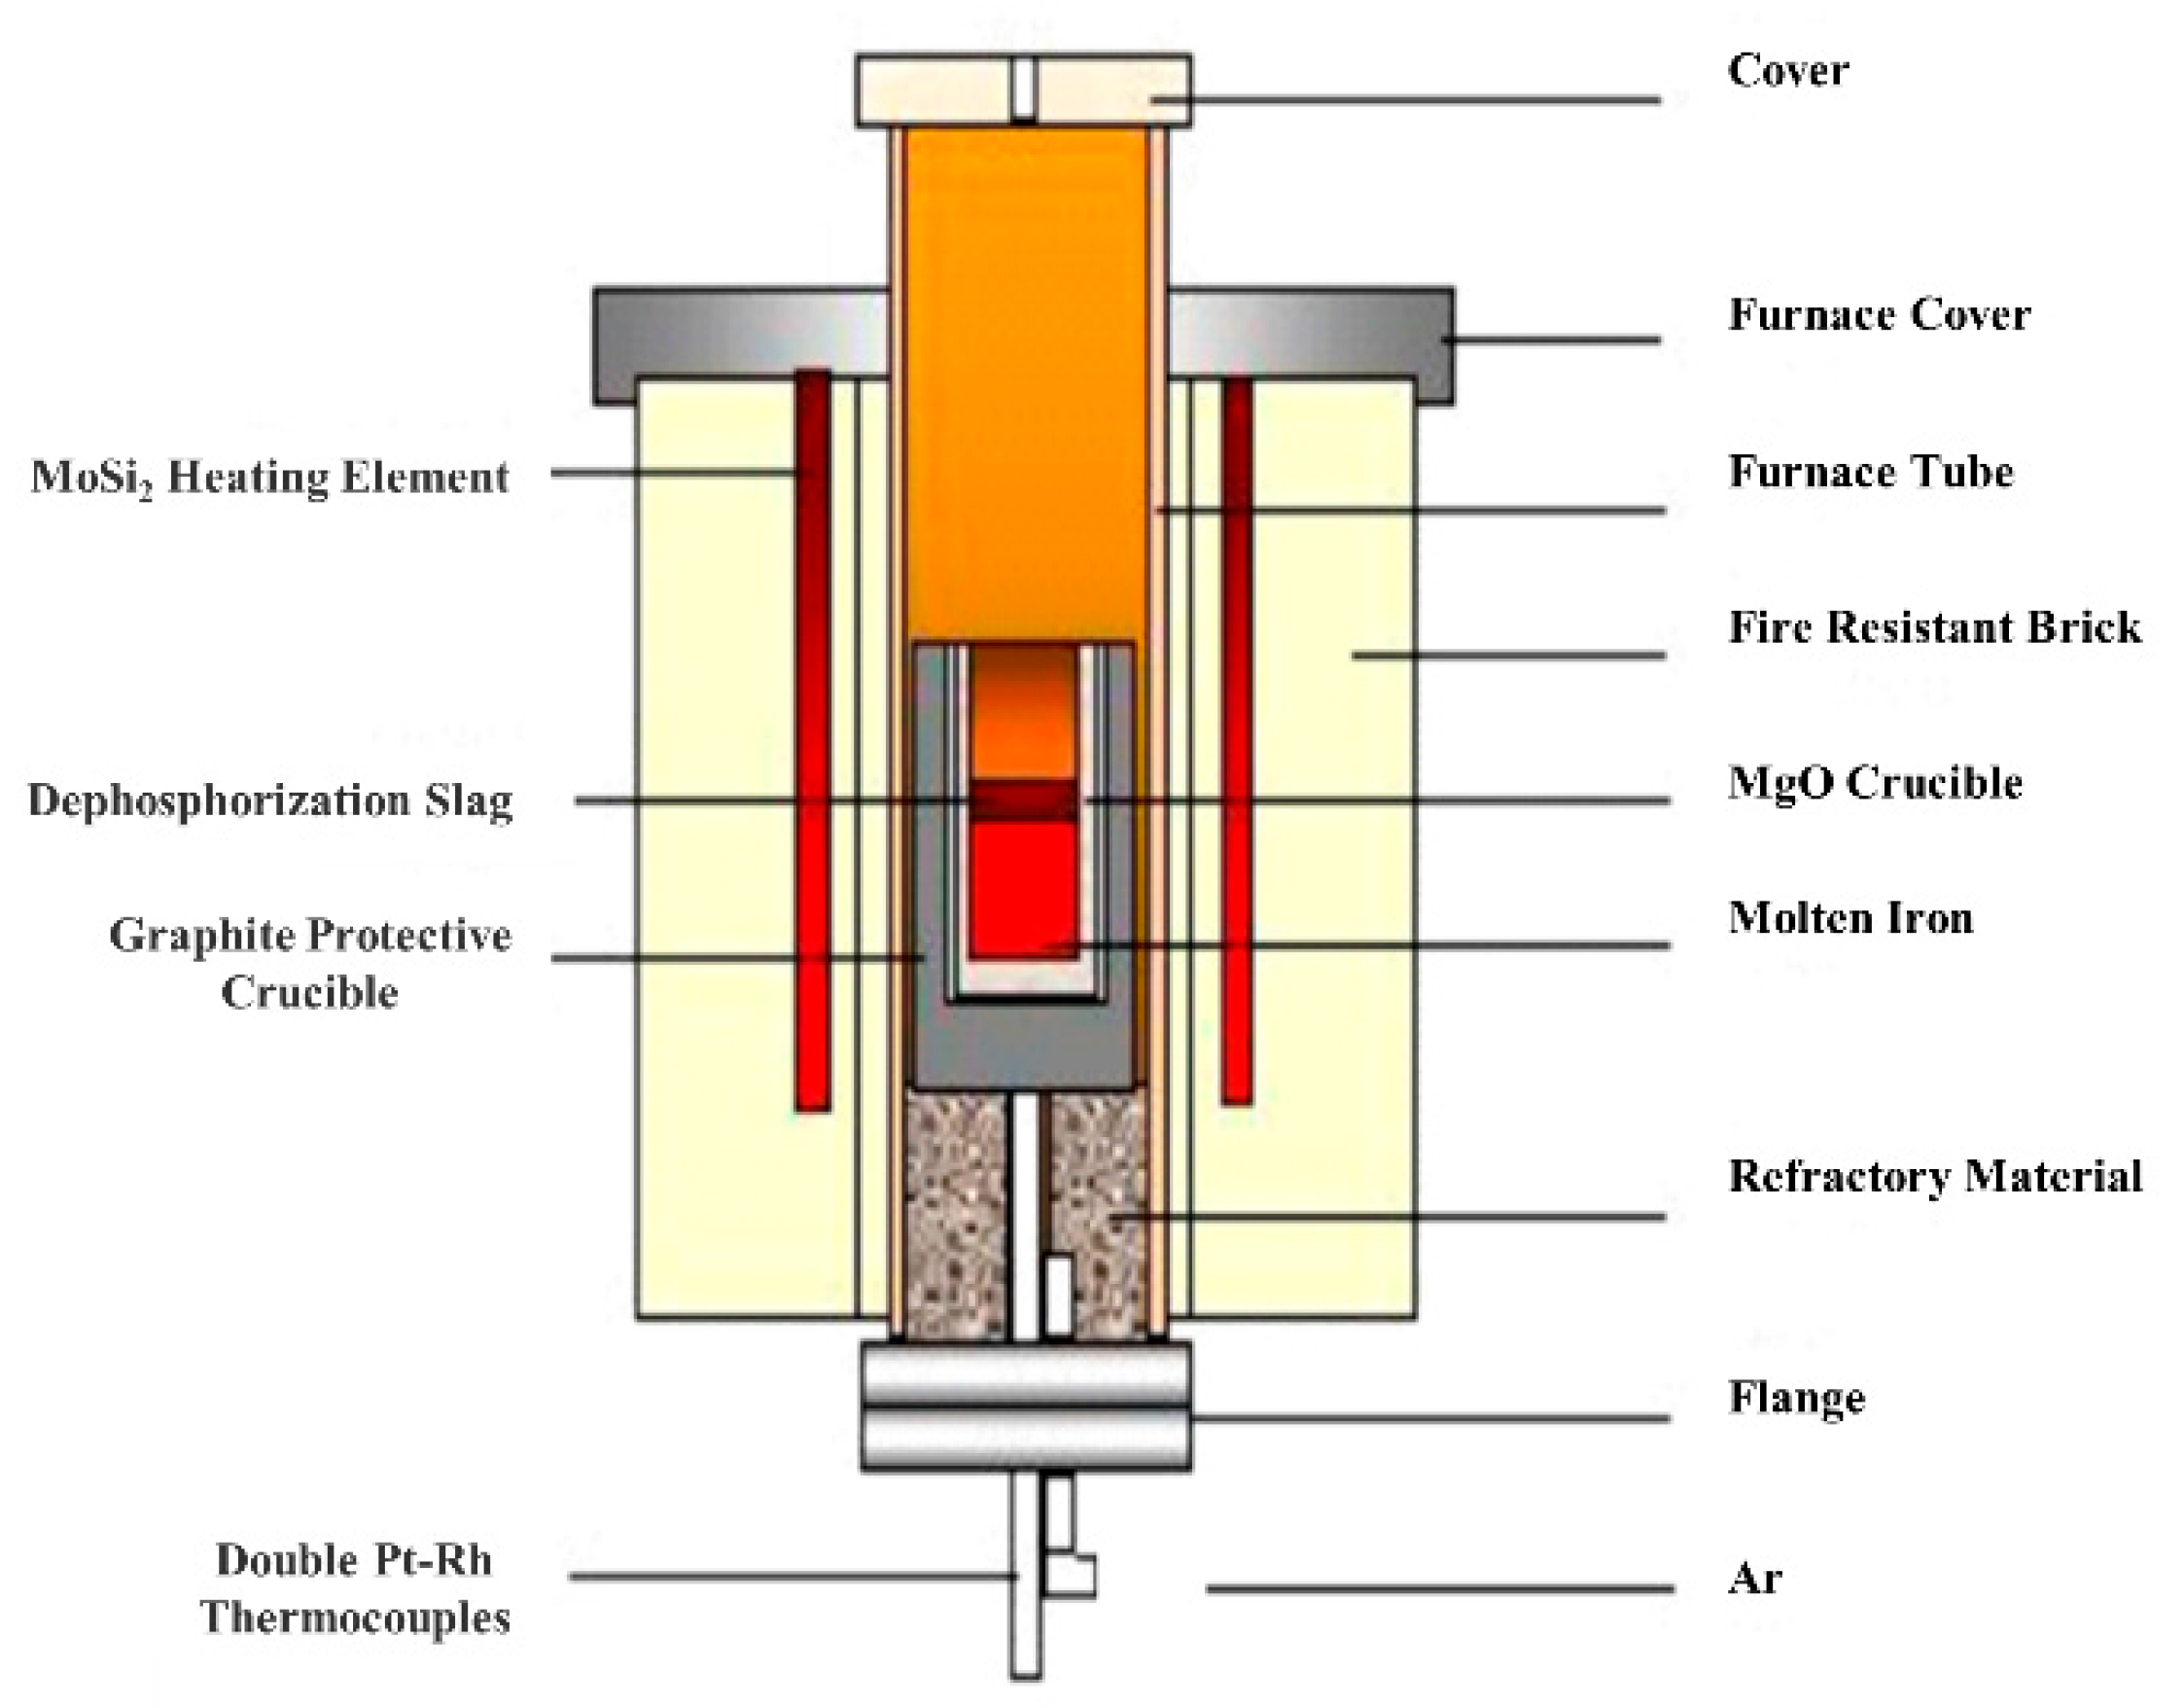
Figure 1. Schematic diagram of MoSi2 resistance furnace.
Metals 13 00844 g001
Figure 2. XRD results of dephosphorization slag. (a) No. 1 slag sample; (b) No. 2 slag sample; (c) No. 3 slag sample; (d) No. 4 slag sample.
Metals 13 00844 g002
Figure 3. SEM results of dephosphorization slag sample. (a) No. 1 slag sample; (b) No. 2 slag sample; (c) No. 3 slag sample; (d) No. 4 slag sample. 1 iron-rich phase; 2 phosphorus-rich phase; 3 matrix phase.
Metals 13 00844 g003
Figure 4. Element mapping analysis result of No. 1 dephosphorization slag. 1 iron-rich phase; 2 phosphorus-rich phase; 3 matrix phase.
Metals 13 00844 g004
Figure 5. Element mapping analysis result of No. 3 dephosphorization slag. 1 iron-rich phase; 2 phosphorus-rich phase; 3 matrix phase.
Metals 13 00844 g005
Figure 6. Relationship between standard Gibbs free energy and temperature of reaction equations.
Metals 13 00844 g006
Figure 7. Comparison of calculated lgLP,cal and measured lgLP,meas [17,42,43].
Metals 13 00844 g007
Figure 8. Effect of different mass fraction of Na2O on lgLP.
Metals 13 00844 g008
Figure 9. Liquid region of CaO-FeO-SiO2 slag at 1573 K.
Metals 13 00844 g009
Figure 10. Effect of different mass fractions of Na2O on melting point of slag system.
Metals 13 00844 g010
Figure 11. Effect of w(Na2O) on viscosity of CaO-25%FeO-SiO2 slag (R = 1.5).
Metals 13 00844 g011
Table 1. Initial chemical compositions of molten iron (mass fraction, %).
CSiMnPS
3.080.030.080.1350.034
Table 2. Compositions of dephosphorization slag (mass fraction, %).
HeatsCompositionsR
CaOFe2O3MgOMnOSiO2Na2CO3
131.633.39521.101.50
229.633.39519.73.421.50
327.633.39518.46.841.50
425.633.39517.110.261.50
Table 3. Experimental dephosphorization results.
HeatsCompositions/%Dephosphorization
Rate/%
lgLP/%
CSiMnPS
No. 12.800.020.040.0380.03071.855.05
No. 22.670.010.050.0320.03076.305.24
No. 32.200.020.050.0300.03077.785.31
No. 41.800.020.040.0290.03278.525.36
Note: The LP calculation formula is L P = ( % P 2 O 5 ) slag [ % P ] 2 molten   iron .
Table 4. Compositions of dephosphorization slag (mass fraction, %).
HeatsCaOT.FeMgOMnOSiO2Na2OP2O5R
No. 134.7619.427.184.3423.240.001.631.50
No. 233.5617.418.743.4422.670.941.761.48
No. 337.8314.139.283.5026.322.421.831.40
No. 436.3116.0210.053.6024.322.981.921.49
Table 5. Energy spectrum analysis results of dephosphorization slag (mass fraction, %).
HeatsAreasCaSiOMgFePMnNa
No. 110.710.2827.7915.3845.23010.610
238.5013.5738.024.972.940.931.060
342.4717.6129.385.323.980.041.200
No. 213.720.3816.4923.2346.8909.200.09
245.0615.7532.252.321.181.151.431.01
335.5716.3436.335.774.170.081.570.17
No. 313.391.5814.3711.8151.17017.200.48
239.2313.7836.260.954.981.951.111.75
336.7317.5737.222.573.570.071.950.32
No. 413.301.2128.239.9746.05010.910.33
236.6216.6635.202.562.192.151.882.75
336.5120.2430.794.375.740.121.640.59
Table 6. Average value of phosphorus mass fraction and dephosphorization rate.
HeatsP Mass Fraction/%Dephosphorization Rate/%
6 min End Point 6 min End Point
Conventional0.0600.04042.7762.14
Test0.0410.03062.3972.03
Table 7. Comparison of converter slag compositions (mass fraction, %).
HeatsCaOT.FeMgOMnOSiO2Al2O3P2O5Na2OR
Conventional43.8115.629.605.0417.542.792.47<0.012.50
Test41.6914.939.555.3818.002.822.830.162.31
Table 8. Comparison of average material consumption (kg·t−1).
HeatsLime Magnesium Oxide Ball Dolomite Sodium-Containing SlagTotal Slag Consumption Iron and Steel Consumption
Conventional32.318.192.6743.171053.60
Test26.158.241.5435.931052.23
Table 9. Standard Gibbs free energy and equilibrium constant of dephosphorization reaction.
Dephosphorization Reactions Δ r G m θ / J · mol 1 K ci θ
2[P] + 5(FeO) = (P2O5) + 5[Fe]−122,412 + 312.522 T K 8 = N 8 a [ Fe ] 5 N 3 5 a [ P ] 2
2[P] + 5(FeO) + 2(Ca2+ + O2−) = (2CaO·P2O5) + 5[Fe]−606,784 + 285.953 T K c 20 = N c 20 a [ Fe ] 5 N 1 2 N 3 5 a [ P ] 2
2[P] + 5(FeO) + 3(Ca2+ + O2−) = (3CaO·P2O5) + 5[Fe]−816,975.125 + 362.419 T K c 21 = N c 21 a [ Fe ] 5 N 1 3 N 3 5 a [ P ] 2
2[P] + 5(FeO) + 4(Ca2+ + O2−) = (4CaO·P2O5) + 5[Fe]−851,492.98 + 352.822 T K c 22 = N c 22 a [ Fe ] 5 N 1 4 N 3 5 a [ P ] 2
2[P] + 5(FeO) + 3(Fe2+ + O2−) = (3FeO·P2O5) + 5[Fe]−552,816 + 405.23 T K c 23 = N c 23 a [ Fe ] 5 N 3 3 N 3 5 a [ P ] 2
2[P] + 5(FeO) + 4(Fe2+ + O2−) = (4FeO·P2O5) + 5[Fe]−504,243 + 359.889 T K c 24 = N c 24 a [ Fe ] 5 N 3 4 N 3 5 a [ P ] 2
2[P] + 5(FeO) + 3(Mn2+ + O2−) = (3MnO·P2O5) + 5[Fe]−648,833.411 + 414.571 T K c 25 = N c 25 a [ Fe ] 5 N 4 3 N 3 5 a [ P ] 2
2[P] + 5(FeO) + 2(Mg2+ + O2−) = (2MgO·P2O5) + 5[Fe]45,957 − 26.835 T K c 26 = N c 26 a [ Fe ] 5 N 5 2 N 3 5 a [ P ] 2
2[P] + 5(FeO) + 3(Mg2+ + O2−) = (3MgO·P2O5) + 5[Fe]−609,127.5 + 349.366 T K c 27 = N c 27 a [ Fe ] 5 N 5 3 N 3 5 a [ P ] 2
2[P] + 5(FeO) + 3(2Na2+ + O2−) = (3Na2O·P2O5) + 5[Fe]−1,202,452 + 451.222 T K c 28 = N c 28 a [ Fe ] 5 N 7 2 N 3 5 a [ P ] 2
Disclaimer/Publisher’s Note: The statements, opinions and data contained in all publications are solely those of the individual author(s) and contributor(s) and not of MDPI and/or the editor(s). MDPI and/or the editor(s) disclaim responsibility for any injury to people or property resulting from any ideas, methods, instructions or products referred to in the content.