Article

Studying Plastic Deformation Mechanism in β-Ti-Nb Alloys by Molecular Dynamic Simulations

1
College of Materials Science and Engineering, Hunan University, Changsha 410082, China
2
State Key Lab of High Performance Ceramics and Superfine Microstructure, Shanghai Institute of Ceramics, Chinese Academy of Sciences, Shanghai 201899, China
3
Materials Genome Institute, Shanghai University, Shanghai 200444, China
*
Authors to whom correspondence should be addressed.
Metals 2024, 14(3), 318; https://doi.org/10.3390/met14030318
Submission received: 8 February 2024 / Revised: 4 March 2024 / Accepted: 9 March 2024 / Published: 10 March 2024
(This article belongs to the Special Issue Multi-Scale Simulation of Metals and Alloys)

Abstract

:
Using molecular dynamics (MD) simulations, the transition of the plastic deformation mechanism of Ti-Nb alloys during the tensile process was studied, and the effects of temperature, Nb composition, and strain rate on the deformation mechanism were also investigated. The results show that the deformation process of Ti-Nb alloys involves defect formation, followed by twinning and ω-phase transition, and ultimately, dislocation slip occurs. The <111>{112} slip makes the ω-phase easily overcome the transition energy barrier, inducing the phase transition in the twinning process. Increasing temperature will enhance the plasticity and reduce the strength of the material, while increasing Nb composition will have the opposite effect on the deformation. The simulations show a competition between twinning and dislocation slip mechanisms. With the increase in Nb content, the plastic deformation mechanism of the alloy will change from twinning to dislocation slip. In addition, the plastic strain range increases with the increase in the deformation rate in Ti-Nb alloys. At a higher strain rate, the alloy’s plastic strain range is affected by various deformation mechanisms, which significantly influence the plasticity of the material. The findings of this study provide further insights into the design of Ti-Nb-based alloys.

1. Introduction

Titanium-based alloys have attracted much attention across various applications, particularly in aerospace and biomedical fields.
Significantly, β-titanium alloys have excellent properties, including superelasticity, a shape memory effect, a low Young’s modulus, resistance to biocorrosion, and biocompatibility [1,2,3]. For β-titanium alloys, the mechanical properties are related to the complex plastic deformation mechanism. Intensive research has revealed various plastic deformation modes under the room-temperature deformation of metastable β-titanium alloys. These plastic deformation modes involve dislocation slip, stress-induced α″ martensitic-phase transformation (SIMα″), and stress-induced ω-phase transformation (SIω), as well as {112}<111> twinning and {332}<113> twinning [4,5,6,7]. Similar results can also be found in the phase transition processes in pure Ti [8,9]. These deformation mechanisms depend on factors such as β-phase stability, deformation temperature, deformation rate, and deformation strain [10,11,12]. Therefore, explaining the deformation mechanisms of β-titanium alloys remains a challenge. Considering the intricate nature of these mechanisms, researchers have developed and formulated strategies to enhance the strength and plasticity of β-type alloys. For instance, Ren et al. [13] and Zhang et al. [14] attained a tensile strength exceeding 1.1 GPa and an elongation exceeding 25% by inducing nanoscale twinning during tensile deformation. Similarly, the adjustment of SIMα″ can optimize the mechanical properties of titanium alloys. Researchers have conducted investigations on Ti-10V-2Fe-3Al [15], Ti-15Nb-5Zr-4Sn-1Fe [16], and Ti-6Al-4V [17] and have determined that the balance between strength and ductility in these materials can be achieved through the control of martensite content within the metastable β-phase. Additionally, Pilz et al. [18] achieved 0.2% yield strength, reaching approximately 900 MPa, through a prolonged aging process of 108.0 ks. The strengthening effect was attributed to the isothermally precipitated ω-phase. Zhou et al. [19] found that the tensile ductility of Ti-1Al-8V-5Fe alloys could be restored by transforming the isothermal ω-phase to a heatless ω-phase by β-annealing and water quenching. Moreover, in terms of computational simulation, using the DV-Xα molecular orbital method facilitated a self-consistent calculation of the electronic structure of alloy clusters [20,21]. Two derived alloying parameters, namely the transition metal d-orbital energy level (Md) and the bond order (Bo) [22], played a crucial role in predicting alloy deformation mechanisms. The Bo–Md diagram [23] assumes significance in the design of β-titanium alloys, indicating a transition in plastic deformation mechanisms from twinning to dislocation slip. Additionally, the Ti-Nb alloy phase diagram reveals that the stability of the β-phase increases with the Nb content [24]. This observation suggests that the deformation mechanism of the alloy changes from twinning to dislocation slip due to the stability of the β-phase. However, the study of this transformation process remains unclear.
Molecular dynamics (MD) is effective in investigating the microstructural evolution and deformation mechanisms of materials. The choice of potential function is critical in the molecular dynamic simulation. However, the available potential functions for the Ti-Nb system are relatively limited. This study utilized the semi-empirical Finnis–Sinclair (FS) potential, which Qiu et al. [25] employed for V-Ti-Ta-Nb high-entropy alloys. This potential has demonstrated accurate predictions of properties related to typical radiation defects and mixing enthalpy, aligning well with theoretical values. It also accurately simulates the generation and movement of defects in materials. However, although the effectiveness of the FS potential has been established for the V-Ti-Ta-Nb alloy, further validation is imperative for its applicability to the Ti-Nb system.
Currently, there is a lack of comprehensive investigations into the specific deformation mechanisms in titanium–niobium alloys from a simulation point of view. This study uses MD simulation to investigate the plastic deformation behavior of Ti-Nb single crystals under uniaxial tension. The transition of the deformation mechanism of alloys under different deformation processes has been revealed. Significantly, the alloy’s plastic deformation and mechanical properties are affected by niobium composition, computational cell size, strain rate, and temperature.

2. Computational Method

2.1. FS Potential Function

In 1984, Finnis and Sinclair [26] proposed a semi-empirical many-body potential function model based on the tight-binding model, later referred to as the FS potential. The original FS potential describes the total potential energy E as the sum of two terms:
E = 1 2 i j V ( r i j ) + i j F ( ρ i )
The expression involves the pair potential term, denoted as V ( r i j ) , which is dependent on the distance r i j between the i atom and the j atom. Additionally, the many-body term F ( ρ i ) , where ρ i represents the local electron density, is formulated as:
F ρ i = A ρ i
The parameter A in Equation (2) is assigned according to Equation (1). The charge density φ around atom i undergoes linear superposition, forming the local electron density ρ i :
ρ i = i φ r i
In 1987, Ackland et al. [27] improved the pair potential function V r and density function of pure elements in FS potential by using cubic spline form φ ( r ) :
V r = k = 1 n k d k r k r 3 H s r k r
φ r = k = 1 n k D k R k r 3 H s R k r
where H s (x) represents the Heaviside step function, d k and D k are the coefficients of the spline curve, while r k and R k denote the positions of cubic-spline curve knots. Before fitting the cross-potential functions, we need to use invariant transformation [28,29] to optimize the pure element potential. Then the pure element pair potential function V ( r ) is linearly combined, and the density function φ ( r ) is defined and adjusted. Finally, a new cross-potential function is formulated.
In this study, we employed the FS atomic potential developed by Qiu et al. [25] for the four-element V-Ti-Ta-Nb high-entropy alloy. This potential was fitted based on density functional theory (DFT) calculations of defect properties, including vacancy formation energy, vacancy migration energy, and interstitial formation energy. The alloy potential predicts radiative defect properties, such as binding energies between substitutional solute atoms, the binding energy between substitutional atoms and vacancies, and the formation energy of interstitial solute atoms, in agreement with the DFT results. This potential function appropriately describes the collision cascade process in the four-element V-Ti-Ta-Nb high-entropy alloy (HEA). However, calculations and validations of mechanical properties for Ti-Nb alloy systems still need to be improved. In the subsequent section, we comprehensively validate the pertinent mechanical properties of the potential function for Ti-Nb alloy systems.

2.2. First-Principles Calculations

This study employed the density functional theory (DFT) method to compute the lattice constants and cohesive energies of alloys with specific compositions and structures. The Vienna Ab-initio Simulation Package [30,31] with the Projector Augmented Wave method [32] was used to perform the DFT calculations. The Perdew–Wang generalized gradient approximation (GGA) was employed to treat the exchange-correlation density function [33]. All results in this paper were obtained using a Body-Centered Cubic (BCC) supercell with 16 atoms (2 × 2 × 2). The Brillouin zone was sampled with KSPACING = 0.2 using the Monkhorst–Pack scheme, and the plane wave cutoff was set to 520 eV. Furthermore, the position of the atoms and the volume of the cell were completely relaxed until the force on each atom was less than 10−3 eV/Å.

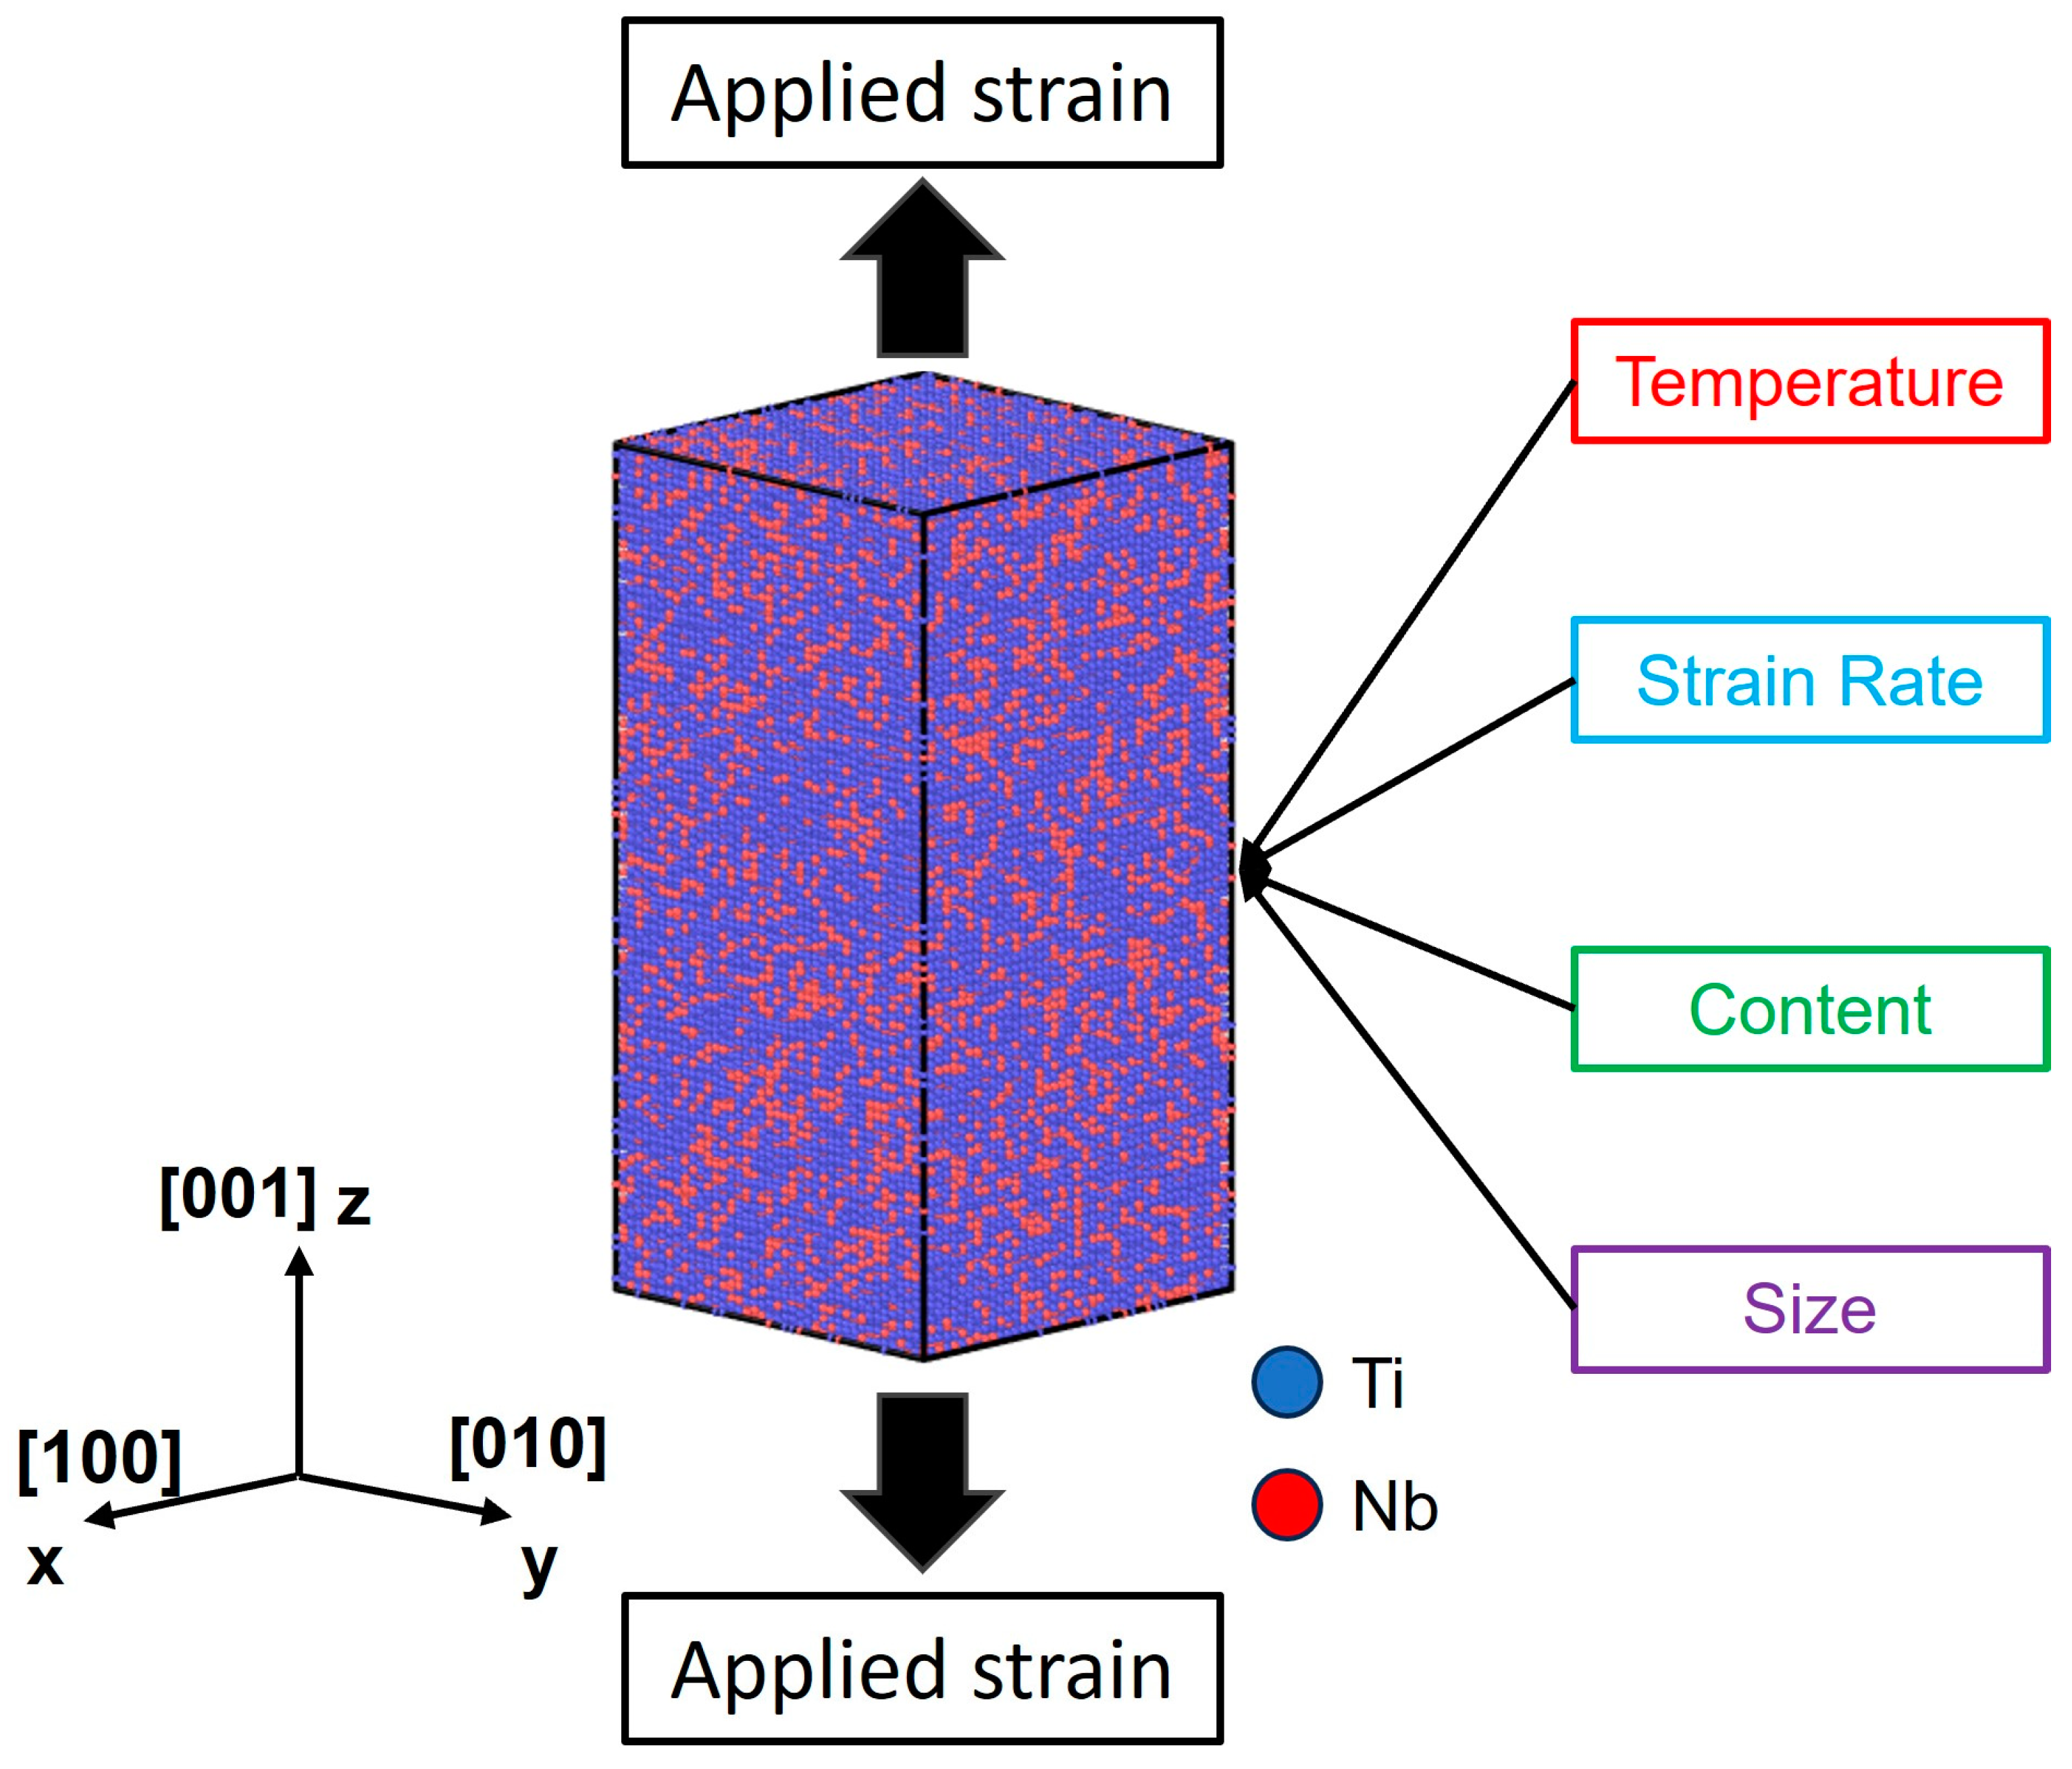
2.3. Molecular Dynamics (MD)

To study the tensile behaviors of Ti-Nb alloys, MD simulations were conducted using the Large-scale Atomic/Molecular Massively Parallel Simulator (LAMMPS) [34], following the verification of potential function. In the simulations, Polyhedral Template Matching (PTM) [35] implemented in Open Visualization Tool (OVITO) software (version: 3.7.10, manufacturer: OVITO GmbH, country: Germany) [36] was used to visualize and analyze the microstructures, including point defects, stacking faults, dislocation, and twins. The simulation methodology is illustrated in Figure 1.

3. Results

3.1. Potential Function Validation

In order to evaluate the effectiveness of the potential function, the FS potential function was used to calculate the various fundamental properties of Ti-Nb alloys. The calculation results were compared with the values obtained from density functional theory (DFT) calculations and experimental results.
Figure 2 shows the four Body-Centered Cubic (BCC) structures that validate the correlation between structural energy and lattice constants. The calculation results of these structures are shown in Table 1; the errors in lattice constants and cohesive energy are all within 0.06 Å and 0.5 eV. Additionally, we computed the unstable stacking fault energies in two directions, namely <111>{110} and <111>{112}, as presented in Table 2. The results were compared with the theoretical values presented by Huang et al. [37], which were based on DFT calculations. The errors of the unstable stacking fault energies obtained with the potential function are around 0.1 J/m−2, indicating reasonable agreement with the DFT-calculated theoretical values. Furthermore, the trend of unstable stacking fault energies with changing composition was accurately reproduced. The elastic constants of alloys with three different compositions were also calculated, as shown in Table 3. These values were compared to other theoretical values from DFT calculations, and the errors were within acceptable ranges.
Therefore, the potential function aligns well with theoretical values for various fundamental properties and is expected to describe the energy and force variations during the tensile loading well.

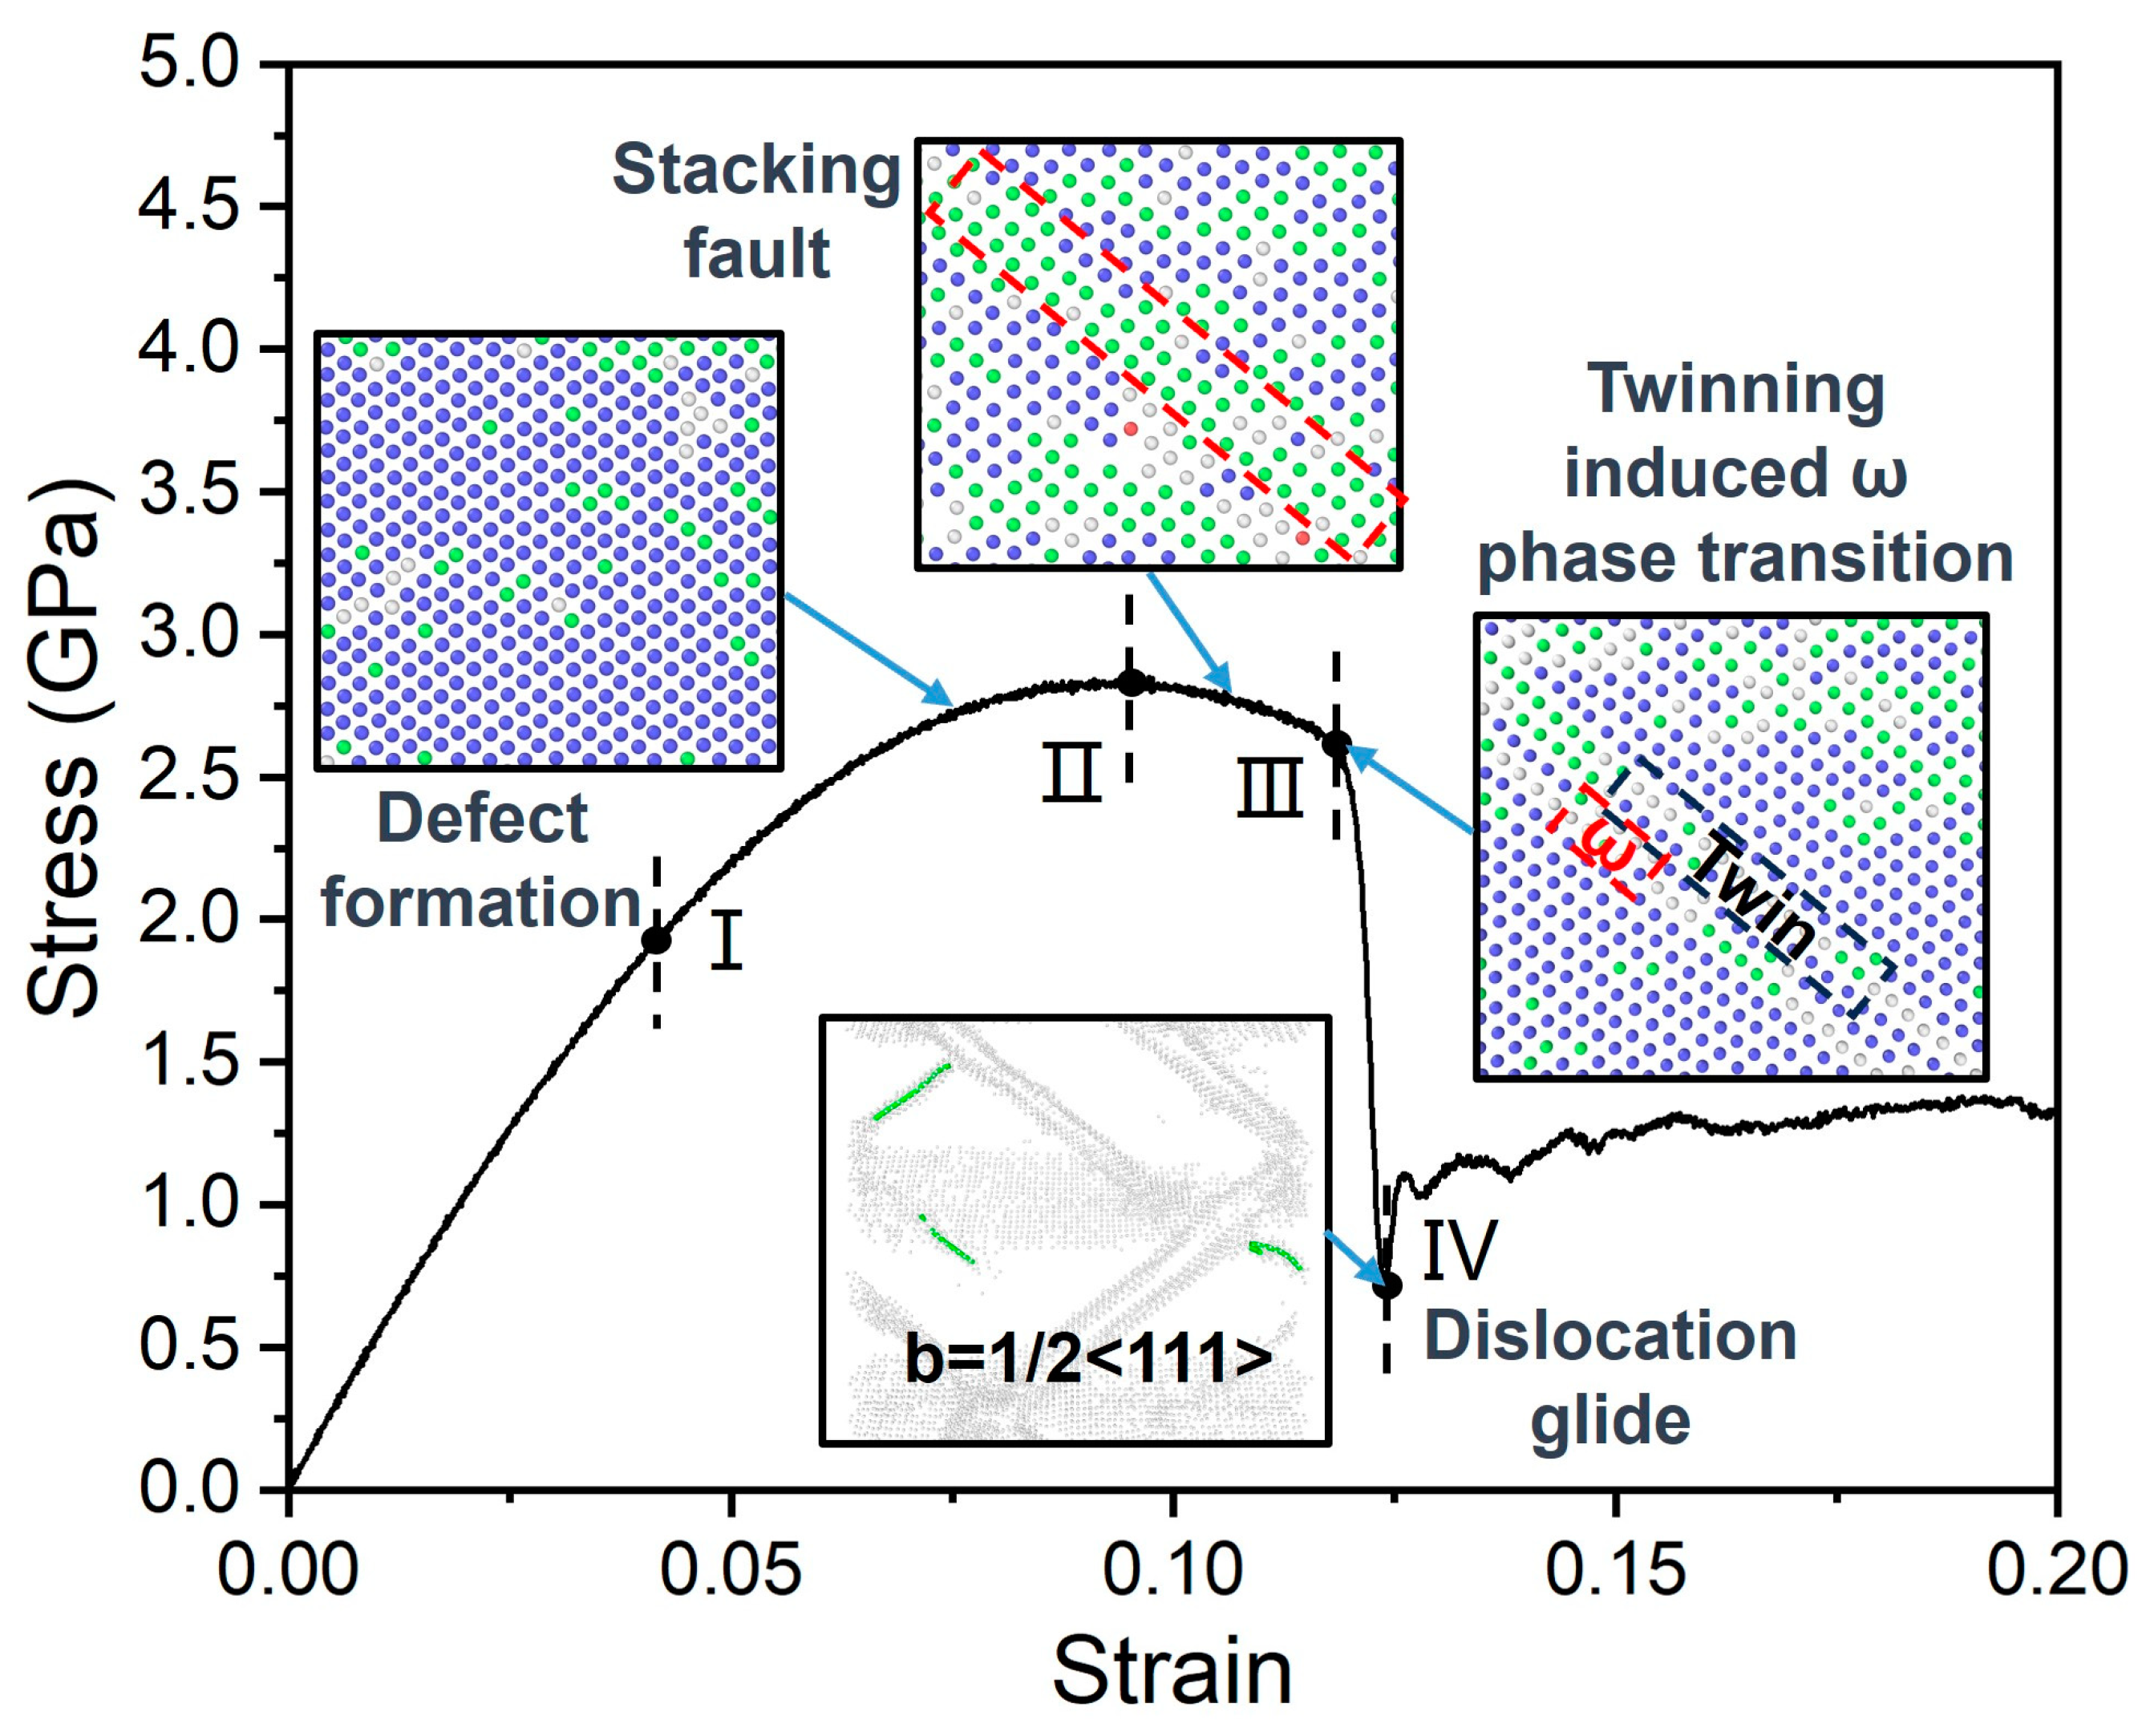
3.2. Analysis of Tensile Behavior

The addition of Nb as a stabilizing element to Ti-Nb alloys enhances the stability of the β-phase at room temperature. Thus, we utilize the example of a Ti-25Nb (at.%) alloy, an essential alloy for biomedical applications, to elucidate the deformation process of the alloy. The stress–strain curve during the tensile process (Figure 3) is consistent with the result calculated by Nagasako et al. [41] using first principles. The initial structure of the tensile sample includes a complete BCC structure. Following the elastic stage, denoted as point I in Figure 3, the material undergoes a transition into the plastic stage. Point defects are generated along with local FCC structures on the stage from point I to point II and release the tensile stress.
In the stage from point II to point III in Figure 3, stacking faults are gradually created and further release stress, causing them to gradually decrease. As strain increases further, the stacking faults become the preferred region for twinning, and twinning begins at the edge of the stacking faults region. The twin continues to propagate, leading to dislocations at the twin-to-twin junction to accommodate the different orientations between the twins, as shown by the green line in the small diagram at the bottom of the figure.
The microstructure in the plastic deformation range was further analyzed in detail. Figure 4 shows a gradual increase in the number of FCC and other structures with increasing strain. Ju et al. [42] found that these close-packed FCC structures produce longer interatomic distance and space for the other atoms around the local FCC structures, which is beneficial to make more atoms transform from BCC structures into the undefined type with a lower energy barrier for stress-relaxing during the tensile process. Furthermore, the local FCC structures possess the highest coordination number, leading to a relatively larger binding energy and stronger local arrangement. Consequently, the local FCC structure can still endure the higher distortion between the yield and ultimate strains. This slows down the rate of stress increase in the material. After that, the alloy undergoes deformation through partial slip on the {112} plane in the <111> direction, ultimately culminating in the formation of the stacking fault structure illustrated in Figure 4d. This arrangement of stacking faults is consistent with the three-layer stacking faults observed in the BCC structure calculated by Machová et al. [43] using first principles. Moreover, it is possible for a three-layer stacking fault (SF) to subsequently transform into multilayer twinning.
As the strain increases further, the <111>{112} slip system continues to move based on FCC stacking faults along the boundary, as illustrated in Figure 5a. The stacking faults ultimately result in the formation of the twin structure depicted in Figure 5b. This observed twin structure aligns with the {112}<111> twin structure identified by Zhan et al. [44] during the deformation of Ti-Nb alloys. The process of twinning formation is shown in Figure 5c. The twinning process can be elucidated through the twinning dislocation mechanism [45,46,47]. This mechanism involves the decomposition of a 1/2[111] perfect dislocation into three 1/6[111] dislocations on a continuous {112} plane during motion under applied stress, ultimately resulting in the formation of a three-layer microscopic twin.

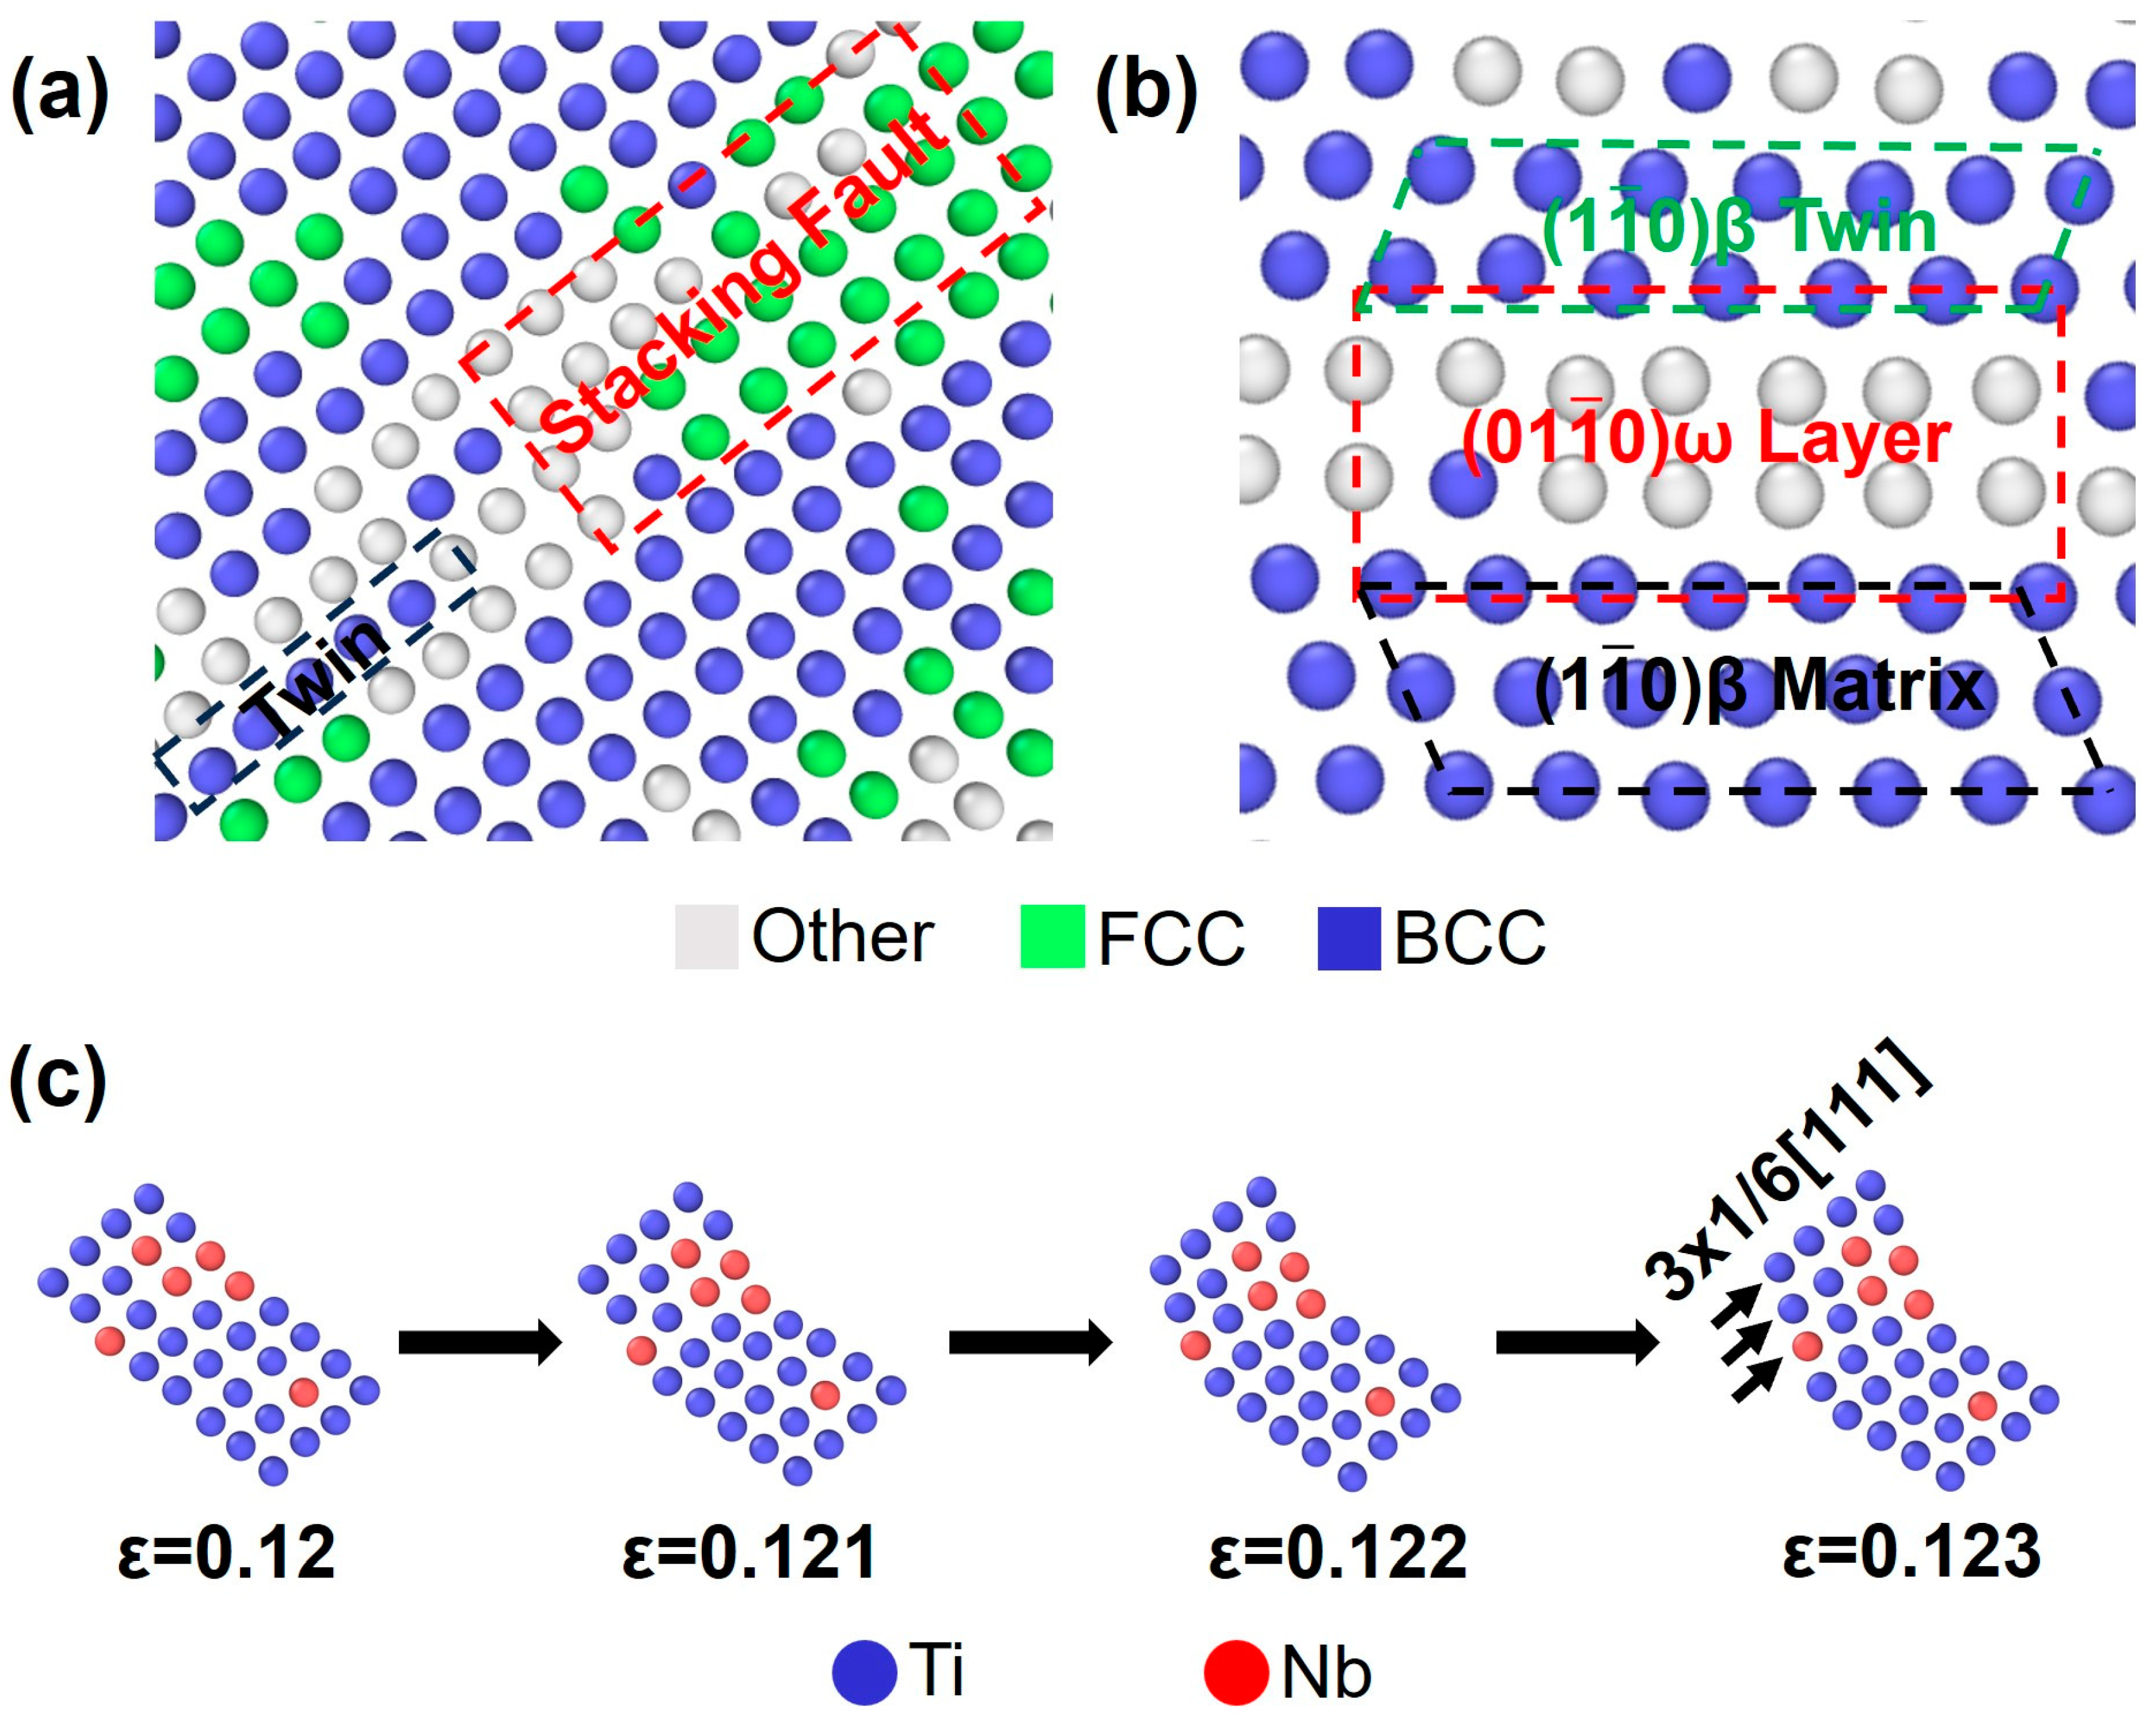
ω-Phase Transformation

The MD simulation revealed that the white atomic portion at the twin boundary exhibited a multilayered structure during twinning deformation, similar to the interfacial ω-phase structure discovered by Lai et al. [48] in Ti-36Nb-1.4Ta-2.8Zr-0.3O (wt.%) cold-rolled samples. To ascertain its nature as an interfacial ω-phase, we initially compared the experimental results with the standard structure of the ω-phase. The space group of the ω-phase is P6/mmm (No. 191), and the three radical atoms are located at (0, 0, 0), (1/3, 2/3, 1/2), and (2/3, 1/3, 1/2), respectively [49]. We observed that the conformations of the grain boundary structures corresponded with the standard ω-phase structure in all three directions.
According to Samiee et al. [50], there is a specific orientation relationship between the ω-phase and the β-matrix, where [111]β//[0001]ω, [1 1 ¯ 0]β//[11 2 ¯ 0]ω. To further substantiate the presence of the interfacial ω-phase, additional analysis was conducted on the grain boundary orientations, as depicted in Figure 6. Substructures c and d in Figure 6a correspond to those in Figure 6c and Figure 6d, respectively. The orientation relationship between them is [111]β//[0001]ω, as the coordinate axes indicate. When the viewpoint is turned in the [1 1 ¯ 0] direction, as depicted in Figure 6b, the partial structure corresponds to that in Figure 6e. Based on Figure 6a, it can be concluded that [1 1 ¯ 0]β//[11 2 ¯ 0]ω, and the correlation between the ω-phase and the BCC matrix provides additional confirmation that the structural atoms at the boundaries generated during the tensile loading belong to the ω-phase.
Lai et al. [48] and Ehemann et al. [51] also calculated the energy change from the β-phase to the ω-phase of Ti-Nb alloys. They determined that the ω-phase structure possesses lower energy compared to the β-phase. However, the presence of an energy barrier between the two phases hindered the spontaneous formation of the ω-phase. In this simulation, the initial relaxation model consisted of the complete Body-Centered Cubic (BCC) structure, and no spontaneous formation of the ω-phase was observed. During the deformation process, {112}<111> slip occurs, and the gained energy enables the generation of the ω-phase at the interface of the twining. The associated stress–strain curves exhibit a noticeable decline during the twin-induced phase transition, signifying that the twin-induced ω-phase transition releases substantial stress and plays a crucial role in plastic deformation. Plastic deformation arises from the synergistic effect of various deformation mechanisms with the simultaneous occurrence of twinning, ω-phase transition, and dislocation slip in the deformation process of alloys with less than 20% strain. The whole deformation process is consistent with the test results of Ti-22.4Nb-0.73Ta-2Zr-1.34O alloys in Yang et al. [52].

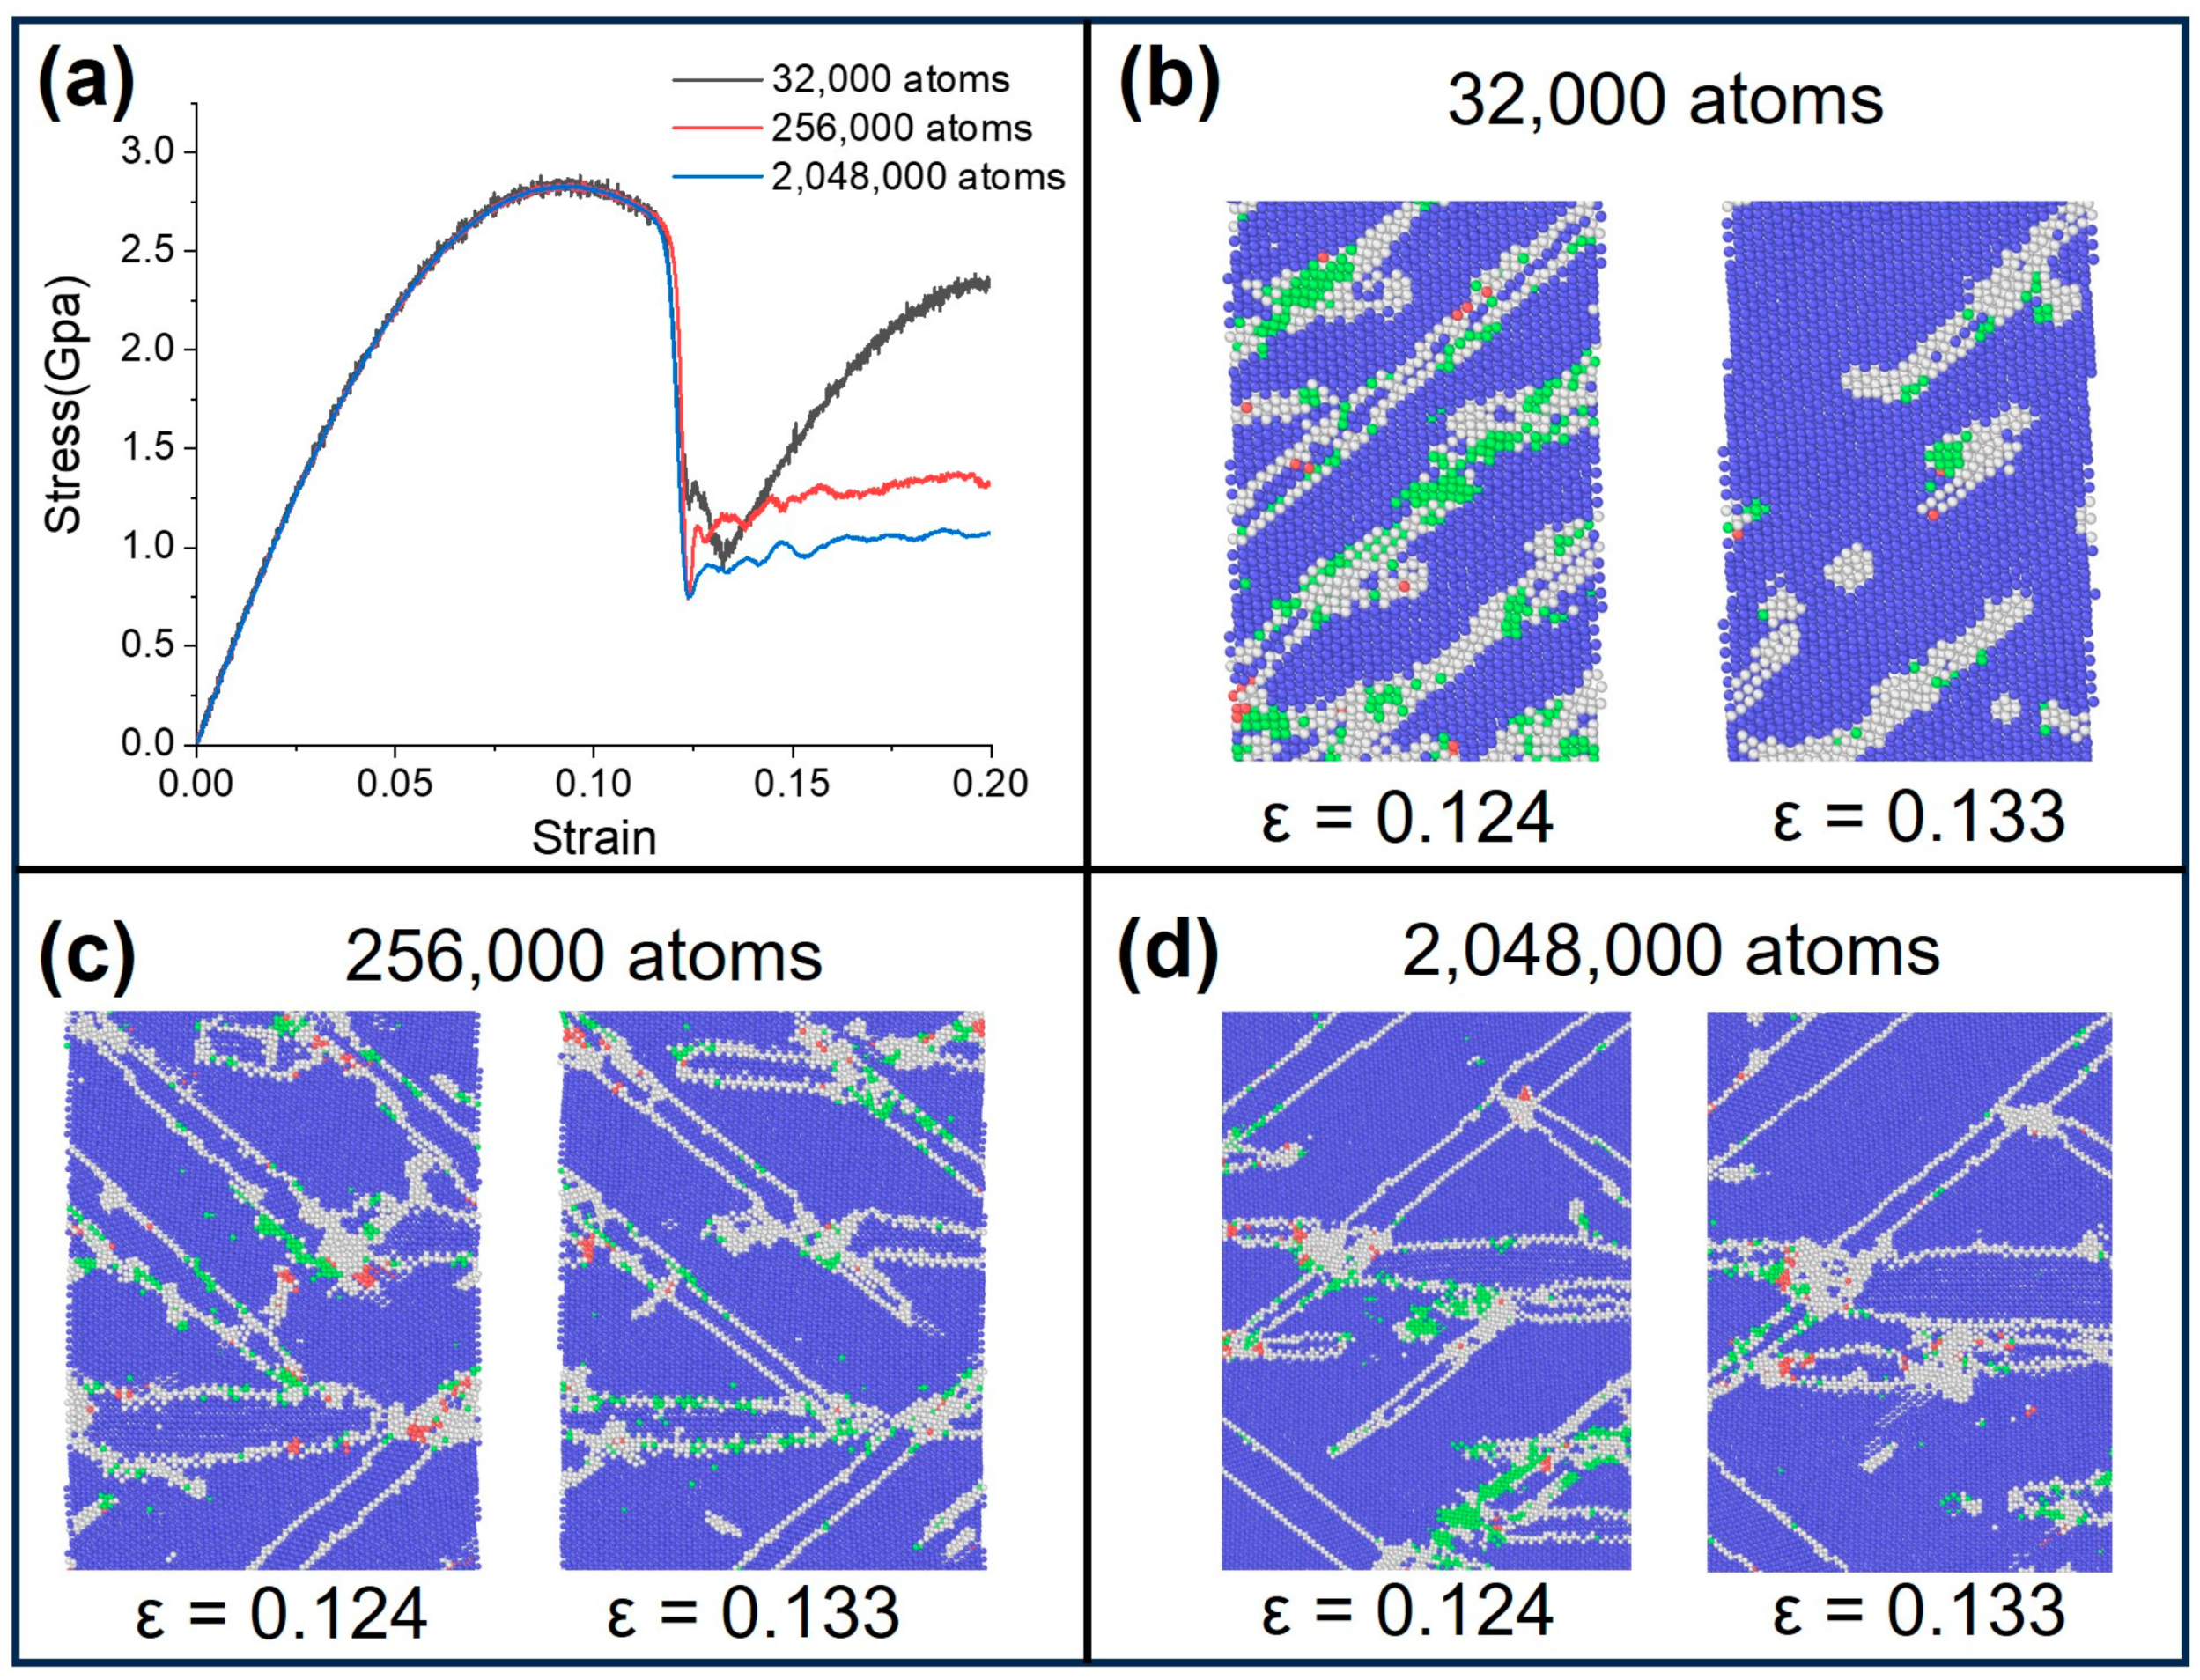
3.3. The Influence of Computational Cell Size on the Tensile Mechanical Properties of Ti-Nb Alloys

With an increase in computational cell size, as shown in Figure 7a, the difference during the deformation process before the twinning induced ω-phase transition stage was minimal. This is consistent with the molecular dynamics simulation for the uniaxial loading of single-crystal Al calculated by Li et al. [53]. As shown in Table 4, the amount of plastic deformation twins increases with the increase in model size, and the stress released by twinning accompanied by ω-phase transformation also gradually increases, so the stress in the stress–strain curve gradually decreases. Compared with other large-scale models, the twins in the 32,000 atomic-size model are unstable. During the subsequent deformation, the twins gradually disappear, as shown in Figure 7b. The subsequent deformation is completely dominated by dislocation slip. In the large-scale model, as shown in Figure 7c,d at a 0.133 strain, the twin boundary hinders the dislocation slip movement and makes the stress curve rise continuously. It can be seen that the stress–strain curves for big samples are smoother compared to those for the small sample, which is similar to the results of Morkina et al. for Zr-Al alloys [54]. Huang et al. [55] and Lu et al. [56] also studied the effect of grain size on twins in the research process of a Ti−12Mo alloy and a Ti-4V-2Mo-2Fe alloy. The results show that the reduction in grain size obviously inhibits the formation of twins, consistent with the results of this study.

3.4. The Influence of Temperature on the Tensile Mechanical Properties of Ti-Nb Alloys

The tensile results of the Ti-25Nb (at.%) alloy at different temperatures are shown in Figure 8. The overall deformation process remains consistent regardless of the temperature variation, from generating defects to twinning and ultimately dislocation slip. During the plastic deformation stage preceding twinning, the increased temperature leads to more pronounced atomic thermal motion, facilitating stress relief through atomic motion. As depicted in Table 5, the defect structure resulting from enhanced atomic thermal motion increases with rising temperature, leading to a gradual decrease in the ultimate strength of the alloy. This is consistent with the decrease in tensile strength of single-crystal BCC Fe nanowires with temperature variation calculated by Li et al. [57] using molecular dynamics. At the same time, the tendency to form stacking faults increases at higher temperatures, as shown in Figure 8. This considerable number of stacking faults can accommodate the stress caused by deformation.
Additionally, the increase in temperature has little effect on the number of twins. This aligns with the findings of Veerababu et al. on BCC-Fe [58]; they show that temperature does not change the inherent twinning property but linearly reduces the energy of stacking faults.

3.5. The Influence of Composition Variation on the Tensile Mechanical Properties of Ti-Nb Alloy

The tensile deformation behavior of alloys with varying compositions is illustrated in Figure 9. As the Nb content increases, the alloy is more stable, resulting in a decrease in the quantity of point defects. At the same time, the stacking fault energy of the alloy progressively rises, leading to a decrease in the stability of the stacking fault. The increasing Nb enhances the ultimate strength of the alloy while diminishing the strain range of the stacking fault.
Due to the higher strain rate in molecular dynamics, the energy barrier can be easily crossed, making it easier to induce twinning accompanied by the ω-phase. As the Nb element content increases, the transformation range of twins decreases. The number and size of twins are significantly reduced, as depicted in Figure 8b,c. A few cases of twinning were observed in the Ti-75Nb (at.%) alloy, as shown in Figure 8d. As the strain increases, the deformed twins in the alloy gradually disappear, and after a 0.12 strain, the twins completely disappear and the deformation mechanism completely transforms into a dislocation slip. This observation aligns with findings on the deformation mode of a β-Ti alloy studied by Hanada et al. [59]. Due to the β-structure stabilizing effect of the Nb element, the deformation mechanism of the alloy changes from twinning to dislocation slip.

Dislocation and Twinning

In order to study the relationship between twinning and dislocation slip during deformation, we counted the tensile structure of each compositional alloy at a 0.125 strain. Statistical assessments were performed to quantify these structures’ twinning fractions and dislocation densities.
For twinning, as shown in the black line graph in Figure 10, the twinning fraction gradually decreases in the range of 25% to 75%. The trends of the interfacial ω-phase and the number of twins are consistent.
Regarding dislocations, they mainly begin to slip during the later stages. The dislocation density is depicted by the red line in Figure 10, and the dislocation density rises when the Nb content is below 50%. Subsequently, the dislocation density and twinning fraction diminish as the Nb content is further increased. Notably, twinning vanishes as the strain is further increased, and the deformation proceeds through dislocation slip. Furthermore, at Nb contents of 25, 30, 50, and 75 (at.%), the strains at which dislocations appear after twinning are 0.12, 0.118, 0.11, and 0.108, respectively. These results imply an earlier tendency for dislocation slip.
Therefore, there is a competitive relationship between twinning and dislocation slip in the deformation of Ti-Nb alloys. Twinning is the primary deformation method in titanium–niobium alloys with low niobium content. With the increase in Nb content, the homogeneity of the twin phase and the interface ω-phase decrease to a lower level, while the dislocation continues to move. This shift alters the deformation mechanism of the alloy, transitioning from twinning to dislocation slip.

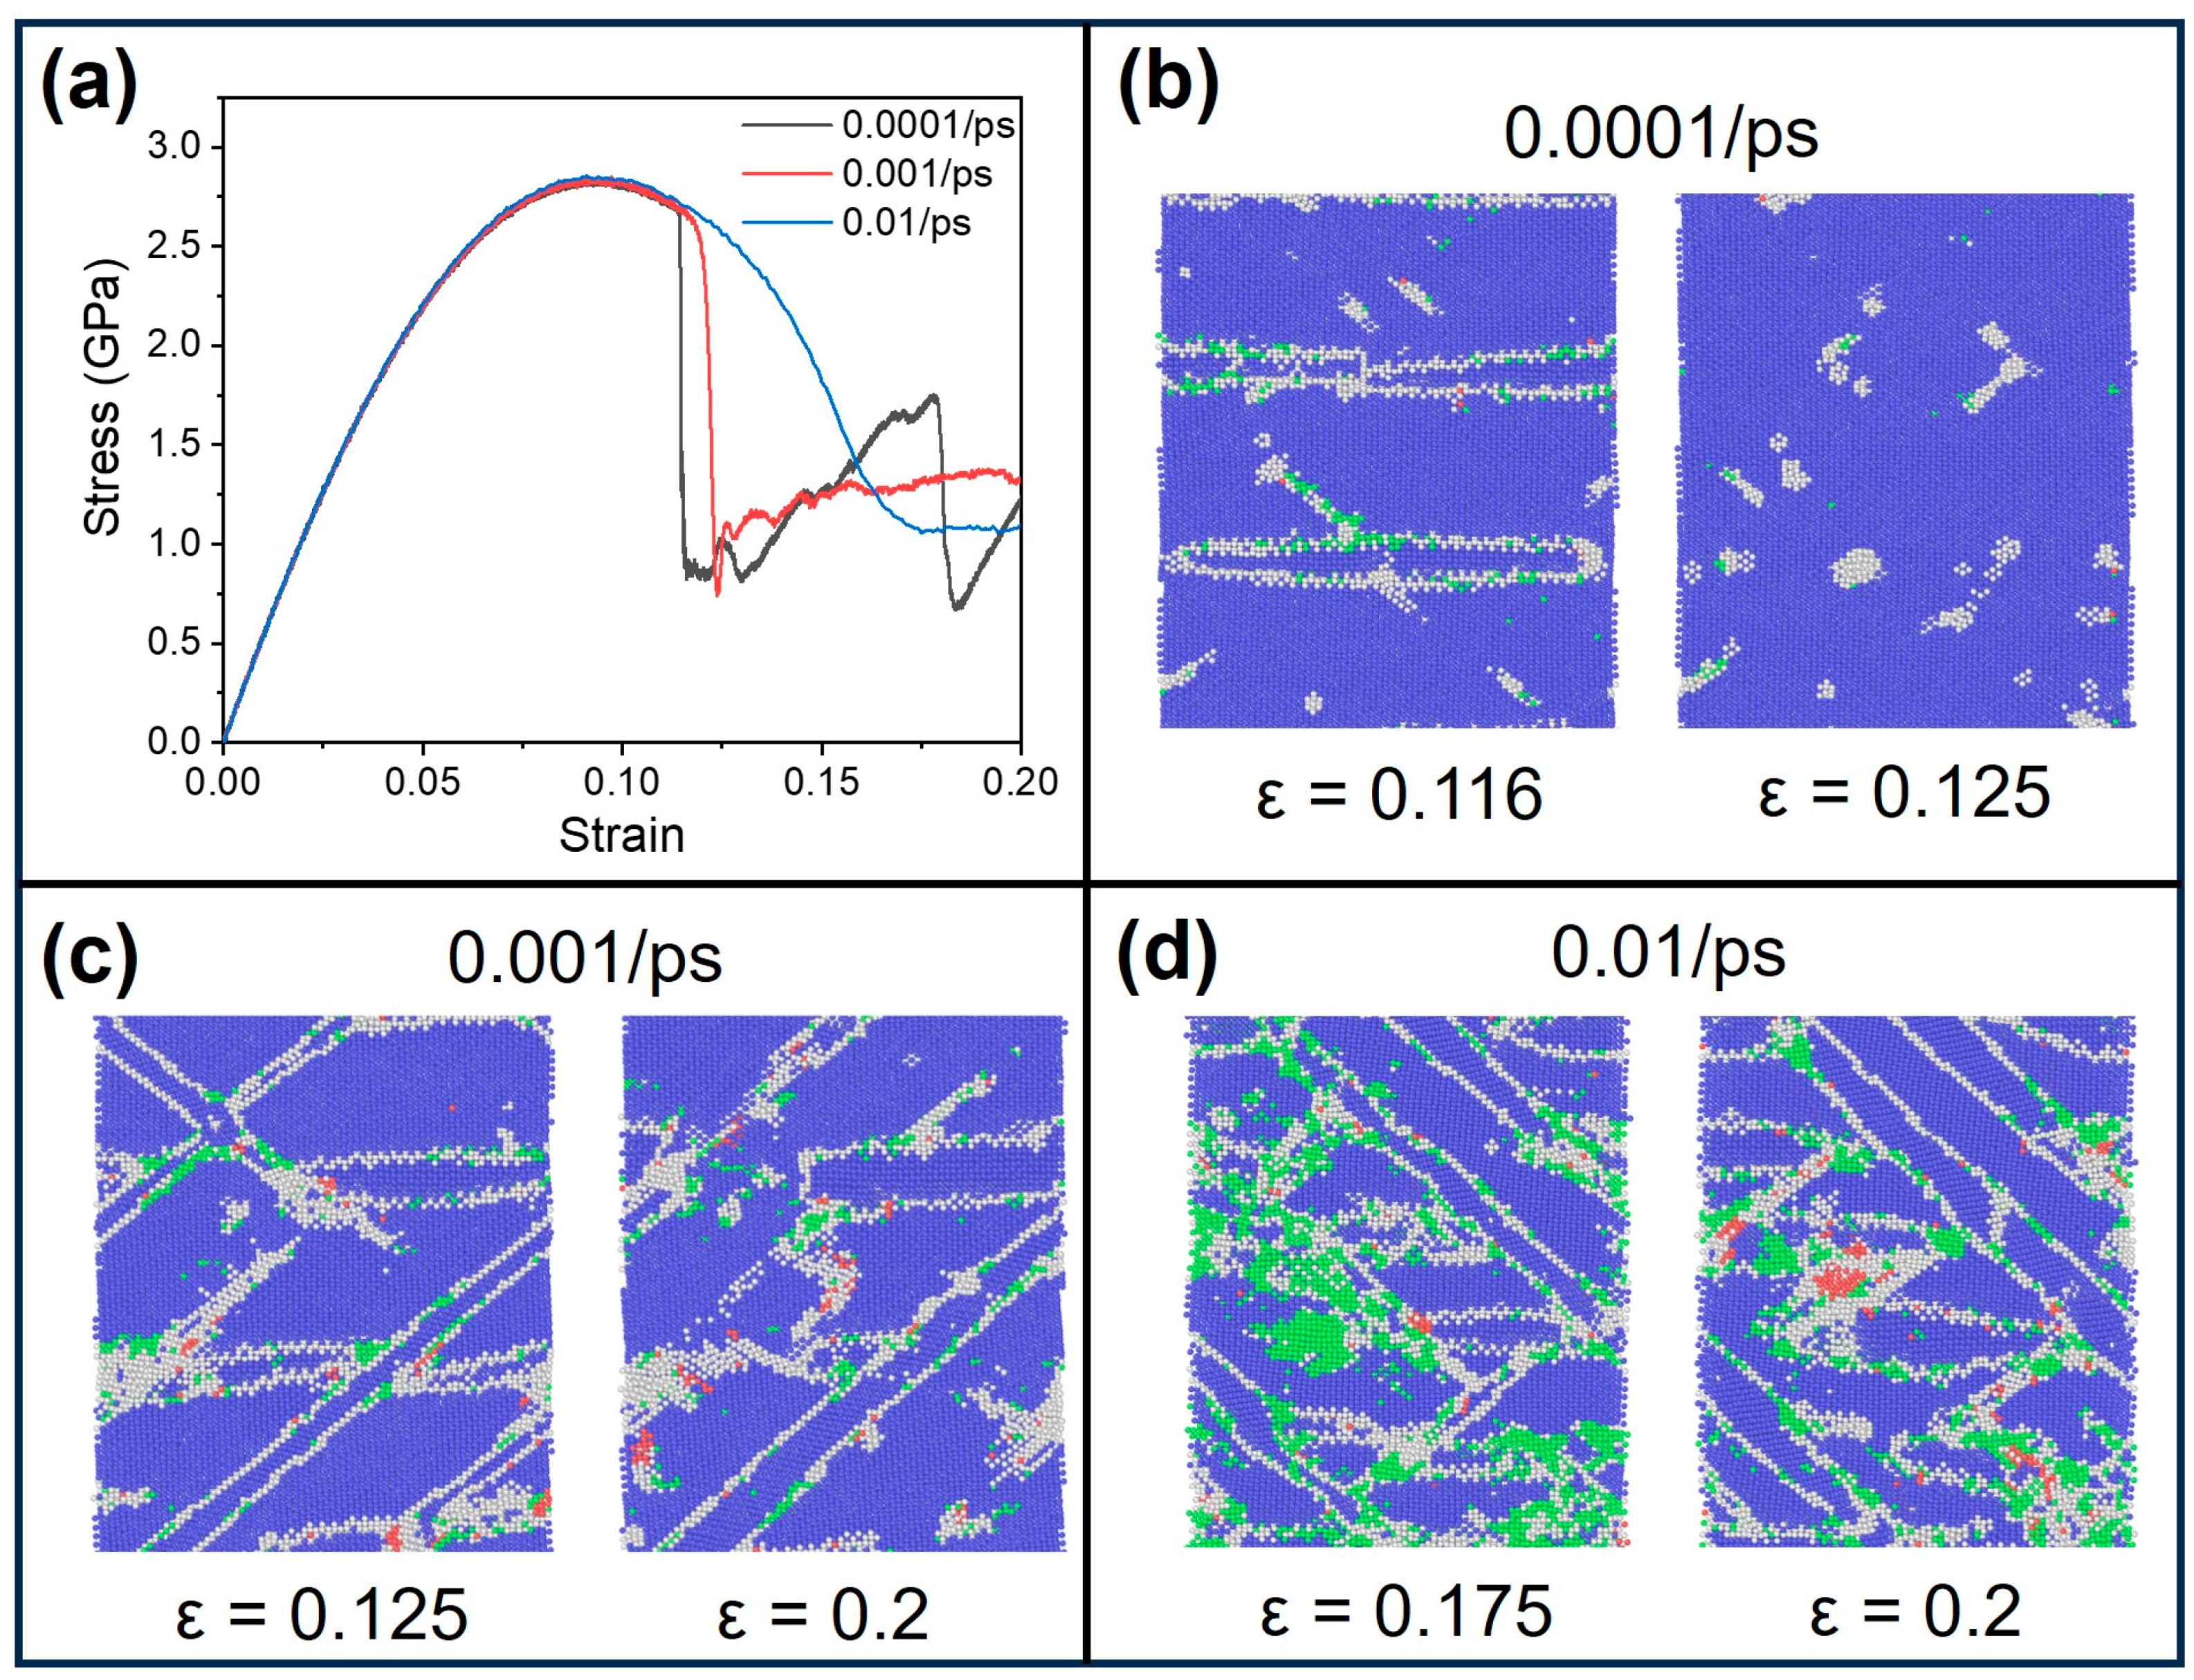
3.6. The Influence of Strain Rate on the Tensile Mechanical Properties of Ti-Nb Alloy

As shown in Figure 11a, the effect of strain rate on the stress–strain curve of the alloy is not significant until twin deformation occurs. In the tensile process of single-crystal BCC Fe nanowires, simulated by Li et al. [57], it was similarly observed that the tensile rate has a minimal impact on the tensile curve before reaching the peak. With an increase in strain rate, the strain gradually decreases at the onset of twinning, and the number of twins also significantly increases. This phenomenon enhances the material’s plasticity, aligning with findings from compression experiments on Ti-25Nb-3Zr-3Mo-2Sn alloys conducted by Zhan [44]. As illustrated in Figure 11a, the transition strain stage from stacking faults to twin dislocation slip progressively widens with increased strain rate. Notably, at a strain rate of 0.01 ps−1, a significantly wider transition range is observed. When the tensile strain rate of the alloy is 0.0001 ps−1, the quantity of twins is exceedingly limited, as shown in Figure 11b. When the strain reaches 0.125, the twins disappear, and the deformation mechanism completely changes to a dislocation slip. Moreover, the dislocation slip continues in the following deformation.
Nevertheless, under higher tensile strain rates, there remains a high level of twinning during the deformation process, evident in Figure 11c,d. At the strain rate of 0.01 ps−1, the microstructure within the transformation interval exhibits greater disorder, characterized by the significant presence of twinning, point defects, and dislocations. The synergistic effect of various deformation mechanisms significantly improves the plasticity of the alloy.
Ahmed et al. [12] observed that the increase in twinning content with increasing strain rate is attributed to increased dislocation density at high strain rates. This theory has been considered in other studies [60].

4. Conclusions

In this study, we used molecular dynamics to study the effects of strain rate, Nb composition, and temperature on the deformation mechanisms of Ti-Nb single crystals during uniaxial tensile deformation. The conclusions derived from the simulations are as follows:
  • The overall deformation process of Ti-Nb alloys involves point-defect generation, followed by twinning and ω-phase transition, and ultimately, dislocation slip occurs. With the increase in the simulation model’s size, the deformed twins’ stability increases, and the strength of the material reduces. In addition, increasing temperature enhances the plasticity and reduces the strength of the material, while increasing composition has the opposite effect on the deformation.
  • The elevated stresses resulting from molecular dynamics at higher strain rates cause the <111>{112} slip system to become more pronounced compared to experimental conditions. The interfacial ω-phase induced by the <111>{112} slip system also makes it easier to pass through the energy barrier of the phase transition, making its formation in the matrix easier.
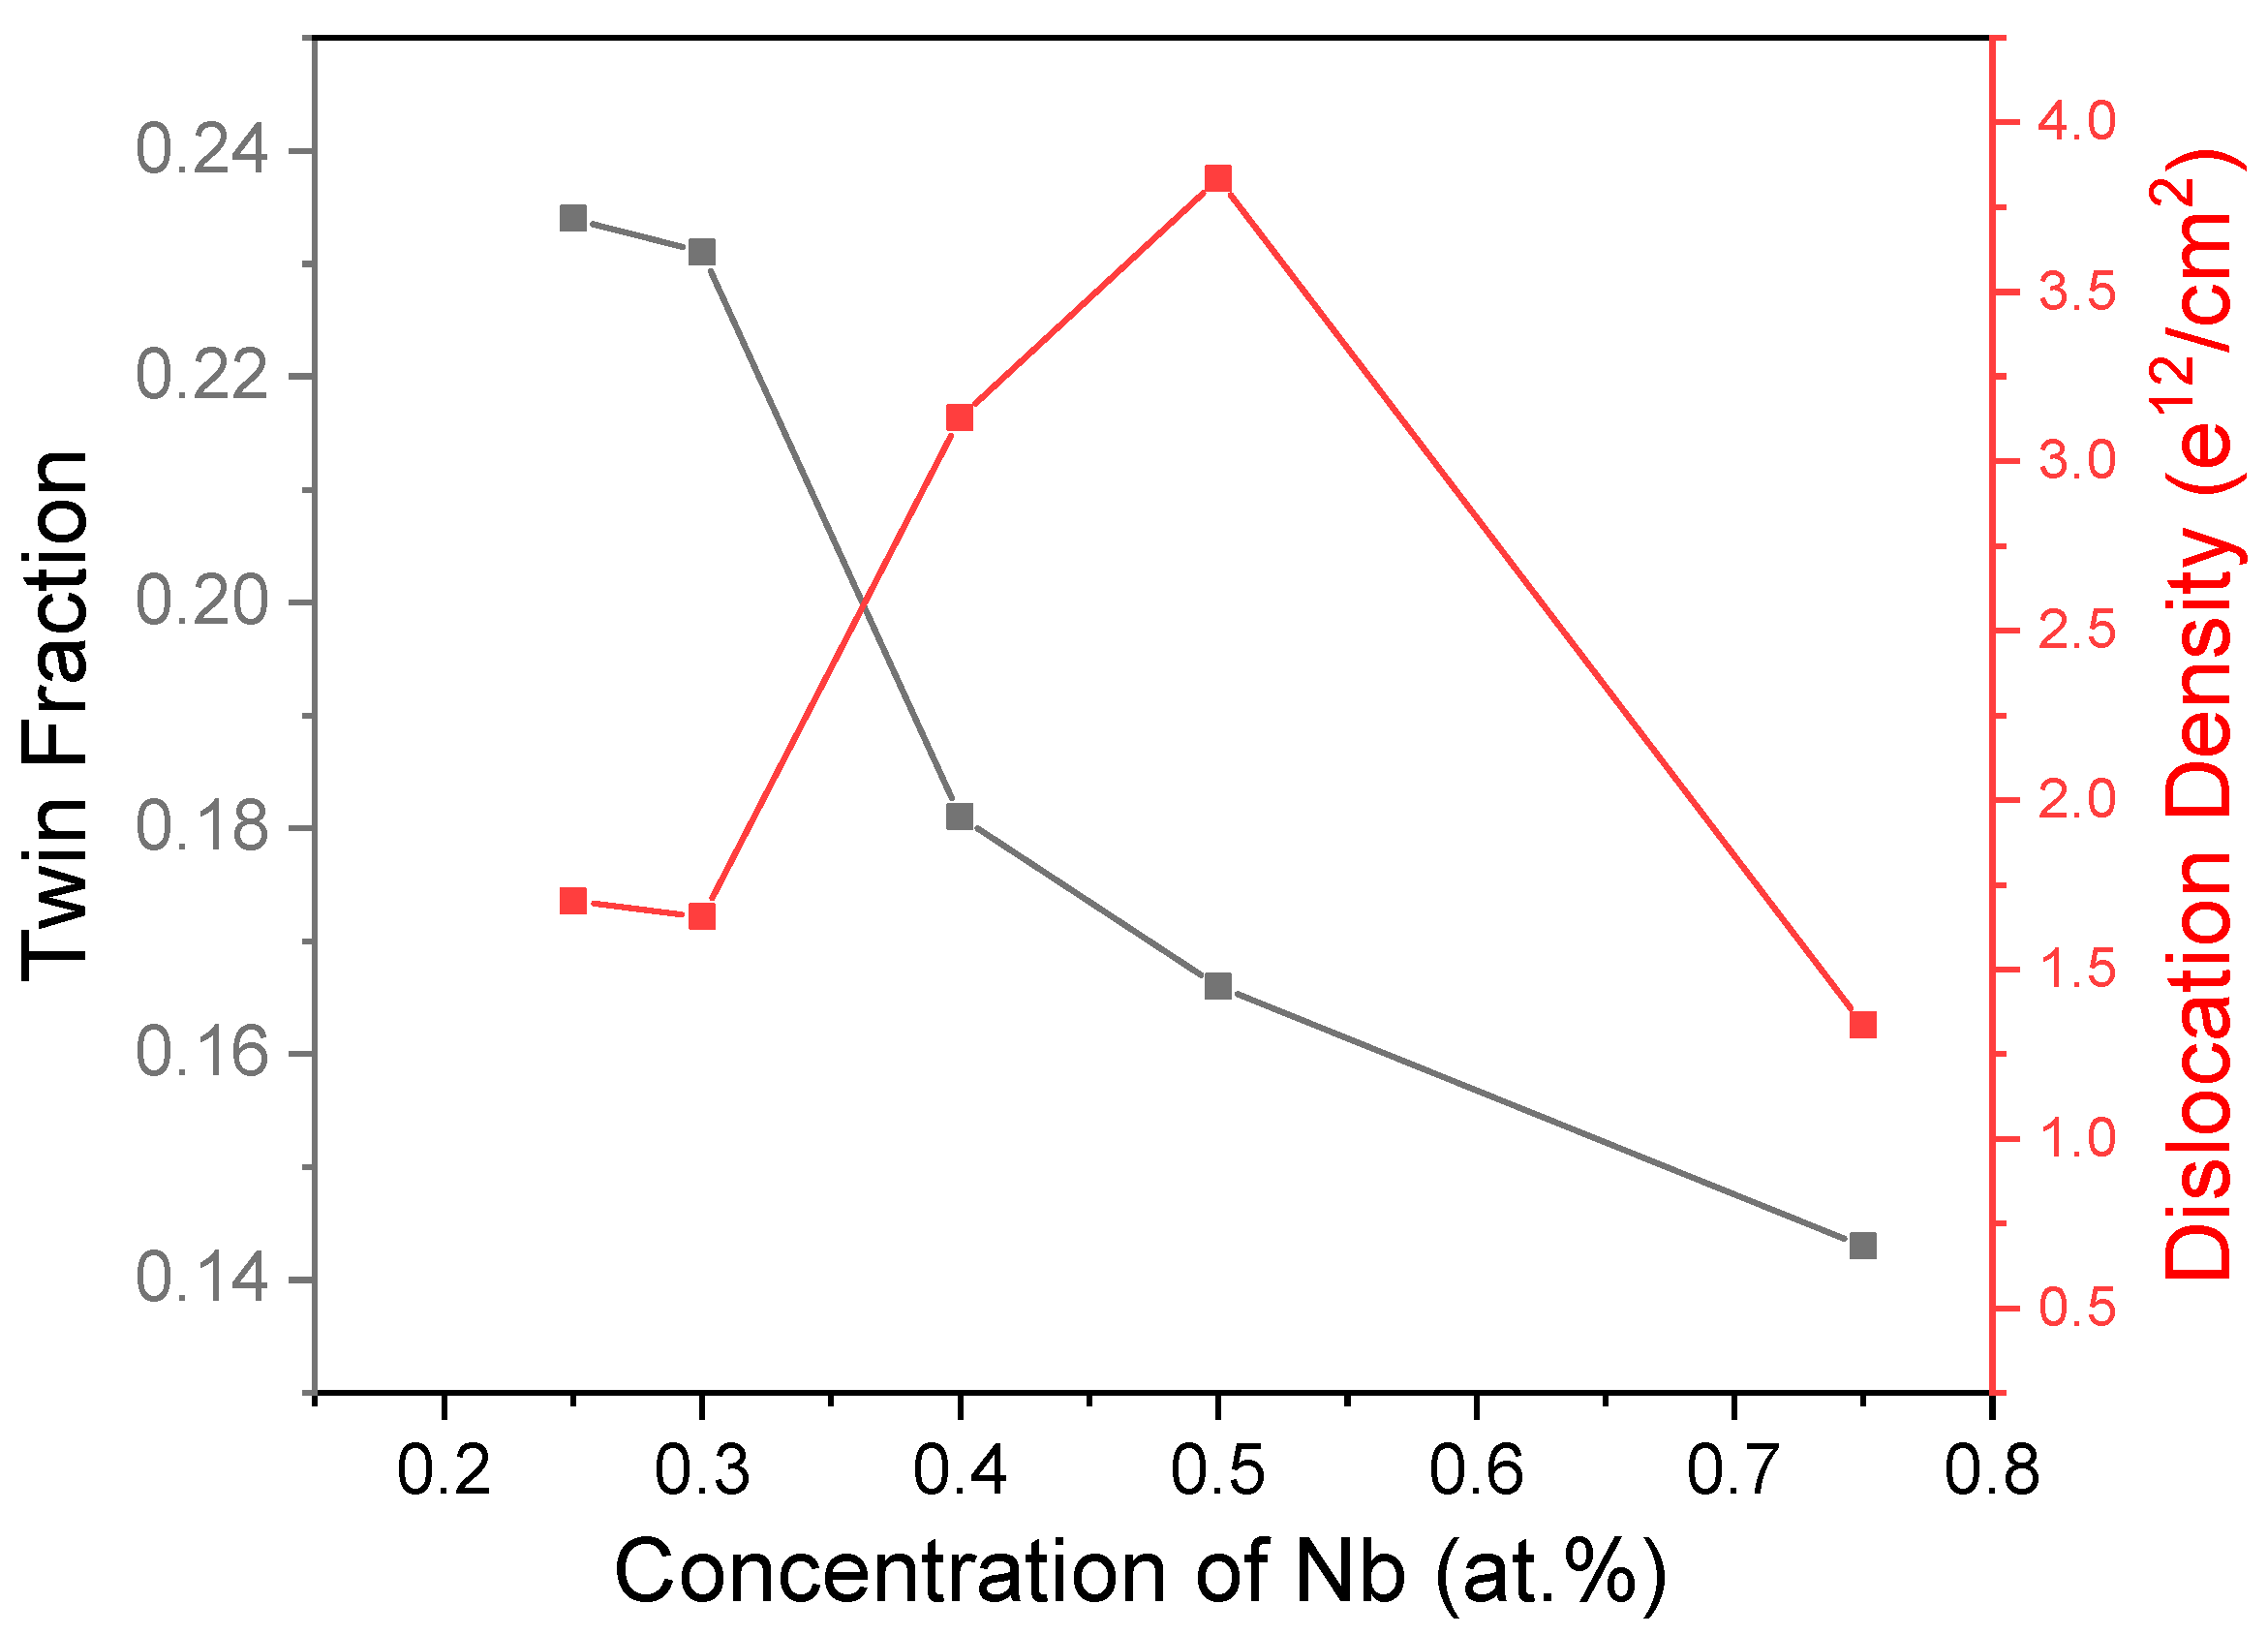
  • The predominant deformation mechanisms in Ti-Nb alloys involve twinning and dislocation slip, exhibiting a certain degree of competitiveness. At low Nb content, the number of twins increases with the increase in Nb content, making twinning the dominant mechanism in the overall deformation process. At high Nb content, dislocation slip is still active, but the addition of β-stability elements suppresses twinning deformation. The proportion of twinning decreases, leading to a shift in the plastic deformation mode from twinning to dislocation slip.
  • At low strain rates, the twins disappear at a slight strain, while higher strain rates result in an increased number of twins. Moreover, the transition strain interval from stacking faults to twin dislocation slip significantly increases. Various deformation mechanisms work synergistically to enhance the material’s plasticity.

Author Contributions

W.H.: Funding acquisition. B.H.: Software. H.W.: Validation, Writing—original draft, Conceptualization, Data curation. J.H.: Funding acquisition, Writing—Review and editing. All authors have read and agreed to the published version of the manuscript.

Funding

This research was funded by the National Natural Science Foundations of China (Grant 12072110 and 51971237), the Ministry of Science and Technology of the People’s Republic of China (National Key Research Project of China, Grant 2023YFB3003000 and 2018YFB0704000).

Data Availability Statement

The raw data supporting the conclusions of this article will be made available by the authors on request.

Acknowledgments

The authors would like to thank the Natural Sciences and the Ministry of Science and Technology of the People’s Republic of China (National Key Research Project of China) for their financial support. Also the authors thank Hefei Advanced Computing Center and the National Supercomputing Center in Changsha for their Numerical computations.

Conflicts of Interest

The authors declare that they have no known competing financial interests or personal relationships that could have appeared to influence the work reported in this paper.

References

  1. Zhu, W.; Lei, J.; Tan, C.; Sun, Q.; Chen, W.; Xiao, L.; Sun, J. A novel high-strength β-Ti alloy with hierarchical distribution of α-phase: The superior combination of strength and ductility. Mater. Des. 2019, 168, 107640. [Google Scholar] [CrossRef]
  2. Deng, C.; Dong, S.; Tan, W. Modelling for the flow behavior of a new metastable beta titanium alloy by GA-based Arrhenius equation. Mater. Res. Express 2018, 6, 026544. [Google Scholar] [CrossRef]
  3. Maghsoudlou, A.; Zarei-Hanzaki, A.; Abedi, H.R.; Barabi, A.; Pilehva, F.; Dietrich, D.; Lampke, T. The room temperature tensile deformation behavior of thermomechanically processed β metastable Ti-Nb-Ta-Zr bio-alloy: The role of deformation-induced martensite. Mater. Sci. Eng. A 2018, 738, 15–23. [Google Scholar] [CrossRef]
  4. Ahmed, M.; Wexler, D.; Casillas, G.; Ivasishin, O.M.; Pereloma, E.V. The influence of β phase stability on deformation mode and compressive mechanical properties of Ti–10V–3Fe–3Al alloy. Acta Mater. 2015, 84, 124–135. [Google Scholar] [CrossRef]
  5. Hanada, S.; Ozeki, M.; Izumi, O. Deformation characteristics in β phase Ti-Nb alloys. Metall. Trans. A 1985, 16, 789–795. [Google Scholar] [CrossRef]
  6. Talling, R.J.; Dashwood, R.J.; Jackson, M.; Dye, D. On the mechanism of superelasticity in Gum metal. Acta Mater. 2009, 57, 1188–1198. [Google Scholar] [CrossRef]
  7. Ballor, J.; Li, T.; Prima, F.; Boehlert, C.J.; Devaraj, A. A review of the metastable omega phase in beta titanium alloys: The phase transformation mechanisms and its effect on mechanical properties. Int. Mater. Rev. 2023, 68, 26–45. [Google Scholar] [CrossRef]
  8. Li, Y.; Li, J.; Liu, B. Homogeneous shear-driven reversible α-to-α″phase transformation and superelasticity of titanium investigated by molecular dynamics simulations. Acta Mater. 2015, 93, 105–113. [Google Scholar] [CrossRef]
  9. Trinkle, D.R.; Hennig, R.G.; Srinivasan, S.G.; Hatch, D.M.; Jones, M.D.; Stokes, H.T.; Albers, R.C.; Wilkins, J.W. New mechanism for the α to ω martensitic transformation in pure titanium. Phys. Rev. Lett. 2003, 91, 025701. [Google Scholar] [CrossRef]
  10. Kuramoto, S.; Furuta, T.; Hwang, J.; Nishino, K.; Saito, T. Elastic properties of Gum Metal. Mater. Sci. Eng. A 2006, 442, 454–457. [Google Scholar] [CrossRef]
  11. Zhan, H.; Wang, G.; Kent, D.; Dargusch, M. The dynamic response of a metastable β Ti–Nb alloy to high strain rates at room and elevated temperatures. Acta Mater. 2016, 105, 104–113. [Google Scholar] [CrossRef]
  12. Ahmed, M.; Wexler, D.; Casillas, G.; Savvakin, D.G.; Pereloma, E.V. Strain rate dependence of deformation-induced transformation and twinning in a metastable titanium alloy. Acta Mater. 2016, 104, 190–200. [Google Scholar] [CrossRef]
  13. Ren, L.; Xiao, W.; Kent, D.; Wan, M.; Ma, C.; Zhou, L. Simultaneously enhanced strength and ductility in a metastable β-Ti alloy by stress-induced hierarchical twin structure. Scr. Mater. 2020, 184, 6–11. [Google Scholar] [CrossRef]
  14. Zhang, J.; Fu, Y.; Wu, Y.; Qian, B.; Chen, Z.; Inoue, A.; Wu, Y.; Yang, Y.; Sun, F.; Li, J.; et al. Hierarchical {332}<113> twinning in a metastable β Ti-alloy showing tolerance to strain localization. Mater. Res. Lett. 2020, 8, 247–253. [Google Scholar] [CrossRef]
  15. Rastogi, A.; Neelakantan, S. Enhanced thermo-mechanical processing through stress-induced martensitic transformation and its effect on grain refinement in metastable β titanium alloys. Scr. Mater. 2023, 226, 115222. [Google Scholar] [CrossRef]
  16. Fu, Y.; Xiao, W.; Rong, J.; Ren, L.; Peng, H.; Wen, Y.; Zhao, X.; Ma, C. Achieving large near-linear elasticity, low modulus, and high strength in a metastable β-Ti alloy by mild cold rolling. J. Mater. Sci. Technol. 2024, 189, 1–12. [Google Scholar] [CrossRef]
  17. Jamhari, F.I.; Foudzi, F.M.; Buhairi, M.A.; Sulong, A.B.; Radzuan, N.A.M.; Muhamad, N.; Mohamed, I.F.; Jamadon, N.H.; Tan, K.S. Influence of Heat Treatment Parameters on Microstructure and Mechanical Performance of Titanium Alloy: A Brief Review. J. Mater. Res. Technol. 2023, 24, 4091–4110. [Google Scholar] [CrossRef]
  18. Pilz, S.; Hariharan, A.; Günther, F.; Zimmermann, M.; Gebert, A. Influence of isothermal omega precipitation aging on deformation mechanisms and mechanical properties of a β-type Ti-Nb alloy. J. Alloys Compd. 2023, 930, 167309. [Google Scholar] [CrossRef]
  19. Zhou, Q.; Zhang, X.Z.; Song, T.; Lu, S.L.; Dong, T.; Tang, H.P.; Qian, M. Laser directed energy deposition of Ti-1Al-8V-5Fe alloy: From zero to significant tensile plasticity. Scr. Mater. 2024, 239, 115814. [Google Scholar] [CrossRef]
  20. Ellis, D.E.; Painter, G.S. Discrete variational method for the energy-band problem with general crystal potentials. Phys. Rev. B 1970, 2, 2887. [Google Scholar] [CrossRef]
  21. Slater, J.C.; Phillips, J.C. Quantum Theory of Molecules and Solids Vol. 4: The Self Consistent Field for Molecules and Solids. Phys. Today 1974, 27, 49–50. [Google Scholar] [CrossRef]
  22. Morinaga, M.; Yukawa, H. Alloy design with the aid of molecular orbital method. Bull. Mater. Sci. 1997, 20, 805–815. [Google Scholar] [CrossRef]
  23. Abdel-Hady, M.; Hinoshita, K.; Morinaga, M. Morinaga. General approach to phase stability and elastic properties of β-type Ti-alloys using electronic parameters. Scr. Mater. 2006, 55, 477–480. [Google Scholar] [CrossRef]
  24. Bönisch, M.; Panigrahi, A.; Calin, M.; Waitz, T.; Zehetbauer, M.; Skrotzki, W.; Eckert, J. Thermal stability and latent heat of Nb–rich martensitic Ti-Nb alloys. J. Alloys Compd. 2017, 697, 300–309. [Google Scholar] [CrossRef]
  25. Qiu, R.; Chen, Y.; Liao, X.; Lin, Y.; Dou, Y.; He, X.; Yang, W.; Hu, W.; Deng, H. Development of a semi-empirical interatomic potential appropriate for the radiation defects in V-Ti-Ta-Nb high entropy alloy. J. Phys. Condens. Matter 2022, 35, 055701. [Google Scholar] [CrossRef]
  26. Finnis, M.W.; Sinclair, J.E. A simple empirical N-body potential for transition metals. Philos. Mag. A 1984, 50, 45–55. [Google Scholar] [CrossRef]
  27. Ackland, G.J.; Thetford, R. An improved N-body semi-empirical model for body-centred cubic transition metals. Philos. Mag. A 1987, 56, 15–30. [Google Scholar] [CrossRef]
  28. Bonny, G.; Pasianot, R.C. Gauge transformations to combine multi-component many-body interatomic potentials. Philos. Mag. Lett. 2010, 90, 559–563. [Google Scholar] [CrossRef]
  29. Johnson, R.A.; Oh, D.J. Analytic embedded atom method model for bcc metals. J. Mater. Res. 1989, 4, 1195–1201. [Google Scholar] [CrossRef]
  30. Kresse, G.; Hafner, J. Ab initio molecular dynamics for liquid metals. Phys. Rev. B 1993, 47, 558. [Google Scholar] [CrossRef] [PubMed]
  31. Kresse, G.; Furthmüller, J. Efficient iterative schemes for ab initio total-energy calculations using a plane-wave basis set. Phys. Rev. B 1996, 54, 11169. [Google Scholar] [CrossRef]
  32. Blöchl, P.E. Projector augmented-wave method. Phys. Rev. B 1994, 50, 17953. [Google Scholar] [CrossRef]
  33. Perdew, J.P.; Chevary, J.A.; Vosko, S.H.; Jackson, K.A.; Pederson, M.R.; Singh, D.J.; Fiolhais, C. Atoms, molecules, solids, and surfaces: Applications of the generalized gradient approximation for exchange and correlation. Phys. Rev. B 1992, 46, 6671. [Google Scholar] [CrossRef]
  34. Plimpton, S. Fast parallel algorithms for short-range molecular dynamics. J. Comput. Phys. 1995, 117, 1–19. [Google Scholar] [CrossRef]
  35. Larsen, P.M.; Schmidt, S.; Schiøtz, J. Robust structural identification via polyhedral template matching. Model. Simul. Mater. Sci. Eng. 2016, 24, 055007. [Google Scholar] [CrossRef]
  36. Stukowski, A. Visualization and analysis of atomistic simulation data with OVITO–the Open Visualization Tool. Model. Simul. Mater. Sci. Eng. 2009, 18, 015012. [Google Scholar] [CrossRef]
  37. Huang, J.; Xing, H.; Sun, J. Structural stability and generalized stacking fault energies in β Ti Nb alloys: Relation to dislocation properties. Scr. Mater. 2012, 66, 682–685. [Google Scholar] [CrossRef]
  38. Kim, H.Y.; Ikehara, Y.; Kim, J.I.; Hosoda, H.; Miyazaki, S. Martensitic transformation, shape memory effect and superelasticity of Ti–Nb binary alloys. Acta Mater. 2006, 54, 2419–2429. [Google Scholar] [CrossRef]
  39. Ikehata, H.; Nagasako, N.; Furuta, T.; Fukumoto, A.; Miwa, K.; Saito, T. First-principles calculations for development of low elastic modulus Ti alloys. Phys. Rev. B 2004, 70, 174113. [Google Scholar] [CrossRef]
  40. Marker, C.; Shang, S.L.; Zhao, J.C.; Liu, Z.K. Effects of alloying elements on the elastic properties of bcc Ti-X alloys from first-principles calculations. Comput. Mater. Sci. 2018, 142, 215–226. [Google Scholar] [CrossRef]
  41. Nagasako, N.; Asahi, R.; Hafner, J. Ideal tensile and shear strength of a gum metal approximant: Ab initio density functional calculations. Phys. Rev. B 2012, 85, 024122. [Google Scholar] [CrossRef]
  42. Ju, S.P.; Li, C.C. Role of Local FCC Structure to the BCC Polycrystalline NbMoTaWV High Entropy Refractory Alloy under Plastic Deformation. Phys. Status Solidi A 2022, 219, 2100834. [Google Scholar] [CrossRef]
  43. Machová, A.; Beltz, G.E.; Chang, M. Chang. Atomistic simulation of stacking fault formation in bcc iron. Model. Simul. Mater. Sci. Eng. 1999, 7, 949. [Google Scholar] [CrossRef]
  44. Zhan, H.; Zeng, W.; Wang, G.; Kent, D.; Dargusch, M. On the deformation mechanisms and strain rate sensitivity of a metastable β Ti–Nb alloy. Scr. Mater. 2015, 107, 34–37. [Google Scholar] [CrossRef]
  45. Chen, C.Q.; Florando, J.N.; Kumar, M.; Ramesh, K.T.; Hemker, K.J. Incipient deformation twinning in dynamically sheared bcc tantalum. Acta Mater. 2014, 69, 114–125. [Google Scholar] [CrossRef]
  46. Sleeswyk, A.W. ½< 111> screw dislocations and the nucleation of {112}< 111> twins in the bcc lattice. Philos. Mag. 1963, 8, 1467–1486. [Google Scholar] [CrossRef]
  47. Marian, J.; Cai, W.; Bulatov, V.V. Dynamic transitions from smooth to rough to twinning in dislocation motion. Nat. Mater. 2004, 3, 158–163. [Google Scholar] [CrossRef]
  48. Lai, M.J.; Tasan, C.C.; Zhang, J.; Grabowski, B.; Huang, L.F.; Raabe, D. Origin of shear induced β to ω transition in Ti–Nb-based alloys. Acta Mater. 2015, 92, 55–63. [Google Scholar] [CrossRef]
  49. Moreno, J.G.; Bönisch, M.; Panagiotopoulos, N.T.; Calin, M.; Papageorgiou, D.G.; Gebert, A.; Eckert, J.; Evangelakis, G.A.; Lekka, C.E. Ab-initio and experimental study of phase stability of Ti Nb alloys. J. Alloys Compd. 2017, 696, 481–489. [Google Scholar] [CrossRef]
  50. Samiee, A.; Casillas, G.; Ahmed, M.; Savvakin, D.G.; Naseri, R.; Pereloma, E. Formation of deformation-induced products in a metastable-β titanium alloy during high temperature compression. Metals 2018, 8, 100. [Google Scholar] [CrossRef]
  51. Ehemann, R.C.; Wilkins, J.W. Force-matched empirical potential for martensitic transitions and plastic deformation in Ti-Nb alloys. Phys. Rev. B 2017, 96, 184105. [Google Scholar] [CrossRef]
  52. Yang, Y.; Wu, S.Q.; Li, G.P.; Li, Y.L.; Lu, Y.F.; Yang, K.; Ge, P. Evolution of deformation mechanisms of Ti–22.4 Nb–0.73 Ta–2Zr–1.34 O alloy during straining. Acta Mater. 2010, 58, 2778–2787. [Google Scholar] [CrossRef]
  53. Li, Z.; Gao, Y.; Zhan, S.; Fang, H.; Zhang, Z. Molecular dynamics study on temperature and strain rate dependences of mechanical properties of single crystal Al under uniaxial loading. AIP Adv. 2020, 10, 075321. [Google Scholar] [CrossRef]
  54. Morkina, A.Y.; Babicheva, R.I.; Korznikova, E.A.; Enikeev, N.A.; Edalati, K.; Dmitriev, S.V. A Molecular Dynamics Simulation to Shed Light on the Mechanical Alloying of an Al-Zr Alloy Induced by Severe Plastic Deformation. Metals 2023, 13, 1595. [Google Scholar] [CrossRef]
  55. Huang, X.; Li, J.S.; Lai, M.J. Influences of grain size on the deformation behavior of a twinning-induced plasticity metastable β titanium alloy. J. Alloys Compd. 2023, 937, 168274. [Google Scholar] [CrossRef]
  56. Lu, H.; Shi, H.; Zhang, H.; Ma, W.; Guo, Y.; Liang, S.; Zhang, J.; Zhang, X.; Zhang, S.; Liu, R. Enhanced yield strength by fine grain strengthening and TRIP/TWIP effect of metastable β-type Ti-4V-2Mo-2Fe alloy with high ductility. Mater. Charact. 2024, 207, 113591. [Google Scholar] [CrossRef]
  57. Li, L.; Han, M. Molecular dynamics simulations on tensile behaviors of single-crystal bcc Fe nanowire: Effects of strain rates and thermal environment. Appl. Phys. A 2017, 123, 450. [Google Scholar] [CrossRef]
  58. Veerababu, J.; Nagesha, A. Competition between full slip and twinning in BCC-Fe: Effect of preloaded stress and temperature. J. Appl. Phys. 2023, 134, 055102. [Google Scholar] [CrossRef]
  59. Hanada, S.; Izumi, O. Correlation of tensile properties, deformation modes, and phase stability in commercial β-phase titanium alloys. Metall. Mater. Trans. A Phys. Metall. Mater. Sci. 1987, 18, 265–271. [Google Scholar] [CrossRef]
  60. Manero, J.M.; Gil, F.J.; Planell, J.A. Deformation mechanisms of Ti–6Al–4V alloy with a martensitic microstructure subjected to oligocyclic fatigue. Acta Mater. 2000, 48, 3353–3359. [Google Scholar] [CrossRef]
Figure 1. Conceptual diagram of the computational methodology.
Metals 14 00318 g001
Figure 2. Four BCC-specific structures for Ti-Nb alloys with different compositions.
Metals 14 00318 g002
Figure 3. Tensile behavior of Ti-25Nb (at.%) alloy at 300 K. (where blue atoms represent BCC structures, green atoms represent FCC structures, and white atoms represent other structures).
Metals 14 00318 g003
Figure 4. Microstructures of the stacking fault structure viewed from the [1 1 ¯ 0] direction, where (a): Microstructure at 0.04 strain; (b): Microstructure at 0.092 strain (ultimate); (c): Microstructure at 0.118 strain; (d): Magnified view of the stacking fault structure, where b = 1/2[11 1 ¯ ].
Metals 14 00318 g004
Figure 5. Diagram of the twinning plastic deformation process, where (a): Stacking fault and twinning transition under tensile loading; (b): Microstructure of the twinning region; (c): Twinning formation process as viewed from [1 1 ¯ 0] direction.
Metals 14 00318 g005
Figure 6. (a) Twin boundary diagram in the [111] direction; (b) Crystal twin boundary diagram in the [1 1 ¯ 0] direction; (c) BCC atom arrangement in the [111] direction; (d) ω-phase atom arrangement in the [0001] direction; (e) BCC atom arrangement in the [1 1 ¯ 0] direction.
Metals 14 00318 g006
Figure 7. Tensile behavior of Ti-25Nb (at.%) alloy at different computational cell size, where: (a) Stress–strain curves during tensile loading at 300 K temperature at 0.001/ps strain rate; (b) Microstructure of 32,000 atoms cell size at 0.124 and 0.133 strain; (c) Microstructure of 256,000 atoms cell size at 0.124 and 0.133 strain; (d) Microstructure of 2,048,000 atoms cell size at 0.124 and 0.133 strain. (where blue atoms represent BCC structures, green atoms represent FCC structures, red atoms represent HCP structures, and white atoms represent other structures).
Metals 14 00318 g007
Figure 8. Tensile behavior of Ti-25Nb (at.%) alloy at 0.001/ps at different temperatures, where: (a) Stress–strain curves during tensile loading of Ti-25Nb (at.%) alloy; (b) Microstructure at 200 K temperature at 0.113 and 0.117 strain; (c) Microstructure at 300 K at 0.119 and 0.123 strain; (d) Microstructure at 400 K temperature at 0.124 and 0.128 strain. (where blue atoms represent BCC structures, green atoms represent FCC structures, red atoms represent HCP structures, and white atoms represent other structures).
Metals 14 00318 g008
Figure 9. Tensile behavior of alloys at 300 K temperature at 0.001/ps strain rate, where: (a) Stress–strain curve pictures of Ti-xNb (at.%) (x = 25, 30, 50, 75) alloys during tensile loading; (b) Microstructure of Ti-25Nb (at.%) at 0.119 and 0.123 strain; (c) Microstructure of Ti-50Nb (at.%) at 0.106 and 0.112 strain; (d) Microstructure of Ti-75Nb (at.%) at 0.105 and 0.107 strain. (where blue atoms represent BCC structures, green atoms represent FCC structures, red atoms represent HCP structures, and white atoms represent other structures).
Metals 14 00318 g009
Figure 10. Statistical plots of the number of changes in dislocation density and twin fraction with alloy composition at 0.125 strain.
Metals 14 00318 g010
Figure 11. Tensile behavior of Ti-25Nb (at.%) alloy at 300 K at different strain rates, where: (a) Tensile stress–strain curves of Ti-25Nb (at.%) alloy at strain rates of 0.0001 ps−1, 0.001 ps−1, 0.01 ps−1; (b) Microstructures of 0.0001 ps−1 strain rate at 0.116 and 0.125 strains; (c) Microstructures of 0.001 ps−1 strain rate at 0.125 and 0.2 strains; (d) Microstructures of 0.01 ps−1 strain rate at 0.175 and 0.2 strains. (where blue atoms represent BCC structures, green atoms represent FCC structures, red atoms represent HCP structures, and white atoms represent other structures).
Metals 14 00318 g011
Table 1. Lattice constants and cohesive energies of the alloys in Figure 2.
Ti4Nb12Ti8Nb8Ti10Nb6Ti12Nb4
Lattice Constant/ÅMD
(This work)
3.3173.3243.2783.265
DFT
(This work)
3.3023.2713.2673.264
[38] 3.2893.286
Cohesive Energy/eVMD
(This work)
−6.838−6.038−5.739−5.429
DFT
(This work)
−6.554−6.185−6.020−5.855
Table 2. Stacking fault energies of varying compositions.
γus on {110} (J m−2)γus on {112} (J m−2)
Ti-25Nb (at.%)0.4080.381
DFT [37]0.3070.296
Ti-50Nb (at.%)0.5010.459
DFT [37]0.3290.371
Ti-75Nb (at.%)0.5810.531
DFT [37]0.4940.534
Nb0.6570.714
DFT [37]0.6780.781
Table 3. Elastic constants of varying compositions.
ContentElastic ConstantThis Work[39][40]
Ti-25Nb (at.%)C11123.9128.5140 ± 11
C1285.5115.5116 ± 13
C4451.714.934 ± 10
B98.3 124 ± 13
G19.2 22 ± 13
Ti-50Nb (at.%)C11167.5155.4181 ± 9
C1288.3124.7121 ± 2
C4452.212.831 ± 10
B114.7 141 ± 9
G39.6 31 ± 10
Ti-75Nb (at.%)C11198.1203.5208 ± 3
C12104.0126.8130 ± 4
C4443.721.315 ± 10
B135.4 156 ± 4
G47.1 22 ± 10
Table 4. Twinning fraction at the strain of 0.124 in the alloy at different computational cell size.
Computational Cell Size32,000 atoms256,000 atoms2,048,000 atoms
Twinning fraction (%)0.1090.2520.263
Table 5. Percentage of atoms with other structures at the strain of 0.1 in the alloy at various temperatures.
Temperature200 K300 K400 K
Other structure concentration (%)3.17.915.1
Disclaimer/Publisher’s Note: The statements, opinions and data contained in all publications are solely those of the individual author(s) and contributor(s) and not of MDPI and/or the editor(s). MDPI and/or the editor(s) disclaim responsibility for any injury to people or property resulting from any ideas, methods, instructions or products referred to in the content.

