Article

A Comparative Study of the Life Cycle Inventory of Thermally Sprayed WC-12Co Coatings

by
Edwin Rúa Ramirez
1,2,
Alessio Silvello
1,*,
Edwin Torres Diaz
1,2,
Rodolpho Fernando Vaz
1 and
Irene Garcia Cano
1
1
Thermal Spray Centre (CPT), Universitat de Barcelona, Carrer Martì i Franqués 1, 08028 Barcelona, Spain
2
Engineering Research and Development Group in New Technologies (GIDINT), Santo Tomás University, Av. Universitaria, 45-202, Tunja 150003, Boyacá, Colombia
*
Author to whom correspondence should be addressed.
Metals 2024, 14(4), 431; https://doi.org/10.3390/met14040431
Submission received: 11 February 2024 / Revised: 15 March 2024 / Accepted: 4 April 2024 / Published: 6 April 2024
(This article belongs to the Special Issue Modern Cold Spray Technique (Volume II))

Abstract

:
In this research, a life cycle inventory (LCI) is developed for tungsten carbide–cobalt (WC-Co) coatings deposited via atmospheric plasma spray (APS), high-velocity oxy-fuel (HVOF), and cold gas spray (CGS) techniques. For the APS process, a mixture of Ar/H2 was used, while the HVOF process was fueled by H2. The carrier gas for CGS was N2. This study aims to determine and quantify the inputs (consumption of inputs and materials) and outputs (emissions to air, soil, water, and waste generation) that could be used in the life cycle analysis (LCA) of these processes. The dataset produced will allow users to estimate the environmental impacts of these processes using WC-Co feedstock powder. To obtain a complete and detailed LCI, measurements of electrical energy, gas, WC-CO powder, and alumina powder consumption were performed (the use of alumina was for sandblasting). Furthermore, emissions like carbon dioxide (CO2), carbon monoxide (CO), and noise were also measured. This practice allowed us to determine the input/output process quantities. For the first time, it was possible to obtain LCI data for the APS, HVOF, and CGS deposition processes using WC-12Co as a feedstock powder, allowing access to the LCI data to a broader audience. Comparisons were made between APS, HVOF, and CGS processes in terms of consumption and emissions. It was determined that the APS process consumes more electrical energy and that its deposition efficiency is higher than the other processes, while the HVOF process consumes a large amount of H2, which makes the process costlier. CGS has comparatively low electricity consumption, high N2 consumption, and low deposition efficiency. The APS, HVOF, and CGS processes analyzed in this study do not emit CO, and CO2 emissions are negligible.

1. Introduction

Tungsten carbide (WC) is widely recognized for its exceptional mechanical properties, such as its remarkable hardness and excellent performance up to 500 °C, depending on the specific composition of the material and the duration of exposure, making it a highly valued material in a variety of industrial, aerospace, and military applications [1]. Its excellent corrosion resistance also increases its usefulness [2]. In recent decades, WC-Co-based coatings have been used extensively to improve the wear resistance of various metallic components [3,4]. These coatings are commonly applied via atmospheric plasma spray (APS) and high-velocity oxy-fuel (HVOF) spraying techniques [5,6,7]. In addition, the microstructural properties of WC-12Co coatings deposited via cold gas spray (CGS) using micron-sized WC powders have been studied [8]. Tungsten carbide typically has a hardness ranging from 1500 to 2000 HV [9]. Cermet materials, such as WC-Co, have demonstrated excellent wear resistance, improving the parts’ durability in applications such as hydraulic turbines [10]. The literature presents a comparison of different spraying techniques for the same feedstock powder, focusing on the coating performance, as presented by Bochenek et al. [11] for NiCr-Re-Al2O3 via HVOF, APS, and laser cladding; or by Vaz et al. [12,13], comparing FeMnCrSi cavitation-resistant coatings produced via arc-spraying, HVOF, CGS, and plasma cladding.
Life cycle analysis (LCA) is carried out systematically to collect and analyze quantifiable data on the resources used, the emissions generated, and the environmental impacts associated with a specific process [14]. It is crucial to carry out an LCA to measure impacts from raw material extraction to final disposal, considering all vectors involved (air, water, and soil) and using a rigorous method [15,16]. Globally, a complete LCA of the APS, HVOF, and CGS processes using WC-12Co as feedstock powder has yet to be carried out, which makes determining their environmental impact very innovative. For this reason, with the support of experts from the Ecoinvent Association, the CPT group has developed life cycle inventory (LCI) data sheets for APS, HVOF, CGS, and sandblasting processes. In the literature, there are no available LCI studies on this powder and processes. Liu et al. [14] investigated LCI and LCA of NiCrAl/NiCr-Cr3C2 coating deposited via APS, acquiring raw data using measurement tools, while Zhang et al. [17] have elaborated an energy consumption model based on the “unit process” for NiAl and Fe APS coatings. They established a relationship between energy consumption and coatings performance. Merlo et al. [18] compared Cr electroplating and WC-13Co HVOF coatings, using ethanol fuel for the HVOF process. The results show a high-level CO2 emission due to the complete ethanol combustion. Vardelle et al. [19] carried out the LCA analysis of WC-Co coatings deposited via HVOF for aircraft landing gears, but there are no results for emissions and noise. Finally, Viscusi et al. [20] studied the sustainability of polymer matrix composite coatings deposited via low-pressure CGS, concluding that the emissions produced during the deposition process are lower than those produced via other thermal spray processes. LCA provides a comprehensive view of the relevant environmental factors, identifying opportunities for improvement in design, material selection, manufacturing, use, and disposal [21]. It allows for a comparison of different options in terms of their environmental impacts, and it may be required by environmental regulations and standards, especially in specific industrial sectors. In addition, the results of the LCA can be used to obtain environmental certifications and eco-labels to demonstrate a commitment to sustainability. LCA and LCI [22] are defined by the international technical standards ISO 14040 and ISO 14044 [23]. The four inventories have been reviewed by experts of the Ecoinvent team, as well as by an independent external reviewer. The LCI dataset produced for the APS, HVOF, and CGS coating processes with WC-12Co represents a true innovation in environmental impact assessment and management; it is a valuable and innovative tool that drives sustainable decision-making and environmental responsibility. By embracing this innovation, companies gain a competitive advantage and forge a path towards a more prosperous and environmentally friendly future, making a difference in the industry and beyond. With LCI, a comprehensive and detailed LCA can be performed through software. LCA will provide a comprehensive assessment of the environmental impact of a company’s process, identify areas for improvement, support informed decision-making, meet regulatory requirements, and improve communication and credibility in terms of sustainability. It is a valuable tool with which to promote environmental responsibility and process optimization for greater sustainability.
An LCA analysis goes through four distinct phases, namely, establishing the initial objectives and the scope of the study, followed by the inventory analysis, impact analysis, and interpretation [14]. For the execution of these four stages, dedicated software tools like SimaPro (PRé Consultants, Amersfoort, The Netherlands) or GABi (Thinkstep, Leinfelden-Echterdingen, Germany) are available to facilitate the process of conducting life cycle analysis and its interpretation. Additionally, different databases providing background data exist. Background data provide information about processes, materials, and energy flows that are not directly linked to the product or system being studied. These datasets form the basis of LCA studies, enabling a comprehensive analysis of impacts throughout a product’s life cycle, incorporating both upstream and downstream effects [24]. In this study, the Ecoinvent database is used for understanding the environmental impacts of products and services. It covers a wide range of sectors at the global and regional levels. It contains over 18,000 datasets [25], representing various human activities and processes, including insights on resource usage, emissions to air, water, and soil, and products and wastes generated. With a global scope, the Ecoinvent database spans diverse industries. It serves both academia and industry, providing support for decision-making and various studies such as LCA, sustainable product design, environmental product declaration (EPDs), greenhouse gas (GHG) reporting, and corporate sustainability reporting (CSR) [26].

2. Materials and Methods

The characterization of the starting powder, the deposition of coatings, and the subsequent testing, as well as the on-site power and emissions data collection, were conducted at the CPT’s facilities, University of Barcelona (Barcelona, Spain). The coatings were applied on a low carbon steel plate with dimensions 50 × 20 × 5 mm3.
The feedstock powder was characterized by chemical composition, shape, XRD phase analysis, and particle size distribution. It was a WC-12Co commercial powder: 88 wt.% WC particles dispersed in a Co matrix, with a Co content of 12 wt.%, supplied by Oerlikon Corporation AG. To analyze the particle size distribution, the laser scattering (LS) technique was used with a Beckman Coulter LS 13 320, in accordance with ASTM B822-02 [27]. In addition, scanning electron microscopy (SEM) was used to investigate and characterize the particle shapes (Phenom X Desktop SEM, ThermoFisher, Eindhoven, The Netherlands). Phase analysis was performed via X-ray diffractometry (XRD) using a X’Pert PRO MPD θ/θ BraggBrentano instrument with X’Pert software v. 2.0.1 (PANalytical, Almelo, The Netherlands). For this analysis, a Co Kα source with a wavelength of 1.7903 Å was used, operating at a power of 45 kV and 40 mA.
Prior to the deposition process, the substrates underwent a grit-blasting treatment using Al2O3 (F24) to achieve the desired surface roughness Ra ≈ 7 µm and then cleaned by acetone. The process parameters used for APS, HVOF, and CGS deposition are presented in Table 1. The APS and HVOF guns are moved by an arm robot TYPE IRB1500/S3 M92/93 (ABB Robotics, Västerås, Sweden) (power, 1.5 kVA; voltage, 3 × 380 V; frequency, 50–60 Hz). For APS, the AG A300 gun (Plasma-Technik AG, Winterthur, Switzerland) was used. The HVOF equipment used was TYPE DJCE (Sulzer Metco, Westbury, NY, USA) (voltage, 230 V; frequency, 50 Hz), 4.0 A, Model 999 DJCE-H, Diamond Jet Gun Model 2600DJM (Sulzer Metco, Westbury, NY, USA) with H2 as fuel. Gas flow rates and powder feed rates are controlled automatically. The CGS equipment used is the Kinetics 4000/34 system (CGT, Haun, Germany) equipped with an electric gas heater with a maximum nominal power rating of 34 kW, enabling it to reach a nominal temperature of 800 °C. The gun was operated by an ABB IRB-2400 robot arm (ABB Robotics, Västerås, Sweden).

2.1. Coatings Characterization

Metallographic cross-section preparation was executed in accordance with the ASTM E1920-03 [28]. Using ImageJ v 1.52a software (National Institute of Heath, Bethesda, MD, USA), and in accordance with ASTM E2109-14 [29] test method B, porosity was calculated by the greyscale threshold on optical microscopy (OM) images obtained with a DMI 5000 microscope (Leica, Wetzlar, Germany). Porosity measurements were carried out for each coating. The microhardness was measured using HZU equipment (Shimadzu, Tokyo, Japan) with 300 gf for 15 s, HV0.3, and is presented as a mean value of ten indentations for each coating. The deposition efficiency (DE) for the three processes is calculated using the methodology illustrated in ISO:17836:2004 [30]. This involves considering the initial and remaining quantity of powder in the feeder before and after the deposition process, as well as the initial and coated mass of the sample. The powder flows through the gun once the process parameters have been reached and stabilized. Additionally, factors such as the number of steps quantity of layers, deposition time, and the robot path on the substrate were considered. The adhesion behavior of the coatings was investigated in compliance with the ASTM C633-13 [31] The chosen bonding agent for this test was HTK Ultra Bond 100 with an adhesion of 70 MPa. Additionally, the adhesion tests were conducted using the Servosis MCH-102 ME equipment.
The sliding wear test (ball-on-disk) was conducted in accordance with ASTM G99-17 [32], utilizing equipment was an OL2000 (CM4 Enginierya S.L., Cervello, Spain). This test involves assessing the friction between a disc and a ball under non-lubricated conditions. Prior to the test, the vertical force applied to the WC-Co ball was set at 25 N. The surfaces of the samples tested were previously prepared by grinding and polishing to achieve a maximum roughness of Ra 0.8 µm. All tests were performed at room temperature (20 ± 5 °C), with a maximum humidity level of 30% moisture for a length of 1000 m. The coefficient of friction (CoF) between the WC-Co ball and the coatings was measured and subsequently graphed for analysis. The rubber wheel test was carried out according to ASTM G65-16 [33] using a constant feed of SiO2 abrasive material (moisture less than 0.5%). The diameter of the rubber wheel was 226 mm and rotated at 139 rpm against the surface of the sample. The load was 50 N. The equipment was a BoD tester(CM4 Enginierya S.L., Cervello, Spain). The mass of the sample was measured in different elapsed times of testing, using equipment AE100 (Metter, Columbus, OH, USA).

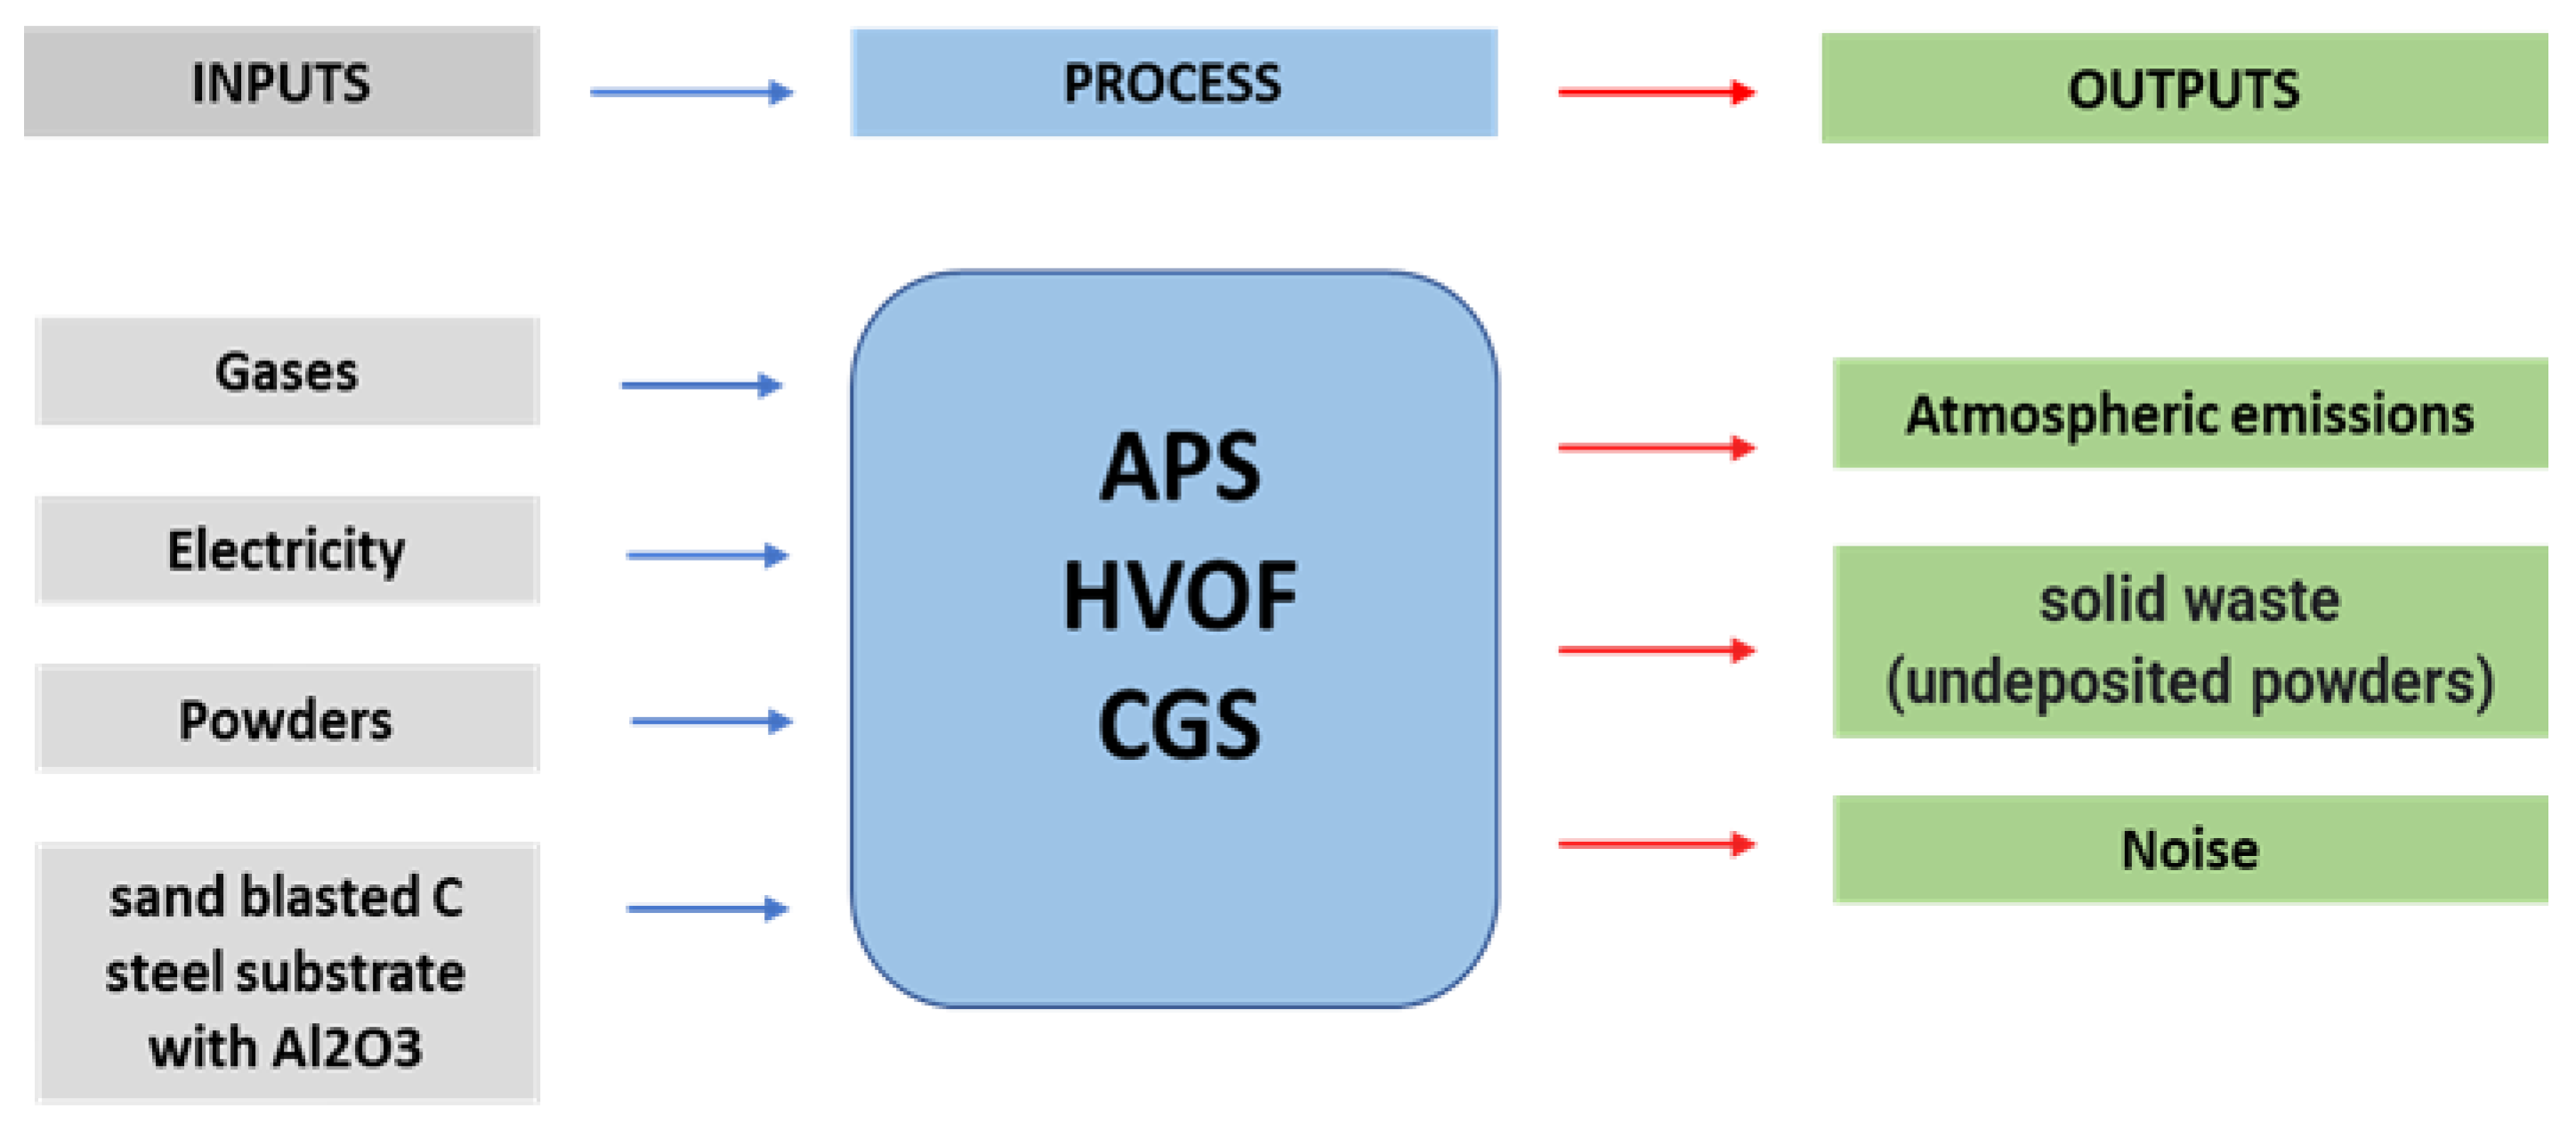
2.2. Inventory Data Acquisition Method

In this investigation, measurements of energy consumption, metal powders, gas emissions, and noise in the spraying booth were conducted in real time during the process deposition using an ammeter clamp Iberica PCE-PCM1 with USB port and software. Moreover, a CO2/CO DELTA OHM HD21ABE17 meter was used to measure the gases generated, with the following ranges: CO2 0–5000 ppm; CO 0–500 ppm. Finally, the SC102 Class 2 sound level meter was used for noise measurement. To generate the LCI for the APS, HVOF, and CGS deposition processes, the LCI of WC-12Co was utilized as the raw material. The WC-12Co feedstock powder dataset was readily accessible in the Ecoinvent database. It is crucial to have a distinct LCI available for each unit process (UPR) or gate-to-gate inventory within a supply chain [34]. Based on the UPR, LCI, and LCIA unit process presented in Ecoinvent database [34], Figure 1 lists the inputs (exchanges from environment and intermediate exchanges); the process or activity; and the outputs (reference product, by product waste, and exchanges to environment).
The database comprises essential constituents rooted in the individual processes associated with human activities. These processes encompass elementary interactions, which involve exchanges with the environment, as well as interactions within the technosphere, referred to as intermediate exchanges. These individual processes are commonly UPR or gate-to-gate inventories, as referenced in [34]. Life cycle impact assessment (LCIA) methods, such as the “IPCC 2021” approach, are employed to assess the list of fundamental trade-offs involving the utilization of natural resources and environmental pollutants into the environment. These methods provide a means of quantifying the environmental impact attributed to a particular activity. Impact assessment methods can take two primary forms: (a) focusing on a single environmental aspect, like the carbon footprint or water footprint; (b) considering multiple impact categories, including “human toxicity”, “land use”, “climate change”, or “water use”. These footprints and impact categories can be evaluated over various timeframes, such as “20-year global warming potential (GWP20)” or “100-year global warming potential (GWP100)”, as seen in the case of the carbon footprint and the impact category “climate change”. Each indicator is assigned a specific unit, such as kg CO2-equivalents. The factor responsible for converting an elementary exchange into a quantity of kg CO2-equivalents is known as the “characterization factor” (CF), as indicated in [25].
The LCI of the APS, HVOF, and CGS deposition processes are illustrated in the diagram below (Figure 2b). The inputs include gas consumption, electricity usage, powder consumption, and steel substrates. The outputs comprise low atmospheric emissions, residual powder, and high noise levels that require hearing protection.

2.3. Inventory Process

The inputs for the sandblasting process are compressed air, Al2O3 powder, and electrical power. The outputs include CO2 gas emissions, residual metal powder particles, and high-frequency noise. The inputs for APS process consist of H2 and Ar gases, electrical power, WC-12Co powder, and a silica sandblasted steel substrate. The outputs include CO2 gas emissions, residual metal powder particles, and high-frequency noise. The HVOF process requires inputs such as H2 gas, compressed air, electrical power, WC-12Co powder, and a steel substrate that has been sandblasted with alumina. As a result of this process, CO2 emissions, residual metal dust particles, and high-frequency noise are generated. In CGS process, the input inventories include N2 gases and compressed air, electricity, WC-12Co powder, steel substrate, and equipment. CGS stands out as a low-emission process, with minimal emissions of gases and metal particles, as well as controllable noise levels.

3. Results and Discussions

This section presents the results obtained following this sequence: powder characterization, coating properties, and LCI and LCA evaluations. Alongside the results, the pertinent discussions are shown.

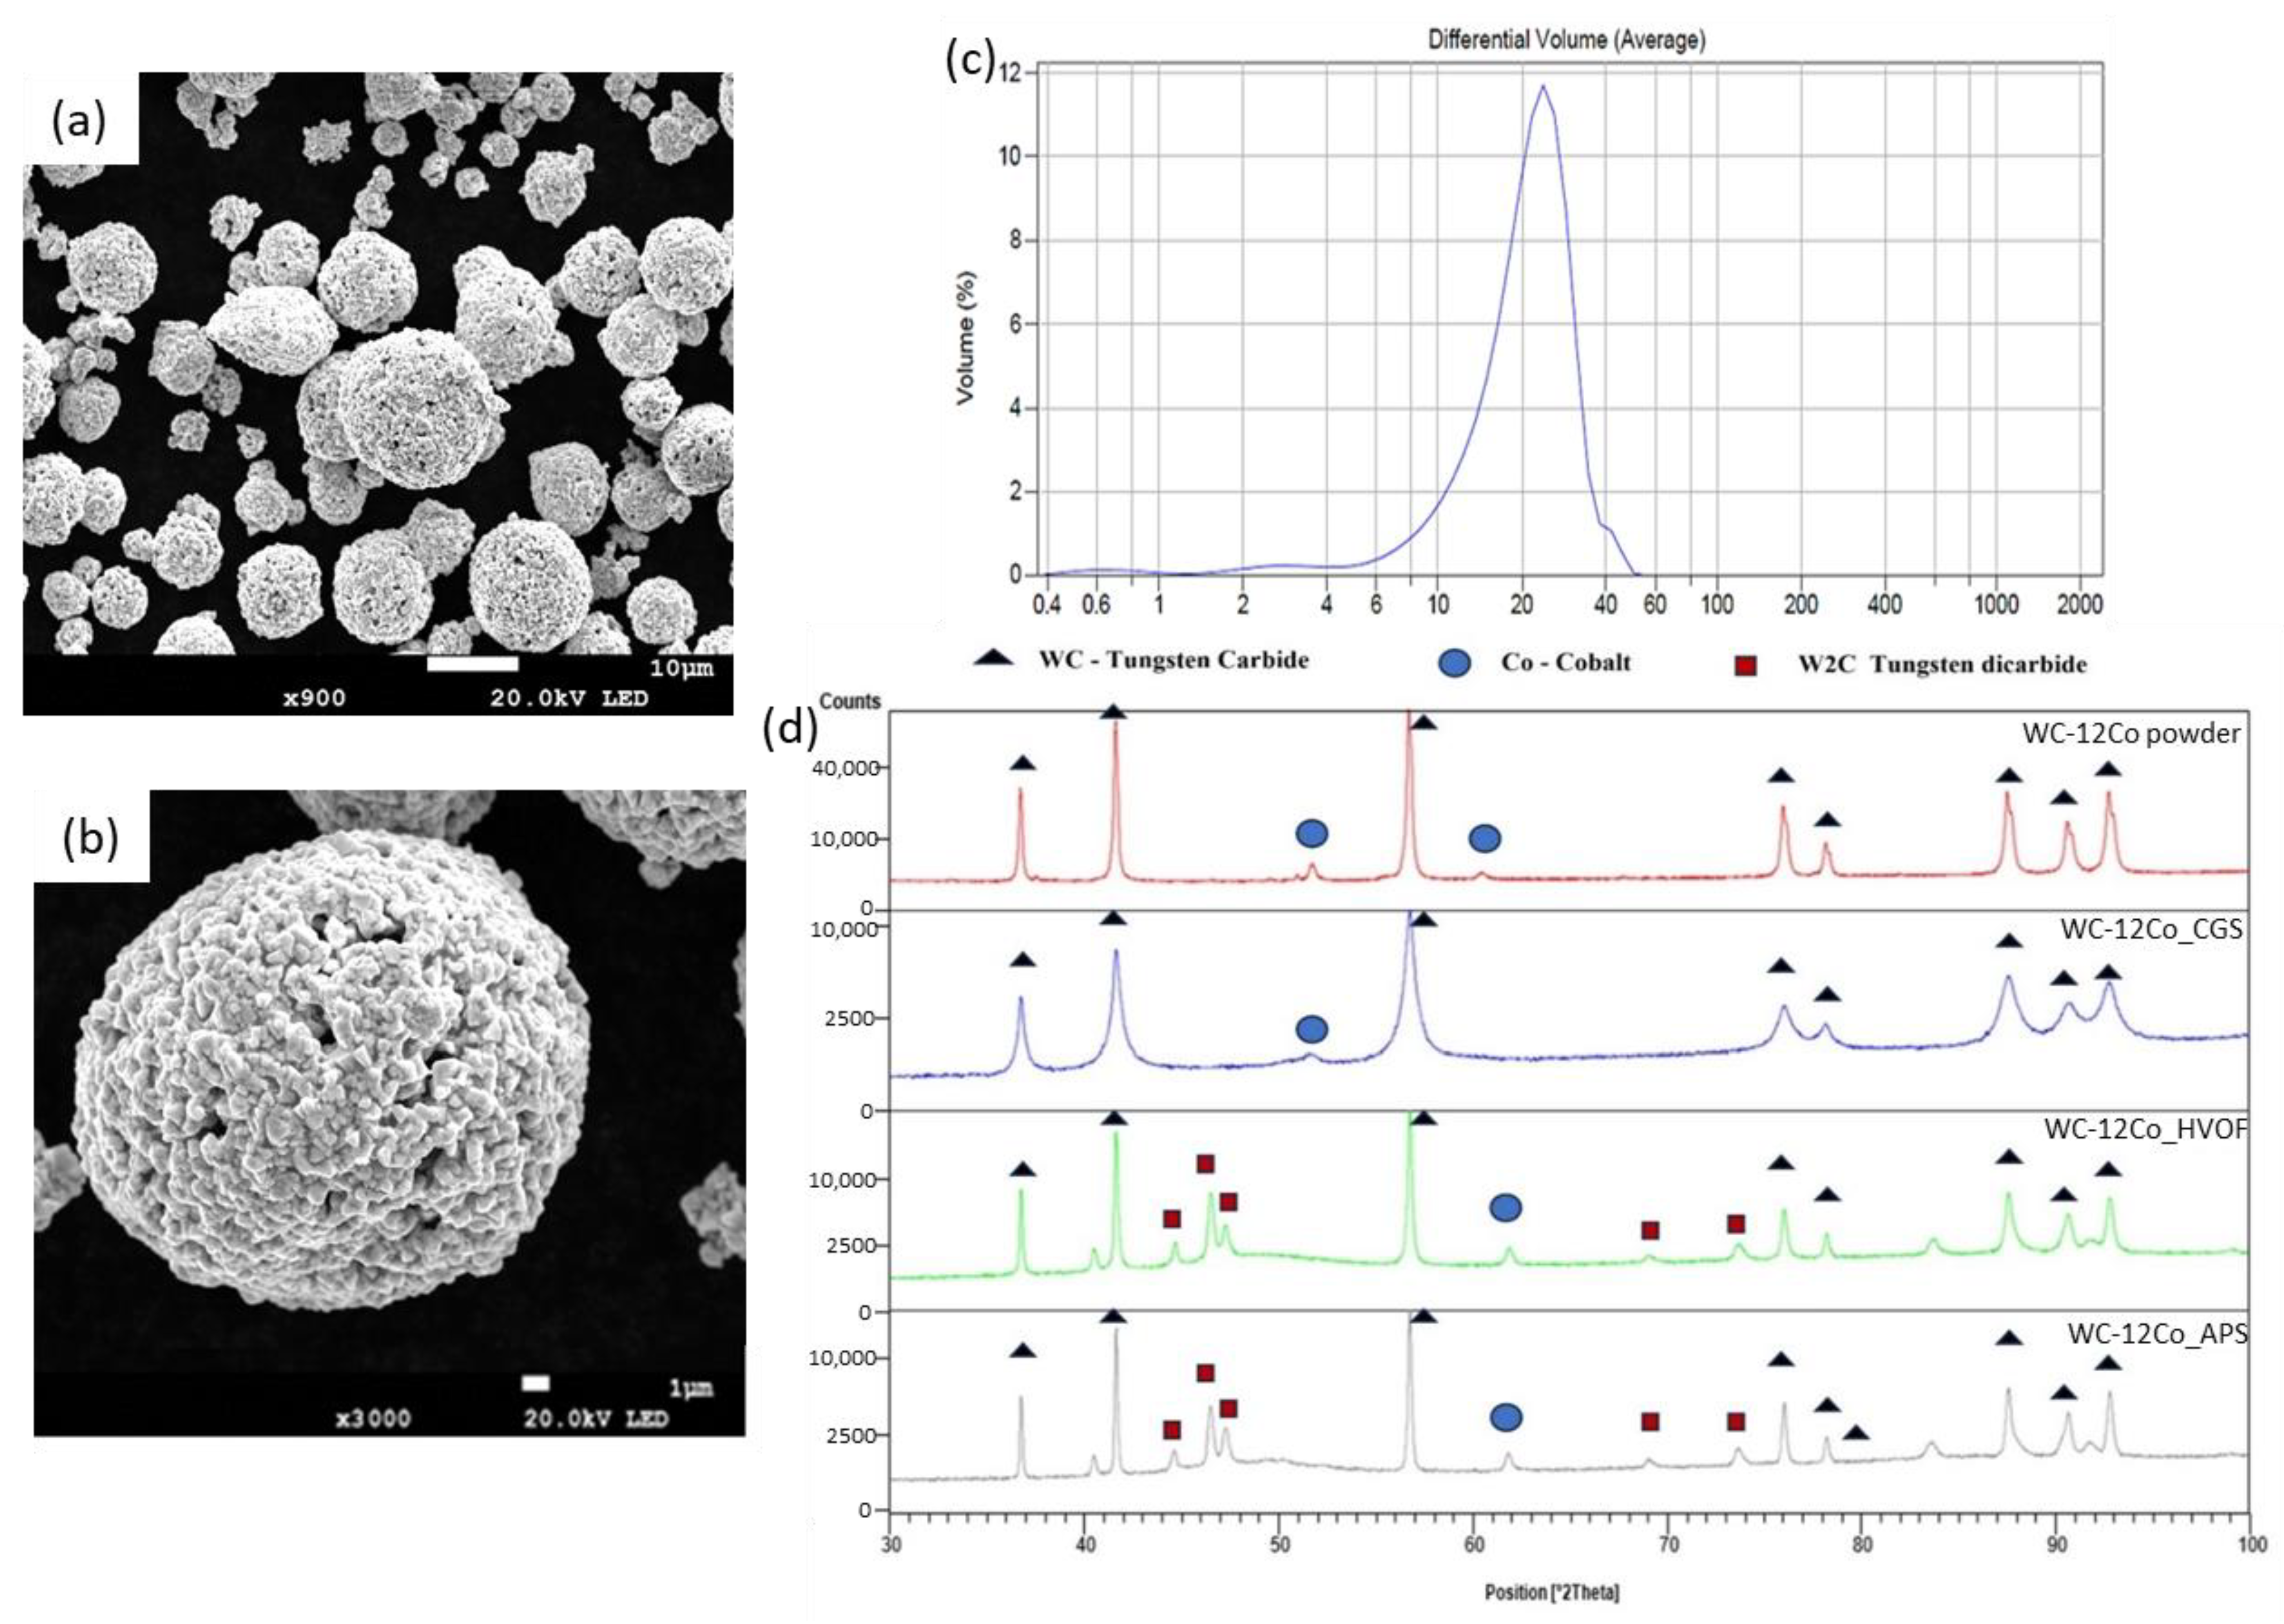
3.1. Feedstock Powder Properties

As shown in Figure 2a,b, the feedstock powder of WC-12Co exhibits a porous structure, closely resembling a nearly spherical shape. This shape and characteristics are typical of agglomerated and sintered powders, which has been the most-used technique with which to produce cermet powders for thermal spraying because of the good binder distribution surrounding the WC ceramic particles, promoting a coating with WC well embedded in the Co-matrix.
WC-12Co powder was characterized by shape, chemical composition, XRD phase analysis, and particle size distribution [35]. Figure 2c presents the volumetric particle size distribution of the sample WC-12Co powder analyzed before the three coatings via APS, HVOF, and CGS. The percentiles show that 90% (d90) of the particles are smaller than 31.80 µm, 50% (d50) are smaller than 19.17 µm, and 10% (d10) are smaller than 12.12 µm, which is a particle size distribution adequate for the spraying process. The phase distribution of the feedstock powder and that of the three obtained coatings were analyzed using the XRD technique. As widely confirmed by existing literature data [36], the mechanism of the CGS process is based on the plastic deformation of the feedstock powder, not giving rise to new oxides or carbides during the deposition process that could worsen the coating properties. Instead, changes in crystalline size are appreciable, highlighted by the broadening of some peaks [37]. In the case of APS and HVOF processes, the appearance of new phases (W2C) is visible. This is attributed to oxidation, decarburizing, and diffusion phenomena during deposition [38]. Figure 2d shows the diffractograms obtained for the feedstock powder and coatings.

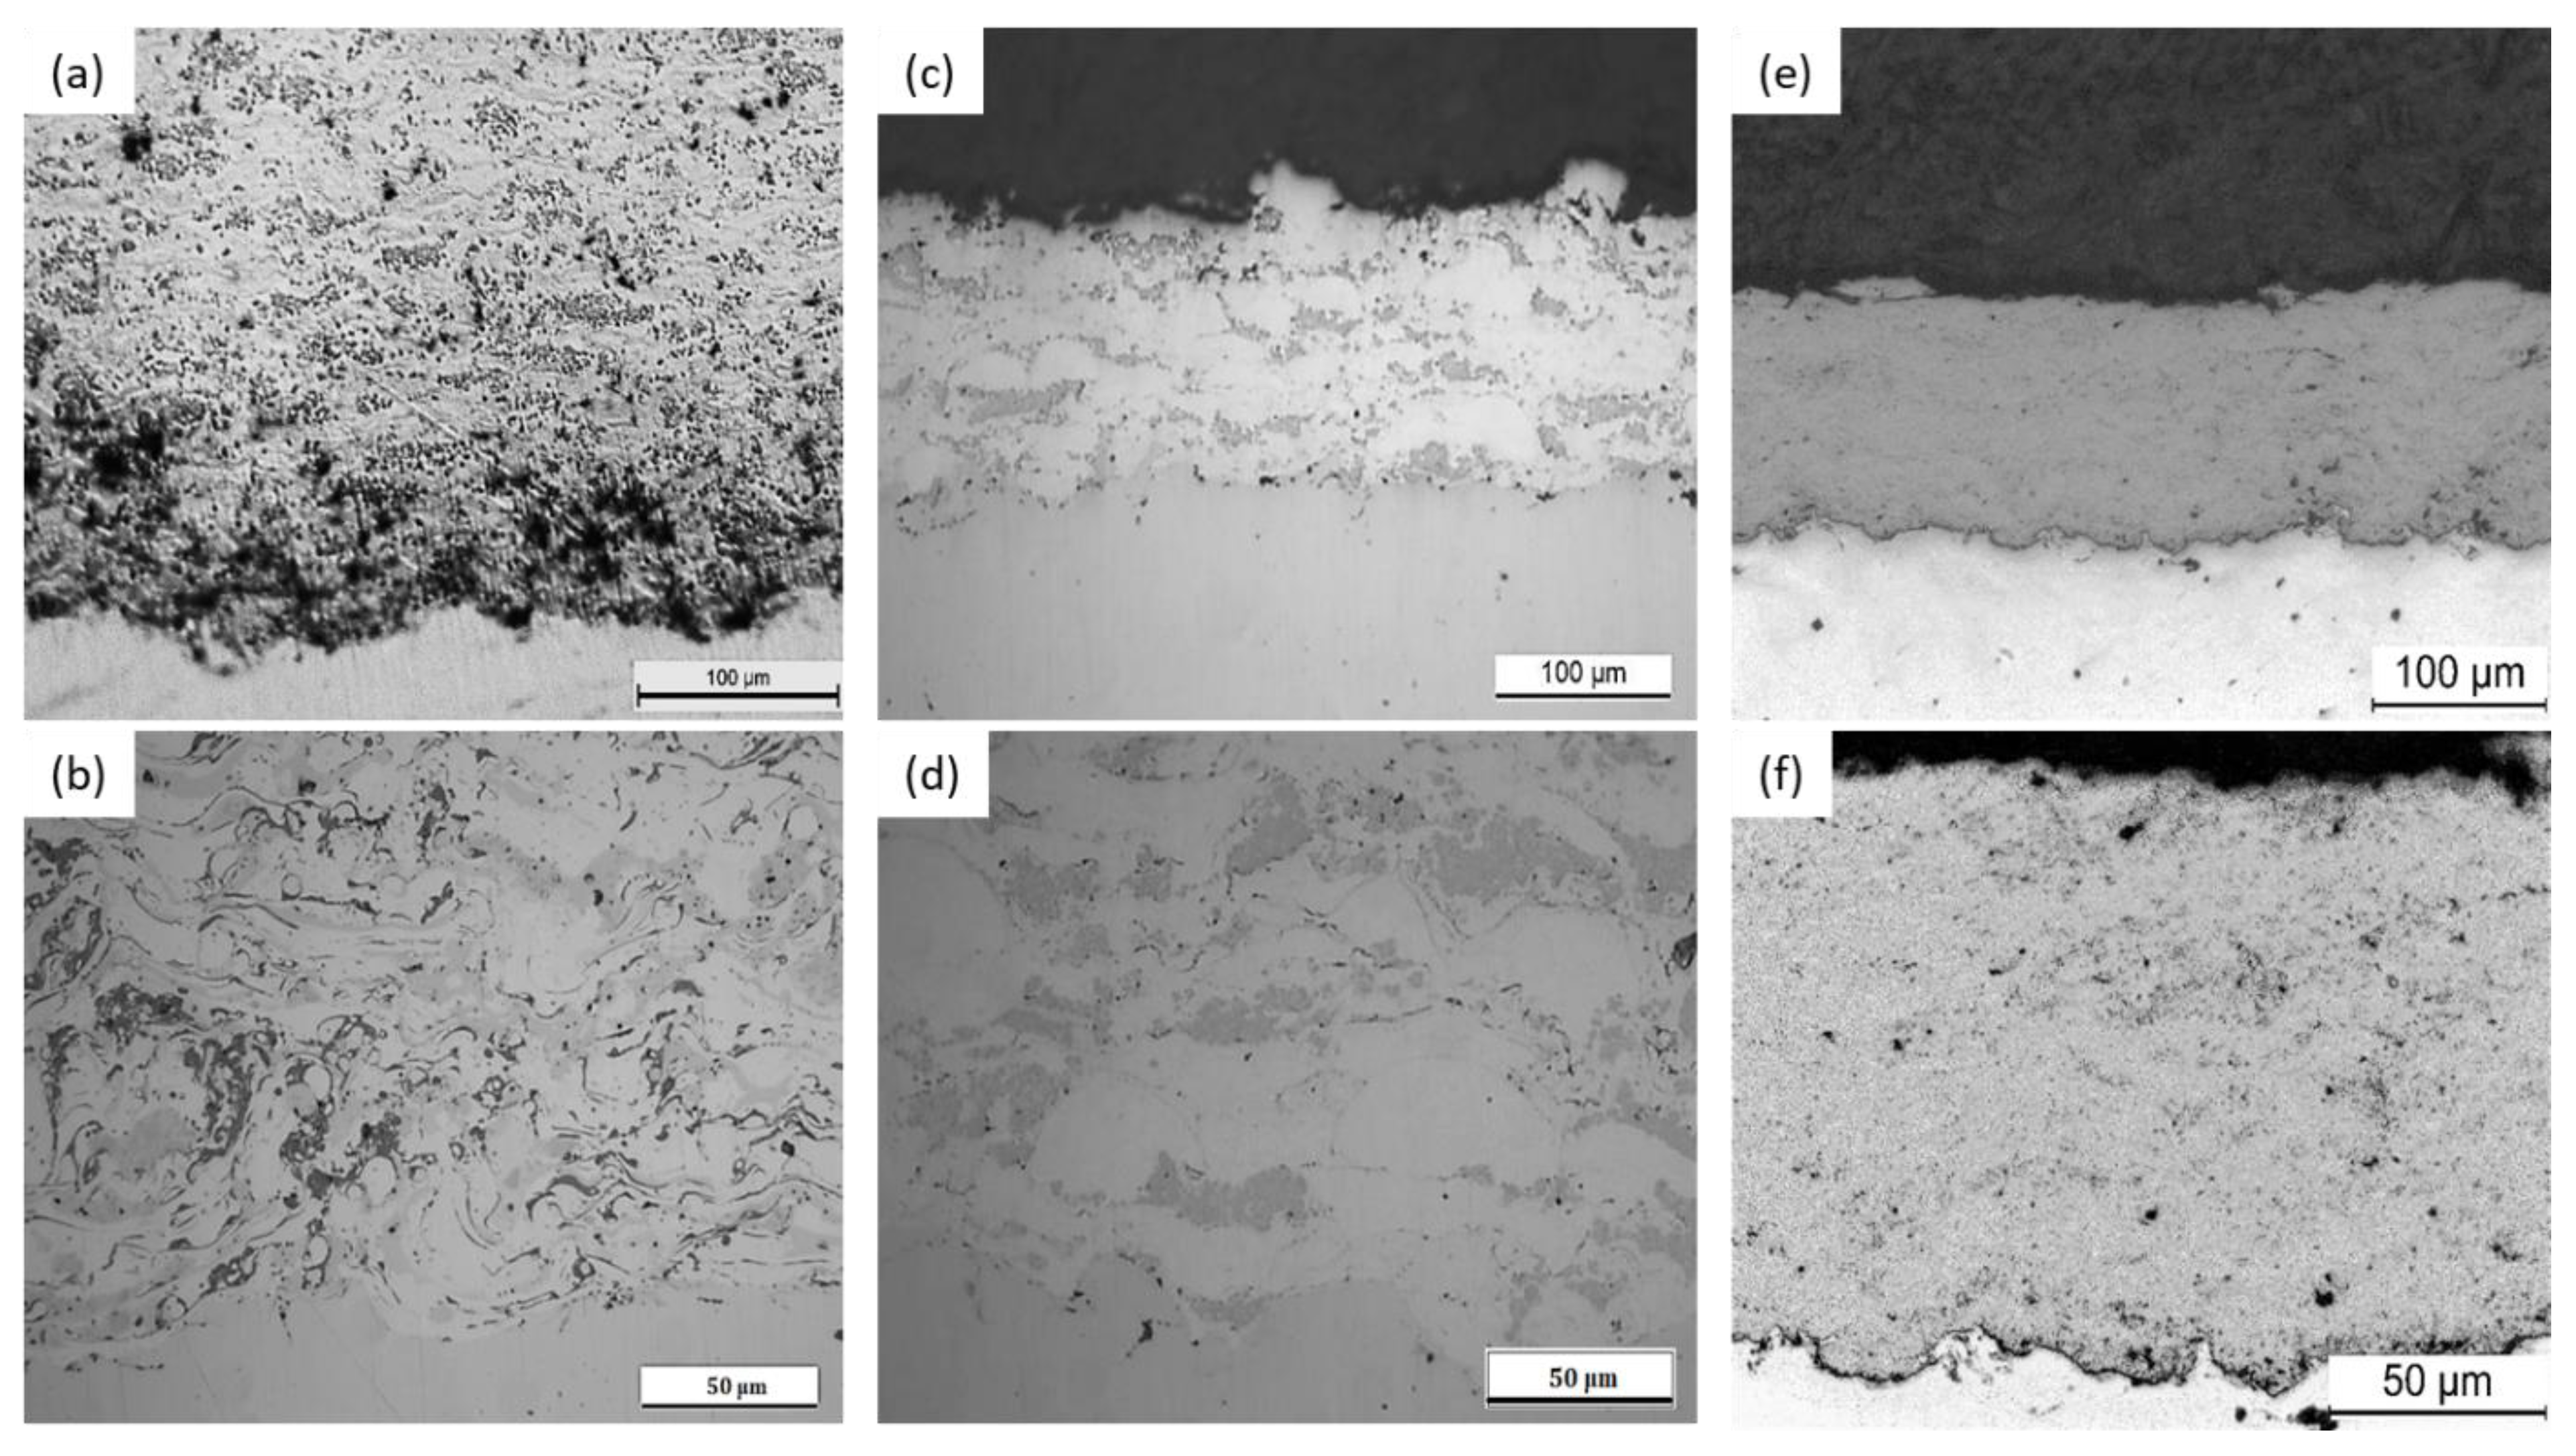
3.2. Coatings Characteristics and Properties

Figure 3a,b displays the microstructure of an APS coating. Despite some large pores, the overall microstructure appears compact and uniform and has a thickness of approximately 450 µm. It is important to note that there are no signs of delamination or cracks, which can be attributed to the meticulous selection of the process parameters mentioned earlier. The porosity measurements for the APS coating were 2.00 ± 0.03%. The adhesion of the WC-12Co coating obtained via APS was high. This is due to the nature of the process, which involves heating and melting the coating particles before spraying them onto the substrate surface. The particles adhere strongly to the substrate during this process, forming a solid bond [39]. In addition, the adhesion of the APS coating also depends on other factors, such as the preparation of the substrate surface and the proper selection of process parameters, such as temperature, spray speed, and gas pressure. These factors influence the interaction between the coating particles and the substrate surface, ensuring good adhesion. The adhesion obtained via APS was a very strong 62 ± 4 MPa.
The HVOF process is characterized by high kinetic energy, accelerating the particles against the substrate surface. The high temperatures of the process (3000–3500 °C) generate diffusion processes that result in a phase change from WC to W2C, as demonstrated via XRD analysis (Figure 3c,d). As a result, a coating with a highly dense structure and exceptional adhesion to the substrate is formed [40]. The adhesion obtained via HVOF was strong (58 ± 1.2 MPa).
Figure 3e,f present the microstructure of the CGS coating. The image reveals a compact and homogeneous coating with an approximate thickness of 150 µm. Some visible pores are also observed, and there is an absence of oxide content. The impact of the accelerated particles on the substrate surface induces a phenomenon known as cold plastic deformation, which leads to significant deformation and robust adhesion between the particles and the substrate without necessitating thermal melting. The adhesion obtained via CGS was 37 ± 3 MPa.
The adhesion of the coatings in the three thermal spraying techniques shows that WC-12Co has a higher adhesion in the APS technique, with results of 62 ± 4 MPa. It is followed by HVOF coating, with results of 58 ± 1.2 MPa, and CGS deposition, with results of 37 ± 3 MPa, showed a lower adhesion. The adhesion results were classified as adhesive, cohesive, or adhesion failure.
For the three coatings, the coefficient of friction (CoF) was calculated when the system achieved a stationary behavior after 15,000 cycles, with the results indicated in Table 2. As is visible in Figure 4, for the APS coating, the wear track width is 685 ± 28 µm; for the HVOF coating, the wear track width is 250 ± 16 µm; and for the CGS coating, the wear track width is 840 ± 52 µm. The worst performance of the CGS process (wider wear track, higher CoF, higher wear rate, greater volume loss) can be attributed to the intrinsic characteristics of the process itself; the bonding between deposited particles in CGS is achieved solely through plastic deformation and not through fusion, as in the case of APS and HVOF. For this reason, more material is removed from the coating with each cycle.
The superior performance of the HVOF process compared to the APS process is attributed to the lower porosity of the coating, as is evident in Table 2. Considering that both coatings have a similar hardness and adhesion strength, the higher presence of voids in the APS coating contributes to a significantly wider wear track, as is visible in Figure 4. The results from the rubber wheel tests (Table 2) generally confirm what was obtained with sliding wear tests. It can be stated that concerning wear protection, the techniques ensuring the best coating performance are HVOF and APS. CGS has limitations due to the low plastic deformation of WC feedstock powder. For this reason, industrially, CGS is used to deposit metallic materials or those with a good degree of deformability.

3.3. WC-12Co Database, Ecoinvent v3.9.1

This dataset is based on a published inventory (available at https://ecoinvent.org/the-ecoinvent-database/ (accessed on 11 February 2024)) that portrays the production of Chinese tungsten carbide [41]. Within this record, no direct emissions are reported. As a result, direct emissions were taken from a published inventory [15], illustrating the manufacture of tungsten carbide outside of China. Direct emissions are somewhat comparable. Specific details concerning the technological procedures employed in the Chinese tungsten carbide production were not obtainable in the publication [41]. Consequently, it is postulated that the process resembles the one delineated in the global dataset. Due to this lack of information, the reasons for the differences in energy consumption and different inputs of gases (N2 vs. H2, in the Chinese and global datasets, respectively) remain unclear.

3.4. LCI of Abrasive Sandblasting

In this step, the quantity of alumina, the electrical power of the exhaust motor and the 5.5 hp air compressor at 600 kPa pressure, the compressed air flow, the CO2 emissions, and the noise were measured as inputs. LCI of abrasive blasting is shown in Table 3.

3.5. LCI of WC-12Co Coating Produced via APS

This experiment can determine the LCI of an APS coating, measuring the electrical consumption of the following components: a Spray Controller Plasma A-3000S Plasma-Technik AG CH-5610, 220 VA; a Control System S3E ABB robot; a powder feeder; a chiller to generate cooling water; and an extraction turbine to eliminate residual powder. Prior to APS deposition process, the LCI of the sandblasting process of the substrate was considered in another dataset. In addition, the consumption of gases for powder transport and plasma production (Ar and H2) and the powder consumption per deposition are measured. The electrical consumption of the components of the APS coating equipment was measured, consisting of all the equipment mentioned before and employing Equation (1). The total consumption is multiplied by the duration of the WC-12Co deposition on one square meter to determine the total electrical energy consumption. A deposition efficiency of 95% and a thickness of 450 µm was obtained. In (1), CelAPS is the electrical power consumption of APS in kW, Sel is the electrical consumption of abrasive sandblasting in kWh, Tel is the turbine power consumption in kWh, Rel is the robot electrical consumption in kWh, GCel is the gun and control equipment electrical consumption in kWh, CHw is the chiller for water cooling in kWh, and td is deposition time in h.
H2 and Ar gas consumptions are parameters defined by the manufacturer and can be controlled by the operating technician; powder consumption is measured by calculating the deposition efficiency. CO emissions are zero, and CO2 emissions are very low, so no pollutant gases are generated into the air. Input and output measurements in the APS process were carried out in real time and under real operating conditions using meticulously calibrated equipment and ensuring accurate and precise values. LCI of APS is shown in Table 4.
C e l A P S = S e l + T e l + R e l + G C e l + C H w × t d

3.6. LCI of WC-12Co Coating Produced via HVOF

The electrical consumption of the components of the HVOF coating equipment was measured, consisting of all the equipment mentioned before and employing Equation (2). As in the case of APS, the total consumption is multiplied by the duration of the WC-12Co coating on 1 m2 to determine the total electrical energy consumption. Input and output measurements in the HVOF process were carried out in real time and under real operating conditions using meticulously calibrated equipment and ensuring accurate and precise values. In (2), CelHVOF is the electrical power consumption of HVOF in kW, Sel is the electrical consumption of abrasive sandblasting in kWh, CPel is the air compressor consumption in kWh, Tel is the turbine power consumption in kWh, Rel is the robot electrical consumption in kWh, GCel is the gun and control equipment electrical consumption in kWh, CHw is the chiller for water cooling in kWh, and td is the deposition time in h.
The manufacturer defines the H2 and O2 gas consumptions and they can be controlled by the operating technician. The powder consumption is measured by the deposition efficiency. A high efficiency of 55% and a thickness of 250 µm has been obtained. There are no CO emissions, and the CO2 emissions are very low. Input and output measurements in the HVOF process were carried out in real time and under real operating conditions using well-calibrated equipment and ensuring accurate and precise values. LCI of HVOF is shown in Table 5.
C e l H V O F = S e l + C P e l + T e l + R e l + G C e l + C H w × t d

3.7. LCI of WC-12Co Coating Produced via CGS

The deposition process reached an efficiency of 17% and a thickness of 150 µm. Additionally, it is worth noting that the emissions of CO and CO2 are extremely low, indicating that the process does not generate significant amounts of pollutant gases into the air. The electrical consumption of the components of the CGS coating equipment was measured, consisting of all the equipment mentioned before and employing Equation (3). As in the case of APS and HVOF, the total consumption is multiplied by the duration of the WC-12Co coating on 1 m2 to determine the total electrical energy consumption. LCI of CGS is shown in Table 6. In (3), CelCGS is the electrical power consumption of CGS in kW, Sel is the electrical consumption of abrasive sandblasting in kWh, Tel is the turbine power consumption in kWh, Rel is the robot electrical consumption in kWh, GCel is the gun and control equipment electrical consumption in kWh, CHw is the chiller for water cooling in kWh, and td is the deposition time in h.
C e l C G S = S e l + T e l + R e l + G C e l + C H w × t d

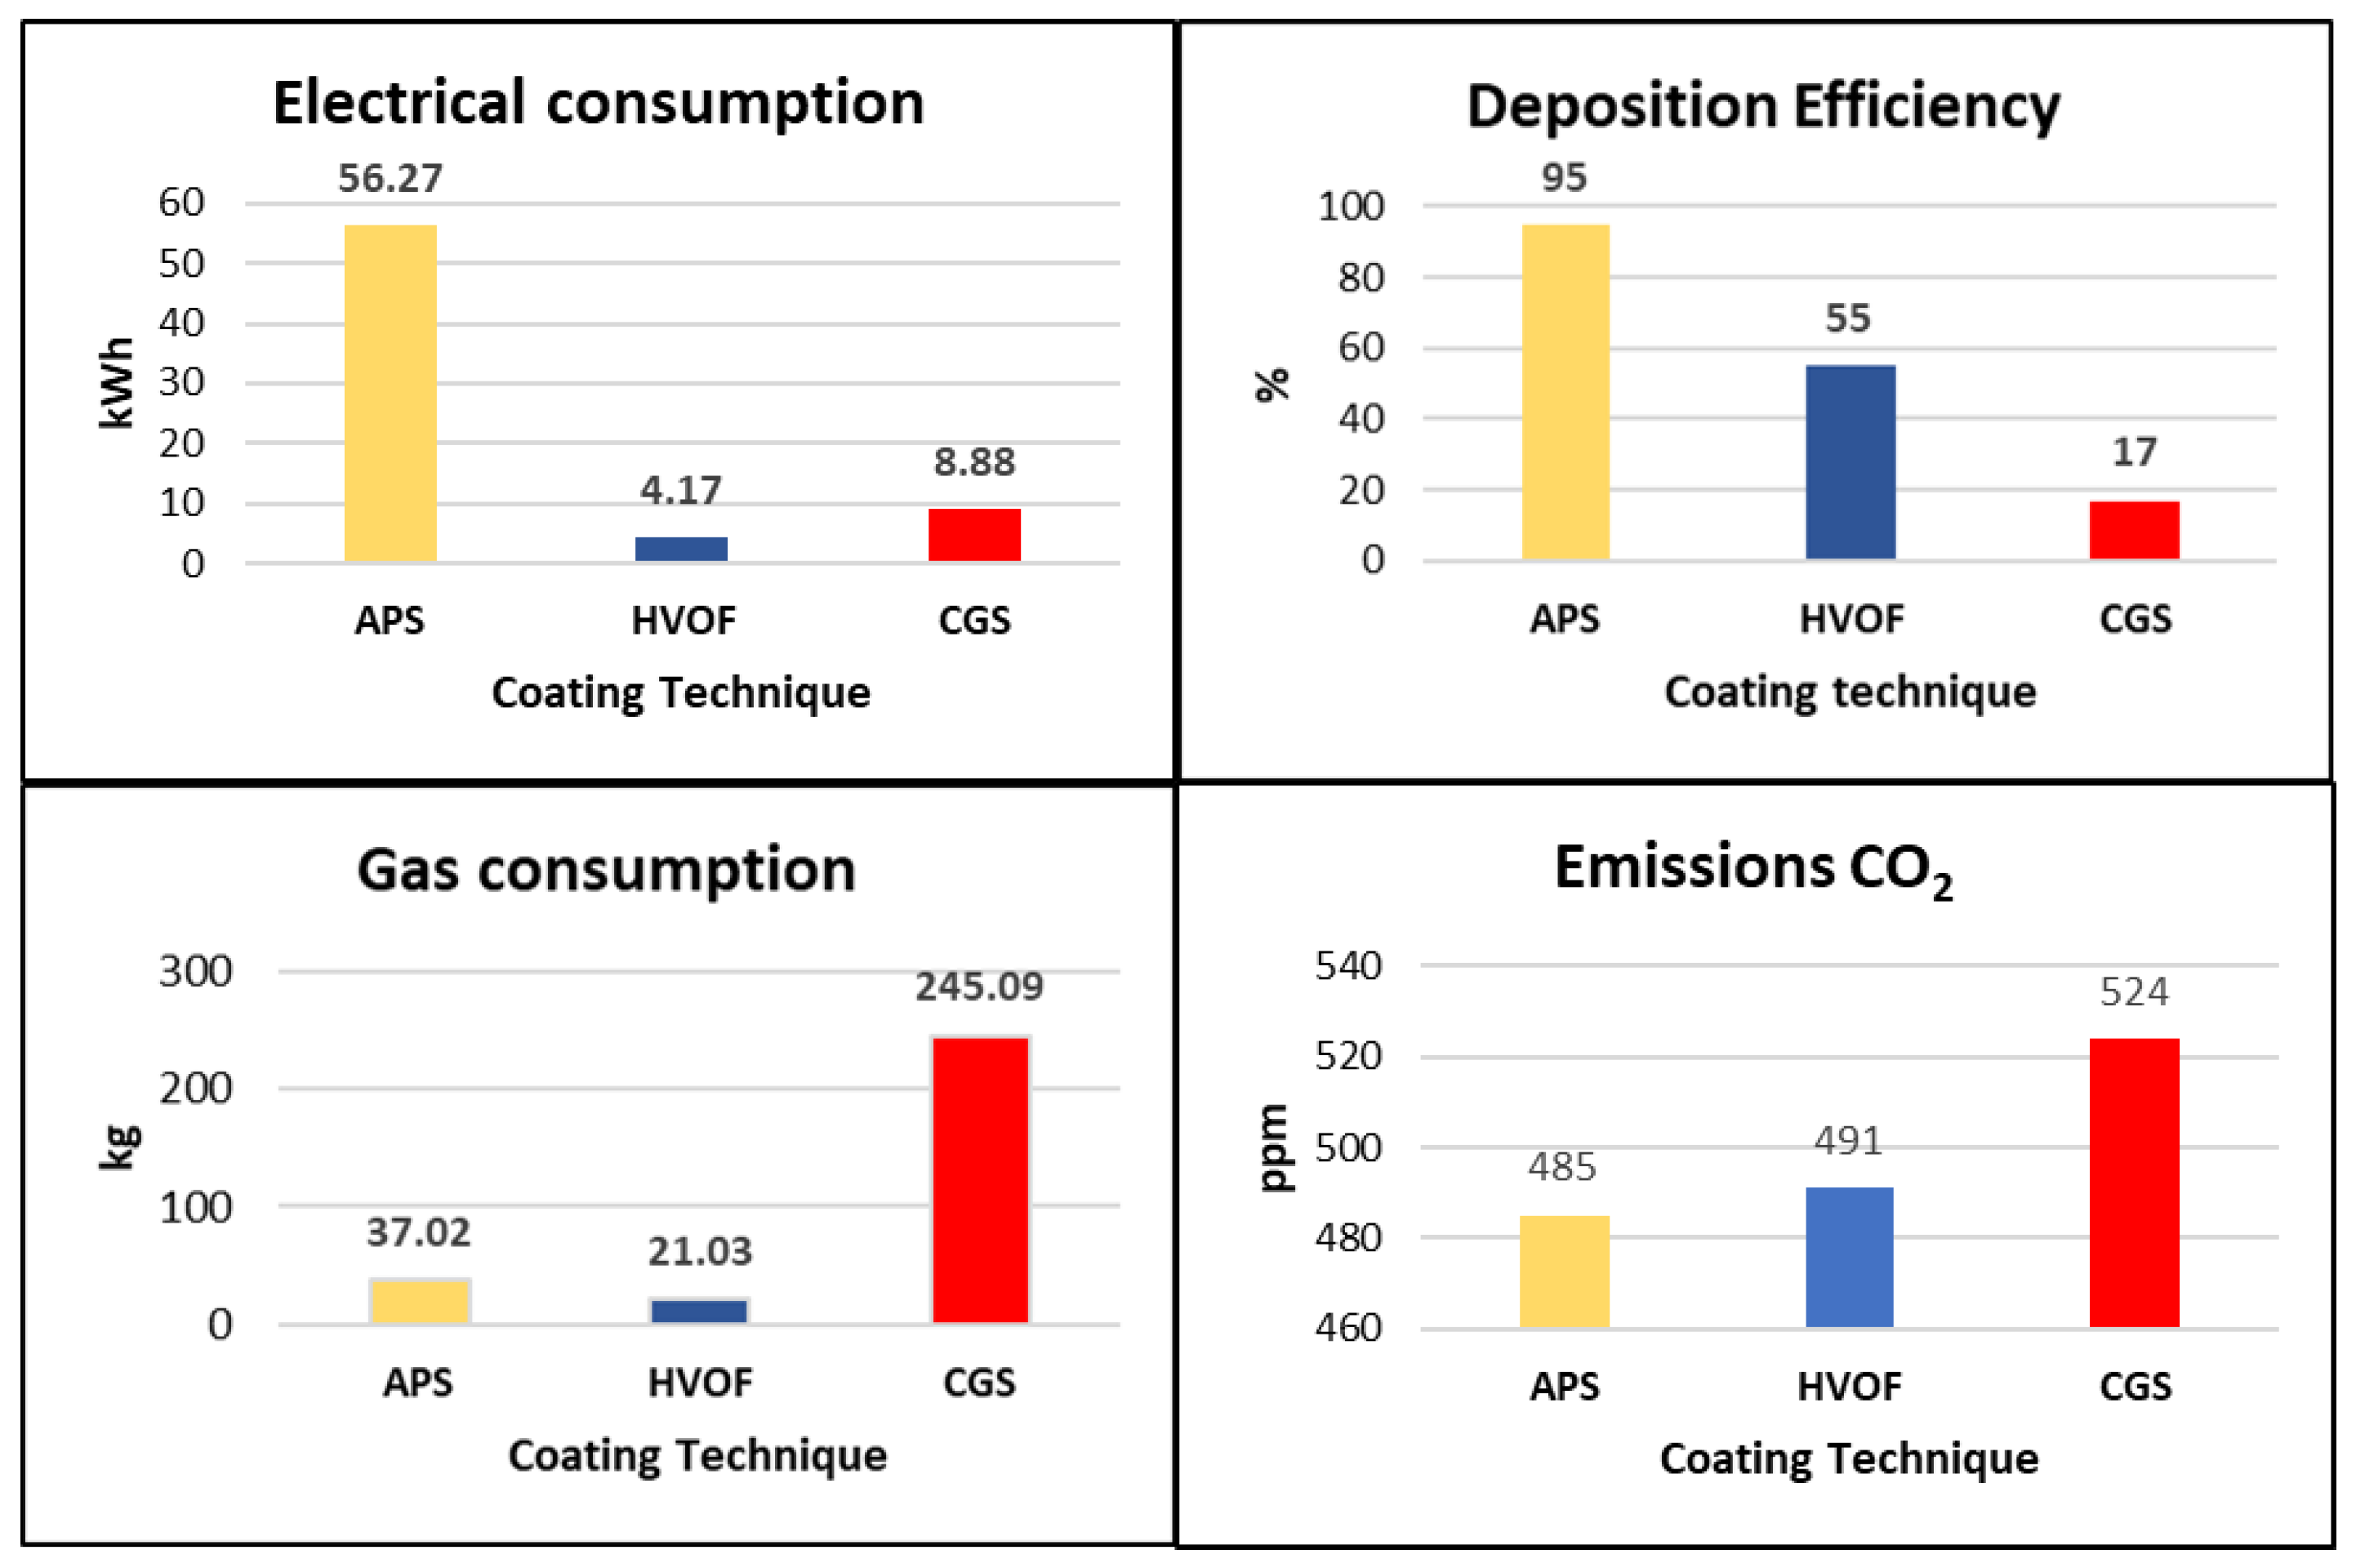
3.8. Comparison of Consumption and Emissions of APS, HVOF, and CGS Processes

Comparing the three WC-12Co powder coating technologies, we can observe significant differences in their power consumption, as seen in Figure 5. In terms of electricity consumption, the APS technology shows a high consumption, representing approximately 80% of the total, while the HVOF technology has a consumption that does not exceed 10%. The higher power consumption of the APS process can be attributed to the different energy source because APS utilizes a plasma torch, which generates a high-temperature plasma arc via the ionizing argon passing through it, while HVOF employs a combustion process using a mixture of H2 and O2. Moreover, APS works at higher temperatures than HVOF, generating higher heat losses during the deposition process. For this reason, APS requires additional power input to compensate for the heat losses and ensure the proper melting and deposition of the coating material. However, it is important to underline that the power requirements vary depending on the equipment used, the deposited material, and other process parameters such as gas flow or robot arm speed. The energy consumption of CGS is lower compared to APS and slightly higher compared to HVOF due to differences in operating conditions; in the CGS process, the temperature of the sprayed particles remains below the melting point of the deposited material because the process is based on accelerated solid particles using compressed N2, without significantly heating them. For this reason, CGS results in higher heating efficiency and lower energy requirements.
However, when analyzing powder consumption, the APS technology stands out as the most efficient, achieving a deposition efficiency of over 90%, as seen in Figure 5. On the other hand, CGS has a deposition efficiency below 20%, which makes it the least efficient in terms of powder consumption. These results are confirmed by the different thicknesses of the coatings: 450 ± 13 µm for APS, 250 ± 9 µm for HVOF, and 150 ± 14 µm for CGS. The deposition efficiency of CGS is lower compared to the APS and HVOF processes due to a fundamental factor; as mentioned below, in the CGS process, the deposition mechanism relies on kinetic energy transfer, and achieving a strong bond between the hard WC-12Co cold sprayed particles can be more challenging compared to APS and HVOF, which are based on higher temperatures and the melting of the sprayed particles. So, the lack of thermal softening or melting in CGS results in a lower deposition efficiency. Even if the CGS has lower deposition efficiency compared to APS and HVOF, it offers advantages in terms of lower heat input, reduced oxidation of the deposited coating, and the ability to spray temperature-sensitive materials.
Regarding gas consumption, CGS technology consumes more than 80%, while HVOF consumes less than 10%, as seen in Figure 5. Typically, CGS consumes a substantial amount of N2 because the carrier gas is crucial for achieving the required particle velocity and kinetic energy. It is worth underlining that the carrier gas is the primary driving force in the CGS process, while APS and HVOF processes are based on a plasma torch and combustion, respectively. HVOF technology consumes less gas than the other two technologies. All three processes show similar values in terms of noise levels. Although the equipment used in these processes have variations in design and functionality, they all incorporate components responsible for gas or plasma generation and particle acceleration. The noise level depends on the rapid expulsion of pressured gas or plasma, which creates a high-velocity flow of particles onto the substrate.
Based on the previous discussion and considering the matter from the LCI perspective, we can state that CGS might not be the most suitable technique for depositing a minimally deformable powder like WC-Co. The strengths of the CGS technique align better with metallic powders than with ceramics. Consequently, using metallic feedstock powder can achieve higher levels of deposition efficiency with less carrier gas consumption.
Moreover, metal powders that do not adhere to the steel substrate are captured during the coating processes using a fume hood equipped with a filter. This filter is replaced periodically, usually every six months, to ensure that it retains the powder efficiently. The fume hood and the regular replacement of the filter are intended to prevent these unattached powders from contaminating the working environment’s air, water, or soil. By capturing and retaining the powder, the dispersion of metal or ceramic particles is minimized, and the risk of negative impacts on air quality and environmental pollution is reduced. Controlling and managing undeposited powder contributes to maintaining a safer working environment and protecting the surrounding environment by ensuring that metal dusts are properly collected and do not cause pollution.

4. Conclusions

This LCI inventory covers all inputs and outputs in APS, HVOF, and CGS WC-12Cocoatings. In this research, the following conclusions were drawn:
  • For 1 m2 of WC-12Co coating, the CGS process is the costliest with respect to energy and resource consumption, while the APS process is the least costly one.
  • Considering the wear performance, the WC-12Co coating obtained via the HVOF process has the highest performance with the lowest wear rate, while the CGS coating has the highest wear rate.
  • The APS process, using an Ar/H2 mixture, consumes more electrical energy, but the deposition efficiency is higher, while the HVOF process consumes a large amount of H2, making the process costlier. It is important to note that this investigation focused solely on the HVOF technique using H2 as the fuel.
  • The lower plasticity and particle deformation produced via CGS result in poor deposition efficiency and higher carrier gas consumption.
  • Despite these valuable results, the study has its limitations; it is based on a single type of WC-12Co powder, which does not fully represent the range of APS, HVOF, and CGS coatings.
  • Economic evaluations will be carried out in future work. Further studies could be conducted to evaluate the life cycle costs (LCC) of the processes, improving our knowledge of the APS, HVOF, and CGS coatings industries.
  • With the support of Ecoinvent experts, the Thermal Spray Centre (CPT) has developed the LCI databases for these processes, which will be published in version 3.10 of the Ecoinvent database.

Author Contributions

Conceptualization: E.R.R., A.S. and I.G.C.; Methodology: E.R.R., A.S. and I.G.C.; Validation: E.R.R. and A.S.; Formal analysis: E.R.R., A.S., E.T.D., R.F.V. and I.G.C.; Investigation: E.R.R., A.S., E.T.D. and I.G.C.; Resources: A.S. and I.G.C.; Data curation: E.R.R., A.S. and E.T.D.; Writing—original draft preparation: E.R.R. and A.S.; Writing—review and editing: E.R.R., A.S. and R.F.V.; Supervision: A.S. and I.G.C.; Project administration: A.S. and I.G.C.; Funding acquisition: A.S. and I.G.C. All authors have read and agreed to the published version of the manuscript.

Funding

This research was funded by Grant PID 2021-128917NA-I00, by MCIN/AEI/10.13039/501100011033, and by the “European Union Next Generation EU/PRTR”. Funding Ph.D. Students: E.R.R. and E.T.D. were funded by COLCIENCIAS—Ministry of Science, Technology, and Innovation of Colombia, call for PhD applications 885-2020, and 906-2021, respectively.

Data Availability Statement

The raw data supporting the conclusions of this article will be made available by the authors on request.

Conflicts of Interest

The authors declare no conflicts of interest.

References

  1. Ke, Z.; Zheng, Y.; Zhang, G.; Ding, Q.; Zhang, J.; Wu, H.; Xu, X.; Lu, X.; Zhu, X. Microstructure and Mechanical Properties of Dual-Grain Structured WC-Co Cemented Carbides. Ceram. Int. 2019, 45, 21528–21533. [Google Scholar] [CrossRef]
  2. Yang, Y.; Zhang, C.; Wang, D.; Nie, L.; Wellmann, D.; Tian, Y. Additive Manufacturing of WC-Co Hardmetals: A Review. Int. J. Adv. Manuf. Technol. 2020, 108, 1653–1673. [Google Scholar] [CrossRef]
  3. Wang, H.; Qiu, Q.; Gee, M.; Hou, C.; Liu, X.; Song, X. Wear Resistance Enhancement of HVOF-Sprayed WC-Co Coating by Complete Densification of Starting Powder. Mater. Des. 2020, 191, 108586. [Google Scholar] [CrossRef]
  4. Venter, A.M.; Luzin, V.; Marais, D.; Sacks, N.; Ogunmuyiwa, E.N.; Shipway, P.H. Interdependence of Slurry Erosion Wear Performance and Residual Stress in WC-12wt%Co and WC-10wt%VC-12wt%Co HVOF Coatings. Int. J. Refract. Met. Hard Mater. 2020, 87, 105101. [Google Scholar] [CrossRef]
  5. Deen, K.M.; Afzal, M.; Liu, Y.; Farooq, A.; Ahmad, A.; Asselin, E. Improved Corrosion Resistance of Air Plasma Sprayed WC-12%Co Cermet Coating by Laser Re-Melting Process. Mater. Lett. 2017, 191, 34–37. [Google Scholar] [CrossRef]
  6. Ding, X.; Ke, D.; Yuan, C.; Ding, Z.; Cheng, X. Microstructure and Cavitation Erosion Resistance of HVOF Deposited WC-Co Coatings with Different Sized WC. Coatings 2018, 8, 307. [Google Scholar] [CrossRef]
  7. He, J.; Schoenung, J.M. A Review on Nanostructured WC-Co Coatings. Surf. Coat. Technol. 2002, 157, 72–79. [Google Scholar] [CrossRef]
  8. Singh, H.; Kumar, M.; Singh, R. Development of High Pressure Cold Spray Coatings of Tungsten Carbide Composites. Mater. Today Proc. 2023. [Google Scholar] [CrossRef]
  9. Klyastkina, E. Desarrollo y Caracterización de Recubrimientos Cerámicos Nanoestructurados Obtenidos Mediante Proyección Por Plasma Atmosférico. Ph.D. Thesis, Universitat Politècnica de València, Valencia, Spain, 2012; p. 236. [Google Scholar]
  10. Silvello, A.; Torres Diaz, E.; Rúa Ramirez, E.; Garcia Cano, I. Microstructural, Mechanical and Wear Properties of Atmospheric Plasma-Sprayed and High-Velocity Oxy-Fuel AlCoCrFeNi Equiatomic High-Entropy Alloys (HEAs) Coatings. J. Therm. Spray Technol. 2023, 32, 425–442. [Google Scholar] [CrossRef]
  11. Bochenek, K.; Węglewski, W.; Strojny-Nędza, A.; Pietrzak, K.; Chmielewski, T.; Chmielewski, M.; Basista, M. Microstructure, Mechanical, and Wear Properties of NiCr-Re-Al2O3 Coatings Deposited by HVOF, Atmospheric Plasma Spraying, and Laser Cladding. J. Therm. Spray Technol. 2022, 31, 1609–1633. [Google Scholar] [CrossRef]
  12. Vaz, R.F.; Sucharski, G.B.; Chicoski, A.; Siqueira, I.B.A.F.; Tristante, R.; Pukasiewicz, A.G.M. Comparison of FeMnCrSi Cavitation Resistance Coatings Deposited by Twin-Wire Electric Arc and High-Velocity Oxy-Fuel Processes. J. Therm. Spray Technol. 2021, 30, 754–771. [Google Scholar] [CrossRef]
  13. Vaz, R.F.; Silveira, L.L.; Cruz, J.R.; Pukasiewicz, A.G.M. Cavitation Resistance of FeMnCrSi Coatings Processed by Different Thermal Spray Processes. Hybrid Adv. 2024, 5, 100125. [Google Scholar] [CrossRef]
  14. Liu, J.; Wang, L.; Li, F.; Ran, X.; Peng, X. Life Cycle Inventory of NiCrAl/NiCr-Cr3C2 Composite Coatings for Plasma Spraying Process. Procedia Manuf. 2020, 43, 559–566. [Google Scholar] [CrossRef]
  15. Furberg, A.; Arvidsson, R.; Molander, S. Environmental Life Cycle Assessment of Cemented Carbide (WC-Co) Production. J. Clean. Prod. 2019, 209, 1126–1138. [Google Scholar] [CrossRef]
  16. Moign, A.; Vardelle, A.; Themelis, N.J.; Legoux, J.G. Life Cycle Assessment of Using Powder and Liquid Precursors in Plasma Spraying: The Case of Yttria-Stabilized Zirconia. Surf. Coat. Technol. 2010, 205, 668–673. [Google Scholar] [CrossRef]
  17. Zhang, C.; Chu, Z.; Wei, F.; Qin, W.; Yang, Y.; Dong, Y.; Huang, D.; Wang, L. Optimizing Process and the Properties of the Sprayed Fe-Based Metallic Glassy Coating by Plasma Spraying. Surf. Coat. Technol. 2017, 319, 1–5. [Google Scholar] [CrossRef]
  18. Merlo, A.; Duminica, F.; Daniel, A.; Léonard, G. Techno-Economic Analysis and Life Cycle Assessment of High-Velocity Oxy-Fuel Technology Compared to Chromium Electrodeposition. Materials 2023, 16, 3678. [Google Scholar] [CrossRef] [PubMed]
  19. Vardelle, A.M. LCA F18 Hard Chrome and HVOF Coating. In Proceedings of the International Thermal Spray Conference and Exposition 2008—ASM Thermal Spray Society, Maastricht, The Netherlands, 2–4 June 2008. [Google Scholar]
  20. Viscusi, A.; Perna, A.S.; Astarita, A. A Preliminary Study on the Sustainability of Metallization of Polymer Matrix Composites through Cold Spray. J. Mater. Eng. Perform. 2023, 32, 3888–3895. [Google Scholar] [CrossRef]
  21. Ferrari, A.M.; Volpi, L.; Settembre-Blundo, D.; García-Muiña, F.E. Dynamic Life Cycle Assessment (LCA) Integrating Life Cycle Inventory (LCI) and Enterprise Resource Planning (ERP) in an Industry 4.0 Environment. J. Clean. Prod. 2021, 286, 125314. [Google Scholar] [CrossRef]
  22. Islam, S.; Ponnambalam, S.G.; Lam, H.L. Review on Life Cycle Inventory: Methods, Examples and Applications. J. Clean. Prod. 2016, 136, 266–278. [Google Scholar] [CrossRef]
  23. Swarr, T.E.; Hunkeler, D.; Klöpffer, W.; Pesonen, H.L.; Ciroth, A.; Brent, A.C.; Pagan, R. Environmental Life-Cycle Costing: A Code of Practice. Int. J. Life Cycle Assess. 2011, 16, 389–391. [Google Scholar] [CrossRef]
  24. Sonemann, G.; Vigon, B.; Rack, M.; Valdivia, S. Global guidance principles for life cycle assessment databases: Development of training material and other implementation activities on the publication. Int. J. Life Cycle Assess. 2013, 18, 1169–1172. [Google Scholar] [CrossRef]
  25. Ecoinvent Impact Assessment. Available online: https://ecoinvent.org/the-ecoinvent-database/impact-assessment/ (accessed on 11 February 2024).
  26. Wernet, G.; Bauer, C.; Steubing, B.; Reinhard, J.; Moreno-Ruiz, E.; Weidema, B. The Ecoinvent Database Version 3 (Part I): Overview and Methodology. Int. J. Life Cycle Assess. 2016, 21, 1218–1230. [Google Scholar] [CrossRef]
  27. ASTM B822-02; Standard Test Method for Particle Size Distribution of Metal Powders and Related Compounds by Laser Scattering. ASTM International: West Conshohocken, PA, USA, 2002.
  28. ASTM E1920-03; Standard Guide for Metallographic Preparation of Thermal Sprayed Coatings. ASTM International: West Conshohocken, PA, USA, 2021.
  29. ASTM E2109-01; Standard Test Methods for Determining Area Percentage Porosity in Thermal Sprayed Coatings. ASTM International: West Conshohocken, PA, USA, 2021.
  30. ISO 17836:2004; Thermal Spraying—Determination of Deposition Efficiency for Thermal Spraying. ISO: Geneva, Switzerland, 2004.
  31. ASTM C633-13; Standard Test Method for Adhesion or Cohesion Strength of Thermal Spray Coatings. ASTM International: West Conshohocken, PA, USA, 2021.
  32. ASTM G99-17; Standard Test Method for Wear Testing with a Pin-on-Disk Apparatus. ASTM International: West Conshohocken, PA, USA, 2017.
  33. ASTM G65-16; Standard Test Method for Measuring Abrasion Using the Dry Sand Rubber Wheel Apparatus. ASTM International: West Conshohocken, PA, USA, 2021.
  34. Ecoinvent Database Ecoinvent Database UPR, LCI & LCIA. Available online: https://ecoinvent.org/the-ecoinvent-database/upr-lci-lcia/ (accessed on 11 February 2024).
  35. Ardila Téllez, L. Fabricación y Caracterización de Carburos de Wolframio WC-X (X = Co, Ni) Obtenidos Por Vía Pulvimetalúrgica//F. Ing. Mecánica 2016, 20, 6–13. [Google Scholar]
  36. Poza, P.; Garrido-Maneiro, M.Á. Cold-Sprayed Coatings: Microstructure, Mechanical Properties, and Wear Behaviour. Prog. Mater. Sci. 2022, 123, 100839. [Google Scholar] [CrossRef]
  37. Assadi, H.; Kreye, H.; Gärtner, F.; Klassen, T. Cold Spraying—A Materials Perspective. Acta Mater. 2016, 116, 382–407. [Google Scholar] [CrossRef]
  38. Voyer, J.; Marple, B.R. Sliding Wear Behavior of High Velocity Oxy-Fuel and High-Power Plasma Spray-Processed Tungsten Carbide-Based Cermet Coatings. Wear 1999, 225–229, 135–145. [Google Scholar] [CrossRef]
  39. Al-Mutairi, S.; Hashmi, M.S.J.; Yilbas, B.S.; Stokes, J. Microstructural Characterization of HVOF/Plasma Thermal Spray of Micro/Nano WC-12%Co Powders. Surf. Coat. Technol. 2015, 264, 175–186. [Google Scholar] [CrossRef]
  40. Kim, K.W.; Kale, A.B.; Cho, Y.H.; Park, S.H.; Lee, K.A. Microstructural and Wear Properties of WC-12Co Cemented Carbide Fabricated by Direct Energy Deposition. Wear 2023, 518–519, 204653. [Google Scholar] [CrossRef]
  41. Ma, X.; Qi, C.; Ye, L.; Yang, D.; Hong, J. A Case Study in China. J. Clean. Prod. 2017, 149, 936–944. [Google Scholar] [CrossRef]
Figure 1. UPR, LCI, and LCIA unit process scheme.
Metals 14 00431 g001
Figure 2. SEM image of WC-12Co feedstock powder at (a) low and (b) high magnification. (c) Particle size distribution. (d) XRD diffractograms of feedstock powder and coatings.
Metals 14 00431 g002
Figure 3. OM images of (a,b) APS, (c,d) HVOF, and (e,f) CGS coating.
Metals 14 00431 g003
Figure 4. Ball-on-disk wear track on (a) APS, (b) HVOF, and (c) CGS coating.
Metals 14 00431 g004
Figure 5. Electrical consumption, deposition efficiency, gas consumption, and CO2 emissions of APS, HVOF, and CGS coating.
Metals 14 00431 g005
Table 1. Coating deposition processes parameters.
ParameterAPSHVOFCGS
Current [A]700
Voltage [V]65
Ar flow [L/min]65
H2 flow [L/min]3635
O2 flow [L/min] 262
Compressed air flow [L/min] 329
Powder carrier gas flow [L/min]21151
N2 flow [L/min] 1260
N2 pressure [MPa] 3.5
N2 temperature [°C] 800
Standoff distance [mm]13022520
Robot speed [mm/s]500500250
Powder feeding stir [rpm]30
Powder feeding [g/min] 30
Step [mm]11110.75
Number of layers45214
Table 2. Coating properties and performance.
CoatingThickness
[µm]
Hardness
[HV0.3]
Porosity
[%]
Adhesion
[MPa]
Ball-on-Disk CoFBall-on-Disk Wear Rate [mm3/Nm]Ball-on-Disk Volume Loss [mm3]Rubber Wheel Wear Rate [mm3/Nm]
APS450 ± 121197 ± 93562 ± 40.58 ± 0.308.39 × 10−60.209786.46 × 10−5
HVOF250 ± 81164 ± 99258 ± 10.29 ± 0.130.39 × 10−60.009804.05 × 10−5
CGS150 ± 141281 ± 57437 ± 30.96 ± 0.1716.40 × 10−60.4099914.28 × 10−5
Table 3. LCI of abrasive sandblasting. Reference product 1 m2 coating.
Exchange NameActivityAmount
Electricity, medium voltage [kWh]Market group for electricity, medium voltage14.667
Compressed air, 600 kPa gauge [m3]Market for compressed air, 600 kPa gauge, RoW81.73882
Compressed air, 600 kPa gauge [m3]Market for compressed air, 600 kPa gauge, Europe33.26118
Al2O3, non-metallurgical [kg]Market for Al2O3, non-metallurgical, ROW0.855213
Al2O3, non-metallurgical [kg]Market for Al2O3, non-metallurgical EU27 and EFTA0.144787
Steel, low-alloyed [kg]Market for steel, low-alloyed0.01
Inert waste [kg]Market for inert waste, RoW−0.78529
Inert waste [kg]Market for inert waste, Europe−0.22279
Inert waste [kg]Market for inert waste, CH−0.00192
Emissions CO2 [ppm] 495
Emissions CO [ppm] 0
Noise [dB] 90
Table 4. LCI of APS process. Reference product 1 m2 coating.
Exchange NameActivityAmount
Ar, liquid [kg]Market for Ar, liquid30.57935
WC-12Co powder [kg]Market for WC-12Co powder1.8947
Electricity, medium voltage [kWh]Market group for electricity, medium voltage56.27
Ar, liquid [kg]Market for Ar, liquid6.441654
H2, liquid [kg]Market for H2, liquid, RoW0.043495
Hazardous waste for underground deposit [kg]Market for hazardous waste for underground deposit, RoW−0.089
H2, liquid [kg]Market for H2, liquid, Europe0.009505
Hazardous waste [kg]Market for hazardous waste for underground deposit, Europe−0.00573
Deposition efficiency [%] 95
Thickness [μm] 450
Emissions CO2 [ppm] 485
Emissions CO [ppm] 0
Noise [dB] 105
Table 5. LCI of HVOF process. Reference product 1 m2 coating.
Exchange NameActivityAmount
WC-12Co powder [kg]Market for WC-12Co powder1.818
O2, liquid [kg]Market for O2, liquid17.63277
H2, liquid [kg]Market for H2, liquid, RoW2.793552
Compressed air, 800 kPa gauge [m3]Market for compressed air, 800 kPa gauge18.17587
Electricity, medium voltage [kWh]Market group for electricity, medium voltage4.17
O2, liquid [kg]Market for O2, liquid4.838233
H2, liquid [kg]Market for H2, liquid, Europe0.610448
Compressed air, 800 kPa gauge [m3]Market for compressed air, 800 kPa gauge7.396128
Hazardous waste [kg]Market for hazardous waste for underground deposit, RoW−0.76859
Hazardous waste for underground deposit [kg]Market for hazardous waste for underground deposit, Europe−0.04951
Deposition efficiency [%] 55
Thickness [μm] 250
Emissions CO2 [ppm] 491
Emissions CO [ppm] 0
Noise [dB] 107
Table 6. LCI of CGS process. Reference product 1 m2.
Exchange NameActivityAmount
N2, liquid [kg]Market for N2, liquid, RoW245.099
WC-12Co powder [kg]Market for WC-12Co powder3.529
N2, liquid [kg]Market for N2, liquid, Europe67.27803
Electricity, medium voltage [kWh]Market group for electricity, medium voltage8.88
Hazardous waste [kg]Market for hazardous waste for underground deposit, RoW−2.75182
Hazardous waste for underground deposit [kg]Market for hazardous waste for underground deposit, Europe−0.17725
N2 [kg] 312.377
Deposition efficiency [%] 17
Thickness [μm] 150
Emissions CO2 [ppm] 482
Emissions CO [ppm] 0
Noise [dB] 103
Disclaimer/Publisher’s Note: The statements, opinions and data contained in all publications are solely those of the individual author(s) and contributor(s) and not of MDPI and/or the editor(s). MDPI and/or the editor(s) disclaim responsibility for any injury to people or property resulting from any ideas, methods, instructions or products referred to in the content.

