Article

Poisson’s Ratio of Selected Metallic Materials in the Elastic–Plastic Region

by
Vladimír Chmelko
1,*,
Tomáš Koščo
1,
Miroslav Šulko
1,
Matúš Margetin
1 and
Jaroslava Škriniarová
2
1
Institute of Applied Mechanics and Mechatronics, Slovak University of Technology in Bratislava, Námestie Slobody 17, 81231 Bratislava, Slovakia
2
Institute of Informatics, Slovak Academy of Sciences, Dúbravská Cesta 9, 84507 Bratislava, Slovakia
*
Author to whom correspondence should be addressed.
Metals 2024, 14(4), 433; https://doi.org/10.3390/met14040433
Submission received: 26 February 2024 / Revised: 30 March 2024 / Accepted: 5 April 2024 / Published: 7 April 2024
(This article belongs to the Special Issue Mechanical Behaviors and Damage Mechanisms of Metallic Materials)

Abstract

:
Poisson’s ratio is one of the fundamental characteristics in the material models that are used. In engineering practice, its values are assumed to be constant in the elastic and in the plastic region. In this paper, the conventionally used values of this number for steel materials and aluminum alloys are confronted with experimental results. By using non-contact strain measurements with the DIC (digital image correlation) method, the evolution of the Poisson ratio value in the regions of transition from the elastic to the plastic region as well as in the regions of large plastic deformations was documented. The obtained experimental results are graphically compared using the proposed strain scaling. The gradient of the Poisson ratio changes in the vicinity of the yield stress is significant, indicating the need for a refinement of the material models in this region. Deviations from the conventionally used value of this number were found in the large plastic deformation region. In conclusion, a possible approach for improving the accuracy of simulations in FEM softwares was formulated.

1. Introduction

Poisson’s ratio was defined by Siméon-Denis Poisson in one of his lectures almost 200 years ago. It expresses the relationship between deformations in mutually perpendicular directions and is used in engineering practice, mainly as the negative ratio of transverse taper to longitudinal elongation expressed by the following equations:
υ y x = ε y ε x ;   υ z x = ε z ε x
where the strains in each direction are defined for the volume element εx = Δdx/dx, εy = Δdy/dy and εz = Δdz/dz—as is evident from Figure 1.
Metals as materials crystallizing in a cubic atomic lattice are considered isotropic in engineering practice. Poisson’s ratio and other mechanical properties are therefore assumed to be the same in all directions in the calculations. For steel materials, engineering practice uses a value in the interval ν = 0.27–0.3 (most commonly 0.3) in the elastic region and ν = 0.5 in the plastic region.
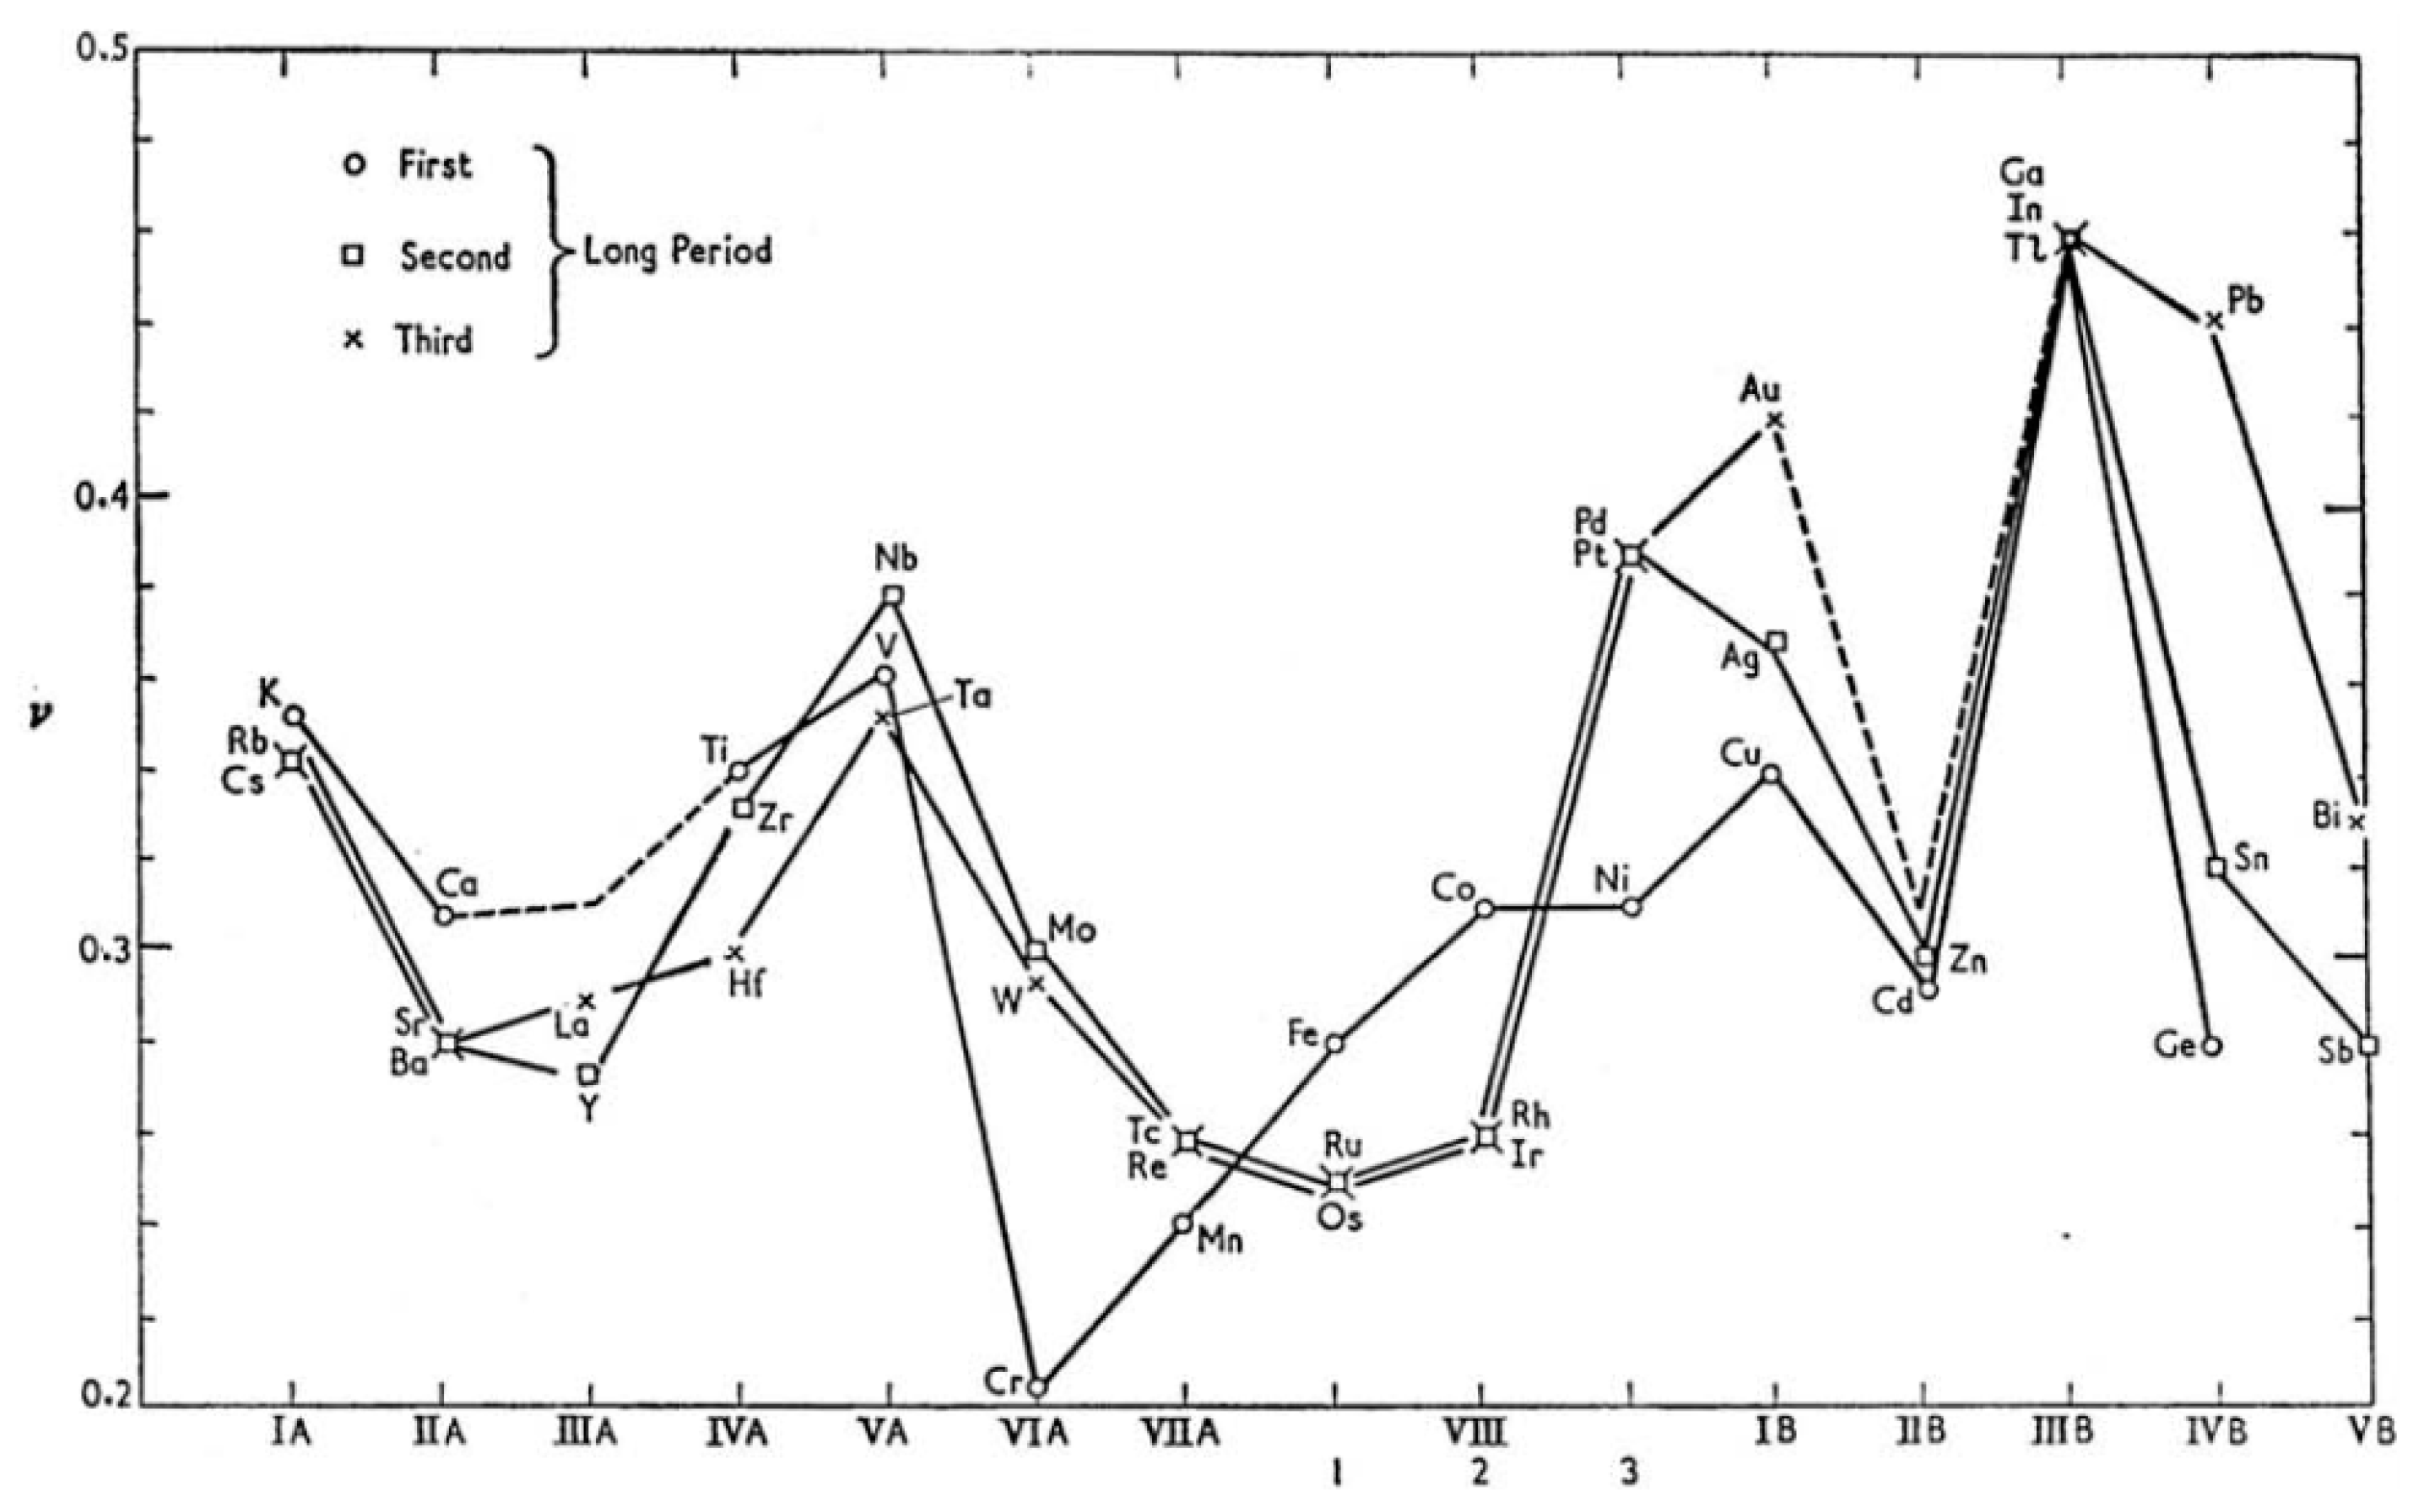
However, the establishment of these values was difficult and took a relatively long time [1]. When Poisson described his ν ratio in 1827 [2], his thinking was still based on the concept of the molecular structure of substances, which was based on Newton’s corpuscular hypothesis of interacting molecules and was developed in Poisson’s time by the Frenchman Laplace and his Societé d’Arcueil. Poisson and other scientists at the time assumed that all substances had this same ratio because of their molecular structure. This led to a simplified theory of a unique constant with a universal value of ν = 1/4. This value happened to agree with the new but, as it turned out, inaccurate experiments on brass [3]. It was only between 1850 and 1870, as more materials were investigated and measurements became more accurate and reliable, that Poisson’s ratio was changed to a multivalued one, in accordance with the newly formulated continuum theory of Cauchy [4]. In the middle of the 20th century, with the discovery of the crystallographic structure of substances and the development of electron microscopy, the understanding of the Poisson ratio also became established and its exact values for individual materials were determined (see Figure 2) [5].
The first experimental measurements of Poisson’s ratio were based on the determination of the change in volume as the material elongated. The change in volume was measured by immersing a stretched wire in a narrow tube of water and observing the change in the volume of water in the tube (Cagniard de la Tour [3]). After the development of the elastic continuum theory, the Poisson ratio was determined by a more precise measurement of Young’s modulus in tension and torsion (Kirchhoff [6]) using the relation
ν = E 2 G 1
Later, around 1900, Grüneisen developed the method of precision interferometry to measure the Poisson ratio [7].
Nowadays, the value of the Poisson ratio can be obtained by measuring deformations in general by any known measurement method-resistive strain gauges, optical FBG sensors, ESPI optical interferometry, the DIC optical digital image correlation method, etc. [8,9]. For the experimental determination of the Poisson ratio value, biaxial extensometers, based on the use of resistive strain gauges, are currently the most commonly used [10,11,12,13]. Although elongation is measured over a length given by the gauge length of the sensor and the transverse constriction over the entire diameter of the specimen, the determination of the Poisson ratio can be considered physically unambiguous by using simultaneous measurements of the relative elongation and the relative constriction in the elastic region.
There are relatively few reports in the literature on Poisson ratio measurements in the elastic–plastic region [14,15]. There is a lack of information on its evolution from a value of 0.3 in the elastic region to a value of 0.5 in the plastic region. The development of non-contact strain measurements using the DIC method opens new possibilities also for the determination of Poisson’s ratio on test specimens of non-circular cross-sections. It also allows elongation measurements on the same basis in both longitudinal and transverse directions.

2. Materials and Methods

The Institute of Applied Mechanics and Mechatronics has been working on the applications of the DIC method for deformation measurements for almost a decade. The instrumentation of the apparatus for measuring strains with the required accuracy in indentations and on materials not allowing contact strain measurement led to the development of a methodology for measuring the entire range of strains (including large strains). All experimental results in this study are the outputs of the use of the DANTEC Q-450 system with two Baumer cameras (Baumer) and Istra 4D software version 4.4. This study focuses on steel materials representing their full range—the low-carbon structural steel S355 and its equivalent X52 used for the production of piping—the higher-carbon steel C55 and the high-strength steel 42CrMo4. This range is complemented by the high-strength steel MS1 produced by additive manufacturing and the frequently used aluminum alloy AlSi10Mg produced by conventional casting. The basic parameters of these materials, including their chemical compositions, are displayed in Table 1.
Non-contact strain measurements by cameras using the DIC method and the ability to measure true stress and true strain allowed the use of different specimen shapes (as shown in Figure 3) without the accuracy of the results being affected.
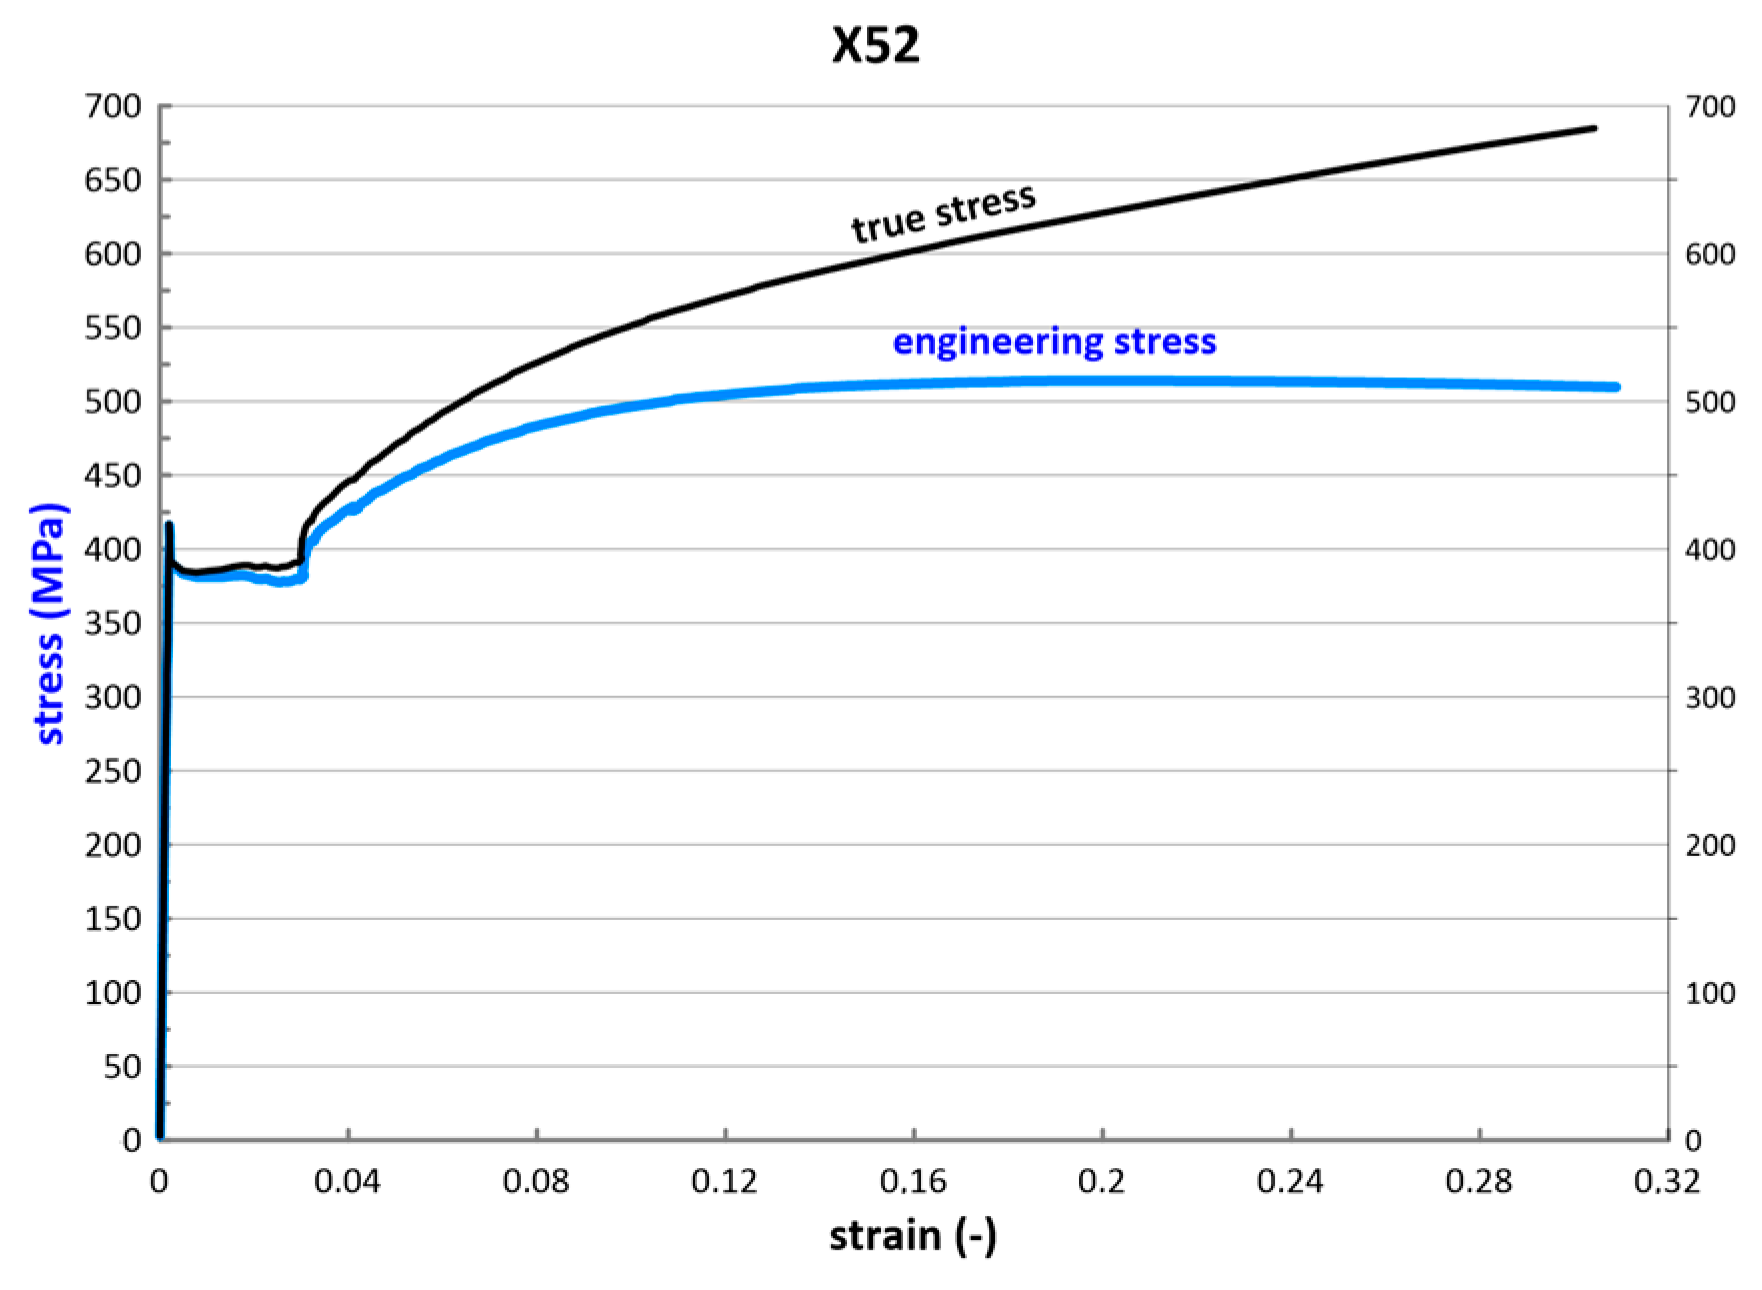
In the process of clamping the test specimens, the additional deformations occurring in the clamping jaws of the measuring machine were minimized, thanks to the fact that the optical measurement of the deformations by means of DIC allowed their visualization directly during the clamping process. The elongation measurement was evaluated for the engineering tensile diagram over a length of approximately 10mm in the longitudinal direction of the specimens. For the Poisson ratio measurement, it was necessary to measure the transverse strain simultaneously, which the DIC method allows. Both longitudinal and transverse strains were evaluated on the same lengths (the size of the image field from which the relative strains were exported was the same for both directions). The evaluation of the strain was performed as an average value over a larger area of the deformation field (the area was approximately 20 mm in length across the width of the specimens) to suppress the noise arising from the evaluation of the transformations. The advantage of the DIC method in allowing the measurement of the entire displacement field was used to evaluate the evolution of the instantaneous cross-sectional area as the specimen elongated. This enabled a tensile diagram to be plotted also for the actual stress and strain (Figure 4). The instantaneous cross-sectional shape could be reliably obtained by the two cameras for half of the circumference of both circular and rectangular cross-section specimens, with the other half of the cross-section being considered symmetrical.
Many years of experience with strain measurements using the DIC method have made it possible to obtain reliable results. When the key DIC parameters are set appropriately (pattern, illumination, position and resolution of the cameras, size of the recording area, etc. [16]), only the noise arising in the comparison of the digital image—which may not always be evenly distributed on both sides of the correct shade—affects the negative results. Apart from the image correlation tools, the results were not otherwise modified in the evaluation software.
Poisson’s ratio values could only be correctly determined up to the magnitude of elongation at which the neck was formed. The localization of the plastic deformation made it impossible to consider the strain as uniaxial from this point on; therefore, the Poisson ratio was not evaluated further.

3. Results

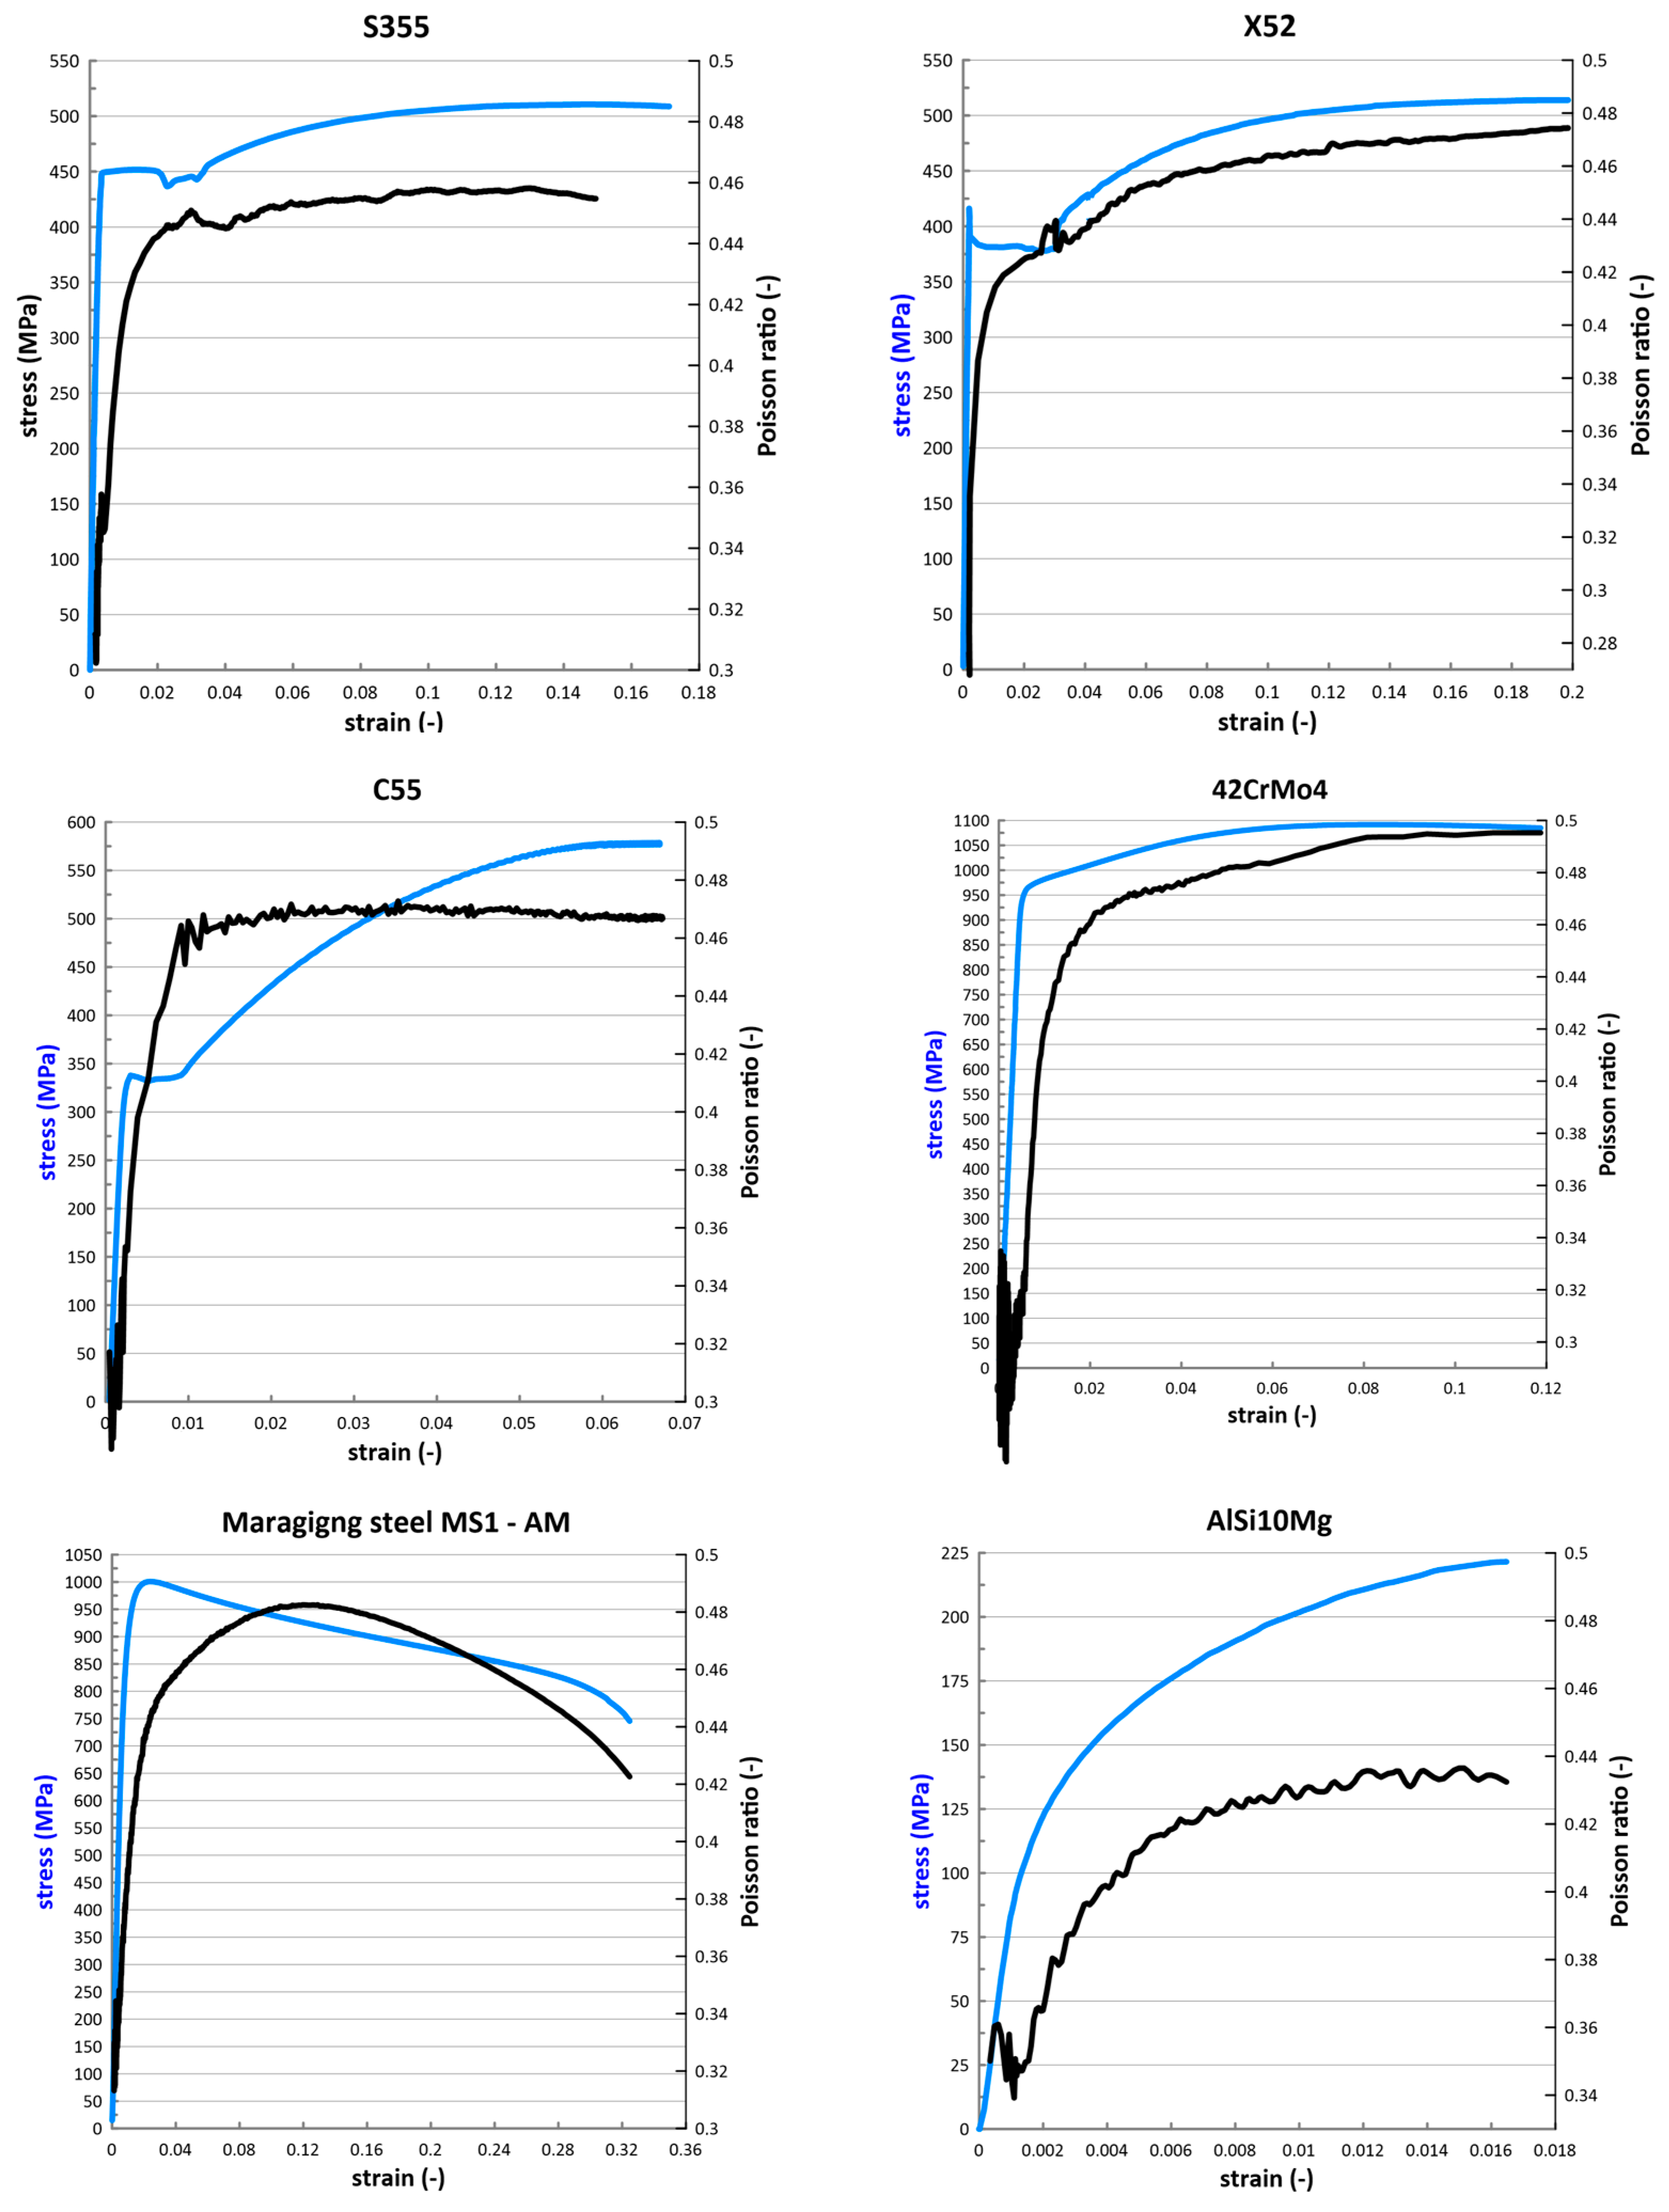
The obtained results are presented successively for each material in the form of a tensile diagram together with the evolution of Poisson’s ratio as a function of the magnitude of the strain. The diagrams are shown sequentially in Figure 5.
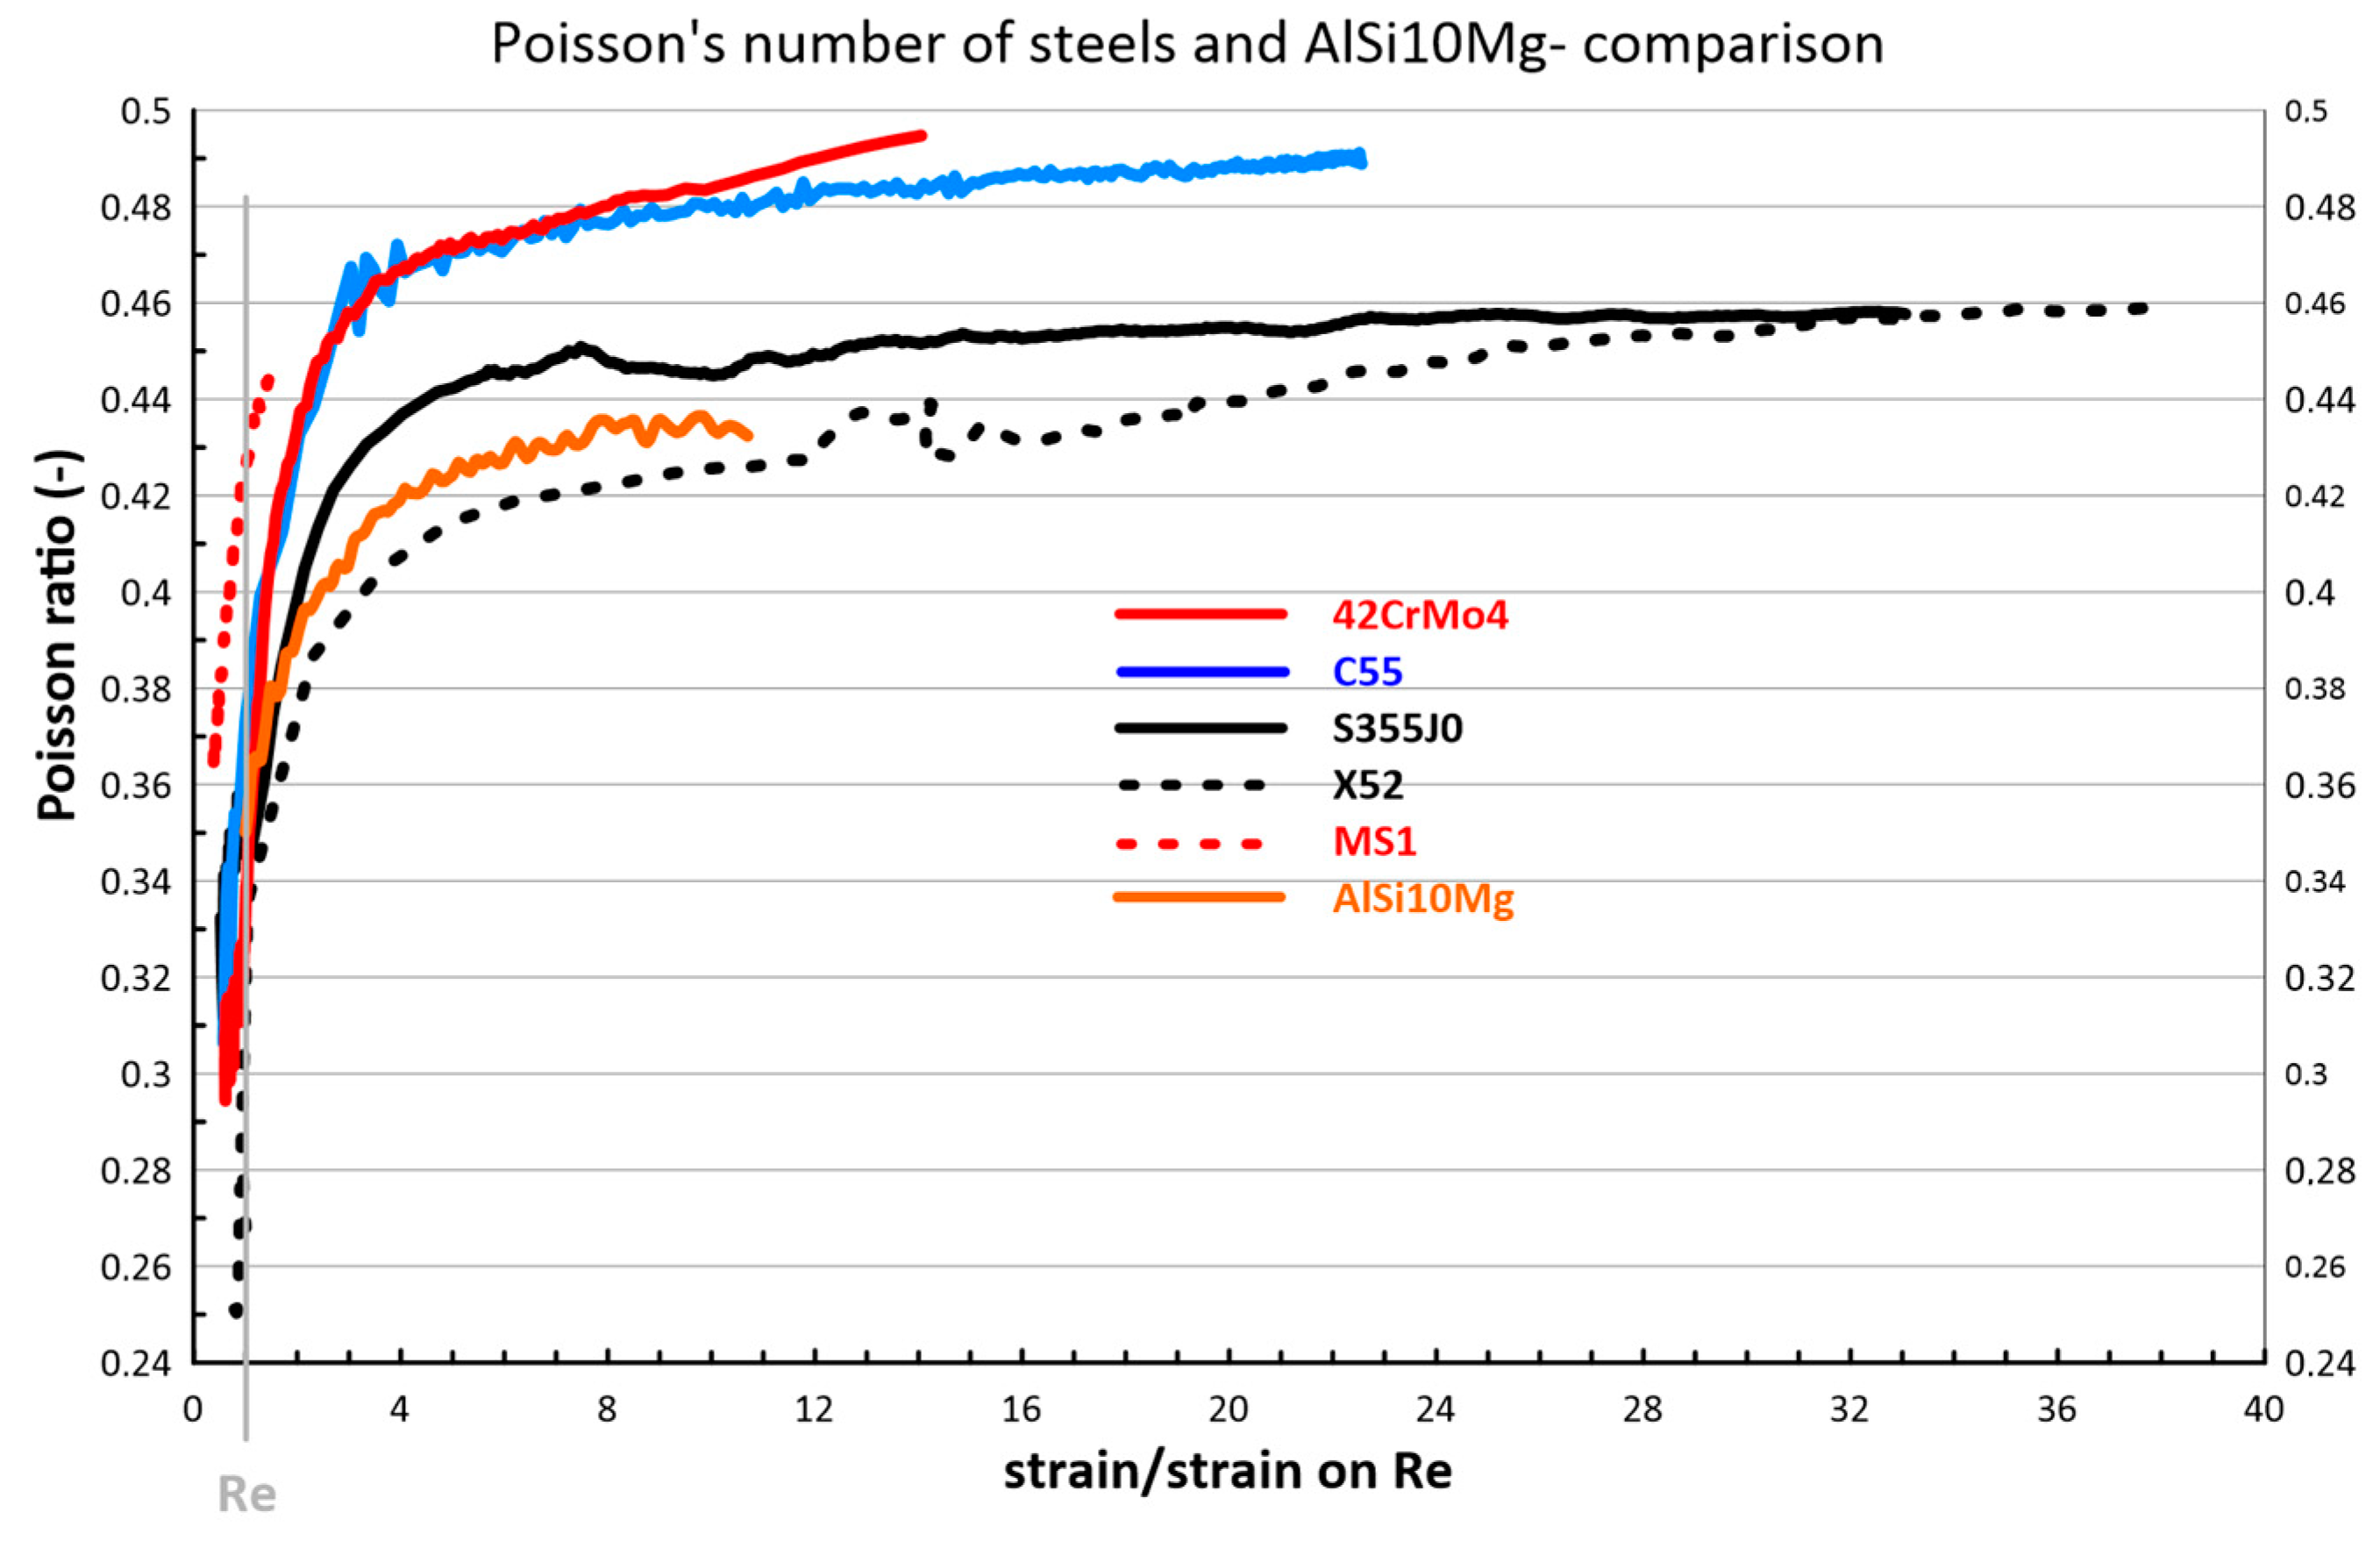
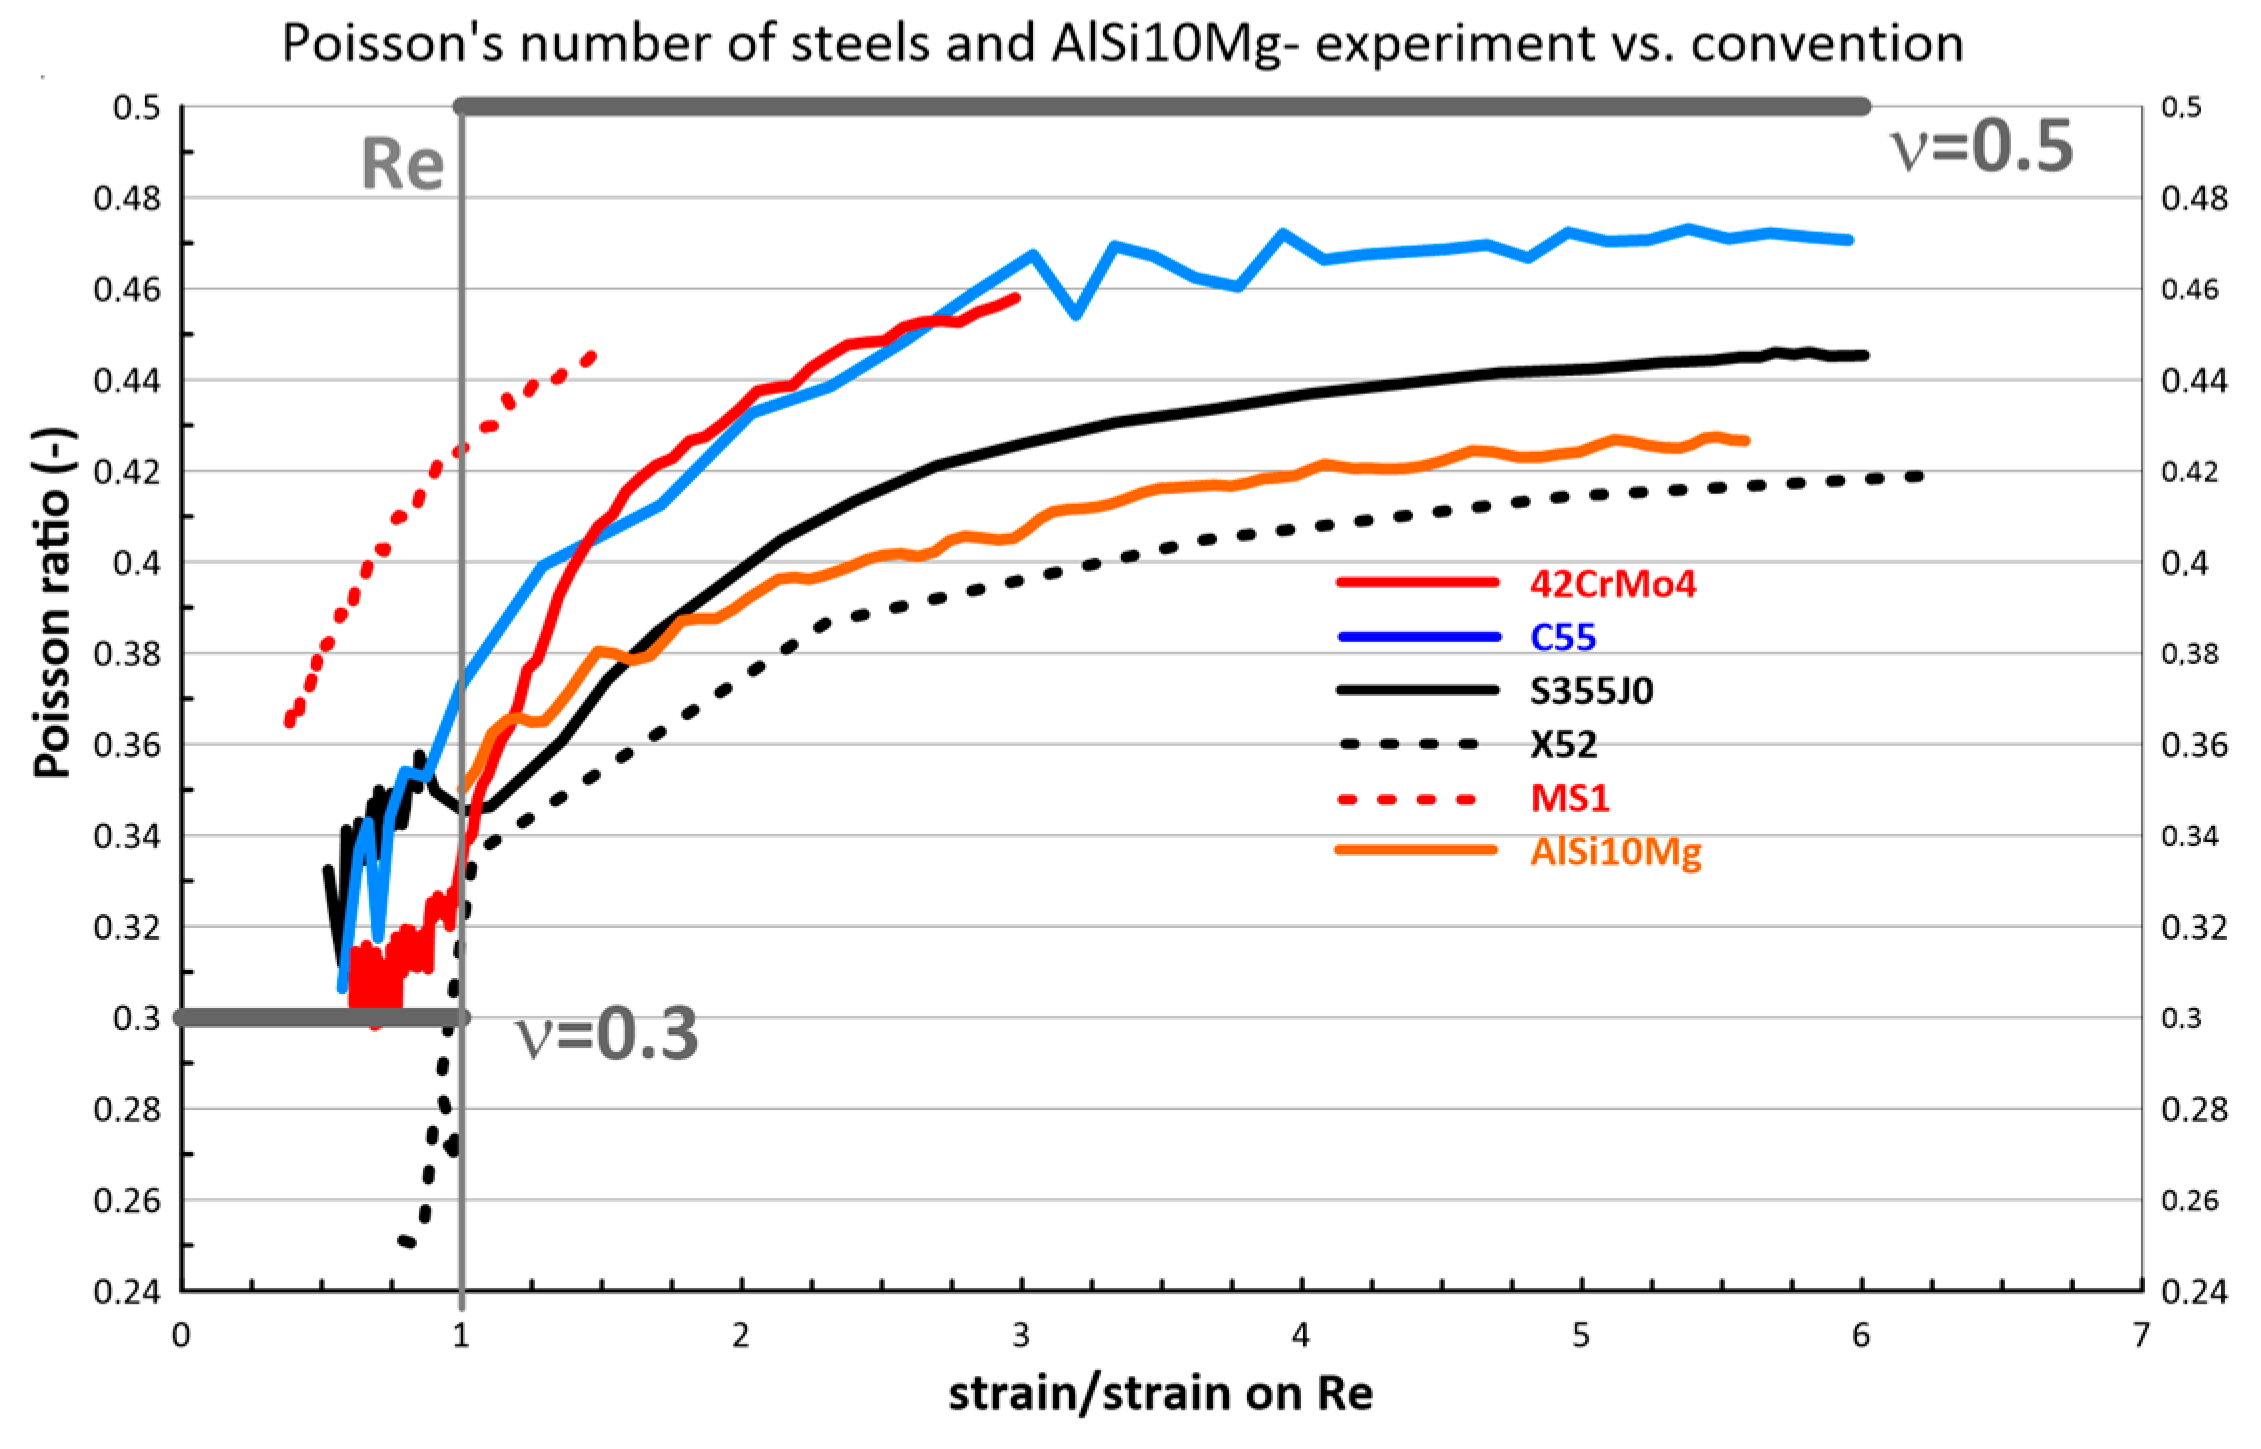
From all the diagrams in Figure 5, it can be seen from the evolution of Poisson’s ratio that it changes significantly much earlier than when yield stress is reached. Table 1 shows Poisson’s ratio values for the measured materials as the average values measured on the interval (0.1 ÷ 0.75) Re. These values are in the intervals in which the commonly used values for both steels (0.27 ÷ 0.3) and aluminum alloys (0.34 ÷ 0.36) are found [17,18]. For a better comparison of the Poisson ratio evolution, a joint diagram was created (Figure 6). On the horizontal axis, the normalized strain as a ratio is shown for a more correct comparison:
s t r a i n s t r a i n   o n   y i e l d   s t r e s s
Thus, the strain on the yield stress is 1. The evolution of the Poisson ratios of the materials is shown from a stress level of 0.75 Re.
From all the diagrams in Figure 6, it can be seen from the evolution of Poisson’s ratio that its values start to increase significantly from the 0.75Re level already. It can also be seen that only Poisson’s number of the 42CrMo4 and C55 materials approaches the value of 0.5 that is used in the numerical simulations. For the other materials, this number does not exceed the value of 0.46.

4. Discussion

The measured values of the Poisson number evolution in Figure 4 and Figure 5 show that the values of the Poisson ratio in the elastic region for steels are about 0.3 and for aluminum alloys are about 0.35. Moreover, these values in the plastic region unified to 0.5 in the computational simulations are only an approximation, which differs from reality [19,20,21]. This approximation gives reliable results for a stress region not exceeding 75% of yield stress. Above this value, the experimental results show a potential increase in the deviation from reality of the stresses obtained from the simulations.
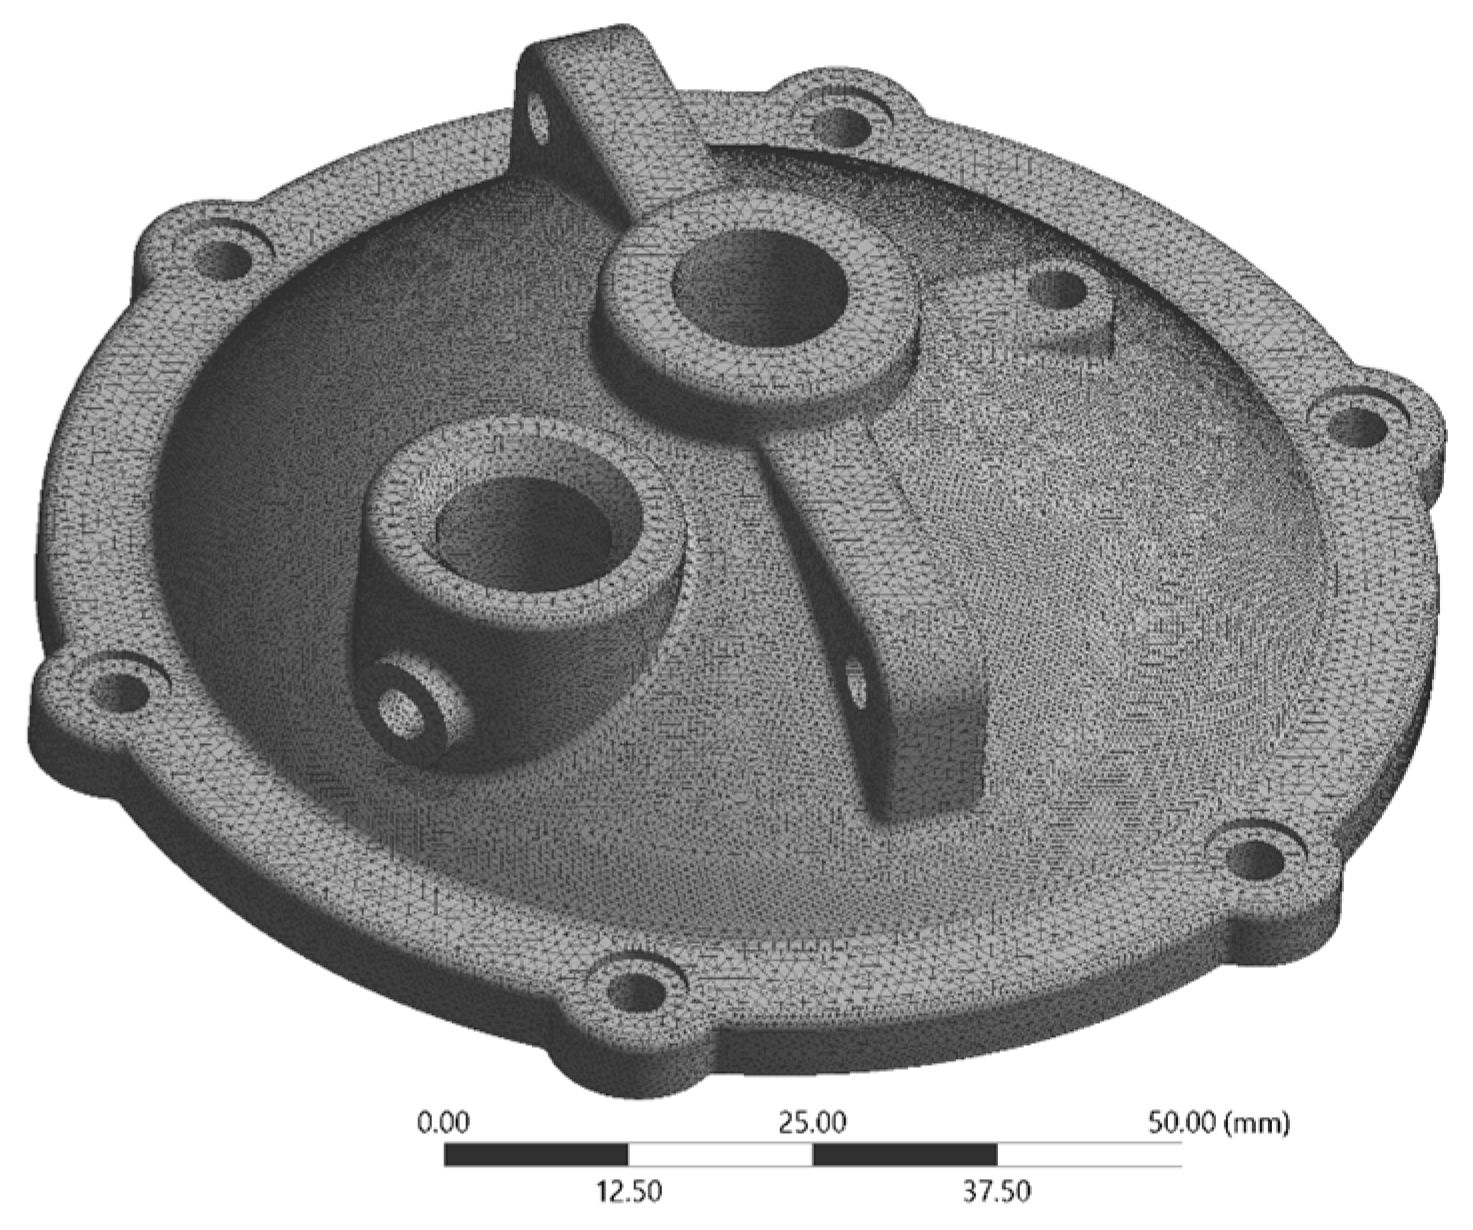
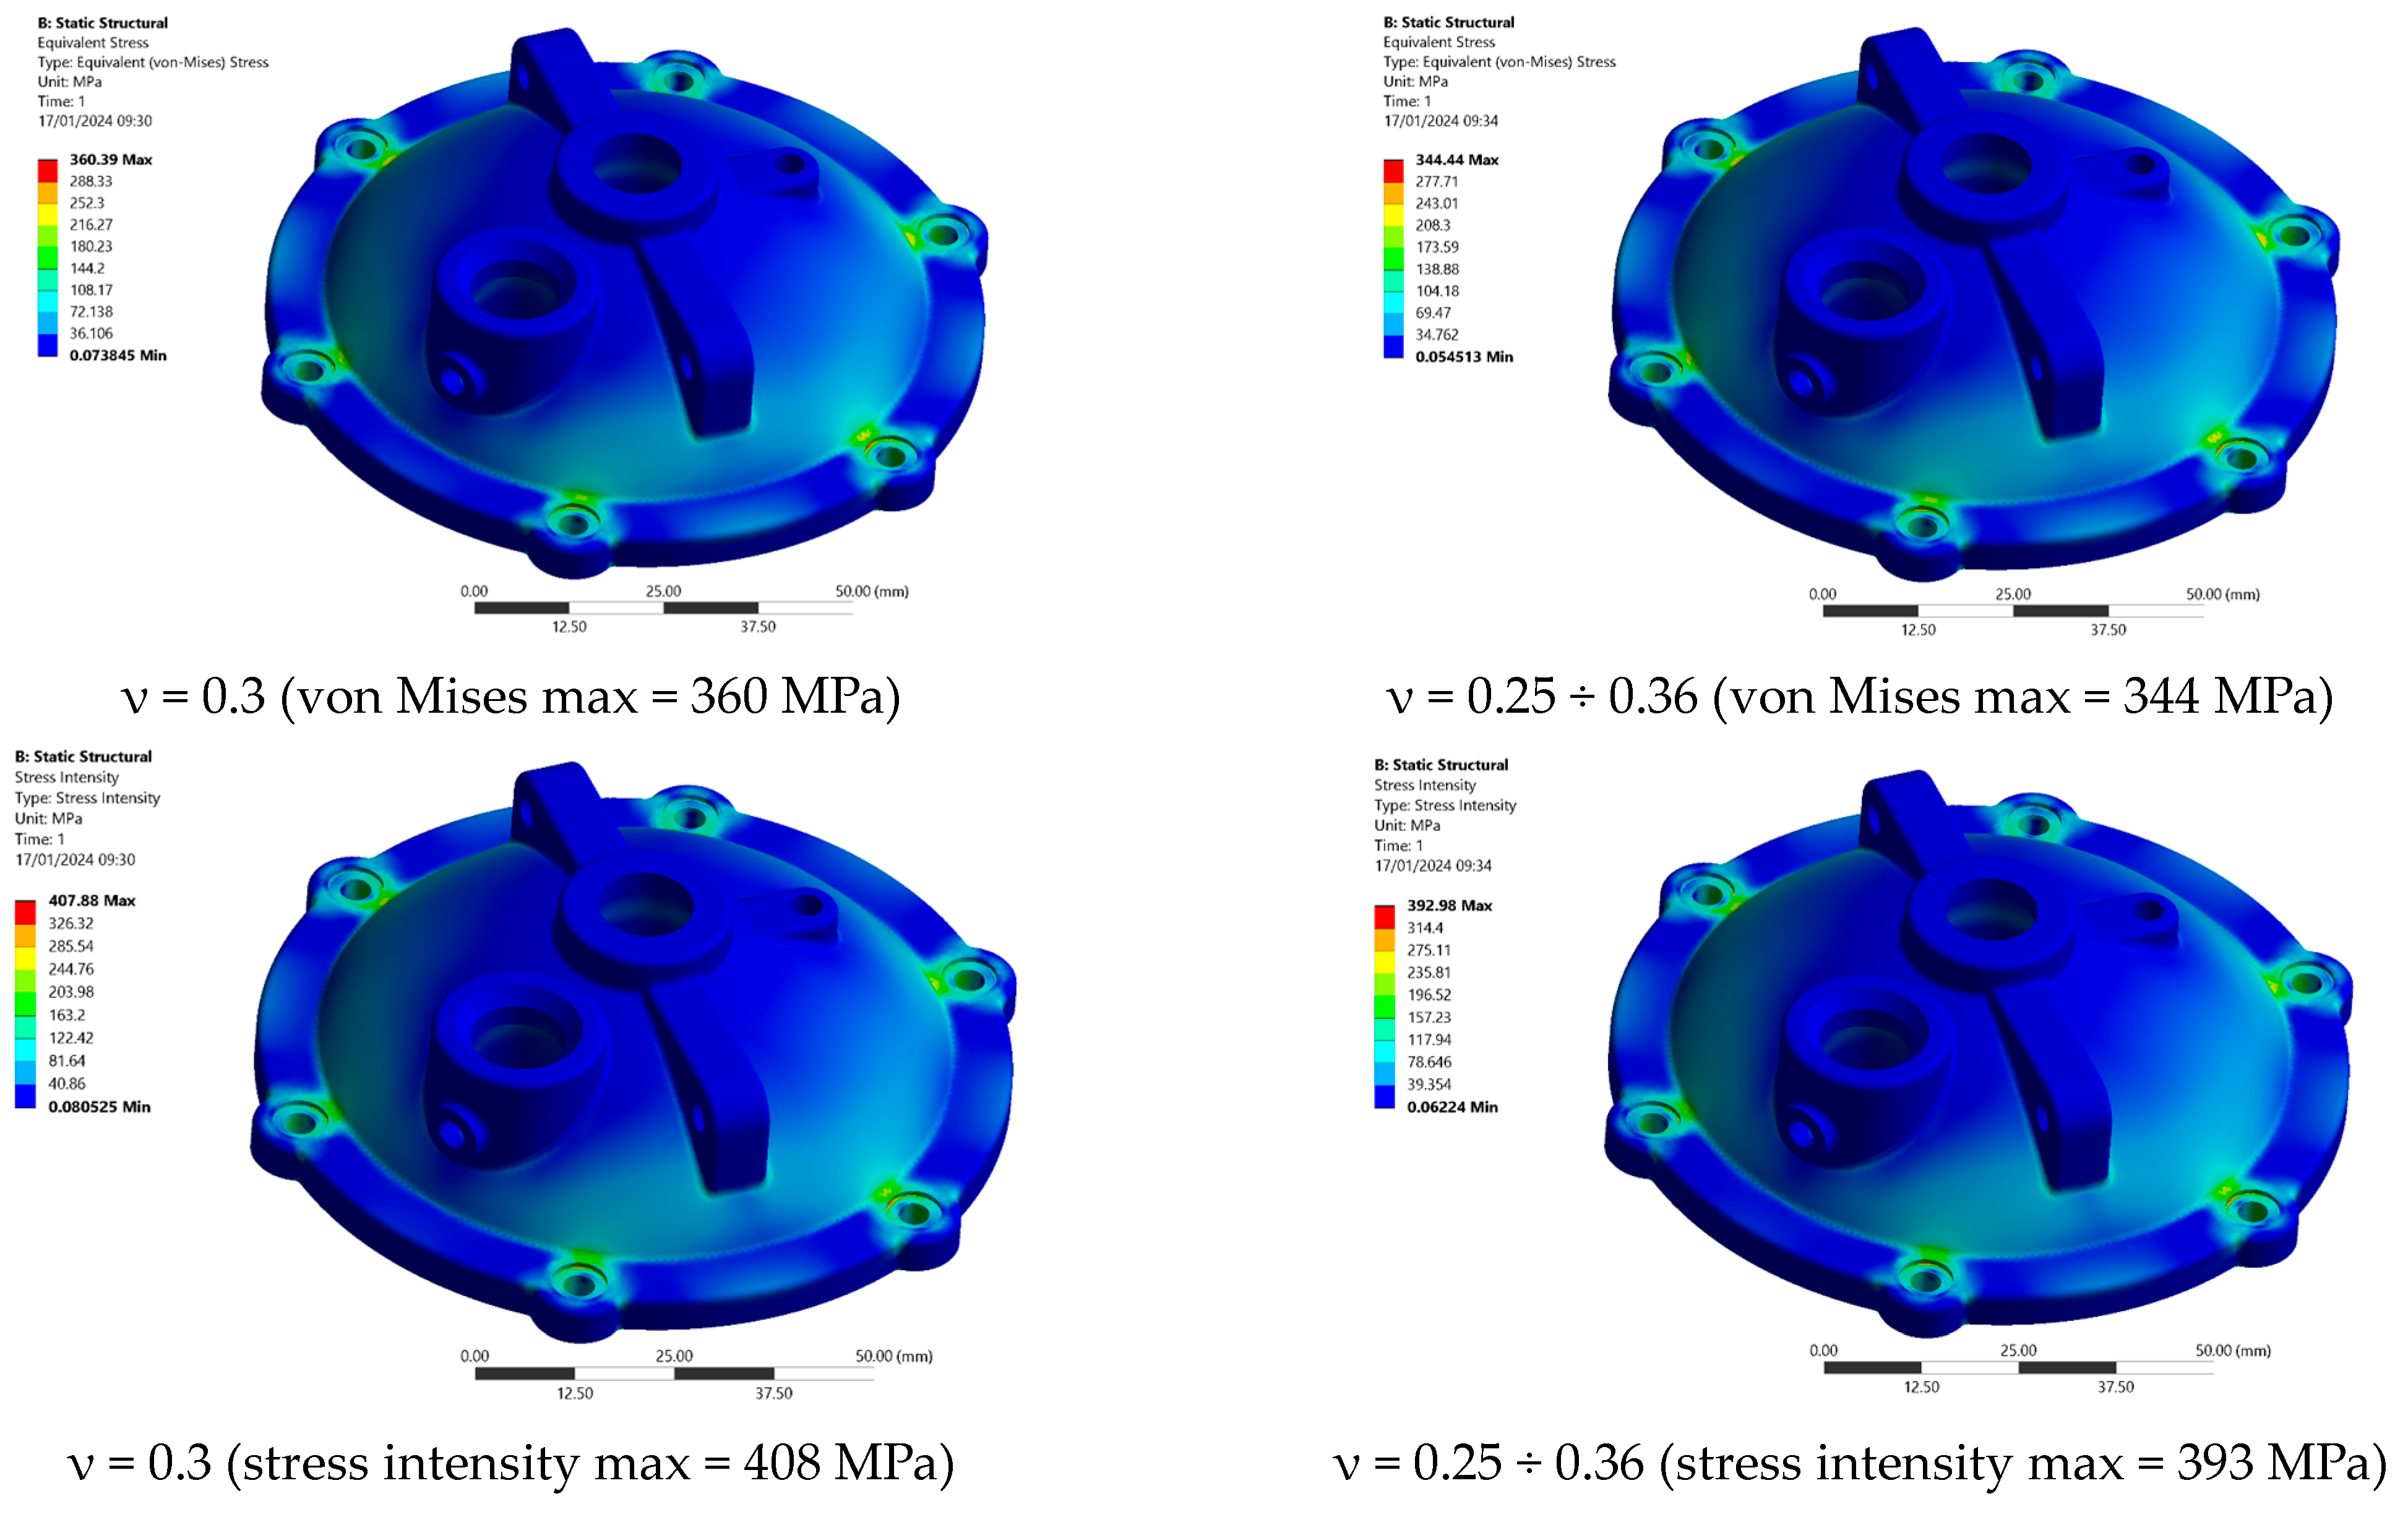
To demonstrate the influence of the magnitude of the Poisson ratio on the resulting stresses in the FEM simulations, the example of a pressure vessel cover loaded with radial pressure was used. A mesh of approximately 440,000 square elements is shown in Figure 7. In the current version of FEM software, it is only possible to change the Poisson number as a function of temperature. By combining the output of the heat conduction results with the input to the structural analysis, the actual measured Poisson’s number values for two of the materials used in this study, S355 and X52, were used in the linear material model. Individual material regions were assigned experimentally, with the measured Poisson’s number values corresponding to the magnitude of the strains identified in the previous internal pressure loading. For the region of deformations not exceeding yield stress, the differences in stress values for the conventional values and the Poisson ratio values from Figure 5 and Figure 6 were monitored. Due to the multiaxial condition of the stresses, it was necessary to consider the influence of the equivalent stress criterion on the results; therefore, both the von Mises stress values and the stress intensity for material S355 are shown in Figure 8.
The differences in the values of the maximum stresses between the use of the constant value of the Poisson ratio ν = 0.3 and the actual values ν = 0.25 ÷ 0.38 corresponding to the values of the strain magnitudes are more than 6% when using von Mises stresses and 5% when using stress intensity. In both cases, the use of the actual values of the Poisson ratio resulted in lower values of the stresses.
The same simulations of the cover loading by internal compression were performed for material X52 with the results shown in Figure 9.
The difference in von Mises stresses obtained by the simulation with ν = 0.3. compared to the experimentally obtained values of Poisson’s ratio was up to 5%, and up to 4% when using the results in the form of intensity stresses. However, these differences are only the result of approximate models using current FEM tools, whereas in reality, they may be somewhat higher.
The influence of the Poisson ratio on the value of the bursting pressure in the pipelines, which is a frequently used criterion for evaluating their serviceability [22,23], was also analyzed. The differences between the use of conventional values of 0.3 and 0.5 compared to the actual measured Poisson ratio waveforms were insignificant. The simulation results showed that the influence of the actual experimental Poisson ratio values on the simulation results is insignificant compared to the conventional values in the cases of relatively homogeneous strain fields, i.e., for small strain gradients.
The most significant differences in the simulation results occur just in the region of the largest Poisson ratio change, i.e., in the region 0.75 Re ÷ 1.2 Re (as is documented in Figure 10), in situations where the strain peak is strongly localized (this case was partially represented by the pressure vessel lid in Figure 7 and Figure 8). This situation occurs in areas of sharp notches, where a strong localization of the strain peak is often the reason for the high-cycle fatigue of the material [3,24].
The experimentally documented evolution of Poisson’s ratio values in the regions above 0.75 Re may also be related to Young’s modulus values. The constants E, G, and ν are bound in the linear theory by Equation (2). The linear elasticity theory provides an appropriate description of reality in the domain of purely elastic deformations. This assumption is only very well validated just in the regions up to about 0.75 Re (for some materials, this limit can be even lower). In the region of the stress–strain curve approaching Re, a drift away from a purely linear relationship is also observable in the experimental record (Figure 11). Therefore, the proportionality limit is correctly used as the elastic strain limit because the linear theory no longer holds above this limit, as confirmed by the measured dependence of Poisson’s number on the magnitude of the strain or stress above this limit.

5. Conclusions

The conventionally used Poisson’s ratio values (ν = 0.3 for elastic strains and ν = 0.5 for plastic strains) were investigated by direct measurements during tensile testing. The accurate measurement of the Poisson ratio by DIC, and especially in its evolution in the plastic strain growth region, revealed some important facts:
-
In the group of steels and aluminum alloys studied, the Poisson ratio can be considered stable up to about 0.75 Re; above this limit, its begins significantly increasing.
-
The increase in Poisson’s ratio is at least partially saturated in character, i.e., the gradient of change is significantly reduced in the region above 5% of the total strain, and, from about 8% of the strain, its value becomes significantly saturated.
-
A Poisson’s ratio value of 0.5, representing the condition of constant volume, is reached only by the 42crmo4 and C55 steels; for the other materials studied. this value did not exceed 0.46 (for AlSi10Mg 0.44).
-
After the initiation of the localization of plastic deformation (formation of the neck or wall buckling of the annular cross-section in the case of MS1), it is not possible to correctly evaluate the magnitude of the Poisson ratio due to the local change in the state of stress.
-
The evolution of Poisson’s ratio from 0.3 in the elastic region to 0.46 in the plastic region has the greatest influence on the simulation results in the region of high gradient of this change—that is, in the region of the yield stress; in the steady-state creep region, the influence of Poisson’s ratio changes decreases significantly.
-
The influence of the evolution of Poisson’s ratio has to be considered in stress–strain simulations for steels that are especially in the region (0.75 ÷ 1.2) Re because of the significant influence on stress values, but specifically because of the deformations that occur in this region with a significant gradient of change; an example of this in engineering applications is represented by a location of sharp notches leading to the need for life assessment in the region of high-cycle fatigue.
The current simulation tools in FEM software do not allow for a direct consideration of the evolution of Poisson’s ratio during strain growth. Increasing the accuracy of simulations, especially in areas of gradual development of plastic deformation in sharp indentations, could be assisted by introducing the option of selecting Poisson’s ratio as a function of strain magnitude into the material models. This will require a modification of the constitutive equations, particularly a modification of the algorithm for their solution. Experimental results on the evolution of Poisson’s number also show that above the proportionality limit on the tensile curve, the linear theory of elasticity no longer holds.

Author Contributions

Conceptualization, V.C.; methodology, V.C.; software, M.Š.; validation, M.M. and T.K.; formal analysis, J.Š.; investigation, T.K. and M.M.; data curation, T.K.; writing—original draft preparation, V.C. and M.Š.; writing—review and editing, J.Š. All authors have read and agreed to the published version of the manuscript.

Funding

This work was supported by the Slovak Educational Grant Agency under the contract No. KEGA-038STU-4/2022 and by the VEGA No. 2/0099/2022.

Data Availability Statement

The raw data supporting the conclusions of this article will be made available by the authors on request.

Conflicts of Interest

The authors declare no conflicts of interest. The funders had no role in the design of this study; in the collection, analyses, or interpretation of data; in the writing of this manuscript; or in the decision to publish the results.

Abbreviations

FEMFinite element method
FBGFiber Bragg grating sensors
ESPIElectronic speckle-pattern interferometry
DICDigital image correlation method

Nomenclature

ReYield stress
νPoisson’s ratio
σNormal stress
EYoung’s modulus in tension
GModulus in shear

References

  1. Greaves, G. Poisson’s Ratio over Two Centuries: Challenging Hypotheses. Notes Rec. R. Soc. Lond. 2013, 67, 37–58. [Google Scholar] [CrossRef] [PubMed]
  2. Poisson, S.D. Note sur l’Extension des Fils et des Plaques elastiques. Annls Chim. Phys. 1827, 36, 384–387. [Google Scholar]
  3. Cagniard de la Tour, C. Notice sur les Travaux Scientifiques de M. Cagniard-Latour; Bachelier: Paris, France, 1851. [Google Scholar]
  4. Cauchy, A.L. Recherches sur l’e’quilibre et le mouvement inte´rieur des corps solides ou fluides, élastiques ou non-élastiques’. In Sur les E´quations qui Expriment les Conditions d’e´Quilibre, ou Les Lois du Mouvement Inte´Rieur d’un Corps Solide e´Lastique ou non e´Lastique; Gauthier-Villars: Paris, France, 1828; Volume 8, pp. 227–277. [Google Scholar]
  5. Köster, W.; Franz, H. Poisson’s ratio for metals and alloys. Metall. Rev. 1961, 6, 1–55. [Google Scholar] [CrossRef]
  6. Kirchhoff, G.R. Uber das Verhältinis der Quercontraction zur Längen-dilatation bei Stäben von federafrten Stahl. Poggendorfs Annln 1859, 108, 369–392. [Google Scholar] [CrossRef]
  7. Grüneisen, E. Interferenzapparat zur Messung der Querkontraktion eines Stabes bei Belastung. Z. InstrumKunde 1908, 28, 89–100. [Google Scholar]
  8. Motra, H.B.; Hildebrand, J.; Dimmig-Osburg, A. Assessment of strain measurement techniques to characterise mechanical properties of structural steel. Eng. Sci. Technol. Int. J. 2014, 17, 260–269. [Google Scholar] [CrossRef]
  9. Chmelko, V.; Harakaľ, M.; Žlábek, P.; Margetin, M.; Ďurka, R. Simulation of Stress Concentrations in Notches. Metals 2021, 12, 43. [Google Scholar] [CrossRef]
  10. Williams, J.G.; Gamonpilas, C. Using the simple compression test to determine Young’s modulus, Poisson’s ratio and the Coulomb friction coefficient. Int. J. Solids Struct. 2008, 16, 4448–4459. [Google Scholar] [CrossRef]
  11. Chang, J.-Y.; Yu, G.-P.; Huang, J.-H. Determination of Young’s modulus and Poisson’s ratio of thin films by combining sin2ψ X-ray diffraction and laser curvature methods. Thin Solid Film. 2009, 517, 6759–6766. [Google Scholar] [CrossRef]
  12. Baughman, R.; Shacklette, J.; Zakhidov, A.; Stafström, S. Negative Poisson’s ratios as a common feature of cubic metals. Nature 1998, 392, 362–365. [Google Scholar] [CrossRef]
  13. Kohlhauser, C.; Hellmich, C. Determination of Poisson’s ratios in isotropic, transversely isotropic, and orthotropic materials by means of combined ultrasonic-mechanical testing of normal stiffnesses: Application to metals and wood. Eur. J. Mech. A Solids 2012, 33, 82–98. [Google Scholar] [CrossRef]
  14. ICózar, R.; Arbeláez-Toro, J.J.; Maimí, P.; Otero, F.; González, E.V.; Turon, A.; Camanho, P.P. A novel methodology to measure the transverse Poisson’s ratio in the elastic and plastic regions for composite materials. Compos. Part B Eng. 2023, 272, 111098. [Google Scholar] [CrossRef]
  15. Lührs, L.; Soyarslan, C.; Markmann, J.; Bargmann, S.; Weissmüller, J. Elastic and plastic Poisson’s ratios of nanoporous gold. Scr. Mater. 2016, 110, 65–69. [Google Scholar] [CrossRef]
  16. Koščo, T.; Ďurka, R. Digital image correlation for accurate strain measurement on sharp notched specimens. Procedia Struct. Integr. 2022, 42, 1600–1606. [Google Scholar] [CrossRef]
  17. Huber, N.; Viswanath, R.N.; Mameka, N.; Markmann, J.; Weimüller, J. Scaling laws of nanoporous metals under uniaxial compression. Acta Mater. 2014, 67, 252–265. [Google Scholar] [CrossRef]
  18. Gu, X.J.; McDermott, A.G.; Poon, J.S.; Shiflet, G.J. Critical Poisson’s ratio for plasticity in Fe–Mo–C–B–Ln bulk amorphous steel. Appl. Phys. Lett. 2006, 88, 211905. [Google Scholar] [CrossRef]
  19. Mohammadi, M.; Dryden, J.R. Influence of the spatial variation of Poisson’s ratio upon the elastic field in nonhomogeneous axisymmetric bodies. Int. J. Solids Struct. 2009, 46, 788–795. [Google Scholar] [CrossRef]
  20. Chen, D.H.; Nisitani, H. Effect of poisson’s ratio on elastic-plastic stress under plane deformation. Eng. Anal. Bound. Elem. 1997, 20, 17–24. [Google Scholar] [CrossRef]
  21. Gu, T.; Jia, L.-J.; Chen, B.; Min Xia, M.; Guo, H.; He, M.-C. Unified full-range plasticity till fracture of meta steel and structural steels. Eng. Fract. Mech. 2021, 253, 107869. [Google Scholar] [CrossRef]
  22. Chmelko, V.; Biro, D. Safety of pressure pipe operation with corrosive defect. Procedia Struct. Integr. 2019, 17, 520–525. [Google Scholar] [CrossRef]
  23. Chmelko, V.; Garan, M.; Berta, I. Calculation of burst pressure of pipeline with local defect. Procedia Struct. Integr. 2020, 26, 417–421. [Google Scholar] [CrossRef]
  24. Garan, M.; Chmelko, V.; Šulko, M.; Musil, M. Fatigue failure of a pressing machine. Appl. Sci. 2021, 11, 398. [Google Scholar] [CrossRef]
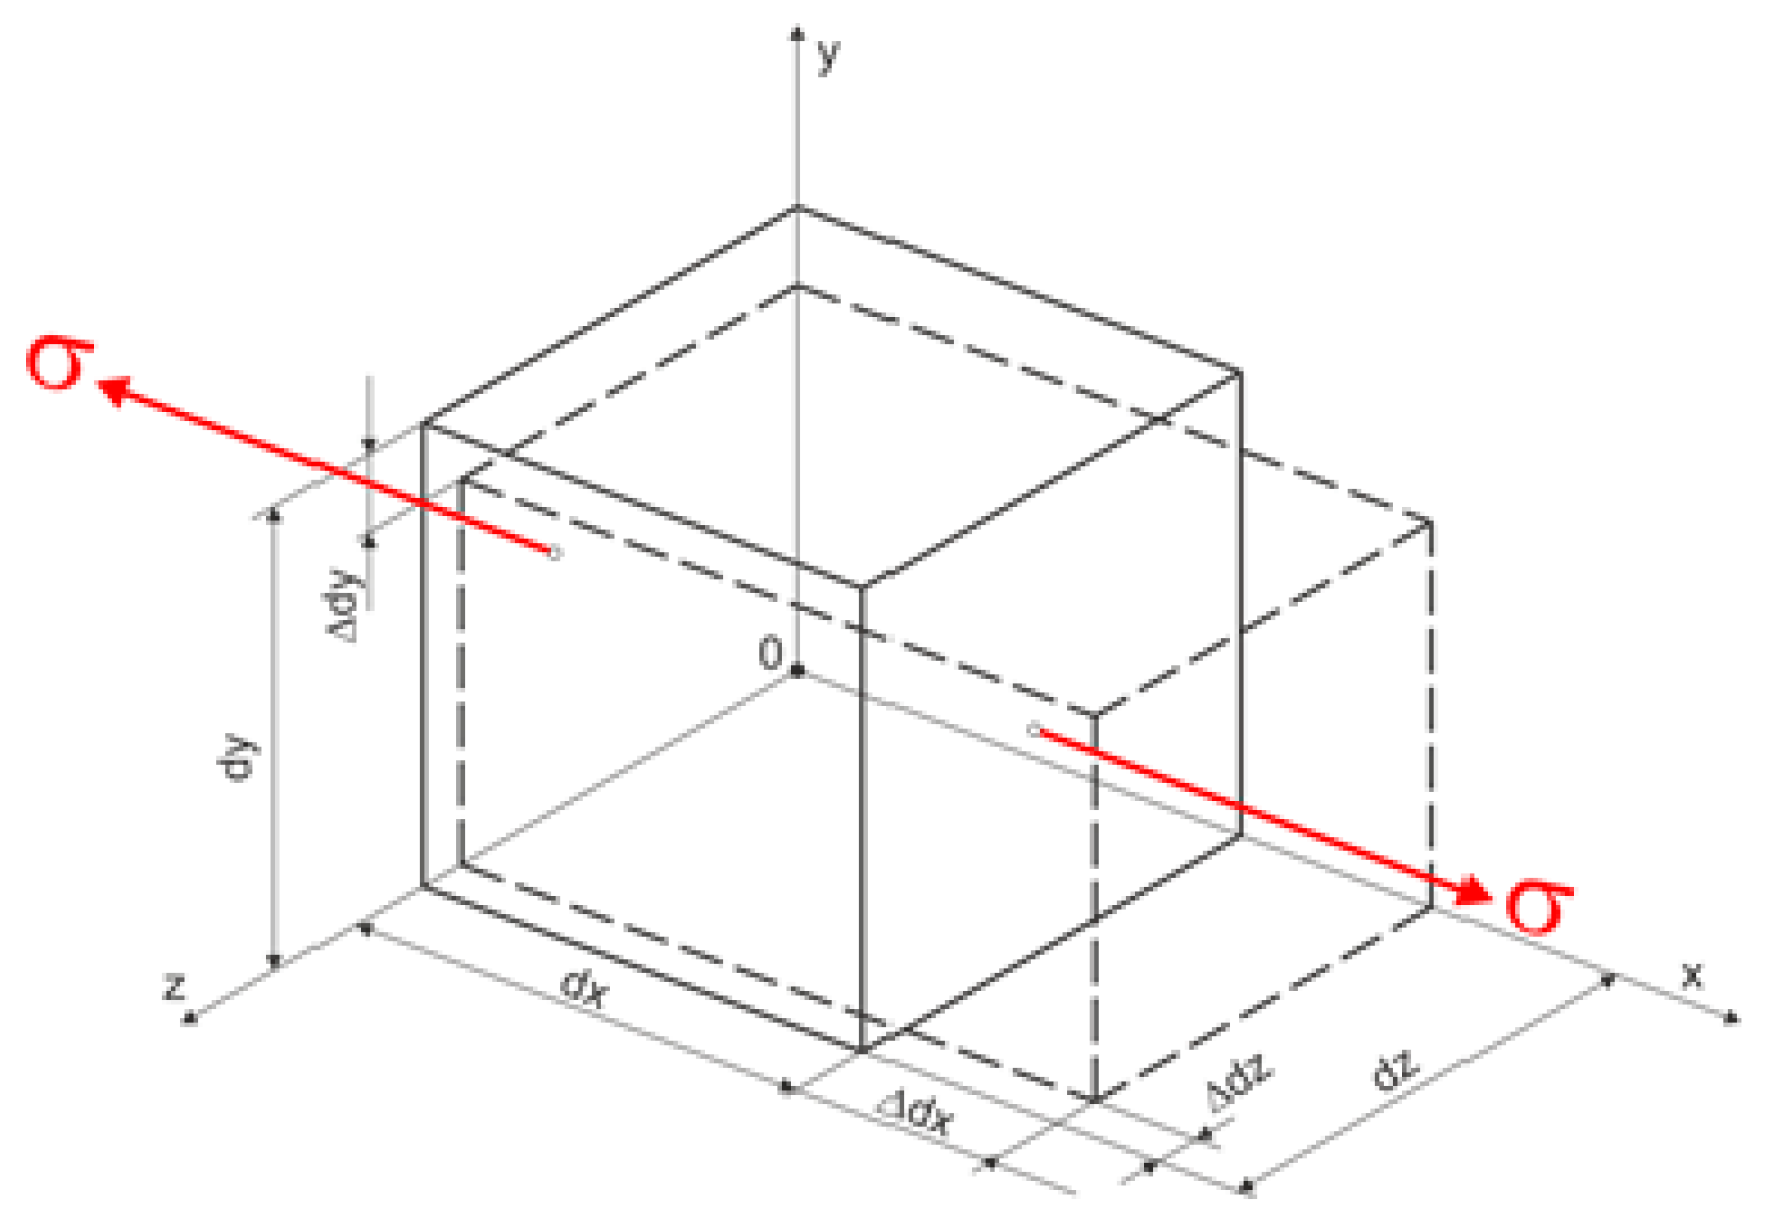
Figure 1. Three-dimensional deformation in uniaxial tension.
Metals 14 00433 g001
Figure 2. Poisson number values built by Köster and Franz in 1961—taken from the original [5]. The authors noted a periodic fluctuation for elements in each of the three longitudinal regions of the periodic table of elements and attributed it to differences in interatomic distances.
Metals 14 00433 g002
Figure 3. Test specimens used for measurements: X52, C55, S355, 42CrMo4, AlSi10Mg, and MS1.
Metals 14 00433 g003
Figure 4. True stress–strain diagram versus engineering stress–strain diagram for X52 steel.
Metals 14 00433 g004
Figure 5. Tensile diagrams along with the evolution of Poisson’s ratio versus strain magnitude for the materials in a stepwise manner: S355, X52, C55, 42CrMo4, MS1, and AlSi10Mg. The stress–strain history for maraging steel MS1 is affected by wall buckling of the annular cross-section of the specimens relatively soon after yield strength is exceeded.
Metals 14 00433 g005
Figure 6. Tensile diagrams along with the evolution of Poisson’s ratio versus the normalized strain for the materials: S355, X52, C55, 42CrMo4, MS1, and AlSi10Mg.
Metals 14 00433 g006
Figure 7. Finite element mesh of quadratic type on the cover of a pressure vessel.
Metals 14 00433 g007
Figure 8. Effects of the reported actual values of Poisson’s ratio compared to the conventional value of 0.3 on the resulting values of equivalent von Mises stresses (top) and stress intensity (bottom) for the S355 material.
Metals 14 00433 g008
Figure 9. Effect of the above actual Poisson’s ratio values compared to the conventional value of 0.3 on the resulting values of equivalent von Mises stresses (top) and intensity stresses (bottom) for the X52 material.
Metals 14 00433 g009
Figure 10. Evolution of Poisson’s ratio—comparison of experimental values and conventional values.
Metals 14 00433 g010
Figure 11. Evolution of nonlinearity of the real stress–strain relationship documented on X52 steel.
Metals 14 00433 g011
Table 1. Characteristics of used steels.
MaterialChemical
Composition
(%)
Yield Stress
(MPa)
Ultimate
Strength
(MPa)
Poisson Ratio
Average (0 ÷ 0.75) Re
S355 plateC 0.16, Mn 0.53,
Si 0.026, Cu 0.035
Al 0.03, Cr 0.028
4505200.285
X52C 0.15, Mn 0.6,
Si 0.32, Cr 0.055, Cu 0.04
4105500.265
C55C 0.54, Mn 0.64,
Si 0.25
3375780.305
42CrMo4C 0.41, Mn 0.63,
Cr 1.1, Mo 0.25
96010900.293
MS1Ni 18, C 8.9, Mo 5.1,
Ti 0.61, Al 0.1
99010000.338
AlSi10MgSi 10.2, Mg 0.35, Fe 0.112,
Mn 0.05, Cu 0.017
1102210.35
Disclaimer/Publisher’s Note: The statements, opinions and data contained in all publications are solely those of the individual author(s) and contributor(s) and not of MDPI and/or the editor(s). MDPI and/or the editor(s) disclaim responsibility for any injury to people or property resulting from any ideas, methods, instructions or products referred to in the content.