Article

Numerical Simulation of Cathode Nodule Local Effects

School of Mechanical and Materials Engineering, North China University of Technology, Beijing 100144, China
*
Authors to whom correspondence should be addressed.
Metals 2024, 14(4), 457; https://doi.org/10.3390/met14040457
Submission received: 1 March 2024 / Revised: 10 April 2024 / Accepted: 11 April 2024 / Published: 12 April 2024

Abstract

:
As one of the main factors decreasing current efficiency and product quality, the growth of nodules deserves attention in the copper electrorefining process. Three-dimensional (3D) Finite Element Method models combining tertiary current distribution and fluid flow were established in this study to investigate the details of the growth of columnar nodules, including the electrolyte flow around the nodule and its effects. Compared with an inert nodule, a significant impact of the electrochemical reaction of an active nodule has been observed on the fluid flow, which may be one of the reasons for the formation of small nodule clusters on the cathode. Furthermore, the local current density is not even on the nodule surface under the comprehensive influence of local electrolyte flow, local overvoltage, and the angle with the anode surface. Thus, the head of an active nodule grows faster than the root, and the upper parts grow faster than the lower parts, leading to asymmetric growth of the nodules.

Graphical Abstract

1. Introduction

Copper sulfide ore is smelted through pyrometallurgy and hydrometallurgy to obtain crude copper containing impurity elements such as As, Zn, Ni, and Se. The purity of copper needs to be increased to 99.99% through electrolytic refining [1]. The current efficiency in industrial copper refining is usually only 93–98% [2]. The growth of cathode nodules is the main cause of current loss, due to the occurrence of short circuits. Previous studies on nodule formation conditions have shown that conductive particles in the electrolyte can form tiny protrusions on the cathode surface [3], and mucous particles from anode mud exist at the root of the nodules [4]. These experiments indicate that the formation of cathode nodules is related to the transport of these impurity particles to the cathode surface. Once formed, the current density on the surface of the nodules increases sharply. According to electrode kinetics, local current density reflects the electrode reaction rate, and the deposition rate of copper ions significantly increases. When the nodules grow and touch the anode surface, short circuits are formed. The changes in the current density of the nodules affect the growth process. Wang et al. [5] simulated the nodule growth process and found that the current density at the head of the nodules with different initial heights was not uniform. Meng et al. [6], through experiments and numerical simulations of current distribution, quantitatively analyzed and modeled the nodule growth behavior. The results showed that current density at the front end of the nodules is the reason for the enhanced growth at the front end and the formation of irregular dendrites. Zhao [7] analyzed the current density on the nodule surface and the corresponding anode and pointed out the importance of studying the current density on the nodule surface in order to reduce the duration of short circuits and even completely avoid their occurrence. In addition, Adachi [8], Nakai [9], etc., simulated the secondary current distribution of the nodule growth process through numerical simulation of nodule placement on the cathode and concluded that, when the height of the nodules exceeds 10 mm, current density occurs due to the geometric shape of the protrusions, and the height of the protrusions increases exponentially with the duration of electrolysis, resulting in the rapid growth of dendrites due to copper deposition. Previous studies have confirmed the possibility of rapid growth of nodules and the formation of dendrites, due to uneven current density distribution on the nodule surface, which could lead to short circuits. Zeng [10] utilized fiber-optic current sensors to measure the cathode current of industrial copper electrolytic refining cells and obtained the relationship between cathode current characteristics and inter-electrode short-circuit mechanisms. However, the electrode kinetics theory proposes that the control steps of electrode reactions are composed of electrochemical reactions and liquid-phase mass transfer [11], and electrolyte flow may increase the current density on the nodule surface. Zeng [12] measured the flow velocity in the gap between adjacent electrodes and used simulation to determine the effect of the different factors, such as current density and flow velocity, on the complex flow of anode slime. Masayuki M. et al. [13] demonstrated, through natural convection numerical simulations based on secondary current distribution, that impurity particles are carried by convective vortices above the nodules, collide frequently with the nodules, and preferentially enter above the nodules. Zeng et al. [14,15,16,17], through numerical simulations of secondary current distribution and experimental analysis of nodules, studied the transport characteristics of copper electrolytic refining particles under symmetric electrodes. Kim et al. [18] simulated electrochemical kinetics with the flow of ions in the electrolyte by fully coupling it with a simplified three-dimensional transport model of a copper electrolyze. In addition, since the rising oxygen bubbles and electrolyte temperature during electrolysis can adversely affect cathodic mass transfer [19], a large number of researchers have paid much attention to the simulation of the flow of rising bubbles within copper electrolytes [20,21,22,23]. Le A.S. [24] and Li M.Z. [25] simulated temperature variations in a copper electrolyte’s electrolyte inlet, outlet, and inter-electrode. They proposed effective measures to improve electrolyte flow and minimize mass transfer effects caused by temperature variations. Ka et al. [26] used the measurement results of actual industrial electrolytes to establish a model for the electrical conductivity and viscosity of the electrolyte, which can be used to optimize industrial electrolytes. Khayatzadeh et al. [27] used X-ray diffraction/Scanning Electron Microscope to characterize the content of glue and thiourea, studying the influence of additives on the formation of cathodic nodules. Researchers conducted a series of studies aimed at improving the quality of the cathode. H. Wang [28] proposed that the cathode mass is best when the electrolyte jet is directed at the middle height of the cathodic deposition area. Sahlman [29] indicated that an increase in the impurity Ni content in the electrolyte reduces the dispersion of chunky anode mud, while an increase in sulfuric acid concentration promotes the detachment of individual particles. Another study [30] used a recursive neural network model to estimate cathode cycle rejection. It is evident that the electrolysis process and factors such as electrolyte flow and composition are closely intertwined.
However, the current research on the correlation between electrolyte flow patterns and current density on the nodule surface in copper electrolytic refining is very limited. This study is based on the numerical simulation of natural convection of tertiary current distribution. By using the nodular model and the inert nodular model for comparison, the current density distribution on the surface of the nodule (at the upper and lower edges) and the flow characteristics of the nearby electrolyte were studied. The influencing factors of the current density distribution on the surface of the nodule (upper and lower edges) were analyzed. In addition, the current density distribution on the upper and lower edges of the nodule is relatively typical, and the current density distribution in other areas of the nodule surface is also worth studying. Nevertheless, we can still simulate the electrode reaction and natural convection of the electrolyte on the micro-scale inside the cell, to explore the relationship between the two and the coupling effects.

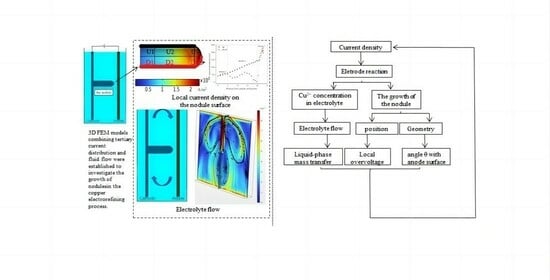
2. Model Description
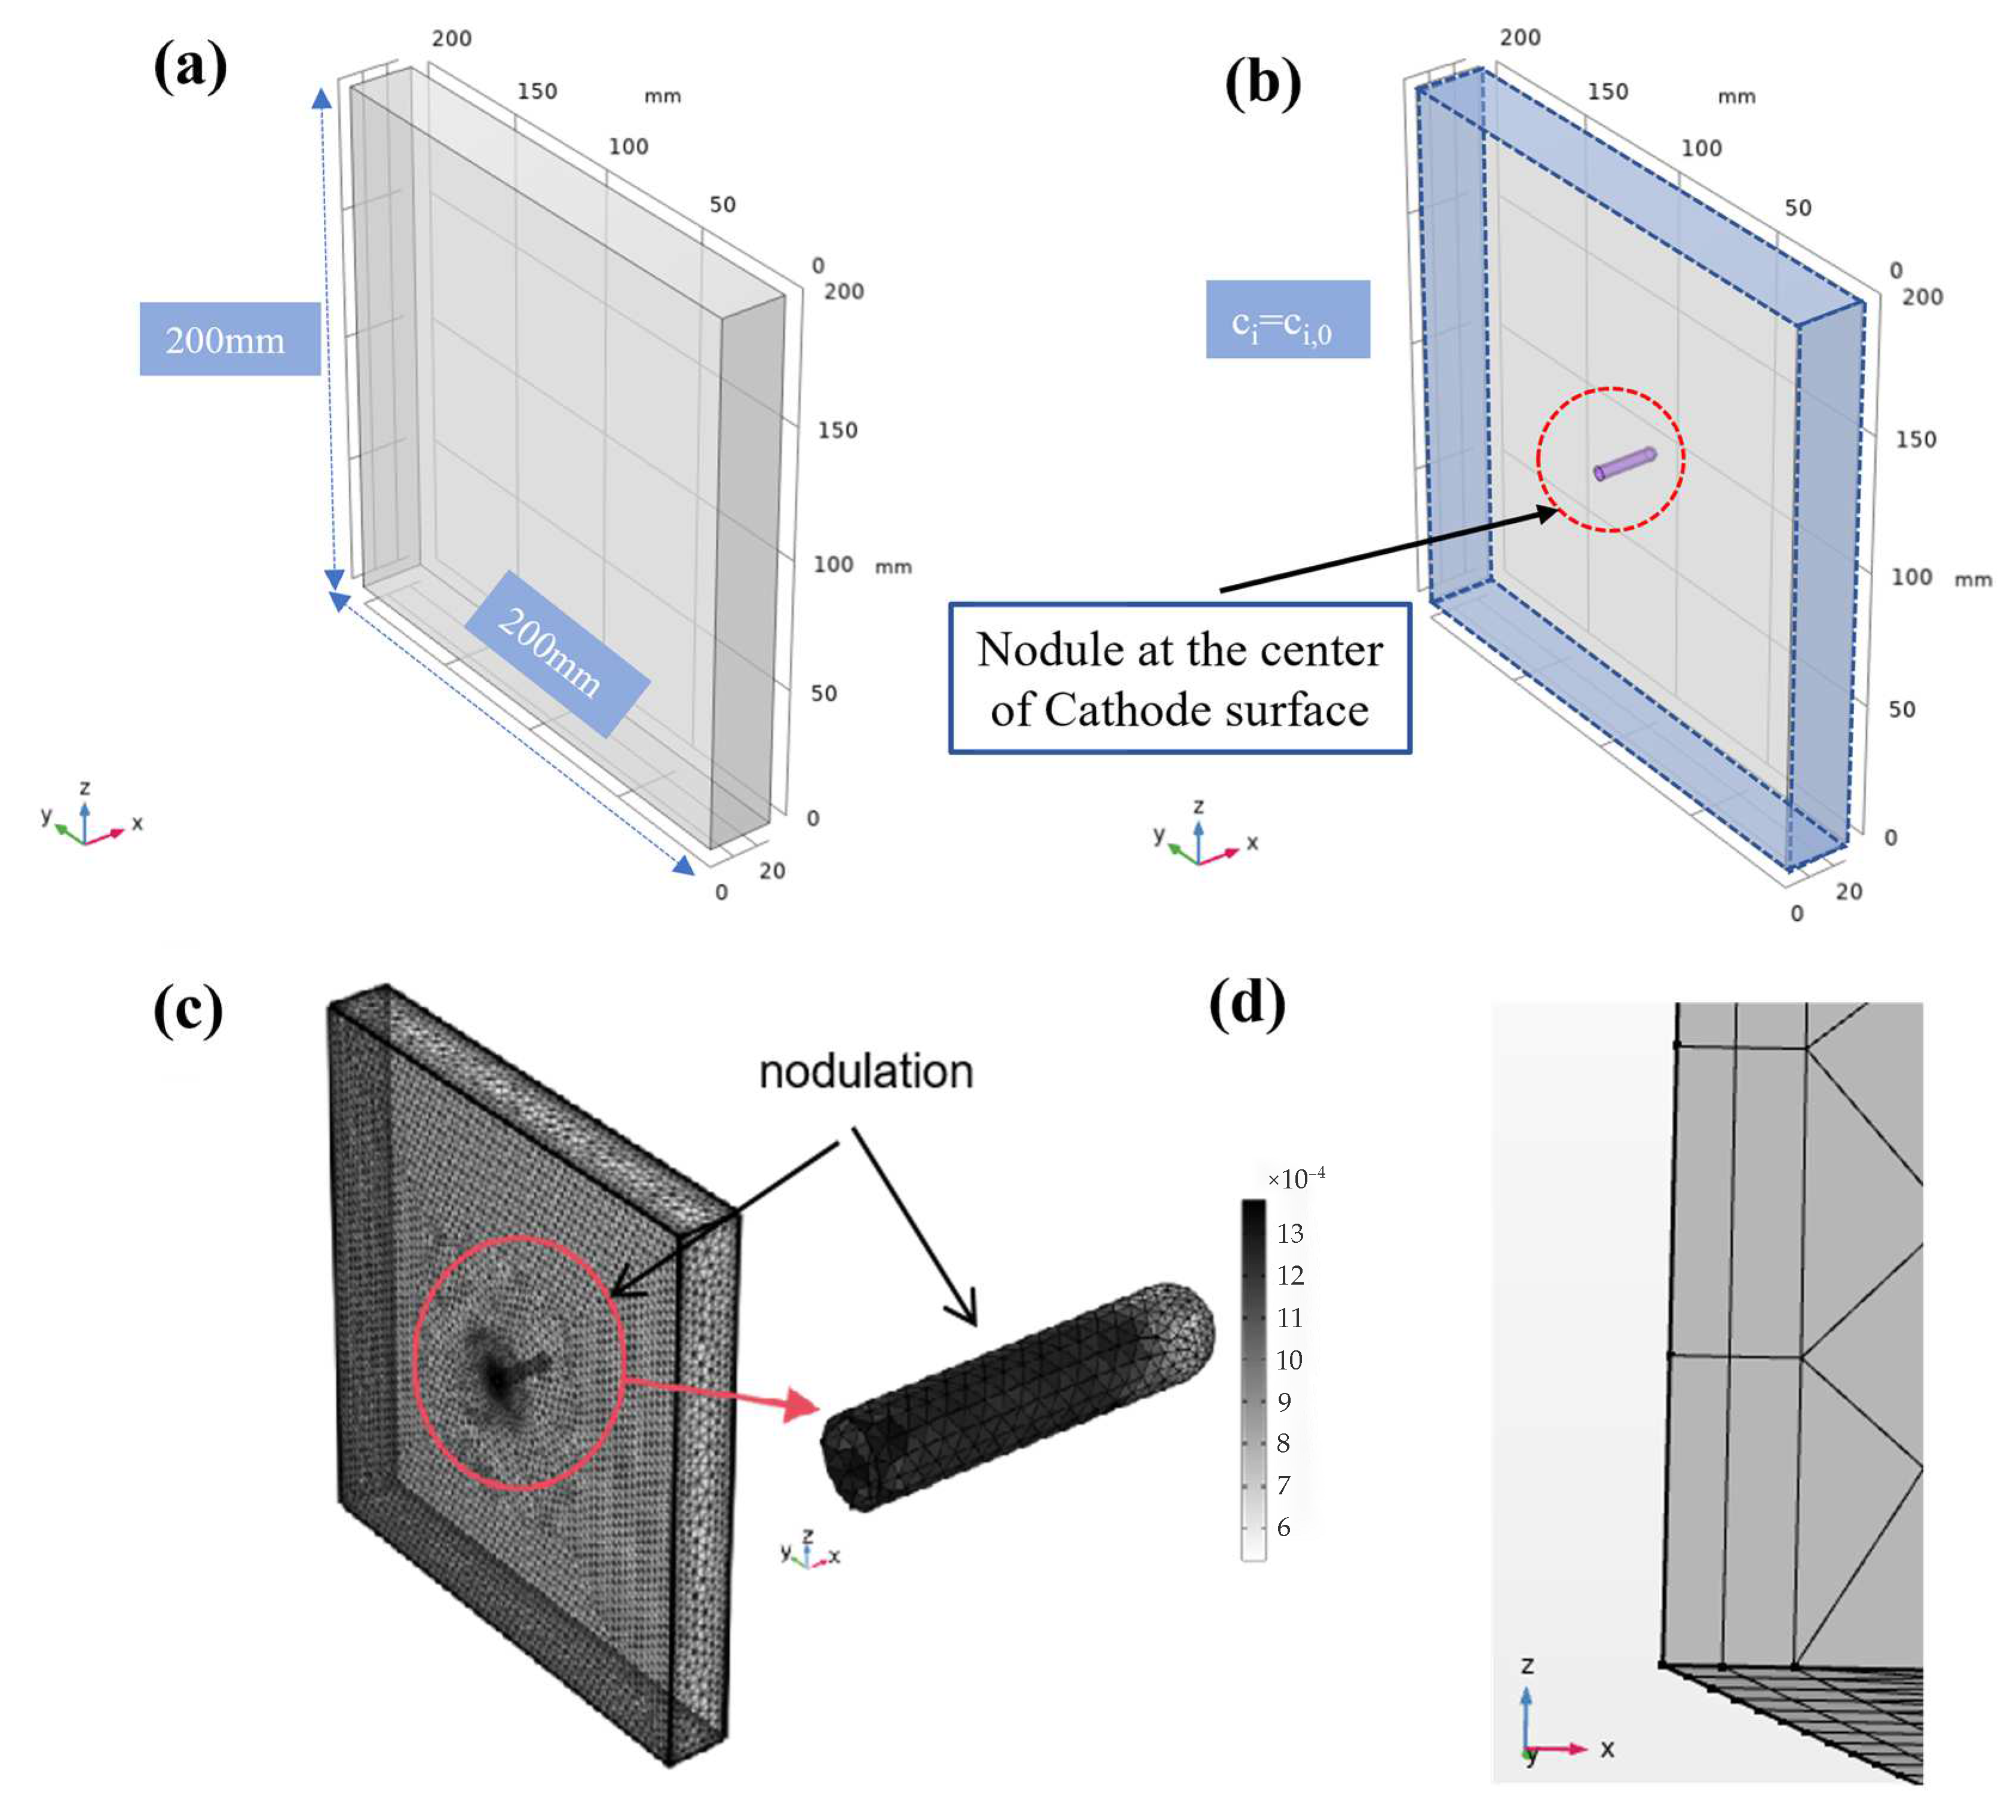
2.1. Geometry Model

COMSOL Multiphysics possesses the capability to integrate electrode position; it offers the functionality to simulate in three dimensions and presents outcomes through three-dimensional visuals and animations [31]. This paper used COMSOL Multiphysics to construct a computational model of a three-dimensional structure of an electrolytic cell, with an anode and cathode length and width of 200 mm, and a distance of 25 mm. The nodule was designed as a front hemispherical, cylindrical structure with a diameter of 5 mm, placed at the center of the nodule. The lengths of the nodules were 0 mm, 15 mm, and 23 mm, respectively. To investigate the influence of electrode reaction occurring on the surface of the nodule, a comparative study was conducted, with the condition where the reduction of copper ions did not exist on the surface, referred to as “inert nodule” in this article. The “inert nodule” geometric dimensions were identical to those of the “active nodule”, with a length of 23 mm.
The model discretized into tetrahedral grid cells using a refined mesh. The maximum mesh cell size, minimum mesh cell size, and maximum mesh cell growth rate of the domain mesh in the cells were distributed as 0.00374 m, 0.0007 m, and 1.13. The head of the nodule (the hemisphere) used an ultra-refined mesh. At the slip boundary, a two-layer boundary cell was formed. The first boundary layer had a thickness of 0.006 m, and the thickness of the second layer was determined by a boundary layer stretch factor of 1.2, resulting in a 20% increase in thickness compared to the first layer. The cells’ geometric edges and vertices were discretized into edge and vertex cells. Several mesh refinements were performed before applying the current mesh. The results of the simulation were not significantly different from those obtained with the previous mesh cells of a lower quality. It is important to note that all cross-section definitions, such as the XZ cross-section, in the following text are based entirely on the coordinate system of Figure 1.

2.2. Numerical Model

The coupling of the “triple current distribution” and “laminar flow” is used to describe electrode reactions and electrolyte flow. Among them, the relationship between the reaction rate on the electrode surface, the ion concentration near the electrode surface, and the potential is characterized using the concentration-dependent Butler–Volmer equation in the triple current distribution, as shown in Equation (1).
i l o c = i 0 [ C a C 0 exp ( α a F η R T ) C c C 0 exp ( α c F η R T ) ]
where is the local overvoltage at the electrode interface, defined as follows:
η = φ s φ l E e q
In Equations (1) and (2), i l o c represents the local current density at the electrode–electrolyte interface, in A/m2; i 0 is the exchange current density, in A/m2; C a , C c , and C 0 represent the concentrations at the anode surface, cathode surface, and in the bulk solution, respectively, in mol/m3; and ϕ s , ϕ l and E e q represent the solid electrode potential, the potential at the electrode–electrolyte interface, and the equilibrium potential difference, respectively, in V. α a and α c represent the anodic transfer coefficient and cathodic transfer coefficient, respectively.
The ion flux and flow velocity in the electrolyte are described using the Nernst–Planck equation, as follows:
N i = D i C z i u m , i F C i ϕ l + C i u
where N i represents the total flux of the substance, in mol/(m2·s); F is the Faraday constant, in As/mol; ϕ l is the potential gradient in the electrolyte, in V; C is the concentration gradient, in mol/m3; z i is the charge of substance i, u m , i is the migration coefficient of the ion, in m2/(s·J·mol); C i represents the concentration of substance i; D i represents the diffusion rate of substance i; C i u represents the convective term; and u represents the velocity of the electrolyte.
Changes in the ion concentration on the anode, cathode, and nodules’ surfaces can cause variations in the local electrolyte density and viscosity. The density and viscosity are obtained from empirical equations for electrolyte composition, according to reference [31], as follows:
ρ = 1.022 + 2.24 M C u C C u 2 + + 0.55 M H 2 S O 4 C H 2 S O 4 0.58 ( T 273 )
μ = 10 3 ( 189.46 + 0.010353 ( 0.06355 C C u 2 + ) + 0.0014685 C H 2 S O 4 + 1983.72 exp ( 1 / T ) )
where ρ represents the electrolyte density in kg/m3; μ represents the electrolyte viscosity in Pa·s; C c u 2 + represents the copper concentration in mol/m3; C H 2 S O 4 represents the concentration of H2SO4 in kg/m3; T represents the electrolyte temperature in K; and M C u and M H 2 S O 4 represent the formula weights of Cu and H2SO4 in g/mol, respectively.
The variation in local electrolyte density and viscosity on electrolyte flow is considered in the study, described by the momentum conservation Equation (6) and the continuity Equation (7). The outlet conditions were specified by prescribing a pressure on the outlet face without viscous stress.
The momentum conservation equation is as follows:
ρ u t + ρ u u = [ p I + K ] + F + ρ g
The continuity equation (mass conservation) is as follows:
ρ u = 0
where ρ is the density of the electrolyte in kg/m3; u is the velocity of the electrolyte flow in m/s; μ is the viscosity of the electrolyte in Pa·s; p is the pressure in Pa; F represents the volume force per unit volume in N/m3, which in this model should be the volume force per unit volume exerted on the fluid due to gravity; and I is the identity tensor.

2.3. Model Boundary Conditions

Ions from external sources can be transported throughout the electrolyte, except the electrode surfaces. As a result, the electrode surfaces, namely of the cathode and anode, are set to no flux boundary conditions, as follows:
n N i = 0
where n represents the unit normal vector to the face and N i is the flux of species i .
The insulating boundary conditions are applied to all faces except for the two electrode faces, as follows:
- n i = 0
where n represents the unit normal vector to the face and i is the current density.
The electrode surface is described as having a non-slip boundary condition due to the electrochemical reactions taking place. Outlets are placed around the electrolysis cell with pressure-constrained boundary conditions, with the electrolyte flowing out into an environment maintained at an absolute pressure of 1 atmosphere. It is important to note that pressure constraint points can be placed anywhere in the model to improve convergence.
The boundaries around the electrodes are set as inflow and pressure boundaries. The simulation assumes that electrolyte flow occurs between the electrodes, and there is also electrolyte present around them, where inflow can represent the exchange of substances with the surrounding electrolyte region. The inlet boundary c i = c i , 0 , as shown in Figure 1b. Applying a pressure constraint by specifying the pressure as 1 atm facilitates substance exchange with the external environment. It is assumed that the electrolyte undergoes natural convection driven by gravity in the downward z-direction.
When investigating the “inert nodule”, we assume that no reaction occurs at the nodule edges. Hence, the edge conditions for the occurrence of electrode reactions are modified to insulation.
Table 1 presents the other main technical parameters used in the paper, and previous research in the literature [12,32] also used similar parameter settings.

3. Results and Discussion

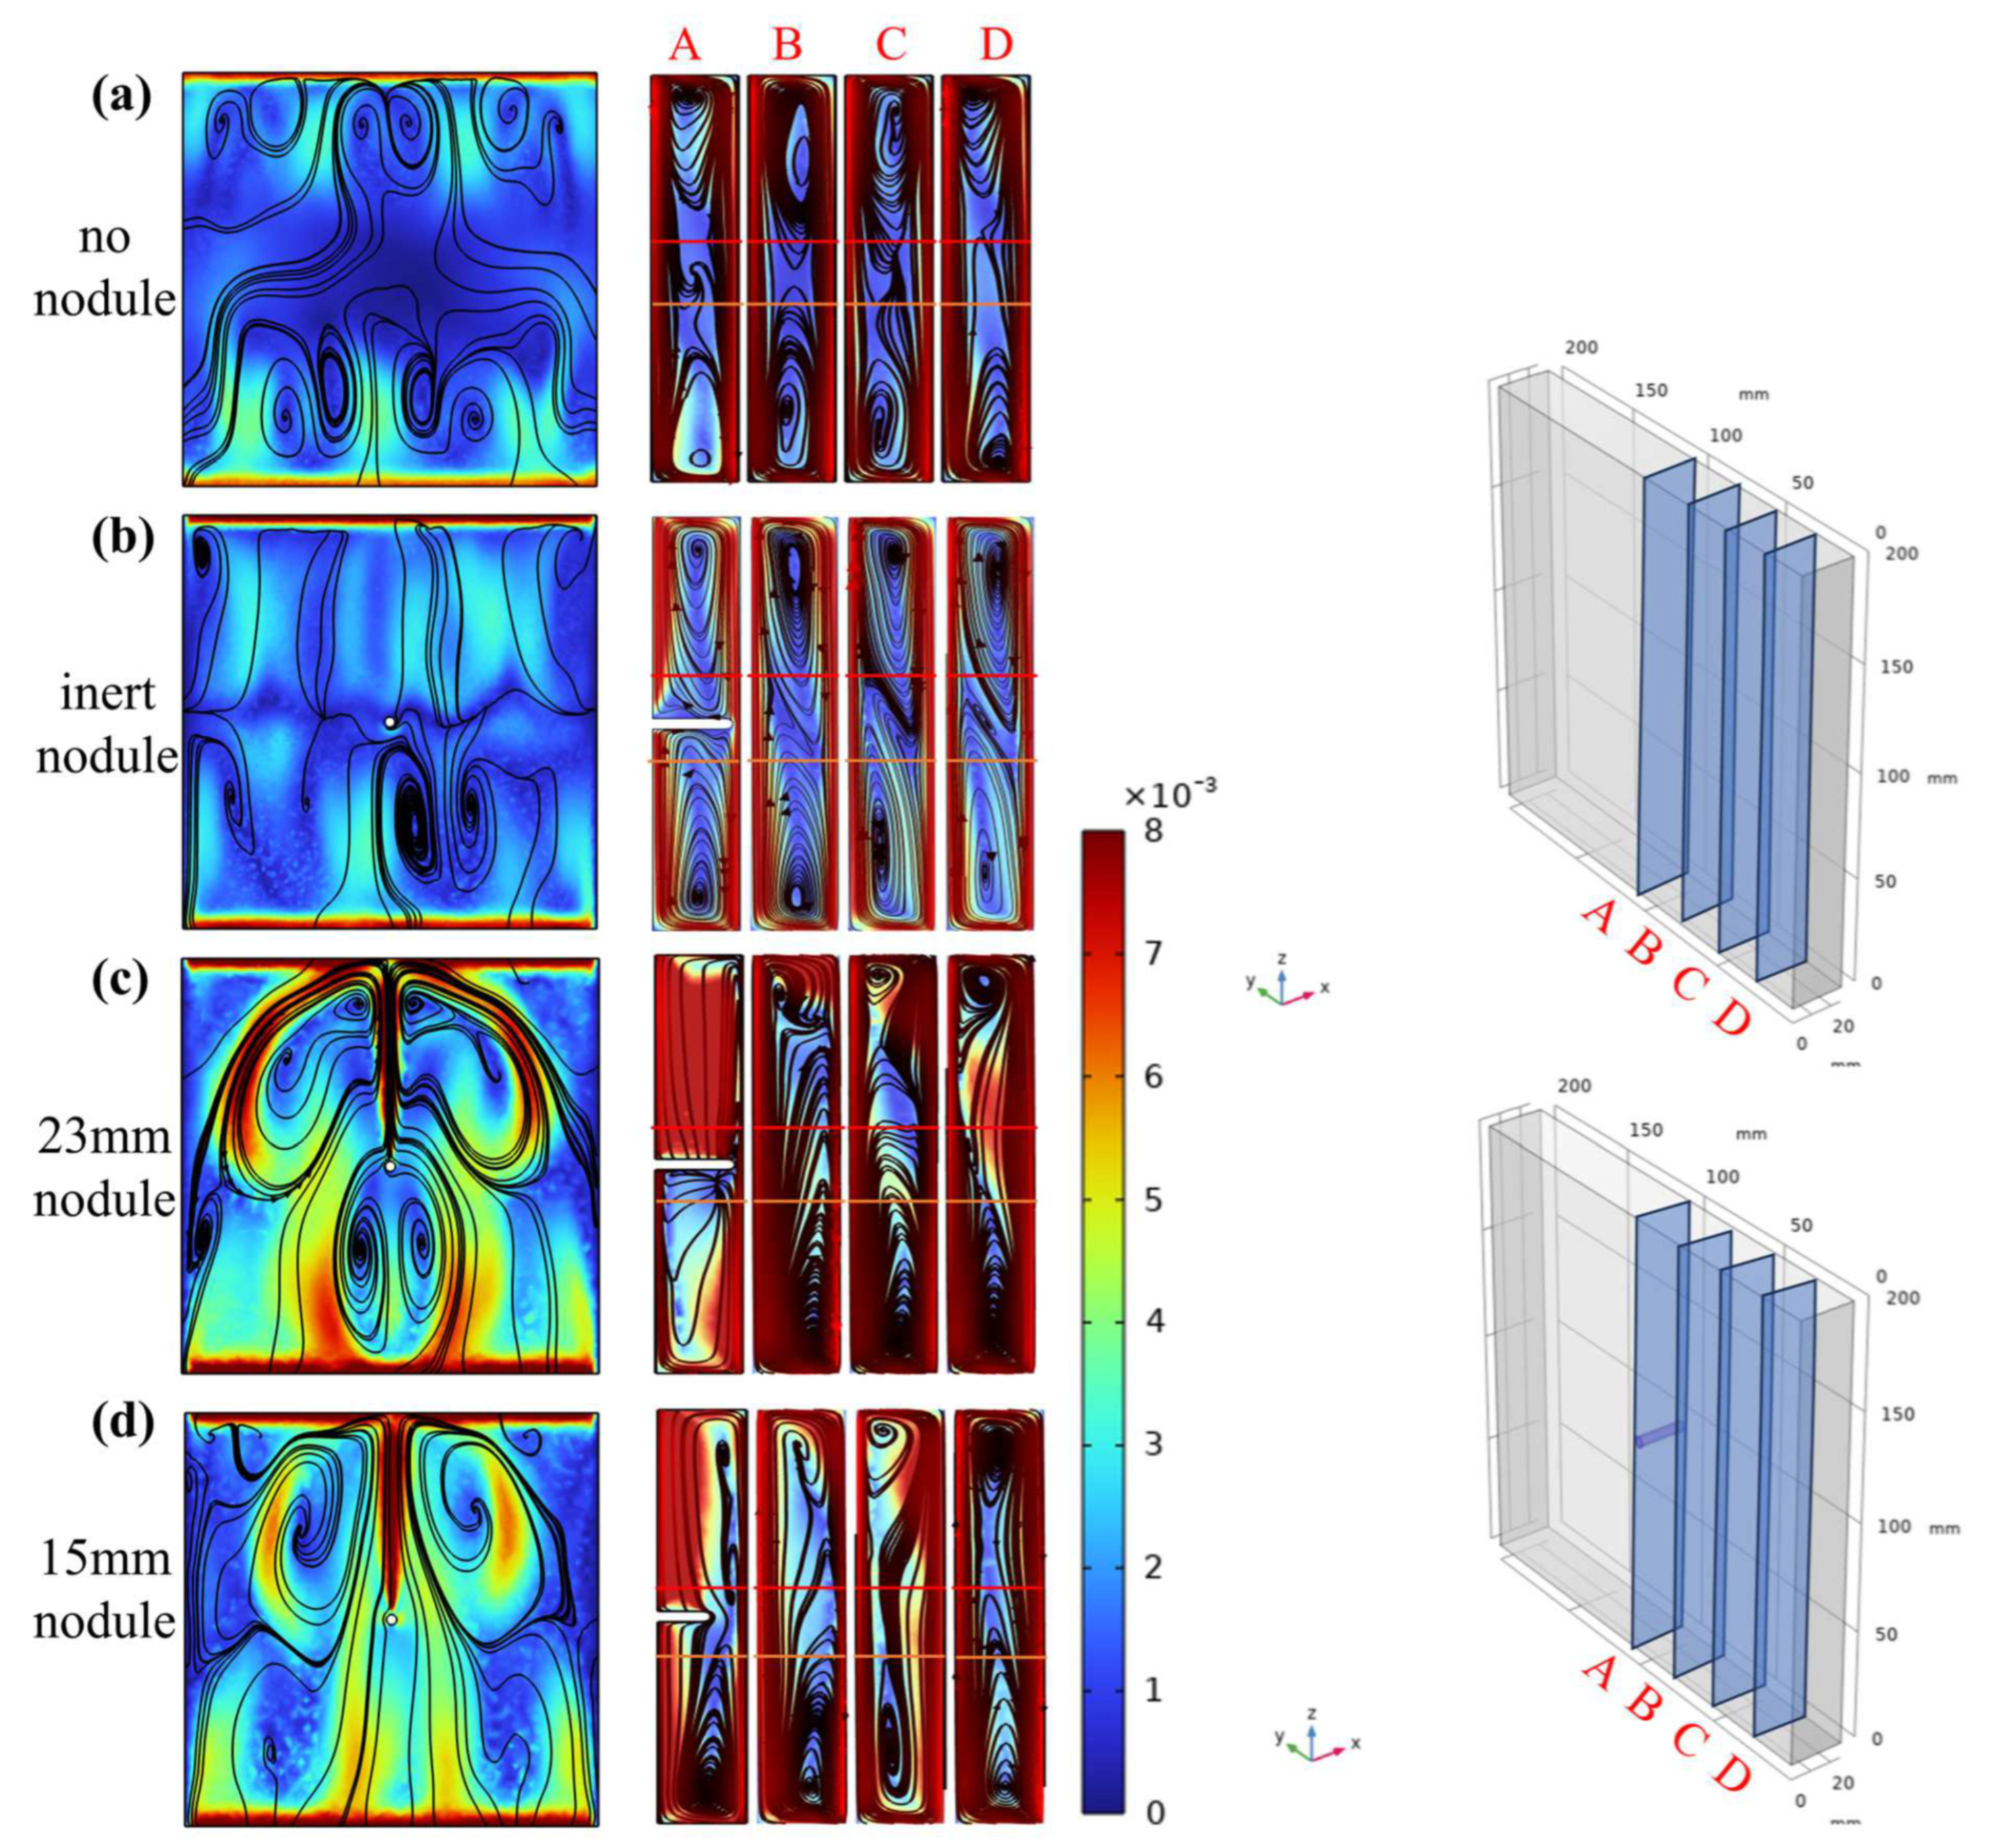
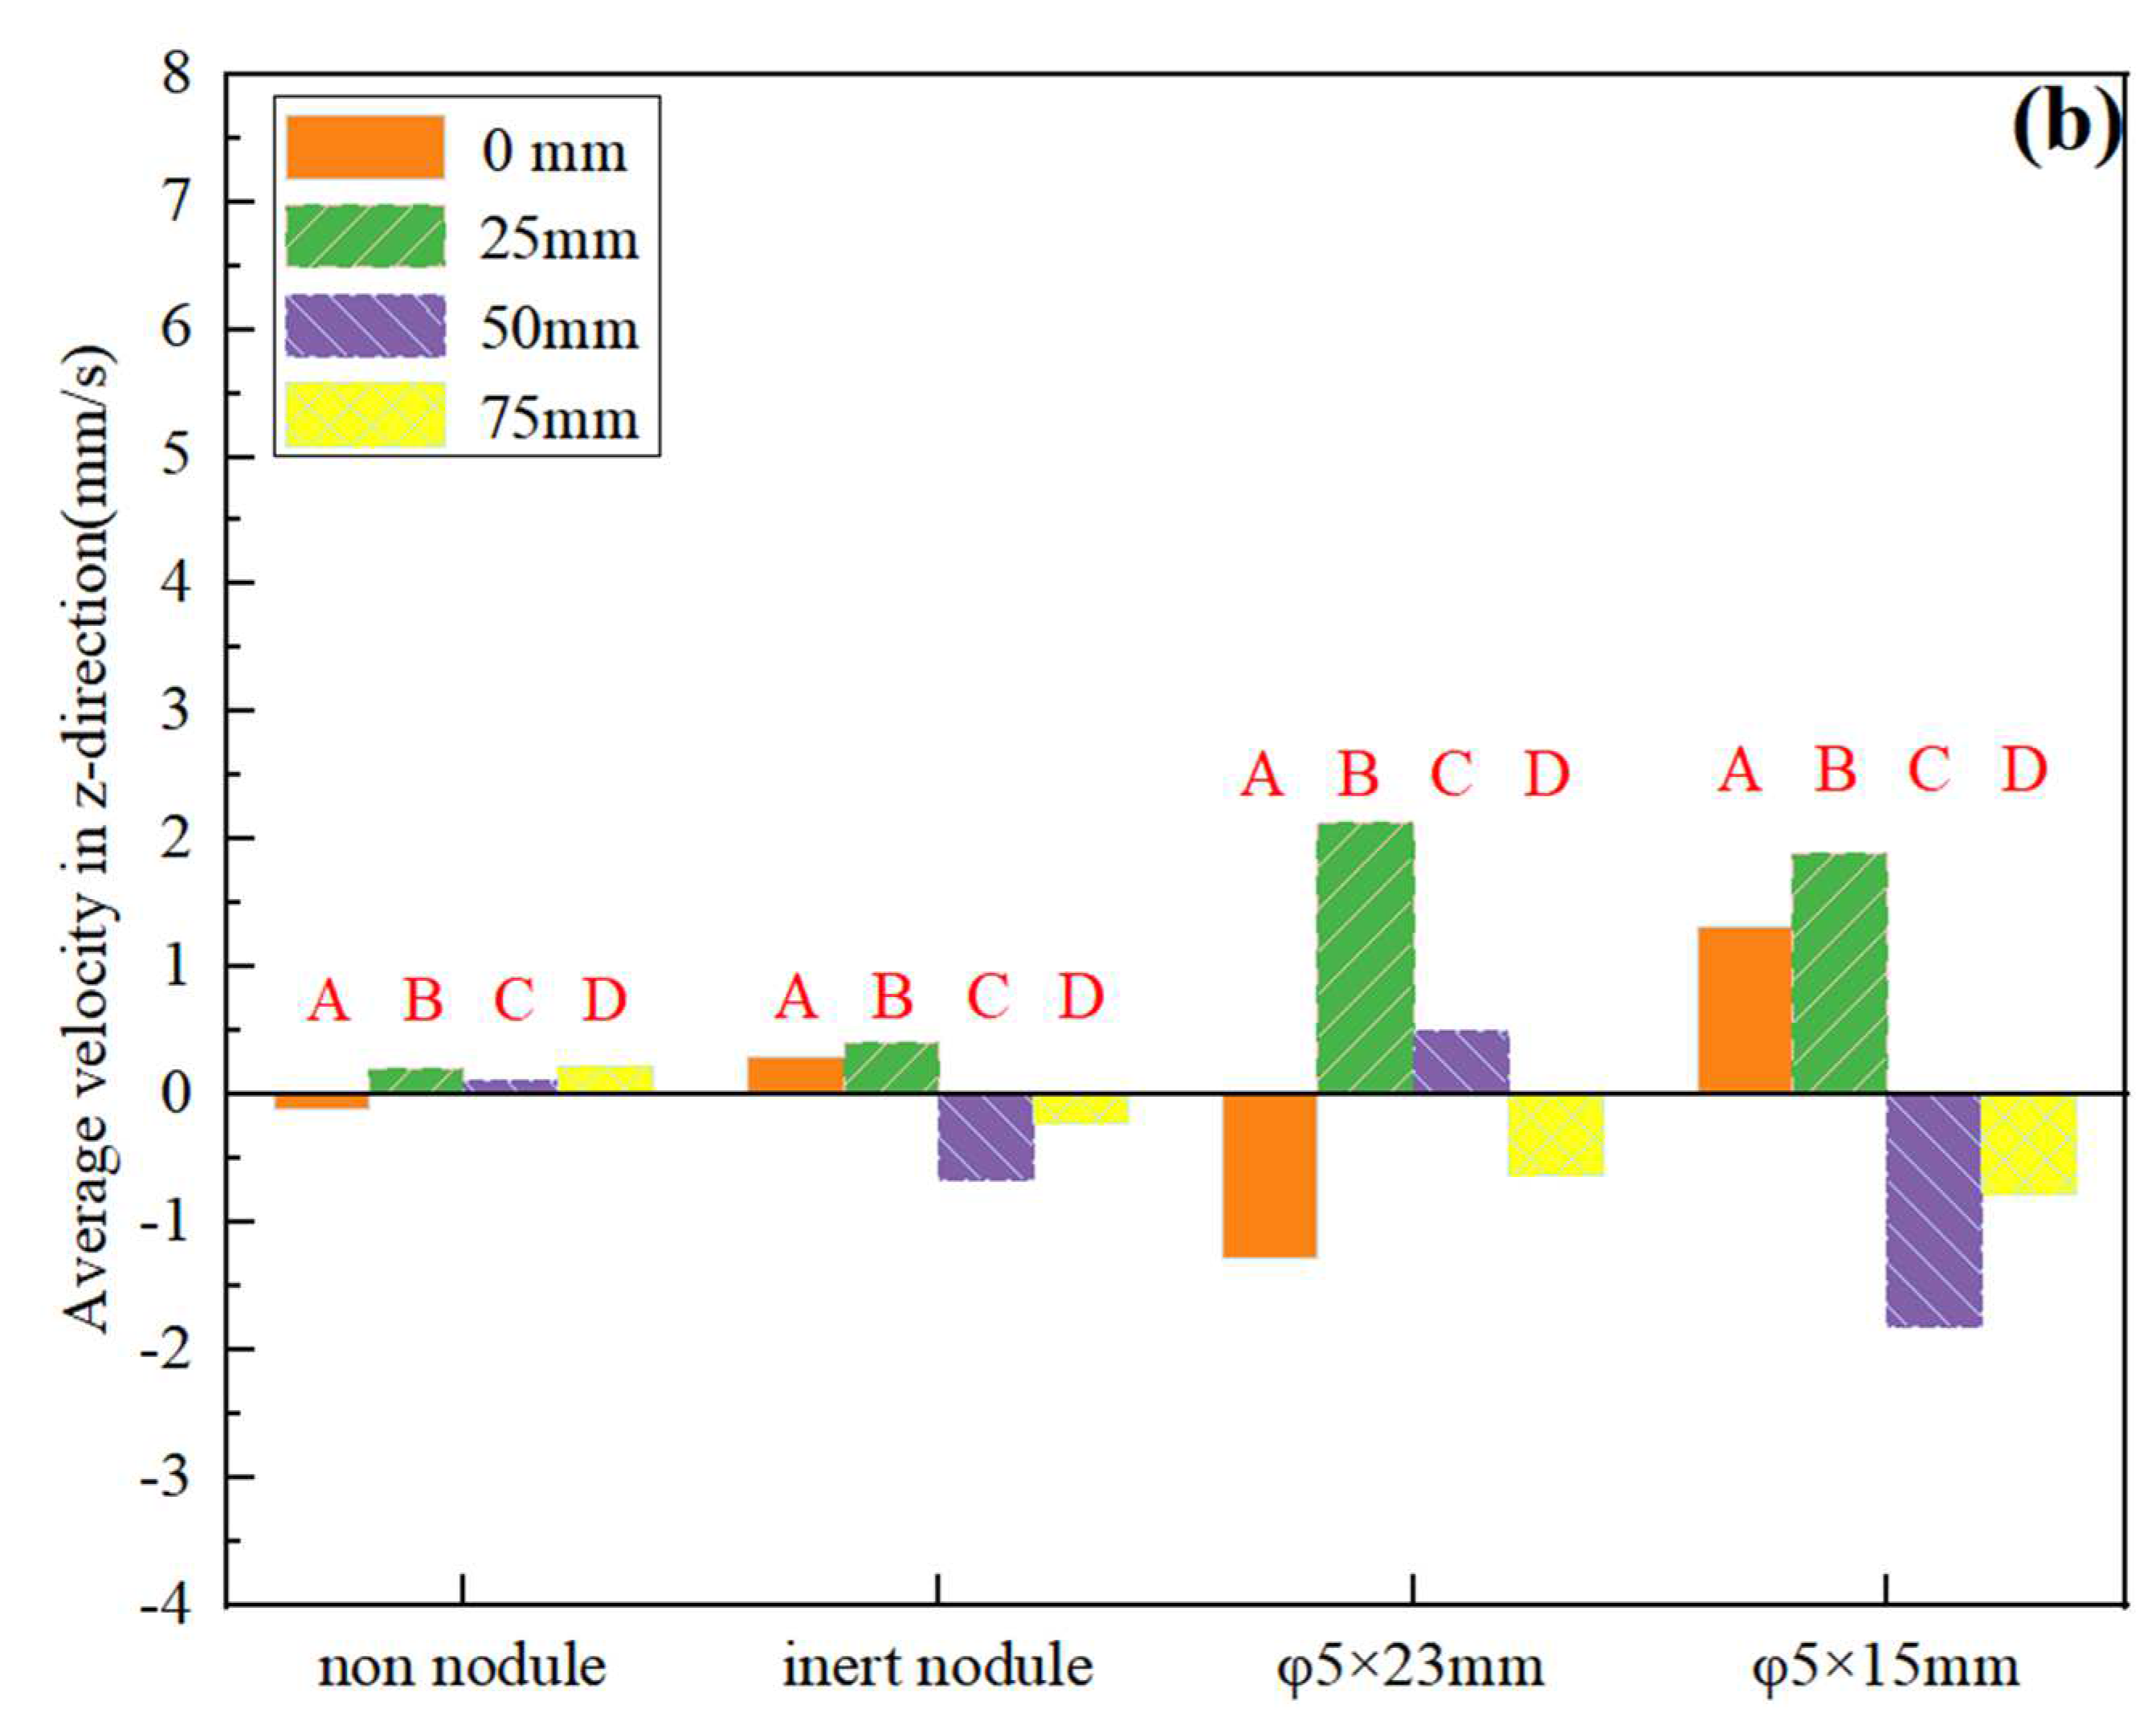
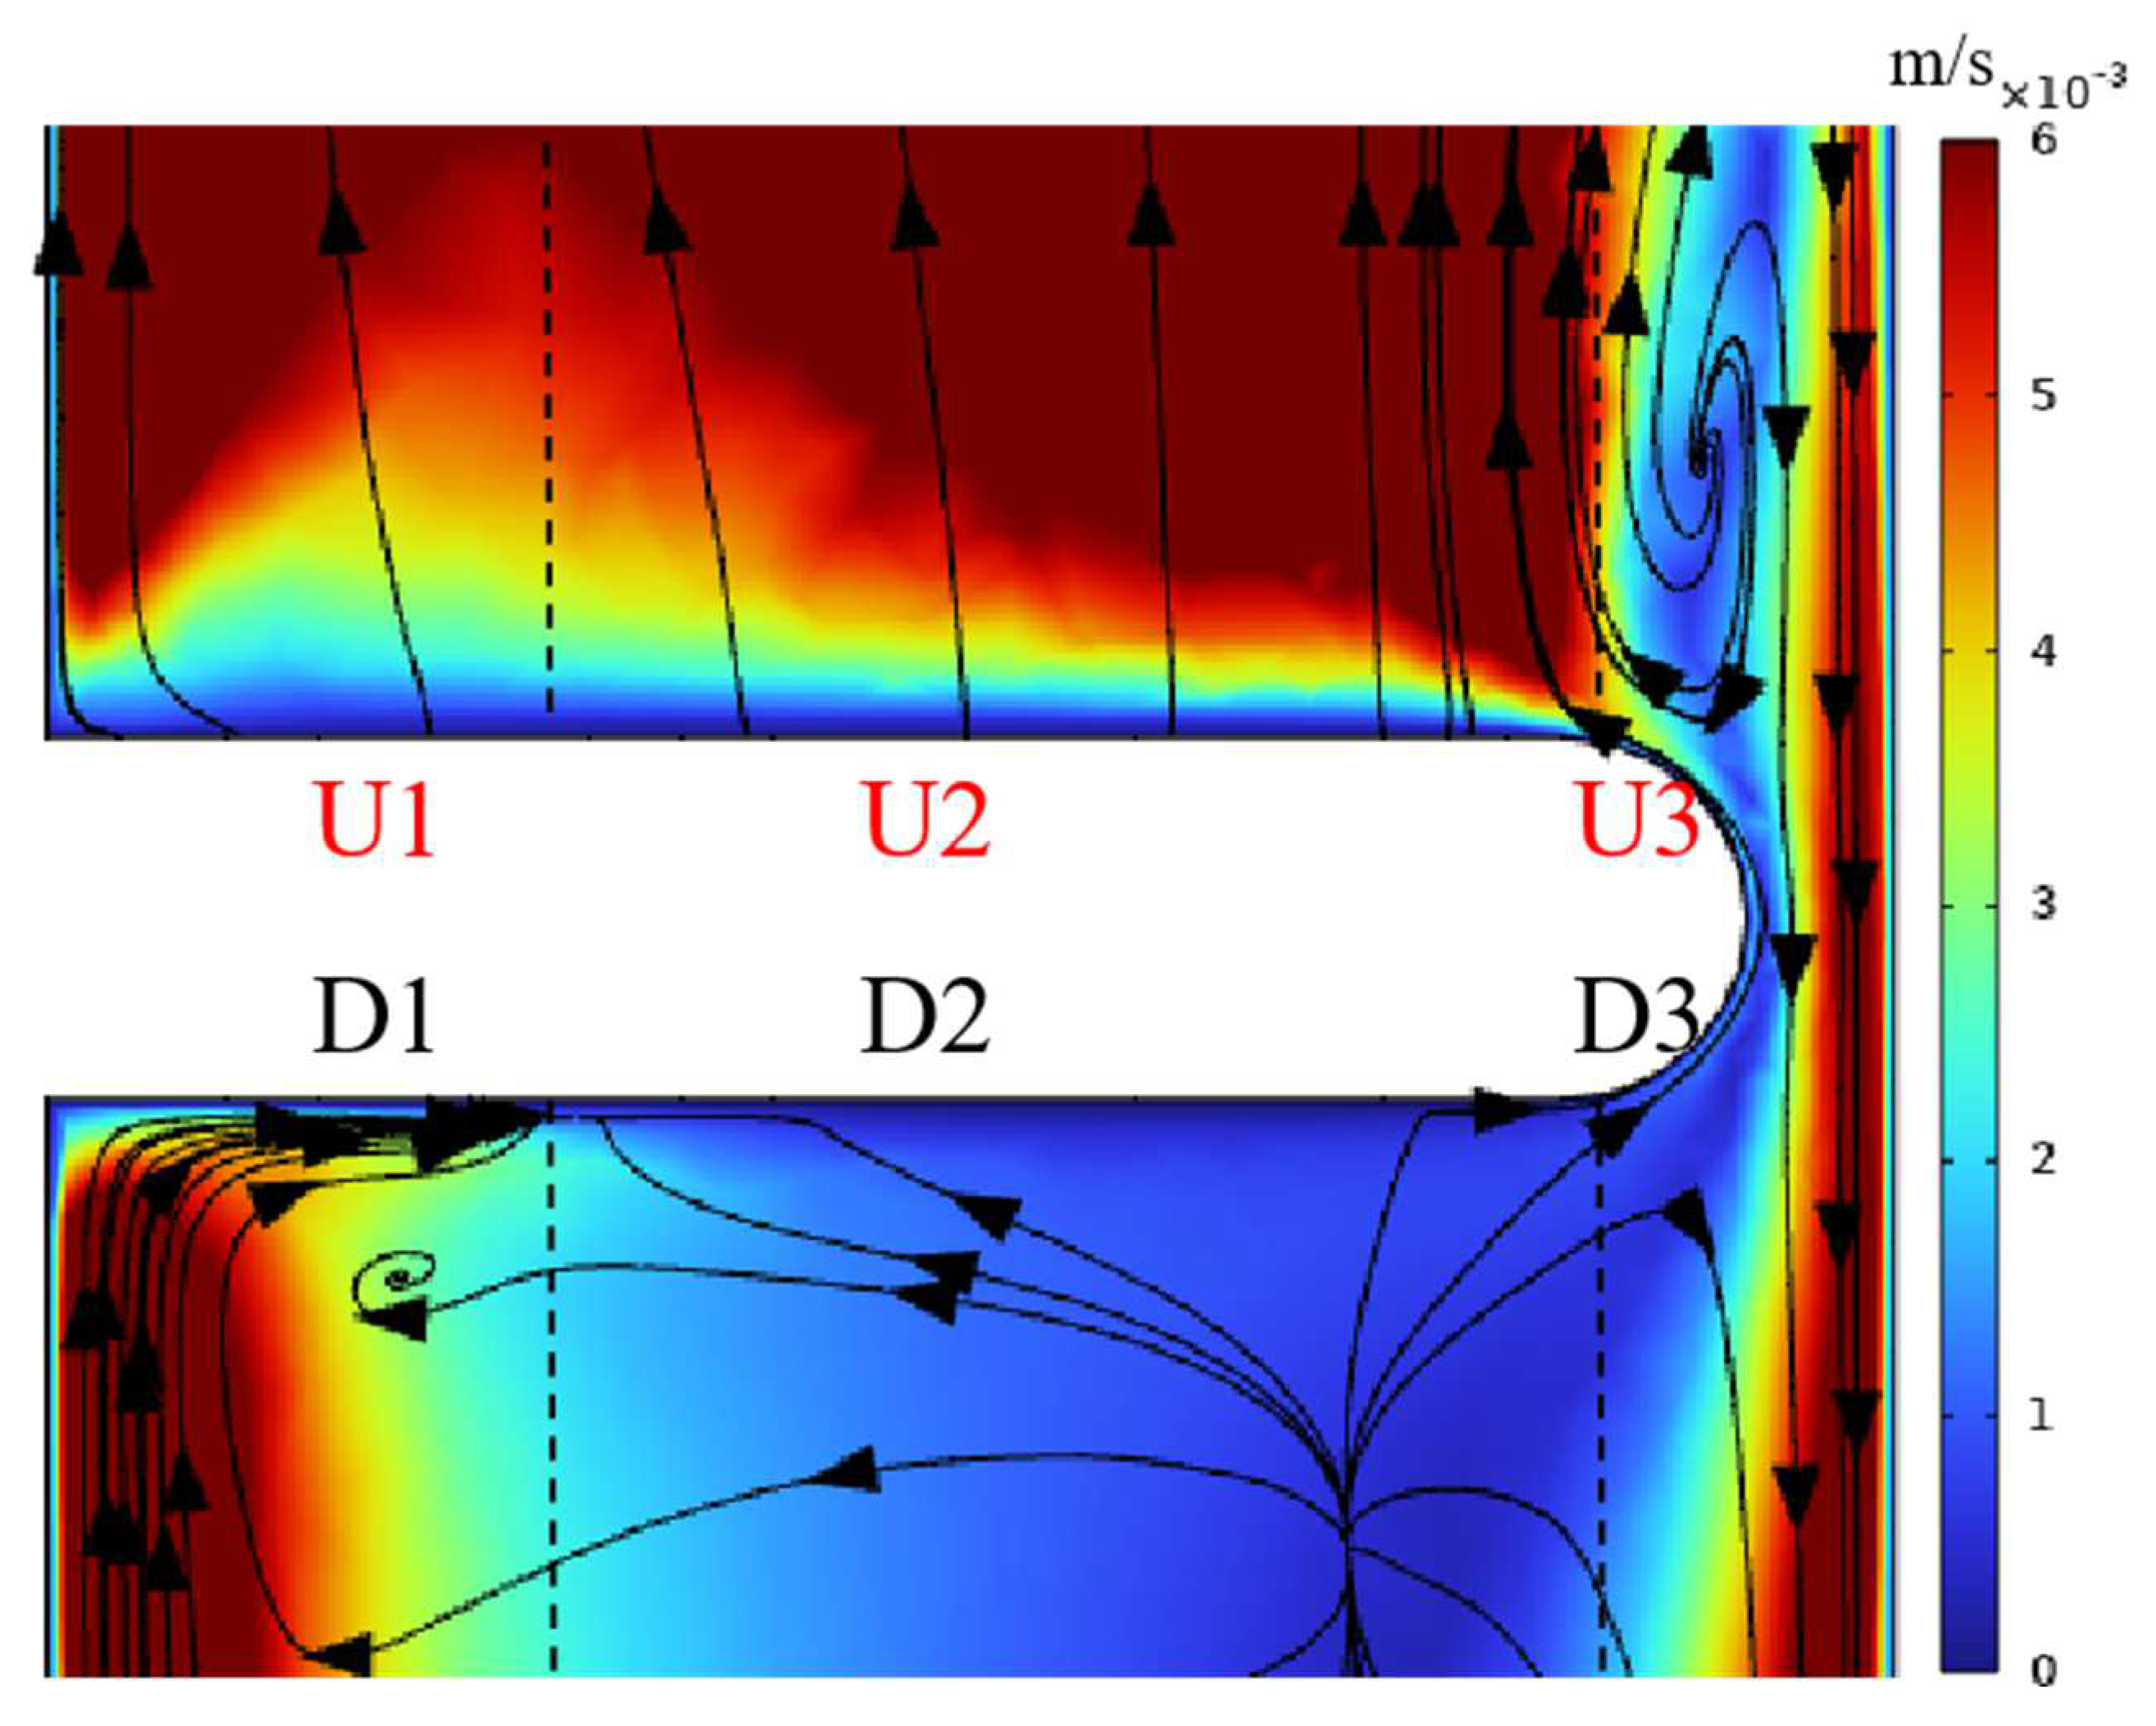
3.1. Characteristics and Analysis of the Electrolytic Process

The electrolyte flow patterns for normal electrolysis (0 mm), inert nodule, active nodule, and smaller active nodule (15 mm) are shown in Figure 2. (a–d) consist of YZ cross-sections and XZ longitudinal sections, where the XZ section corresponds to the A–D in the three-dimensional model on the right side. It is worth noting that, due to the symmetry of the electrolyte flow, only half of the electrolytic cell was studied.
Figure 2a depicts the flow field distribution during normal electrolysis without a nodule. The production of copper ions at the anode and their consumption at the cathode lead to a concentration difference of copper ions in the nearby electrolyte, resulting in the formation of density difference. This density difference, under the influence of gravity, induces natural convection and the formation of downwards flow near the anode and upwards flow near the cathode, which has been reported in the literature [33,34]. In the inter-electrode, the internal flow velocity of the electrolyte is uniform and flows smoothly. The convection speed is relatively steady, and the presence of two vortices, like the findings in the literature [6], is observed.
Figure 2b shows that neglecting the reduction reaction of copper ions on the nodule surface has a small influence on the flow of the electrolyte. The overall natural convection pattern, characterized by downwards flow near the anode and upwards flow near the cathode, remains relatively unchanged, with slight variations. In the vertical cross-section (XZ cross-section), the electrolyte is divided into upper and lower parts by nodule. Compared to the case without a nodule, there is a certain increase in swirl size. In the transverse cross-section (YZ cross-section), the number of small swirls decreases.
When considering the occurrence of reduction reaction on the surface of the nodule described above, the flow state of the electrolyte is significantly disturbed, as shown in Figure 2c. The electrolyte flow rate above the nodule local increases significantly, and two distinct vortices can be observed in the transverse cross-section (YZ cross-section). The bottom electrolyte of electrolytic cell flows around just beneath the nodule and merges into the upper local from both sides of the nodule. As a result, significant differences in flow velocity between the upper and lower parts appear in the middle section of the nodule. These characteristics are particularly prominent in the vertical cross-section through the center of the nodule. As the vertical cross-section moves away from the nodule, this effect gradually weakens, but there is still a certain disturbance observed at a distance from the nodule center.
When the length of the nodule is reduced to 15 mm, as shown in Figure 2d, it still exhibits the main influencing tendencies described earlier. By comparing Figure 2c,d, we can discuss the size of the area in which the length of the nodule affects the electrolyte, as shown in Figure 3. Figure 3 presents the line averages of 20 mm in the z-direction above and below the axial center line of the nodule for different nodule conditions of different lengths, with positions A–D corresponding to the red lines (above the nodule) and orange lines (below the nodule) in different cross-sections in Figure 2. Figure 3a illustrates a significant increase in the electrolyte flow velocity upward along the z-direction due to the occurrence of the active nodule (reduction reactions occurring). For the nodule with a longer length (23 mm), this effect still exists even at 50 mm away from the central cross-section, and the electrolyte-to-flow downward trend continues to dominate as one moves far away from the local nodule. For nodules with a length of 15 mm, the electrolyte at the center of the cross-section has a smaller flow velocity, and at the locations far from the central cross-section, it has transformed into a dominant downward flow trend. The statistical data for the lower part (Figure 3b) reflect the enhanced disturbance caused by the nodules, but there is no significant difference observed for nodules of different lengths.
In conclusion, compared to the inert nodule, the occurrence of an electrode reaction on the nodule grown under real operating conditions has a significant impact on electrolyte flow, especially the flow state of the upper edge of the nodule. The changes in the flow state will inevitably affect the liquid-phase mass transfer process in the electrolyte, which in turn affects the deposition of copper ions. We believe this may be the reason for the nodule exhibiting dendritic growth and the appearance of nodule clusters in lamellar locals near the nodule. The specific impact of the electrolyte flow state on the surface reduction reaction of the nodules will be discussed in detail in the following section.

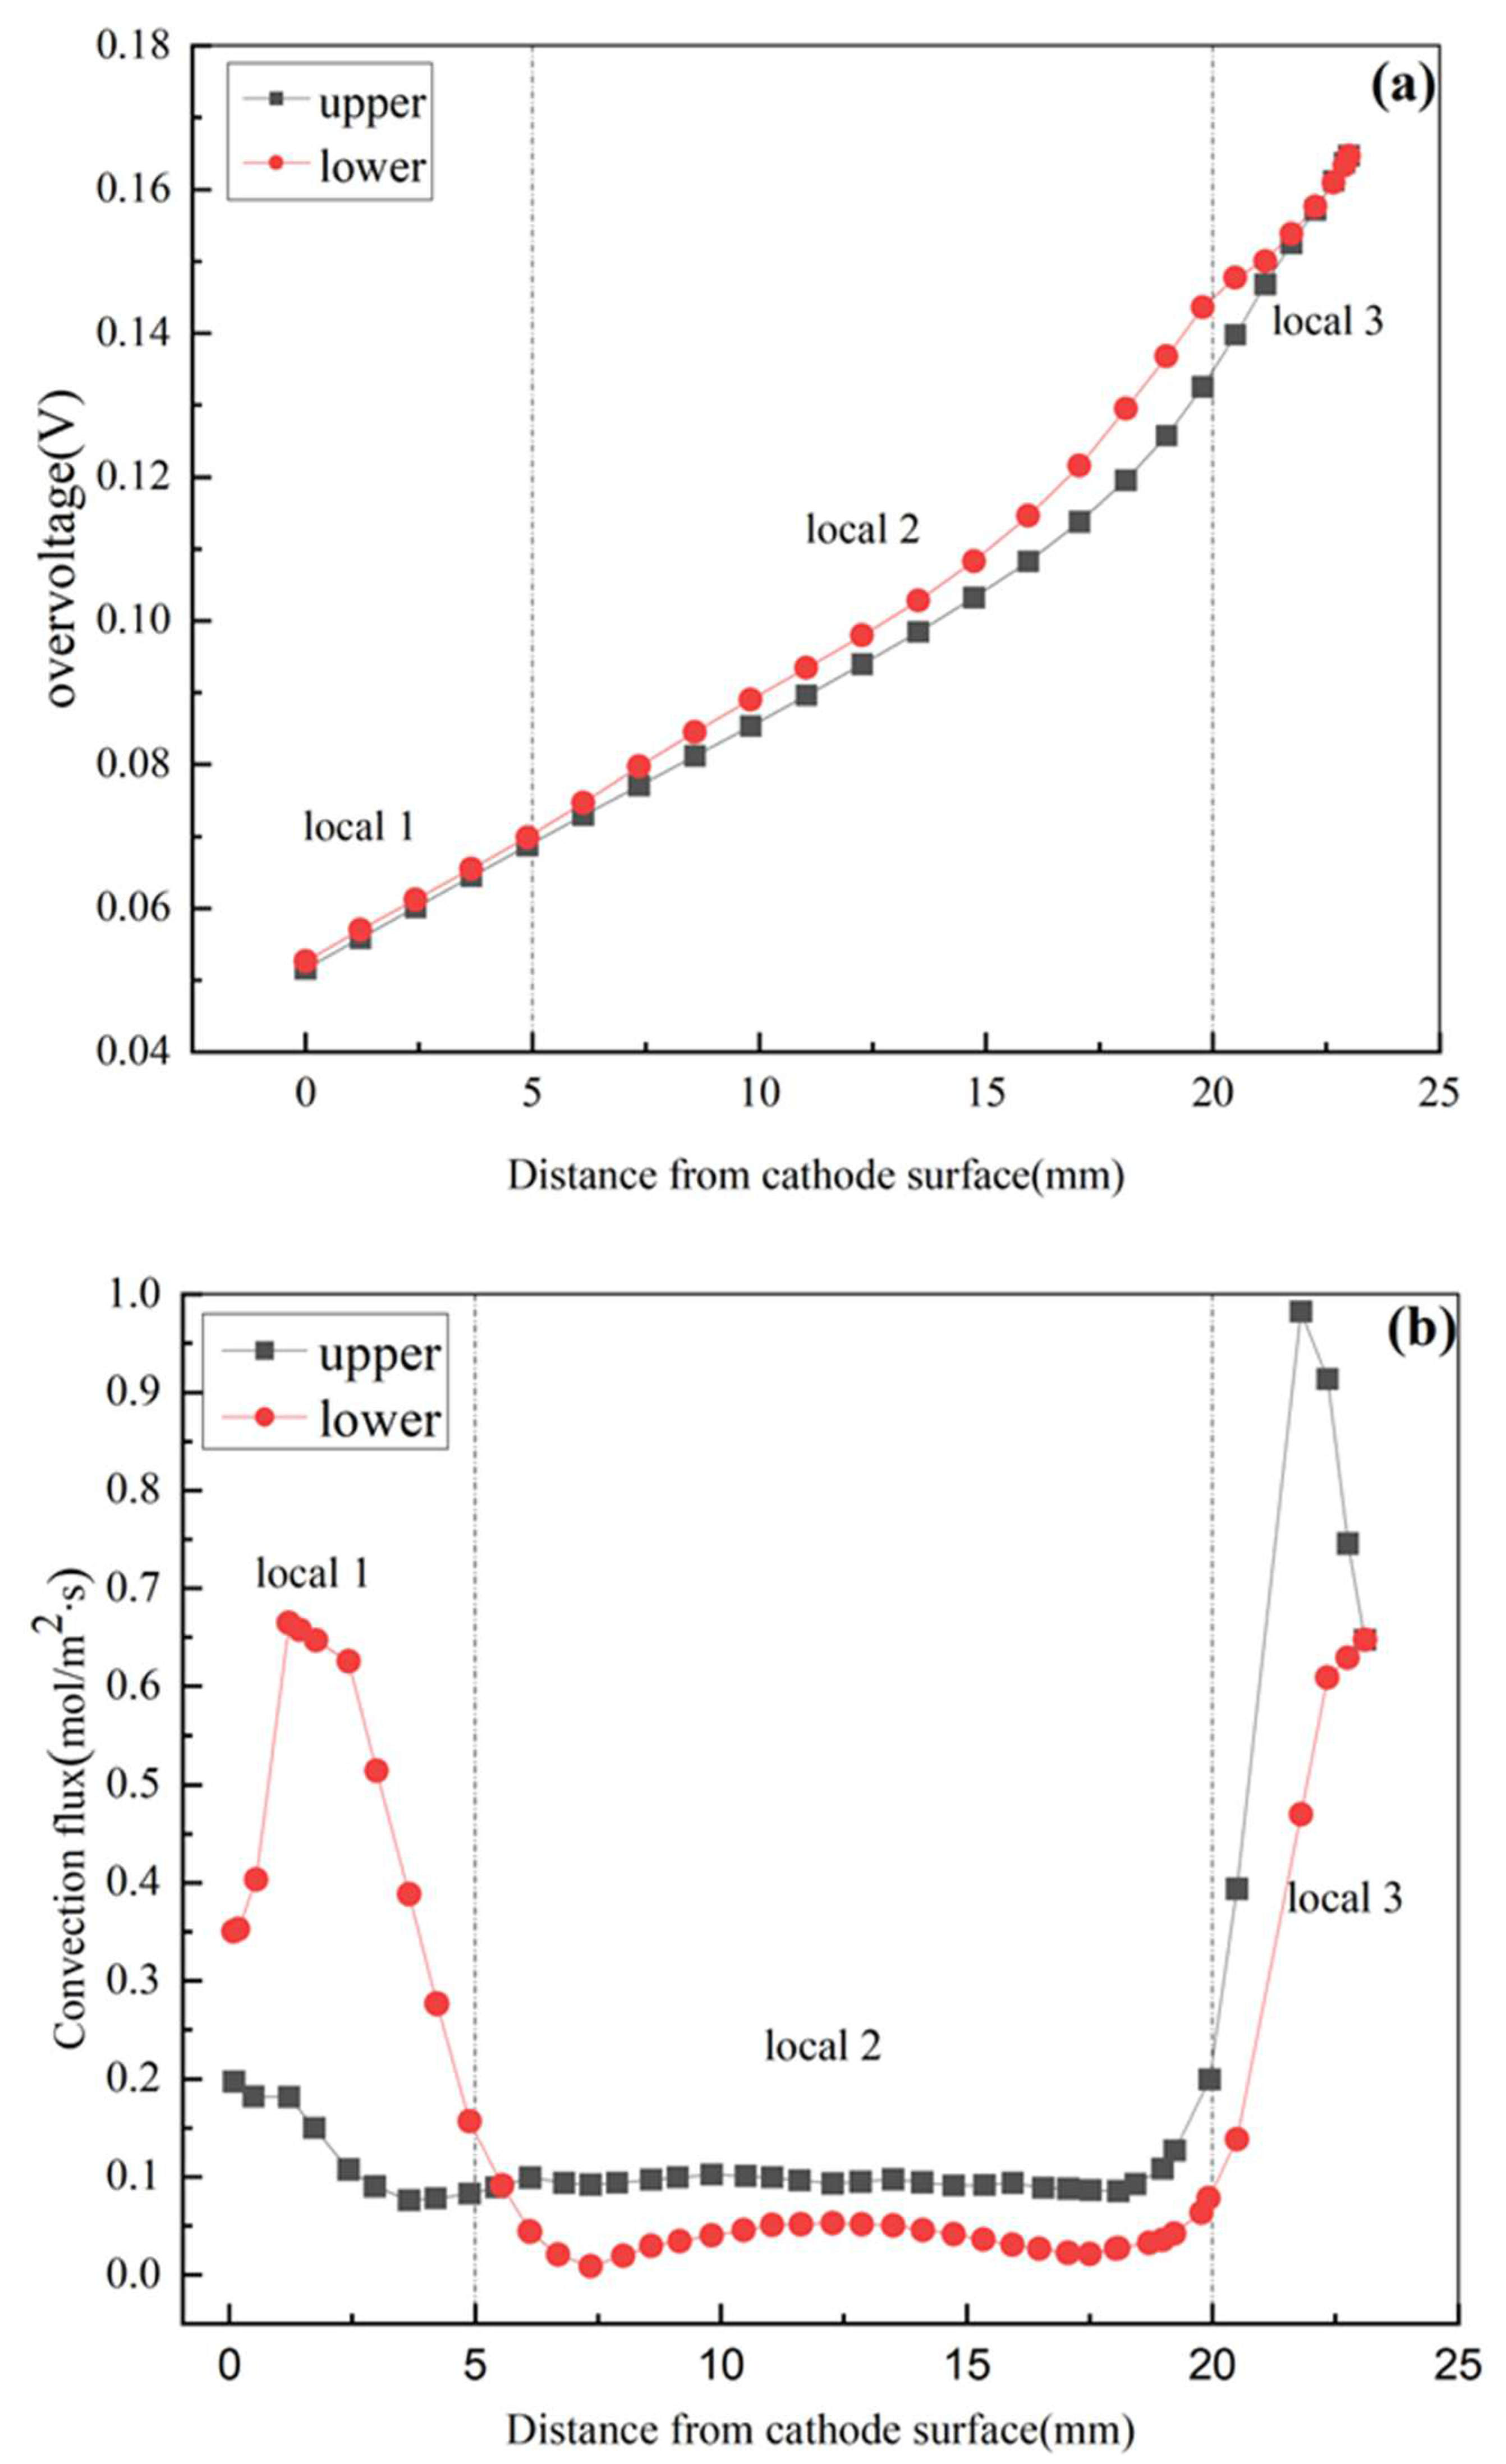
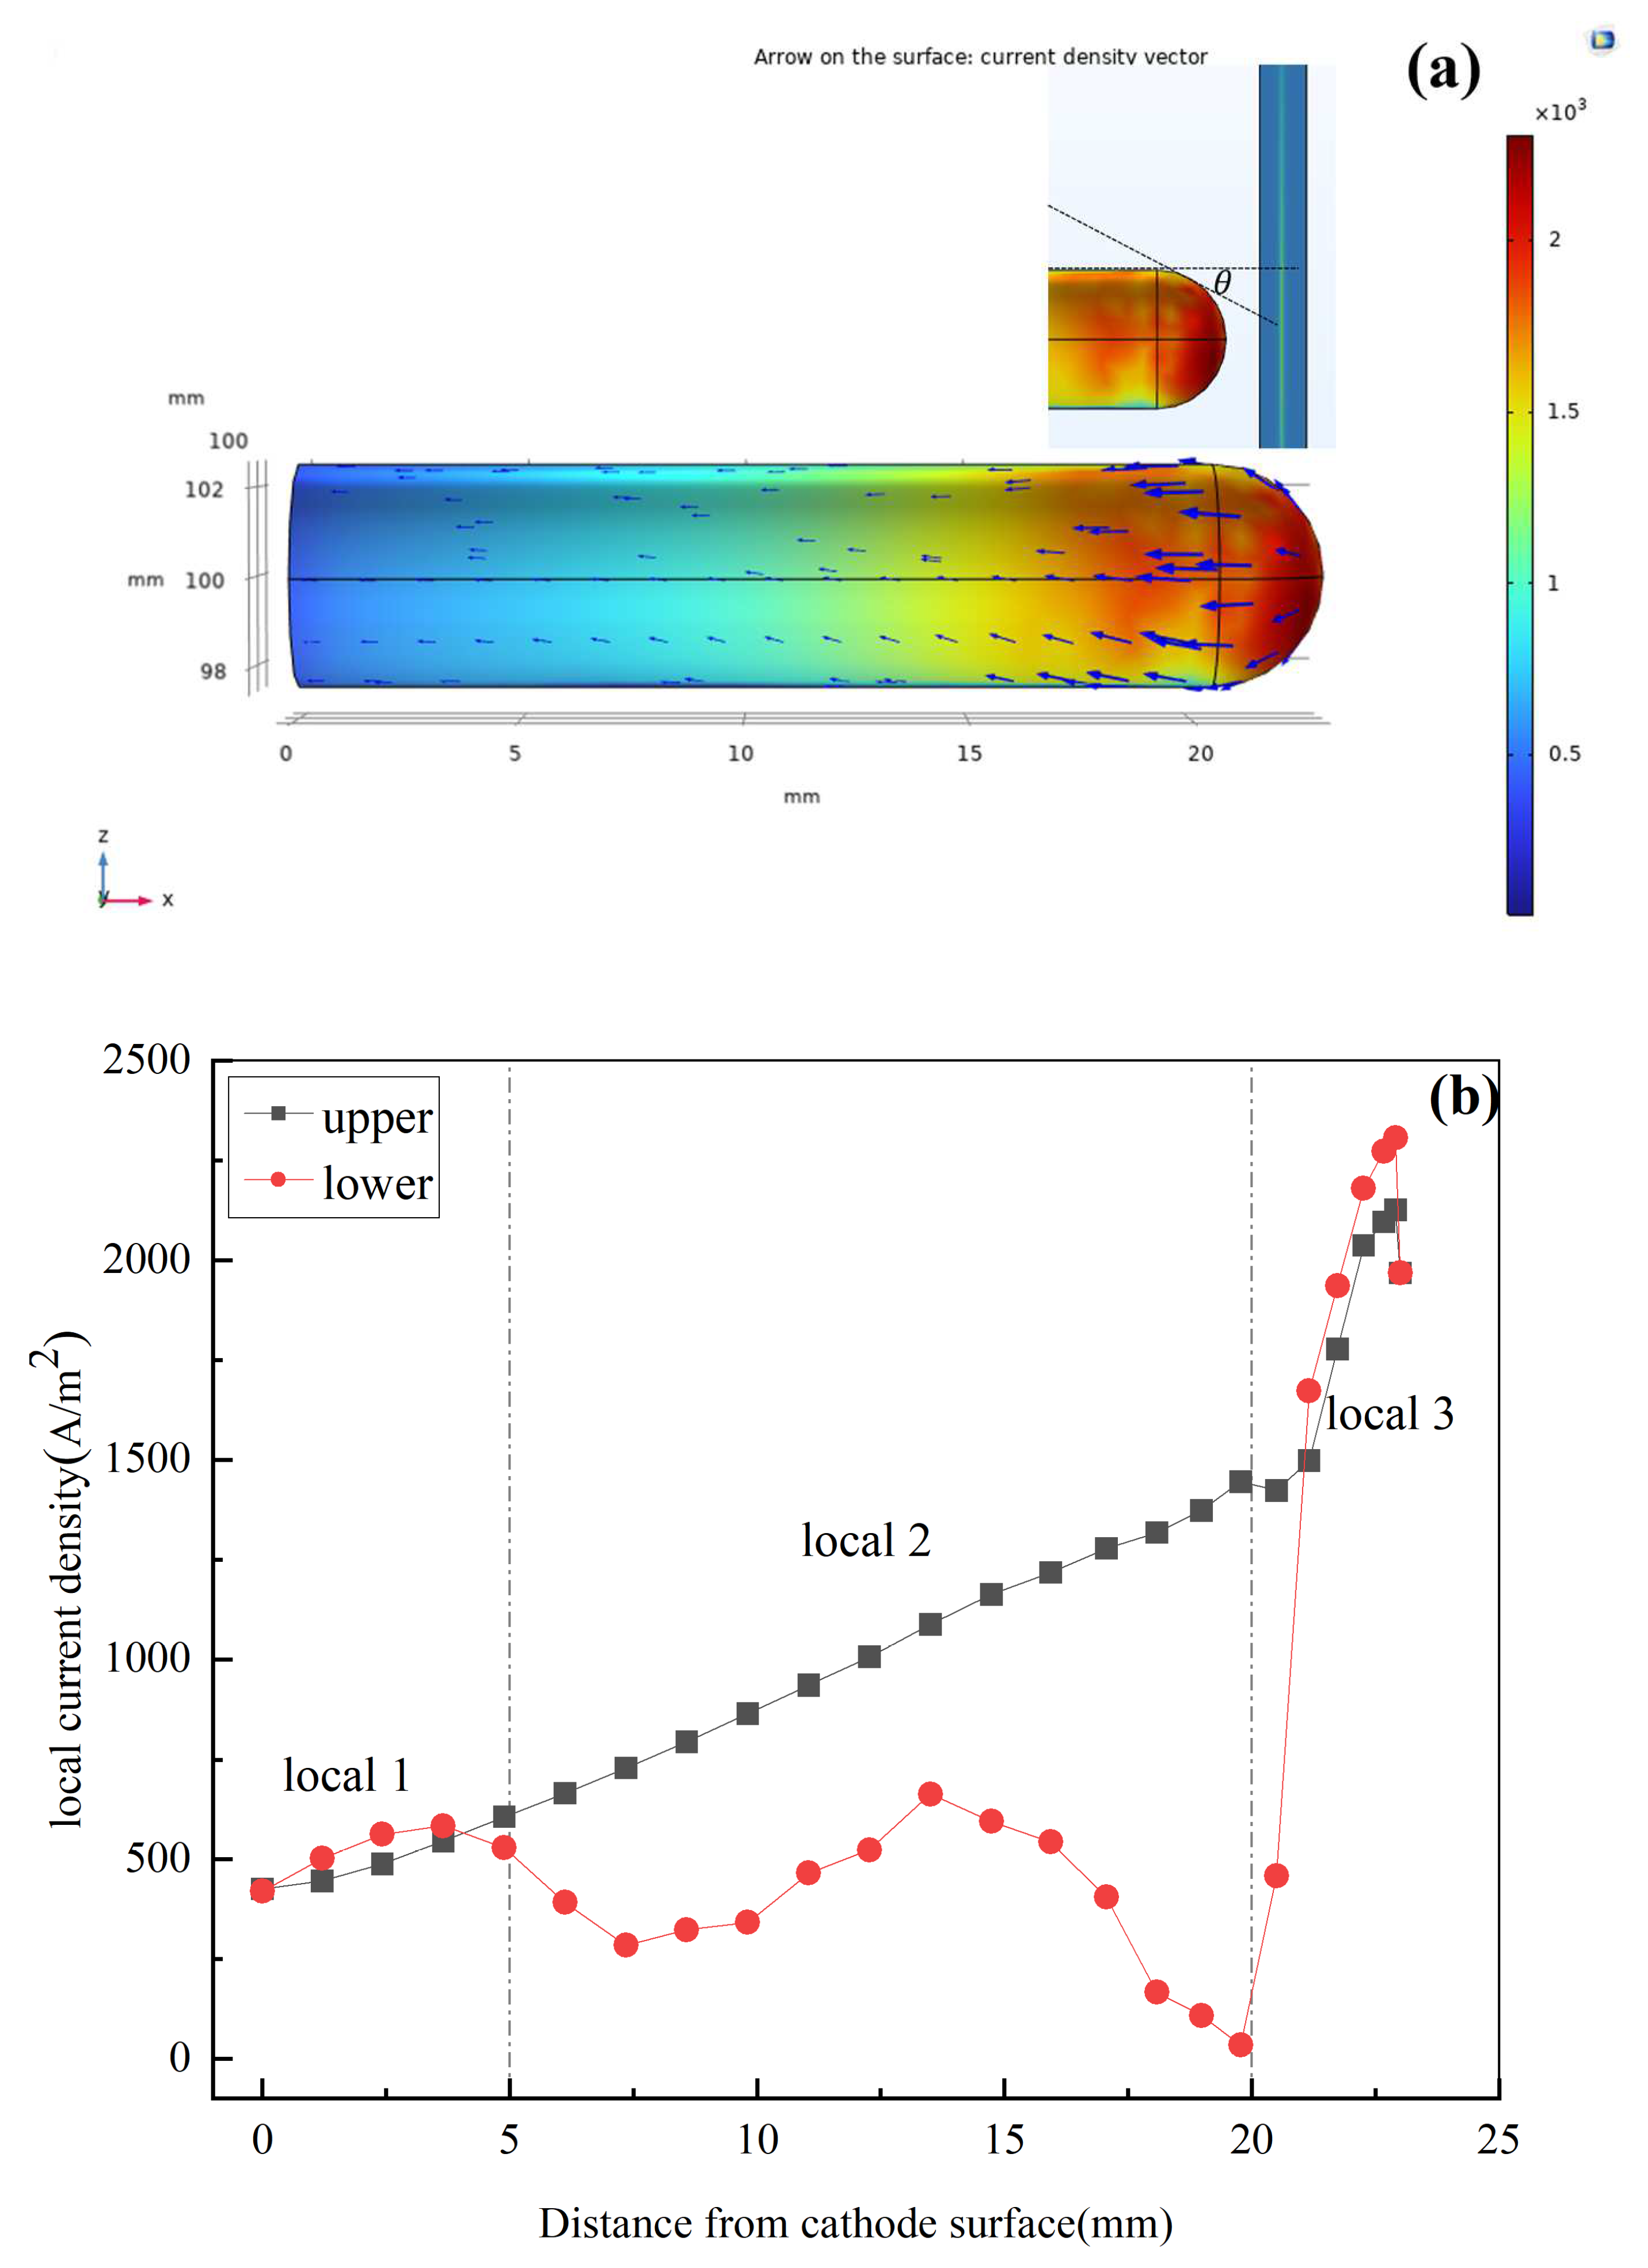
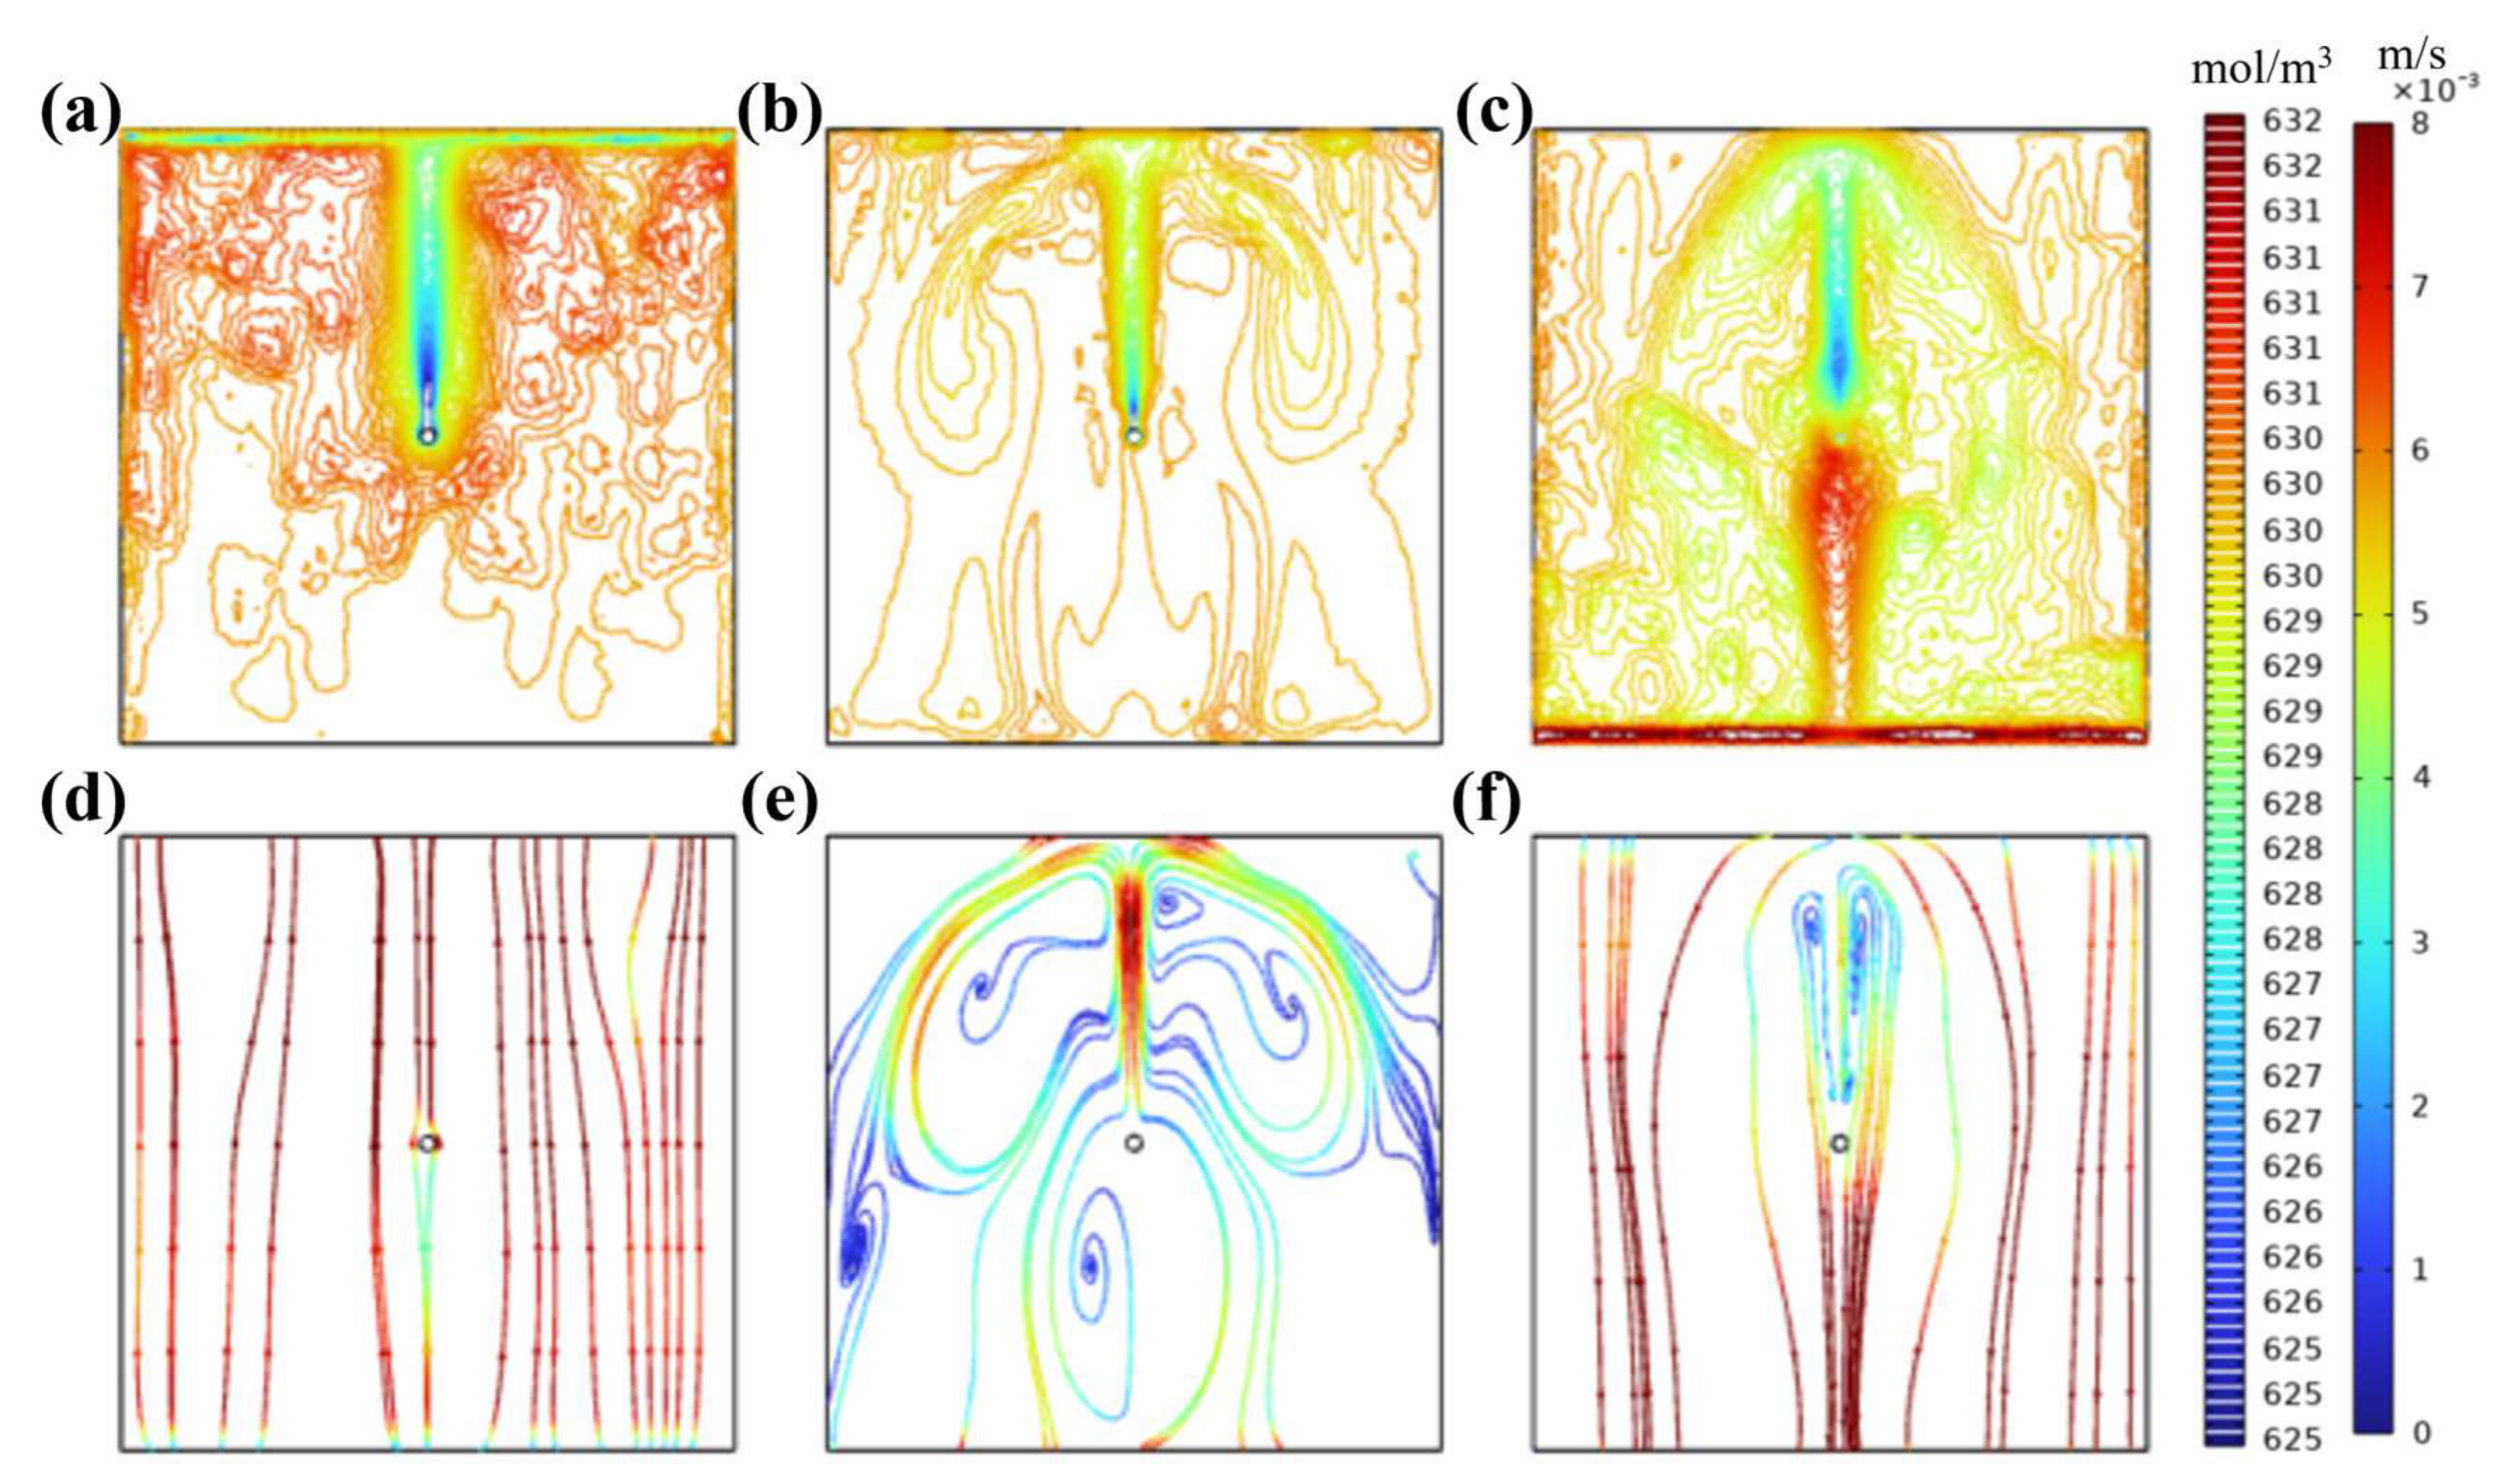
3.2. Current Density Distribution of Nodule Surface and Analysis

Figure 4a shows the local current density distribution on the surface of the nodule, and Figure 4b shows the variation in current density along the distance from the cathode surface. According to the pattern of the curve graph, the upper and lower edges of the nodule can be divided into the following six locals.
U1—the upper edge of the nodule area within a distance of 0–5 mm from the cathode surface, namely the upper edge of the nodule root.
U2—the upper edge of the nodule area within a distance of 5–20 mm from the cathode surface, namely the middle of the nodule upper edge.
U3—the nodule upper edge area within a distance of 20 mm to the tip of the nodule from the cathode surface, namely the upper edge of the head of the nodule.
D1—the lower edge of the nodule area within a distance of 0–5 mm from the cathode surface, namely the lower edge of the nodule root.
D2—the lower edge of the nodule area within a distance of 5–20 mm from the cathode surface, namely the middle of the nodule lower edge.
D3—the nodule lower edge area within a distance of 20 mm to the tip of the nodule from the cathode surface, namely the lower edge of the head of the nodule.
Among them, the current density of the upper edge of the nodule increases with the distance from the surface of distance from the cathode, showing a significant linear correlation. The current density in the U3, and D3 locals is sharp, and it is significantly larger than in locals U1, U2, and D1. The current density in the D2 local fluctuates at a lower level (0–600 A/m2). It can be seen that the distribution of current density on the surface of the nodule is extremely uneven. The local current density reflects the electrode reaction rate, and different deposition rates on the surface of the nodule will cause asymmetric growth of the nodule from upper and lower parts, i.e., a significantly larger conical dendrite at the head. Other experimental [35,36] observations indeed confirm the growth of these phenomena.
The electrode reaction kinetics law indicates that the electrode reaction rate is primarily controlled by the slowest step in the liquid phase mass transfer and electrochemical reaction steps.
Figure 5 presents the variation trends of local overvoltage and copper ion pair flux as the distance from the nodule surface at the upper and lower edges of the nodule. In the D2 local, the convective flux is extremely low, fluctuating only within the 0–0.05 mol/m2∙s range, which is unfavorable for the liquid-phase mass transfer of copper ions in this local and becomes the limiting step of the electrolytic reaction. Therefore, although the local overvoltage of the nodule surface on the D2 area increases with the increase in distance from the cathode surface, the local current density only fluctuates within the low value range. On the other hand, in the corresponding U2 local, the convective flux is approximately twice that of the D2 local, and the local current density increases with the increase in local overvoltage, indicating that the electrochemical reaction step replaces the liquid-phase mass transfer step as the dominating step in this local. This is also the reason for the increase in local current density in the U1 and U2 locals. In the U3 and D3 locals at the head of the tubercle, the sphere-like shape leads to a gradual change from a perpendicular to a parallel relationship between the tubercle surface and the anode, which introduces a new factor affecting the local current density (i.e., the angle θ between the cathode and anode surfaces, as in Figure 4a). We believe that the influence of deviation angle on the electrode reaction rate makes it one of the important factors affecting the size of current density. The impact of the geometric shape of nodules on the current density of nodules has been confirmed in previous studies [12].
It is worth noting that a downward trend in local current density was observed at the right end of the U3 and D3 locals, i.e., at the head of the nodule (Figure 3a), whereas the local overvoltage was still elevated and the convective fluxes were maintained at a relatively high level of more than 0.5 mol/m2∙s. In order to explain this phenomenon, we believe that it is reasonable to propose the concept of a convective flux threshold: since the convective mass transfer is the main pathway of liquid-phase mass transfer in the electrolyte, when the convective flux of the local on the surface of the nodule is lower than this threshold, the liquid-phase mass transfer step controls the rate of the electrode reaction, and the trend of the local current density change is in line with the trend of the convective flux, whereas when the convective flux is higher than this threshold.
When the convective flux is above the threshold, other steps, such as an electrochemical reaction step, control the electrode reaction rate, and the trend of the change in the local current density is consistent with the trend of the change in other factors such as local overvoltage. The magnitude of this threshold depends on the electrode reaction rate, and the sharp increase in the local current density in the local of U3 and D3, due to the increase in local overvoltage and the decrease in θ, greatly increases the threshold of the convective current, which results in the actual convective current at the tip of the head of the nodule being lower than the threshold of the local convective current, which causes the step of controlling the electrode reaction rate in this area to be shifted back to the liquid-phase mass transfer, which leads to the decreasing tendency of the local current density in this area. This causes the local current density here to fall back.

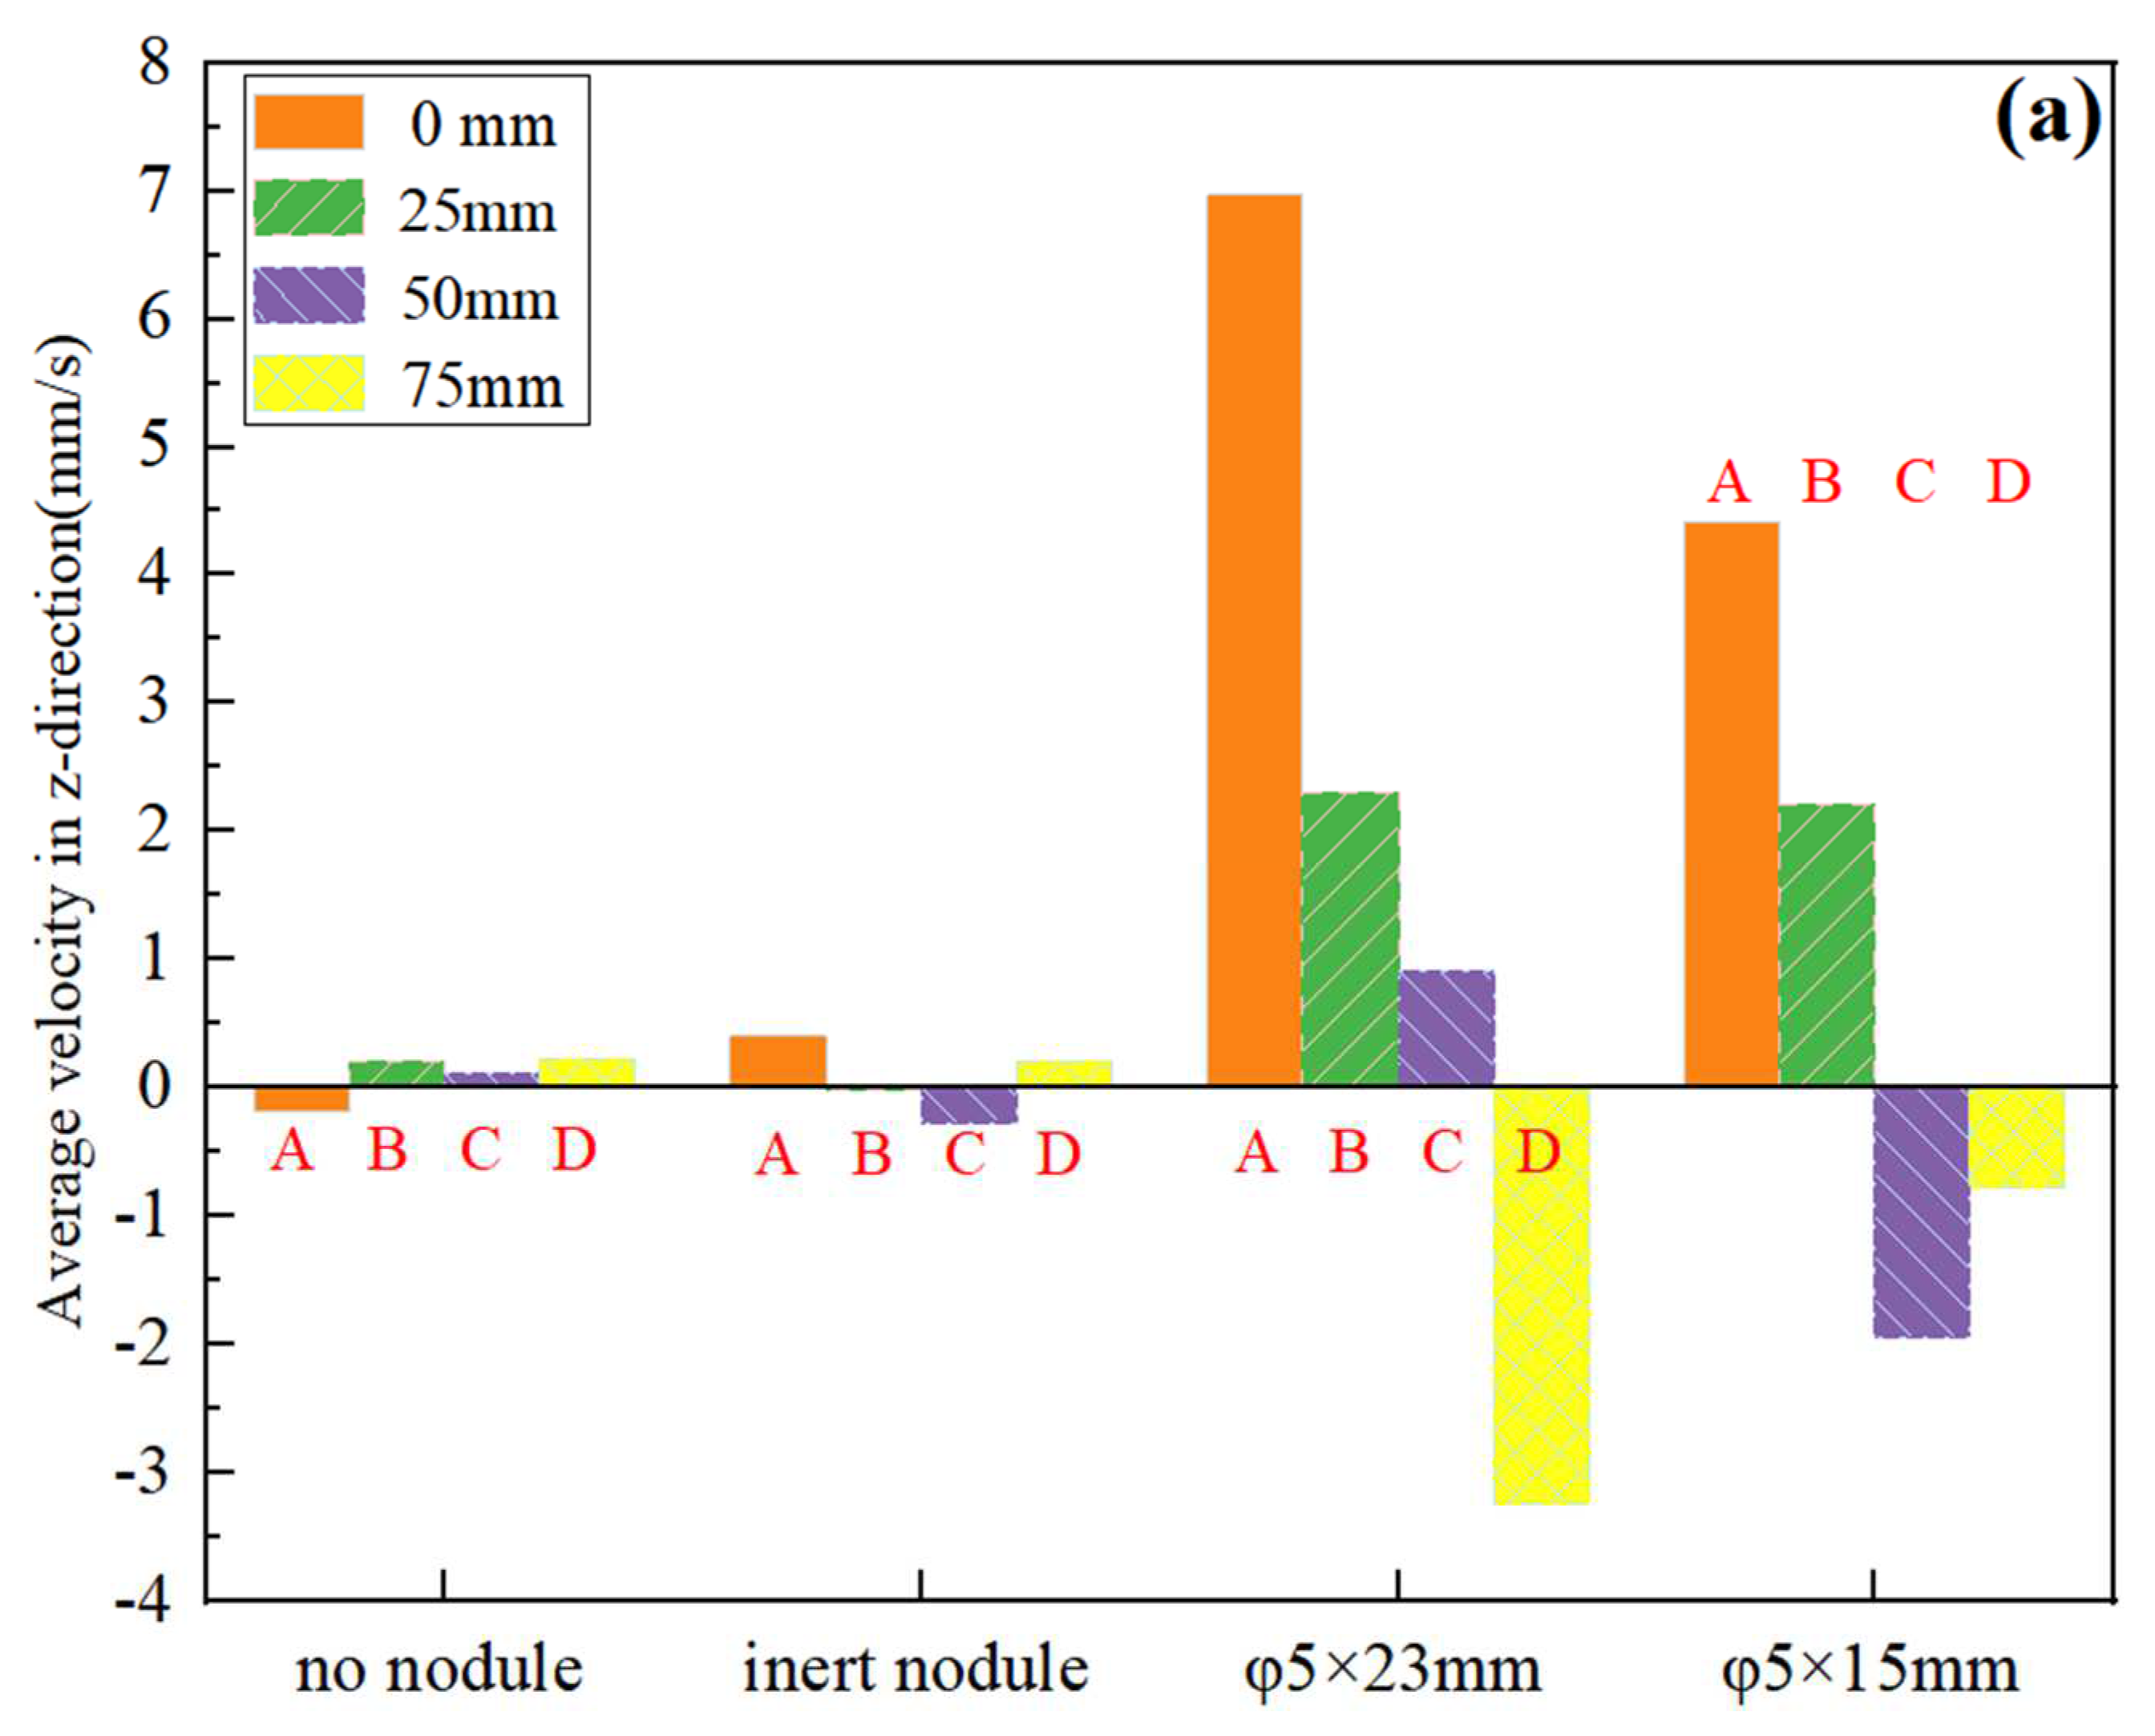
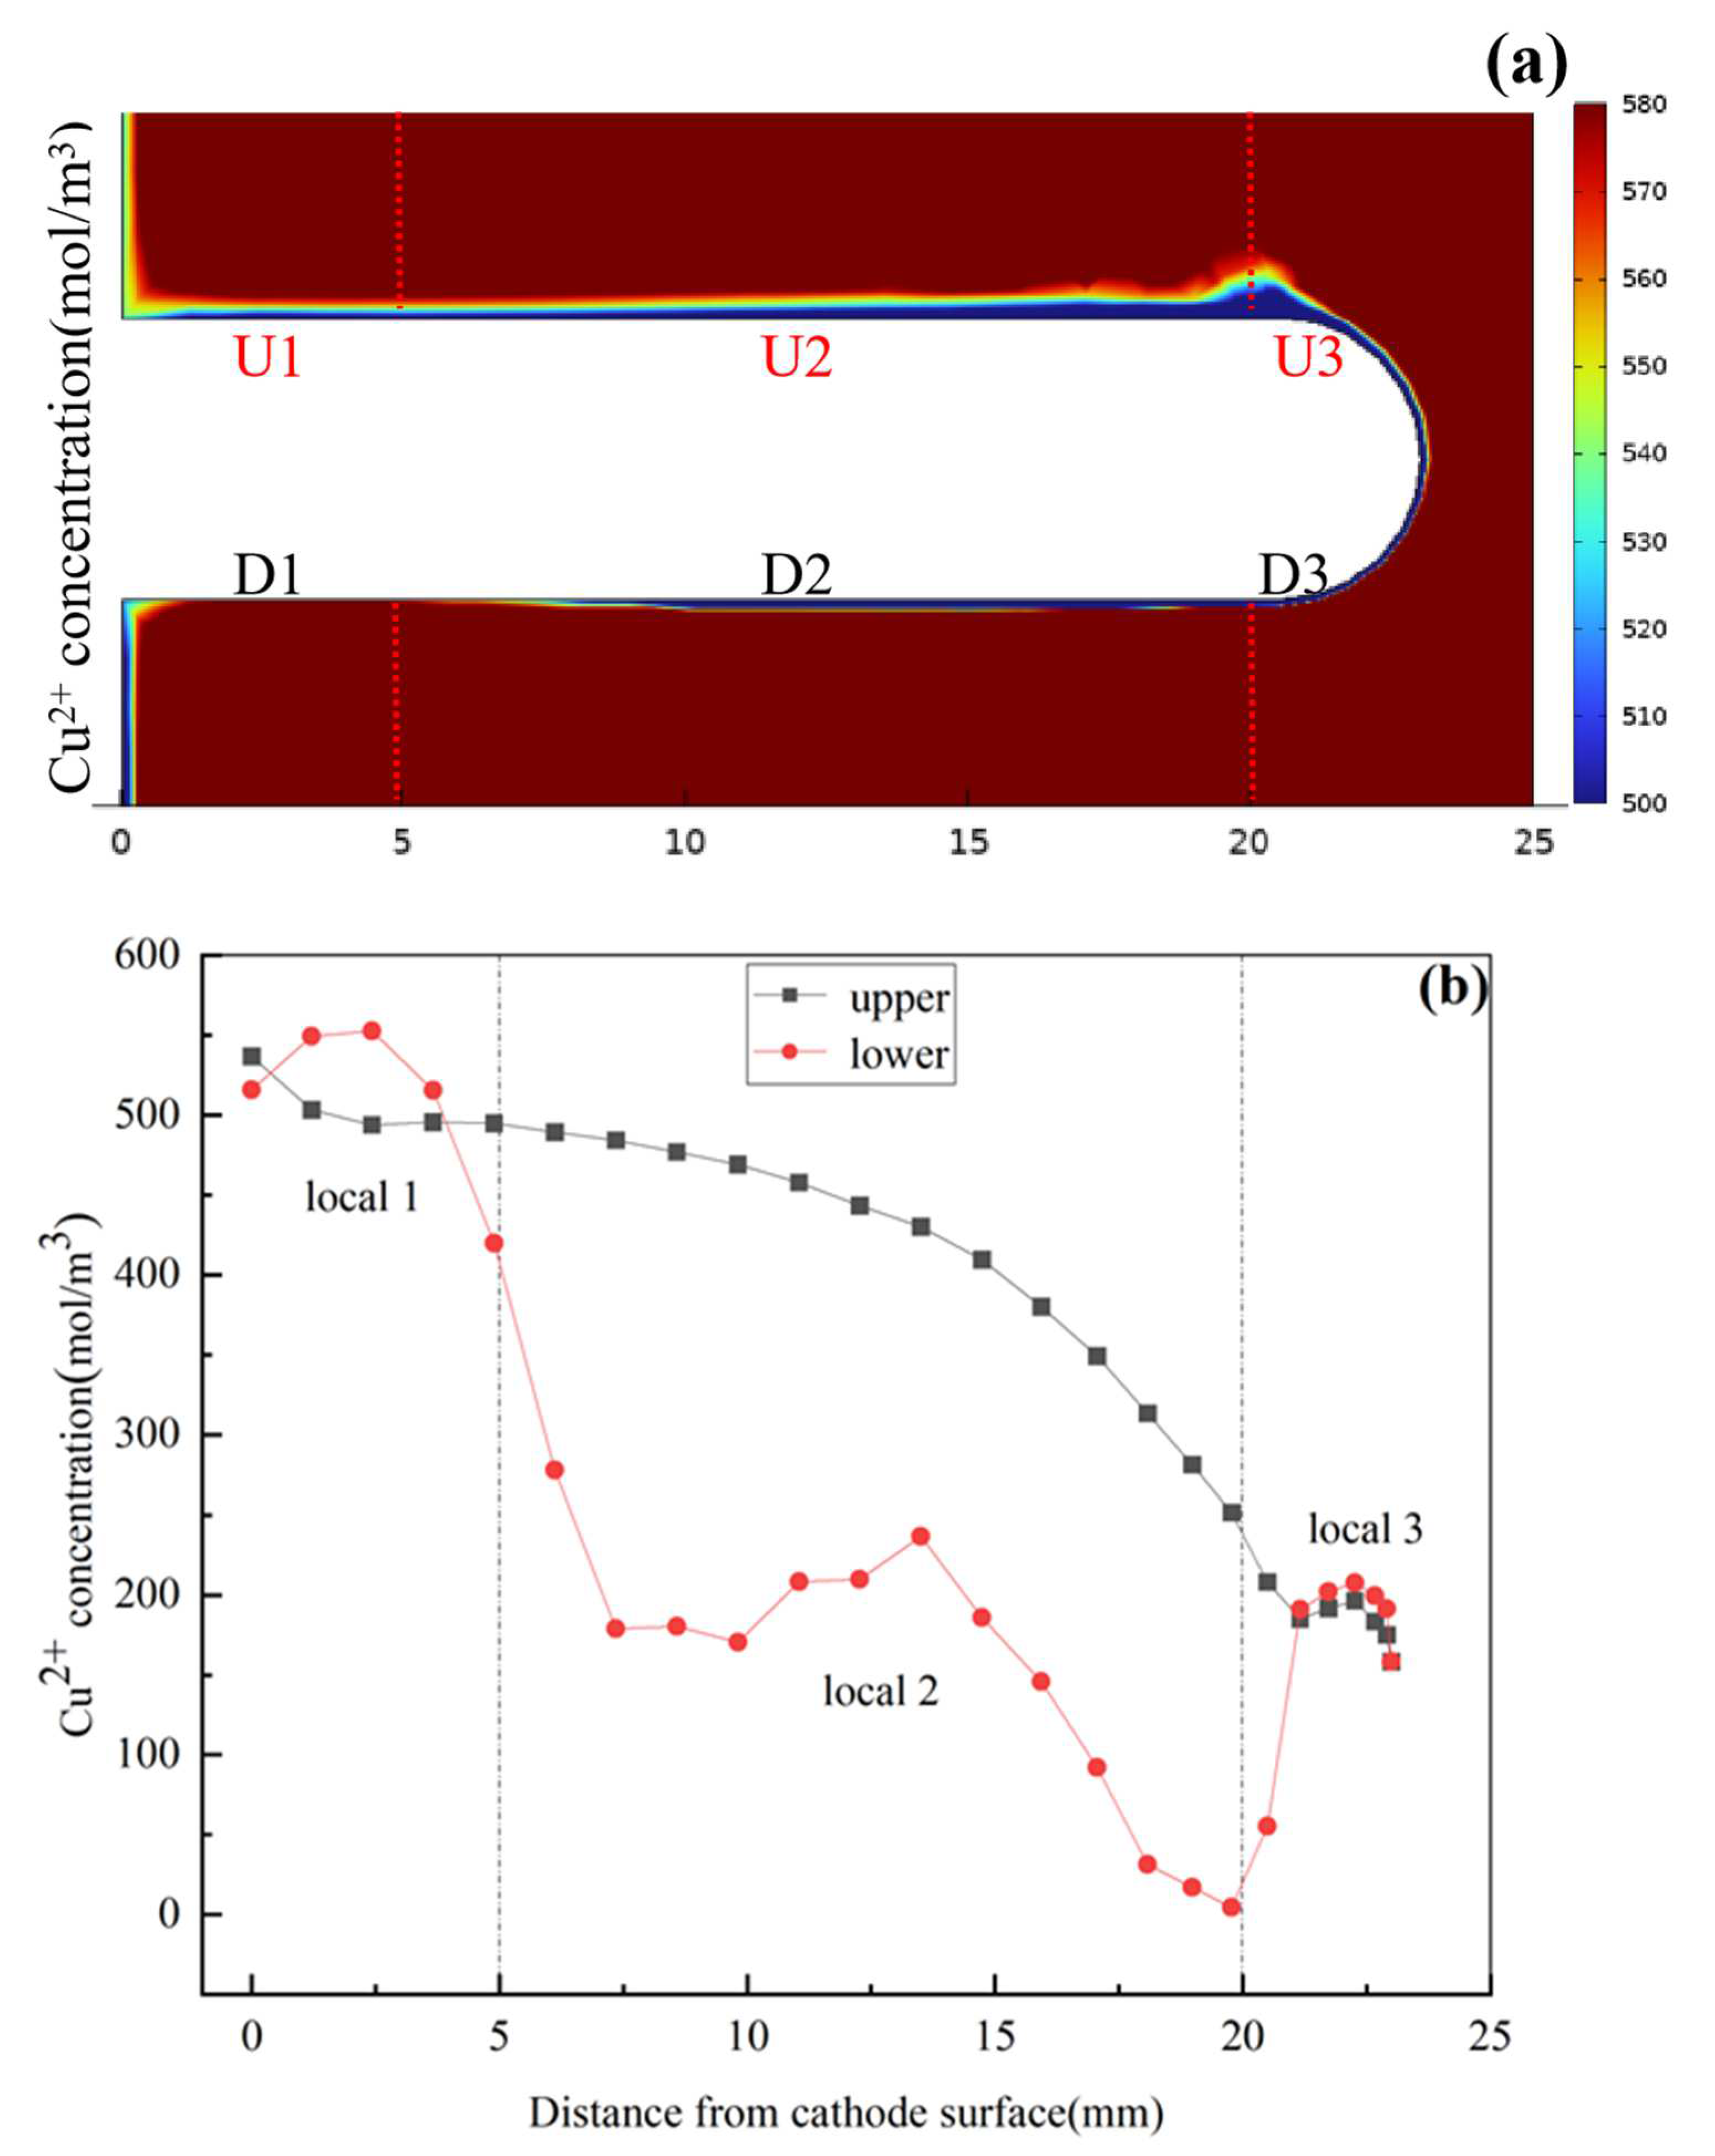
3.3. Surface Concentration Effects of Nodule

As mentioned earlier, the localized current density on the surface of the nodule is not uniform but exhibits obvious local effects under the combined influence of multiple factors such as the flow field, the potential field, and the geometrical shape. Figure 6 shows an enlarged image of the flow velocity local near the nodule in the vertical cross-section, which corresponds well to the copper ion convection flux variation curve in Figure 4b. It can be observed that electrolyte is significantly slowed down underneath the nodule, especially in the D2 locals, where the convective flux is at its minimum. Due to the proximity of U1 and U2 locals to the nodule surface, the electrolyte flow rate increases rapidly, while the U2 local also has a relatively high flow rate due to the influence of upward flow from the nodule above.
Figure 7a depicts a contour map of copper ion concentration distribution on the cross-section at the center of the nodule, and Figure 7b illustrates the curve of copper ion concentration along the upper and lower edges of the nodule at varying distances from the cathode. It is evident that copper ions not only form locals of high and low concentration on the anode and cathode surfaces during normal electrolysis but also create irregularly sparse ion concentration layers on the nodule surface, demonstrating distinct local effects. Copper ions are transported to the D1 local as the electrolyte undergoes natural convection along the cathode. However, due to the lower local overvoltage in the D1 local and a current density of only around 600 A/m2, the electrode reaction is weaker, leading to copper ion accumulation, increased electrolyte density, and viscosity, thereby impeding the flow of the electrolyte. This hindrance is more pronounced in the D2 local. We selected YZ cross-sections of 2 mm, 10 mm, and 22.5 mm to represent locals 1, 2, and 3, respectively. Figure 8 presents velocity streamlines and contour plots of copper ion concentration for various locals perpendicular to the cross-section at the center of the nodule. Particularly, in the U2 (Figure 8b), the upward disturbance in electrolyte velocity accelerates due to copper ion scarcity, resulting in a relatively complex flow pattern. In the D2 local below the nodule (Figure 8e), with a small copper ion concentration gradient, the convection circulation of the electrolyte is impeded, leading to a slower flow rate. The concentration gradient in the D3 is greater than that in the U3, resulting in an increased flow rate in the electrolyte, providing a reasonable explanation for the higher convection flux in the D3 local compared to the U3. In contrast to the active nodule, when the inert nodule is present, its surface acts as an equivalent wall, only hindering the upward flow of the electrolyte along the cathode surface.
In particular, the downward flow of the electrolyte near the anode surface may carry anode slime that should have settled down and flowed into the electrolyte body. Moreover, according to Wang et al. [4], when the upward flow rate of the electrolyte exceeds the downward settling rate of the anode slime, more anode slime that should have settled will float in the electrolyte. These particles are passed toward the cathode, and join with anode sludge particles in the cathodic formation of the precipitated copper process, contributing to the formation of fine nodule clusters.
In summary, the cathode nodule local effect is significant. In the local D2, along the nodules’ lower edge, the current density fluctuates at a lower level due to poor electrolyte convection, leading to the accumulation of copper ions and an increase in electrolyte viscosity, inhibiting natural convection. Along the upper edge of the nodules, the current density gradually increases, the electrode reaction rate continues to rise, and the copper ion concentration gradually decreases. At this point, the electrolyte in the upper edge of the nodule local gradually flows downstream (the top of the electrolytic cell).

4. Conclusions

The paper is based on the numerical simulation of the cathode–anode reaction mechanism in the copper electrolytic cell. By comparing this with the non-nodule model and the inert nodule model, the influence of the nodule growth/deposition process on the natural convection pattern of the electrolyte is studied. The focus is on discussing the current density distribution characteristics on the nodule surface caused by the local effect of the cathodic nodule.
The results indicate the following:
The electrochemical reactions on the surface of the nodule affect the flow state of the electrolyte. This results in a significant increase in the flow rate of the electrolyte above the nodule, leading to the formation of two distinct vortices in the cross-section (YZ section). The electrolyte at the bottom of the electrolytic bath flows just below the nodule and joins the upper electrolyte flow from both sides of the nodule. Active nodules impact the flow pattern of natural convection in the electrolyte by enlarging the region above the nodule, causing the electrolyte to flow upward against the cathode surface. Unlike inert nodules, the size of the affected region increases with the length of the nodule. The electrochemical reaction at the tip of the nodule causes upward convection of the electrolyte near the anode surface, which carries anodic sludge, which may form clusters of fine nodules on the surface of the nodule.
The area below the nodule (local D2) has a weaker electrolyte flow, and the mass transfer in the liquid phase controls the electrode process, with local current density fluctuating in a relatively low range. In the U1 and D2 at the root of the nodule, as well as the U2 along the head of the nodule, electrolyte convection is faster, and stronger convection mass transfer ensures an adequate supply of copper ions, with current density mainly depending on local overvoltage. In the U3 and D3, due to the combined effect of the angle deviation from the anode surface and local overvoltage, the current density gradually deviates from the originally increasing one, leading to a sharp increase. The local current density is not even on the nodule surface under the comprehensive influence of local electrolyte flow, local overvoltage, and the angle with the anode surface. Thus, the head of an active nodule grows faster than the root, and the upper parts grow faster than the lower parts, leading to asymmetric growth of the nodules.
The concentration of copper ions on the surface of the nodule is not uniform. The uniform decrease in copper ion concentration along the upper edge of the nodule is mainly due to overvoltage. The convection pattern of the electrolyte and the current density on the nodule surface are interrelated factors, and their coupling constitutes the local cathodic effect of the nodule.

Author Contributions

Conceptualization, X.W. and C.L.; data curation, X.W.; funding acquisition, J.T.; investigation, X.W. and C.L.; methodology, C.L. and J.T.; project administration, C.L. and J.T.; software, X.W.; supervision, J.T.; writing—original draft, X.W. and C.L.; writing—review and editing, X.W., C.L. and J.T. All authors have read and agreed to the published version of the manuscript.

Funding

This project was supported by the National Natural Science Foundation of China (21978004) and the National Key R&D Program of China under Grant (2022YFB3304900).

Data Availability Statement

The raw data supporting the conclusions of this article will be made available by the authors on request.

Conflicts of Interest

The authors declare no conflicts of interest.

References

  1. Mori, K.; Yamakawa, Y.; Oue, S.; Taninouchi, Y.-K.; Nakano, H. Effect of Impurity Ions and Additives in Solution of Copper Electrorefining on the Passivation Behavior of Low-Grade Copper Anode. Mater. Trans. 2023, 64, 242–251. [Google Scholar] [CrossRef]
  2. Schlesinger, E.; King, J.; Sole, C.; Davenport, G. Extractive Metallurgy of Copper, 5th ed.; Electrolytic Refining; Pergamon Press: Oxford, UK, 2011; pp. 251–280. [Google Scholar] [CrossRef]
  3. Andersen, T.N.; Pitt, C.H.; Livingston, L.S. Nodulation of Electrodeposited Copper Due to Suspended Particulate. J. Appl. Electrochem. 1983, 13, 429–438. [Google Scholar] [CrossRef]
  4. Dutrizac, J.E.; Chen, T.T. A Mineralogical Study of Nodulated Copper Cathodes. J. Proc. Copper Int. Conf. 1999, 383–403. [Google Scholar]
  5. Wang, Z.; Meng, Y.; Li, C.; Tie, J.; Zhao, R. Effect of nodules on electrolyte flow and Cu2+ concentration distribution in copper electrolytic refining. In Advances in Energy, Environment and Chemical Engineering; Abdullah, A.Z., Osman, A.F., Eds.; CRC Press: Boca Raton, FL, USA, 2023; pp. 309–313. [Google Scholar]
  6. Meng, Y.; Liu, H.; Li, C. Cathodic current change and nodulation morphology during short circuit of copper electrolysis. Chin. J. Nonferrous Met. 2022, 32, 262–270. [Google Scholar] [CrossRef]
  7. Zhao, J.; Meng, Y.; Li, C.; Tie, J. The effect of nodulation on the distribution of concentration and current density during copper electrolytic refining. J. Phys. Conf. Ser. 2022, 2285, 012015. [Google Scholar] [CrossRef]
  8. Adachi, K.; Nakai, Y.; Kitada, A.; Fukami, K.; Murase, K. FEM Simulation of Nodulation in Copper Electro-Refining. In Rare Metal Technology; Springer: Cham, Switzerland, 2018. [Google Scholar] [CrossRef]
  9. Nakai, Y.; Adachi, K.; Kitada, A.; Fukami, K.; Murase, K. Experimental Modeling of Nodulation in Copper Electrorefining. In Rare Metal Technology; Springer: Cham, Switzerland, 2018. [Google Scholar] [CrossRef]
  10. Zeng, Q.; Li, C.; Meng, Y.; Tie, J.; Zhao, R.; Zhang, Z. Analysis of interelectrode short-circuit current in industrial copper electrorefining cells. Measurement 2020, 164, 108015. [Google Scholar] [CrossRef]
  11. Bard, A.J.; Faulkner, L.R. Electrochemical Methods: Fundamentals and Applications; Chemical Industry Press: Beijing, China, 2005. [Google Scholar]
  12. Zeng, W. Experimental and Validated Modeling Studies of Electrolyte Flow and Anode Slime Behavior and Transport in Copper Electrorefining; University of Utah: Salt Lake City, UT, USA, 2016. [Google Scholar]
  13. Miyamoto, M.; Mitsuno, S.; Kitada, A.; Fukami, K.; Murase, K. Mechanism of nodular growth in copper electrorefining with the inclusion of impurity particles under natural convection. Hydrometallurgy 2023, 216, 106013. [Google Scholar] [CrossRef]
  14. Zeng, W.; Free, M.L.; Werner, J.; Wang, S. Simulation and Validation Studies of Impurity Particle Behavior in Copper Electrorefining. J. Electrochem. Soc. 2015, 162, E338–E352. [Google Scholar] [CrossRef]
  15. Zeng, W.; Werner, J.; Free, M.L. Experimental studies on impurity particle behavior in electrolyte and the associated distribution on the cathode in the process of copper electrorefining. Hydrometallurgy 2015, 156, 232–238. [Google Scholar] [CrossRef]
  16. Zeng, W.; Free, M.L.; Wang, S. Simulation Study of Electrolyte Flow and Slime Particle Transport in a Newly Designed Copper Electrorefining Cell. ECS Trans. 2016, 72, 23–42. [Google Scholar] [CrossRef]
  17. Zeng, W.; Wang, S.; Free, M.L. Experimental and Simulation Studies of Electrolyte Flow and Slime Particle Transport in a Pilot Scale Copper Electrorefining Cell. J. Electrochem. Soc. 2016, 163, E111–E122. [Google Scholar] [CrossRef]
  18. Kim, K.R.; Choi, S.Y.; Paek, S.; Park, J.Y.; Hwang, I.S.; Jung, Y. Electrochemical Hydrodynamics Modeling Approach for a Copper Electrowinning Cell. Int. J. Electrochem. Sci. 2013, 8, 12333–12347. [Google Scholar] [CrossRef]
  19. Brown, D.A.; MacDonald, A.R.; McCarron, E.A.; Zarwell, S.; Bernhard, T.; Brüning, R. Properties of an electroless copper process as a function of nickel and cyanide ion concentrations. J. Appl. Electrochem. 2021, 51, 795–802. [Google Scholar] [CrossRef]
  20. Graydon, J.W.; Kirk, D.W. Suspension codeposition in electrowinning cells: The role of hydrodynamics. Can. J. Chem. Eng. 1991, 69, 564–570. [Google Scholar] [CrossRef]
  21. Najminoori, M.; Mohebbi, A.; Arabi, B.G.; Daneshpajouh, S. CFD simulation of an industrial copper electrowinning cell. Hydrometallurgy 2015, 153, 88–97. [Google Scholar] [CrossRef]
  22. Leahy, M.J.; Schwarz, M.P. Experimental Validation of a Computational Fluid Dynamics Model of Copper Electrowinning. Met. Mater. Trans. B 2010, 41, 1247–1260. [Google Scholar] [CrossRef]
  23. Rosa-Ortiz, S.M.; Khorramshahi, F.; Takshi, A. Study the impact of CuSO4 and H2SO4 concentrations on lateral growth of hydrogen evolution assisted copper electroplating. J. Appl. Electrochem. 2019, 49, 1203–1210. [Google Scholar] [CrossRef]
  24. Le, A.S. Improved Production Practice of Copper Electrolysis by Enhancing Electrolyte Temperature. J. China Nonferrous Metall. 2017, 46, 11–15. [Google Scholar]
  25. Li, M.Z.; Huang, J.T.; Tong, C.R. Numerical Analysis of Electrothermal Field in Copper Electrolyzer. Nonferrous Met. Sci. Eng. 2016, 7, 50–55. [Google Scholar]
  26. Kalliomäki, T.; Aji, A.T.; Jafari, S.; Leskinen, W.; Wilson, B.P.; Aromaa, J.; Lundström, M. Industrial validation of conductivity and viscosity models for copper electrolysis processes. Miner. Eng. 2021, 171, 107069. [Google Scholar] [CrossRef]
  27. Khayatzadeh, H.; Tahmasebi, K. Optimizing Electrolyte Conditions for the Elimination of Nodules in Copper Electrorefining Process. JOM 2024, 76, 452–463. [Google Scholar] [CrossRef]
  28. Wang, H.; Wang, Q.; Xia, W.; Ren, B. Effect of Jet Flow between Electrodes on the Cathode Quality in Copper Electrorefining with High Current Density. Metals 2018, 8, 833. [Google Scholar] [CrossRef]
  29. Sahlman, M.; Aromaa, J.; Lundström, M. Detachment and flow behaviour of anode slimes in high nickel copper electrorefining. Physicochem. Probl. Miner. Process. 2024, 60, 186194. [Google Scholar] [CrossRef]
  30. Correa, P.P.; Cipriano, A.; Nunez, F.; Salas, J.C.; Lobel, H. Forecasting Copper Electrorefining Cathode Rejection by Means of Recurrent Neural Networks with Attention Mechanism. IEEE Access 2021, 9, 79080–79088. [Google Scholar] [CrossRef]
  31. Pryor, R.W. Multiphysics Modeling Using COMSOL: A First Principles Approach; Jones and Bartlett Publishers, LLC: Sudbury, MA, USA, 2011. [Google Scholar]
  32. Adachi, K.; Nakai, Y.; Mitsuno, S.; Miyamoto, M.; Kitada, A.; Fukami, K.; Murase, K. The Mechanism of Nodular Growth in Copper Electrorefining. J. MMIJ 2020, 136, 8–13. [Google Scholar] [CrossRef]
  33. Price, D.C.; Davenport, W.G. Physico-chemical properties of copper electrorefining and electrowinning electrolytes. Met. Trans. B 1981, 12, 639–643. [Google Scholar] [CrossRef]
  34. Zeng, W.; Wang, S.; Free, M.L. Two-Phase Flow Modeling of Copper Electrorefining Involving Impurity Particles. J. Electrochem. Soc. 2017, 164, E233–E241. [Google Scholar] [CrossRef]
  35. Miyamoto, M.; Ishikawa, Y.; Fukami, K.; Murase, K. Surface Roughening and Growth-Promoting Effects of Nickel and Antimony on Nodules in Copper Electrorefining. Met. Mater. Trans. B 2023, 54, 3579–3590. [Google Scholar] [CrossRef]
  36. Meng, Y.; Liu, H.; Li, C. Study on the growth behavior of nodules under the electrolytic conditions of copper industry. Hydrometall. China 2021, 40, 446–450. [Google Scholar]
Figure 1. The geometric model and mesh partition used in this paper (a,b) are the three-dimensional geometric models of non-nodules and nodules of φ5 × 23 mm, respectively; (c) is the mesh partition under the condition of nodules, and the color legend shows the grid unit size at the nodules. (d) is the boundary layer mesh at the cathode surface, and the anode is consistent.
Metals 14 00457 g001
Figure 2. The electrolyte flow velocities in electrolytic cells. (a) represents a condition of no nodules, (b) represents an electrolytic cell with inert nodules, (c) represents a real nodule electrolytic cell with a length of 23 mm, and (d) represents a real nodule electrolytic cell with a length of 15 mm. (ad) are composed of cross-sectional views (YZ cross-section) and longitudinal views (XZ cross-section) to demonstrate the internal fluid dynamics within the respective electrolytic cell configurations. A–D cross-sections are shown in 3D on the right.
Metals 14 00457 g002
Figure 3. The average of the z-direction velocity vectors at 20 mm, (a) above nodule (red lines in Figure 2), (b) below nodule (orange lines in Figure 2); 0 mm, 25 mm, 50 mm, and 75 mm represent cross-sections (XZ cross-sections) at distances of 0 mm, 25 mm, 50 mm, and 75 mm from the center of the nodule, below nodule, and under a different nodule. A–D represent the cross-section of the 3D diagram on the right side of Figure 2.
Metals 14 00457 g003aMetals 14 00457 g003b
Figure 4. Distribution of current density of the surface of the cathode; (a) the distribution of the surface of nodule current density and the angle θ to the anode surface along the nodule, and the arrows represent current density vectors, (b) the distribution of current density along the head and root of the nodule, local 1 includes the U1 and D1 locals; local 2 includes the U2 and D2 locals.
Metals 14 00457 g004
Figure 5. The variation in local overvoltage and copper ion flux with the distance from the cathode surface to the head and root edges of the nodule. (a) Local overvoltage, (b) copper ion flux; local 1 in the figure includes locals U1 and D1; local 2 includes locals U2 and D2; local 3 includes locals U3 and D3.
Metals 14 00457 g005
Figure 6. Local flow rate of electrolyte near the cross-section of the center of a nodule magnification view, the arrows represent the direction of electrolyte flow.
Metals 14 00457 g006
Figure 7. Copper ion concentration distribution near the nodule. (a) Nodule center cross section (XZ section), (b) the variation trend of the nodule at the upper and lower edges with respect to the cathode surface distance; local 1 includes the U1 and D1 locals, local 2 includes the U2 and D2 locals, and local 3 includes the U3 and D3 locals.
Metals 14 00457 g007
Figure 8. Contour streamlines of copper ion concentration and electrolyte velocity plots for various locals of YZ cross-section for the nodule size φ5 × 23 mm for locals 1, 2, and 3; (a,d) are for the cross-section of 2 mm from the cathode surface; (b,e) are for the cross-section of 10 mm from the cathode surface; (c,f) are for the cross-section of 22.5 mm from the cathode surface.
Metals 14 00457 g008
Table 1. Main parameters and boundary conditions applied in the simulation.
DescriptionValue
Temperature338.15 K
Exchange current density150 A/m2
Anode voltage0.25 V
Cathode voltage0 V
Cu2+ diffusion coefficient1.13 × 10−9 m2/s
H+ diffusion coefficient2.26 × 10−9 m2/s
SO42− diffusion coefficient3.77 × 10−10 m2/s
Anodic transfer coefficient1.3
Cathodic transfer coefficient0.7
Disclaimer/Publisher’s Note: The statements, opinions and data contained in all publications are solely those of the individual author(s) and contributor(s) and not of MDPI and/or the editor(s). MDPI and/or the editor(s) disclaim responsibility for any injury to people or property resulting from any ideas, methods, instructions or products referred to in the content.

