Article

Leaching of Rare Earths from End-of-Life NdFeB Magnets with Citric Acid Using Full Factorial Design, Response Surface Methodology, and Artificial Neural Network Analysis

Department of Industrial and Information Engineering and of Economics (DIIIE), Engineering Headquarters of Roio, University of L’Aquila, 67100 L’Aquila, Italy
*
Author to whom correspondence should be addressed.
Metals 2024, 14(8), 932; https://doi.org/10.3390/met14080932
Submission received: 20 July 2024 / Revised: 6 August 2024 / Accepted: 13 August 2024 / Published: 16 August 2024

Abstract

:
In recent years, the increasing demand and rising prices of rare earth elements (REEs), along with their attendant supply risk (about 95% of these elements are supplied by China), have led the European Commission to consider REEs as critical raw materials. Developing and optimizing processes for recovering REEs from secondary sources such as NdFeB magnets is fundamental in this context. A novel method to recover REEs by leaching with citric acid and subsequently separating these elements using the solvent extraction method has been introduced. Therefore, this research investigates the leaching efficiency of REEs, Fe, and B from NdFeB magnets. A full factorial design, with 18 experimental setups, was conducted to optimize the citric acid concentration (1–3 mol/L), leaching time (1–3 h), and solid–liquid ratio (5–10%wt./vol.). All tests were carried out at room temperature and 150 rpm. Different optimizations (response surface methodology (RSM) and artificial neural network (ANN) analysis) are used to maximize the REEs’ leaching efficiency. RSM resulted in a maximum extraction yield of total rare earth elements (TREEs) of about 89% in the investigated experimental plan. This result is similar to that for ANN analysis (about 86%), but more accurate than that for RSM. In fact, for the ANN, an overall R-value higher than 0.99 was obtained. This result indicates that the developed ANN can be used as an accurate model for estimating the leaching efficiencies of REEs from NdFeB magnets.

1. Introduction

In recent years, there has been an increasing demand for rare earth elements (REEs) due to their widespread use in advanced industries such as automotive manufacturing, renewable energy technology, computer and electronic products, and refineries [1,2,3]. The special physical and chemical properties of REEs make them a good choice for producing permanent magnet alloys. NdFeB magnets are considered to be the most powerful magnets [4]. These magnets are used in hard disk drives (HDDs), hybrid vehicles, wind turbine generators, smartphones, and other electrical and mechanical devices [1,5,6]. Due to the increase in demand and rising price of REEs, as well as the attendant risks of supplying them (~65% of these elements are supplied by China [3]), the REEs have been included in the list of critical elements compiled by the European Commission [4,7]. Although REEs can be found in some ores, their low concentration (0.2% to 1.4%) makes their extraction processing difficult and expensive. The critical situation regarding the supply of REEs and the problems of replacing them with other elements have focused much attention on the potential value of permanent magnet waste as a secondary source of REEs. It should be noted that the permanent magnets contain about 30% REEs [5,8].
Permanent magnet waste usually includes end-of-life products and industrial scraps generated during the NdFeB magnet manufacturing processes [9]. End-of-life magnets can be refurbished or used in the casting process to reproduce the original alloy. However, these methods have disadvantages such as low efficiency and purity, uncontrolled alloy composition, and loss of a large amount of REEs due to the formation of melting slag [10]. Consequently, finding an alternative method to recover REEs from secondary sources, while maintaining high purity, is essential. The focus and attention of researchers in recent years on finding an efficient method for recovering REEs from permanent magnets confirms this issue [11,12,13,14,15].
Hydrometallurgical processes can recover metals with desirable concentrations from complex and low-purity wastes [16]. Hydrometallurgical methods are more straightforward than pyrometallurgical methods, boast lower operating costs, require lower energy consumption, and do not emit toxic gases. Although hydrometallurgical methods are efficient, they often involve toxic and hazardous chemicals (such as strong inorganic acids, cyanides, highly corrosive compounds for the skin, and organic solvents). Thus, significant efforts have been made to replace these chemicals with environmentally friendly reagents and reduce the waste produced by these processes. It should be noted that the type of acid is considered as the most critical factor in the efficiency of the acid-leaching process [17]. Although mineral acids are efficient in leaching REE elements, using these components causes several problems in regards to environmental pollution. Therefore, replacing organic acids with inorganic acids in the leaching process is one of the measures taken to reduce the environmental impact [18]. Aerobic and anaerobic degradability, availability, lower toxic gas emissions, low cost, and ease of transportation make organic acids suitable alternatives to mineral acids [7,19]. The application of organic acids such as citric acid, oxalic acid, acetic acid, and tartaric acid as leaching agents to leach REEs has been studied [18,20]. It was reported that organic acids dissolve REEs at a milder pH [5,21], and bio-degradation methods can neutralize the unreacted free acid. Favorable complexability and good regeneration are additional advantages of organic acids [22]. The mechanism of organic acids as leaching agents can be due to the reduction of the pH, the transfer of H+ to the aqueous phase, or the creation of a complex with the metals [22,23]. Thus, in recent decades, several attempts have been made to use organic acids as leaching agents to dissolve REEs.
In 2016, Behara and Parhi used 0.4 M acetic acid to dissolve Nd from scrap magnets. They reported that ~100% of Nd was dissolved by acetic acid at the optimal parameter conditions, with a stirring rate of 800 rpm, a pulp density of 1%, and a particle size of 106–150 µm [24]. Also, Gregorik et al. [18] found that citric acid (1 M) dissolved all REE elements after 24 h, while a dissolving efficiency of 95% was achieved by adding acetic acid (1 M). Moreover, it was reported that the mentioned acid could not selectively leach REEs, while as impurities, Fe and Co were also completely leached. Reisdörfer et al. [7] reported that roasting HDD magnets, as the pretreatment step (at 900 °C for 8 h), increased the leaching selectivity of REEs via Fe, with a selectivity enhancement of 86% and 98% using malic and citric acids, respectively. Belfqueh et al. [5] studied the effects of organic acid type (acetic acid, formic acid, citric acid, and tartaric acid), acid concentration (in the range of 10% v/v to saturation concentration), and S/L ratio (in the range of 0.5–10%) on the REEs dissolving efficiency using statistically designed experiments. It was concluded that acetic acid was the most efficient leaching reagent for recovering all the REEs presented in the HDD. It was also reported that by using a 24 h leaching test, 90% of the dissolution efficiency of REEs can be obtained using 1.6–10.0 M acetic acid, a 0.5–5% S/L ratio, and a temperature of 60 °C.
Birloaga and Vegliò [25] introduced a novel method to recover end-of-life permanent magnets using the hydrometallurgical method. In this method, the spent NdFeB magnets are dissolved using citric acid, while the achieved PLS is subjected to the SX stage to recover the REEs. Romano et al. [26] investigated the effect of citric acid concentration as leaching agents on the equilibrium time and dissolving kinetics of NdFeB swarf metals. In this research, the shrinking core model was applied to achieve the results, and it was concluded that this leaching process was under product layer diffusion control. Also, the optimal concentration of citric acid was determined to be in the range of 0.9 to 1.45 M, with a theoretical value of approximately ~1.2 M.
As the hydrometallurgical recycling of NdFeB magnets has not been carried out industrially, the NEW-RE and INSPIREE projects have been introduced to recover these metals from end-of-life NdFeB magnets using hydrometallurgical methods on a pilot and industrial scale, respectively. For this goal, the effect of chemical and operational parameters of each stage on the process efficiency needs to be comprehensively investigated. Therefore, the main and interaction effects of some chemical and operational parameters, such as citric acid concentration, leaching time, and solid content, on the dissolution efficiency of NdFeB swarf metals were investigated using lab scale experiments designed by a full factorial plan and analyzed using the response surface methodology (RSM) and an artificial neural network (ANN). Such investigations have not been found in other articles in the literature. The comparison between the RSM and ANNs represents another innovation of the presented work. Some papers present a comparison of the two methods only in terms of fitting but never with respect to the prediction of an optimal point. Since the leaching stage is the first step in the recovery of REEs from end-of-life NdFeB magnets, the results of this research can be used for the efficient dissolution of valuable metals, as well as the optimization of the subsequent stages of this process, i.e., solvent extraction and stripping, at the pilot and industrial scales.

2. Materials and Methods

2.1. Sample Characterization

The analyzed sample was obtained by demagnetizing and grounding waste material from the hydrogen decrepitation of permanent magnets. The photographic image is shown in Figure 1a. The sample appears as a black powder. The granulometric analysis of the samples is shown in Figure 1b. Based on the plot, the d80 of the sample was about 180 μm.
To determine the chemical composition of the metal fraction, the sample was treated with aqua regia (HCl to HNO3 of 3:1). The metal concentration in the resulting liquid solution after chemical treatment was measured by ICP-OES. The chemical composition of the solid sample was calculated based on the resulting concentrations. This procedure was performed three times in order to define the confidence interval (±3σ). Table 1 reports the resulting composition.
The sample was also analyzed by energy-dispersive X-ray spectroscopy. Figure 2 shows the results of the XRD analysis of the used NdFeB magnet sample. Plastic and ceramic fractions in the material resulted in an XRD spectrum with significant background noise. Before the leaching process, the material contains mainly Ni3TB, BFe14NdPr, and DyNi3.

2.2. Procedure

For each test, pre-determined amounts of the solid sample and citric acid were added to the flasks filled with 50 mL of distilled water at ambient temperature. The leaching solution was prepared in 100 mL conical flasks by first adding water, then the amount of citric acid monohydrate, and finally, the solid. Except for the three factors studied, all other parameters are kept constant at the optimal conditions suggested in a previous work [26]. In particular, the leaching temperature was maintained at 25 ± 2 °C, and the rotation speed at 150 rpm. The amount of solid used for the tests varied in the range of 1.65–5.85 g, depending on the level indicated in the factorial plan.
Once the expected reaction time had passed, each solution was vacuum-filtered using Whatman filter paper (hole size: 20 µm), and the residual solid was washed with 30% of the initial leach solution volume to remove the solution remaining in the material’s pores. The main reactions that take place during the involved leaching system are as follows:
2 Nd + 2 C6H8O7 → 2 C6H5NdO7 + 3 H2
2 Dy + 2 C6H8O7 → 2 C6H5DyO7 + 3 H2
2 Pr + 2 C6H8O7 → 2 C6H5PrO7 + 3 H2
2 Tb + 2 C6H8O7 → 2 C6H5TbO7 + 3 H2
2 B + 2 C6H8O7 → 2 C6H5BO7 + 3 H2
Fe + C6H8O7 → C6H5FeO7 + H2
An inductively coupled plasma optical emission spectroscopy (ICP-EOS) analysis was then conducted to analyze the resulting leach liquors (LL) and the washing waters (WW) in order to determine the REEs, Fe, and B content of each. Thus, it was possible to determine the extraction yield of the leaching process for each element using Equation (7).
M e r e c % = C M e L L · V L L + C M e W W · V W W C M e S · m S
where C M e L L is the metal concentration in the leach liquor, V L L is the leach liquor volume, C M e W W is the metal concentration in the washing water, V W W is washing water volume, C M e S is the metal concentration in the solid sample, and m S is the mass of the used sample.

2.3. Design of Experiments and RSM

Several experiments were carried out to investigate the efficiency of citric acid in the leaching process. According to operational parameters, the leaching mechanism was investigated by applying an analysis of variance (ANOVA) to the results. For this goal, a full factorial plan, with two levels and three independent variables, was designed (23). The investigated factors and levels are reported in Table 2.
In total, 12 runs were performed: 8 tests of a factorial plan 23 and 4 replications at the central point to estimate the experimental error.
Thanks to this prescribed test plan, it was possible to apply the response surface model to the results obtained to generate the best system model to describe the recovery yield of each metal as a function of the three independent variables chosen. To use the RSM, the relationship between the extraction yield y and each of the factors (A, B, C) must be considered. The RSM is often based on first or second-order polynomial functions.
One of the main features of this method is the ability to designate experiments sequentially. An initial screening of the investigated space can verify the role of each considered factor, making it possible to individuate the most influential components. Reducing the number of factors allows for the reduction of the number of runs required [27].
Then, applying the first model determines whether the current experiment yields results which are far away or close to the ideal response. This step allows for subsequent experimentation to be conducted. This procedure is repeated until a final full factorial plan, centered in the global optimum point, can be designed. This plan will be designed to generate the model that most accurately represents the process response in a small space, with solid predictive capabilities. Usually, a low-degree polynomial, such as a first (8) or second order (9) term, is used as the initial model:
y = β 0 + i = 1 k β i   X i
y = β 0 + i = 1 k β i   X i + i = 1 k β i i   X i 2 + i > j β i j   X i X j
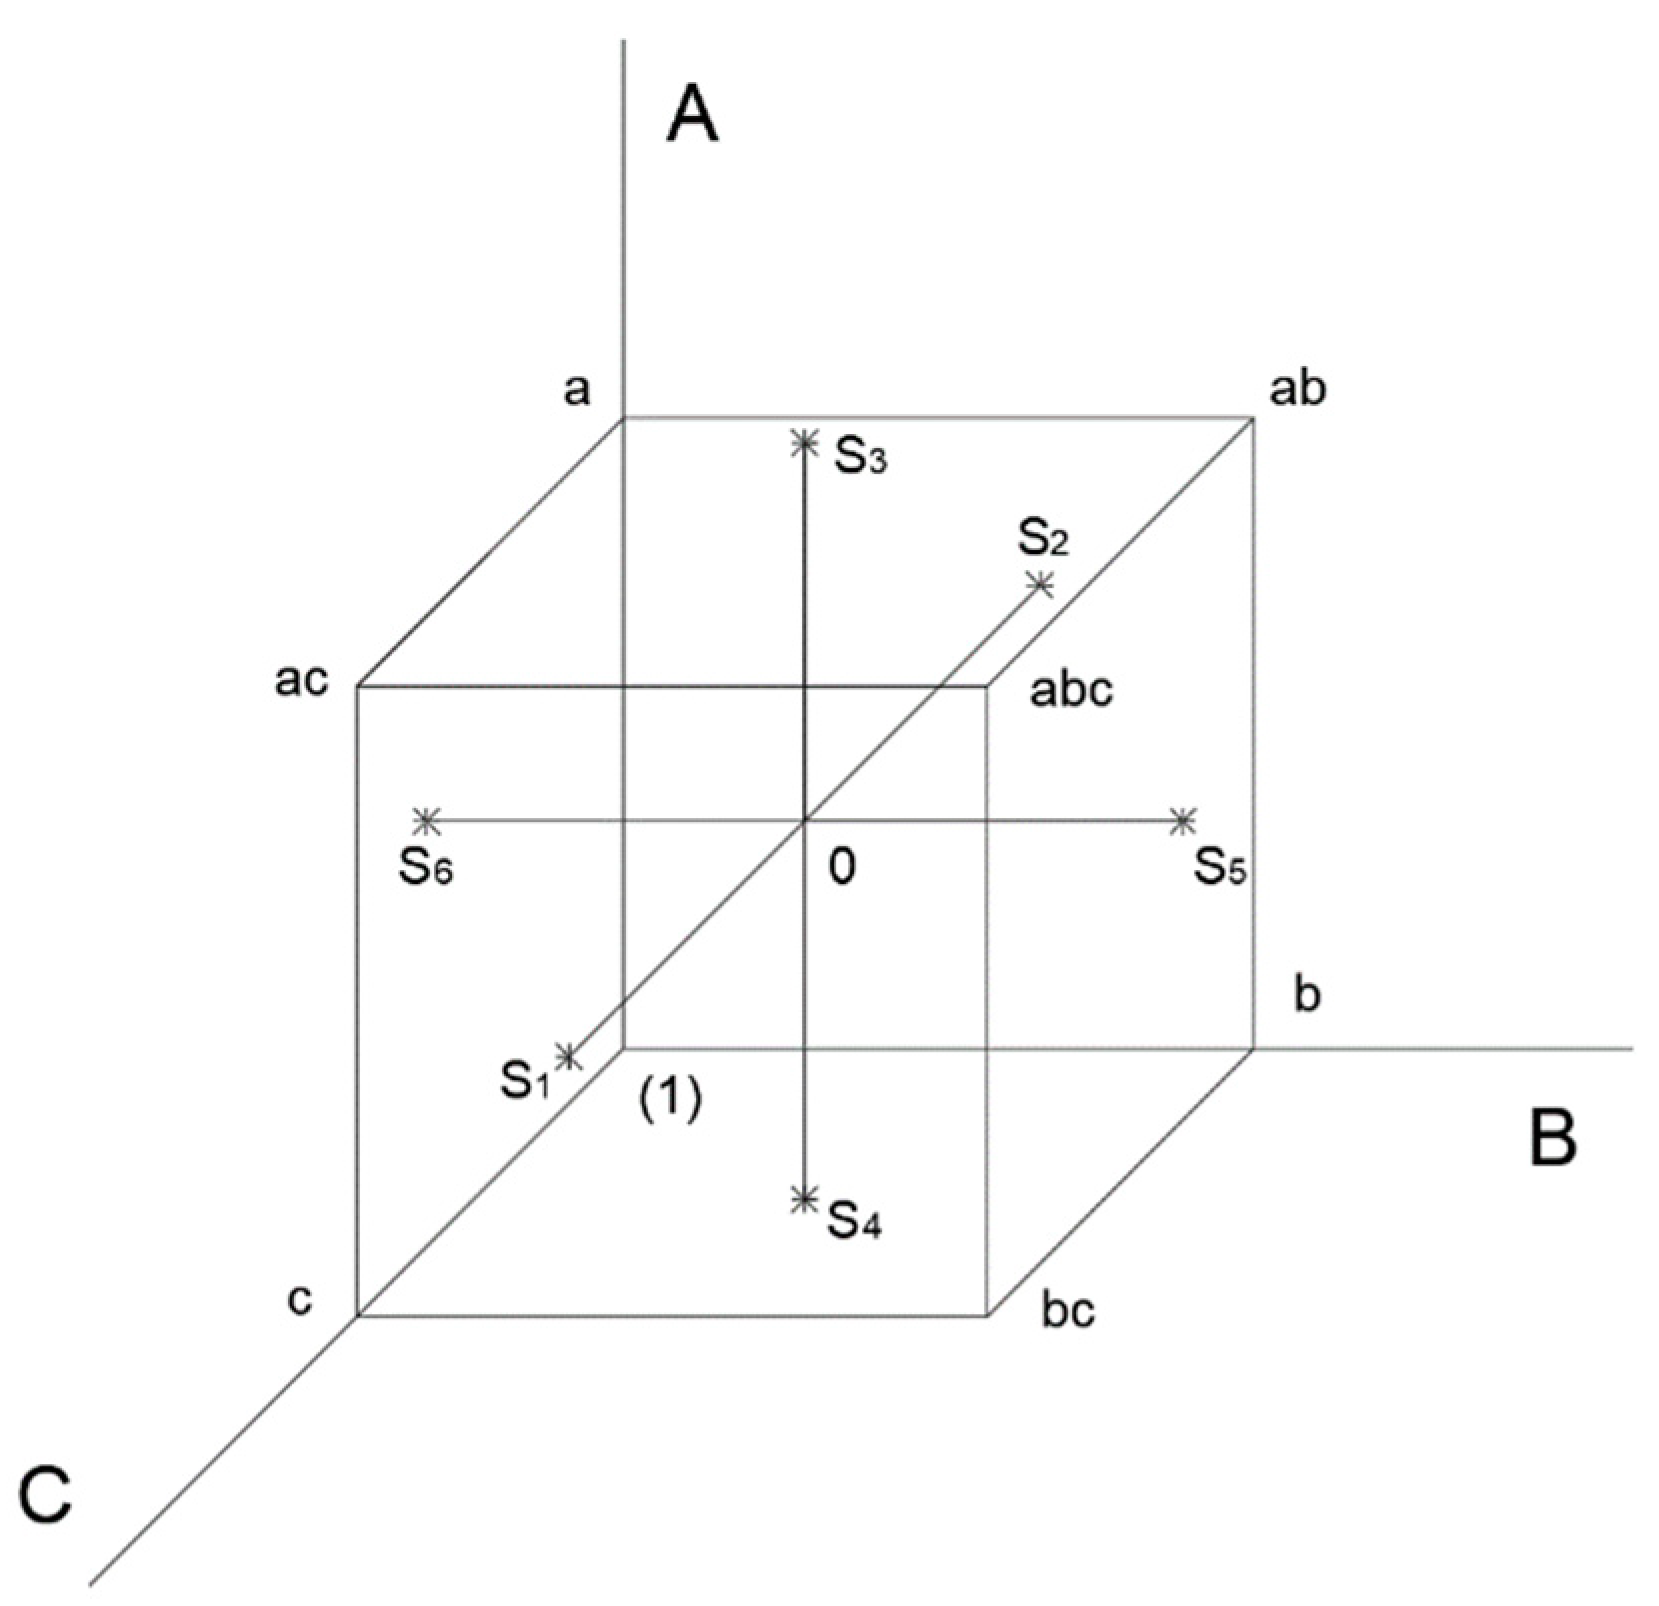
These polynomial functions are often good approximations of small regions of space. In the case of II-OP, the number of coefficients is increased, and the number of initial runs must be increased to estimate them. As more information is required, the so-called star points (six tests) were added. The full factorial plan, completed with star points, is summarized in Figure 3.

2.4. Artificial Neural Network

An artificial neural network (ANN) is a machine learning technique that is increasingly used in many fields. In metallurgy, works are currently being published in which ANNs are employed to identify complex relationships between input and output data through a series of nonlinear functions [28,29]. This technique allows the ANN to recognize patterns between input and output, regardless of the complexity of the dependency relationships. Notable advantages of the ANN are its ability to tolerate noise in the data and the fact that there is no need for the preliminary identification of a mathematical model.
ANNs have been used in several hydrometallurgical studies to optimize leaching processes and maximize extraction yields of precious and base metals [28,29,30].
Essentially, the ANN is a computational model that simulates the learning mechanism of the human brain. It is made up of nodes or neurons, which function as processors operating in parallel. These neurons are organized into an input layer, one or more hidden layers, and an output layer. Neurons are interconnected by links that carry specific weights.
This work used the feed-forward ANN, employing a back-propagation algorithm to model the relationship between the explanatory variables and the total REEs (TREE) leaching efficiency using MATLAB R2023b. The back-propagation algorithm reduces the error between output and input data by altering the weighted connections between neurons [28,31]. The architecture of the 3-26-12-7 neural network used in this work, which was chosen for its ability to handle the complexity of the data and the relationships between the variables, is shown in Figure 4.

3. Results

3.1. Leaching Results

This work studied the effect of citric acid concentration, leaching time, and solid–liquid ratio on the recovery yields of REEs, Fe, and B. In total, 18 leaching experiments were performed. The total experimental design and the obtained leaching efficiencies are presented in Table 3. It should be noted that REEs can be classified into light (Nd and Pr) and heavy (Dy, Y, Tb) categories, each with distinct chemical and physical properties. The differences can explain the varying behaviors of the studied REEs in regards to their leaching efficiency.
The data demonstrate the crucial role of citric acid concentration, reaction time, and S/L ratio in influencing the element recovery yield. The recovery yields obtained vary in a very wide range (7.3–89.9%), underscoring the significance of our research. The best run in terms of TREE yield was the S5 run, with a recovery rate of about 75.2%.
For example, at a concentration of 1 mol/L of citric acid, a time of 1 h, and a solid–liquid ratio of 5% wt./vol., the recovery yields vary from 17.9% to 48.7% for the elements considered, with a total recovery of rare earths (TREE) of 25.3%. Increasing the time to 3 h, with the same citric acid concentration and solid–liquid ratio, significantly improved the yields, with a TREE recovery value reaching 50.8%.
When both citric acid concentration and time were increased (3 mol/L and 3 h, respectively), the recovery yields further increased, with a TREE value of 64.6%. This promising result suggests that there is still room for improvement, with a higher citric acid concentration and a longer reaction time being key factors for enhancing element recovery.
Experiments using extreme solid–liquid ratios, such as S1 (11.7%wt./vol.) and S2 (3.3%wt./vol.), show that TREE recovery can vary significantly. S1, with a time of 2 h and a concentration of 2 mol/L, achieved a TREE recovery of 47.0%; S2, with the same reaction time and citric acid concentration, achieved a TREE recovery yield of 74.3%. This comparison indicates that optimizing the solid–liquid ratio is essential to maximize recovery efficiency.
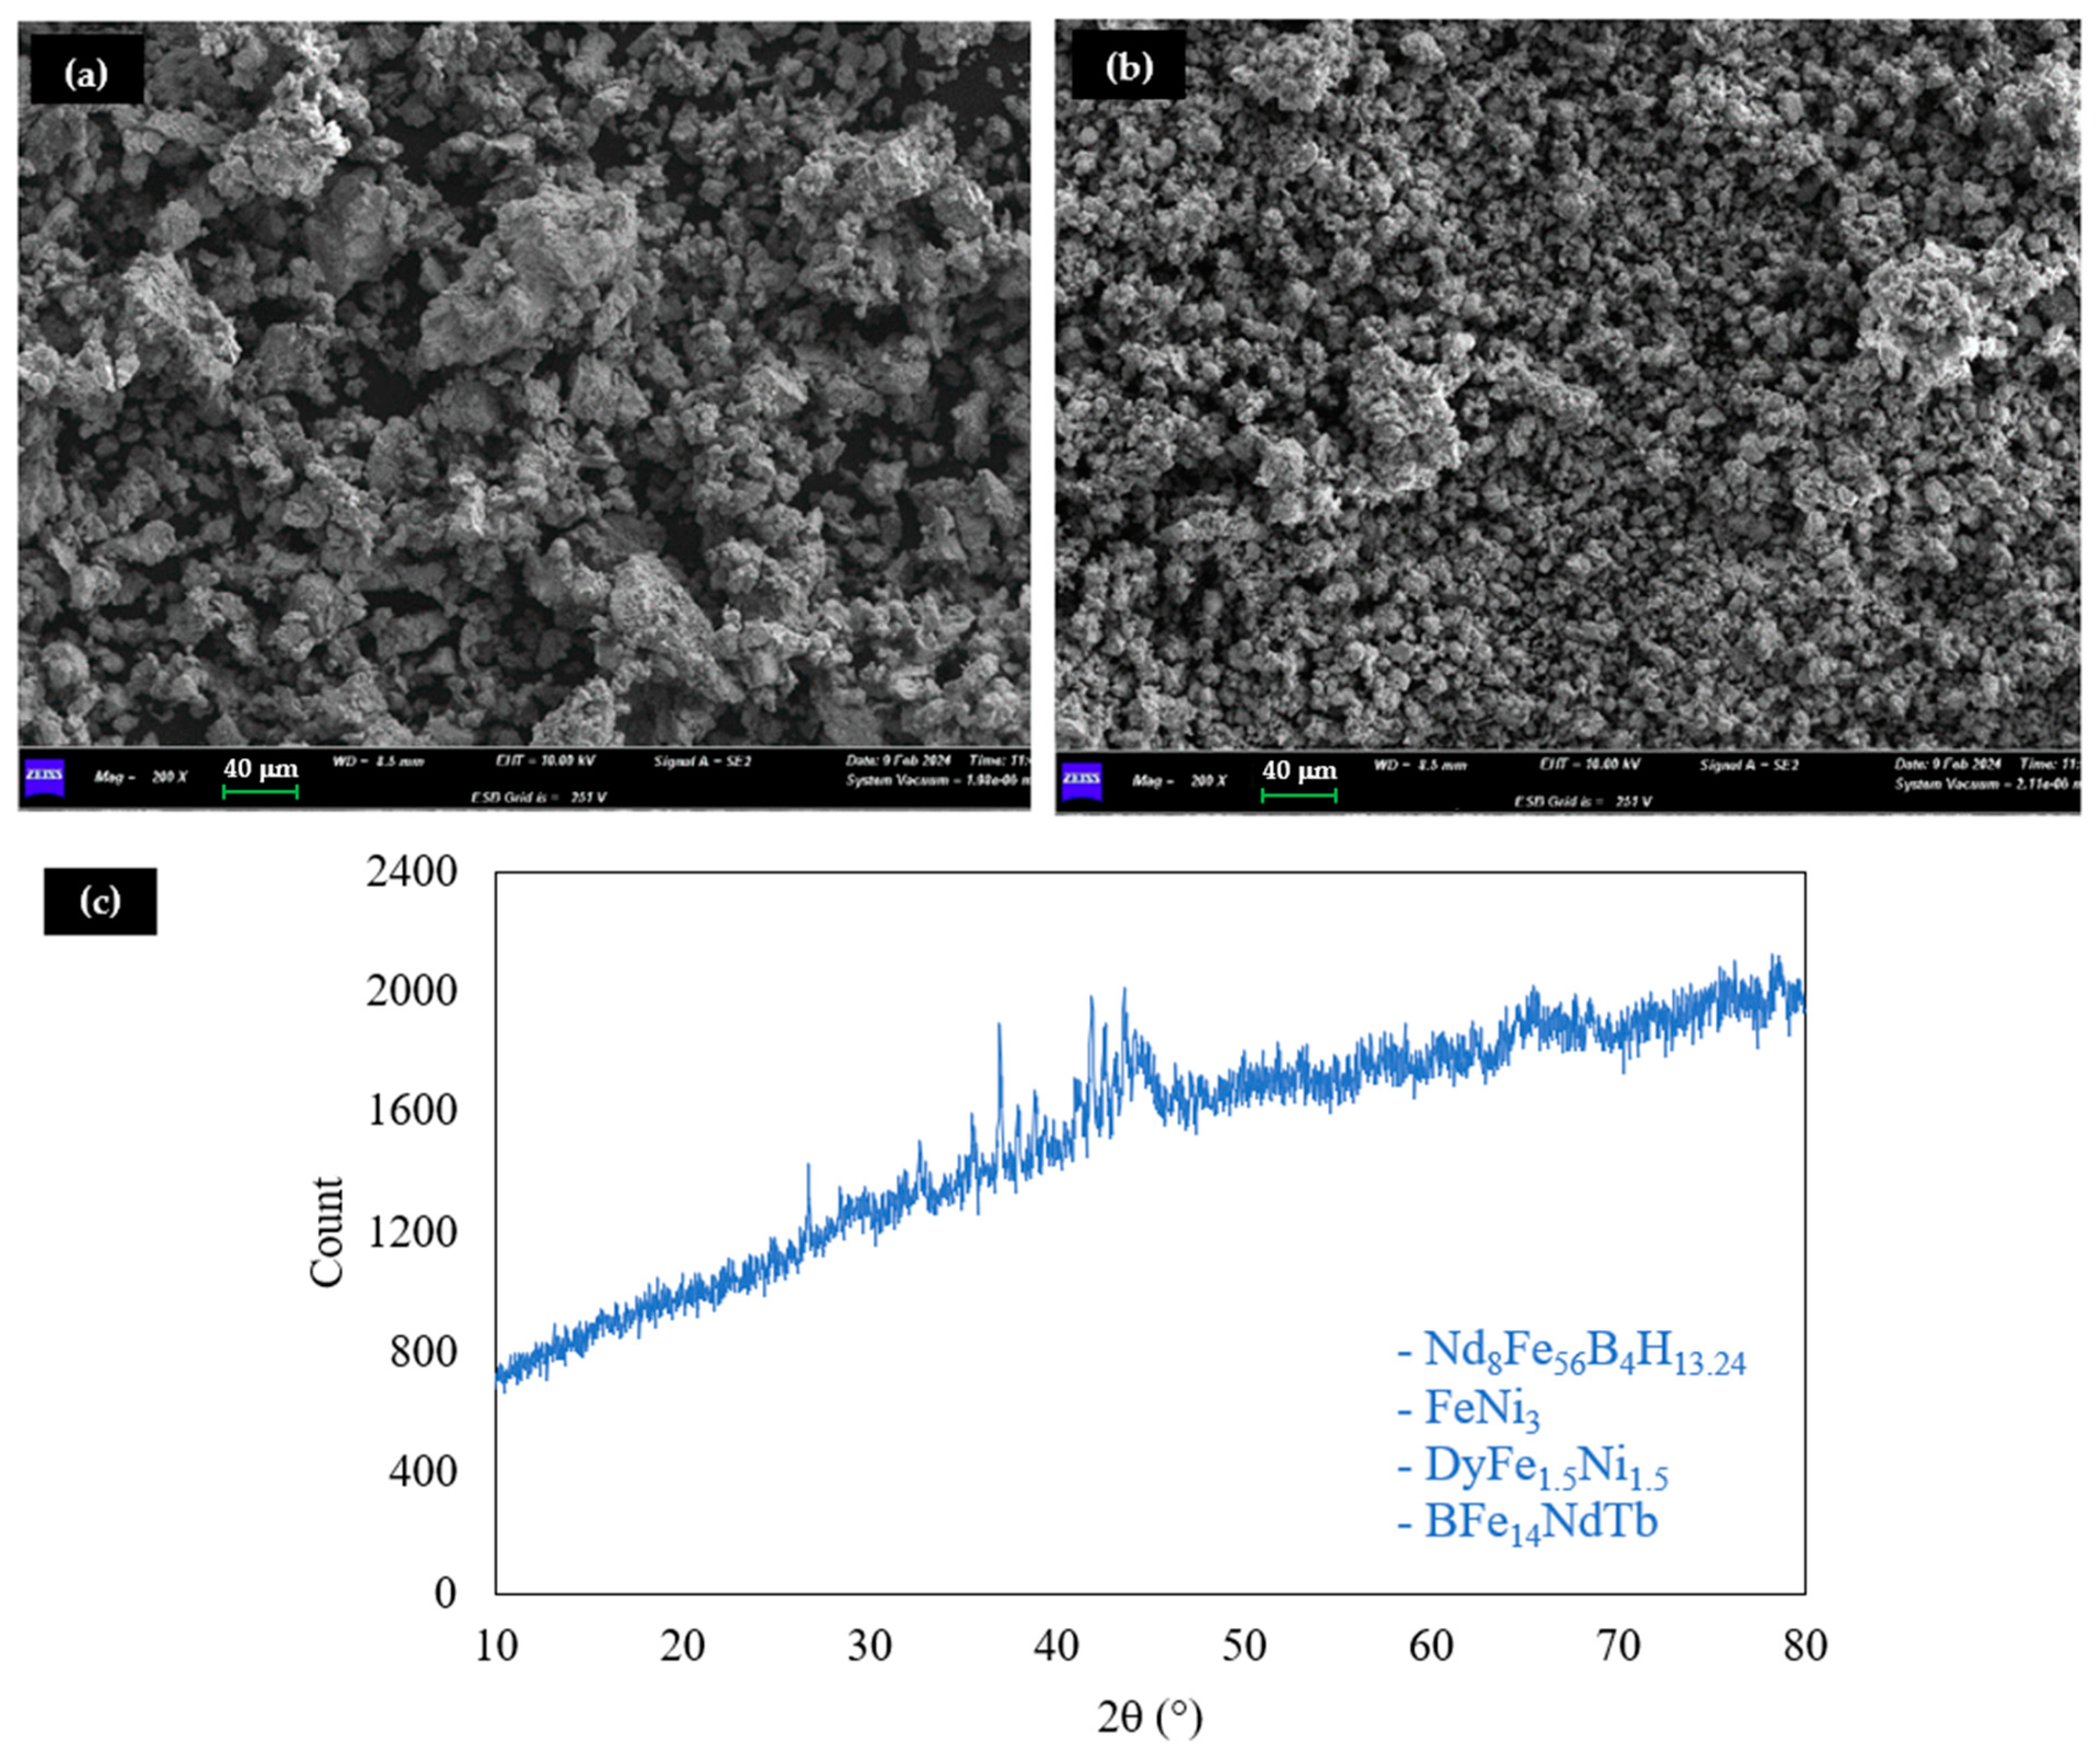
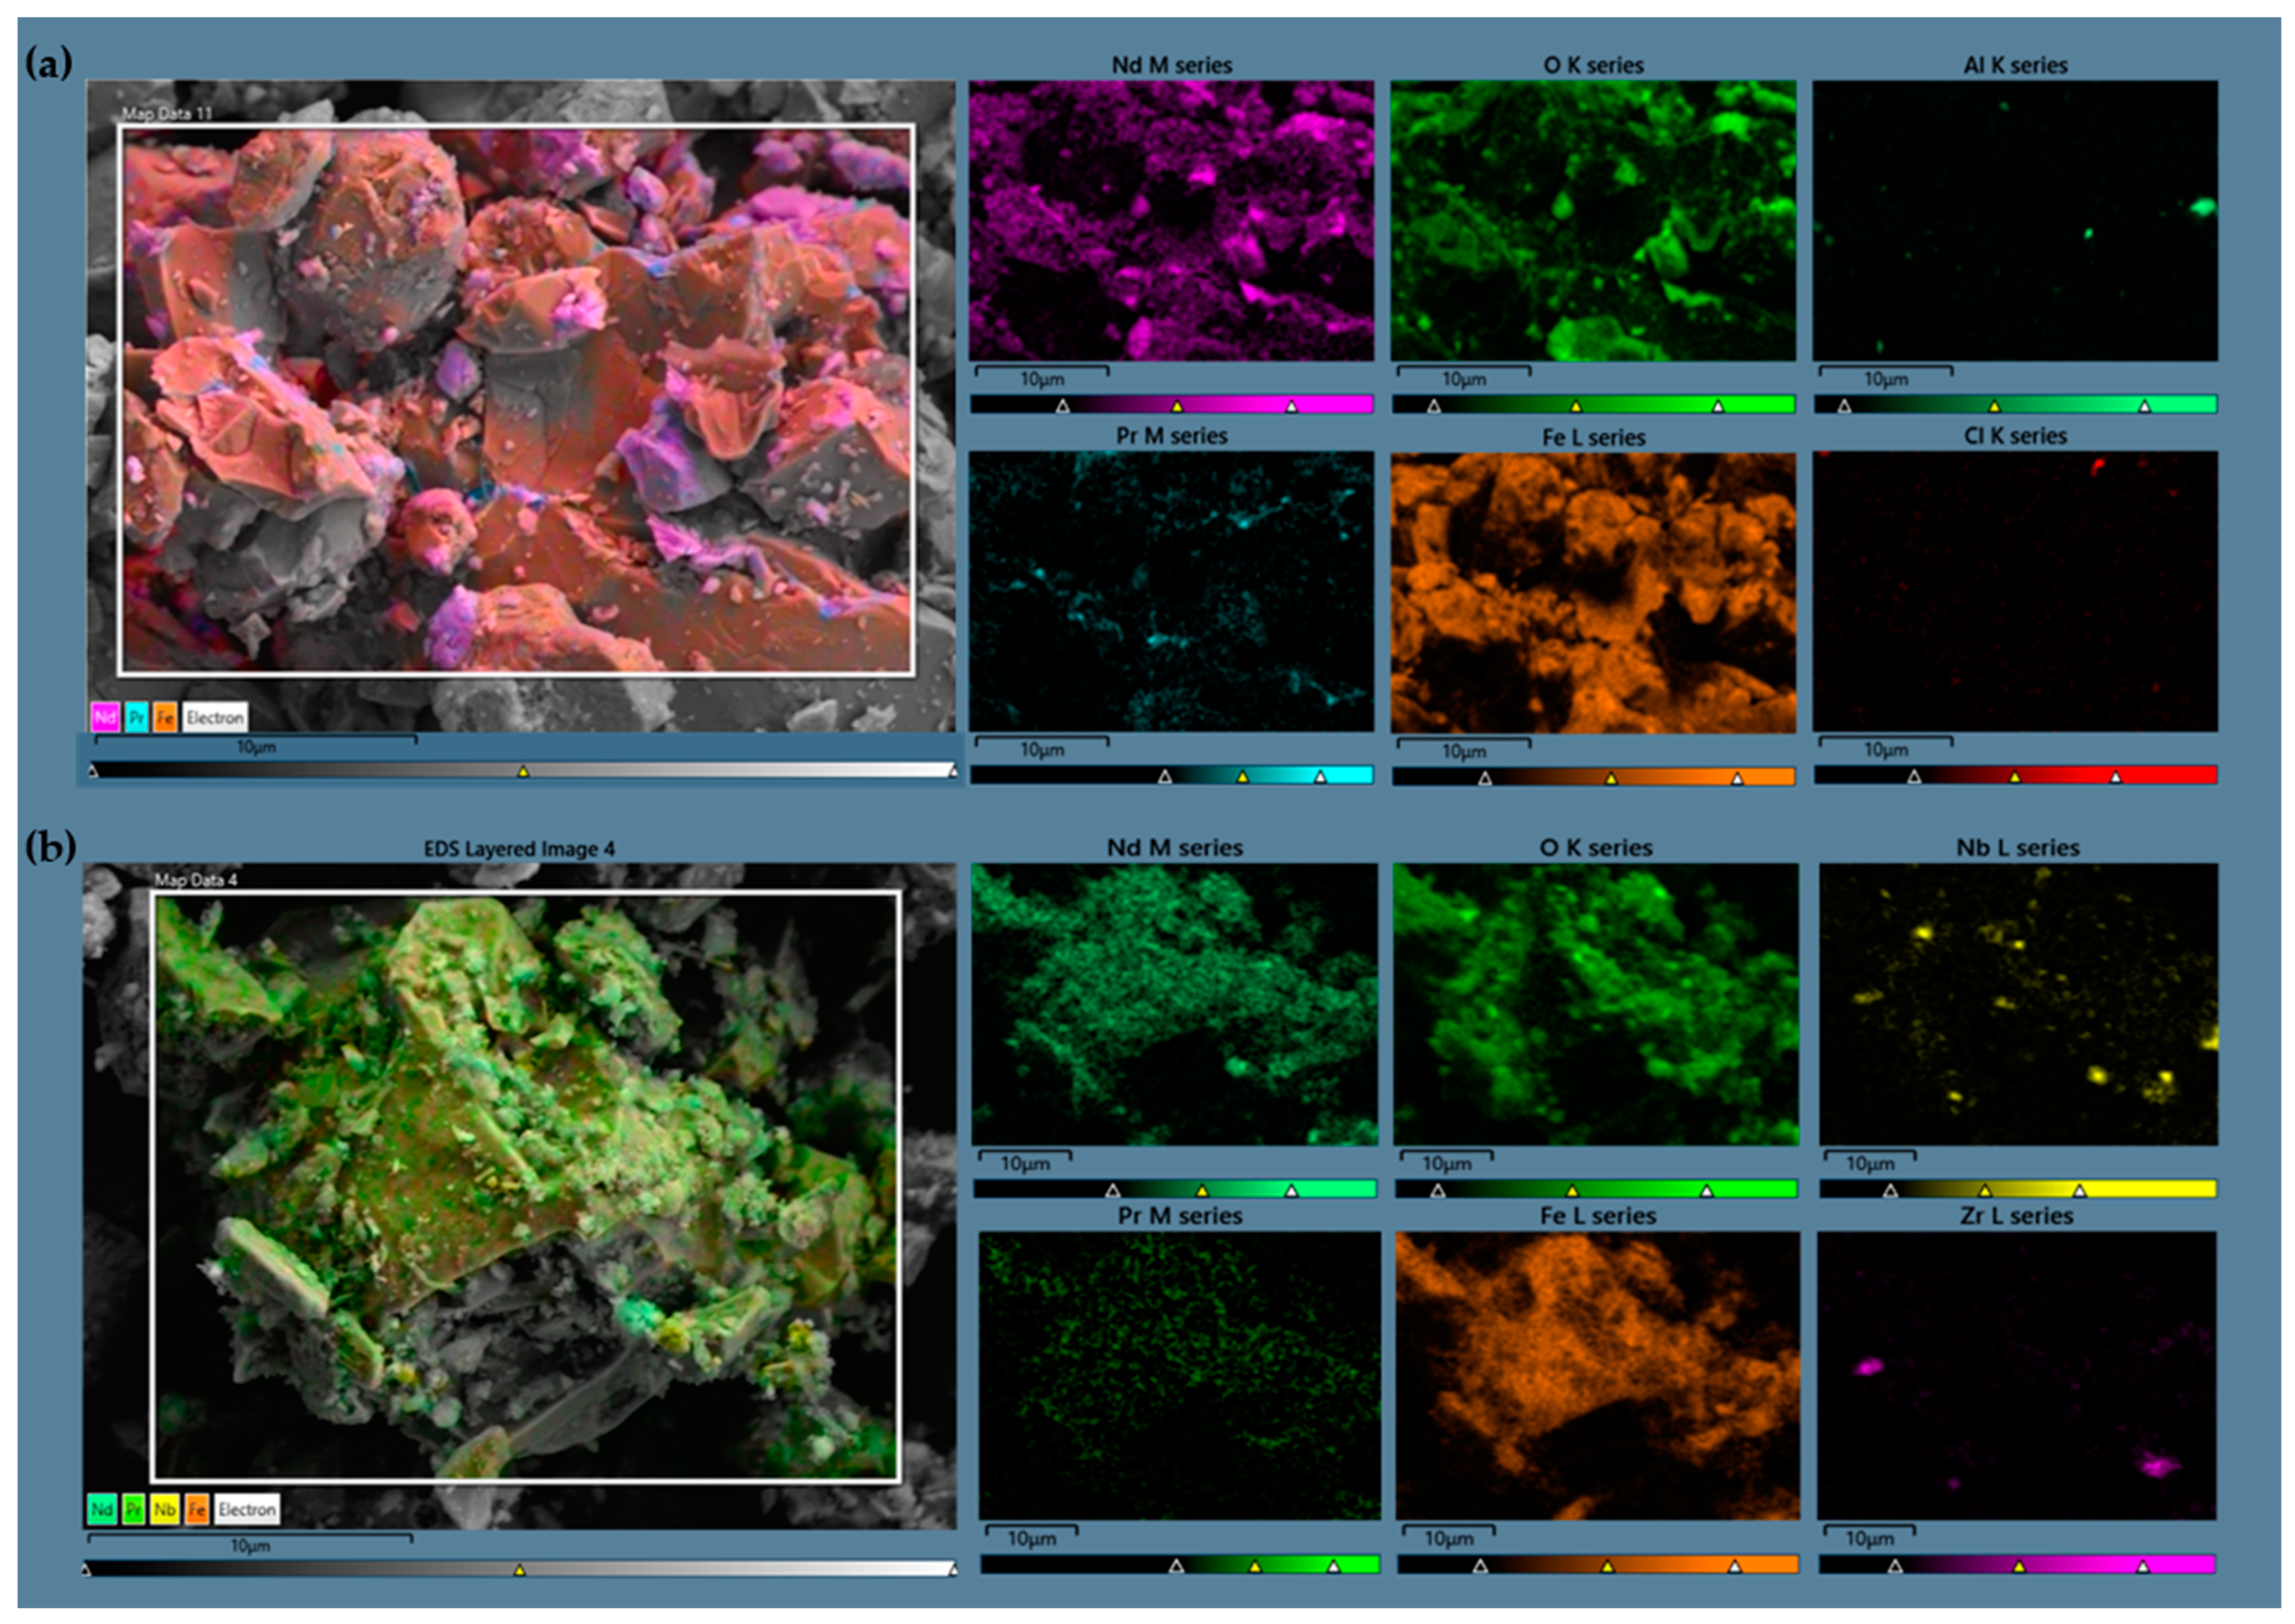
The solid residue from one of the four central point tests was analyzed using XRD and SEM-EDS. The results of these two analyses are reported in Figure 5 and Figure 6.
Figure 5a (SEM analysis of feed of leaching) and Figure 5b (SEM analysis of leaching residue) show that the size of the solid particles is reduced significantly during the leaching stage. A reduction in particle size indicates that some components have been dissolved and removed, resulting in smaller particles and increased porous portions. The residual particle comprised undissolved REEs, Fe, B, and Ni. The reduction in particle size could also be due to an alteration of the material structure, facilitating the fracture or disintegration of the particles into smaller units. This phenomenon may occur due to the high local hydrogen concentration that develops from the leaching reactions, which can cause hydrogen embrittlement [32] and hydrogen decrepitation [33].
The residual material from the leaching process contained compounds similar to the feed (Figure 2), except for Nd8Fe56B4H13.24, which includes a relatively high percentage of hydrogen. This result confirms the possibility of hydrogen embrittlement phenomena.
Figure 6a,b shows the results of elemental mapping conducted on both the material before leaching and on the residual solid. There are no significant differences between the two samples; however, it was possible to identify some contaminants. Traces of Al and Cl were found in the feed, and traces of Zr and Nb were observed in the leaching residue solids. The latter could be present due to the fact that some production processes for NdFeB magnets use Nb to improve the properties of the future alloy [34]. The differences between the elements found in the residual solid and not in the feed are mainly due to their low concentration in the initial sample, as well as a very slow dissolution kinetics or a completely inert behavior. The reduction of the average particle diameter allowed for better identification after leaching.
Once the recovery yield of REEs, Fe, and B was determined, an analysis of variance (ANOVA) was carried out to evaluate which variations recorded in the responses were significant and which were variations caused by experimental error. The significance of the effects was assessed using the F-test method at a 95% confidence level. The effects of all factors and interactions are shown in Figure 7. This figure represents the value of the effects, which reaches the 95% significance level for all elements. This means that every effect in the figure is significant, according to the F-test utilized [35].
The leaching time was the most significant critical factor in the recovery of all elements, with an average significance of 98%. Time positively affects leaching yields; an increment from 1 to 3 h increased the recovery efficiency by about 20–30% for the analyzed elements.
The element most influenced by the increase in reaction time is Tb, with an increase in the recovery yield of about +30% when increasing the reaction time from 1 h to 3 h. On the contrary, the element least influenced by time was B, with an increase in yield of about 20% in the time interval considered. From a physical point of view, the high significance of time for all elements and the very similar effects between them suggests that the dissolution kinetics are very similar, with significant effects in the first three hours of reaction. This result is also confirmed by the results of a previous study on the influence of citric acid on the extraction kinetics of REEs, Fe, and B [26].
As for the effect due to the variation of citric acid, the only two elements for which there was a significance higher than 95% were Dy and Nd. For both, the increase of citric acid from 1 mol/L to 3 mol/L increased the recovery yield by about 12%. These elements form stable complexes with chelating agents such as citric acid for Nd and Dy. This aspect may explain the effectiveness of citric acid in improving their recovery yield. This chelation tendency may be less pronounced in other REEs and elements such as Fe and B.
The solid–liquid ratio is another important factor for process optimization, as it significantly affects all elements, except for Dy and Nd. As expected, an increase in this factor leads to a decrease in recovery yields of about 10–20%. The low significance of the solid–liquid ratio on the recovery yield of Nd and Dy can be attributed to their tendency to form very stable complexes with citric acid, which, however, does not depend on the total amount of citric acid present in the solution but simply on its concentration. These combined factors explain why, unlike other elements, Nd and Dy do not show significance regarding the solid–liquid ratio in the recovery process.
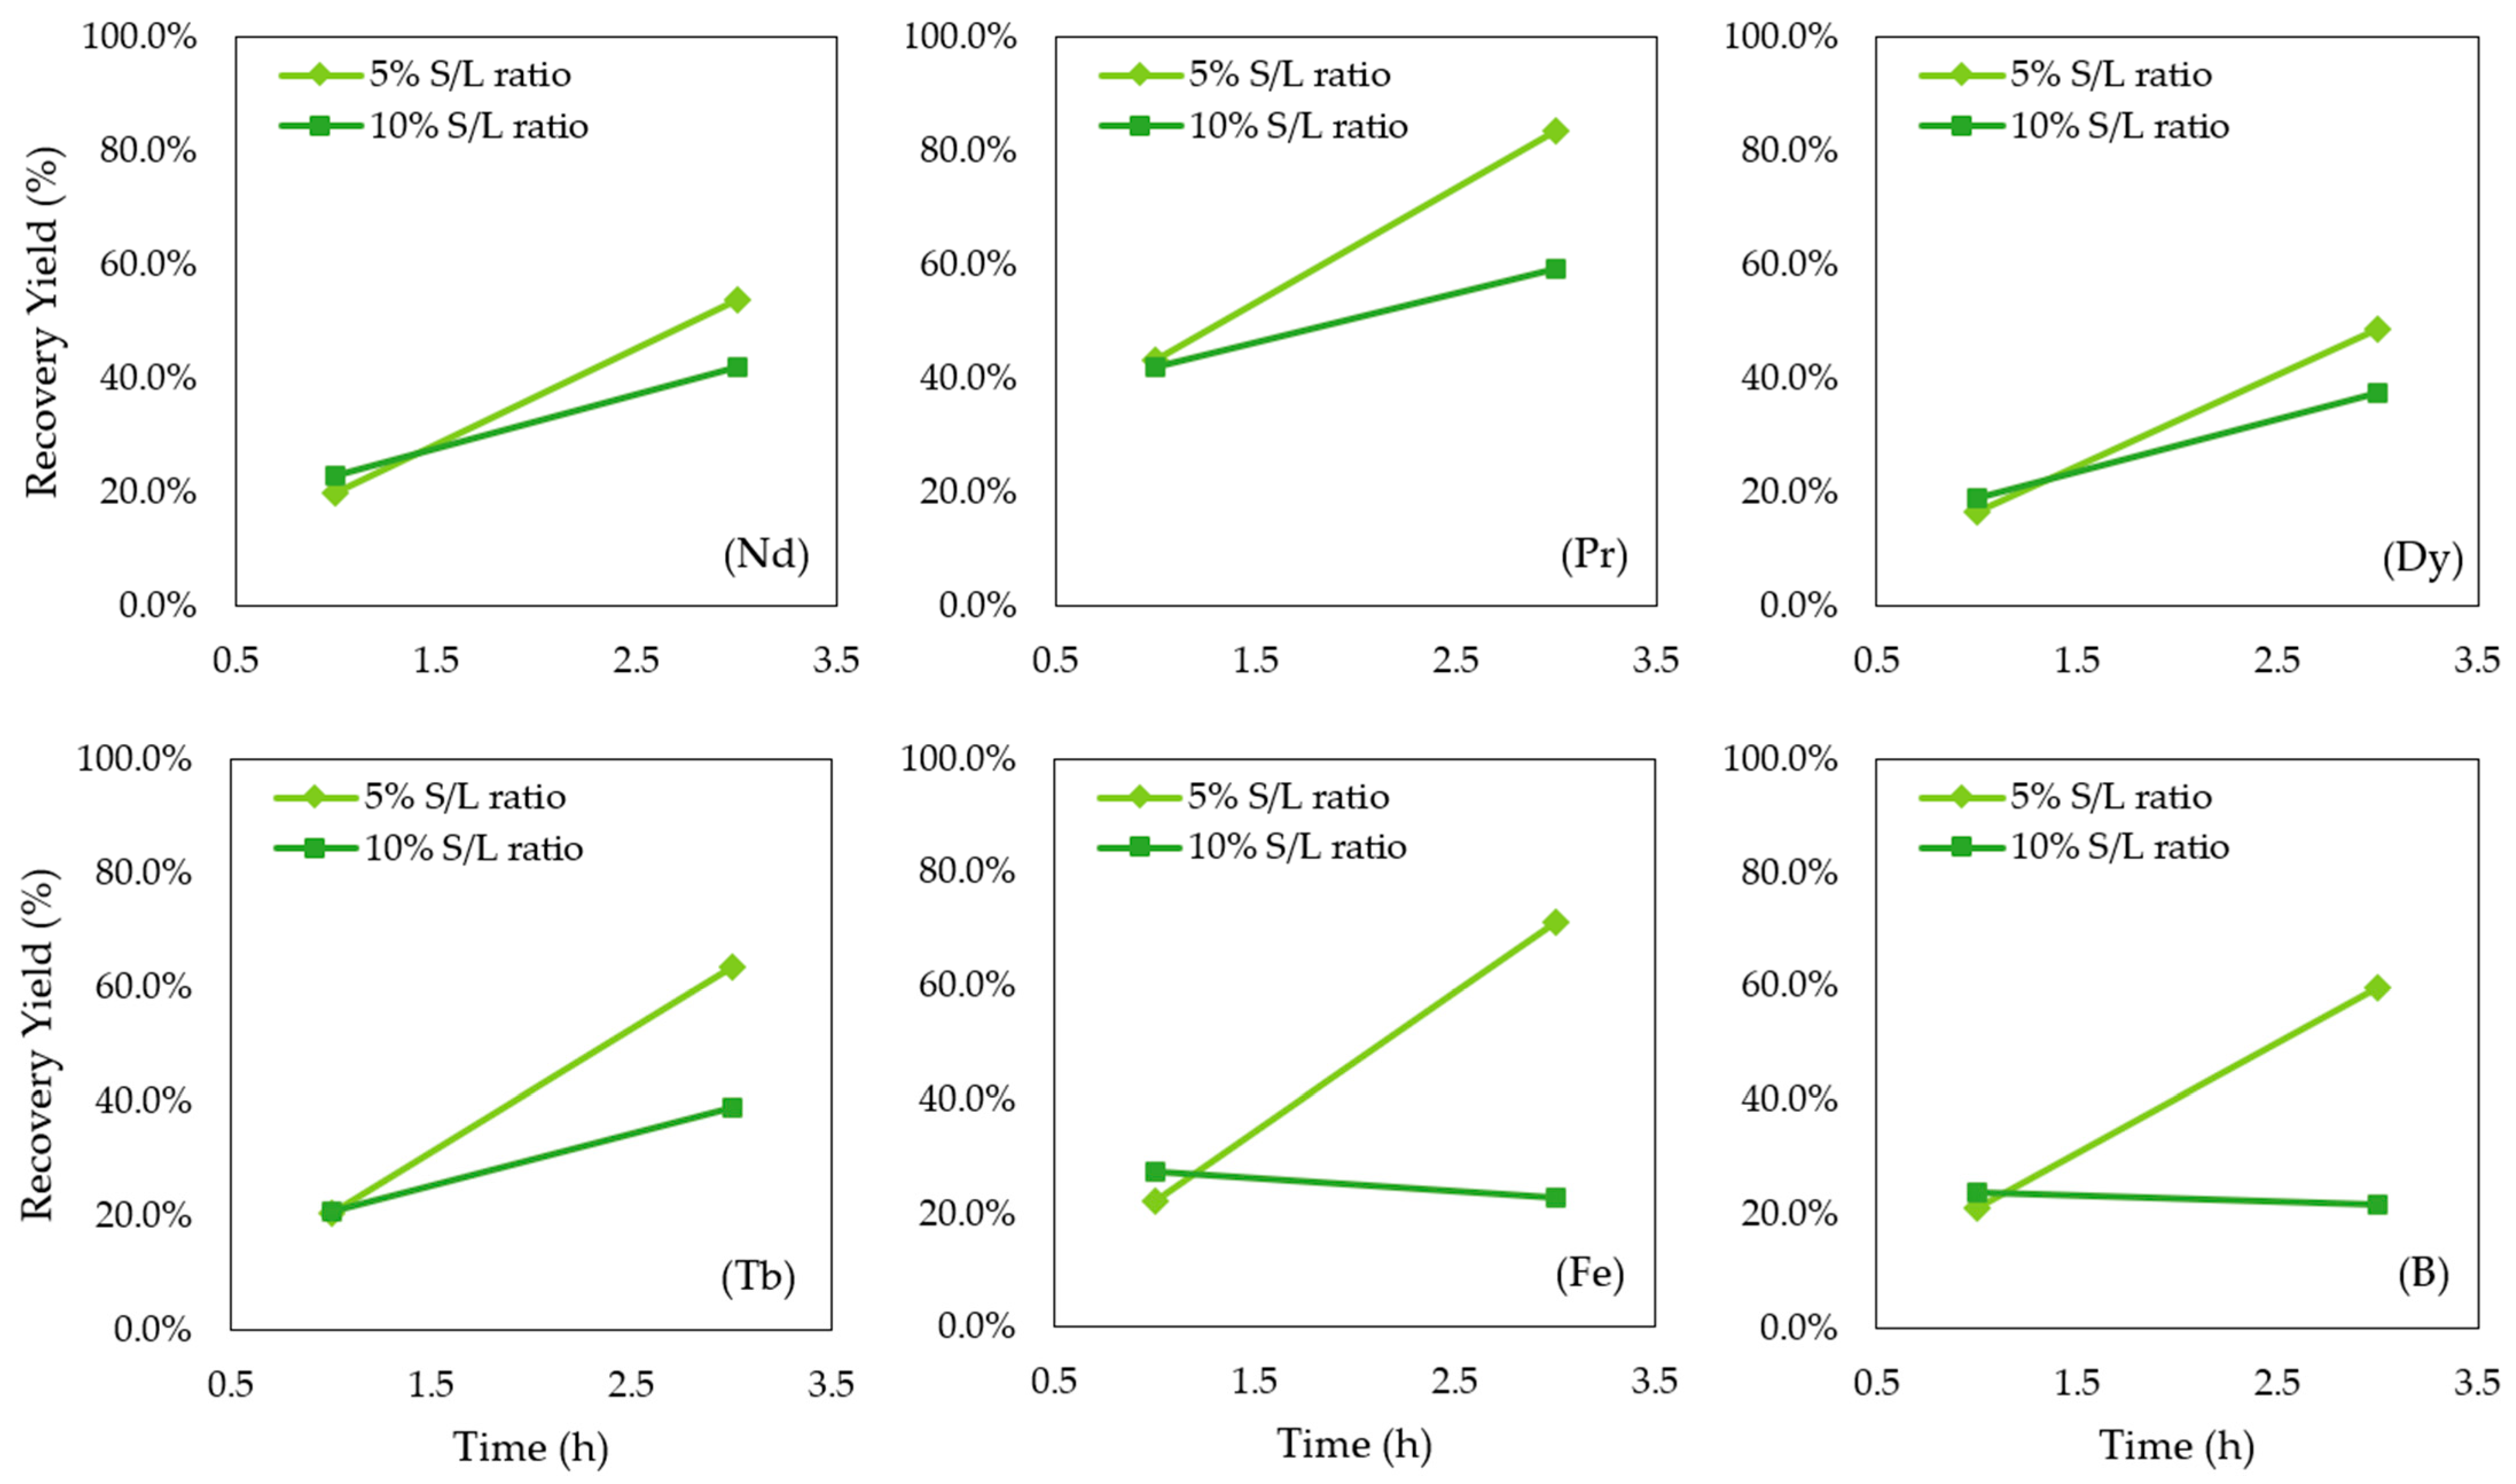
The only significant interaction is that between time and solid–liquid ratio. This interaction affects the yields, with a 10–30% decrease for all elements except Nd and Dy. This result suggests that the solid–liquid ratio significantly affects the kinetics of the recovery yield. At a lower solid–liquid ratio (5%), the dissolution kinetics are faster, leading to a faster increase in recovery yield compared to that from a higher S/L ratio (10%). This phenomenon is due to better diffusion, less interference from reaction products, and gradual solvent saturation. For Nd and Dy, the kinetics are not significantly affected by this interaction. The effects of the second-order interactions on the recovery yields are shown in the two-way diagrams reported in Figure 8.

3.2. Leaching Efficiency Models Using RSM

The recovery yields for all elements considered were described using second-order polynomial response surfaces. The significance of the explanatory variable for consideration in the model was validated using p values [36]. Table 4 summarizes all the main statistical results for the regressions.
For all the elements, the regression statistics show an R2 of 0.649–0.992, an adjusted R2 of 0.573–0.984, and an overall p-value < 0.001. Based on these values, the second-order polynomial models for the leaching efficiencies of REEs, Fe, and B are:
N d r e c ( % ) = 25.69 + 32.98   C C 6 H 8 O 7 + 15.41   t 6.51   C C 6 H 8 O 7 2  
P r r e c ( % ) = 12.34 + 38.64   C C 6 H 8 O 7 + 14.20   t 8.21   C C 6 H 8 O 7 2
D y r e c % = 33.58 + 26.45   C C 6 H 8 O 7 + 14.38   t 14.13   S L r a t i o 4.94   C C 6 H 8 O 7 2 + 0.81   S L r a t i o 2
T b r e c % = 3.23 + 17.69   C C 6 H 8 O 7 + 35.49   t 4.58   C C 6 H 8 O 7 · t 2.47   C C 6 H 8 O 7 · S L r a t i o 7.89   C C 6 H 8 O 7 2 2.57   t 2 + 0.29   S L r a t i o 2
F e r e c % = 84.28 + 45 .   88   C C 6 H 8 O 7 + 56.79   t + 6.65   S L r a t i o 5.35   t · S L r a t i o 10.01   C C 6 H 8 O 7 2
B r e c % = 60.47 + 38.34   C C 6 H 8 O 7 + 43.99   t + 4.70   S L r a t i o 4.07   t · S L r a t i o 8.44   C C 6 H 8 O 7 2
T R E E r e c % = 8.54 + 33.46   C C 6 H 8 O 7 + 15.12   t 2.02   S L r a t i o 6.68   C C 6 H 8 O 7 2
The regression models confirmed the results of ANOVA. Nd and Dy exhibit similar behavior, with citric acid concentration and time as the principal factors. Furthermore, it is observed that the solid–liquid ratio does not significantly influence the recovery yield.
Tb is the only element for which the overall model of the extraction yield is made up of all the factors of the model (binary interactions and squared terms). This aspect partially explains the higher value of R2. For Tb, it was noted that the model does not depend on the solid–liquid ratio, unlike the results from the ANOVA. Fe and B exhibit a very similar result, influenced by all the factors and the interaction time/solid–liquid ratio.
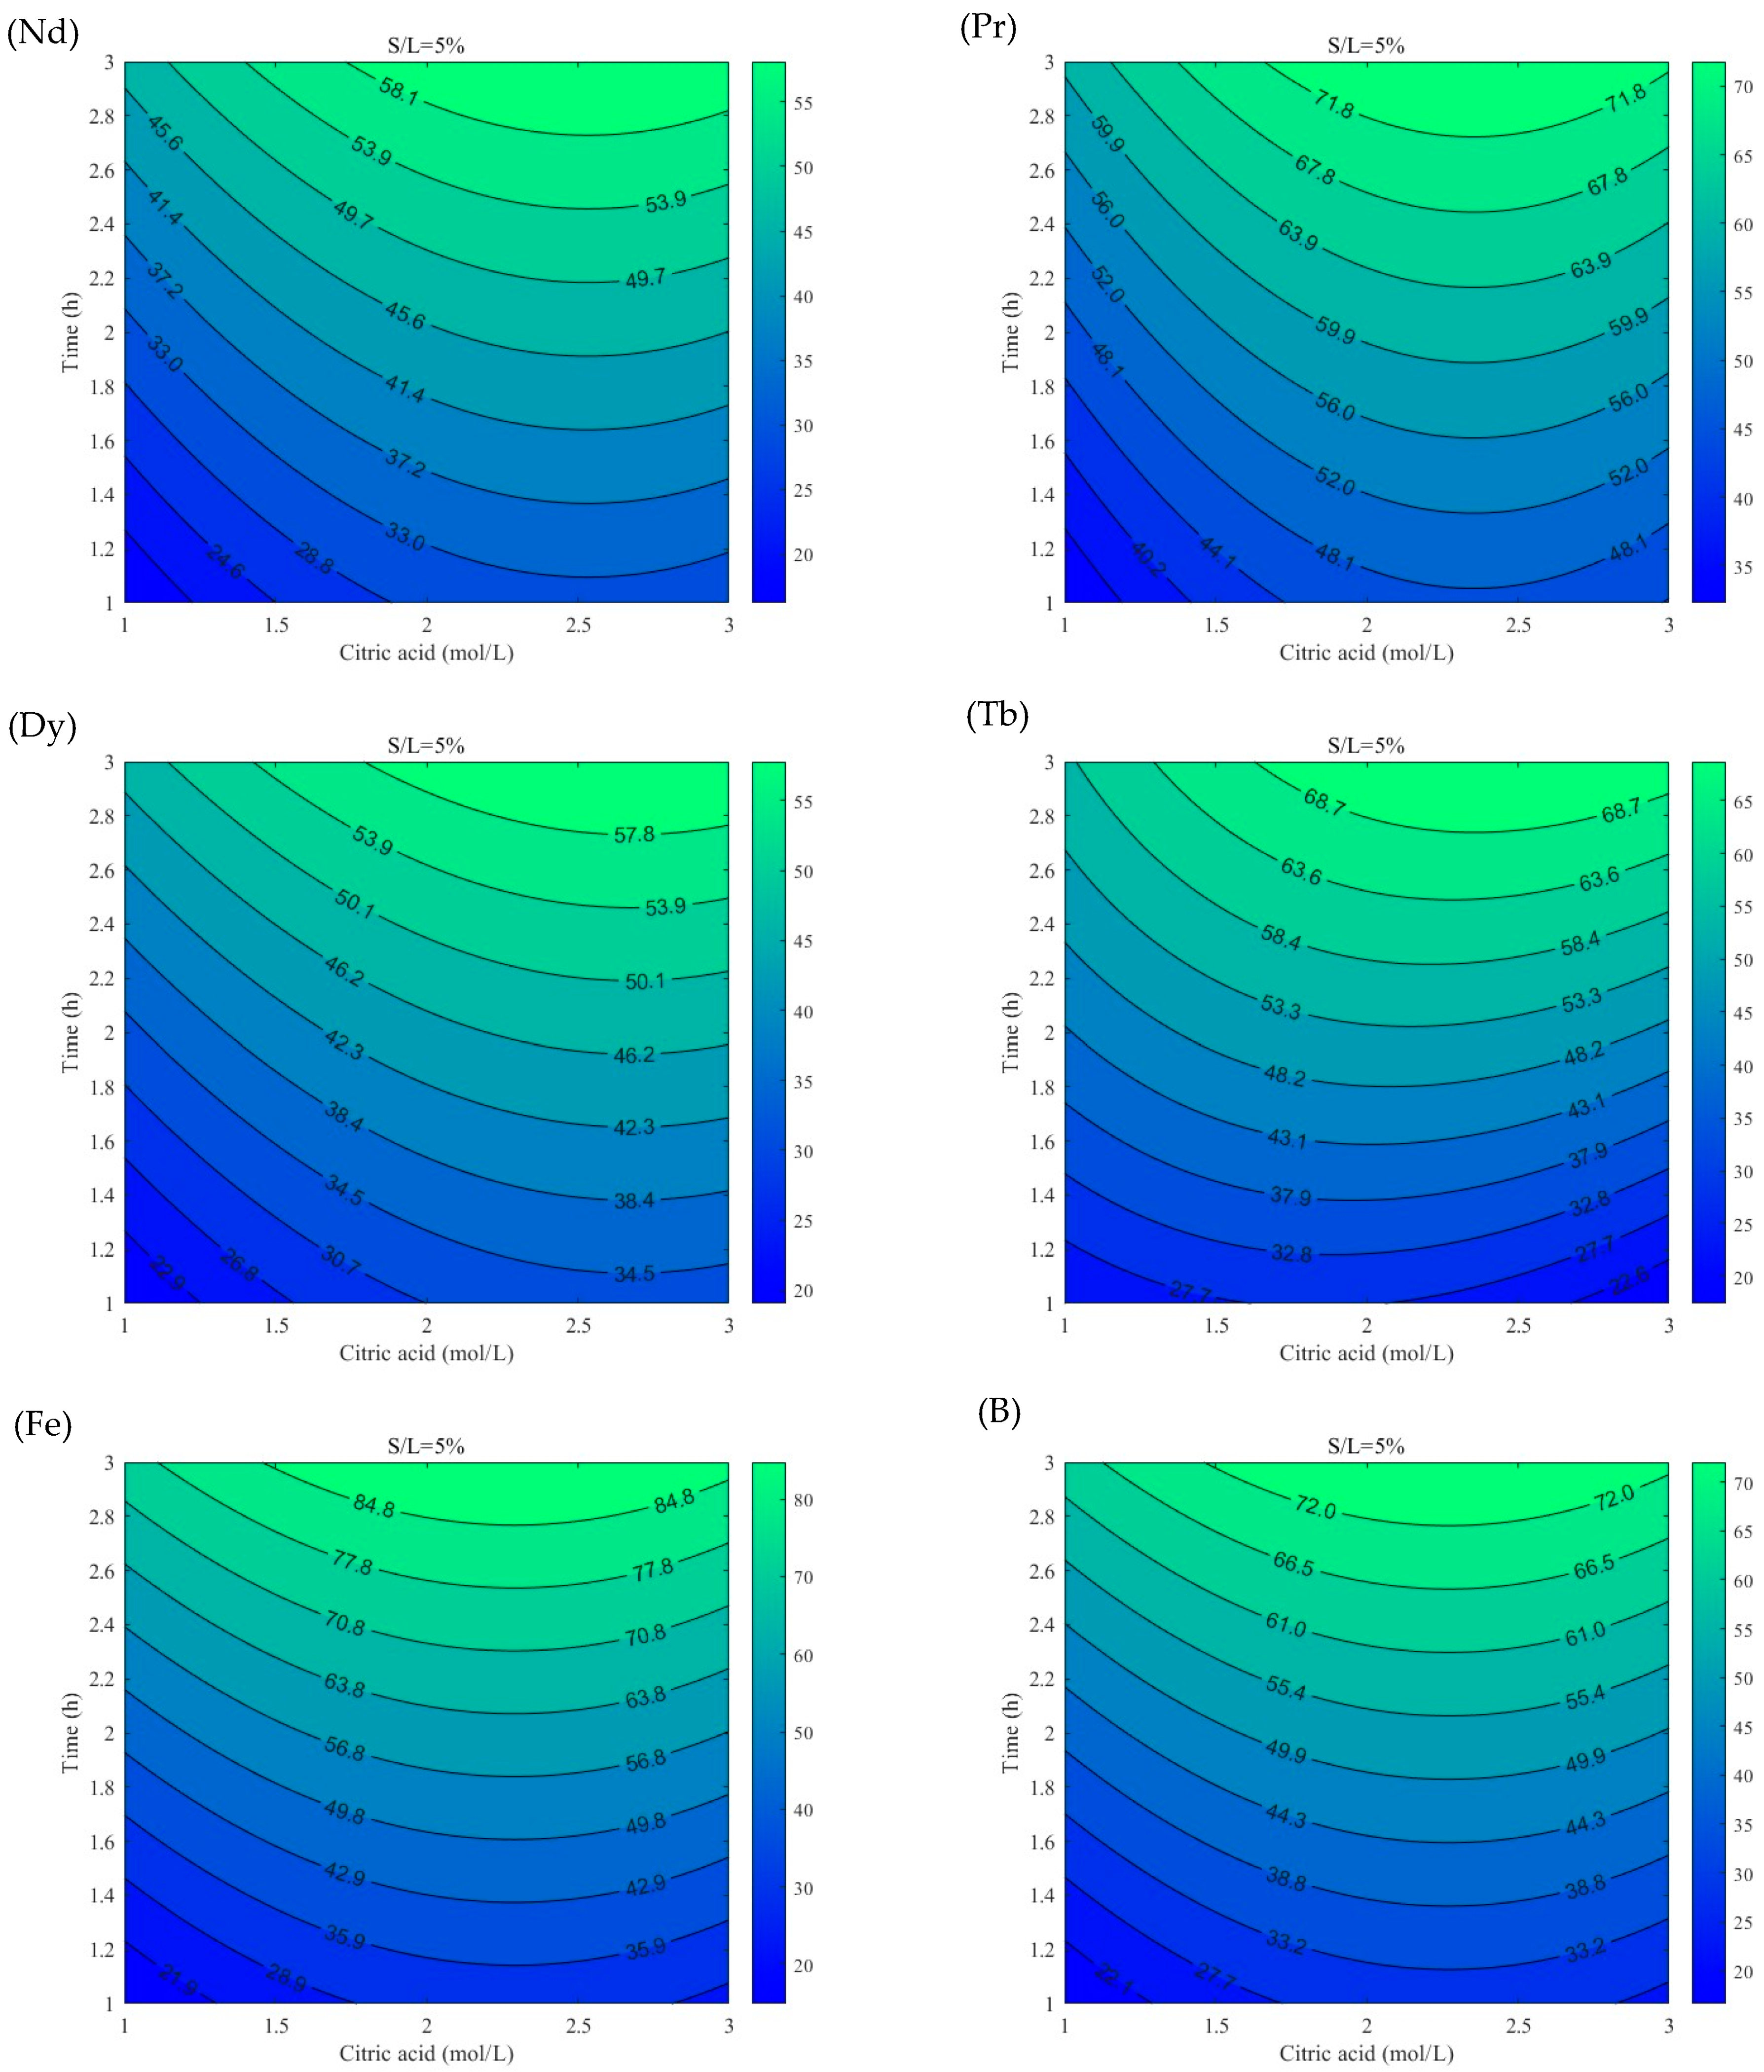
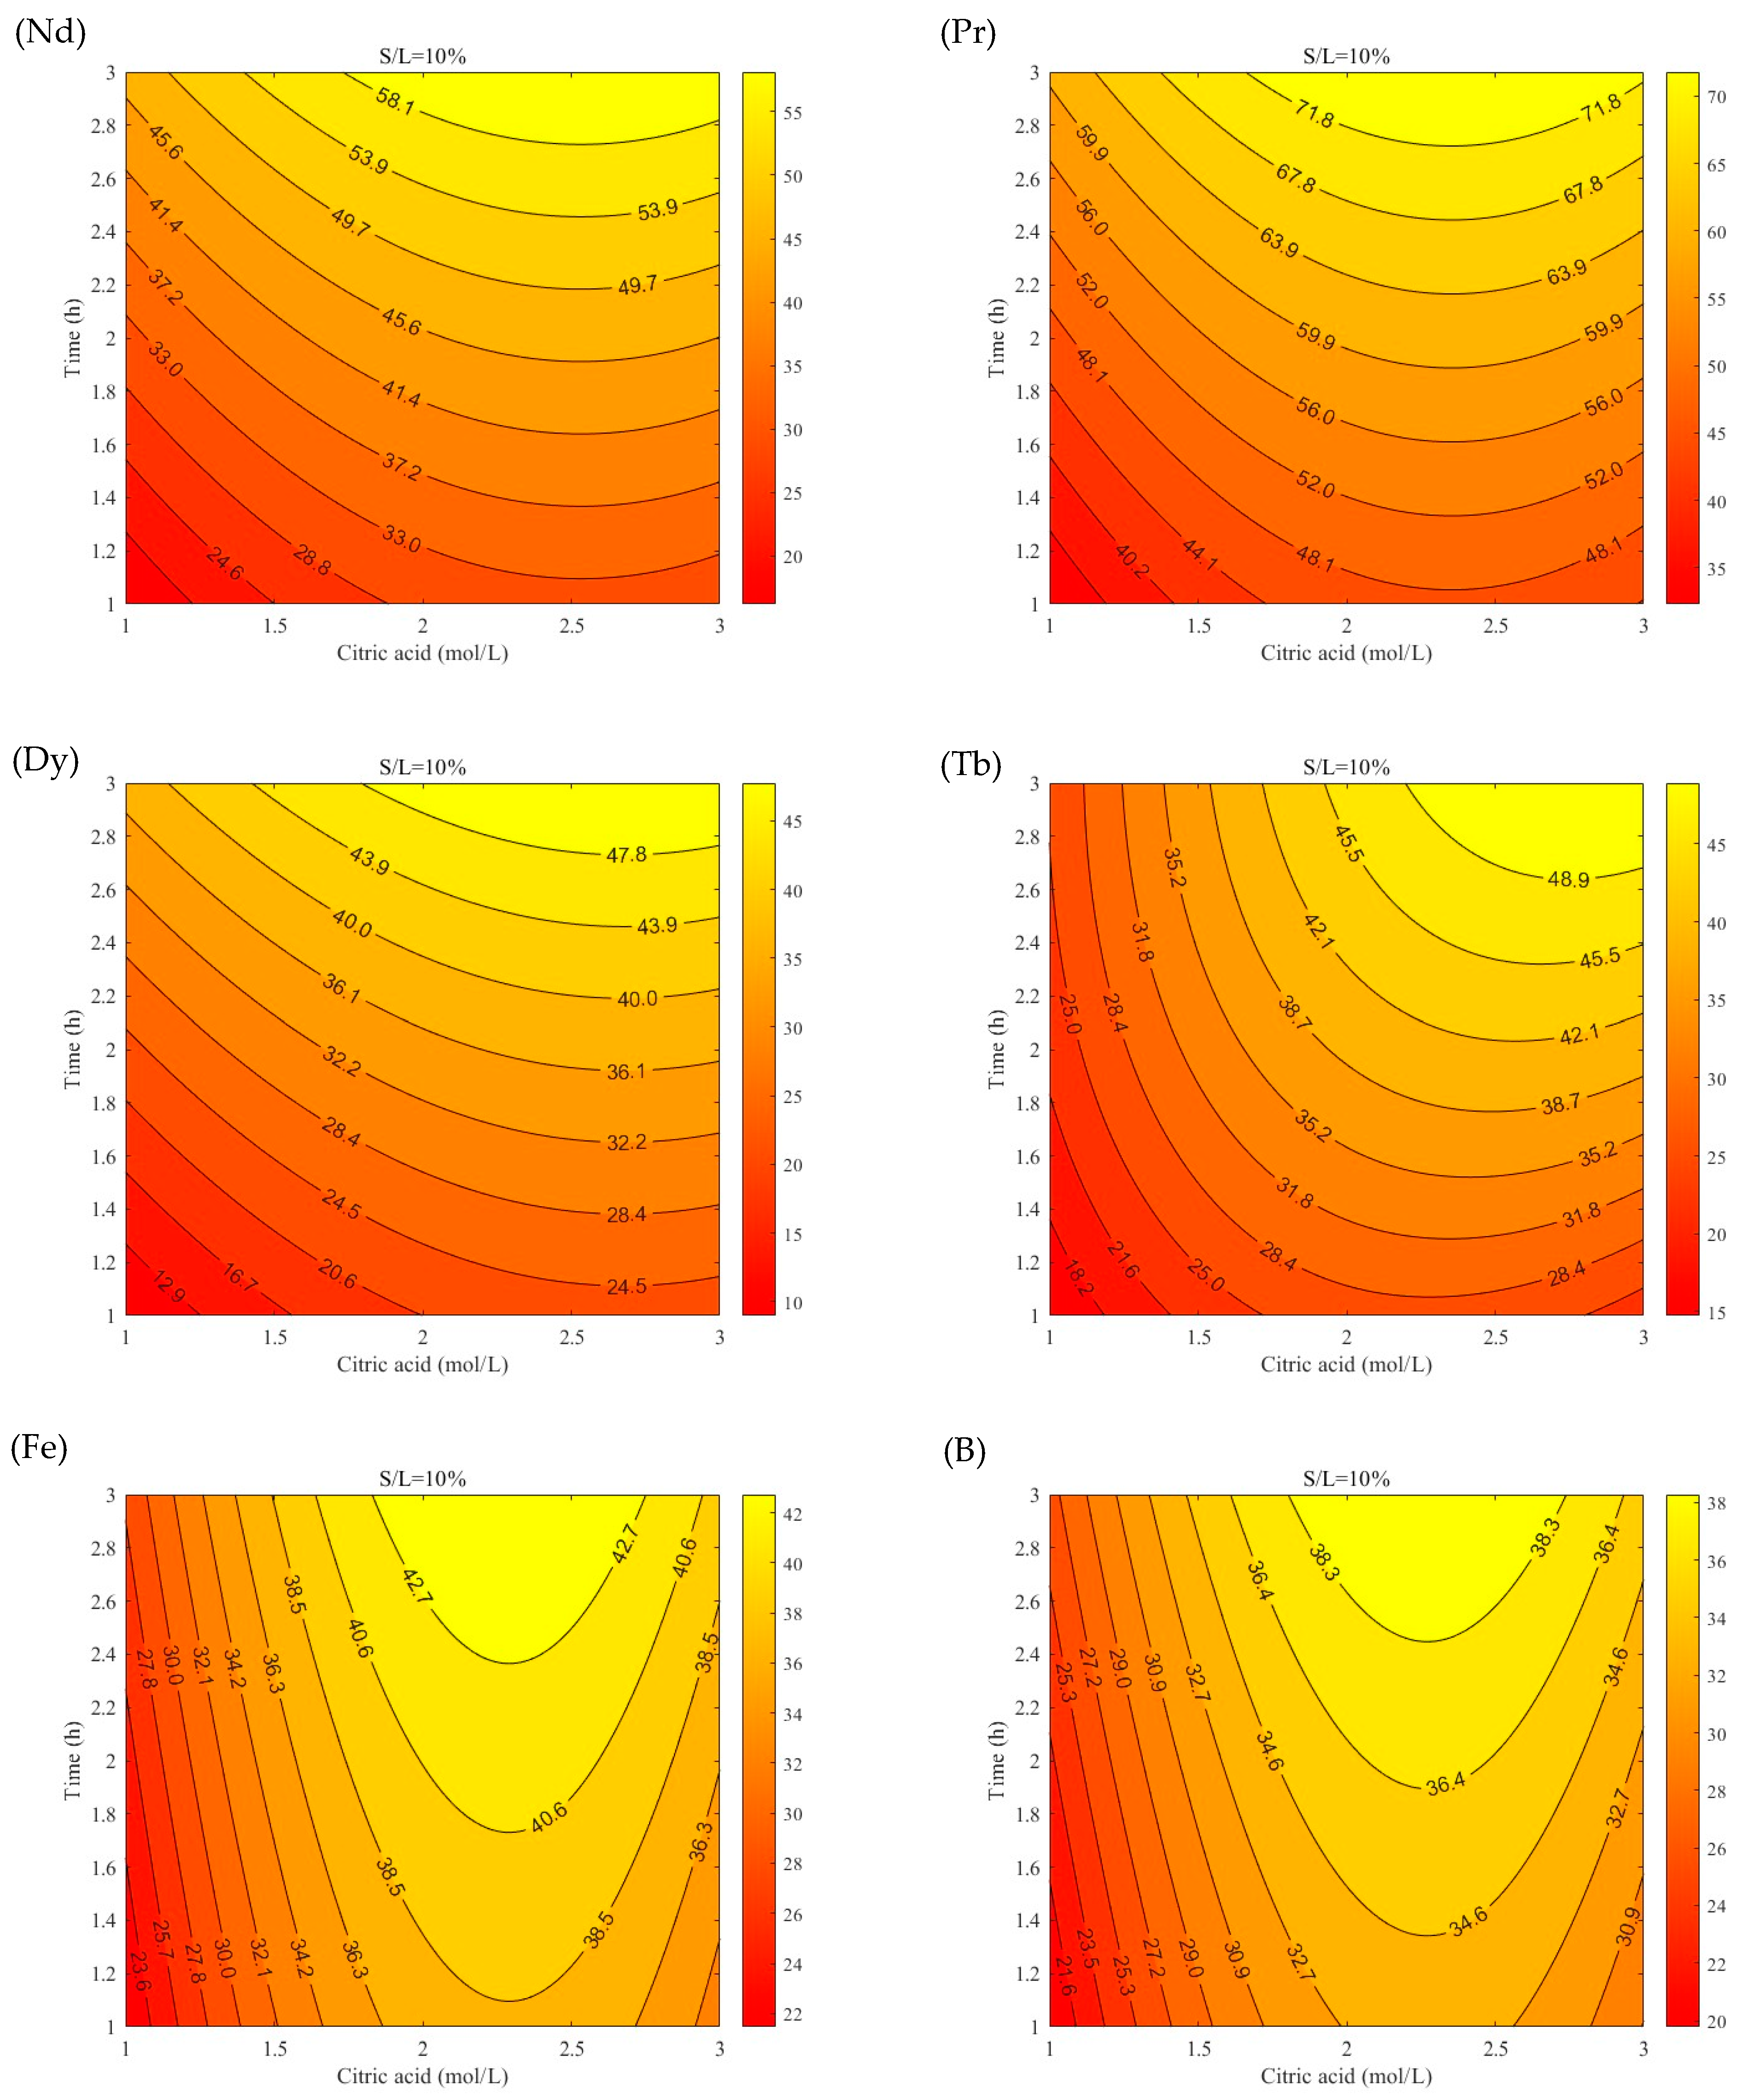
The determined equations were used to draw the response surfaces on the plane constituted by the variable’s citric acid–time relationship; the surfaces are parameters of the solid–liquid ratio, enabling their representation. Figure 9 and Figure 10 show the contour plots for all the elements, with a ratio of 5%wt./vol. and 10%wt.vol., respectively.
As can be seen from the figures, the shapes of the surfaces are very similar if we consider a solid–liquid ratio of 5%wt./vol. This result is not obtained with a solid–liquid ratio of 10%wt./vol. In this case, we can see how the REEs behave similarly to each other (a slight difference can be observed for Tb) but very differently compared to Fe and B. The latter have surfaces of the same shape. The slight difference for Tb is due to the presence of significative additional terms in the surface equation compared to the composition of the other REEs (these terms describe a higher curvature of the contour lines than those of other REEs.).
A response surface, a visual representation of the relationship between multiple variables and a response, was also created to describe the TREE recovery yield. This surface, which is very similar to that of Nd, Pr, and Dy, given their percentage in the starting solid matrix compared to that of Tb, is a crucial tool in our optimization process. It serves as the objective function we want to maximize in order to extract the highest quantity of rare earths. In hydrometallurgy, there are different approaches for process optimization in the case of the simultaneous recovery of different elements. Various approaches are present due to the different behavior of metals in the same extraction environment, which could lead to different optimal working points, based on the metal considered.
Among the most used methods, we identify two main approaches for process optimization. The first approach tends to maximize the total recovery of raw materials from the solid matrix, making it a better performing process from a recycling point of view. The second approach involves maximizing the function of the revenues due to the net recovery of raw materials in regards to the consumption costs, rendering it a more feasible process from an economic point of view.
This study used the first approach as a starting point for future studies within the INSPIREE project. Figure 11 shows the response surface for the TREE recovery yield, with the determination of the respective optimal working point.
The point that maximizes the recovery yield of TREE in the experimental space investigated is characterized by a citric acid concentration of 2.5 mol/L, a time of 3.7 h, and a solid–liquid ratio of 3.3%wt./vol. These operating conditions allow for a good recovery yield of about 89.23%.
It is important to note that, in addition to REEs, Fe and B are also dissolved during the leaching stage, necessitating further purification steps. Rahmati et al. [37] demonstrated that solvent extraction using di(2-ethylhexyl)phosphoric acid (D2EHPA) can selectively separate REEs from the citrate leach solution. Moreover, during the precipitation stripping stage, REEs are recovered as oxalates, yielding a final product with an iron concentration of 0.1% and a negligible boron concentration.
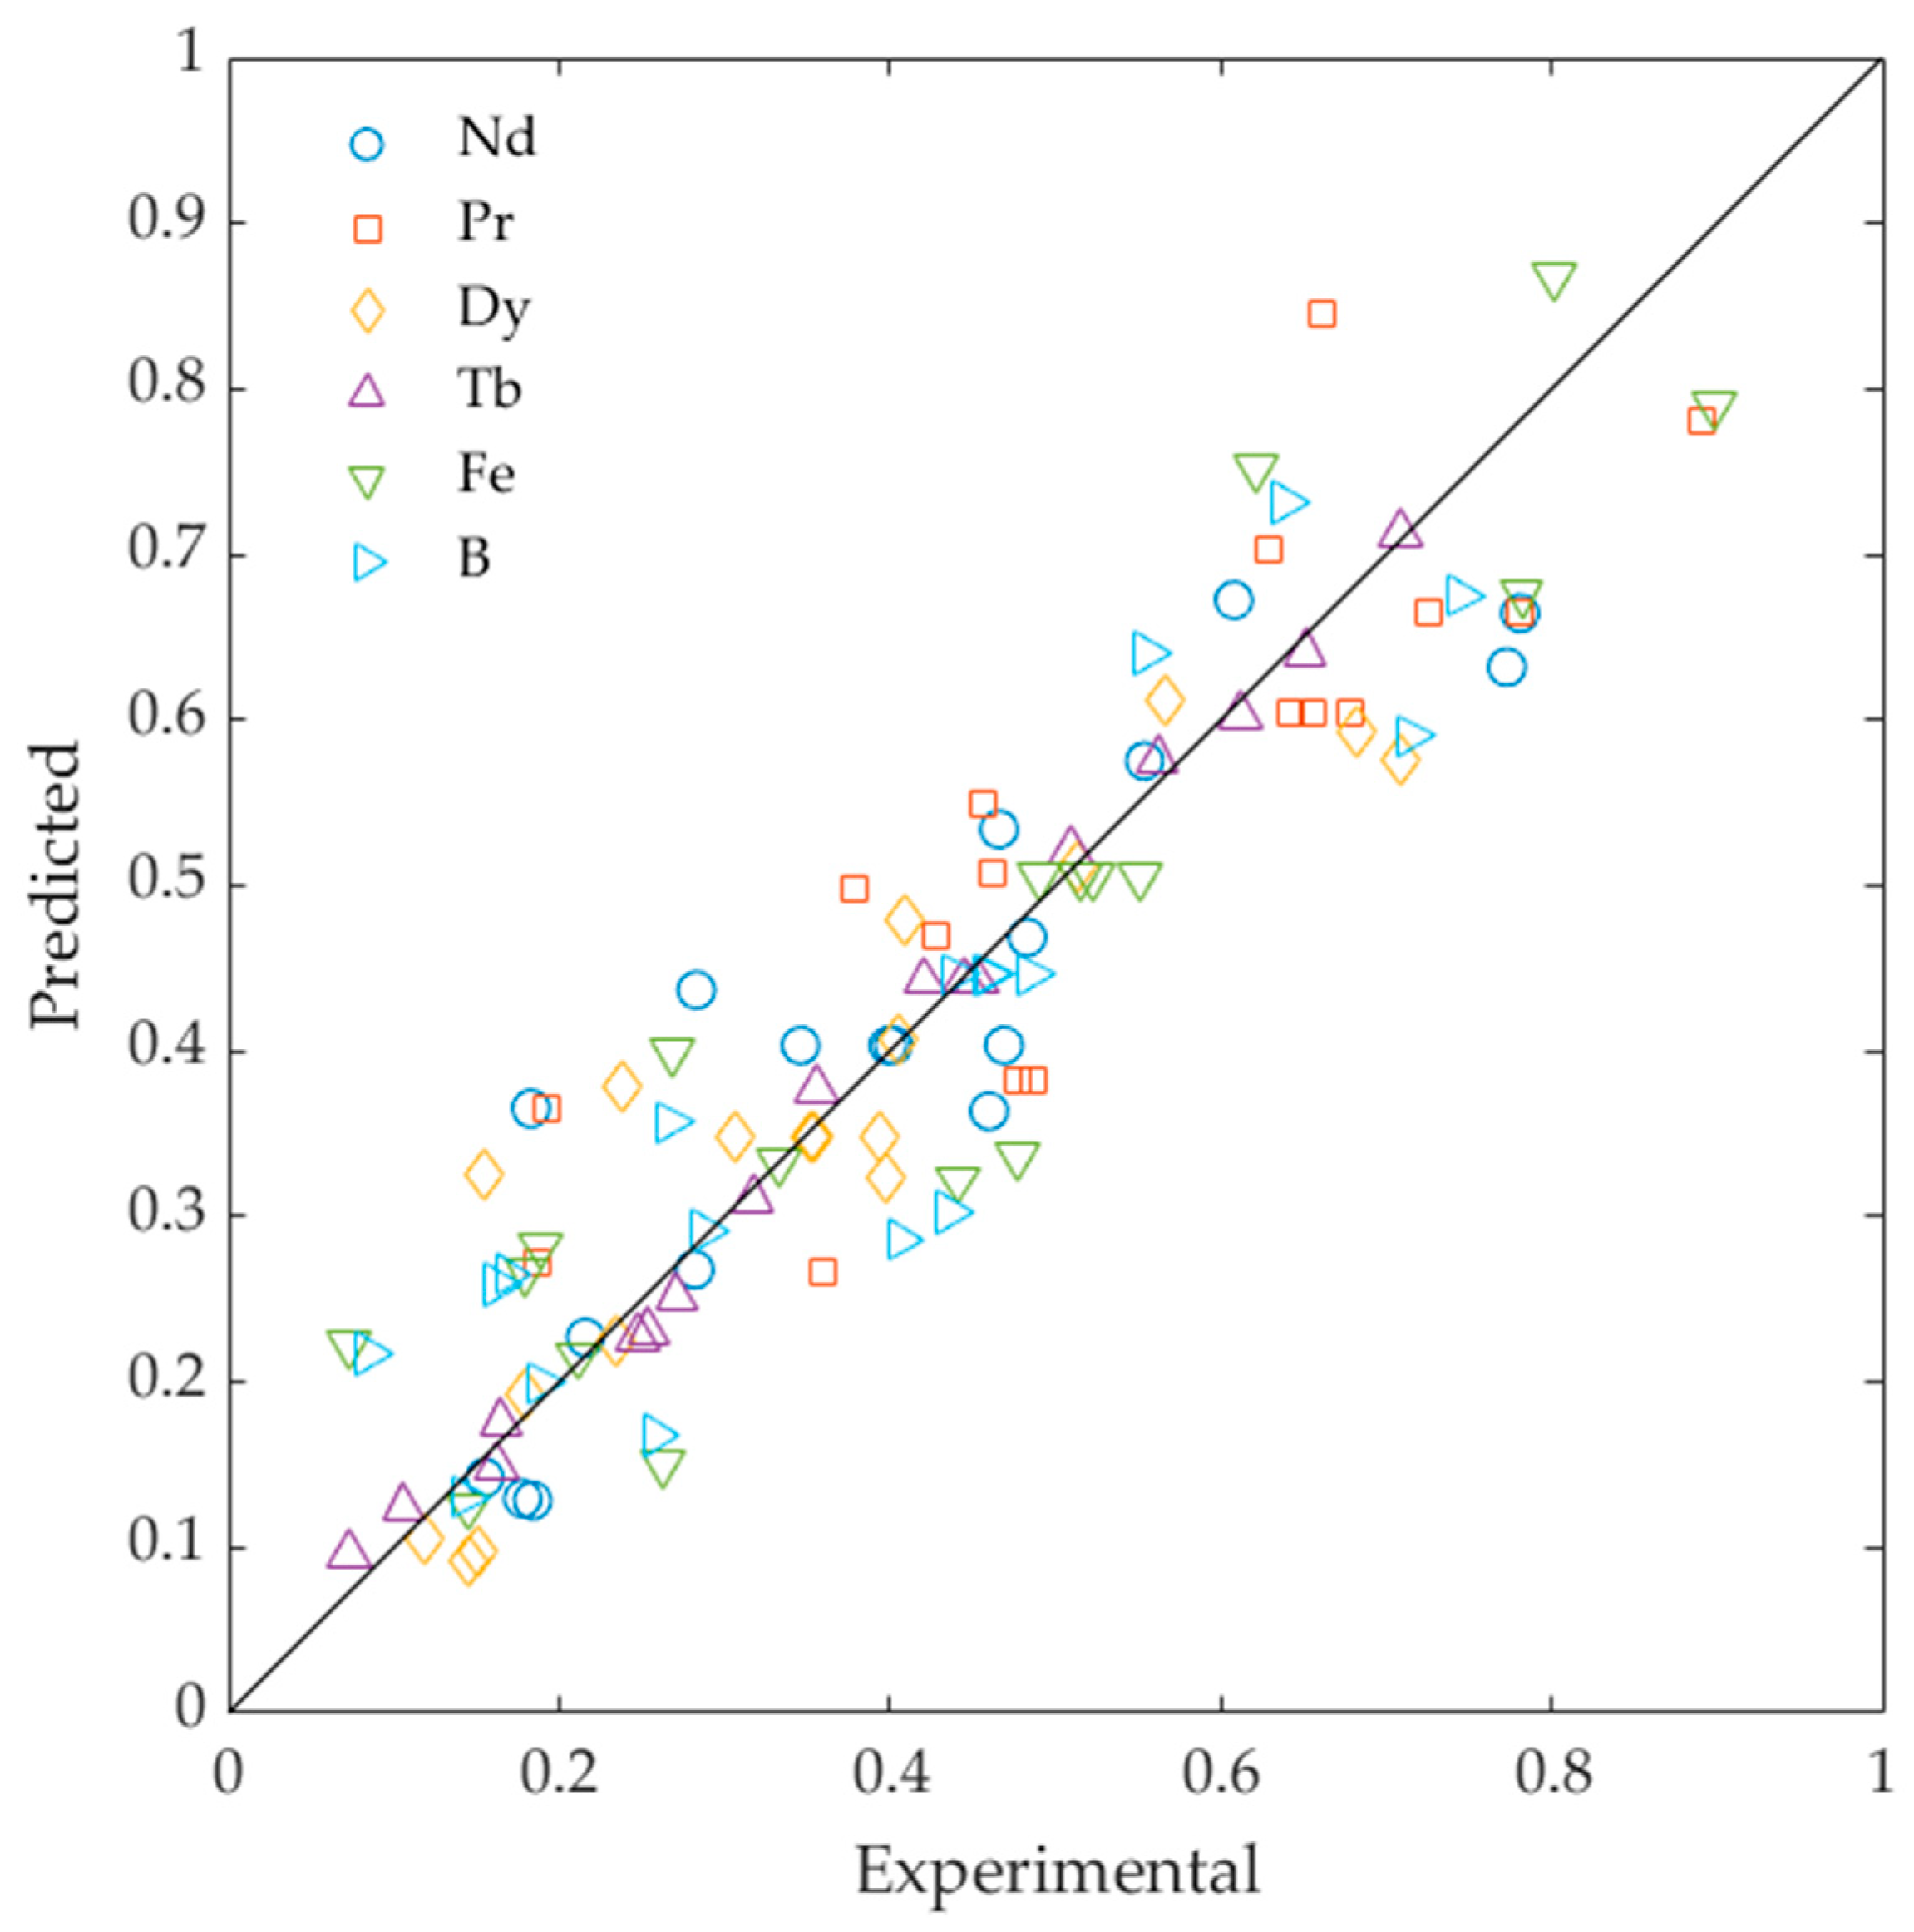
Figure 12 shows the scatter plot for all analyzed response surfaces. This plot allows for the comparison of the experimental and predicted values for all analyzed elements. The results show that the identified surfaces can successfully predict the experimental values. However, the data show a slight dispersion around the ideal line (diagonal), indicating that the predicted values do not always perfectly match the experimental values. This dispersion seems more pronounced for values lower than 0.4, with a more significant variability in the expected values. For higher values of 0.4, there is a greater tendency for the points to concentrate near the ideal line.
The predictive models used exhibit a certain degree of accuracy but with significant variations for some elements and ranges of values (variations already anticipated indirectly in the form of the R2 of the surfaces). This result suggests the need to improve the models by considering additional factors to increase the accuracy of the predictions.
Based on this consideration, it was decided to use an ANN. This method could allow for greater accuracy in the predictions, as it attempts to establish a link between input and output, without the rigidity of a classical regression.

3.3. Artificial Neural Networks

Different ANN architectures were analyzed using MATLAB R2023b to identify a structure suitable for describing the previously reported experimental data. The first study used the Kolmogorov mapping neural network existence theorem [28]. For a system with n inputs and m outputs, this theorem suggests using a three-layer neural network with a single hidden layer of 2n + 1 neurons.
In this sense, a 3-7-7 ANN was trained, with three neurons in the input layer, seven in the single hidden layer, and seven in the output layer. The data were divided, considering 70% of the data for training, 15% for validation, and 15% for testing. The Levenberg–Marquardt backpropagation algorithm, which updates the values of weights according to the Levenberg–Marquardt optimization, was used to train a feed-forward ANN. With this algorithm, the training continues until convergence or a maximum number of iterations is reached [38]. With these conditions and with an activation function of the purelin type, a total correlation coefficient of 0.797 was obtained. The number of epochs was initially set to 300; however, the training process was ended after only five iterations, as the combination of weights that resulted in the lowest mean square error was found. The correlation coefficient R was 0.814 for training, 0.758 for validation, and 0.679for testing.
A study was conducted to optimize the ANN architecture by increasing the number of hidden layers and the number of neurons, starting from the results obtained. It was noted that with an architecture of the 3-26-12-7 type, an extremely satisfactory model was obtained. The activation functions are purelin for the output layer and logsig for the hidden layers. Using different activation functions in a neural network allowed us to better describe the various types of nonlinear relationships in the data.
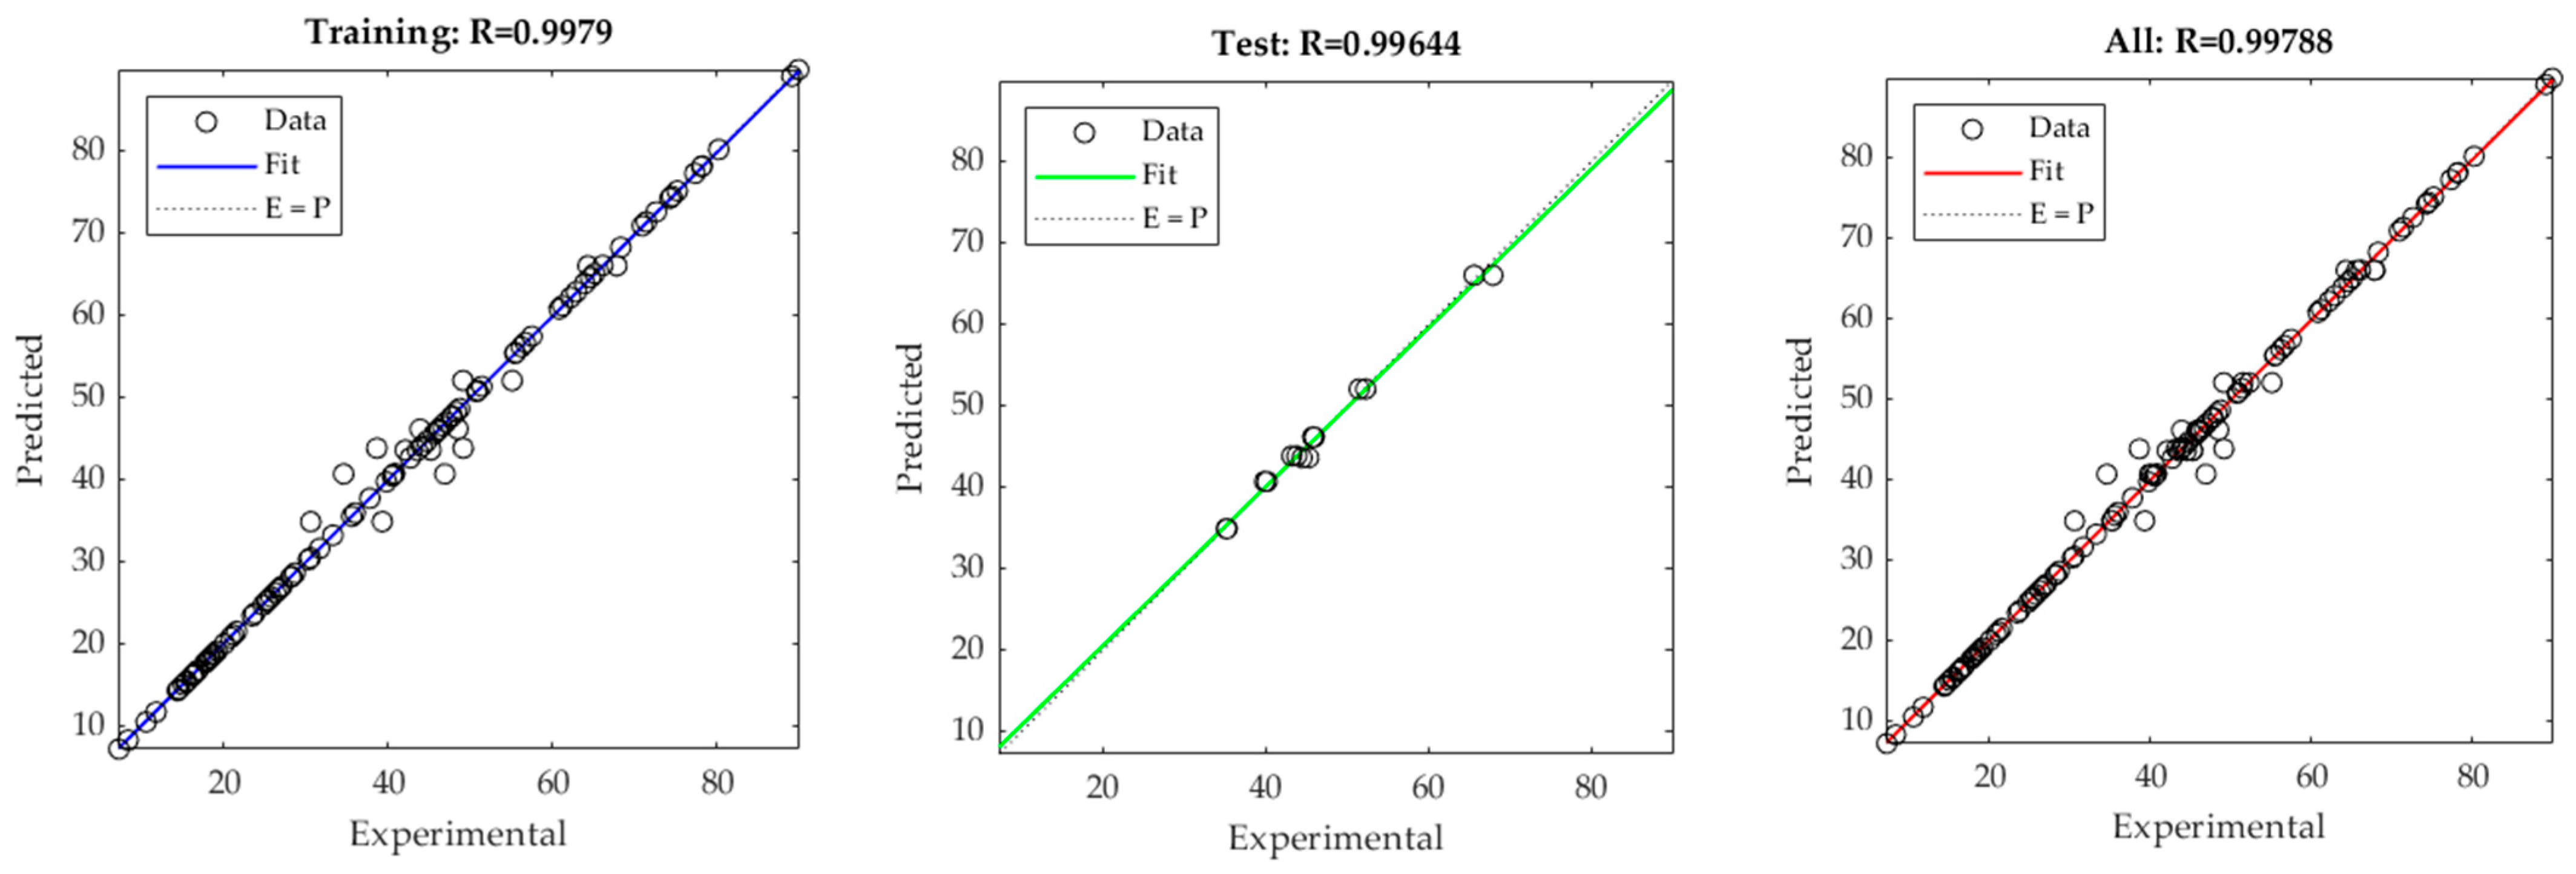
The results are reported in Figure 13. With this new configuration, the correlation coefficient R for the training was 0.998. The R values for the testing and the overall model were 0.996 and 0.998, respectively. The training process was ended for this ANN after 11 iterations of the 300-target value.
Using the optimized ANN, the investigated experimental space was studied to determine the optimal combination of parameters that maximize the TREE (%) output. This maximization allowed us to identify a maximum yield of about 86.1%. This value corresponds to a citric acid concentration of about 2.38 mol/L, a time of about 3.7 h, and a solid–liquid ratio of 8.8%wt./vol.
Comparing these results with those obtained using the RSM, it can be observed that both methods predict very similar results. A percentage difference between the RSM and ANN values of only 3.5% is observed. Also, for the independent variables estimated for the optimal working point, minimal percentage differences are recorded between the two methods: 4.8% and 0% for the citric acid concentration and time, respectively. The only significant difference between the two methods concerns estimating the solid–liquid ratio for the optimal point. For this parameter, the ANN was able to identify the hidden correlations between input and output that the RSM was not able to discover. Table 5 summarizes the pros and cons of the two methods used.

4. Conclusions

This work investigated the effect of different important parameters on the recovery yields of REEs, Fe, and B from NdFeB magnets in the citric acid leaching process at room temperature. In particular, the effects of acid concentration, reaction time, and solid–liquid ratio were analyzed.
The ANOVA results showed that the effect of citric acid concentration is significant regarding the yield of Nd and Dy only. Considering the other factors, time is the most important component, followed by the solid–liquid ratio. The only significant interaction is that of time with the solid–liquid ratio.
Based on the experimental results obtained at the laboratory scale, the second-order polynomial response surfaces were calculated, which allowed for the estimation of the extraction yields for each element considered and the calculation of the TREE yield. The latter was maximized to determine the optimal working point regarding the overall recovery of rare earths. The determined optimal point corresponds to a recovery yield of about 89% (citric acid concentration of 2.5 mol/L, time of 3.7 h, and a solid–liquid ratio of 3.3%wt./vol.) at room temperature.
Using ANN, an attempt was made to increase the accuracy of the predictions. The optimized architecture was of the 3-26-12-7 type. With this new approach, an optimal TREE recovery yield of about 86% was determined at a point very close to that found using the RSM. The accuracy of the ANN is much higher than that of the RSM, with correlation coefficients >0.99.
These models, determined starting from experimental tests at a laboratory scale, will be compared with those obtained at a pilot scale (NEW-RE project) and at an industrial scale (INSPIREE project) to better optimize the scale-up of this phase of the process and to allow for the full-scale efficient recovery of REEs from NdFeB.

Author Contributions

Conceptualization, F.V.; methodology, P.R., A.Z., S.R. and R.A.; validation, F.F. and F.V.; formal analysis, P.R., A.Z. and R.A.; investigation, P.R., A.Z. and S.R.; data curation, P.R., F.F. and F.V.; writing—original draft preparation, P.R., A.Z., S.R. and R.A.; writing—review and editing, F.F. and F.V.; visualization, S.R., R.A. and F.F.; supervision F.V. All authors have read and agreed to the published version of the manuscript.

Funding

This study was financially supported by the LIFE22-ENV-IT-INSPIREE project (number 101113882).

Data Availability Statement

The original contributions presented in the study are included in the article/supplementary material, further inquiries can be directed to the corresponding author/s.

Acknowledgments

The authors thank all the INSPIREE Consortium partners for collaborating in this research activity. The authors would like to thank the University of L’Aquila for their precious support.

Conflicts of Interest

The authors declare no conflicts of interest.

References

  1. Gorzin, H.; Ghaemi, A.; Hemmati, A.; Maleki, A. Equilibrium and kinetics of praseodymium and neodymium extraction from NdFeB magnet-leaching solutions with [R4N+][NO3−] using single drop column. J. Mol. Liq. 2020, 318, 114376. [Google Scholar] [CrossRef]
  2. Ni, A.C.; Wang, Y.-F.; Chen, S.-W.; You, S.-J. Recovery of rare earth elements from waste permanent magnet (WPMs) via selective leaching using the Taguchi method. J. Taiwan Inst. Chem. Eng. 2019, 97, 137–145. [Google Scholar]
  3. Gergoric, M.; Ekberg, C.; Foreman, M.R.S.J.; Steenari, B.-M.; Retegan, T. Characterization and leaching of neodymium magnet waste and solvent extraction of the rare-earth elements using TODGA. J. Sustain. Metall. 2017, 3, 638–645. [Google Scholar] [CrossRef]
  4. Papagianni, S.; Moschovi, A.M.; Sakkas, K.M.; Chalaris, M.; Yakoumis, I. Preprocessing and Leaching Methods for Extraction of REE from Permanent Magnets: A Scoping Review. AppliedChem 2022, 2, 14. [Google Scholar] [CrossRef]
  5. Belfqueh, S.; Seron, A.; Chapron, S.; Arrachart, G.; Menad, N. Evaluating organic acids as alternative leaching reagents for rare earth elements recovery from NdFeB magnets. J. Rare Earths 2023, 41, 621–631. [Google Scholar] [CrossRef]
  6. Jha, M.K.; Kumari, A.; Panda, R.; Kumar, J.R.; Yoo, K.; Lee, J.Y. Review on hydrometallurgical recovery of rare earth metals. Hydrometallurgy 2016, 165, 2–26. [Google Scholar] [CrossRef]
  7. Reisdörfer, G.; Bertuol, D.; Tanabe, E.H. Recovery of neodymium from the magnets of hard disk drives using organic acids. Miner. Eng. 2019, 143, 105938. [Google Scholar] [CrossRef]
  8. Liu, F.; Porvali, A.; Halli, P.; Wilson, B.P.; Lundström, M. Comparison of different leaching media and their effect on REEs recovery from spent Nd-Fe-B magnets. JOM 2020, 72, 806–815. [Google Scholar] [CrossRef]
  9. Xiao, F.; Hu, W.; Zhao, J.; Zhu, H. Technologies of Recycling REEs and Iron from NdFeB Scrap. Metals 2023, 13, 779. [Google Scholar] [CrossRef]
  10. Kumari, A.; Sinha, M.K.; Pramanik, S.; Sahu, S.K. Recovery of rare earths from spent NdFeB magnets of wind turbine: Leaching and kinetic aspects. Waste Manag. 2018, 75, 486–498. [Google Scholar] [CrossRef]
  11. Parhi, P.K.; Misra, P.K.; Jyothi, R.K. Integrated hydrometallurgical investigation for extraction and recovery of neodymium (Nd) from waste permanent Nd-Fe-B magnet. Inorg. Chem. Commun. 2023, 148, 110251. [Google Scholar] [CrossRef]
  12. Klemettinen, A.; Adamski, Z.; Chojnacka, I.; Leśniewicz, A.; Rycerz, L. Recovery of Rare Earth Elements from the Leaching Solutions of Spent NdFeB Permanent Magnets by Selective Precipitation of Rare Earth Oxalates. Minerals 2023, 13, 846. [Google Scholar] [CrossRef]
  13. Wu, R.; Liu, R.; Liu, X.; Zhang, J.; Xue, W.; Yang, Y. P350-N235 synergistic extraction system used for the recovery of Nd (III) from waste NdFeB magnets. Sep. Purif. Technol. 2023, 319, 124042. [Google Scholar] [CrossRef]
  14. Chung, H.; Prasakti, L.; Stopic, S.R.; Feldhaus, D.; Cvetković, V.S.; Friedrich, B. Recovery of Rare Earth Elements from Spent NdFeB Magnets: Metal Extraction by Molten Salt Electrolysis (Third Part). Metals 2023, 13, 559. [Google Scholar] [CrossRef]
  15. Wu, J.; Wang, D.; Ye, C.; Wang, Z.; Hu, X. Selective extraction and separation of REEs from NdFeB magnets scrap using co-chlorination and water leaching. Sep. Purif. Technol. 2023, 306, 122452. [Google Scholar] [CrossRef]
  16. Rahmati, S.; Adavodi, R.; Hosseini, M.R.; Veglio’, F. Efficient Metal Extraction from Dilute Solutions: A Review of Novel Selective Separation Methods and Their Applications. Metals 2024, 14, 605. [Google Scholar] [CrossRef]
  17. Emil-Kaya, E.; Polat, B.; Stopic, S.; Gürmen, S.; Friedrich, B. Recycling of NdFeB magnets employing oxidation, selective leaching, and iron precipitation in an autoclave. RSC Adv. 2023, 13, 1320–1332. [Google Scholar] [CrossRef] [PubMed]
  18. Gergoric, M.; Ravaux, C.; Steenari, B.-M.; Espegren, F.; Retegan, T. Leaching and recovery of rare-earth elements from neodymium magnet waste using organic acids. Metals 2018, 8, 721. [Google Scholar] [CrossRef]
  19. Rücker, C.; Mahmoud, W.M.; Schwartz, D.; Kümmerer, K. Biodegradation tests of mercaptocarboxylic acids, their esters, related divalent sulfur compounds and mercaptans. Environ. Sci. Pollut. Res. 2018, 25, 18393–18411. [Google Scholar] [CrossRef]
  20. Erust, C.; Akcil, A.; Tuncuk, A.; Deveci, H.; Yazici, E. A multi-stage process for recovery of neodymium (Nd) and dysprosium (Dy) from spent hard disc drives (HDDs). Miner. Process. Extr. Metall. Rev. 2021, 42, 90–101. [Google Scholar] [CrossRef]
  21. del Mundo Dacera, D.; Babel, S. Use of citric acid for heavy metals extraction from contaminated sewage sludge for land application. Water Sci. Technol. 2006, 54, 129–135. [Google Scholar] [CrossRef]
  22. Mohanty, C.; Behera, S.; Marandi, B.; Tripathy, S.; Parhi, P.; Sanjay, K. Citric acid mediated leaching kinetics study and comprehensive investigation on extraction of vanadium (V) from the spent catalyst. Sep. Purif. Technol. 2021, 276, 119377. [Google Scholar] [CrossRef]
  23. Punt, T.; Akdogan, G.; Bradshaw, S.; van Wyk, P. Development of a novel solvent extraction process using citric acid for lithium-ion battery recycling. Miner. Eng. 2021, 173, 107204. [Google Scholar] [CrossRef]
  24. Behera, S.; Parhi, P. Leaching kinetics study of neodymium from the scrap magnet using acetic acid. Sep. Purif. Technol. 2016, 160, 59–66. [Google Scholar] [CrossRef]
  25. Birloaga, I.; Vegliò, F. Hydrometallurgical method for the treatment of permanent magnets. IT102018 2018:000005178. WO2019215583A1, 2019. [Google Scholar]
  26. Romano, P.; Rahmati, S.; Adavodi, R.; Birloaga, I.; Vegliò, F. Leaching of rare earth elements from permanent magnet swarf in citric acid: Effects of acid concentration on extraction kinetics. Metals 2023, 13, 1801. [Google Scholar] [CrossRef]
  27. Montgomery, D.C. Design and Analysis of Experiments; John Wiley & Sons: Hoboken, NJ, USA, 2017. [Google Scholar]
  28. Diwa, R.R.; Tabora, E.U.; Haneklaus, N.H.; Ramirez, J.D. Rare earths leaching from Philippine phosphogypsum using Taguchi method, regression, and artificial neural network analysis. J. Mater. Cycles Waste Manag. 2023, 25, 3316–3330. [Google Scholar] [CrossRef]
  29. Hoseinian, F.S.; Abdollahzade, A.; Mohamadi, S.S.; Hashemzadeh, M. Recovery prediction of copper oxide ore column leaching by hybrid neural genetic algorithm. Trans. Nonferrous Met. Soc. China 2017, 27, 686–693. [Google Scholar] [CrossRef]
  30. Kasongo, K.B.; Mwanat, H.-M. Application of Taguchi method and artificial neural network model for the prediction of reductive leaching of cobalt (III) from oxidised low-grade ores. S. Afr. J. Sci. 2021, 117, 1–8. [Google Scholar] [CrossRef] [PubMed]
  31. Al-Thyabat, S. On the optimization of froth flotation by the use of an artificial neural network. J. China Univ. Min. Technol. 2008, 18, 418–426. [Google Scholar] [CrossRef]
  32. Zhang, W. Evaluation of susceptibility to hydrogen embrittlement—A rising step load testing method. Mater. Sci. Appl. 2016, 7, 389. [Google Scholar] [CrossRef]
  33. Habibzadeh, A.; Kucuker, M.A.; Go, M. Review on the parameters of recycling NdFeB magnets via a hydrogenation process. ACS Omega 2023, 8, 17431–17445. [Google Scholar] [CrossRef] [PubMed]
  34. Zhang, K.; Yue, Z.; Ma, Y.; He, J.; Li, X.; Gong, W.; Huang, Y. Effect of Nb on microstructure and magnetic decay of sintered NdFeB magnets in NaCl solution. J. Alloys Compd. 2023, 969, 172391. [Google Scholar] [CrossRef]
  35. Romano, P.; Birloaga, I.; Vegliò, F. Recovery of Platinum and Palladium from Spent Automotive Catalysts: Study of a New Leaching System Using a Complete Factorial Design. Minerals 2023, 13, 479. [Google Scholar] [CrossRef]
  36. Adavodi, R.; Dini, G. Benzotriazoium Bis (2-Ethylhexyl) Phosphate Ionic Liquid as a Catalyst and Multifunctional Lubricant Additive: Synthesis, Optimization, Characterization, and Tribological Evaluation. Arab. J. Sci. Eng. 2024, 49, 7995–8010. [Google Scholar] [CrossRef]
  37. Rahmati, S.; Birloaga, I.; Romano, P.; Vegliò, F. Optimization of Rare Earth Magnet Recovery Processes Using Oxalic Acid in Precipitation Stripping: Insights from Experimental Investigation and Statistical Analysis. Heliyon 2024, 10, E34811. [Google Scholar] [CrossRef]
  38. Majdi, A.; Beiki, M. Evolving neural network using a genetic algorithm for predicting the deformation modulus of rock masses. Int. J. Rock Mech. Min. Sci. 2010, 47, 246–253. [Google Scholar] [CrossRef]
Figure 1. Photographic image (a) and particle size distribution (b) of the sample.
Metals 14 00932 g001
Figure 2. XRD pattern of end-of-life NdFeB sample.
Metals 14 00932 g002
Figure 3. Design of experiments using 23, with CCD factorial plan and six-star points (S1, S2, S3, S4, S5, and S6). A is citric acid concentration, B is the reaction time, and C is the S/L ratio.
Metals 14 00932 g003
Figure 4. ANN structure for the optimization of the leaching efficiencies REEs in the 3-26-12-7 format.
Metals 14 00932 g004
Figure 5. SEM before (a) and after (b) leaching; XRD of leaching residue (c).
Metals 14 00932 g005
Figure 6. SEM–EDS before leaching (a) and after leaching (b).
Metals 14 00932 g006
Figure 7. Main factors and their interaction effects on recovery yields.
Metals 14 00932 g007
Figure 8. Effects of second-order interaction on the recovery yields.
Metals 14 00932 g008
Figure 9. Contour plot for the responses of all elements, with solid–liquid ratio equal to 5%wt./vol.
Metals 14 00932 g009
Figure 10. Contour plot for the responses of all elements, with solid–liquid ratio equal to 10%wt./vol.
Metals 14 00932 g010
Figure 11. Response surface for TREE recovery yield, with 3.3%wt./vol. (solid–liquid ratio).
Metals 14 00932 g011
Figure 12. Scatter diagram for RSM.
Metals 14 00932 g012
Figure 13. Recovery yields predicted by the 3-26-12-7 ANN in the training, testing, and overall model versus the experimental leaching efficiency results.
Metals 14 00932 g013
Table 1. Chemical composition of permanent magnet powder obtained via ICP-OES.
ElementFePrTbDyNdBOther *
Composition (%wt.)56.80 ± 1.284.21 ± 0.140.33 ± 0.112.92 ± 0.1821.17 ± 1.360.91 ± 0.0113.66 ± 1.88
* Plastic and other elements (Ni, Al, Nb, Zr, etc.).
Table 2. Factorial plan factors and levels.
LevelFactors
A—Citric Acid ConcentrationB—Reaction TimeC—S/L Ratio
Low (−1)1 M1 h5.0%
Medium (0)2 M2 h7.5%
High (1)3 M3 h10.0%
Table 3. Results of the factorial plan (Temperature: 25 °C; stirring rate: 150 rpm).
RunA—Citric AcidB–TimeC—S/L RatioRecovery Yield (%)
(mol/L)(h)(%wt./vol.)NdPrDyTbFeBTREE
1115%21.6%48.7%17.9%24.8%26.3%25.8%25.3%
a315%18.3%37.8%15.4%16.5%18.0%16.3%20.9%
b135%46.6%78.1%40.8%56.2%62.2%55.5%50.8%
ab335%60.8%89.1%56.7%70.9%80.2%63.9%64.6%
c1110%17.8%36.0%14.6%16.2%21.2%18.9%20.1%
ac3110%28.2%47.8%23.5%25.4%33.3%28.7%30.6%
bc1310%28.3%45.6%23.8%27.1%18.9%16.9%30.3%
abc3310%55.4%72.6%51.4%50.9%26.8%26.7%57.5%
0227.5%40.2%67.9%35.3%45.3%51.5%45.8%43.9%
0227.5%39.9%65.6%35.2%44.5%52.3%46.0%43.2%
0227.5%34.6%64.3%30.6%42.1%49.1%43.9%38.6%
0227.5%46.9%67.8%39.3%45.2%55.1%48.5%49.1%
S12211.7%48.3%46.2%40.5%35.6%47.7%43.6%47.0%
S2223.3%77.3%62.9%70.9%61.2%78.2%71.4%74.3%
S33.727.5%46.0%42.7%39.8%31.7%44.1%40.6%44.7%
S40.327.5%18.4%18.7%15.1%10.6%14.5%14.4%18.1%
S523.77.5%78.1%66.1%68.3%65.1%89.9%74.5%75.2%
S620.37.5%15.5%19.2%11.8%7.3%7.3%8.4%15.6%
Table 4. Summary of the regression statistic results for all elements.
SourceSSdfMSF-Valuep-ValueR2Adj. R2
NdModel4480.3231493.4410.990.00060.7020.638
A—Citric Acid658.31658.34.840.045
B—Time3243.9313243.9323.870.0002
A2578.091578.094.250.0582
PrModel4134.5231378.178.610.00170.6480.573
A—Citric Acid460.031460.032.870.1122
B—Time2755.1512755.1517.20.001
A2919.331919.335.740.0311
DyModel4577.45915.4811.330.00030.8250.752
A—Citric Acid612.241612.247.580.0175
B—Time2822.1812822.1834.92<0.0001
C—S/L ratio344.851344.854.270.0611
A2322.811322.813.990.0688
C2337.131337.134.170.0637
TbModel6095.329677.26116.41<0.00010.9920.984
A—Citric Acid410.631410.6370.58<0.0001
B—Time3524.9513524.95605.9<0.0001
C—S/L ratio617.81617.8106.19<0.0001
AB176.721176.7230.380.0006
AC88.44188.4415.20.0046
BC305.051305.0552.43<0.0001
A2788.431788.43135.52<0.0001
B283.81183.8114.410.0053
C238.27138.276.580.0334
FeModel8462.651692.5213.570.00010.8500.787
A—Citric Acid462.571462.573.710.0782
B—Time3813.6613813.6630.570.0001
C—S/L ratio1390.3211390.3211.140.0059
BC1428.4511428.4511.450.0054
A21367.611367.610.960.0062
BModel5579.0651115.8110.890.00040.8200.744
A—Citric Acid286.611286.612.80.1202
B—Time2491.6312491.6324.330.0003
C—S/L ratio1003.2811003.289.80.0087
BC826.211826.218.070.0149
A2971.341971.349.480.0095
TREEModel4699.0641174.7717.750.00010.8090.750
A—Citric Acid617.551617.557.230.0186
B—Time3123.4613123.4636.55<0.0001
C—S/L ratio348.751348.754.080.0645
A2609.301609.307.130.0193
Table 5. Pros and cons of RSM and ANN.
ProsCons
Response Surface Methodology
  • It is easy to implement and interpret, especially for linear or quadratic models.
  • It requires a relatively small number of experiments compared to other methods.
  • It provides a good understanding of the relationships between the independent variables and the response.
  • It is not suitable for complex problems with complex nonlinear relationships between variables.
  • It often uses low-order polynomial models, which may not adequately represent complex behaviors.
  • It is necessary to have an initial understanding of the operating region to set the starting parameters.
Artificial Neural Network
  • It can model complex nonlinear relationships between variables.
  • It works well with large amounts of data and can handle many variables.
  • It can improve its performance with continuous training.
  • It requires high computational resources, especially for deep neural networks.
  • It is often considered a “black box” and is challenging to interpret.
  • Without proper network management and regularization, there is a high risk of overfitting the training data.
Disclaimer/Publisher’s Note: The statements, opinions and data contained in all publications are solely those of the individual author(s) and contributor(s) and not of MDPI and/or the editor(s). MDPI and/or the editor(s) disclaim responsibility for any injury to people or property resulting from any ideas, methods, instructions or products referred to in the content.