Article

Mechanical and Corrosion Properties of AA2024 Aluminum Alloy with Multimodal Gradient Structures

by
Zhenwei Xie
1,2,
Liexing Zhou
1,3,*,
Jun Li
1,2,*,
Yonghua Duan
1,2,*,
Mingjun Peng
1,2,
Hongbo Xiao
1,2,
Xiong Du
1,2,
Yuanjie Zhao
1,2 and
Mengnie Li
1,2
1
Faculty of Materials Science and Engineering, Kunming University of Science and Technology, Kunming 650093, China
2
Yunnan Key Laboratory of Integrated Computational Materials Engineering for Advanced Light Metals, Kunming University of Science and Technology, Kunming 650093, China
3
Analytic & Testing Research Center, Kunming University of Science and Technology, Kunming 650093, China
*
Authors to whom correspondence should be addressed.
Metals 2025, 15(2), 177; https://doi.org/10.3390/met15020177
Submission received: 13 January 2025 / Revised: 31 January 2025 / Accepted: 6 February 2025 / Published: 10 February 2025
(This article belongs to the Special Issue Light Alloy and Its Application (2nd Edition))

Abstract

:
Enhancing the strength and toughness of aluminum alloys using microstructure optimization remains a key challenge. In this study, an AA2024 aluminum alloy with a double-layer multi-gradient structure was fabricated using 50% constrained deformation and single-stage peak aging at 150 °C. Microstructural and compositional analysis was performed using SEM, XRD, and TEM to investigate grain structures, dislocation density, and the distribution of precipitated phases. The results revealed a heterogeneous microstructure with variations in grain size, dislocation gradient, and precipitation phases between the constrained and deformation layers. Mechanical testing demonstrated a 30.9% increase in yield strength, a 16.4% increase in tensile strength, and a 13.9% improvement in uniform elongation compared to the T6 temper. Corrosion tests showed enhanced resistance, with a shallower intergranular corrosion depth and higher self-corrosion potential. The improved mechanical properties were attributed to the dislocation gradient and heterogeneous precipitation phases, while the enhanced corrosion resistance resulted from the transformation of the S phase from a continuous grain boundary distribution to a discontinuous distribution along dislocations. This study provides a novel approach for optimizing the mechanical and corrosion properties of AA2024 aluminum alloy using microstructure design and precise thermal–mechanical treatment.

1. Introduction

As a high-strength aluminum alloy with thermo-mechanical treatment, AA2024 aluminum alloy is widely used in aviation and automotive industries. Traditionally, T3 and T6 heat treatment processes are employed to achieve high strength [1,2,3]. In recent years, to further optimize the mechanical properties of AA2024 aluminum alloy, severe plastic deformation ([SPD], a method for creating gradient structures through surface mechanical processing) techniques [4,5] have been utilized to refine grains, producing microstructures with micron- and submicron-sized grains through the application of sufficiently high strains [6,7]. While this approach significantly enhances strength, it often compromises elongation. Cryogenic rolling, for example, involves rolling the sample in a liquid nitrogen environment to introduce high-density dislocations, which provide numerous heterogeneous nucleation sites. This process yields materials with both high strength and toughness [8]. The strategy of achieving high strength and toughness through the construction of heterostructures has been successfully implemented in various material systems, offering new approaches for developing high-performance aluminum alloys. However, as the demand for lightweight and high-performance materials increases, optimizing the balance among the strength, ductility, and corrosion resistance of AA2024 aluminum alloy remains a significant challenge in materials research.
In recent years, the incorporation of gradient structures using SPD technology has emerged as an effective approach to enhancing the overall performance of materials. Gradient structures generally refer to the gradual variation in defect density across a material. Most reported gradient structure materials are characterized by a grain size gradient [9], often produced using surface mechanical grinding treatment ([SMGT], a method for creating gradient structures through surface mechanical processing) [10]. Recent studies have demonstrated the effectiveness of heterostructures in coordinating the strength and toughness in both steel and aluminum alloys. For instance, Wu et al. [11] studied the effect of gradient layer ratios on ultra-low-carbon steel and observed that a volume ratio of 0.48 for the gradient layer maximized heterogeneous deformation-induced (HDI) strengthening. This strengthening effect arises from the mechanical incompatibility between the elastic deformation layer and the plastic deformation layer, which generates a two-dimensional stress state and a transverse strain gradient near the elastic–plastic interface. These effects promote dislocation interactions and accumulation, resulting in rapid strengthening of the plastic deformation layer, particularly near the interface. Irmer et al. [12] utilized transmission electron microscopy (TEM) to analyze the shear and non-shear precipitates in the alloy in detail. The results indicate that shear precipitates promote a more uniform dislocation distribution under SPD conditions, thereby contributing to the formation of a refined sub-grain structure. Furthermore, the study reveals that the morphology and distribution of precipitates directly influence the plasticity and strength properties of the material under various heat treatment conditions. These findings offer a novel perspective on the role of precipitates in microstructure evolution.
Xu et al. [13] fabricated a nano-gradient microstructure from the surface to the coarse-grained matrix using SMGT. This gradient structure, formed by strain and strain rate gradients at varying depths, facilitates the formation and stabilization of high-density dislocations, resulting in a surface nano-microhardness of up to 1 GPa. Similarly, Wu et al. [14] characterized the gradient microstructure of 7075 aluminum alloy produced using ultrasonic shot peening. They found that the microstructural evolution in the deformation layer—from dislocation cells to equiaxed submicron and nano-grains—occurs with increasing strain. To accommodate further plastic deformation, coarse grains in the gradient structure subdivide into sub-grains, which rotate to form high-angle grain boundaries, thereby enabling further deformation.
Thermo-mechanically treated high-strength aluminum alloys, such as 2XXX and 7XXX series alloys, have become the preferred choice for constructing heterogeneous materials. However, research on the corrosion resistance of nano-layered surface structures in aluminum alloys remains in its early stages. Akiyama et al. [15] treated Al-Cu, Al-Ni, and pure aluminum using equal channel angular extrusion and found that Al-Ni and Al-Cu alloys demonstrated improved corrosion resistance compared to pure aluminum. This improvement is attributed to the fine grains of α-Al, which reduce the tendency for pitting corrosion, and to the significant plastic deformation, which reduces copper-depleted zones near the θ-phase precipitates in Al-Cu alloys, thereby enhancing corrosion resistance.
Sun et al. [16] systematically studied the effect of impact energy on the localized corrosion behavior of AA 7150 after ultrasonic shot peening. By adjusting shot peening parameters, such as duration, amplitude, distance, and medium size, they eliminated localized corrosion in high-energy shot-peened alloys, thereby improving the corrosion resistance of gradient surface layers. Wen et al. [17] used shot peening to construct a gradient layer on AA2024 aluminum alloy. While the iron-rich layer introduced by shot peening reduced corrosion resistance due to external Fe ion infiltration, it improved wear resistance through increased grain refinement and lubrication by the iron-rich layer.
In studies of intergranular corrosion in AA2024-T3, Liu et al. [18] demonstrated that applying appropriate compressive stress significantly reduced the driving force for vertical intergranular corrosion growth. Residual compressive stress increased the breakdown potential in affected regions, resulting in enhanced corrosion resistance in AA2024 aluminum alloy. Chumaevskii et al. [19] conducted SPD experiments on AA2024 aluminum alloy, focusing on the evolution of the microstructure following processing. Their findings revealed that the surface gradient structure significantly enhanced corrosion resistance, particularly in the surface region. The enhancement in corrosion resistance is attributed to the high density of dislocations and the redistribution of grain boundaries.
In the field of 2XXX high-strength corrosion-resistant aluminum alloys, pitting corrosion and intergranular corrosion are more prevalent and detrimental than uniform corrosion [20]. In the gradient layers produced by severe plastic deformation (SPD), changes in the behavior of precipitate phases are closely related to the mechanical properties and corrosion performance of the material. While many researchers have studied the corrosion resistance mechanisms of high-strength aluminum alloys processed using SPD methods, few investigations have focused on the effect of precipitate behavior on the corrosion performance within the gradient layer of high-strength AA2024 aluminum alloy. Furthermore, the underlying mechanisms remain unclear. The evolution mechanism of the precipitated phase within the gradient structure significantly impacts corrosion performance; however, there are limited studies addressing this aspect. Specifically, in AA2024 aluminum alloy, the behavior of the precipitated phase within the gradient layer has not been thoroughly explored.
In the systematic study of multi-performance optimization, there remains a lack of comprehensive analysis and validation regarding the coordination of strength, ductility, and corrosion performance in the integration of SPD technology and heat treatment.
To comprehensively evaluate the surface corrosion resistance of gradient structures in AA2024 aluminum alloy, it is important to not only rely on electrochemical methods commonly used to study corrosion rates [17,21,22,23] but also to consider intergranular corrosion depth measurements [18,24] that provide additional insights into corrosion behavior.
To develop lightweight alloys with exceptional overall properties, building on previous studies, the following strategies were proposed: large plastic deformation to enhance strength, the creation of a gradient structure to improve ductility, and the incorporation of an artificial aging process to enhance the surface corrosion resistance of the gradient samples. The mechanical properties and corrosion resistance were systematically investigated using various characterization techniques, and the relationship between microstructure evolution and properties under a multi-modal gradient structure was elucidated.
This study addresses this gap by innovatively combining the constrained deformation ([CD], a method for introducing gradient strains by constraining material deformation) process with the peak aging ([PA] an artificial aging process that optimizes the mechanical properties and precipitation behavior of materials) heat treatment system to construct a grain and dislocation gradient structure, as well as a heterogeneous precipitated phase structure, in AA2024 aluminum alloy. Fine microstructural features, including grains, precipitates, and dislocations, of the deformed layer (DL) and constraint layer (CL) were characterized using metallographic microscopy, scanning electron microscopy (SEM), X-ray powder diffraction (XRD), and TEM. The influence of the multi-gradient structure on the mechanical properties and corrosion resistance of AA2024 aluminum alloy was thoroughly investigated.

2. Materials and Methods

In this experiment, a commercial T4 state (T4 refers to solution heat treatment followed by natural aging) AA2024 aluminum alloy hot-rolled plate that had been exposed to the natural environment for 3 years was used. It had a thickness of 30 mm and was produced by ALG Aluminium, Inc. The alloy composition is presented in Table 1.

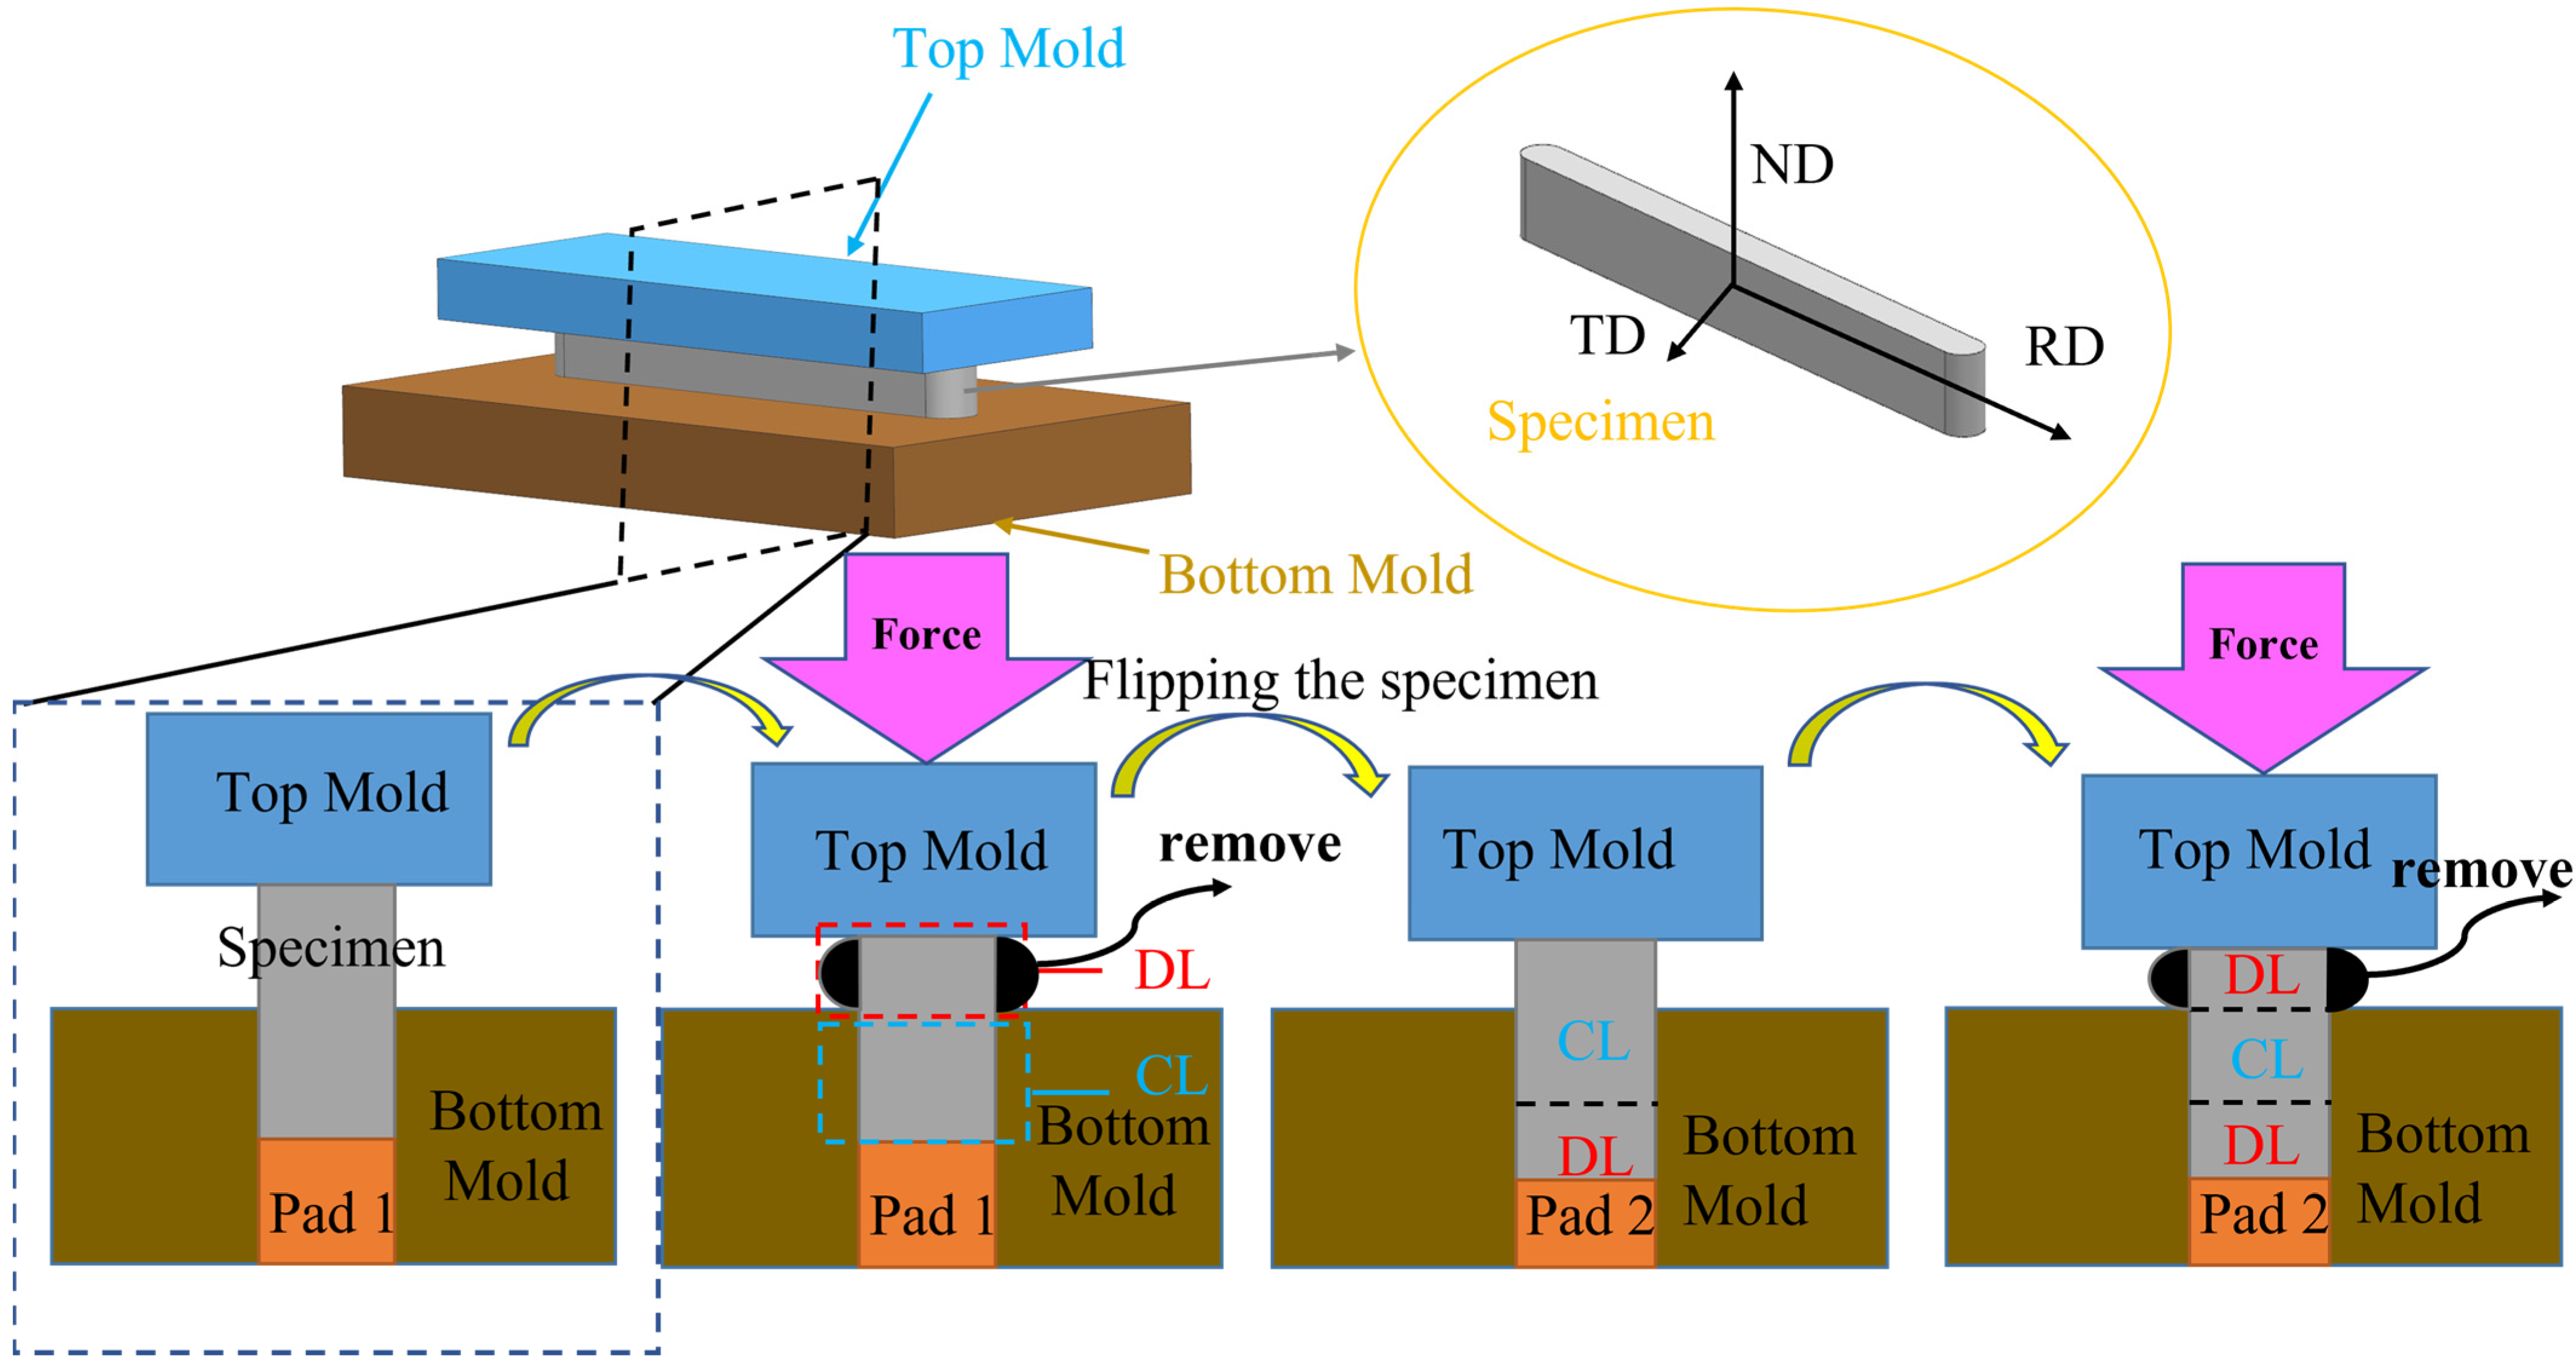
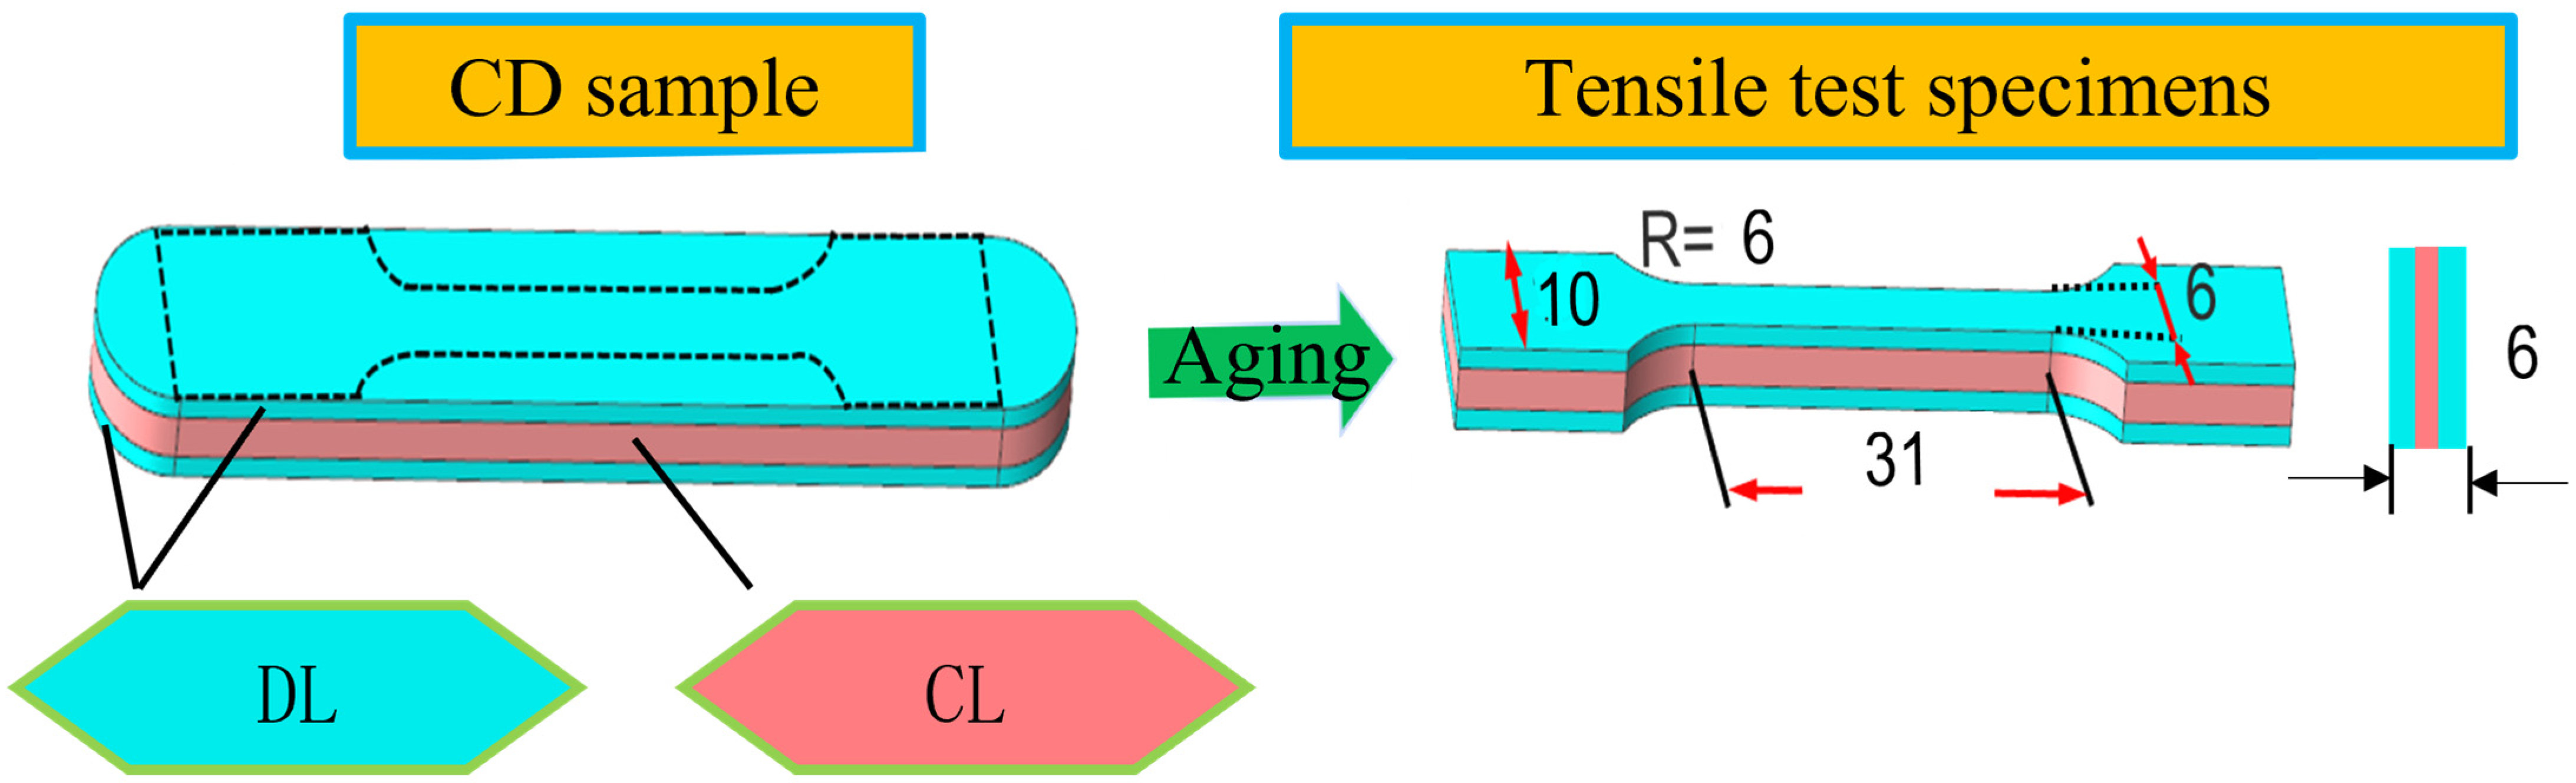
2.1. Constraint Deformation and Heat Treatment

Samples with dimensions of 91 × 11 × 9 mm were cut along the rolling direction for the experiments. The samples underwent a solid solution treatment (SST) in a resistance furnace (2025, Shanghai Jujing Precision Instrument Manufacturing Co., Ltd., Shanghai, China) at 495 °C for 1 h, followed by immediate water quenching with a transfer time of less than 2 s. To prevent the influence of natural aging during transportation after solution treatment, a retrogression heat treatment (RHT) was applied at 250 °C for 1 min prior to rolling.
Before the CD process, the samples were placed in a mold, and pads were adjusted so that the surface layer exposed to the mold was 3 mm thick. Multi-pass extrusion was conducted using a 300-ton hydraulic press (2020, Instron 5582, Instron Corporation, Norwood, MA, USA). A rectangular hard alloy, slightly larger than the sample but smaller than the mold, is used as the top mold. Before extrusion, the geometric center of the top mold is aligned with the top of the sample to ensure stability during the experiment, preventing uneven extrusion or slippage caused by an unstable center of gravity (Figure 1).
During the multi-pass extrusion of deformation layers, the mold containing the sample is rotated before each pass. In order to ensure that the amount of each pass of extrusion is always maintained at the originally designed 50% strain height, a hard plate with a thickness of 1.5 mm is placed in the narrow space between the die and the top mold. When the deformation reached 50%, the upper mold came into contact with the hard plate and stopped, preventing further pressing. The hard plate was securely fixed and could not be removed. After each pass, pressure is maintained for 30 s, resulting in two DLs with a uniform 50% strain.
After the extrusion deformation, an angle grinder is used to remove the excess material from the DL. The sample is then lightly polished in the ND before being flipped to perform the same extrusion process on the opposite side. This results in a sample containing deformation layers on both the top and bottom, resulting in the formation of two 1.5 mm thick DLs with 50% deformation and a 3 mm thick central CL with minimal deformation. The volume ratio of the DLs to CL was 1:1, as illustrated in the constrained deformation diagram (Figure 1).
After CD, the samples were uniformly stored in a natural environment (NA) for at least 1 week to allow stabilization. Subsequently, the samples underwent artificial aging at 150 °C for durations ranging from 0 to 30 h to determine the optimal peak aging time for the DL. For comparison, original state samples were solution treated at 495 °C for 1 h and artificially aged at 190 °C for 0 to 20 h to establish the T6 condition based on the microhardness peak.

2.2. Mechanical Property Testing

In the microhardness test using the 3S-1000QZD microhardness tester (2025, Suzhou Shouzhin Instrument Equipment Co., Ltd., Suzhou, China), indentations are made at different positions in the rolling direction (RD) × normal direction (ND) of the sample, with the punch direction aligned to the ND. The interval between test points is 0.4 mm, the applied load is 200 g, and the holding time is 10 s. No fewer than three test points are assessed at each position, and the results are averaged.
Tensile testing was conducted in accordance with the GB/T 16865-2013 standard [25], using standard rectangular tensile specimens. The dimensions of these specimens are provided in Figure 2. The tests were performed at room temperature using a double-column electronic universal testing machine (Instron 5582, 2020, Instron Corporation, Norwood, MA, USA) with a strain rate of 1 mm/min. Mechanical properties, including tensile strength, yield strength, and elongation, were derived from the test results. Three specimens were prepared in parallel for each condition to ensure the reliability of the test results.
After the constrained thermomechanical treatment (hereinafter referred to as CD + PA), the grain structure and microhardness of the DL and CL samples were evaluated following heat treatment.
The grain structure was observed using an Axioscope 5 Zeiss optical microscope (2020, Carl Zeiss AG, Oberkochen, Germany), and the bandwidth of the rolled structure was measured using Image-Pro software (2020, Media Cybernetics, Rockville, MD, USA) to quantify structural characteristics.
Metallographic examination was performed using an EM-30AX scanning electron microscope (2020, COXEM Co., Ltd., Daejeon, Republic of Korea), and the composition of the second-phase particles was analyzed using the EDS scanning mode on the SEM. Additionally, Image-Pro software was used to statistically analyze the density of coarse particles in the DL and CL structures within a selected range of 10–100 μm, with no fewer than 5 images analyzed for each sample, providing detailed insights into the material’s microstructural and compositional features.
Samples from the DL at the surface and the CL at the center were extracted in the TD × RD orientation for further analysis. The phase and crystalline structure were characterized using a D/MAX2500V X-ray diffractometer (2020, Rigaku Corporation, Tokyo, Japan).
The XRD test was conducted under the following conditions: a tube voltage of 40 kV, a tube current of 40 mA, a scanning range of 10–90°, and a step size of 0.02626°. The diffraction peaks obtained from the XRD test results were calculated according to the following Scherrer formula to determine the grain size (D) [26]:
D = k λ β cos θ
where θ is the diffraction angle corresponding to the diffraction peak, β is the corresponding full width at half maximum, the constant k value is 0.9, and λ is the X-ray wavelength 0.15406 nm. The corresponding dislocation density δ is calculated using the following formula [27]:
δ = 1 D 2
Samples from the DL and CL were extracted in the RD × TD plane and processed to a thickness of less than 100 μm. The samples were then subjected to electrolytic double-spray treatment to prepare them for transmission electron microscopy (TEM) analysis (2020, JEOL JEM-2100, JEOL Ltd., Tokyo, Japan). The microstructure of the DL and CL regions was characterized and thoroughly studied using TEM.
The density, diameter, and spacing of precipitated phases in the DL and CL regions were quantified using JMatPro software (Version 2020, Sente Software, Wokingham, UK). For these measurements, at least five bright field TEM images were selected from both the DL and CL regions, and the results were averaged to ensure statistical reliability.
High-resolution transmission electron microscopy (HRTEM) was used to further analyze the microstructure. Forward and inverse fast Fourier transforms (FFT) of high-resolution images were performed using GMS3 software (Version 2020, Gatan Inc., Pleasanton, CA, USA) to obtain the corresponding diffraction spots, enabling detailed crystallographic analysis.

2.3. Corrosion Performance Testing

The intergranular corrosion (IGC) test was conducted in accordance with GB/T 22639-2022 [28]. The rolled surface of the sample (corrosion surface) was prepared by sequential polishing with sandpaper, fine polishing, degreasing with acetone, rinsing with deionized water, and allowing the sample to air-dry naturally. The prepared samples were then immersed in a corrosion solution for 6 h and subsequently removed. The cross-section of the sample was ground and polished to observe the intergranular corrosion morphology using the metallographic microscope. The maximum corrosion depth was measured at least three times, and the results were averaged to ensure accuracy.
The electrochemical tests were carried out using a Wuhan Coster CS series electrochemical workstation (2020, Wuhan Koster, Wuhan, China), with AA2024 aluminum alloy as the working electrode. The sample size was 10 mm × 10 mm. To prepare the working electrode, a copper wire was welded to the sample and sealed with a self-curing denture base resin, leaving only the working surface exposed. The working surface was polished with sandpaper up to 5000# grit and further polished to achieve a mirror-like finish for a smooth surface.
The reference electrode was a saturated KCl calomel electrode, while the auxiliary electrode was a platinum electrode. The test solution consisted of 3.5 wt% NaCl solution. During testing, the calomel electrode was inserted into a Luggin capillary containing saturated KCl, positioned no more than 2 mm from the center of the working electrode to ensure accurate measurements.
Once the open circuit potential (OCP) stabilized, a potentiodynamic polarization test was conducted. The test involved applying a sinusoidal AC excitation signal to study the relationship between the electrochemical impedance and frequency. The sinusoidal disturbance amplitude was set to 5 mV, and the frequency range for impedance testing was 0.1 Hz to 100,000 Hz. The scanning range for the potentiodynamic polarization test was set to −0.83 V to 0 V, with a scanning rate of 5 mV/s.
To ensure experimental accuracy, three groups of samples (SST, T6, and CD + PA) were tested, with five parallel samples in each group.

3. Results and Discussion

3.1. Microhardness of Sample

Figure 3a illustrates the average microhardness of the DL and CL after artificial aging at 150 °C. The data show that the microhardness of both DL and CL reaches a peak value of 173 HV and 165 HV, respectively, after 9 h of aging. Throughout the aging process, the trend in microhardness change for both DL and CL remains consistent, with a constant microhardness difference of approximately 10 HV. Interestingly, the microhardness rises again after 12 h of aging, which can be attributed to the bimodal strengthening effect observed in aluminum alloys after deformation aging treatments, as reported by Zhao [29].
For the solid solution-treated samples, peak microhardness is achieved at 190 °C after 9 h of aging, corresponding to the T6 state. Compared with the traditional T6 aging treatment at 190 °C, the application of 50% deformation reduces the aging temperature required to reach the peak aging (PA) state to 150 °C, while still achieving the same 9-h peak aging duration.
Figure 3b further investigates the microhardness gradient effect under different aging treatments: 3 h of under-aging (UA), 9 h of peak aging (PA), and 20 h of over-aging (OA) at 150 °C. After constrained deformation and heat treatment, it is evident that the microhardness of the CL is significantly lower than that of the DL, owing to the smaller degree of deformation in the CL. This difference creates a gradient structure transitioning from the DL to the CL.
For varying aging times, the microhardness gradient effect differs. Under the UA state (3 h), the microhardness value of the CL is similar to that of the PA state (9 h), while the DL exhibits a higher microhardness under the PA state compared to the UA state. Both UA and PA states show significant improvement over the naturally aged (NA) samples, with an overall microhardness increase of 20–30 HV.
Notably, under the constrained deformation condition of 50% and at 150 °C, the microhardness gradient effect constructed during PA is the most pronounced. The microhardness difference between the DL and CL reaches a maximum of approximately 20 HV, highlighting the effectiveness of the constrained deformation and aging treatment in achieving a gradient structure.

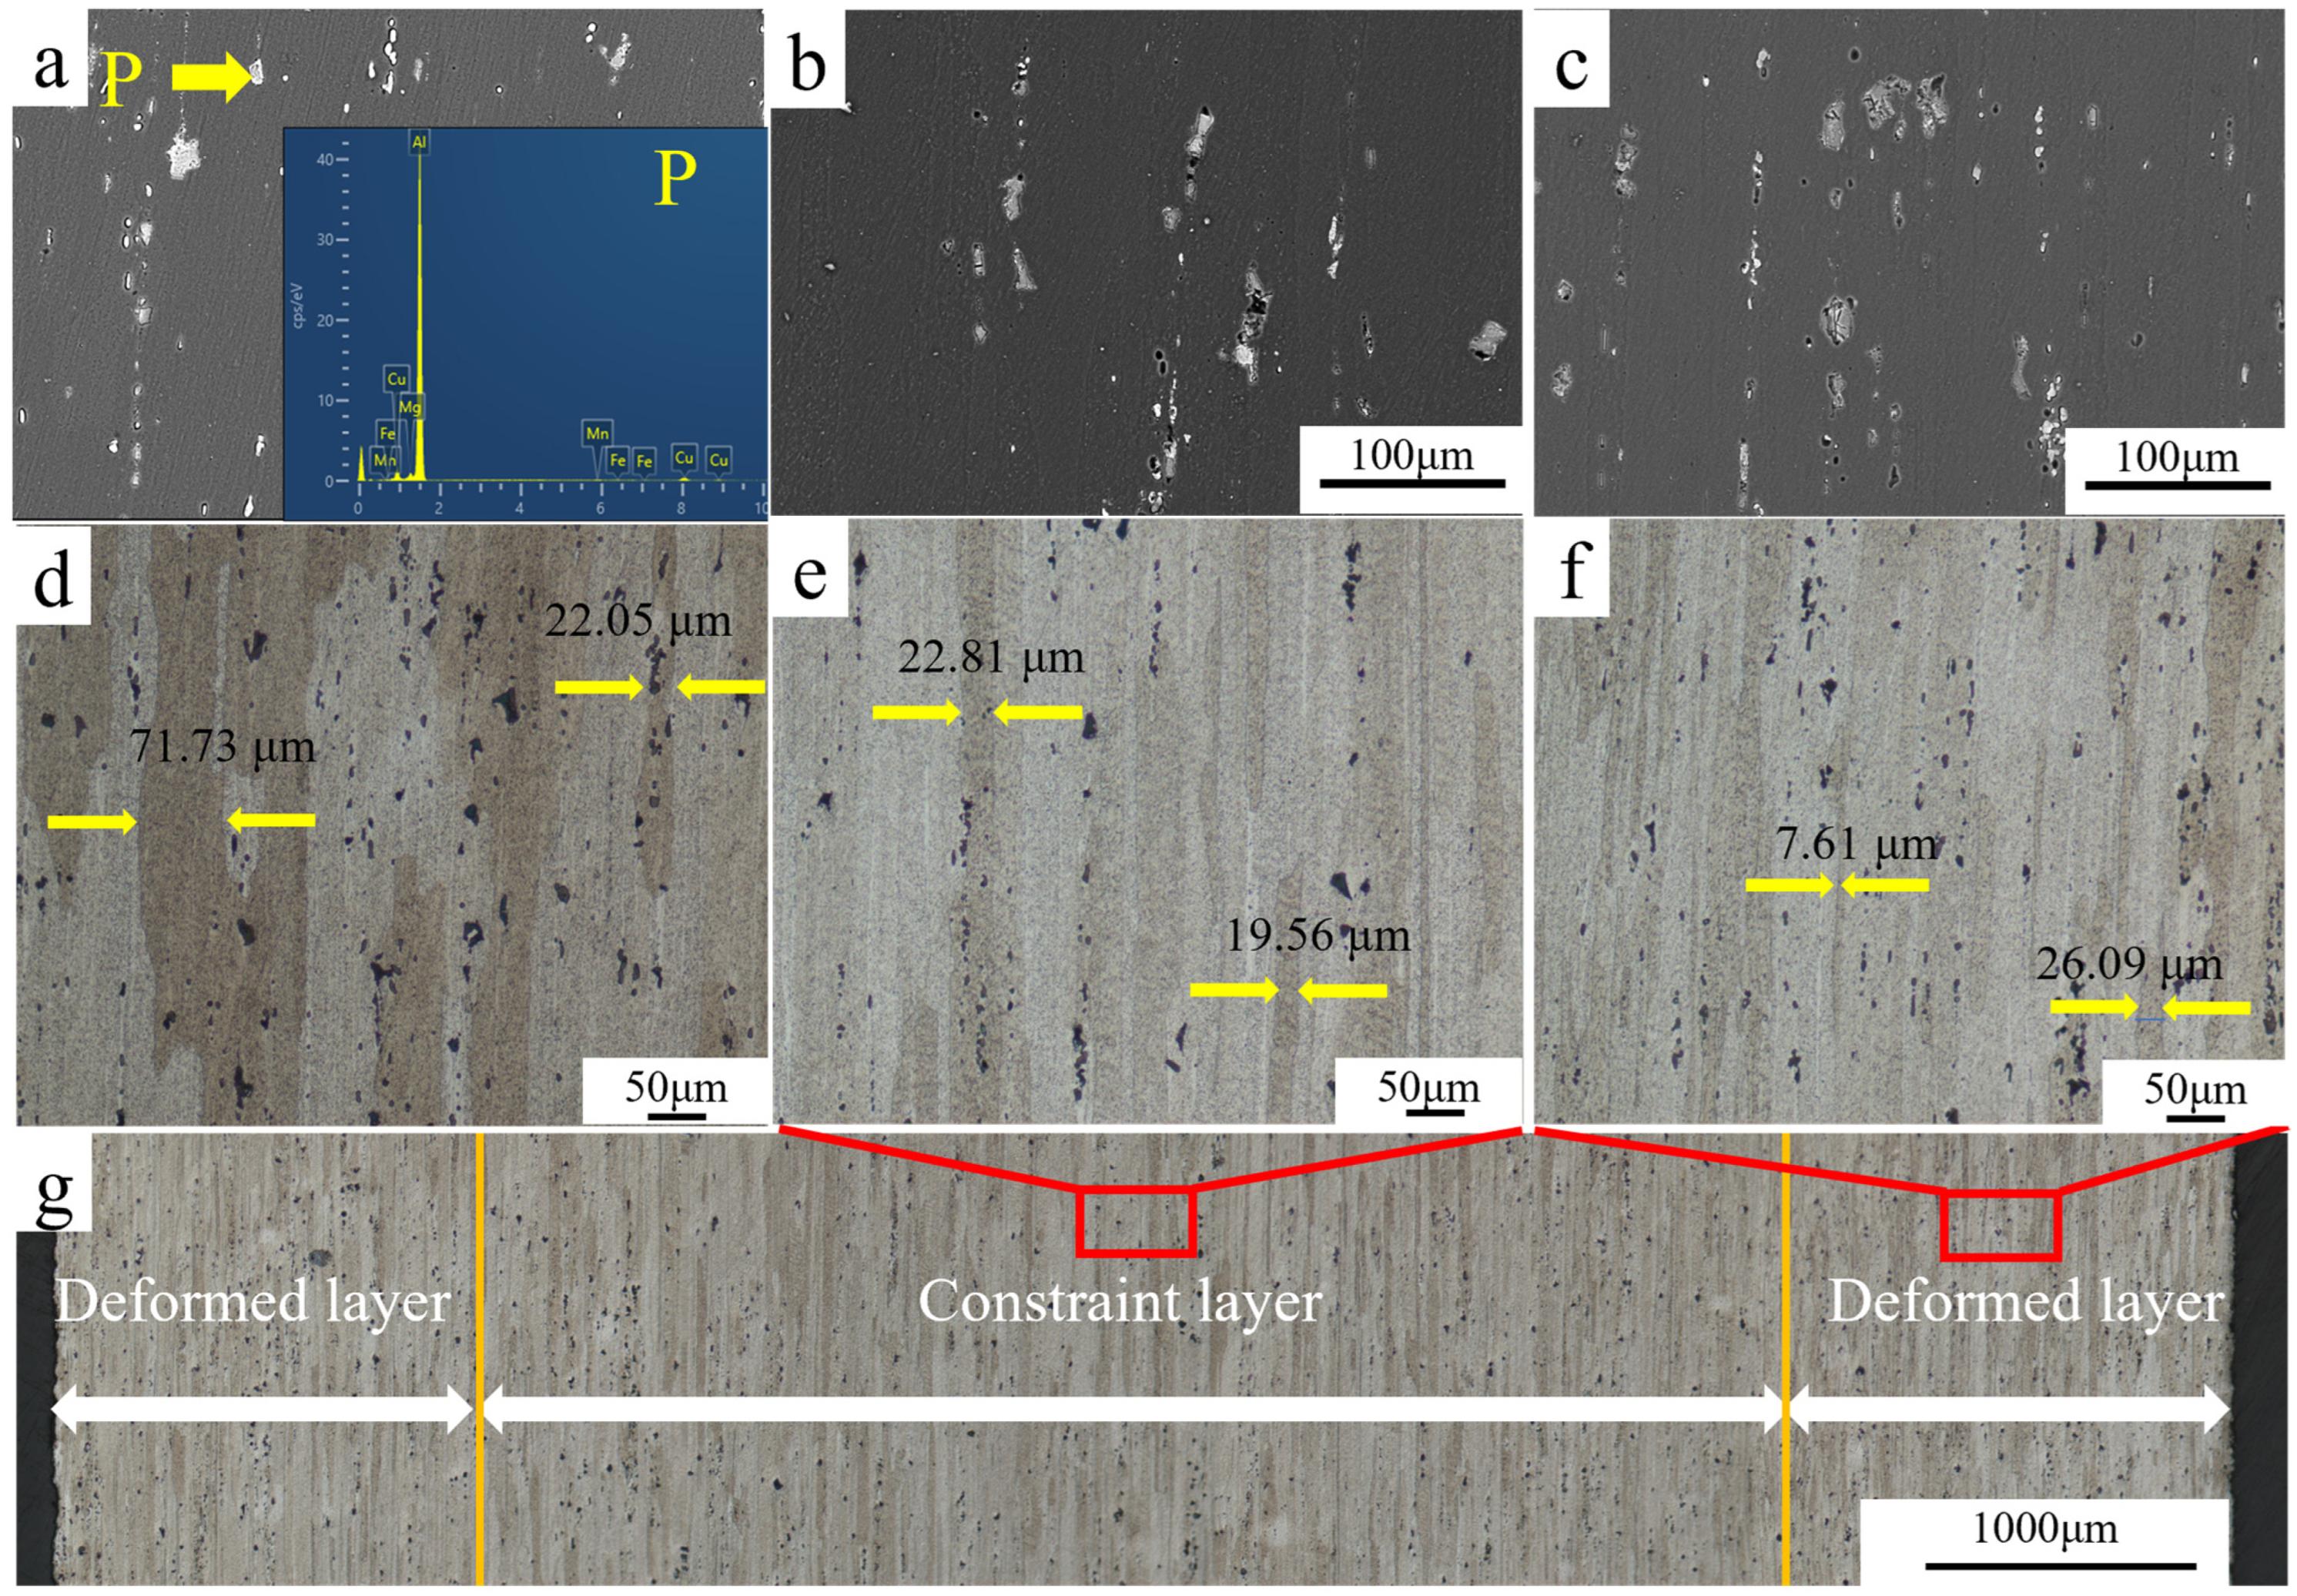
3.2. Multi-Gradient Structure

The analysis of the microhardness distribution results for the CL and DL indicates that the observed “U-shaped” microhardness distribution may be attributed to the distribution of grains, dislocations, and precipitated phases within the DL and CL after constrained thermomechanical treatment [30]. These factors suggest complex microstructural interactions that influence the mechanical properties of the material.
To further understand the origins of this “U-shaped” microhardness distribution, it is essential to perform cross-scale characterization of the microstructural features, including the grain morphology, dislocation density, and the spatial distribution and characteristics of precipitated phases (See Table 2). Such a detailed investigation will provide valuable insights into the mechanisms underlying the microhardness gradient effect and the relationship between microstructural evolution and mechanical performance.

3.2.1. Grain Gradient

The SEM and metallographic results of the original sample after solid solution treatment (SST), 50% CD, and peak aging (PA) are shown in Figure 4a–g.
In the rolling direction (RD) × normal direction (ND) plane, the SEM image in Figure 4a reveals that most of the precipitated phases are dissolved into the Al matrix during the treatment. However, rod-shaped bright spots (indicated by the P arrow) are observed, representing coarse phases rich in Al, Cu, Fe, Mn, and Si elements. These coarse phases remain in the matrix as insoluble phases.
Figure 4b,c demonstrate that, after thermomechanical treatment, the distribution of coarse phases becomes more dispersed in the DL compared to the CL. The number of coarse phases in the DL is notably higher than in the CL, indicating that CD plays a significant role in refining the coarse phases and improving their distribution.
The average bandwidth of the rolled microstructure in the solid solution state (before deformation) is shown in Figure 4d–f. After constrained thermomechanical treatment, the average bandwidth decreases significantly from 62.13 ± 10.55 μm in the solid solution state to 19.17 ± 5.78 μm in the CL and to 11.22 ± 6.37 μm in the DL (See Table 2).
A comparison between the CL (Figure 4e) and DL (Figure 4f) highlights further microstructural differences. In the DL, the black coarse phases are more dispersed and broken down by deformation. Additionally, the narrow rolled structure accounts for a larger proportion of the DL, reflecting the refining effects of constrained deformation.
At the grain scale, it is observed that the grain size decreases progressively from the DL to the CL. This gradient in grain size further supports the effectiveness of constrained thermomechanical treatment in tailoring the microstructure for enhanced mechanical properties.

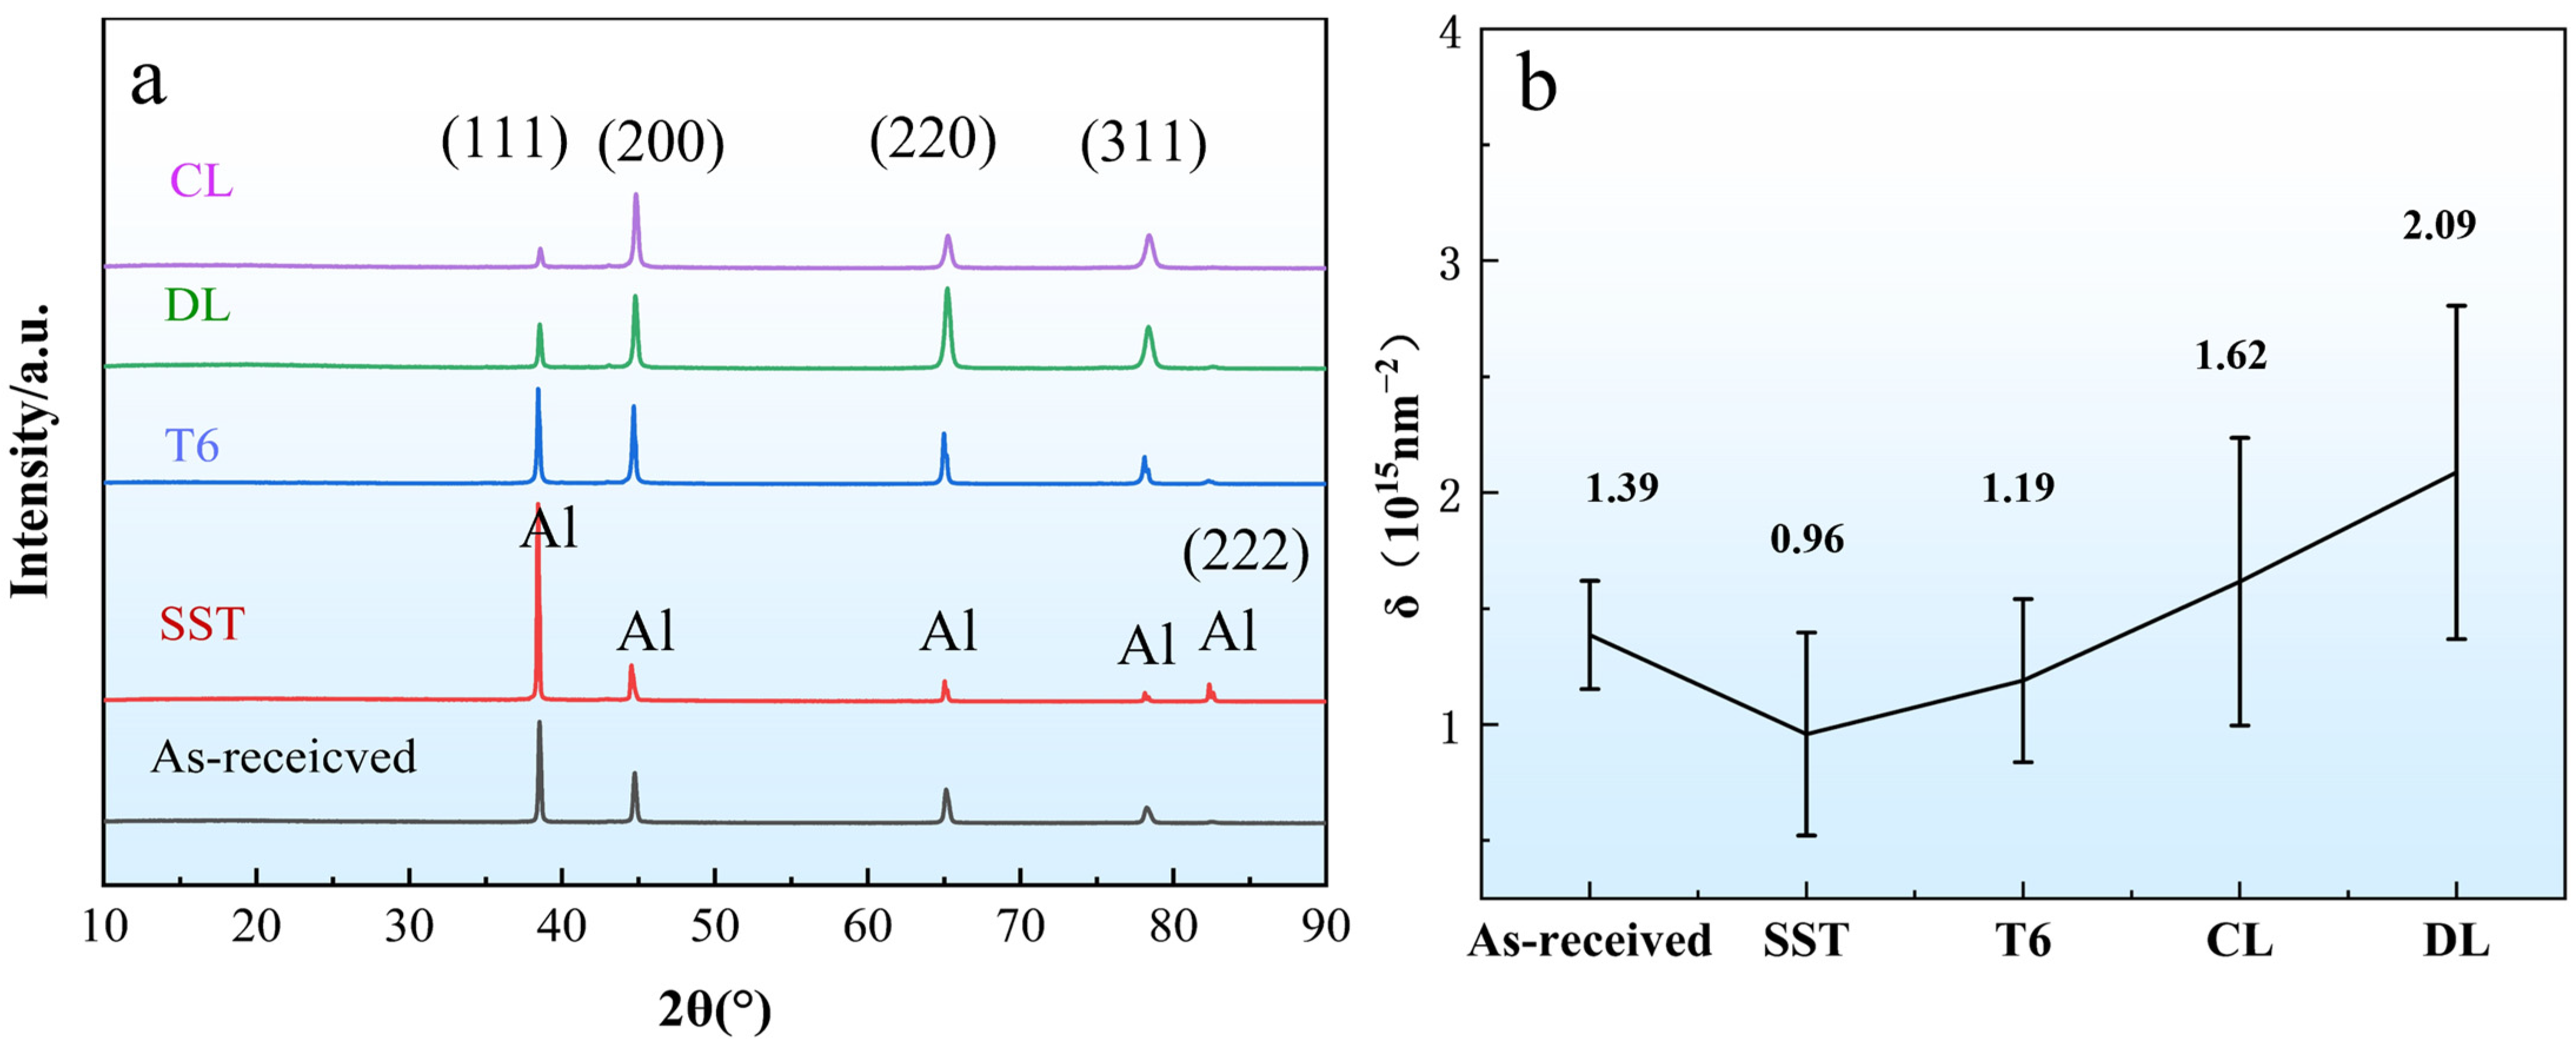
3.2.2. Dislocation Gradient

To further quantify the dislocation density of the CL and DL in the CD + PA state, the XRD results presented in Figure 5 were analyzed.
Figure 5a confirms that the XRD diffraction peaks of SST, T6, DL, and CL are mainly Al phase, and the corresponding 2θ values are 38.5°, 44.6°, 64.6°, 77.4°, and 82.3°, corresponding to (111), (200), (220), (311), and (222) crystal planes, respectively. However, Figure 5b reveals a significant difference in dislocation density between the two regions. Specifically, the average dislocation density of the DL is noticeably higher than that of the CL. A dislocation density difference of approximately 0.47 × 10¹⁵ nm−2 is observed between the two layers, forming a dislocation gradient from the DL to the CL.
According to Table 2, the average dislocation densities of the CL and DL in the CD + PA state are 1.62 × 10¹⁵ nm−2 and 2.09 × 10¹⁵ nm−2, respectively. This is a significant increase compared to the T6 state, where the average dislocation density of the sample is 1.19 × 10¹⁵ nm−2. The CD + PA treatment effectively enhances the overall dislocation density of the material. Furthermore, the pronounced difference in dislocation density between the DL and CL results in the formation of a dislocation gradient structure, with the DL exhibiting a higher dislocation density than the CL.
This dislocation gradient plays a critical role in influencing the mechanical properties of the material, as the increased dislocation density in the DL enhances its strength while the lower dislocation density in the CL provides better ductility.

3.2.3. Heterogeneous Structure of Precipitated Phase

TEM analysis of the CL in the RD × TD is presented in Figure 6.
From Figure 6a,b, at low magnification, a small amount of dislocations and rod-shaped T phase (Al20Cu2Mn3) can be observed, which are produced by constrained deformation. These results indicate that recrystallization does not occur in the CL, and the layer undergoes limited deformation. The T phase, being a hard and brittle phase that cannot dissolve during the solid solution treatment, impedes the movement of dislocations, contributing to the mechanical stability of the CL.
In Figure 6b,c, under high-resolution TEM (HRTEM), a significant number of nanoscale Guinier–Preston–Bagaryatsky (GPB) zones are formed in the CL after aging. After performing fast Fourier transform (FFT) on these granular clusters, clear matrix diffraction spots appear, while the GPB zones show weak diffraction spots [30]. The average number density of the GPB zones (FA) is measured as 449 ± 124 clusters·μm−2 (Table 2), demonstrating the substantial precipitation of nanoscale GPBs in the CL.
By applying inverse FFT transformations to Figure 6c, it can be seen in Figure 6d that dislocations are densely distributed around the GPB zones. This suggests that aging promotes the formation of GPB zones near dislocation lines, further indicating an interaction between the dislocations and the precipitated GPB zones. These findings align with those reported by Feng et al. [26], further corroborating the relationship between dislocation lines and the formation of nanoscale precipitates during aging.
From Figure 7a, the number of dislocations in the DL is significantly higher than that in the CL. A large number of dislocations are observed to accumulate around the T phase in the DL. This indicates that the DL undergoes greater deformation compared to the CL, leading to increased dislocation activity and accumulation near the hard, brittle T phase.
At high magnification (Figure 7c), needle-like precipitates are clearly observed in the DL. Under HRTEM, these needle-like precipitates are found to be distributed along dislocation lines in a stepped or corrugated pattern (Figure 7d). This alignment suggests strong interactions between the precipitates and dislocation structures, which likely contribute to the mechanical strengthening of the DL.
The FFT transform of the precipitates (Figure 7e) confirms the formation of the S′/S phase (hereinafter referred to as the S phase). Additional diffraction spots are observed, arranged roughly along the (120) Al direction, with an orientation difference (OR) of approximately 26° relative to the Al matrix. This pattern is identified as a typical Type I S phase. The OR between the S phase and Al matrix [31] is as follows:
  • [100] Al // [100] S,
  • [021] Al // [010] S,
  • [012] Al // [001] S.
The inter-row spacing and inter-atomic spacing of the S phase were measured using HRTEM as 0.726 nm and 0.923 nm, respectively (Figure 7f). These values align closely with the inter-planar spacings of the (001) s and (010) s planes in the classical S phase structure, further confirming the identification of the precipitate phase.
Compared to the CL, the DL exhibits a significantly higher number density of precipitated phases, including GPB and S phases. The average precipitate density in the DL is measured to be 1265 ± 335 clusters·μm−2 (Table 2), far exceeding that of the CL. This higher precipitate density, combined with the increased dislocation density, reflects the more intense deformation and aging processes experienced by the DL.
From the TEM characterization analysis of CL and DL, it is not difficult to find that the dislocation density of the two is significantly different. Especially in DL, the main precipitated phase is the S phase that cannot be cut by dislocations, while in CL, it is a GPB-based atomic cluster. The difference in dislocation density and the precipitated phase constructs a heterogeneous structure of a dislocation density gradient and soft and hard regions. According to the precipitation sequence SST-Cu-Mg co-clusters-S′/GPB2-S of Wang et al. [30], the high-density dislocations of DL provide a fast diffusion channel for Cu and Mg atoms, forming Cu-Mg atomic clusters near the dislocations, and gradually forming GPB zones with aging. The number is related to the number of dislocations in the region. Therefore, GPB cannot further form the S phase due to less deformation and the UA state. For DL with high-density dislocations, the number of GPB zones generated near the dislocations is due to the presence of a large number of dislocation channels, which obtains sufficient nucleation driving force and S phase precipitation driving force. Thus, the strengthening phase S appeared in the PA state. Under the same heat treatment system, when CL is in UA state, DL reaches the PA state in advance. The microhardness difference between DL and CL in Figure 3a,b is caused, and a U-shaped microhardness distribution is constructed. These evidences fully demonstrate that in DL and CL, the heterogeneous structure of precipitated phase is produced due to the change of morphology and quantity distribution of precipitated phase caused by the dislocation gradient.
From the TEM characterization analysis of the CL and DL, it is evident that there is a significant difference in dislocation density and precipitate phases between the two layers. Specifically, the main precipitate phase in the DL is the S phase, which cannot be cut by dislocations, whereas in the CL, the dominant structure is GPB-based atomic clusters. This difference in dislocation density and precipitated phase distribution constructs a heterogeneous structure characterized by a dislocation density gradient and soft-hard regions.
According to the precipitation sequence SST → Cu-Mg co-clusters → Sʹ/GPB2 → S phase described by Wang et al. [24], the high-density dislocations in the DL provide fast diffusion channels for Cu and Mg atoms. This promotes the formation of Cu-Mg atomic clusters near dislocations, which subsequently evolve into GPB zones during aging. The number of GPB zones is directly related to the dislocation density in the region. In the CL, due to lower dislocation density and limited deformation, GPB zones cannot further transform into the S phase, leaving the CL in an UA state. Conversely, in the DL, where dislocation density is significantly higher, the abundance of dislocation channels provides sufficient nucleation driving force and S phase precipitation driving force. Consequently, the strengthening S phase is formed in the DL during the PA state.
Under the same heat treatment system, the DL reaches the PA state earlier than the CL, which remains in the UA state. This difference in aging progression leads to the observed microhardness disparity between the DL and CL, as shown in Figure 3a,b, and results in the formation of a U-shaped microhardness distribution. These findings demonstrate that in both the DL and CL, a heterogeneous structure is produced due to the morphological and quantitative differences in precipitate phases caused by the dislocation gradient.

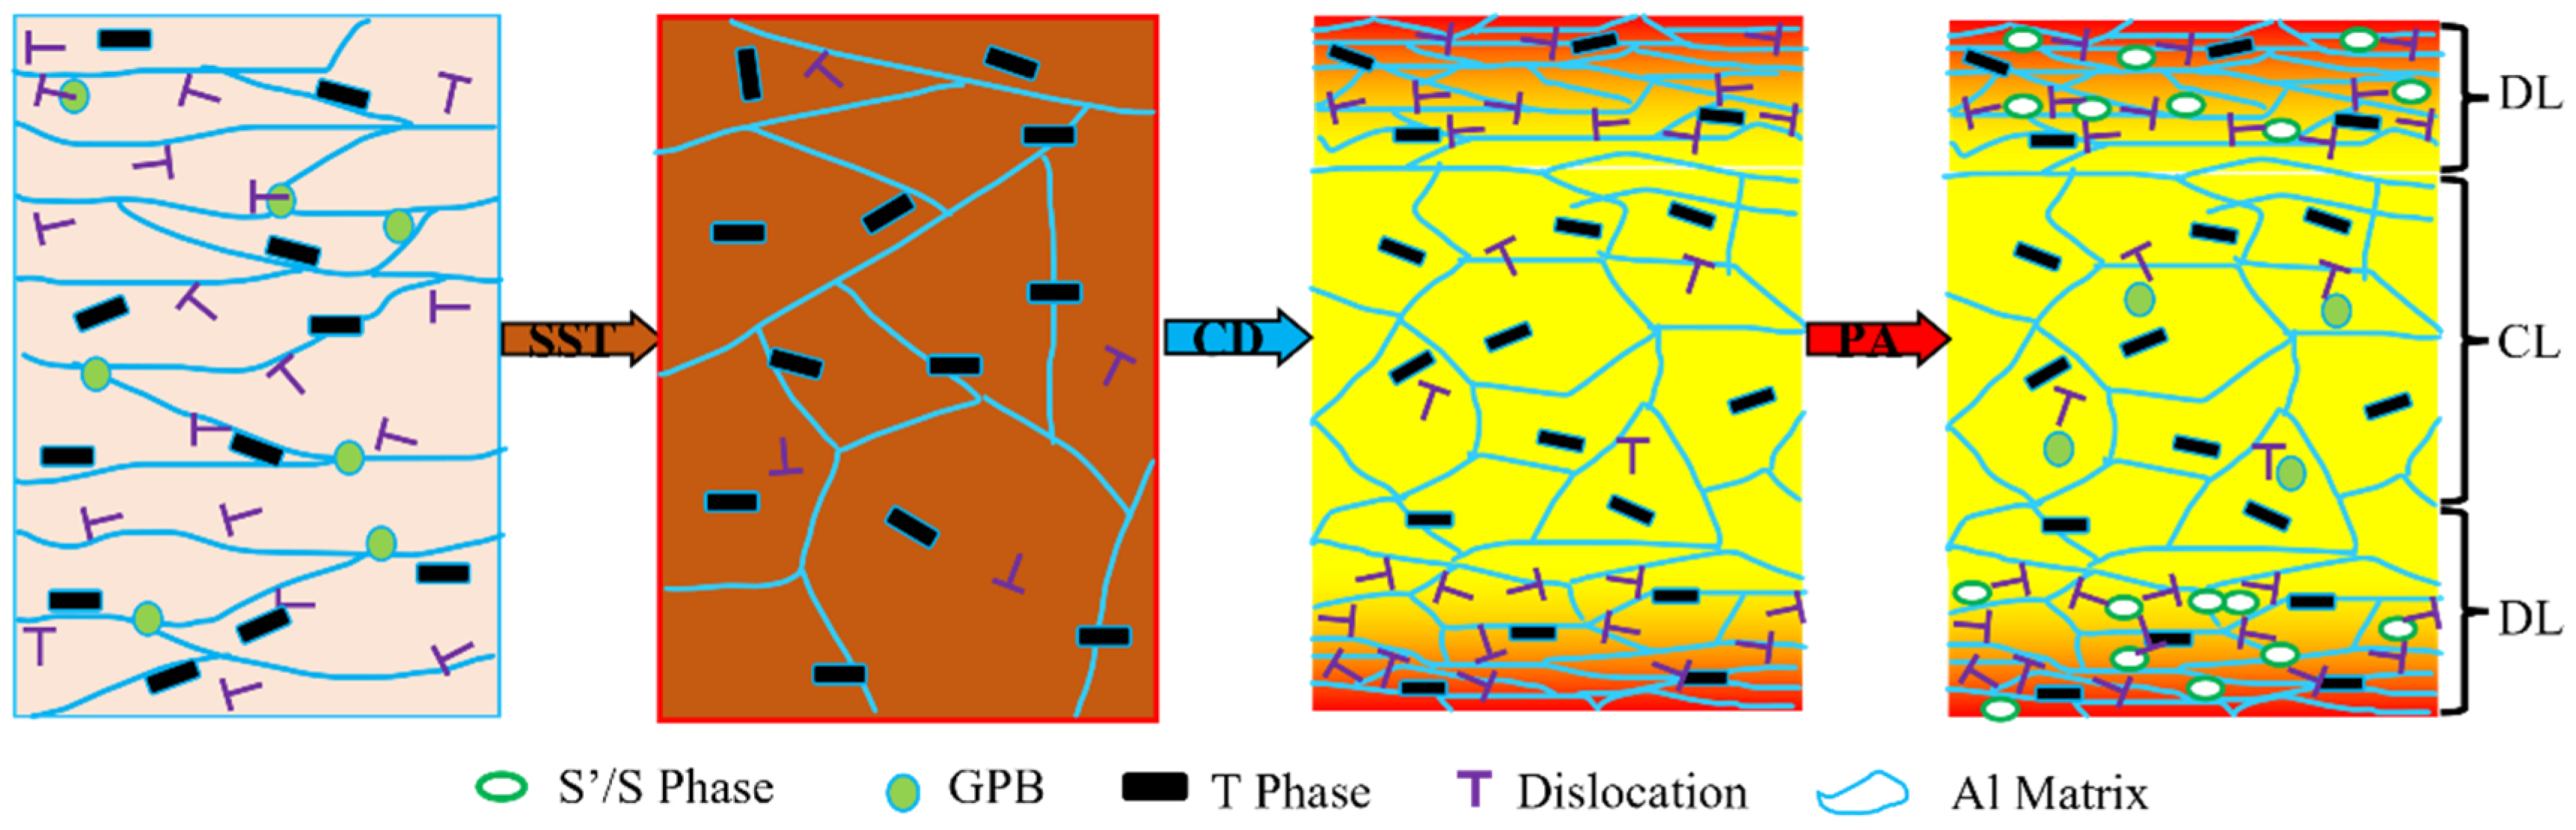
3.2.4. Microstructural Evolution During CD + PA

Initially, the original sample predominantly exhibits a cold-rolled structure containing T phase and GPB zones. After the SST, Cu-Mg atomic clusters dissolve back into the matrix, resulting in the dissolution of GPB zones. Grain growth and recrystallization occur, and the number of dislocations decreases significantly.
During the CD treatment, the deformation in the DL is much greater than in the CL. As a result, the following observations are made: (1) the dislocation density in the DL increases significantly, exceeding that of the CL; (2) the microhardness of the DL becomes much higher than that of the CL, resulting in noticeable work hardening; and (3) a dislocation gradient structure is formed, transitioning from the highly deformed DL to the less deformed CL.
During the subsequent PA treatment, the overall dislocation gradient structure acts as nucleation sites for precipitates. The higher dislocation density in the DL enhances the atomic diffusion rate, leading to a faster nucleation rate in the DL compared to the CL. Thus, the following is observed: (1) in the DL, a large number of S′/GPB2 particles nucleate near dislocations, eventually transforming into a dispersed distribution of S phases, allowing the DL to reach the PA state earlier; and (2) in the CL, with fewer dislocations, fewer S′/GPB2 nuclei are formed, and the CL remains in the UA state, containing a small amount of metastable S″ phase.
This difference in precipitate morphology and the quantitative distribution between the DL and CL results in precipitate phase heterogeneity, which is critical in defining the mechanical properties of the material.
The specific organizational evolution of the material during CD + PA is schematically illustrated in Figure 8. The figure highlights the following: (1) the dissolution of Cu-Mg atomic clusters during SST; (2) the reformation of GPB zones during aging, facilitated by dislocation gradients; and (3) the transformation of GPB zones into S phases in the DL, while the CL remains in a UA state with fewer dislocations and less precipitate transformation.
This model underscores how the interaction between dislocation density gradients and precipitate morphology drives the development of a heterogeneous microstructure in the material.

3.3. Mechanical Properties of Sample

3.3.1. Aging Behavior and Mechanical Strength

As shown in Figure 9a, the yield strength (YS) and ultimate tensile strength (UTS) of the sample gradually increase with aging time at the same aging temperature. After 9 h of aging, corresponding to the peak-aged (PA) state, the sample achieves the best comprehensive performance, including a yield strength (YS) of 495 MPa, ultimate tensile strength (UTS) of 553 MPa, fracture elongation (Ef) of 13.5%, and uniform elongation (Eu) of 9.8%.
Compared to the traditional T6 treatment, the yield strength increases by 100 MPa, the fracture elongation is maintained or slightly increased, and uniform elongation is also improved (Figure 9b). This improvement can be attributed to the rapid increase in the work hardening rate at the early stage of the tensile process (Figure 9c), which significantly enhances the yield strength.
In the UA state (1, 3, or 5 h of aging), the mechanical properties of the sample remain similar with a YS of 469–489 MPa, UTS of 548–554 MPa, Ef of 10.5–10.6%, and Eu of 9.8–10.4%.
When the aging time reaches 9 h, corresponding to the DL reaching the PA state, the sample exhibits the best overall elongation due to the gradient structure.

3.3.2. Yield Strength Contribution of the Deformed Layer in the Multi-Gradient Structure

To further investigate the dominant factors influencing the yield strength in the multi-gradient structure, the strengthening contributions of the DL were calculated.
According to the grain boundary strengthening formula [32],
δ gb = K D - 1 / 2
the yield strength increment δgb contributed by grain boundary in DL is calculated, where K is a constant of 0.1 MPa m1/2 and D is the average grain size of DL 11.22 μm. The yield strength contributed by grain boundary strengthening in DL is calculated to be 29.8 MPa.
According to the dislocation strengthening formula [33],
τ d = M α Gb ρ 1 / 2
the yield strength increment τd provided by dislocation is calculated, where the Taylor factor M is 3.06, α = 0.27, G is the shear modulus with a value of 26.2 GPa, b is the Burgers vector of Al with a value of 0.286 nm, and ρ is the dislocation density. The dislocation strengthening contribution of DL is 283.05 MPa, and the dislocation strengthening contribution of CL is 248.27 MPa.
Generally speaking, the precipitated phases T and S strengthen the material by acting as obstacles to the movement of dislocations. For small precipitates, the main strengthening phase is the S phase, and the precipitation strengthening formula is described as follows [34]:
τ p = 0.4 Gbln ( 2 r / b ) / λ π ( 1 - υ ) 1 / 2
This equation is used to calculate the yield strength strengthening contribution τp [33] provided by the precipitate, where r and λ are the average radius and spacing of the S phase, respectively, and G is the shear modulus of 26.2 GPa. In addition, b is the Burgers vector of 0.286 nm, and υ is the Poisson’s ratio of 0.33. The measured r and λ are about 2.1 ± 0.64 nm and 17.5 ± 3.56 nm, respectively, so the precipitation strengthening contribution of S phase in the DL is 179 MPa.
Therefore, the theoretical yield strength of the DL after CD + PA treatment is calculated to be 457.07 MPa, which is obtained by summing the contributions from the three strengthening mechanisms. Among these, dislocation strengthening provides the largest contribution, precipitation strengthening contributes the second most, and grain boundary strengthening has the smallest impact.
Thus, dislocation strengthening is identified as the dominant strengthening mechanism in the DL.
However, the actual yield strength of the entire sample, as shown in Figure 9a, is measured at 495 MPa, which exceeds the theoretical value. This demonstrates that the yield strength is not merely the sum of the calculated contributions from the three mechanisms. The additional improvement in yield strength is attributed to HDI hardening, which arises from the unique strengthening mechanism of the gradient structure.

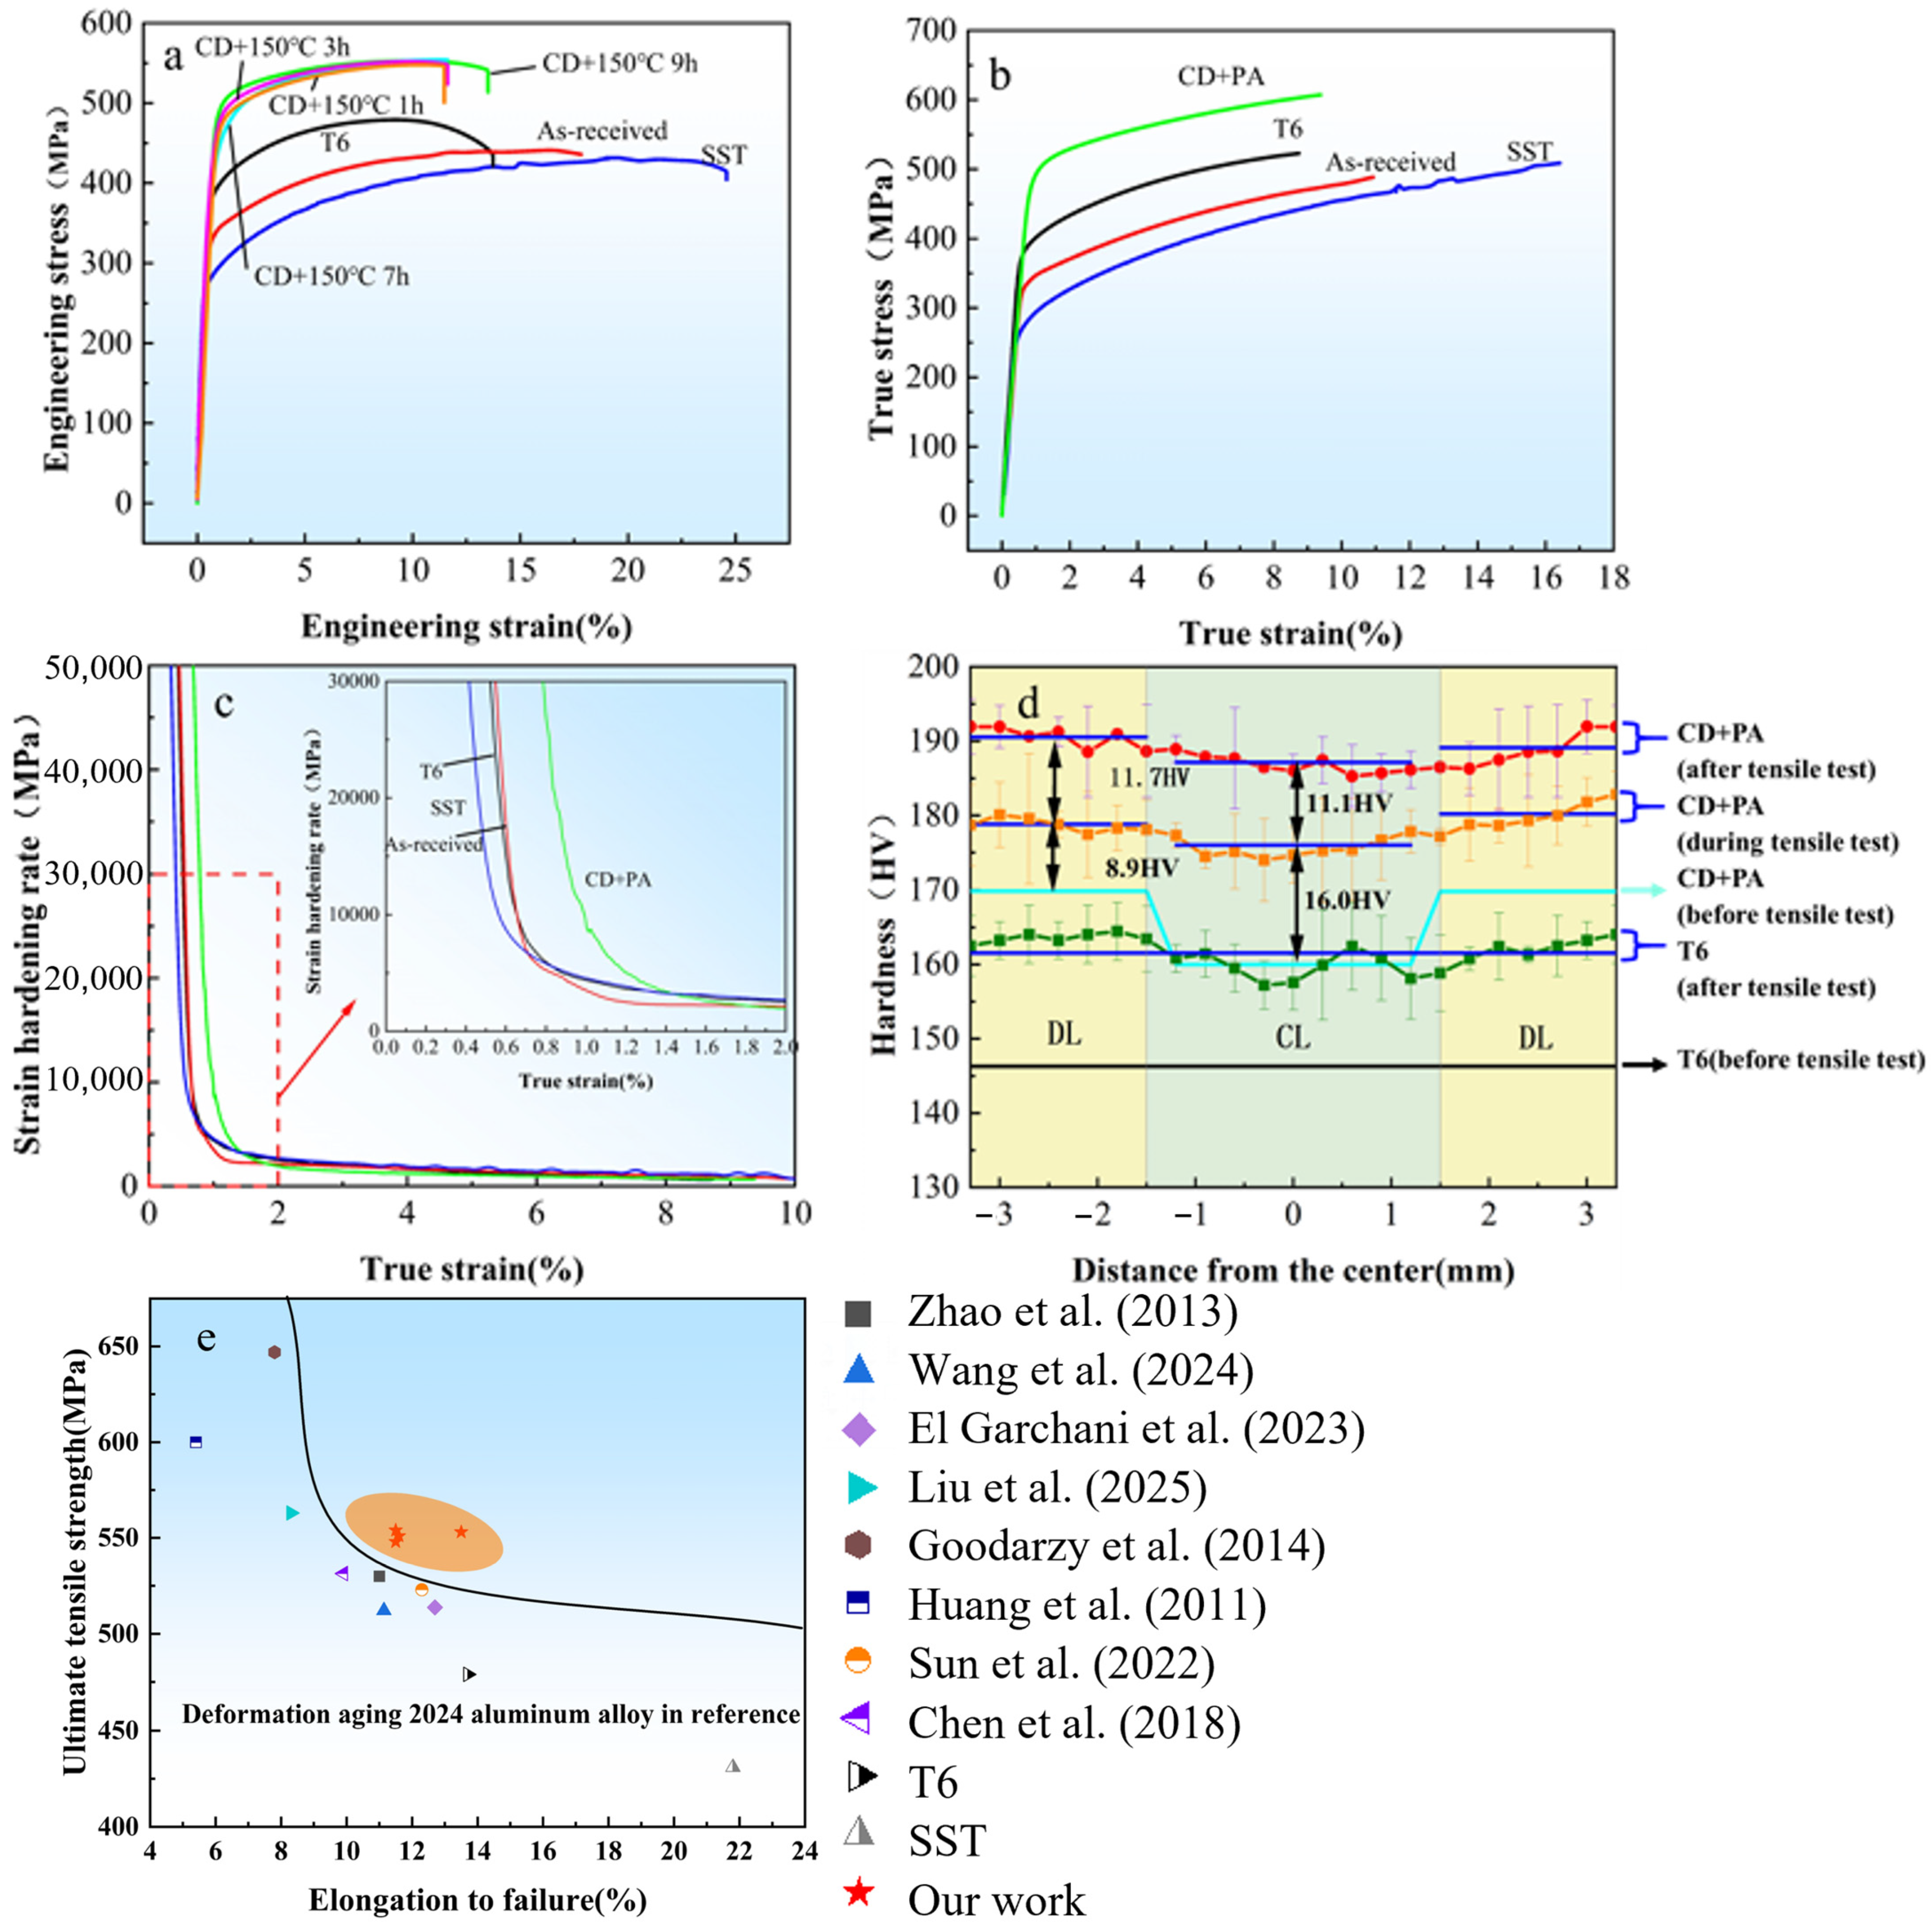
3.3.3. Work Hardening Behavior Across Samples

As shown in Figure 9c, the work hardening behavior of the samples differs significantly under tensile deformation.
For the original, SST, and T6 samples, at true strains between 0% and 2%, the hardening rate decreases rapidly.
In the SST sample, due to the reduced dislocation density caused by solid solution treatment, the material exhibits limited work hardening during the early stage of plastic deformation. The lack of internal dislocations before tensile deformation leads to a diminished capacity for strain hardening.
For the original and T6 samples, with inherently high dislocation densities, a large number of movable dislocations are available during the early stage of plastic deformation, resulting in significant work hardening behavior. However, as strain increases, these dislocations begin to entangle and accumulate. This dislocation entanglement reduces mobility, causing a rapid decrease in the hardening rate. Consequently, the samples enter the necking stage prematurely and fail [35].
For the CD + PA sample, the behavior is markedly different.
The hardening rate remains stable over a larger strain range. This stability is attributed to the gradient heterostructure introduced during the CD + PA process. The unique work hardening behavior of the gradient sample can be explained by the dislocation density gradient and precipitated phase gradient, as revealed by XRD results. Dislocations are continuously emitted from the softer CL, which acts as a dislocation source [36]. These dislocations gradually diffuse into the harder DL during tensile deformation. Within the DL, they encounter significant resistance due to dislocation entanglement, and hindrance from the S phase precipitates [37]. This interaction creates a large work hardening effect in the DL, which sustains strain hardening over a larger deformation range.

3.3.4. HDI Hardening Mechanism

The enhanced yield strength and plasticity in the gradient structure are also explained by the HDI hardening theory proposed by Zhu et al. [38,39].
According to this theory, the back stress generated in the softer zone (CL) induces a corresponding normal stress in the harder zone (DL). In the gradient structure, the transition from large-grain regions in the CL to small-grain regions in the DL results in a gradual increase in dislocation density, forming a dislocation density gradient. The large-grain CL region produces dislocations during deformation, which are hindered as they move into the small-grain DL region. This hindrance increases the dislocation storage capacity of the material and enhances the yield strength.
HDI strengthening contributes to the improvement of yield strength, while HDI strain hardening helps maintain and even improve plasticity [36]. As shown in Figure 9d, under CD + PA conditions, the microhardness of the DL increases with strain, reaching an average value of 188 HV, significantly higher than the 161 HV observed in the T6 sample. This increase reflects an enhanced dislocation storage capacity and the ability to maintain plasticity.
The microhardness increase in the CL is more significant (16 HV) compared to the DL (8.9 HV), indicating that plastic deformation begins in the softer CL. This is accompanied by dislocation proliferation in the CL, while the harder DL remains elastic and forms a strain gradient.
The strain gradient leads to the formation of geometrically necessary dislocations (GNDs), which are critical for maintaining lattice continuity and accommodating uneven deformation. After tensile deformation, the microhardness values of the CL and DL become similar, highlighting the role of the gradient structure in achieving uniform deformation and strain compatibility. The gradient heterostructure also creates plastic incompatibility between the soft and hard layers, leading to a locally complex three-axis stress state under uniaxial tension. This change in the stress state promotes additional dislocation accumulation and increased dislocation interactions through the activation of multiple slip systems [40,41,42].
The unique work hardening behavior and enhanced mechanical properties of the CD + PA sample arise from its gradient structure, which enables the following: (1) dislocation emission from the CL and storage in the DL; (2) sustained work hardening due to dislocation entanglement and precipitate interactions; and (3) HDI hardening mechanisms that enhance yield strength and plasticity.
These mechanisms combine to produce a material with superior strength and ductility compared to conventionally treated samples.
These data are plotted alongside the results of this study in Figure 9e, illustrating the equilibrium relationship between strength and ductility [29,43,44,45,46,47,48,49]. Since uniform tensile elongation data are not available, ultimate tensile strength (UTS) and total strain are used as the longitudinal and transverse axes, respectively, to represent the balance between strength and ductility. The plotted results reveal that most data points adhere to the general trade-off relationship between strength and ductility, where an increase in strength often comes at the expense of ductility. A comparison of various heat treatment technologies reveals that, although T6 heat treatment [44], electric pulse therapy [45], ECAP [46], and ultrasonic surface mechanical rolling treatment [43] can enhance the mechanical properties of 2024 aluminum alloy, they do not provide uniform performance across all required properties. In contrast, our novel CD + PA process can consistently improve mechanical strength, ductility, and corrosion resistance, making it the optimal choice for enhancing the overall performance of 2024 aluminum alloy. The combined benefits of superior mechanical properties and excellent corrosion resistance position the CD + PA process as a promising candidate for industrial applications.
Figure 9. Mechanical property charts: (a) Engineering stress-strain curve; (b) True stress-strain curve; (c) Work hardening curve; (d) Microhardness distribution across different regions during tensile testing (solid line represents the average value); (e) Strength–ductility balance (yield strength vs. total strain) of the present results and data picked from previous reported successful attempts [29,43,44,45,46,47,48,49].
Metals 15 00177 g009

3.4. Corrosion Performance

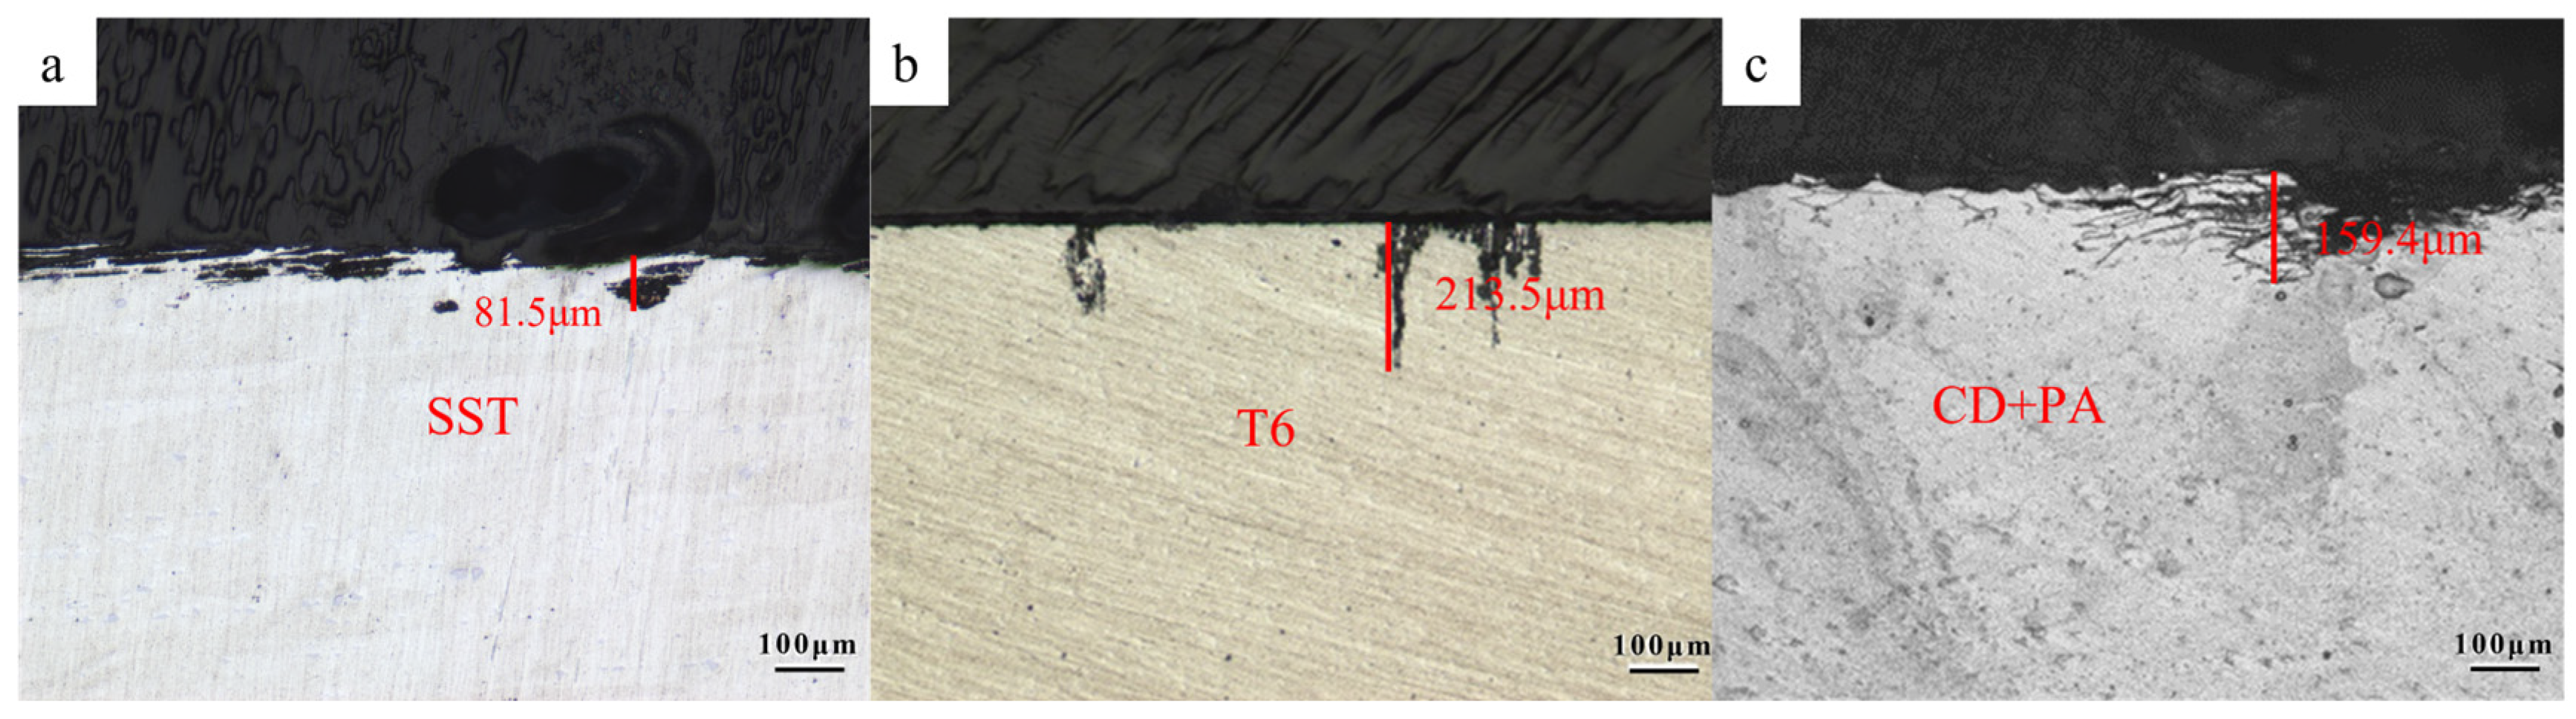
3.4.1. Intergranular Corrosion Behavior

As shown in Figure 10, the corrosion resistance of AA2024 aluminum alloy improves after CD and different aging time treatments, compared to the traditional T6 treatment. The maximum corrosion depths for the various conditions are as follows: SST of 79.6 ± 12.9 μm, T6 of 224.3 ± 10.1 μm, and PA of 164.3 ± 9.41 μm.
For the CD + PA sample, the improvement in corrosion resistance is explained below.
After deformation, the surface dislocation density increases, which enhances atomic diffusion rates on the surface. This leads to a uniform distribution of corrosion across the surface, reducing localized corrosion and improving pitting resistance.
During plastic deformation, the second-phase particles break apart, and their sizes decrease, further enhancing pitting corrosion resistance [17]. The ultrafine grain structure introduces a high density of defects, such as grain boundaries, which reduce the nucleation energy barrier of the second phase. This accelerates the kinetics of second-phase precipitation. Even at room temperature over a short time, significant precipitation along the grain boundaries occurs [50]. These grain boundary precipitates increase the tendency for pitting corrosion, reducing corrosion resistance relative to SST.
In summary, the intergranular corrosion resistance of the samples ranks as follows: SST > CD + PA > T6.

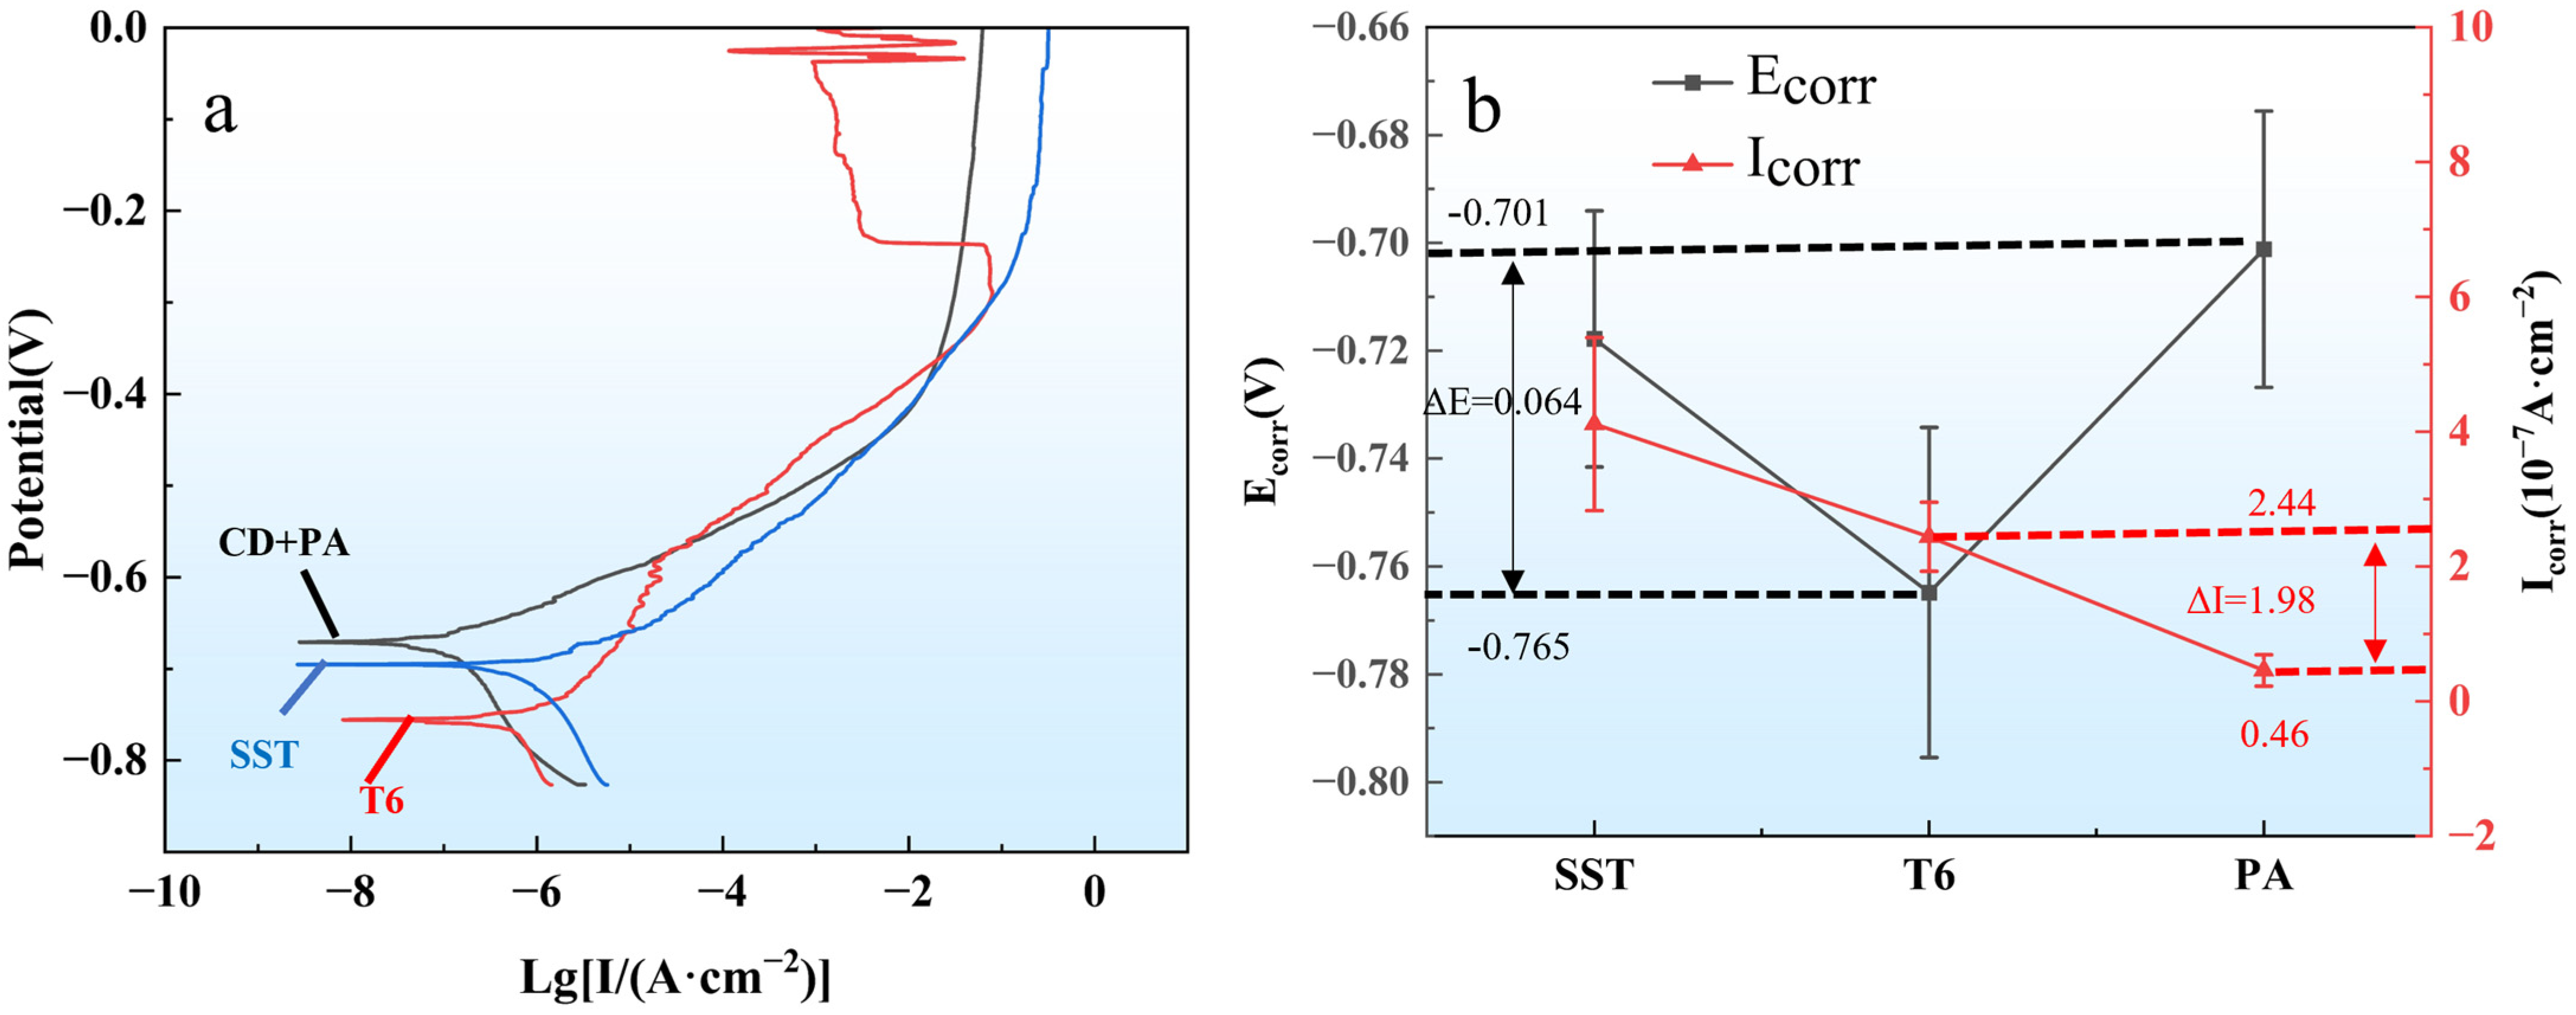
3.4.2. Electrochemical Behavior

The electrochemical corrosion behavior of the AA2024 aluminum alloy in different treatment states is presented in Figure 11.
As shown in Figure 11a, the self-corrosion potentials (Ecorr) of the SST and CD + PA samples are higher than those of the traditional T6 state. This indicates that the corrosion resistance of SST and CD + PA is superior to that of T6.
During the anodic reaction, when the polarization potential exceeds the self-corrosion potential, the anodic current density of all three samples increases rapidly, indicating active dissolution of the aluminum alloy in the anodic zone. At higher anodic current densities, the corrosion products formed during the polarization process begin to attach to the sample surface.
These corrosion products prevent the penetration of H+ and Cl into the aluminum alloy matrix, thus inhibiting further anodic dissolution on the surface of the alloy [51].
In the potential range of −0.7 V to −0.41 V, the corrosion current of the CD + PA sample is higher than that of the T6-treated sample. This behavior can be explained by the electrochemical characteristics of the S phase in the alloy. In a 3.5% NaCl solution, the potential of the S phase is approximately −0.94 V, while the potential of the AA2024 aluminum alloy matrix is between −0.81 V and −0.86 V [48]. The Mg-rich regions within the S phase are more electrochemically active and serve as anodes, initiating localized pitting corrosion in the early stages [52]. Concurrently, the aluminum matrix undergoes a cathodic reaction via oxygen reduction. As corrosion progresses, Mg is rapidly consumed from the S phase, leaving behind Cu-rich residues, which act as cathodes due to their higher potential compared to the Al matrix. The aluminum substrate undergoes anodic dissolution, reacting with H2O and Cl in the electrolyte. At the cathode, the transmission of O2 generates OH, which forms a passivation film on the alloy surface [53]. However, Cl in the solution quickly destroys this passivation film, allowing localized corrosion to continue.
As shown in Figure 11b, among the three treatment states, the CD + PA sample exhibits the lowest corrosion current density and the highest corrosion potential. This indicates that the corrosion resistance of CD + PA is superior to both the T6 state and SST.
Above all, the improved corrosion resistance of the CD + PA sample compared to the T6-treated sample is attributed to the following: (1) the higher self-corrosion potential of the CD + PA sample; (2) the reduced corrosion current density; and (3) the ability of the CD + PA treatment to minimize localized corrosion through uniform dissolution and delayed passivation film breakdown.
Overall, the corrosion resistance of the samples exhibits the following rankings: CD + PA > SST > T6.

3.4.3. Localized Corrosion Behavior of AA2024 Aluminum Alloy in Different Treatment States

The schematic diagram in Figure 12 illustrates the intergranular corrosion mechanisms of AA2024 aluminum alloy under different treatment conditions (SST, T6, and CD + PA).
During the SST treatment process, the aluminum alloy is heated to the solution temperature and then rapidly cooled. This process evenly distributes alloying elements within the matrix. As a result, the following is observed: (1) fewer precipitated phases form at the grain boundaries, and these are primarily metastable phases; (2) the potential of these metastable phases is close to that of the matrix, thereby reducing the electrochemical driving force for corrosion; and (3) consequently, the electrochemical stability of grain boundaries in the SST state is higher, and the resistance to intergranular corrosion is stronger.
In the T6 state, aging treatment promotes the precipitation of a large number of strengthening phases (S phases) within the alloy. These strengthening phases are densely distributed at the grain boundaries. This results in a significant potential difference between the grain boundaries and the matrix, leading to galvanic corrosion. The S phase, which typically has a lower potential, preferentially dissolves, making grain boundaries the focal point of corrosion. This localized galvanic effect increases the susceptibility to intergranular corrosion in a corrosive environment, thereby reducing the corrosion resistance of the alloy in the T6 state.
CD introduces grain deformation and increases dislocation density, which raises the internal stress of the alloy. During the subsequent PA process, the precipitation of the S phase at grain boundaries becomes dense and uneven. In the CD + PA state, the potential difference between the S phase in the DL and the matrix can promote micro-galvanic corrosion. However, the accumulation of dislocations near grain boundaries inhibits the diffusion of supersaturated Cu and Mg solutes into the grain boundaries, thereby preventing the formation of continuous S phase precipitates along the grain boundaries [54]. Furthermore, the uniformly distributed precipitates reduce the localization of electrochemical corrosion, thereby decreasing the sensitivity to localized corrosion.
In summary, the corrosion resistance of the alloy in different treatment states exhibits the following order: SST > CD + PA > T6.
Although CD + PA improves corrosion resistance compared to T6 due to reduced localized corrosion, it does not reach the same level as the SST state, where the grain boundaries are more electrochemically stable and less prone to corrosion.

4. Conclusions

In this study, the microstructure, mechanical properties, and corrosion resistance of CD + PA-treated AA2024 aluminum alloy were systematically investigated under tensile and corrosion conditions. Additionally, the performance of CD + PA-treated AA2024 was compared with that of the T6-treated AA2024 alloy to evaluate its mechanical and electrochemical properties. Based on the experimental evidence presented, the following conclusions were drawn:
(1)
Microstructure Changes: A multi-gradient structure consisting of grains, dislocations, and precipitates was successfully produced in AA2024 aluminum alloy using the CD + PA treatment. This gradient structure played a crucial role in enhancing the alloy’s mechanical and electrochemical properties. Compared to CL, the grain size of DL of the CD + PA-treated sample was significantly reduced from approximately 10 μm to around 20 μm, showing superior mechanical performance. The dislocation density varied significantly between the DL and the CL, from 2.09 × 10¹⁵ nm−2 in the DL to approximately 1.62 × 10¹⁵ nm−2 in the CL. This difference in dislocation density contributed to the improvement in the mechanical properties and the fine distribution of precipitates. The CD + PA treatment also promoted significant changes in the precipitate phases. In the CL, fewer GPB clusters were observed, with a density of 449 ± 124 number·μm−2. However, in the DL, the density of S′ phases increased significantly to 1265 ± 335 number·μm−2. This increase in the density of S′ precipitates in the DL region contributed to a more refined microstructure, further enhancing the strength and corrosion resistance of the alloy. Among the four major strengthening mechanisms, dislocation strengthening and precipitation strengthening play the dominant roles, contributing a yield strength of 283.05 MPa, with precipitation strengthening following closely at 179 MPa. Additionally, there is an extra HDI strain hardening during the tensile process.
(2)
Improvement in Mechanical Properties: The CD + PA treatment promoted grain boundary strengthening, dislocation strengthening, and precipitation strengthening. The unique deformation mechanisms between the DL and the CL were revealed by the microhardness distribution. After the tensile test, the average microhardness in the surface DL region reached around 190 HV, while the T6-treated sample had an average value of r163 HV. Additionally, the yield strength of the CD + PA sample is 495 MPa, and the fracture elongation is 13.5%, which is an improvement of 100 MPa compared to the T6 sample. The elongation remains nearly unchanged.
(3)
Improvement in Corrosion Resistance: The increased dislocation density in the surface DL region promoted the formation of fine and uniformly distributed precipitates, contributing to more uniform and stable corrosion behavior. In intergranular corrosion, the average maximum corrosion depth of the CD + PA sample was 164.3 ± 9.41 μm, while the T6 sample had an average maximum corrosion depth of 224.3 ± 10.1 μm. In the electrochemical tests, the average open circuit potential of the CD + PA sample was −0.70 V, higher than the T6 sample’s value of −0.76 V. The average self-corrosion current density of the CD + PA sample was 0.046 μA/cm2, significantly lower than the 0.24 μA/cm2 of the T6 sample. This further demonstrates the improved corrosion resistance of the CD + PA-treated sample. The reduced corrosion depth and lower self-corrosion current density, along with the higher self-corrosion potential, all indicate that the CD + PA treatment significantly enhances the alloy’s resistance to corrosion compared to the T6 treatment.
In conclusion, the experimental results indicate that the CD + PA treatment exhibits significant potential for industrial applications, such as aerospace and automotive manufacturing. This process not only enhances the mechanical properties and corrosion resistance of AA2024 aluminum alloy but also offers a feasible and cost-effective method for producing materials with superior performance, making it highly suitable for components that require high strength and durability in harsh environments.

Author Contributions

Conceptualization, Z.X., L.Z. and J.L.; methodology, Z.X. and L.Z.; software, L.Z.; validation, Z.X., H.X., X.D. and Y.Z.; formal analysis, Z.X., Y.D. and Y.Z.; investigation, Z.X., L.Z., M.P., H.X., X.D. and M.L.; resources, M.P. and M.L.; data curation, M.P. and M.L.; writing—original draft preparation, Z.X., Y.D. and H.X.; writing—review and editing, Z.X., L.Z., J.L., Y.D., M.P., H.X., X.D., Y.Z. and M.L.; visualization, Z.X.; supervision, J.L. and Y.D.; project administration, J.L.; funding acquisition, J.L. All authors have read and agreed to the published version of the manuscript.

Funding

This research was funded by the Yunnan International Cooperation Base in Cloud Computation for Nonferrous Metal Processing (grant no. 202203AE140011), the Key Science and Technology Project of Yunnan Province (grant no. 202402AB080012), and the Kunming University of Science and Technology Analytical Testing of China (grant no. 2023M20222130018).

Data Availability Statement

The data presented in this study are available on request from the corresponding author due to privacy.

Acknowledgments

We acknowledge the project of the Yunnan International Cooperation Base in Cloud Computation for Nonferrous Metal Processing, the Key Science and Technology Project of Yunnan Province, and the Kunming University of Science and Technology Analytical Testing of China.

Conflicts of Interest

The authors declare no conflicts of interest. The funders had no role in the design of the study; in the collection, analyses, or interpretation of data; in the writing of the manuscript; or in the decision to publish the results.

References

  1. Miller, W.S.; Zhuang, L.; Bottema, J.; Wittebrood, A.J.; De Smet, P.; Haszler, A.; Vieregge, A. Recent Development in Aluminium Alloys for the Automotive Industry. Mater. Sci. Eng. A 2000, 280, 37–49. [Google Scholar] [CrossRef]
  2. Singh, D.; Rao, P.N.; Jayaganthan, R. Effect of Deformation Temperature on Mechanical Properties of Ultrafine Grained Al–Mg Alloys Processed by Rolling. Mater. Des. 2013, 50, 646–655. [Google Scholar] [CrossRef]
  3. Kikuchi, D.; Harada, Y.; Kumai, S. Surface Quality and Microstructure of Al-Mg Alloy Strips Fabricated by Vertical-Type High-Speed Twin-Roll Casting. J. Manuf. Process. 2019, 37, 332–338. [Google Scholar] [CrossRef]
  4. Tsuji, N.; Toyoda, T.; Minamino, Y.; Koizumi, Y.; Yamane, T.; Komatsu, M.; Kiritani, M. Microstructural Change of Ultrafine-Grained Aluminum during High-Speed Plastic Deformation. Mater. Sci. Eng. A 2003, 350, 108–116. [Google Scholar] [CrossRef]
  5. Roy, S.; Suwas, S.D.; Kumar, S.; Chattopadhyay, K. Microstructure and Texture Evolution during Accumulative Roll Bonding of Aluminium Alloy AA5086. Mater. Sci. Eng. A 2011, 528, 8469–8478. [Google Scholar] [CrossRef]
  6. Lei, W.; Yong, Y.; Yaming, W.; Ying, J. Effect of Nanocrystalline Surface and Iron-Containing Layer Obtained by SMAT on Tribological Properties of 2024 Al Alloy. Rare Met. Mater. Eng. 2015, 44, 1320–1325. [Google Scholar] [CrossRef]
  7. Wang, Y.M.; Ma, E. Three Strategies to Achieve Uniform Tensile Deformation in a Nanostructured Metal. Acta Mater. 2004, 52, 1699–1709. [Google Scholar] [CrossRef]
  8. Shahsavari, A.; Karimzadeh, F.; Rezaeian, A.; Heydari, H. Significant Increase in Tensile Strength and Hardness in 2024 Aluminum Alloy by Cryogenic Rolling. Procedia Mater. Sci. 2015, 11, 84–88. [Google Scholar] [CrossRef]
  9. Hassanpour, H.; Jamaati, R.; Hosseinipour, S.J. Effect of Gradient Microstructure on the Mechanical Properties of Aluminum Alloy. Mater. Charact. 2021, 174, 111023. [Google Scholar] [CrossRef]
  10. Huang, C.X.; Wang, Y.F.; Ma, X.L.; Yin, S.; Höppel, H.W.; Göken, M.; Wu, X.L.; Gao, H.J.; Zhu, Y.T. Interface Affected Zone for Optimal Strength and Ductility in Heterogeneous Laminate. Mater. Today 2018, 21, 713–719. [Google Scholar] [CrossRef]
  11. Wu, X.L.; Jiang, P.; Chen, L.; Zhang, J.F.; Yuan, F.P.; Zhu, Y.T. Synergetic Strengthening by Gradient Structure. Mater. Res. Lett. 2014, 2, 185–191. [Google Scholar] [CrossRef]
  12. Irmer, D.; Yildirim, C.; Sennour, M.; Esin, V.A.; Moussa, C. Effect of Second-Phase Precipitates on Deformation Microstructure in AA2024 (Al–Cu–Mg): Dislocation Substructures and Stored Energy. J. Mater. Sci. 2024, 59, 18978–19002. [Google Scholar] [CrossRef]
  13. Xu, P.; Luo, H.; Han, Z.; Zou, J. Tailoring a Gradient Nanostructured Age-Hardened Aluminum Alloy Using High-Gradient Strain and Strain Rate. Mater. Des. 2015, 85, 240–247. [Google Scholar] [CrossRef]
  14. Wu, X.; Tao, N.; Hong, Y.; Xu, B.; Lu, J.; Lu, K. Microstructure and Evolution of Mechanically-Induced Ultrafine Grain in Surface Layer of AL-Alloy Subjected to USSP. Acta Mater. 2002, 50, 2075–2084. [Google Scholar] [CrossRef]
  15. Akiyama, E.; Zhang, Z.; Watanabe, Y.; Tsuzaki, K. Effects of Severe Plastic Deformation on the Corrosion Behavior of Aluminum Alloys. J. Solid. State Electrochem. 2009, 13, 277–282. [Google Scholar] [CrossRef]
  16. Sun, Q.; Han, Q.; Xu, R.; Zhao, K.; Li, J. Localized Corrosion Behaviour of AA7150 after Ultrasonic Shot Peening: Corrosion Depth vs. Impact Energy. Corros. Sci. 2018, 130, 218–230. [Google Scholar] [CrossRef]
  17. Wen, L.; Wang, Y.; Zhou, Y.; Guo, L.X.; Ouyang, J.H. Iron-Rich Layer Introduced by SMAT and Its Effect on Corrosion Resistance and Wear Behavior of 2024 Al Alloy. Mater. Chem. Phys. 2011, 126, 301–309. [Google Scholar] [CrossRef]
  18. Liu, X.; Frankel, G.S. Effects of Compressive Stress on Localized Corrosion in AA2024-T3. Corros. Sci. 2006, 48, 3309–3329. [Google Scholar] [CrossRef]
  19. Chumaevskii, A.V.; Zykova, A.P.; Gusarova, A.V.; Guryanov, D.A.; Rubtsov, V.E.; Kolubaev, E.A. Regularities of Structure Formation in AA2024 Alloy During High-Intensity Plastic Deformation Under Conditions of Adhesion-Diffusion Friction Interaction. Russ. Phys. J. 2022, 65, 303–311. [Google Scholar] [CrossRef]
  20. Estrin, Y.; Vinogradov, A. Extreme Grain Refinement by Severe Plastic Deformation: A Wealth of Challenging Science. Acta Mater. 2013, 61, 782–817. [Google Scholar] [CrossRef]
  21. Navaser, M.; Atapour, M. Effect of Friction Stir Processing on Pitting Corrosion and Intergranular Attack of 7075 Aluminum Alloy. J. Mater. Sci. Technol. 2017, 33, 155–165. [Google Scholar] [CrossRef]
  22. Ilieva, M.; Radev, R. Effect of Severe Plastic Deformation by ECAP on Corrosion Behaviour of Aluminium Alloy AA 7075. Arch. Mater. Sci. Eng. 2016, 81, 55–61. [Google Scholar] [CrossRef]
  23. Asquith, D.T.; Yerokhin, A.L.; Yates, J.R.; Matthews, A. The Effect of Combined Shot-Peening and PEO Treatment on the Corrosion Performance of 2024 Al Alloy. Thin Solid Film. 2007, 516, 417–421. [Google Scholar] [CrossRef]
  24. Ye, Z.; Liu, D.; Li, C.; Zhang, X.; Yang, Z.; Lei, M. Effect of Shot Peening and Plasma Electrolytic Oxidation on the Intergranular Corrosion Behavior of 7A85 Aluminum Alloy. Acta Metall. Sin. Engl. Lett. 2014, 27, 705–713. [Google Scholar] [CrossRef]
  25. GB/T 16865-2013; General Rules for Sampling and Sample Preparation of Wrought Aluminum and Aluminum Alloys. China Standards Press: Beijing, China, 2013.
  26. Mariya Joseph, H.; Poornima, N. Synthesis and Characterization of ZnO Nanoparticles. Mater. Today Proc. 2019, 9, 7–12. [Google Scholar] [CrossRef]
  27. Zhao, Z.; Lin, J.; Xiao, Y.; Min, J. Effects of Grain Size and Dislocation Density on Thermally-Induced Martensitic Transformation of Nanocrystalline NiTi Alloys. J. Alloys Compd. 2024, 978, 173490. [Google Scholar] [CrossRef]
  28. GB/T 22639-2022; Test Method for Exfoliation Corrosion of Aluminum Alloy Products. China Standards Press: Beijing, China, 2022.
  29. Zhao, Y.L.; Yang, Z.Q.; Zhang, Z.; Su, G.Y.; Ma, X.L. Double-Peak Age Strengthening of Cold-Worked 2024 Aluminum Alloy. Acta Mater. 2013, 61, 1624–1638. [Google Scholar] [CrossRef]
  30. Wang, S.C.; Starink, M.J.; Gao, N. Precipitation Hardening in Al–Cu–Mg Alloys Revisited. Scr. Mater. 2006, 54, 287–291. [Google Scholar] [CrossRef]
  31. Feng, Z.; Yang, Y.; Huang, B.; Han, M.; Luo, X.; Ru, J. Precipitation Process along Dislocations in Al–Cu–Mg Alloy during Artificial Aging. Mater. Sci. Eng. A 2010, 528, 706–714. [Google Scholar] [CrossRef]
  32. Lee, B.-H.; Kim, S.-H.; Park, J.-H.; Kim, H.-W.; Lee, J.-C. Role of Mg in Simultaneously Improving the Strength and Ductility of Al–Mg Alloys. Mater. Sci. Eng. A 2016, 657, 115–122. [Google Scholar] [CrossRef]
  33. Li, H.; Xu, W.; Wang, Z.; Fang, B.; Song, R.; Zheng, Z. Effects of Re-Ageing Treatment on Microstructure and Tensile Properties of Solution Treated and Cold-Rolled Al–Cu–Mg Alloys. Mater. Sci. Eng. A 2016, 650, 254–263. [Google Scholar] [CrossRef]
  34. Huskins, E.L.; Cao, B.; Ramesh, K.T. Strengthening Mechanisms in an Al–Mg Alloy. Mater. Sci. Eng. A 2010, 527, 1292–1298. [Google Scholar] [CrossRef]
  35. Li, C.; Deng, B.; Dong, L.; Liu, X.; Du, K.; Shi, B.; Dong, Y.; Peng, F.; Zhang, Z. Effect of Zn Addition on the Microstructure and Mechanical Properties of As-Cast BCC Mg-11Li Based Alloys. J. Alloys Compd. 2022, 895, 162718. [Google Scholar] [CrossRef]
  36. Wu, X.; Yang, M.; Yuan, F.; Wu, G.; Wei, Y.; Huang, X.; Zhu, Y. Heterogeneous Lamella Structure Unites Ultrafine-Grain Strength with Coarse-Grain Ductility. Proc. Natl. Acad. Sci. USA 2015, 112, 14501–14505. [Google Scholar] [CrossRef] [PubMed]
  37. Chen, J.; Lv, L.; Zhen, L.; Dai, S. Precipitation Strengthening Model of AA 7055 Aluminium Alloy. Acta Met. Sin. 2020, 57, 353–362. [Google Scholar] [CrossRef]
  38. Zhu, Y.; Wu, X. Heterostructured Materials. Prog. Mater. Sci. 2023, 131, 101019. [Google Scholar] [CrossRef]
  39. Zhu, Y.; Wu, X. Perspective on Hetero-Deformation Induced (HDI) Hardening and Back Stress. Mater. Res. Lett. 2019, 7, 393–398. [Google Scholar] [CrossRef]
  40. Wu, X.; Jiang, P.; Chen, L.; Yuan, F.; Zhu, Y.T. Extraordinary Strain Hardening by Gradient Structure. Proc. Natl. Acad. Sci. USA 2014, 111, 7197–7201. [Google Scholar] [CrossRef] [PubMed]
  41. Nix, W.D.; Gao, H. Indentation Size Effects in Crystalline Materials: A Law for Strain Gradient Plasticity. J. Mech. Phys. Solids 1998, 46, 411–425. [Google Scholar] [CrossRef]
  42. Hansen, N.; Huang, X. Microstructure and Flow Stress of Polycrystals and Single Crystals. Acta Mater. 1998, 46, 1827–1836. [Google Scholar] [CrossRef]
  43. Wang, C.; Liu, X.; Song, Q.; Tian, K.; Fei, S.; Deng, H.; Shen, G. Effects of Ultrasonic Shot Peening Followed by Surface Mechanical Rolling on Mechanical Properties and Fatigue Performance of 2024 Aluminum Alloy. Eng. Fract. Mech. 2024, 311, 110538. [Google Scholar] [CrossRef]
  44. El Garchani, F.E.; Lgaz, H.; Kaya, S.; Lee, H.-S.; Ibrahim, S.M.; Chafiq, M.; Ko, Y.G.; Kabiri, M.R. Effects of Heat Treatment on the Corrosion Behavior and Mechanical Properties of Aluminum Alloy 2024. J. Mater. Res. Technol. 2023, 25, 1355–1363. [Google Scholar] [CrossRef]
  45. Liu, F.; Tu, Y.; Wang, Q.; Yang, W. Microstructure Evolution and Mechanical Behavior of 2024 Aluminum Alloy under Electric Pulse Treatment. J. Alloys Compd. 2025, 1010, 177237. [Google Scholar] [CrossRef]
  46. Goodarzy, M.H.; Arabi, H.; Boutorabi, M.A.; Seyedein, S.H.; Hasani Najafabadi, S.H. The Effects of Room Temperature ECAP and Subsequent Aging on Mechanical Properties of 2024 Al Alloy. J. Alloys Compd. 2014, 585, 753–759. [Google Scholar] [CrossRef]
  47. Huang, Y.J.; Chen, Z.G.; Zheng, Z.Q. A Conventional Thermo-Mechanical Process of Al–Cu–Mg Alloy for Increasing Ductility While Maintaining High Strength. Scr. Mater. 2011, 64, 382–385. [Google Scholar] [CrossRef]
  48. Sun, L.; Chen, L.; Guo, Y.; Zhao, G. Experimental Study and Optimization on Solution and Artificial Aging of Cold-Rolled 2024 Al Alloy Sheet. J. Mater. Eng. Perform. 2022, 31, 5419–5431. [Google Scholar] [CrossRef]
  49. Chen, Y.; Zhou, J.; Liu, C.; Wang, F. Effect of Pre-Deformation on the Pre-Corrosion Multiaxial Fatigue Behaviors of 2024-T4 Aluminum Alloy. Int. J. Fatigue 2018, 108, 35–46. [Google Scholar] [CrossRef]
  50. Huang, Y.; Robson, J.D.; Prangnell, P.B. The Formation of Nanograin Structures and Accelerated Room-Temperature Theta Precipitation in a Severely Deformed Al–4 wt.% Cu Alloy. Acta Mater. 2010, 58, 1643–1657. [Google Scholar] [CrossRef]
  51. Dovletoglou, E.; Skarvelis, P.; Stergiou, V.; Alexopoulos, N.D. Effect of Corrosion Exposure on the Mechanical Performance of 2024 Aluminum Alloy Electron Beam Welded Joints. Procedia Struct. Integr. 2018, 10, 73–78. [Google Scholar] [CrossRef]
  52. Horstemeyer, M.F.; Yang, N.; Gall, K.; McDowell, D.; Fan, J.; Gullett, P. High Cycle Fatigue Mechanisms in a Cast AM60B Magnesium Alloy. Fatigue Fract. Eng. Mater. Struct. 2002, 25, 1045–1056. [Google Scholar] [CrossRef]
  53. Hilpert, M.; Wagner, L. Corrosion Fatigue Behavior of the High-Strength Magnesium Alloy AZ 80. J. Mater. Eng. Perform. 2000, 9, 402–407. [Google Scholar] [CrossRef]
  54. Wang, Z.; Chen, P.; Li, H.; Fang, B.; Song, R.; Zheng, Z. The Intergranular Corrosion Susceptibility of 2024 Al Alloy during Re–Ageing after Solution Treating and Cold–Rolling. Corros. Sci. 2017, 114, 156–168. [Google Scholar] [CrossRef]
Figure 1. Schematic diagram of constrained deformation.
Metals 15 00177 g001
Figure 2. Uniaxial tensile specimen size drawing (Unit: mm).
Metals 15 00177 g002
Figure 3. (a) The curve of microhardness variation with aging time in each state; (b) Microhardness variation curves with distance from the center for different aging times under CD.
Metals 15 00177 g003
Figure 4. Metallographic and SEM images of different regions after SST and CD with PA: (ac) SEM image of the SST, CL, and DL; (df) Metallographic image of the SST, CL, and DL; (g) The overall metallographic structure diagram.
Metals 15 00177 g004
Figure 5. XRD results under different states: (a) XRD diffraction peak diagram; (b) Dislocation density in different states.
Metals 15 00177 g005
Figure 6. TEM images of CL: (a) Low-magnification bright field TEM image of CL, with inset showing a magnified view of a specific area; (b) Low-magnification bright field image of GPB zones in CL; (c) Magnified view of the area circled in red in (b) and the corresponding FFT diagram; (d) Inverse FFT transformation of (c).
Metals 15 00177 g006
Figure 7. TEM images of DL along the (001) Al direction: (ac) Low-magnification images showing dislocations and precipitate morphology; (d) HRTEM image of the precipitate indicated by the arrow in (c); (e) HRTEM and corresponding FFT image of the S/S′ phase; (f) Parameters of interplanar and atomic spacings in the S phase.
Metals 15 00177 g007
Figure 8. Schematic diagram of microstructure evolution during the CD + PA process.
Metals 15 00177 g008
Figure 10. Intergranular corrosion images under different conditions: (a) SST; (b) T6; (c) CD + PA.
Metals 15 00177 g010
Figure 11. Electrochemical corrosion results under different conditions: (a) Polarization curves; (b) Corrosion current vs. voltage.
Metals 15 00177 g011
Figure 12. Schematic of corrosion mechanisms: intergranular corrosion under different conditions.
Metals 15 00177 g012
Table 1. Chemical composition of AA2024 aluminum alloy (wt, %).
MgMnFeSiCuCrZnTiAl
4.510.540.30.0850.0150.0730.0540.03Bal
Table 2. Statistical diagrams illustrating the quantities of coarse phases, precipitated phases, and grain size distribution in SST, DL, and CL.
Region and StateSSTCL (CD + PA)DL (CD + PA)
Coarse phase density (number·cm−2)4.85 ± 0.3 × 1045.43 ± 0.2 × 10424.17 ± 0.5 × 10⁴
Rolling microstructure bandwidth (μm)62.13 ± 10.55 19.17 ± 5.78 11.22 ± 6.37
Dislocation density (1015 nm−2)0.961.622.09
Precipitate density (FA/number·μm−2)--449 ± 1241265 ± 335
Disclaimer/Publisher’s Note: The statements, opinions and data contained in all publications are solely those of the individual author(s) and contributor(s) and not of MDPI and/or the editor(s). MDPI and/or the editor(s) disclaim responsibility for any injury to people or property resulting from any ideas, methods, instructions or products referred to in the content.

