Article

Fatigue Damage Assessment in AL6XN Stainless Steel Based on the Strain-Hardening Exponent n-Value

by
Donovan Ramírez-Acevedo
,
Ricardo Rafael Ambriz
*,
Christian Jesús García
,
Cesar Mendoza Gómora
and
David Jaramillo
Instituto Politécnico Nacional CIITEC-IPN, Cerrada de Cecati S/N Col. Sta. Catarina, Azcapotzalco, Ciudad de México 02250, Mexico
*
Author to whom correspondence should be addressed.
Metals 2025, 15(5), 472; https://doi.org/10.3390/met15050472
Submission received: 8 March 2025 / Revised: 17 April 2025 / Accepted: 18 April 2025 / Published: 22 April 2025
(This article belongs to the Special Issue Fatigue of Metals and Welded Joints)

Abstract

:
The fatigue life curve was determined for the AL6XN stainless steel under strain-controlled Low Cycle Fatigue (LCF) tests. Additionally, a specific number of loading cycles were applied to new specimens made from the same AL6XN alloy batch to set an Accumulated Fatigue Damage (AFD) based on the Palmgren–Miner rule. The AFD was 0.25, 0.50 and 0.75; subsequently, these specimens were subjected to tensile tests. It was observed that all AFD specimens exhibited a yield strength increment with respect to the AL6XN material property, thus, it was similar to a strain-hardening mechanism. However, the stress–strain behavior and microstructure characterization showed a microvoid nucleation and growth mechanism that competed against the strain-hardening one. The fracture in the 0.75 AFD specimens was dominated by this microvoid-based mechanism. The experimental results indicated that the strain-hardening exponent (n-value) and electrical resistivity ( ρ -value) were consistently modified by the AFD in all the specimens, with an inverse linear relationship for the n-value and a nonlinear increasing behavior for the ρ -value.

1. Introduction

The fatigue of materials is defined as progressive, permanent and localized mechanical damage due to the application of cyclic loadings [1], which generates a dissipative energy mechanism in the material that partially led to fatigue crack nucleation and growth process and, ultimately, can result in the fracture of the component. Commonly, the fatigue process is divided into three stages; the first stage corresponds to fatigue damage accumulation and microcrack nucleation, the second stage corresponds to the coalescence of microcracks and the stable fatigue crack propagation process, and third stage corresponds to an unstable crack propagation regimen and final fracture [2].
It is complicated to term the fatigue damage stage because too many factors are involved, such as microcracks initiation near or at singularities that lie on or just below the surface (scratches, sharp changes, pits, inclusions, etc.) and atomic debonding. Even in a flaw-free material with a highly polished surface and no stress concentrators, a fatigue crack may arise from the localized plastic deformation due to dislocations motion, leading to slip steps on the surface [3].
Continuum damage mechanics studies material degradation by monitoring material variable changes [4] based on a D parameter that considers the effective stress σ ~ concept (Equation (1)), first introduced by Kachanov and later Rabotnov [5]. The D parameter takes into account the following limits: the initial condition of an unstressed material corresponds to D = 0, and D = Dc at failure (commonly Dc = 1) [5].
σ ~ = σ 1 D
Since the effective stress σ ~ concept introduction, different parameters have been used to quantify the fatigue damage, such as material’s density, elastic modulus, ultrasonic waves, micro-hardness and electrical potential [5,6,7,8]. Likewise, the AFD involves the presence of plastic strain; thus, some attempts have been made to monitor the localized strains in components subjected to fluctuating loads [9]. Inspired by strain measurements, Socha [10,11] proposed a new method for the damage process evaluation based on inelastic strain observations during cyclic loading. In a general way, any influence of a measurable physical or mechanical property of the material can be used as a basis for the AFD evaluation. In 2022, Fredrik Bjorheim et al. [12] made a summary of several proposed techniques to detect the AFD prior to the macroscopic crack initiation, as well as during fatigue crack growth; the advantages and limits of each of these techniques were analyzed in the literature [13].
Regarding the mechanical properties obtained from stress–strain curves, some researchers have compared the cyclic stress–strain behavior against the quasi-static behavior to analyze if materials undergo cyclic hardening or softening [14,15]. Niu et al. [16] proposed an H parameter (Equation (2)) to evaluate the AFD from fatigue strain-controlled tests. Their work was based on the hardening law of cyclically hardened metal through the change of stress range. This H parameter can be determined by:
H = Δ σ Δ σ 0 Δ σ
where at any fatigue cycle, a zero-reference point of cyclical hardening can be chosen ( Δ σ 0 ) to compare against the actual stress range. As the material hardens, the H parameter provides an evaluation of the AFD.
The usage of several different parameters and approaches for the AFD assessment of mechanical components, where either material variables or properties have been proposed to estimate fatigue failure, reflects a controversy that remains open. This manuscript follows a rigorous experimental method for the fatigue testing of AL6XN alloy and the introduction of a specific index of AFD. The results provide novel insights into the physical significance of fatigue damage. Among the different material properties analyzed, it was found that the strain-hardening exponent n-value and the electrical resistivity were the best alternatives used for the AFD assessment.

2. Materials and Methods

A cold-rolled AL6XN plate (700 × 300 × 3 mm) from ATI Flat Rolled Products (Pittsburgh, PA, USA) was used in this study as the analyzed material. This specific material was previously characterized by the authors to verify its chemical composition, grain structure, hardness and stress–strain behavior during the tensile test [13]. That stress–strain behavior previously reported in the literature [17,18] will be used in this study as reference for the analysis of additional tensile test results of the same AL6XN material, but with an initial condition corresponding to a specific AFD generated under strain-controlled fatigue tests. Flat-sheet specimens were machined according to the dimensions shown in Figure 1 [19].
The specimens were obtained perpendicular to the rolling direction, which resulted in a less tortuous path trajectory for the crack growth process for any fatigue crack produced by cyclic loading. The specimens were mirror polished at the reduced section to obtain a mean surface roughness lower than 0.2 μm. A servo-hydraulic test system, MTS Landmark 370.10 from Eden Prairie, Minnesota, USA, equipped with a load cell of 100 kN and a dynamic extensometer with a gauge length and strain range of 10 mm and ±15%, respectively, was used to perform the fatigue tests. Five strain amplitudes ( ε a = 0.002, 0.004, 0.006, 0.008 and 0.01) were established to determine the fatigue behavior of the AL6XN material in terms of the strain amplitude ε a versus the number of cycles to failure N f . Three samples for each ε a were tested. A triangular waveform with a strain ratio Rε = −1 was used to apply the strain amplitude loads. To obtain a constant strain rate of ε ˙ = 0.016 s−1 during the test, the frequency f was adjusted as a function of the ε a by applying Equation (3). The failure criterion for the fatigue test was established at a 15% drop in the force from the stable strain hysteresis loop.
f = ε ˙ 4 ε a
To obtain the material parameters for the constitutive equations, the results were fitted to the Manson–Coffin (Equation (4)) and Basquin’s relationships (Equation (5)).
ε p a = ε f 2 N f c
σ a = σ f 2 N f b
From the ε a N f curves obtained for the AL6XN specimens, a fatigue damage condition was defined as a direct function of the number of cyclic loads. The Palmgren–Miner rule was used to determine the AFD:
D = i = 1 k n i N i
where D is the fatigue damage, n i and N i are the applied loading cycles and applied loading cycles to failure under the i-th constant amplitude loading level, respectively, and k is the number of constant amplitude loading levels. To analyze the influence of AFD on the true stress–strain behavior of the AL6XN material resulting from a tensile test, the flat-sheet specimens were subjected to cyclic loads to generate an AFD of 0.25, 0.50 and 0.75. Three strain amplitude levels were used for each AFD, which were 0.004, 0.006 and 0.008. Different mechanical properties were analyzed, such as the strain-hardening exponent n-value and strength coefficient K, and compared against the reported values for the AL6XN material [13]. Further, a scanning-electron microscope was used to analyze the surface of the AFD specimens generated with ε a = 0.008 and subjected to an interrupted tensile test at the onset of necking, i.e., at maximum tensile strength and before the final fracture of the specimen. The tested section in these specimens was also ground and mirror polished to a mean surface roughness lower than 0.2 μm, where no evidence of any damage source was present, and no scratches, cracks or voids were present before the loading cycles and interrupted tensile test.
In addition, the influence of the AFD on the electrical resistivity of the AL6XN material was analyzed by performing resistance measurements. It used an electrical arrangement consisting of the double Kelvin bridge method, which has been previously used to analyze the fatigue damage as reported in the literature [20,21]. The resistance measurements were realized for the positive and negative directions of the electrical current flow according to Equation (7). The flat-sheet specimens analyzed were those subjected to a constant strain amplitude of 0.004 with the AFD of 0.25, 0.5, and 0.75. The sampling length was 10 mm, corresponding to the reduced length section in the flat-sheet specimens (Figure 1). The electrical resistivity ρ was defined as a function of the specimen resistance R, cross-section area A, and sampling length L, as presented in Equation (8).
R = V + V + I + + I
ρ = R   A L
For this experimental setup (Figure 2), an HP® triple output power supply model E3631A was used to provide an initial voltage of 1.42 V with direct current (DC) mode operation. The response of the intensity of the current p0I and electric potential difference V generated by the flat-sheet specimen in the region of interest (ROI) was measured using a BK precision digital multimeter model 5492C and a Fluke® digital multimeter model 289, respectively.

3. Results

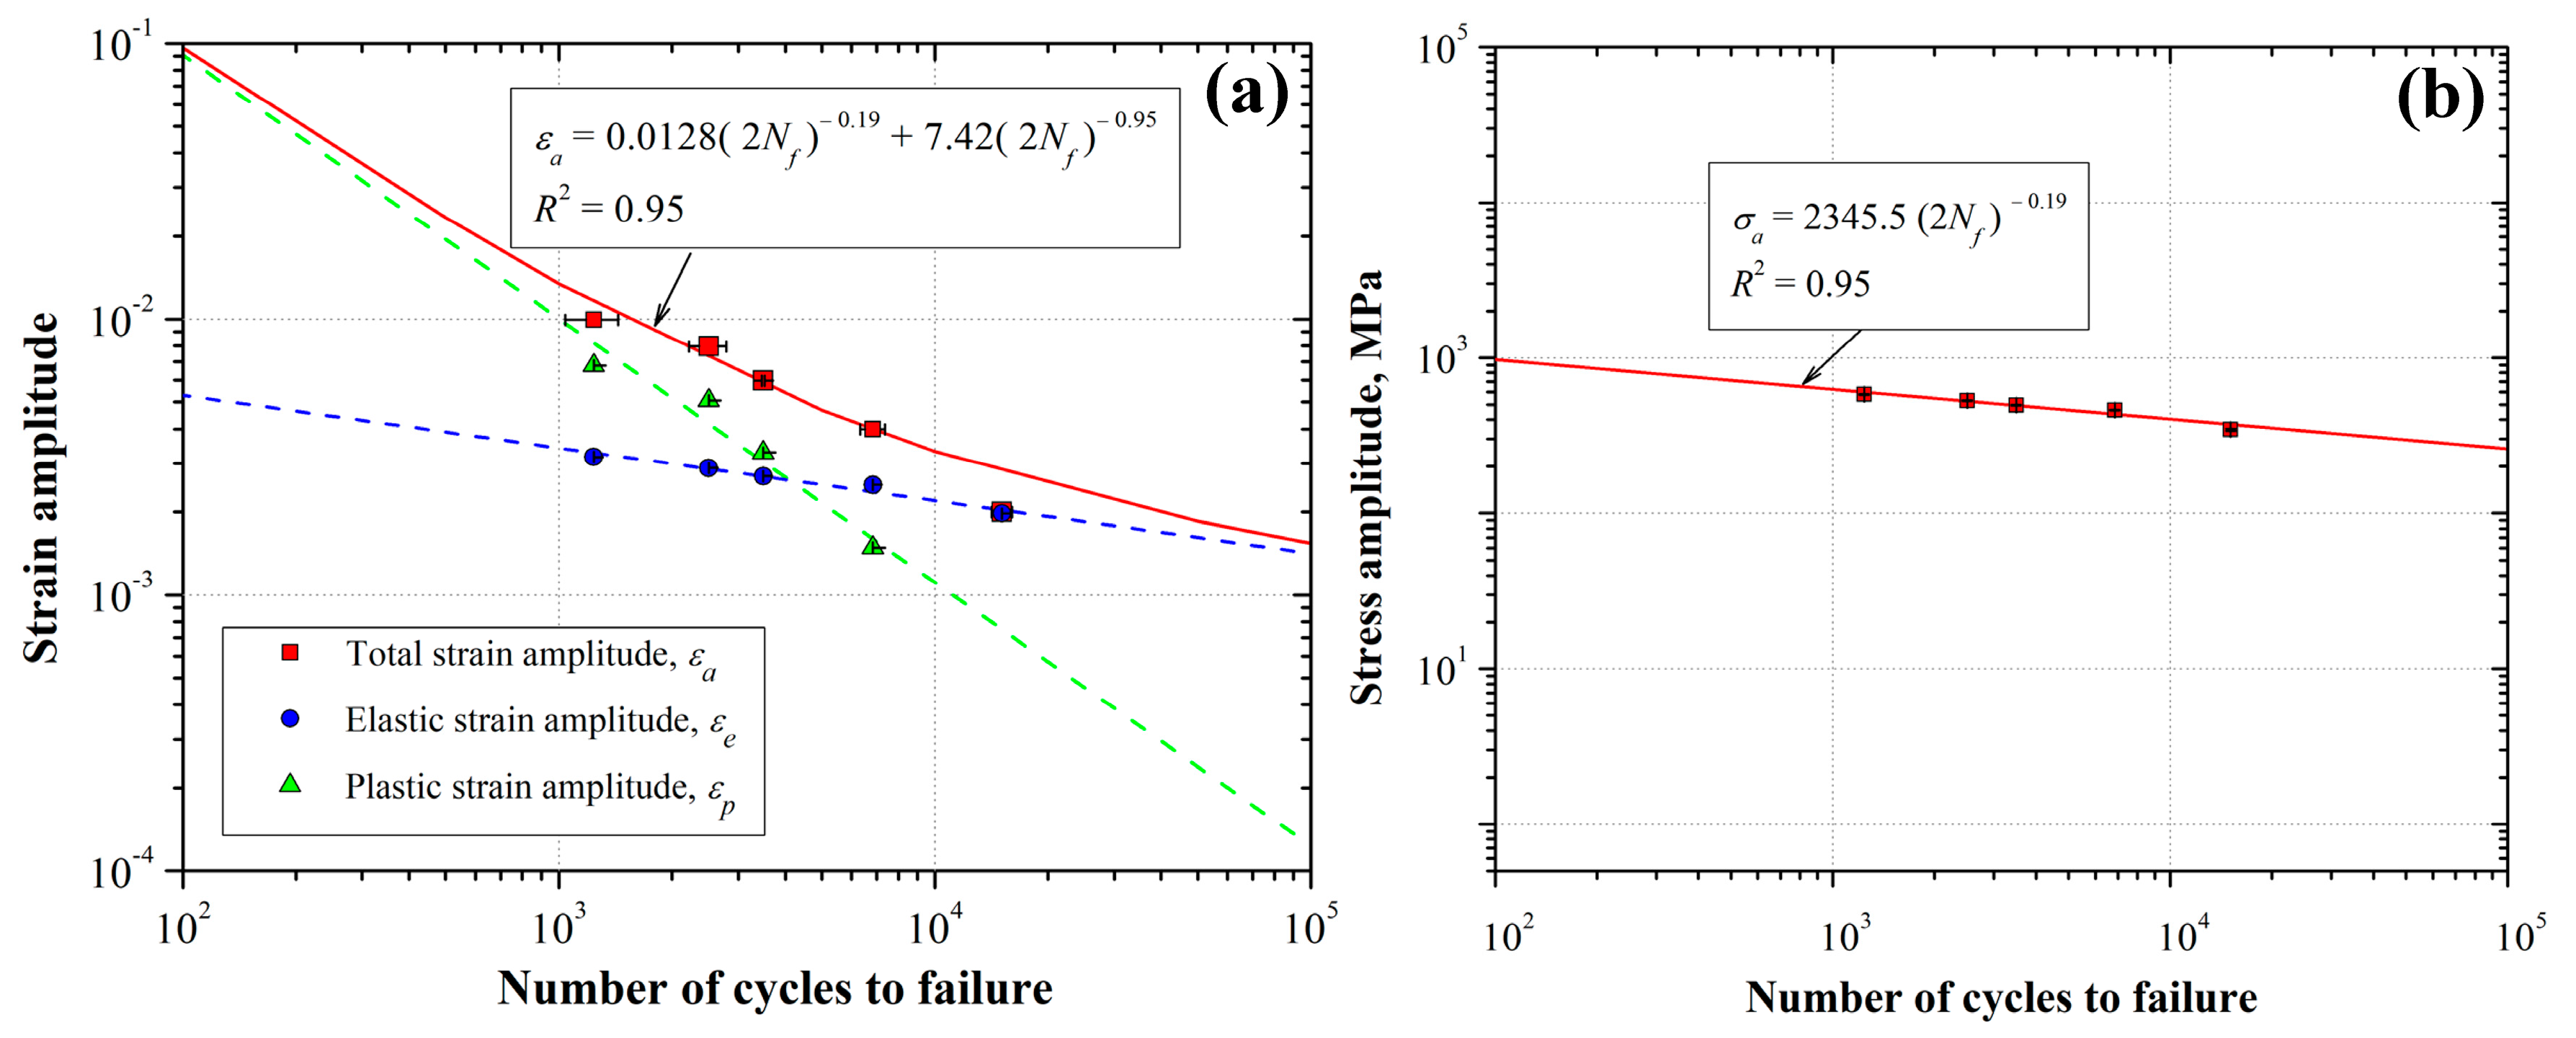
3.1. Strain-Controlled Fatigue Testing

The data analysis of the fatigue testing was done following the guidelines established in ISO 12106:2017 [19] and ASTM E739–23 [22] standards, where the Basquin Equation (5) is used to determine the elastic strain component, the Manson–Coffin Equation (4) for the plastic strain component and the total strain is calculated by the Morrow model (Equation (9)). Figure 3a,b shows the strain- and stress-life curves (εa, σa vs. Nf). From these curves, it was observed that for the lowest strain amplitude level (εa = 0.002), the total strain was essentially elastic without a plastic component (Figure 3a). The corresponding number of cycles to failure was ~15 k cycles, and the stress amplitude was ~370 MPa (Figure 3b). The experimental material parameters that fit the Manson–Coffin and Basquin equations for the AL6XN material were also presented in Figure 3a,b.
ε a = ε e a + ε p a = σ f E 2 N f b + ε f 2 N f c
From the values of the strain and stress amplitudes based on the strain-controlled fatigue characterization, the hysteresis loops, belonging to the middle of the fatigue life, were obtained (Figure 4a). In addition, the maximum stress reached at each strain amplitude level was compared against the cyclic stress–strain curve, obtained from the Ramberg–Osgood model (Equation (10)). Likewise, to verify the fitting of the maximum stress levels from the hysteresis loops into the cyclic stress–strain curve, five different experimental values of the strain amplitude were substituted into Equation (10), and the stress amplitude was calculated. Also, the behavior of the quasi-static stress–strain curve from [13] was presented for comparison (Figure 4b).
ε a = σ a E + σ a K 1 n
As can be seen in Figure 4a, the maximum stress values for each strain amplitude level fit the trend of the Ramberg–Osgood model, indicating a good accuracy in the approximation model. From Figure 4b, it was observed that the cyclic stress–strain behavior presented an increase in the yield and maximum stresses, which means that the material hardened with the repeated cyclic loads. As a reference, the yield strength from the standard tensile test (quasi-static behavior) was around 358 MPa [13]. On the other hand, the cyclic resistance coefficient K′ (789.68 MPa) and the cyclic strain-hardening exponent n′ (0.08), determined by the Hollomon power-law Equation (11), decreased compared to those obtained in [13] for the quasi-static behavior (K = 1644.1 and n = 0.39), i.e., the material lost its capability to harden as the stress level increases. True values of stress σ ~ and plastic strain ε ~ p are used in the Hollomon equation. Static and cyclic K and n values were determined following the standard guidelines [23].
σ ~ = K   ε ~ P n

3.2. Tensile Tests of Specimens with AFD

Figure 5 shows the true stress–strain behavior resulting from the tensile tests on the specimens with an AFD of 0.25 (Figure 5a), 0.50 (Figure 5b) and 0.75 (Figure 5c). As previously mentioned, three strain amplitude levels were used ( ε a = 0.004, 0.006 and 0.008) to reach each of the AFD. Additionally, Figure 5 presents the referenced true stress–strain behavior for the AL6XN alloy [13]. For all the cases, it was observed that the AFD generated a decrease in the ductility of the specimens with respect to the referenced behavior. For the 0.25 and 0.50 AFD specimens, a similar reduction of one-half in the ductility was observed with minimal differences between the different applied strain amplitude levels. In the 0.75 case of AFD, the ductility reduction was also influenced by the strain amplitude level. The lowest elongation value was presented for the case with an AFD generated with a strain amplitude level of ε a = 0.006. It decreased from a true strain value of 0.48 corresponding to the specimen without damage to a value of 0.16 in the damaged specimen, representing a reduction of around three-quarters of the ductility. The ductility reduction observed in the results of Figure 5a–c was accompanied by an increase in the material’s yield strength. This phenomenon is explained by the material strain-hardening mechanism, which produces a material strength increment and a decrease in ductility. However, the specimens with an AFD generated with a strain amplitude level of ε a = 0.008 exhibited an unusual trend, because it was expected to obtain larger true stress values than the other strain amplitude levels ( ε a = 0.006 and 0.004), but this was not the case. Actually, these AFD specimens with ε a = 0.008 exhibited the lowest response to the strain-hardening mechanism. It was likely that the applied strain amplitude level, which was the higher among the three different values used, corresponded to a critical saturation region where the plastic strain accumulation during the fatigue test produced the formation, growth and coalescence of micro-cracks that dominated the tensile test failure. The evolution of these micro-cracks resulted in a reduction of the effective cross-sectional area of the specimens. This could be a competitive mechanism for the strain-hardening one during the tensile tests of the AFD specimens. The micro-cracks’ evolution will be analyzed later in the present manuscript. Also, it is important to mention that while the yield strength of the material increased for larger AFD, the ductility reduction resulted in ultimate tensile strength values that did not increase with respect to the reference value of the material without fatigue damage. Figure 5d presents a comparison of the true stress–strain behavior of the AFD specimens generated with the strain amplitude level of ε a = 0.008. As previously mentioned, there was a decrease in the ductility for the AFD specimens with respect to the reference specimen behavior. The specimens with an AFD of 0.25 and 0.50 presented a similar one-half reduction in ductility, while the specimen with a 0.75 fatigue damage presented an even larger reduction in ductility up to around a strain of 0.18. Also, it was observed that larger AFD conditions resulted in larger material yield strengths.
With respect to the resistance coefficient K, an increase was observed in the early stages of the AFD (0.25) when it was compared against the value provided by the reference specimen previously reported in the literature [13]. Subsequently, the K value presented a decrease as the AFD increased to 0.50 and 0.75 (Figure 6a). This behavior can also be explained by the material strain-hardening mechanism. During the early stages of AFD, the material stress increases; as the AFD continues, the difference between the maximum stress σ m a x and the yield stress σ 0.2 is lower, causing the K value to be lower. Regarding the strain-hardening exponent n-value (Figure 6b), it was observed that there was a decrease in this property as the AFD increased without dependence upon the strain amplitude level. This reduction in the n-value was a direct result of the applied cyclic loadings and can be related to a reduction in the hardening capability as the cyclic plastic strain accumulates. For all the tested tensile specimens, after being fatigued, the strain-hardening exponent n-value decreased approximately 20% when the AFD was 0.25. For an AFD of 0.5, the decrease in the n-value was around 56% and continued to decrease close to 70% when the AFD was 0.75, in comparison with the reference value in the material characterization without damage [13].

3.3. Relationship Between Mechanical and Electrical Properties of AFD Specimens

Regarding the electrical resistivity ρ measurements, Figure 7 presents the results of ρ as a function of the AFD. The reference value for the specimen without AFD is also presented in Figure 7. An increment was observed in ρ as the AFD increased. This phenomenon can be related to the change in the microstructure of the material, where the application of cyclic loads caused an increase in the density of dislocations, which began to pile up, creating an obstacle for the passage of the electric current. This phenomenon had been reported in other works [20,21].
Furthermore, by plotting the observed changes in the strain-hardening exponent n-value against the electrical resistivity ρ during the AFD, a material curve that provides a relationship between mechanical and electrical properties was obtained. Figure 8 presents a log-log plot of n as a function of ρ, where the corresponding fit equation is provided. The correlation coefficient was 0.92 R 2 . This material curve indicated that the strain-hardening exponent decreased as the electrical resistivity increased. This correlation between mechanical and electrical properties would be useful within the assessment of structural integrity and fatigue damage evaluation. The evaluation of mechanical damage based on electrical properties has already been reported in the literature [20,21,24].

3.4. Fatigue Damage Assessment

Derived from the observed change in the strain-hardening exponent n-value as the AFD increased, a revision of the damage variable D can be established. Starting from the premise that a material without AFD corresponds to D = 0, and a material that has reached a fatigue failure corresponds to D = 1, the variable that quantifies the damage, based on the decrease in the strain-hardening exponent n-value, could be stipulated as:
D = 1 n ¯ n
where:
n ¯ = strain-hardening exponent n-value of a material with AFD,
n = strain-hardening exponent n-value of a material without AFD.
Several material parameters have been reported to evaluate the damage mechanics, such as the elastic modulus or tensile strength [25,26]. However, the strain-hardening exponent n-value has not been reported as a used material parameter to evaluate the mechanical damage. Figure 9 shows the use of Equation (12) with the data obtained during the tensile tests on the AFD specimens at different strain amplitude levels. The x-axis corresponds to the n ¯ value obtained at the different stages of AFD. The y-axis is the result of the substitution of values to determine the variable D . The trend of the graph seems to be linear regardless of the strain amplitude level used.
Figure 10 presents the surface condition of the AFD specimens generated with ε a = 0.008 and subjected to the interrupted tensile tests. The surface exhibited an important quantity and size of defects such as micro-cracks, micro-voids and fatigue striations. The 0.75 AFD case exhibited larger metrics for the defects (quantity and size), while the 0.25 AFD case presented smaller defect metrics. Figure 11 exhibits a zoom with a larger scale for the defects in Figure 10. In all AFD cases, striations were presented as a result of the imposed loading cycles for the initial AFD condition of the specimens. The defects were clearly resolved at this magnification, and it was verified that the 0.75 AFD specimens presented the larger metrics for the defects, while the 0.25 AFD specimens presented smaller metrics. The same dimension condition was present in the case of micro-voids.

4. Conclusions

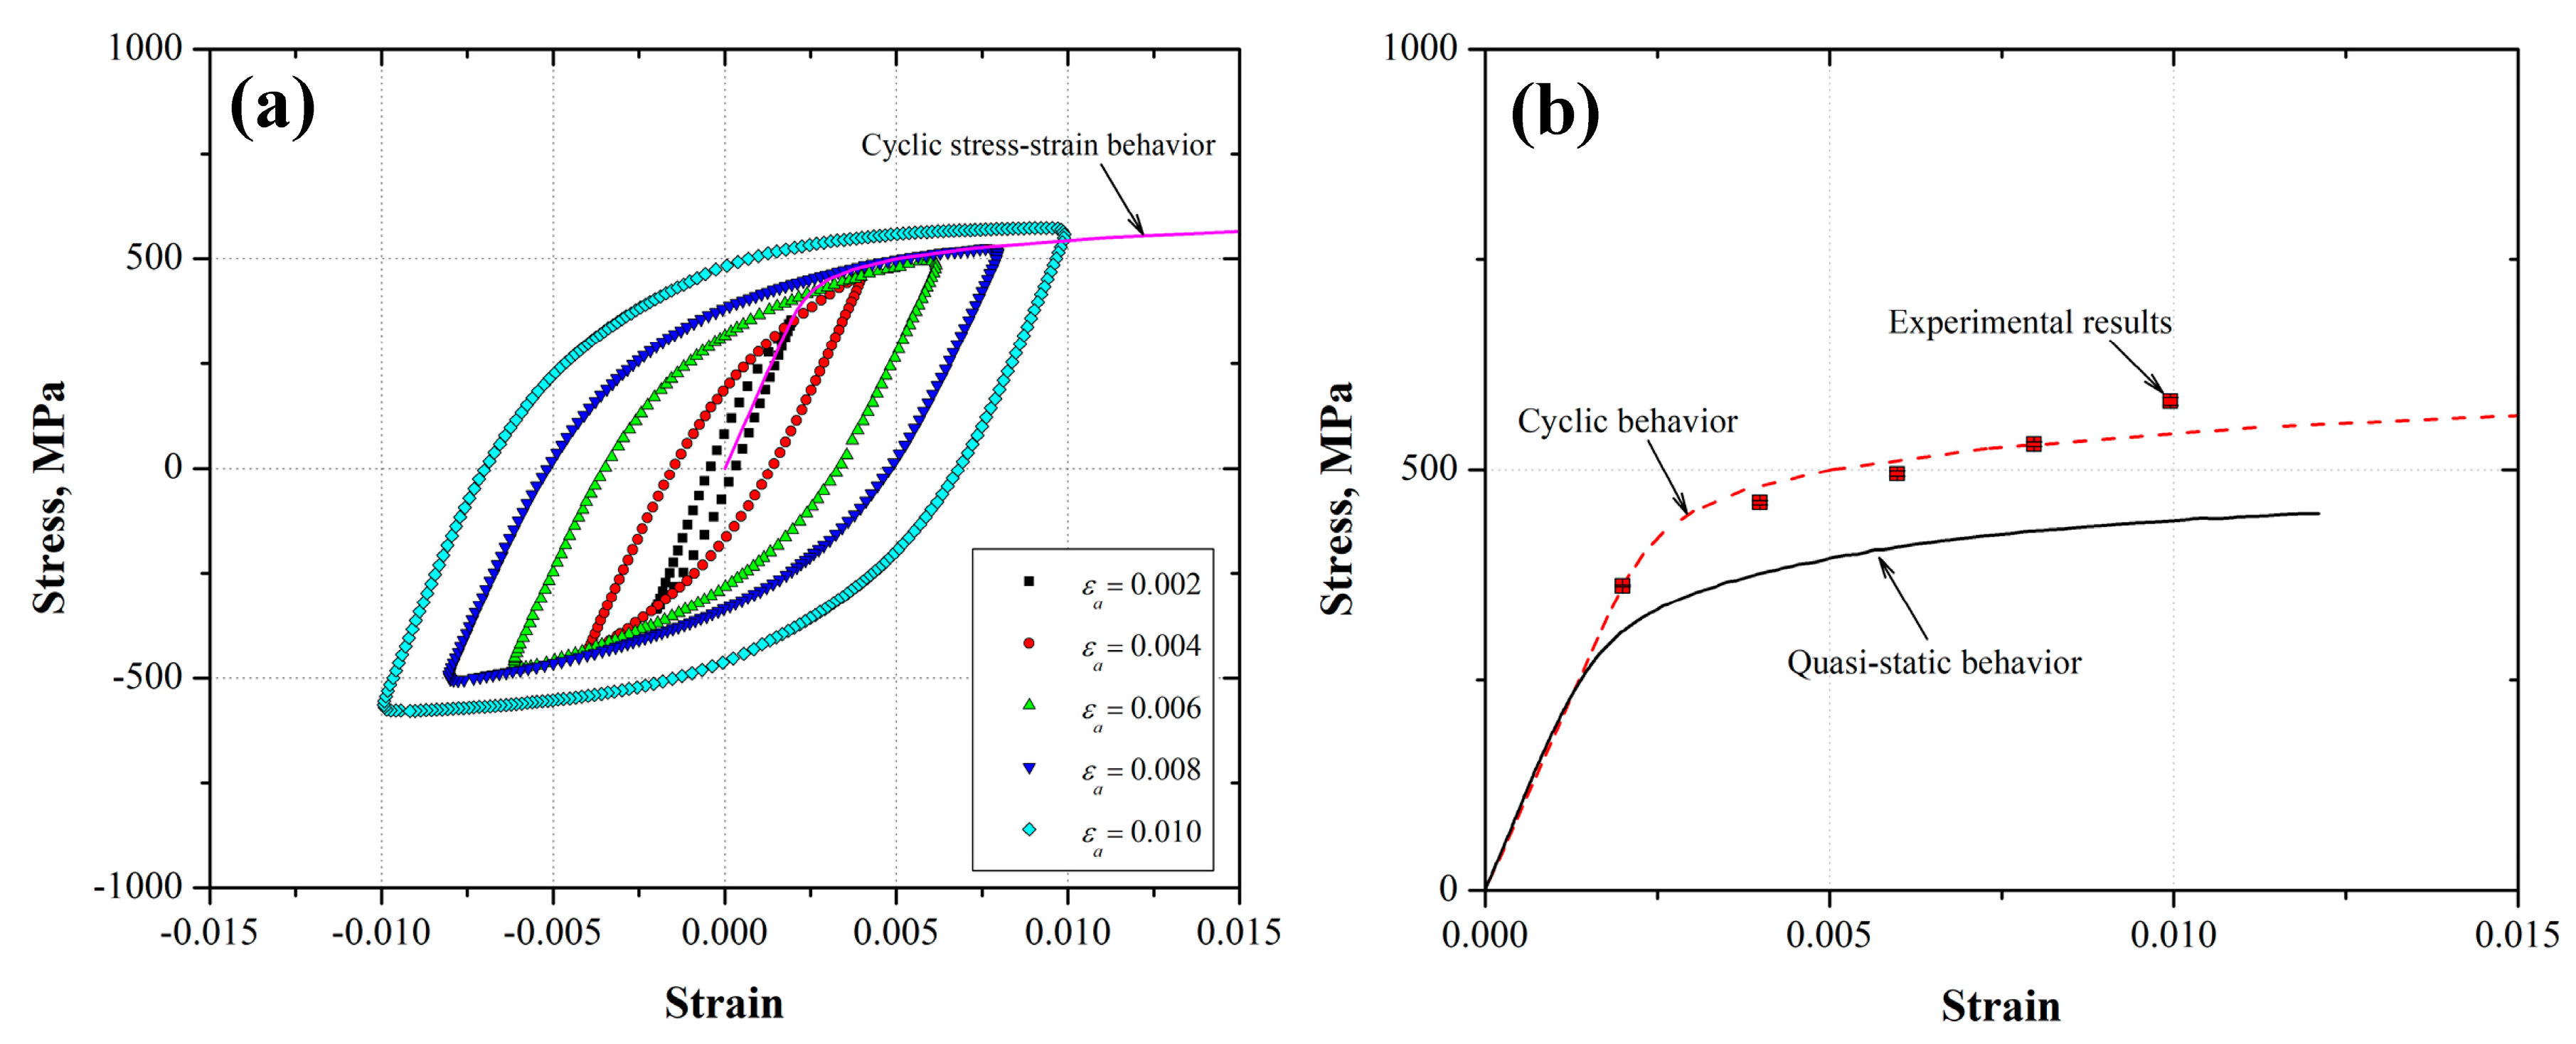
  • The LCF data revealed that the AL6XN stainless steel material exhibited a cyclic true stress–strain behavior with larger strength values than the corresponding one from the tensile test reference values, i.e., the strain-hardening exponent n-value. This corresponds to a hardening cyclic mechanism. This cyclic behavior was determined based on the stable hysteresis loops with different strain amplitude levels applied ( ε a = 0.002, 0.004, 0.006, 0.008 and 0.01). The cyclic yield strength was around 500 MPa, while the reference values were around 358 MPa.
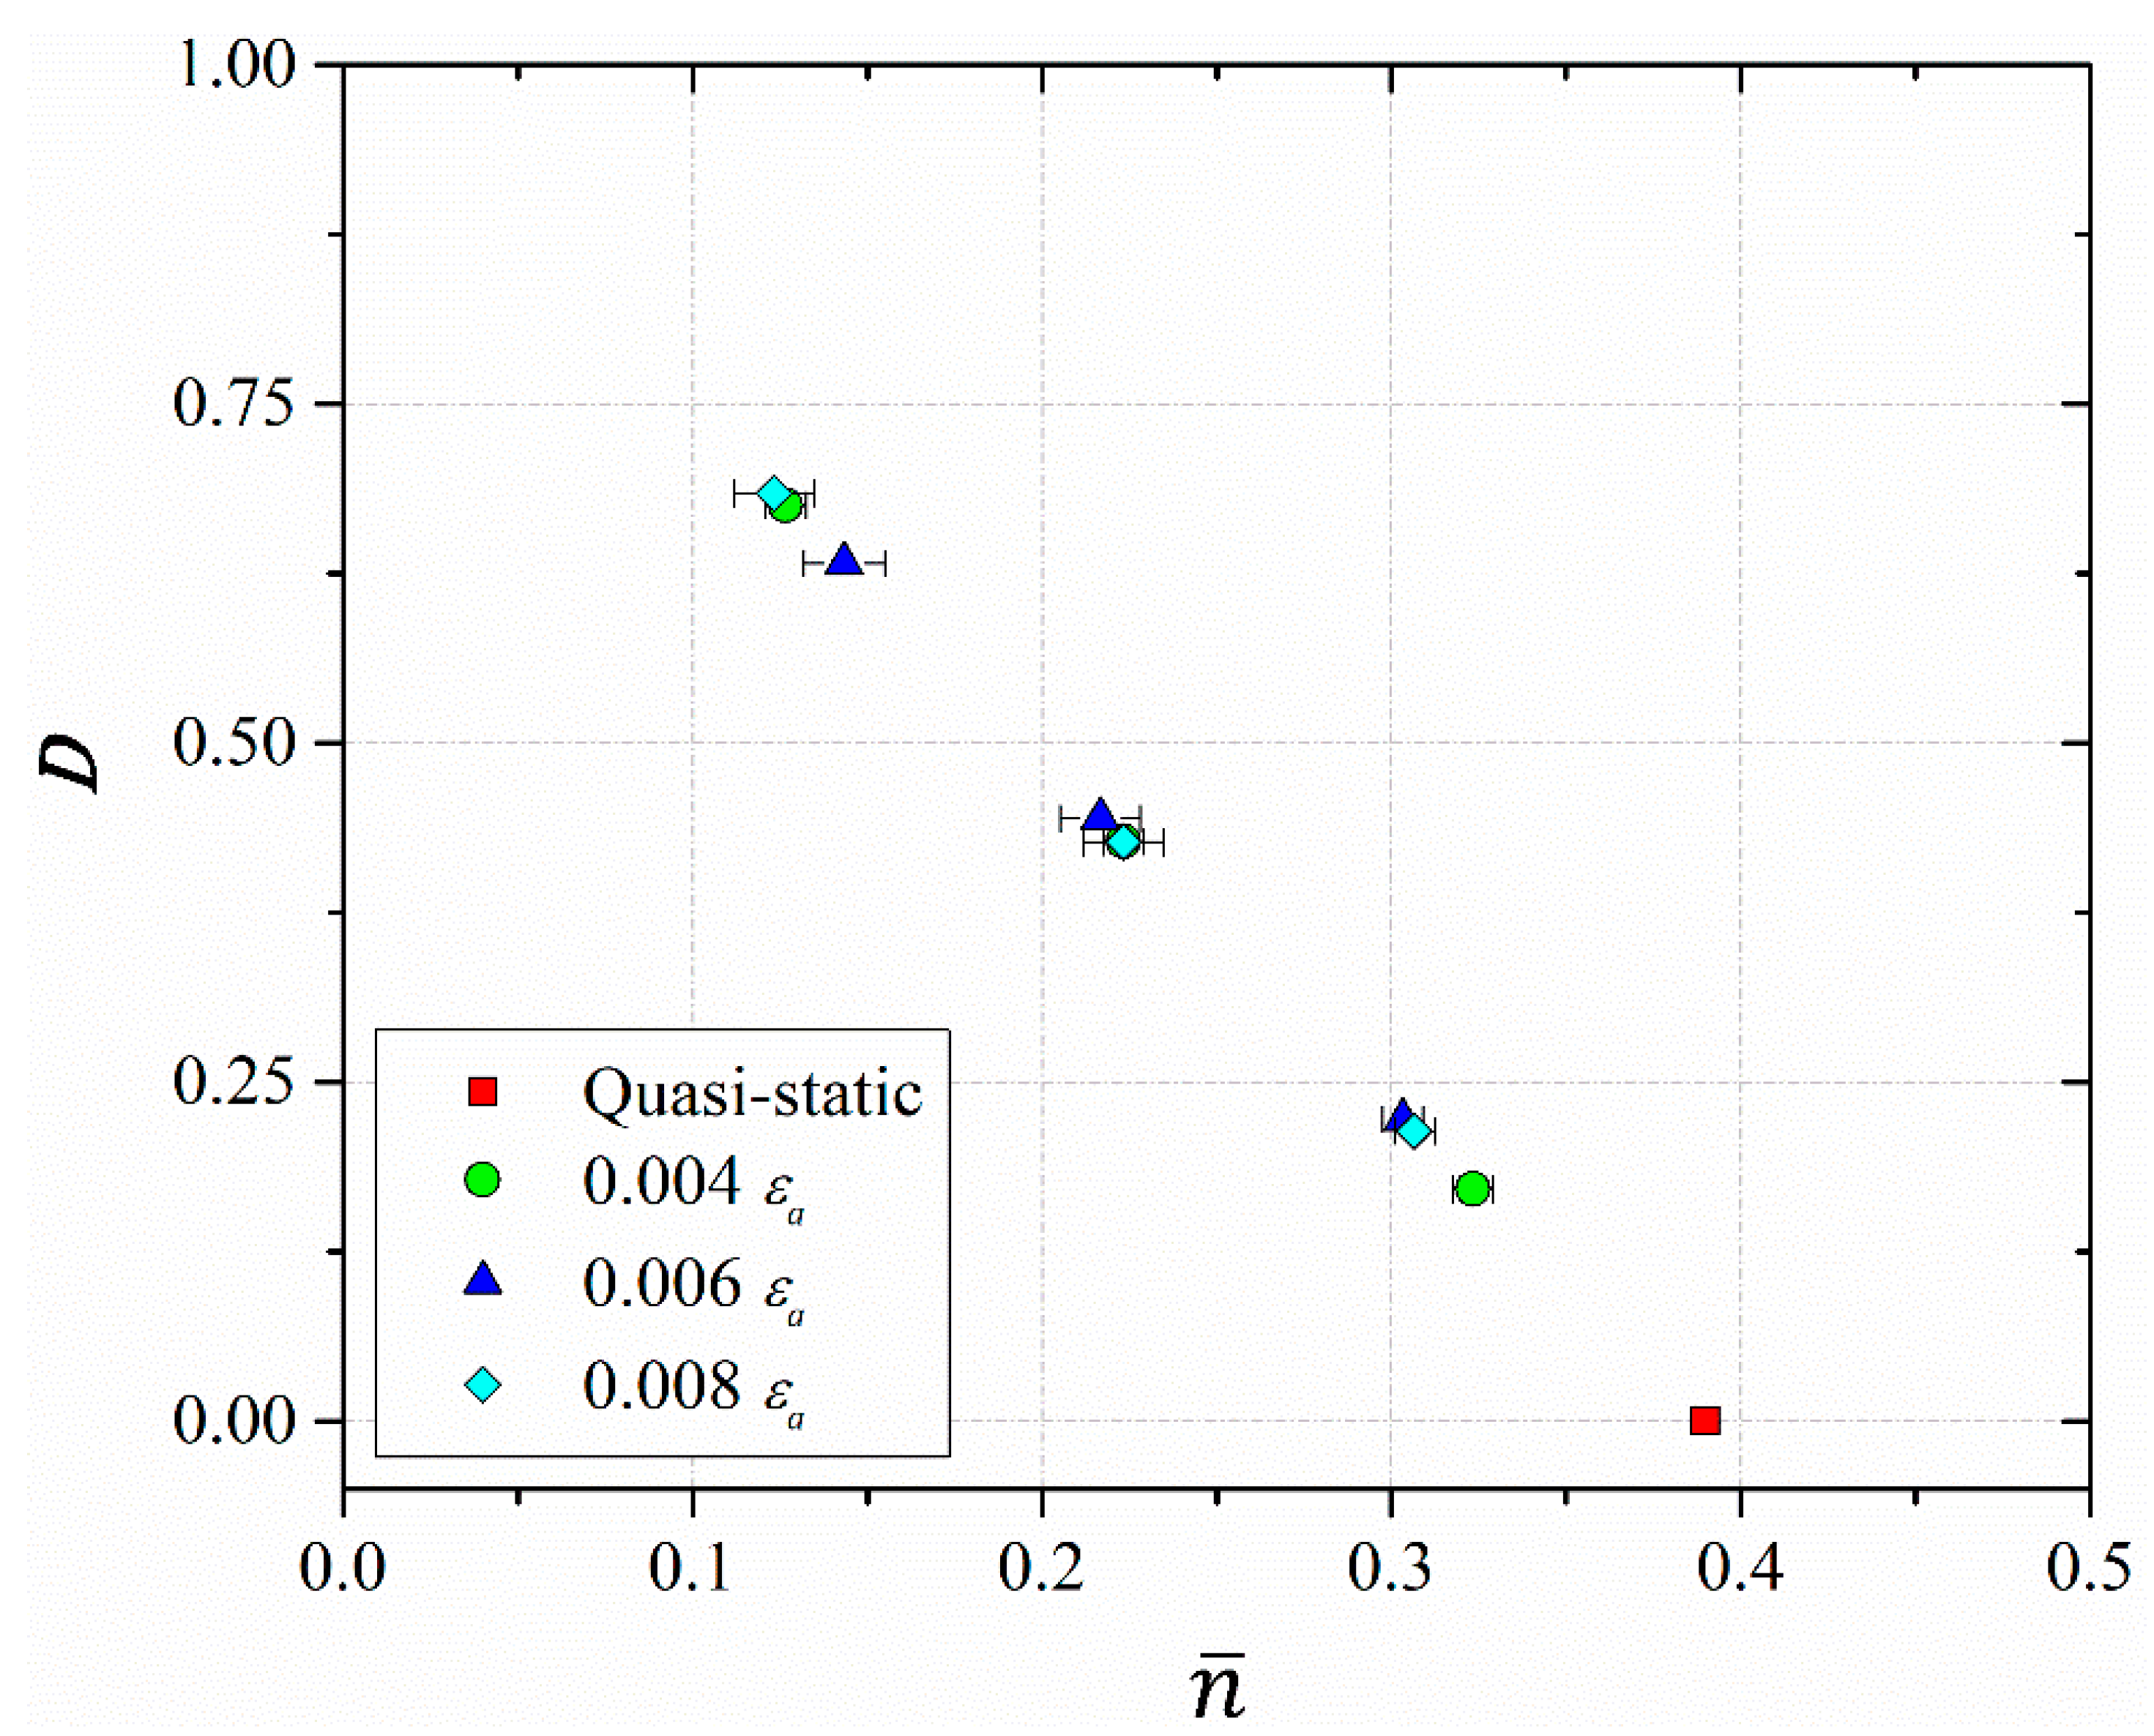
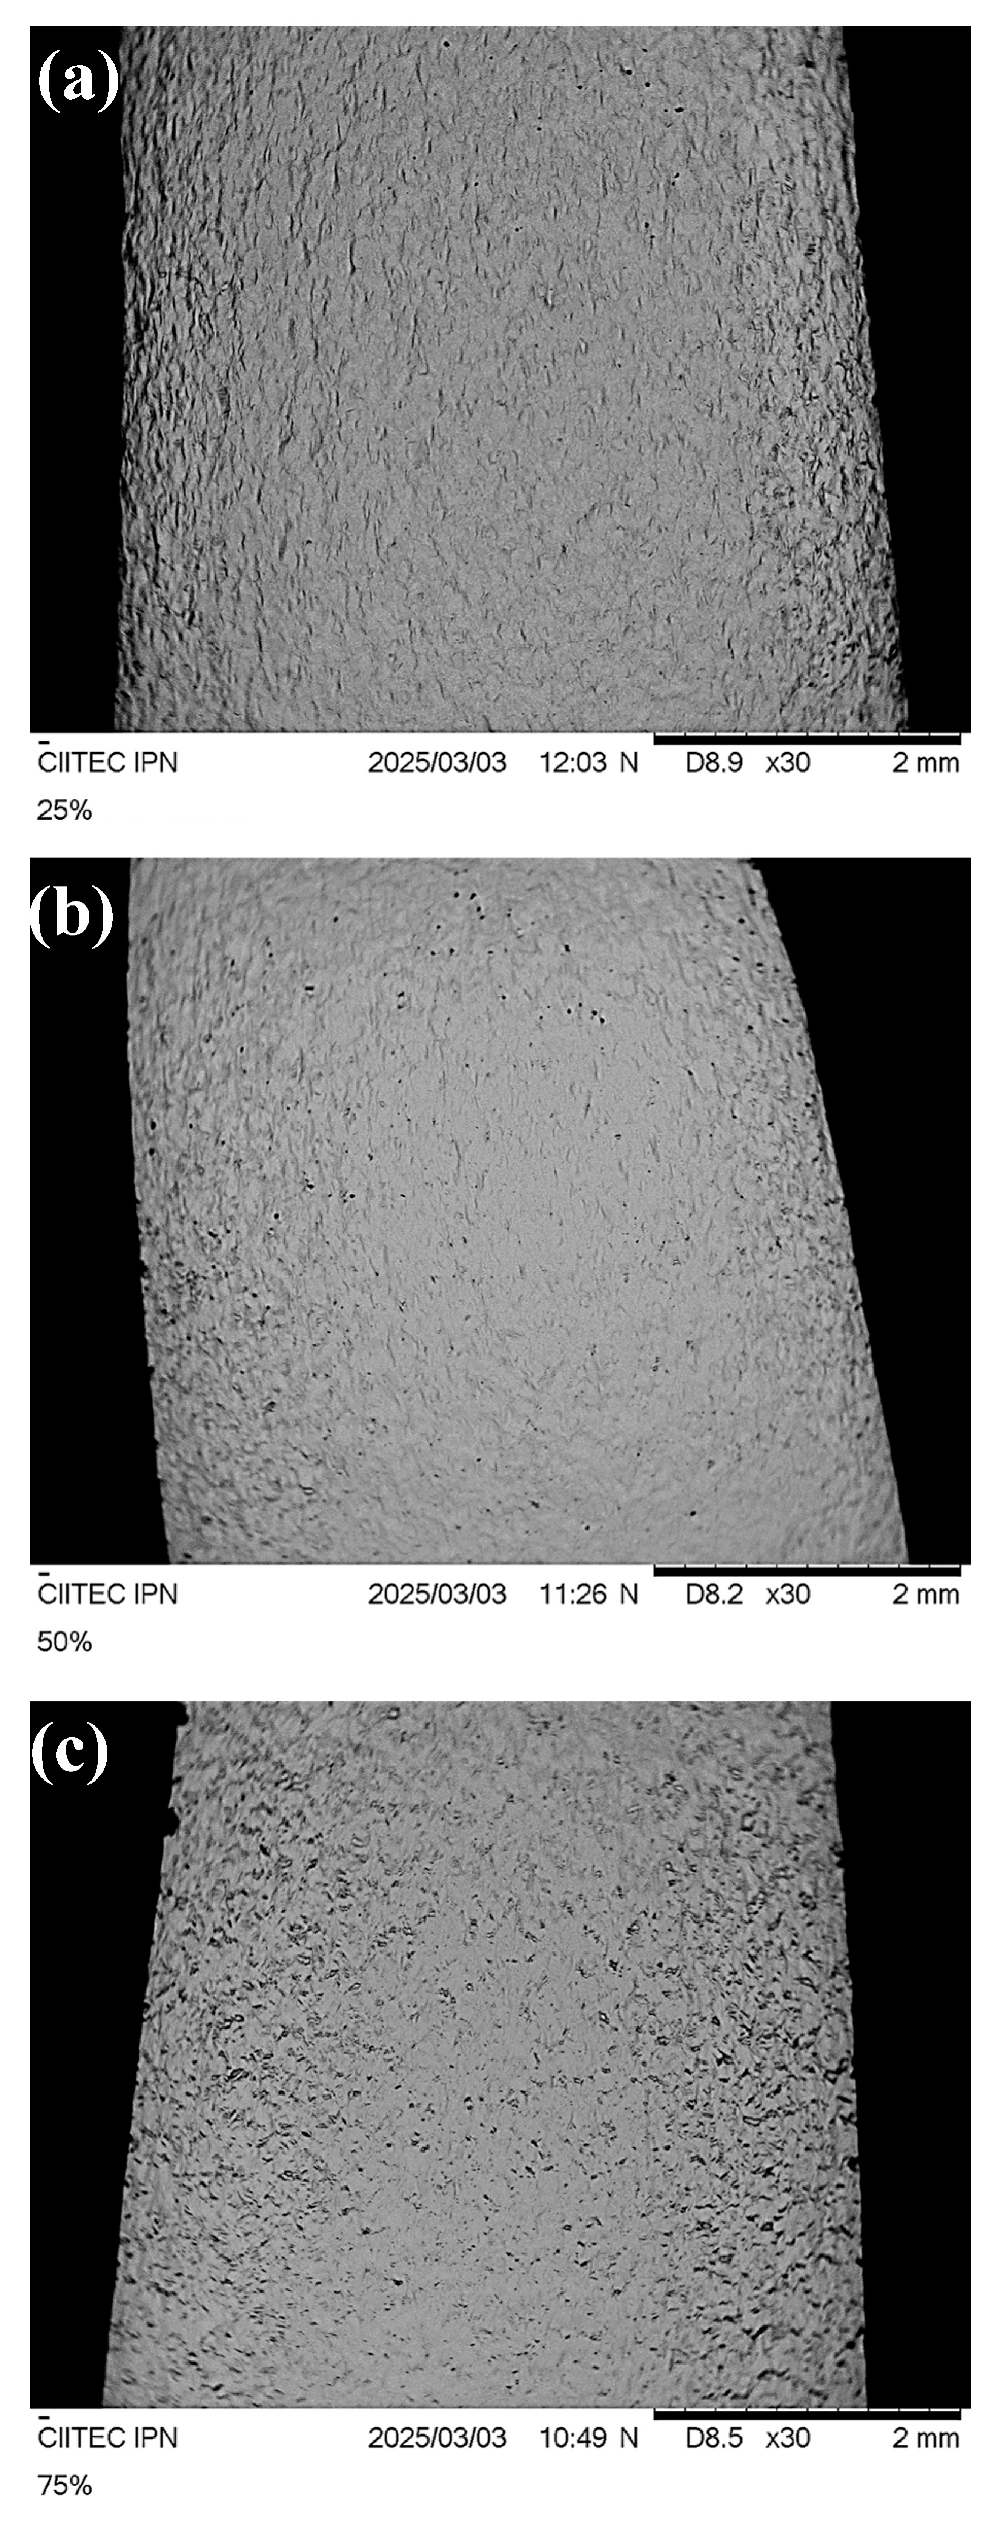
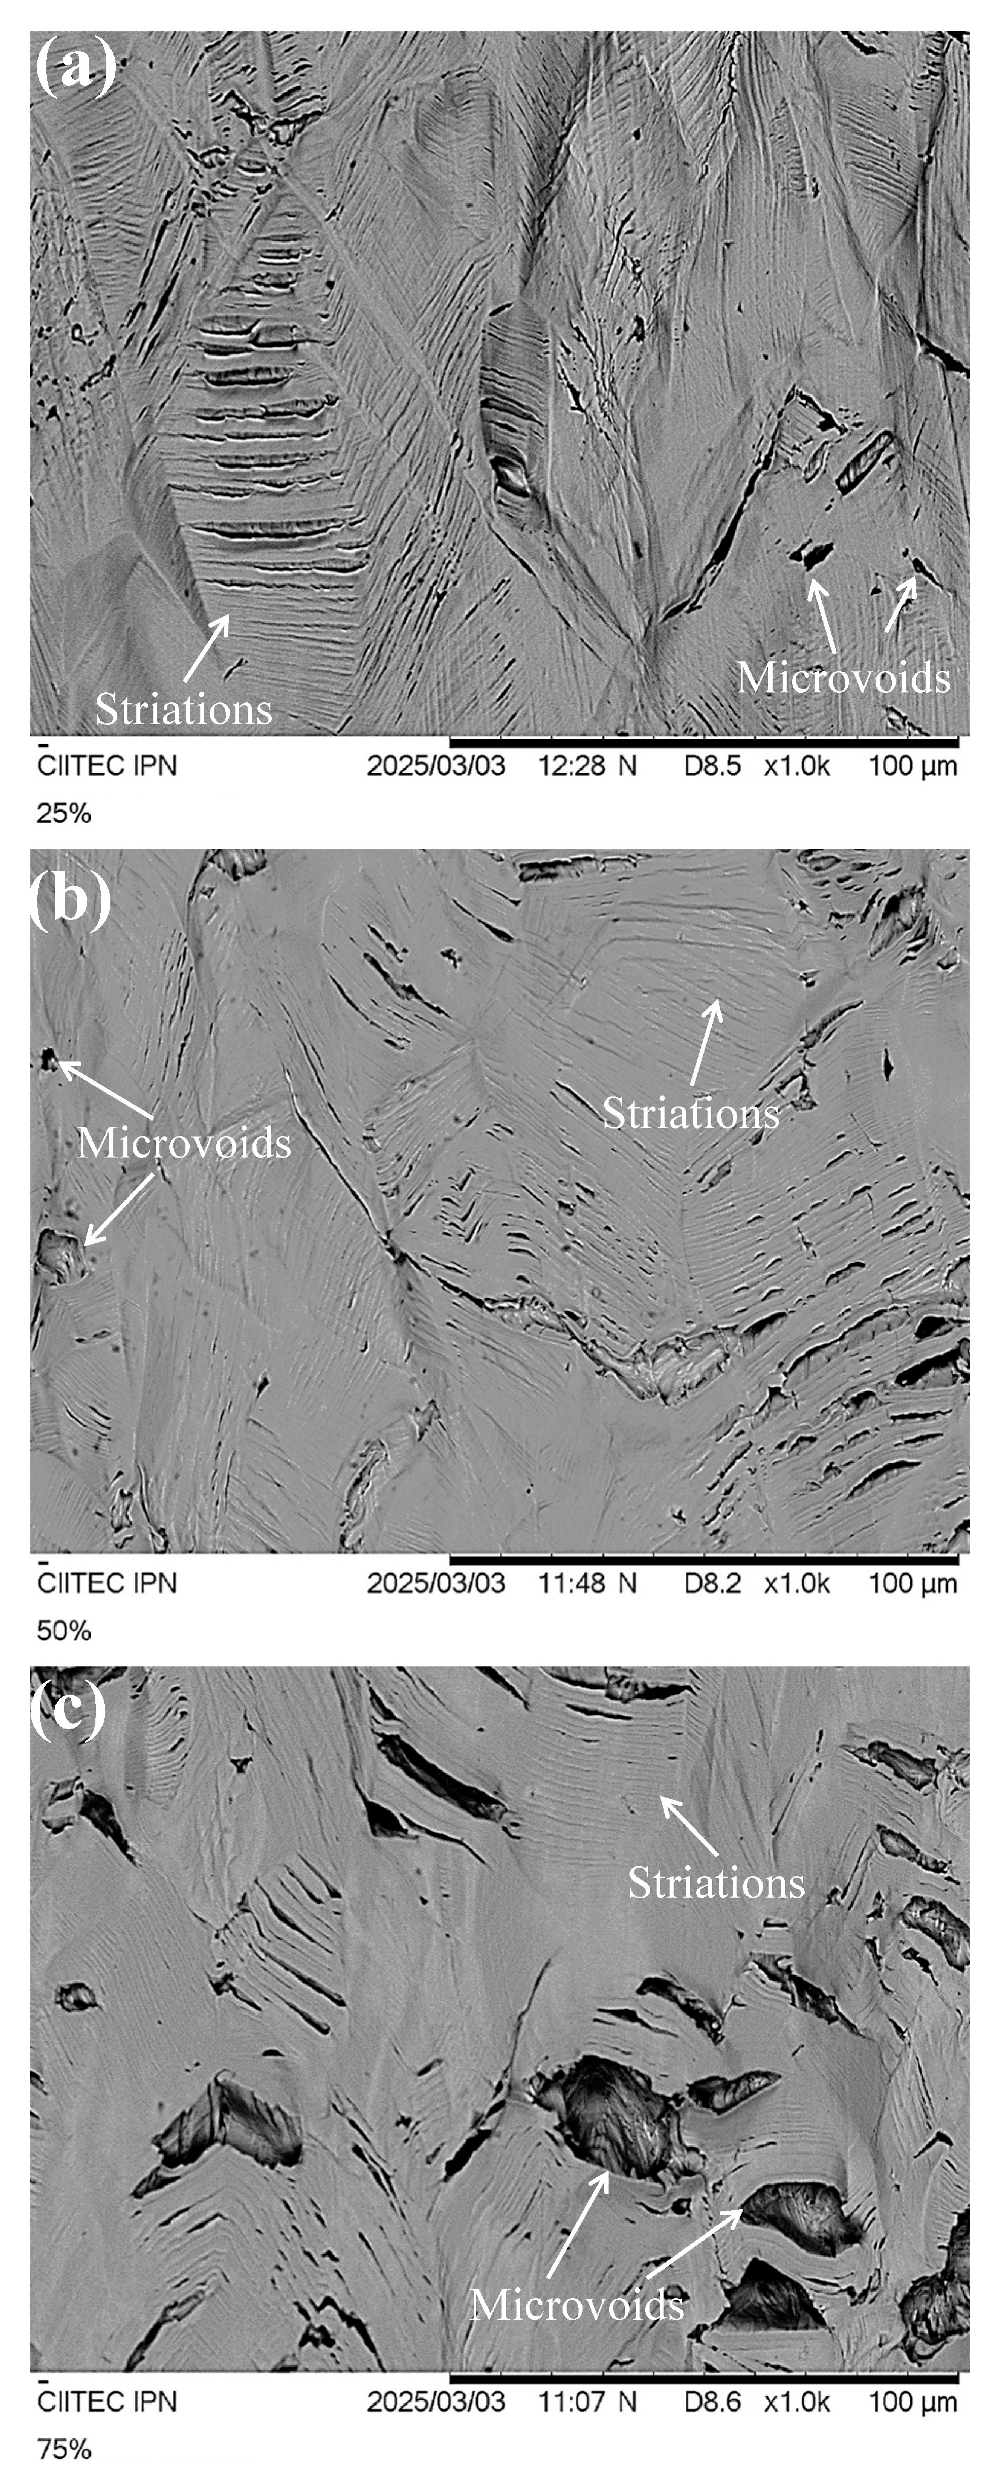
  • The AFD specimens revealed a ductility reduction in the cyclic true stress–strain behavior with respect to the reference one, which depended on the applied strain amplitude level. This ductility reduction was more severe when it was applied to the larger strain amplitude value ε a = 0.008 and a damage index of 0.75. It found a competitive mechanism, where fatigue micro-cracks and striations produced by the AFD and during the interrupted tensile tests resulted in a larger quantity and size of micro-voids, which defined the cyclic true stress–strain behavior in the 0.75 AFD specimen.
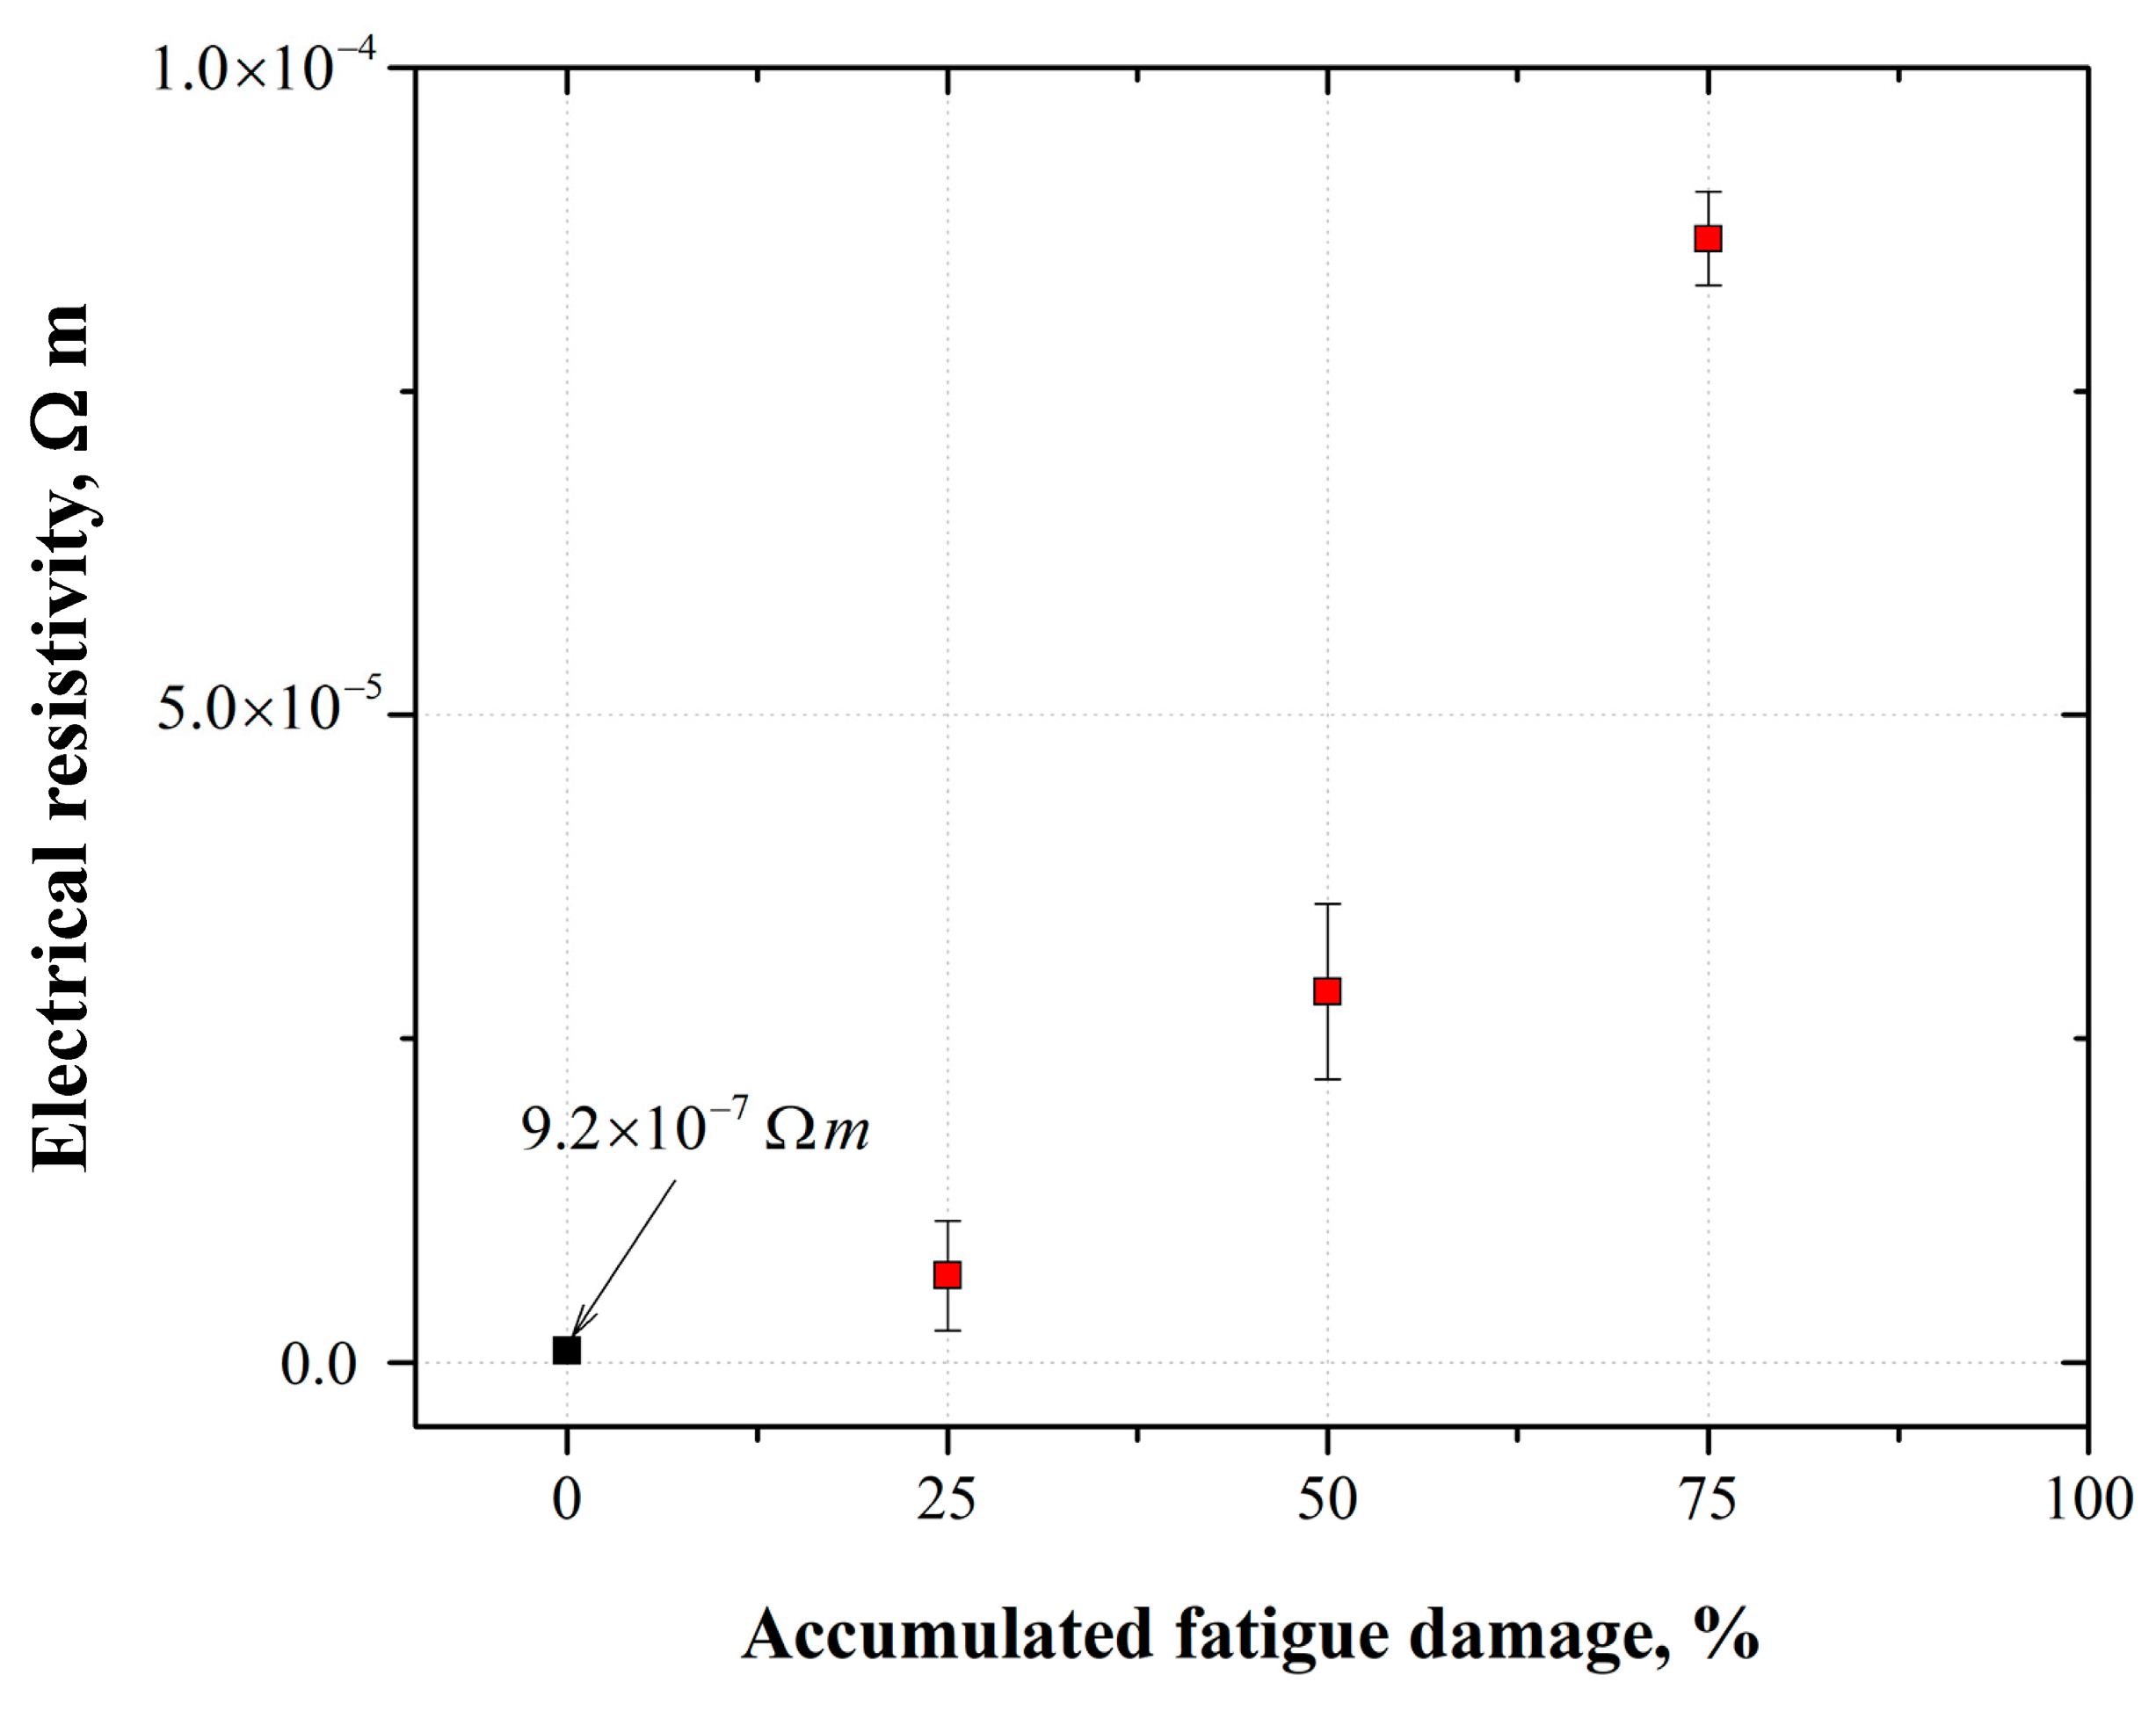
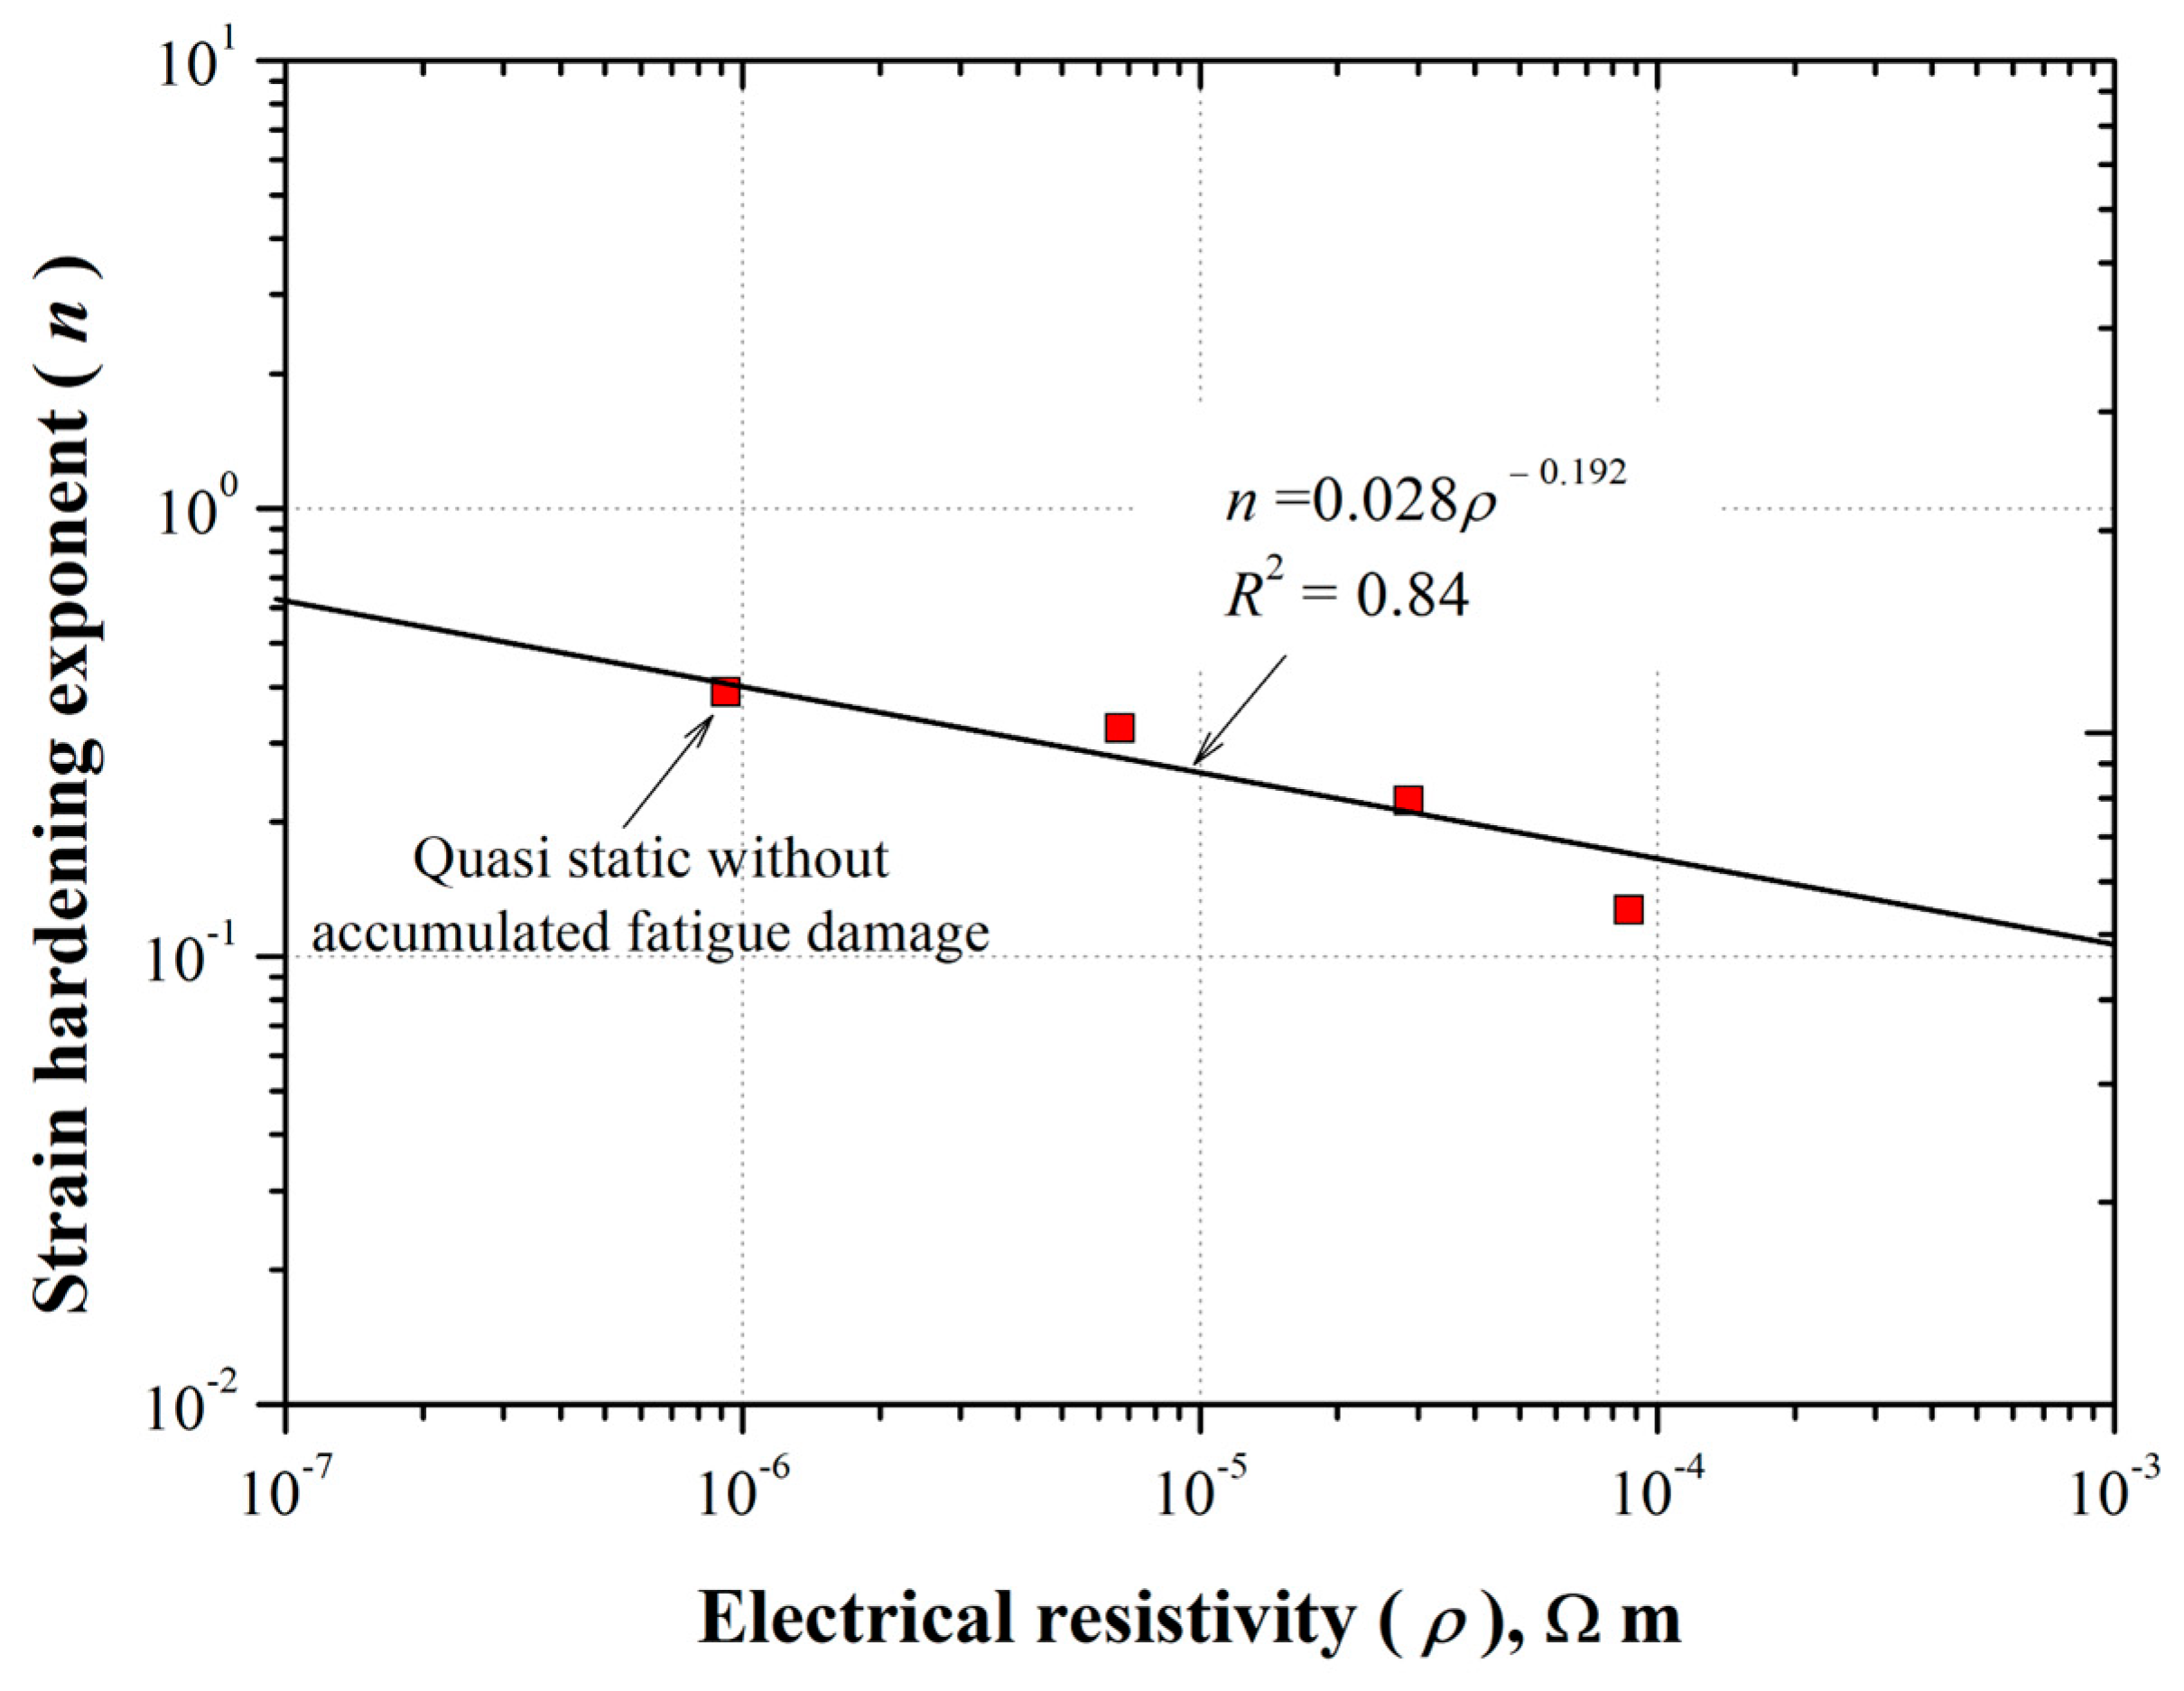
  • The strain-hardening exponent n-value was affected by the AFD. It exhibited an inverse linear relationship with respect to the AFD. The n-value was 0.39 for the specimen without AFD, and decreased up to around 0.14 for the specimen with an AFD of 0.75. Regarding the electrical resistivity, it exhibited an increasing non-linear behavior as a function of increasing the AFD. The ρ-value was 9.2 × 10⁻⁷ Ω·m for the specimen without AFD, and increased up to around 8.7 × 10⁻⁵ Ω·m for the the specimen with an AFD of 0.75. Both the n- and ρ-values were sensitive to the AFD.

Author Contributions

Conceptualization, D.R.-A., R.R.A. and D.J.; methodology, D.R.-A., R.R.A. and D.J.; formal analysis, D.R.-A., R.R.A. and C.J.G.; investigation, D.R.-A.; resources, R.R.A. and D.J.; writing—original draft preparation, D.R.-A., R.R.A. and C.J.G.; writing—review and editing, D.R.-A., R.R.A., C.J.G. and C.M.G.; supervision, R.R.A. and C.J.G.; project administration, R.R.A. and D.J.; funding acquisition, R.R.A. All authors have read and agreed to the published version of the manuscript.

Funding

This research was funded by CONACHYT-Mexico (Project A1-S-27474).

Data Availability Statement

The original contributions presented in this study are included in the article. Further inquiries can be directed to the corresponding author.

Acknowledgments

The authors of this paper are very grateful for the support given by CONACHYT to conduct doctoral studies of D. Ramírez-Acevedo. Also, the Centro de Investigación e Innovación Tecnológica of the IPN and SIP-IPN are acknowledged for the technical and academic support provided.

Conflicts of Interest

The authors declare no conflicts of interest.

References

  1. Pook, L.E. Metal Fatigue; Springer: Berlin/Heidelberg, Germany, 2007; Volume 145. [Google Scholar]
  2. Dowling, N.E. Mechanical Behavior of Materials; Pearson Education: London, UK, 2012. [Google Scholar]
  3. ASM International Handbook, Fatigue and Fracture; ASM International: Almere, The Netherlands, 1996; Volume 19.
  4. Zhang, W.; Cai, Y. Continuum Damage Mechanics and Numerical Applications; Springer: Berlin/Heidelberg, Germany, 2010. [Google Scholar]
  5. Chaboche, L. Continuous damage mechanics—A tool to describe phenomena before crack initiation. Nucl. Eng. Des. 1981, 64, 233–247. [Google Scholar] [CrossRef]
  6. Lemaitre, J. A Course on Damage Mechanics, 2nd ed.; Springer: Berlin/Heidelberg, Germany, 1996. [Google Scholar]
  7. Lemaitre, J. How to use damage mechanics. Nucl. Eng. Des. 1984, 80, 233–245. [Google Scholar] [CrossRef]
  8. Lemaitre, J.; Dufailly, J. Damage measurements. Eng. Fract. Mech. 1987, 28, 643–661. [Google Scholar] [CrossRef]
  9. Whitworth, I.; Thickpenny, J. Fatigue Damage Monitoring; Royal Military College of Science: Swindon, UK, 1980; pp. 263–266. [Google Scholar]
  10. Socha, G. Experimental Investigations of Fatigue Cracks Nucleation, Growth and Coalescence in Structural Steel. 2003. Available online: www.elsevier.com/locate/ijfatigue (accessed on 17 February 2025).
  11. Socha, G. Prediction of the fatigue life on the basis of damage progress rate curves. Int. J. Fatigue 2004, 26, 339–347. [Google Scholar] [CrossRef]
  12. Bjørheim, F.; Siriwardane, S.C.; Pavlou, D. A review of fatigue damage detection and measurement techniques. Int. J. Fatigue 2022, 154, 106556. [Google Scholar] [CrossRef]
  13. Ramírez-Acevedo, D.; Ambriz, R.R.; García, C.J.; Mendoza, C.; Jaramillo, D. Strain Measurement during Quasi-Static and Cyclic Loads in AL6XN Material Using Digital Image Correlation Technique. Materials 2024, 17, 3697. [Google Scholar] [CrossRef] [PubMed]
  14. Sonsino, C.M. The influence of coldforming on the low cycle fatigue behavior of the fine-grained structural steel Fe E 47 and the age-hardened aluminium alloy AICuMg2. Int. J. Fatigue 1984, 6, 173–183. [Google Scholar] [CrossRef]
  15. Kanda, Y.; Kariya, Y.; Oto, Y. Influence of cyclic strain-hardening exponent on fatigue ductility exponent for a Sn-Ag-Cu micro-solder joint. J. Electron. Mater. 2012, 41, 580–587. [Google Scholar] [CrossRef]
  16. Niu, X.; Li, G.; Lee, H. Hardening law and fatigue damage of a cyclic hardening metal. Eng. Fract. Mech. 1987, 26, 163–170. [Google Scholar]
  17. Allegheny Technologies Incorporated. ATI AL6XN ® Alloy; ATI Properties, Inc.: Albany, OR, USA, 2010; no. PA. [Google Scholar]
  18. ATI Flat Rolled Products. Certificate AL 6168-8 0417; ATI Flat Rolled Products: Pittsburgh, PA, USA, 2020. [Google Scholar]
  19. ISO 12106:2017; Metallic Materials—Fatigue Testing—Axial—Strain—Controlled Method. Internacional Organization for Standardization: Geneva, Switzerland, 2017.
  20. Nobile, R.; Saponaro, A. Electrical resistance measurements for fatigue damage prediction of AISI 316L stainless steel. Procedia Struct. Integr. 2022, 41, 421–429. [Google Scholar] [CrossRef]
  21. González-Zapatero, W.F.; García, C.J.; Gómora, C.M.; Ambriz, R.R.; Jaramillo, D. Low Cycle Fatigue and Damage Evaluation on 16MnCr5 Alloy Steel. Steel Res. Int. 2024, 95, 2300888. [Google Scholar] [CrossRef]
  22. ASTM E739–23; Practice for Statistical Analysis of Linear or Linearized Stress-Life (S-N) and Strain-Life (-N) Fatigue Data. ASTM International: West Conshohocken, PA, USA, 2023. [CrossRef]
  23. ASTM International. ASTM International. ASTM International Designation E8/E8M-22. In Standard Test Methods for Tension Testing of Metallic Materials; ASTM Committee E28; ASTM International: West Conshohocken, PA, USA, 2022. [Google Scholar] [CrossRef]
  24. Nobile, R.; Saponaro, A. Real-time monitoring of fatigue damage by electrical resistance change method. Int. J. Fatigue 2021, 151, 106404. [Google Scholar] [CrossRef]
  25. Chow, C.L.; Wei, Y. A Model of Continuum Damage Mechanics for Fatigue Failure; Kluwer Academic Publishers: Norwell, MA, USA, 1991. [Google Scholar]
  26. Mizuno, M.; Zhu, S.; Kagawa, Y.; Kaya, H. Stress, Strain and Elastic Modulus Behavior of SiC/SiC Composites during Creep and Cyclic Fatigue. J. Eur. Ceram. Soc. 1998, 18, 1869–1878. [Google Scholar] [CrossRef]
Figure 1. Scheme of the specimen geometry for cyclic strain control fatigue tests, dimensions in mm.
Metals 15 00472 g001
Figure 2. Experimental setup for the electrical resistivity measurements with the double Kelvin bridge method.
Metals 15 00472 g002
Figure 3. Fatigue life curves, (a) strain amplitude, and (b) stress amplitude.
Metals 15 00472 g003
Figure 4. (a) Hysteresis loops form strain control fatigue characterization, (b) cyclic stress–strain curve.
Metals 15 00472 g004
Figure 5. True stress–strain behavior for specimens with an AFD of (a) 0.25, (b) 0.50, (c) 0.75, and (d) a comparison of the specimens with different AFD generated with ε a = 0.008.
Metals 15 00472 g005
Figure 6. (a) Variation of the resistance coefficient K as a function of the AFD, and (b) strain-hardening exponent n-value as a function of the AFD.
Metals 15 00472 g006
Figure 7. Electrical resistivity ρ measurements of fatigued samples as a function of the AFD.
Metals 15 00472 g007
Figure 8. Relationship between strain-hardening exponent n-value and electrical resistivity ρ measurements in AL6XN specimens subjected to AFD.
Metals 15 00472 g008
Figure 9. D variable with respect to the n ¯ -value from accumulated fatigue damage.
Metals 15 00472 g009
Figure 10. Surface condition in AFD specimens generated with ε a = 0.008 for the index: (a) 0.25, (b) 0.50 and (c) 0.75.
Metals 15 00472 g010
Figure 11. Defects present in the 0.008 − ε a AFD specimens for the index: (a) 0.25, (b) 0.50 and (c) 0.75.
Metals 15 00472 g011
Disclaimer/Publisher’s Note: The statements, opinions and data contained in all publications are solely those of the individual author(s) and contributor(s) and not of MDPI and/or the editor(s). MDPI and/or the editor(s) disclaim responsibility for any injury to people or property resulting from any ideas, methods, instructions or products referred to in the content.

