Article

Quantitative Microstructure of Multiphase Al-Zn-Si-(Mg) Coatings and Their Effects on Sacrificial Protection for Steel

by
Guilherme Adinolfi Colpaert Sartori
1,2,*,
Blandine Remy
1,
Tiago Machado Amorim
1 and
Polina Volovitch
2,*
1
ArcelorMittal Research SA, 57283 Maizières-les-Metz, France
2
Institut de Recherche de Chimie Paris (IRCP), Chimie ParisTech—CNRS, PSL University, 75005 Paris, France
*
Authors to whom correspondence should be addressed.
Metals 2025, 15(5), 476; https://doi.org/10.3390/met15050476
Submission received: 27 February 2025 / Revised: 8 April 2025 / Accepted: 14 April 2025 / Published: 23 April 2025
(This article belongs to the Section Corrosion and Protection)

Abstract

:
A new combined analysis of SEM-BSE and EDX images using AphelionTM software was proposed to describe the quantitative microstructure (quantity and neighborhood of sacrificial phases) of Al-Zn-Si-(Mg) coatings on steel. Three materials with different Al/Zn ratios and Mg content were analyzed. The quantitative microstructure allowed us to describe their corrosion behaviors in a chloride environment and understand their ranking for sacrificial protection of steel in accelerated corrosion tests. For the analyses, interdendritic Zn-rich or Mg-rich phases were expected to be more sacrificial to steel than Al-rich dendrites. Without Mg (AZ coating), Al-rich dendrites created a percolating network, but interdendritic phases did not, suggesting their sacrificial protection to steel to be very limited. Additionally, significant Zn gradients inside dendrites led to a premature coating consumption on the surface, creating new zones of naked steel. In the coatings with Mg (AZM), sacrificial interdendritic phases created a percolating network, which is expected to improve long-time sacrificial protection and contribute to a more uniform formation of Zn corrosion products. For Al content between 30 wt.% and 45 wt.%, a lowering of the Al/Zn ratio (L-AZM) increased the connectivity of the sacrificial interdendritic phases, which is expected to improve the long-term sacrificial effect. Accelerated corrosion tests of scratches in the steel coatings validated the hypotheses.

Graphical Abstract

1. Introduction

Steels are the most used structural materials due to their exceptional mechanical properties. Their service time is, however, compromised by their corrosion susceptibility. Costs of corrosion could be strongly reduced (up to 35%) by the correct corrosion prevention practices [1], among which anticorrosion coatings are largely used. An ideal anticorrosion coating will offer a transport barrier effect, sacrificial protection, and slow release of inhibiting/passivating species [2], which could be due to the formation of inhibiting or barrier corrosion products. Among different coating strategies, the first patent on sacrificial coating formed by Zn galvanizing was proposed in 1836 [3]. Zinc offers excellent sacrificial capacity; however, its anticorrosion protection is compromised in strongly corrosive environments, especially with high chloride content [4], as it increases zinc’s corrosion rate, resulting in coating consumption occurring too quickly (perforating corrosion). One of the first coatings developed to increase the perforating corrosion protection of zinc was Galvalume® (GL), also known as AluZinc® (AZ) [5], composed of 55 wt.% of Al, 1.6 wt.% Si, and Zn for balance. Its microstructure is mainly composed of dendrites of the α-Al phase with Zn in solid solution, a binary ZnAl phase consisting of zinc matrix with globular Al-rich particle inclusions, and needles of Si [6]. This coating provides excellent protection against perforating corrosion; however, it has very poor sacrificial protection for scratches on steel and naked steel at the cut edges in low chloride environments [7]. Later, zinc-based coatings with the addition of other alloying elements, especially low aluminum and magnesium, were developed and are now widely used [8,9,10,11,12,13]. They provide a compromise by offering good perforating corrosion resistance with a satisfactory cut-edge protection. Nevertheless, these coatings remain rich in zinc. The increase in its price and the toxicity of soluble Zn2+ ions formed by corrosion have driven the research and development of other coating compositions with less Zn content and pushed the development of new Al-based coatings [14].
One of the solutions already used to increase the corrosion resistance of the AZ coatings is the addition of Mg in the composition. An addition of around 2 wt.% of Mg in the AZ coatings resulted in the formation of two new phases: Zn2Mg and Mg2Si [15]. The polarization curves of the AZ samples with and without Mg addition showed that, even if both coatings present the same corrosion potential, the anodic current of the sample with Mg was almost three times lower, indicating a slower corrosion rate and, therefore, a longer sacrificial protection period is expected [15]. The addition of Mg to AZ coatings was also noted to increase the compactness of the corrosion products in accelerated tests, which can be associated with an improved barrier effect [16,17].
Although the existing literature considers the improvement of the sacrificial capacity of Al-based coating by Zn and Mg alloying (see, for instance, [18]), it mainly considers the effect of alloying on the nature of the present phases qualitatively without taking their distribution into account. At the same time, the chemical composition of the coating alloy is not the only factor that influences sacrificial capacity. For instance, the current distribution could be affected by the fractions of phases with different electrochemical potentials and their interfaces. The quantitative aspects of the coating microstructure regarding its sacrificial capacity have not been studied probably because, for such a correlation, both corrosion and phase distribution should be characterized by a sufficient spatial resolution at the scale of the microstructure (nano to micrometers) and be statistically representative of the big samples at the same time (millimeter to tens of centimeters scale). The present study aims to fill this gap thanks to the development of computational tools, allowing us to obtain quantitative data from image analysis with sufficient statistics.
Many methods of image treatment for corrosion detection were previously proposed. The easiest approach is based on color analysis to detect defects [19,20,21]. Furthermore, taking into account that corrosion creates a rough surface, most studies used morphological texture analysis [22,23,24,25] or a combination of both color and texture [26].
Thanks to the availability of high-resolution optical microscopy techniques in recent decades, a better understanding of corrosion mechanisms at the microstructure level can be achieved, for instance, for Zn-Al-Mg coatings [27,28,29] and Al alloys [30]. Particularly, optical reflective microscopy stands out due to its high resolution, robustness, and fast measurements. While the images themselves provide only qualitative results, significant efforts have been recently made with data treatment to obtain quantitative results. This can be achieved, for example, by measuring the changes in the reflected light intensity, which occurs due to dissolution and results in a change in roughness, the formation of corrosion products, gas bubbles evolution, etc. [31,32,33].
Other than corrosion, image treatment is also used for phase detection in the material engineering domain. As an example, the phases and their distributions on multicomponent Al-Si alloys [34] were identified and described thanks to the combination of electron backscattered diffraction (EBSD), which provides crystallographic structure and orientation information, with energy dispersive X-ray analysis (EDX), which provides chemical information. An automated method was proposed and successfully applied to identify the phases of minerals using low-energy EDX mappings [35]. Hence, it seems feasible to quantify the obtained results. One should note that the interest in EBSD for microstructure analysis, due to the phase attribution of each pixel, is not just due to its visual aspects but is also based on how it handles diffraction patterns. EBSD is, however, much more time-consuming in comparison with simple backscattered electron image acquisition. It requires a highly qualified operator and a long period of time for both data acquisition and treatment, in addition to relying on good crystallinity and being limited to materials consisting of well-described phases.
In recent years, microstructure description by optical or scanning electron microscopy image analysis with machine learning (ML)-based separation and segmentation procedures has gained increasing interest [36]. ML-based techniques allow a good description of steel structures, but reach their limits with complex segmentation tasks (for instance, for microstructures consisting of several textures and differing strongly in their shape) in a low data regime. These limitations are often unavoidable in multi-element coating development, for which materials with very complex, not well-described, and strongly varying microstructures are studied. Specific developments are, therefore, still necessary for image analysis of such types of microstructures.
Another challenge, faced when designing the materials, is figuring out how to correlate the quantitative microstructure of the coating, the sacrificial protection offered by individual phases, and the corrosion properties of the overall coating material. In the present work, this relationship is handled by considering the approaches offered by the percolation theory. Percolation is a mathematical concept based on the existence of a percolation threshold, pc, defined for a multicomponent system of a sufficiently large size. For such a system, when one type of component is present in an amount higher than this critical (pc) value, the theory states the existence of at least one agglomerate of this component considered as “infinite” (percolating from one side to another for the system). The threshold values for 3D systems usually vary between 10.7% and 24% [37]. This theory is already used to understand the conductivity of composite materials [38] as well as to better understand the effect of particle precipitation in the grain boundaries on the corrosion properties [39,40,41]. Furthermore, it is used to explain the critical amount of chromium needed to obtain the “stainless” properties of some grades of steels and other alloys [42,43]. The present work proposes, for the first time, the application of the percolation approach to the distribution of sacrificial phases in quaternary Al-Zn-Si-(Mg) coatings on steel to understand the corrosion paths that can be created due to very heterogeneous microstructures of these quaternary coatings.
To test the corrosion performance of the coatings, both accelerated corrosion tests in climatic chambers and natural exposure are often used. For new performant coatings, natural exposures can be very long. Among accelerated tests, cyclic procedures with alternating dry and wet phases, like VDA 233-102, are known to be more representative for zinc-coated steels than continuous salt spray tests, like B117 and ISO 9227 [4]. Although accelerated tests are now routinely used in automotive and building industries, no test can take into account the totality of the atmospheric corrosion conditions; multiple factors, such as sample orientation, liquid flow conditions, atmospheric pollutants, etc., can affect both the nature of the corrosion products and the sacrificial capacity of the phases. At the same time, an understanding of the effect of the microstructure of the coatings on the corrosion behavior of the coatings and their relative corrosion resistance can be approached in more model conditions of one chosen accelerated test. Taking into account the very long degradation time expected in natural exposure, even for the reference coatings, the application of the cyclic corrosion test was chosen in the present work as a good compromise between the research time constraints and coherence with atmospheric corrosion conditions.
To sum up, the scientific question raised in the present work is as follows: “If and how the microstructure of the coatings will affect the corrosion behavior of the coatings and their relative corrosion resistance”. The answer could allow quantitative microstructure assessment and could be further developed for the analysis of new sacrificial multi-element metallic coatings.
The first objective of the present work is to propose a new methodology describing the microstructure of multi-element and multiphase metallic coating in a quantitative way (Q-µstructure) using the phase identification and quantification from the image analysis methods, applied to combined backscattered electron images from scanning electron microscopy (SEM-BSE) and EDX mapping. Such a methodology offers the advantage of using simple BSE images in place of more complex and time-consuming EBSD phase identification. Combining BSE image analysis with EDX allows to extend this image analysis for complex quaternary microstructures, containing multiple solid solutions and different phases with varying compositions and shapes.
The second objective is to apply the Q-µstructure description of the three Al-Zn-Si-(Mg) coatings to understand the mechanisms and the relative ranking of the anticorrosion performances of these coatings for steel protection, using the percolation approach, and to compare the expectations with the results of accelerated corrosion tests in climatic chambers.
Finally, we aim to discuss the limits of the proposed approach and further development.

2. Materials and Methods

2.1. Materials

Three different compositions of metallic coatings were deposited by the hot-dip galvanizing process on the surface of low-alloy steel with a composition reported in Table 1. They were deposited on the surface of IF grade steel with a thickness of 1 mm. Before the deposition, the steel surface was prepared by degreasing and acid pickling, followed by rinsing with distilled water and drying. Then, it was annealed at 780 °C under an atmosphere of N2-4 vol% H2 and dipped into the molten metallic bath, with preliminary adjustment of the steel temperature to the same value as the bath temperature using N2 gas flow. The bath temperature was between 530 and 600 °C, depending on the composition, and the immersion time was 3 s. The coating thickness was controlled by wiping with N2 with an adjusted flow rate and pressure. N2 was also blown to control the cooling rate at around 10 °C/s until full solidification was attained.
The AZM coating has the quantities of Al and Si defined by the industrial standard for the AZ coating, but with the addition of Mg. L-AZM sample has a similar Si and Mg content as the AZM coating, however higher amount of Zn and lower amount of Al. The average compositions of the coatings, measured by ICP OES, and their thicknesses, measured with a magnetic induction method, are presented in Table 1.

2.2. Accelerated Corrosion Test

Accelerated corrosion tests in climatic chambers were performed to evaluate the corrosion resistance of the coatings in a cut-edge situation. The tests were made using the standard VDA 621-415 [44]. The one-week cycle of the test started with a 24 h salt spray phase using 5 wt.% NaCl solution in osmotic water with a natural (neutral) pH value and a flow rate of 1.5 ± 0.5 mL/h. The salt spray phase was followed by a wet phase with a duration of 8 h and a temperature of 40 ± 2 °C and a dry phase of 16 h and temperatures of 23 ± 2 °C. The alternating wet/dry phases were repeated 4 times in total. Finally, a 48 h dry phase concluded the one-week cycle. One should note that, although cyclic tests in chloride environments are one of the most used for zinc, even this test still needs further improvements [45].
Prior to the test in climatic chambers, the samples were cleaned with petroleum benzene, and the borders and the back of the samples were covered by anti-corrosion tape, so it was expected that there would be no effect of the protected cut-edges. The anticorrosion performance of the coatings for steel was tested in two different types of exposure:
  • A configuration in which, prior to the corrosion test, coated plates of 100 × 200 mm2 surface area were scratched, until the steel was revealed, by a tool of 2 and 3 mm width, and the corrosion test was carried out until the appearance of the red rust;
  • A configuration in which the plates of 100 × 50 mm2 with only 1 mm scratches were exposed for 1 week to examine the initial corrosion mechanisms and formation of corrosion products.

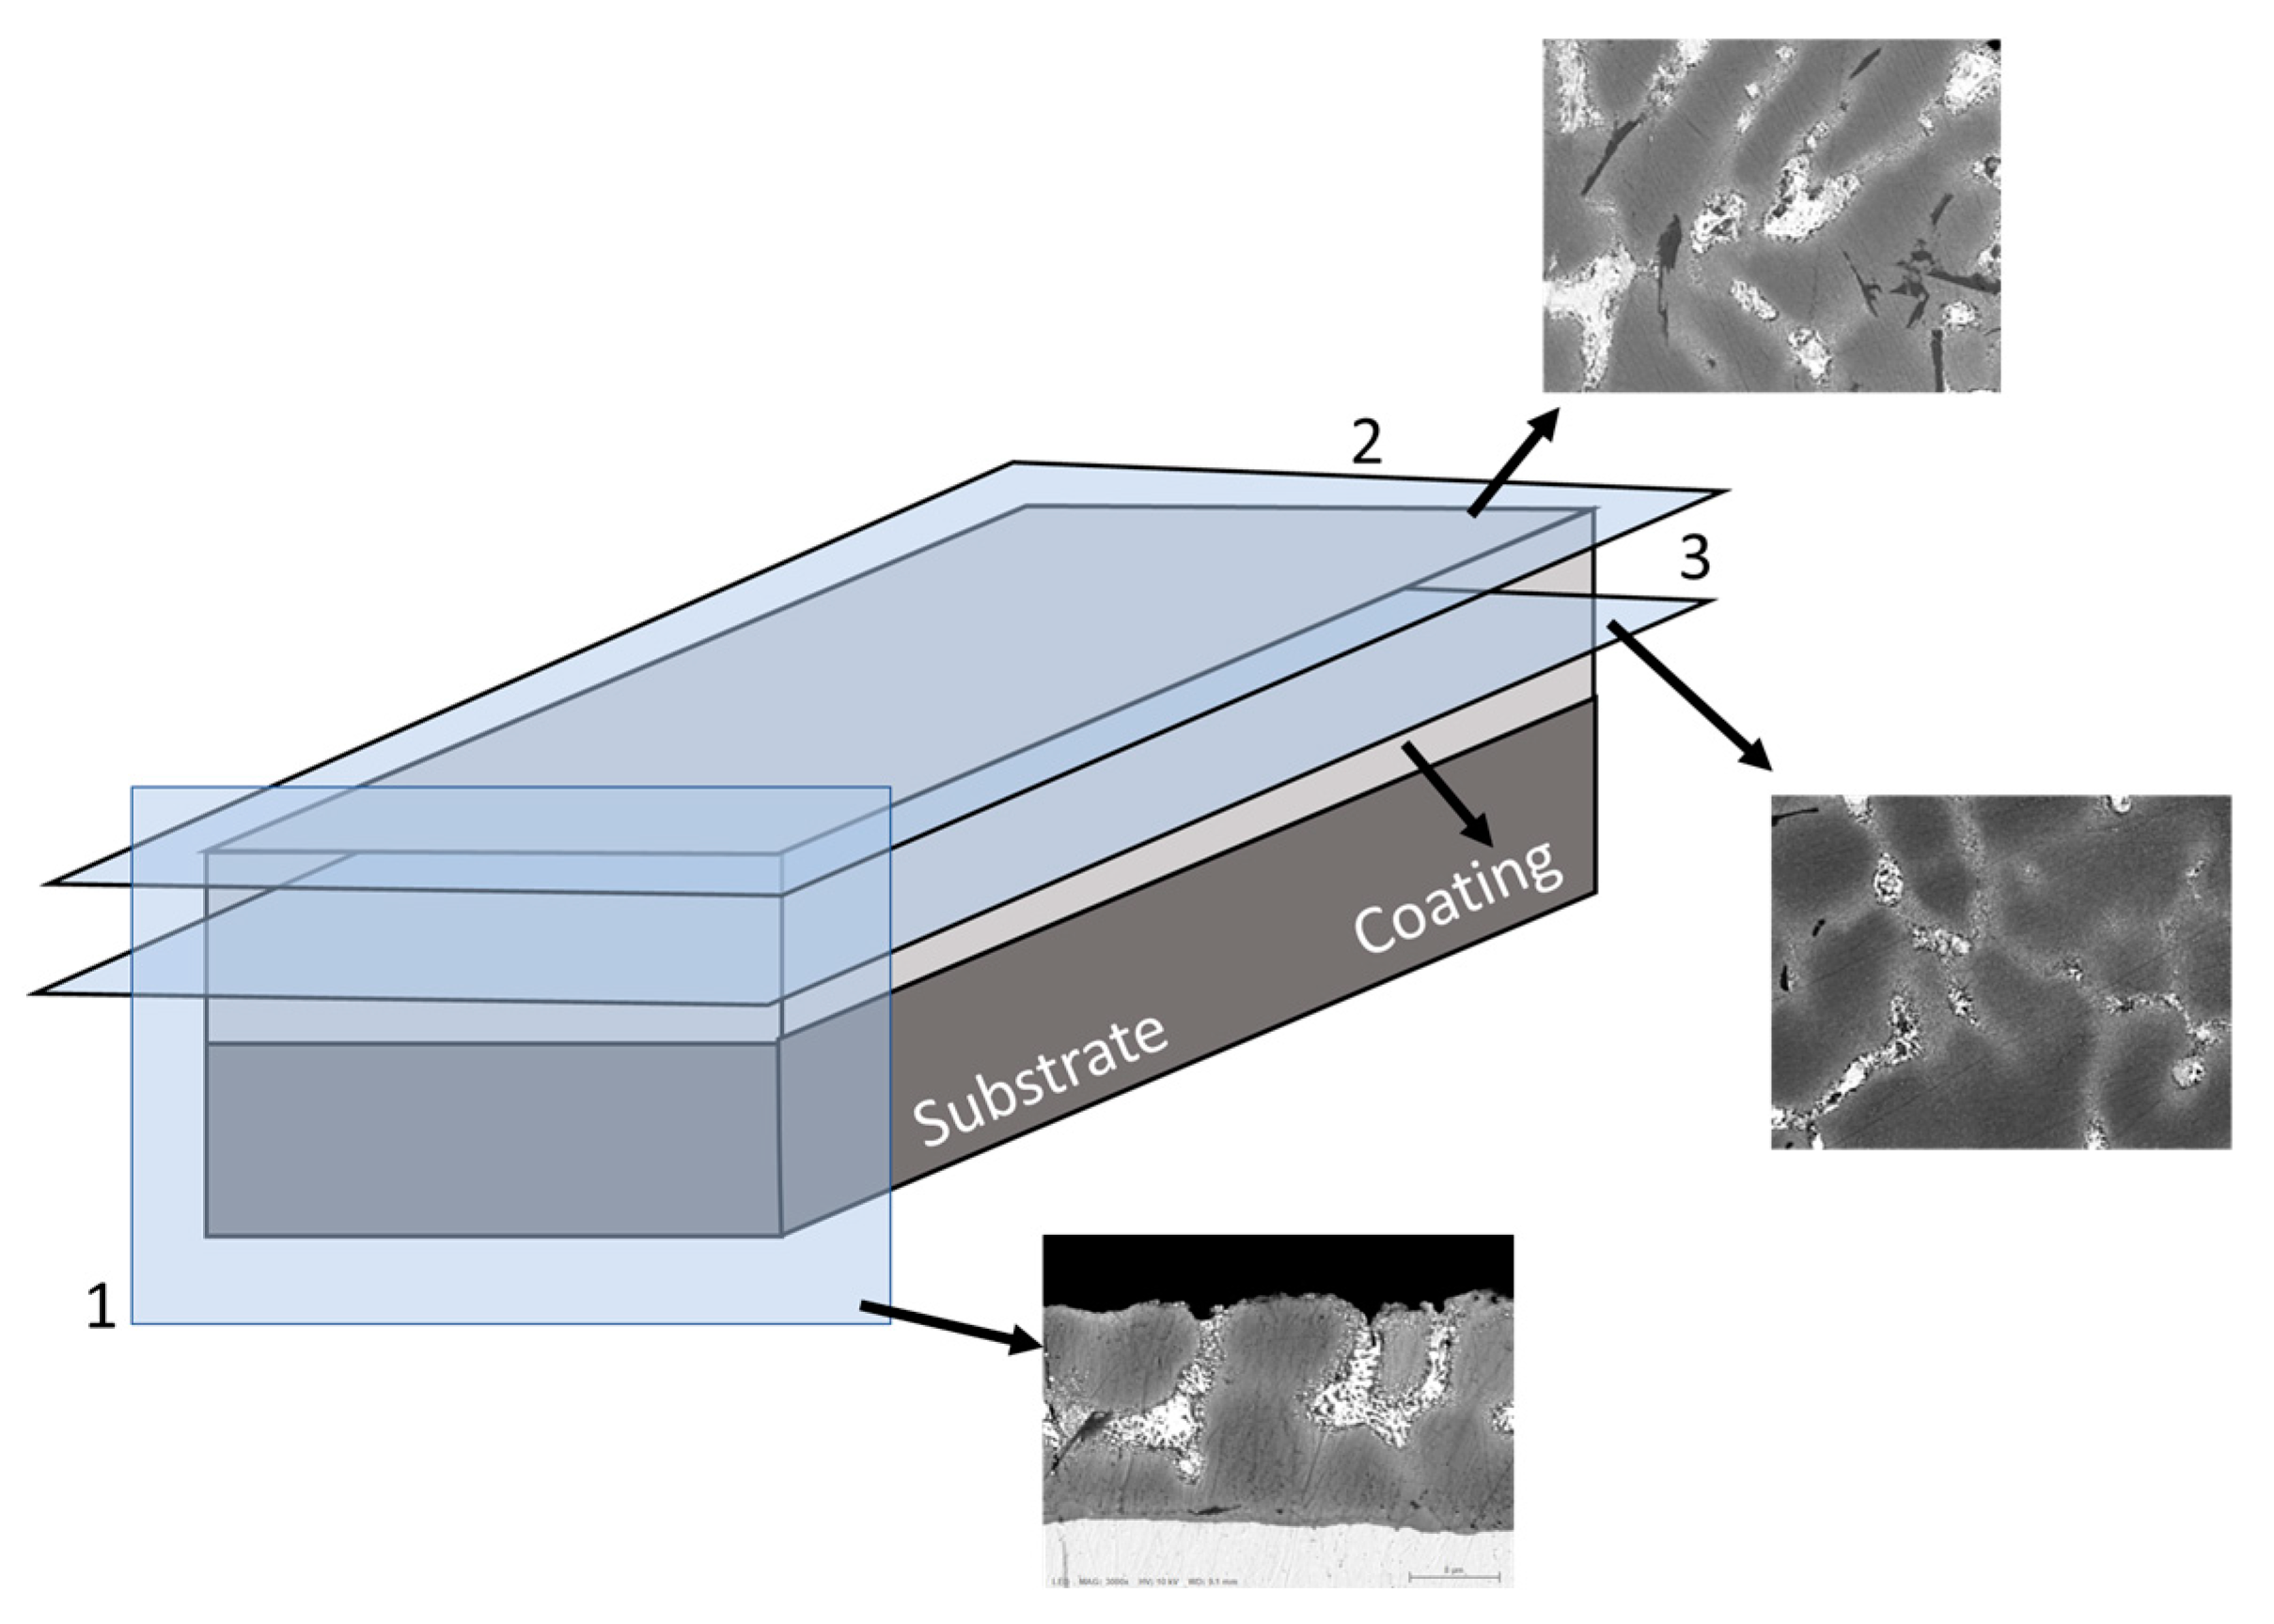
2.3. Microstructure and Corrosion Products Analyses

The cross-sections of the uncorroded samples, as well as the superficial and cross-section analysis after accelerated corrosion tests, were performed using scanning electron microscopy (SEM-FEG, JEOL 7800F, Tokyo, Japan) coupled with an EDX detector (XFlash 6l60 from BRUKER (Billerica, MA, USA) with Copper as calibration element). The imaging was made in both secondary electron (SE) and backscattered electron (BSE) modes at an accelerating voltage of 10 kV and a current of 3 nA. The EDX quantification was made using the P/B—ZAF technique [46] (the acronym ‘ZAF’ describes a procedure in which corrections for atomic number effects (Z), absorption (A), and fluorescence (F) are calculated separately from suitable physical models, P/B indicates that a local peak to background ratios are used for an input into the modified ZAF matrix correction). Only Al, Zn, Si, Mg, and Fe were considered for the quantification of the initial microstructure; therefore, the sum of the weight concentrations (wt.%) of these elements was considered as 100%.
For the cross-section analysis of uncorroded or corroded samples, plates of 10 × 20 mm2 were cut and mounted using epoxy resin with a low polymerization temperature to avoid any changes in the microstructure by heating. The mounts were polished using both abrasive paper and diamond solution until 1 µm. A deposition of a thin layer of gold of 20 nm on the mounted samples was necessary to allow charge dissipation from the samples because the low-temperature resin was not conductive.
Surface analyses of uncorroded samples were made on the top surface and the half-thickness. Samples were polished using abrasive paper 2500 (for half thickness only) and diamond solution of 3 µm and 1 µm. The thickness of the coating was measured before and after polishing using an alcometer DeltaScope FMP30® (Piraeus, Greece), which measures the coating’s thickness with a magnetic induction method. For the top surface, a difference in the thickness smaller than 1 µm was targeted, while for the half thickness, the tolerated interval was ±2 µm, around half of the initial thickness (mean value of the unpolished coating divided by two).
To sum up, in order to verify the coating homogeneity, the microstructures were analyzed in cross-section and by top-views at two different depths, as schematically shown in Figure 1. The top views were obtained after polishing at two different depths, achieved by a very slight polishing of the top surface and a deep polishing as described previously.

2.4. Quantitative Microstructure Description Using Aphelion Software

The quantitative analyses of the microstructure of the coatings were made using the image treatment software Aphelion SDK 4.6.1 from ADCIS™ (Coburg, Germany) [47]. This software is suitable as it allows the implementation of macros, opening up the possibility of working easily with different types of data. A general schema of the image analyses and their use to obtain the quantitative microstructure is presented in Figure 2. The procedure will be described in more detail below.

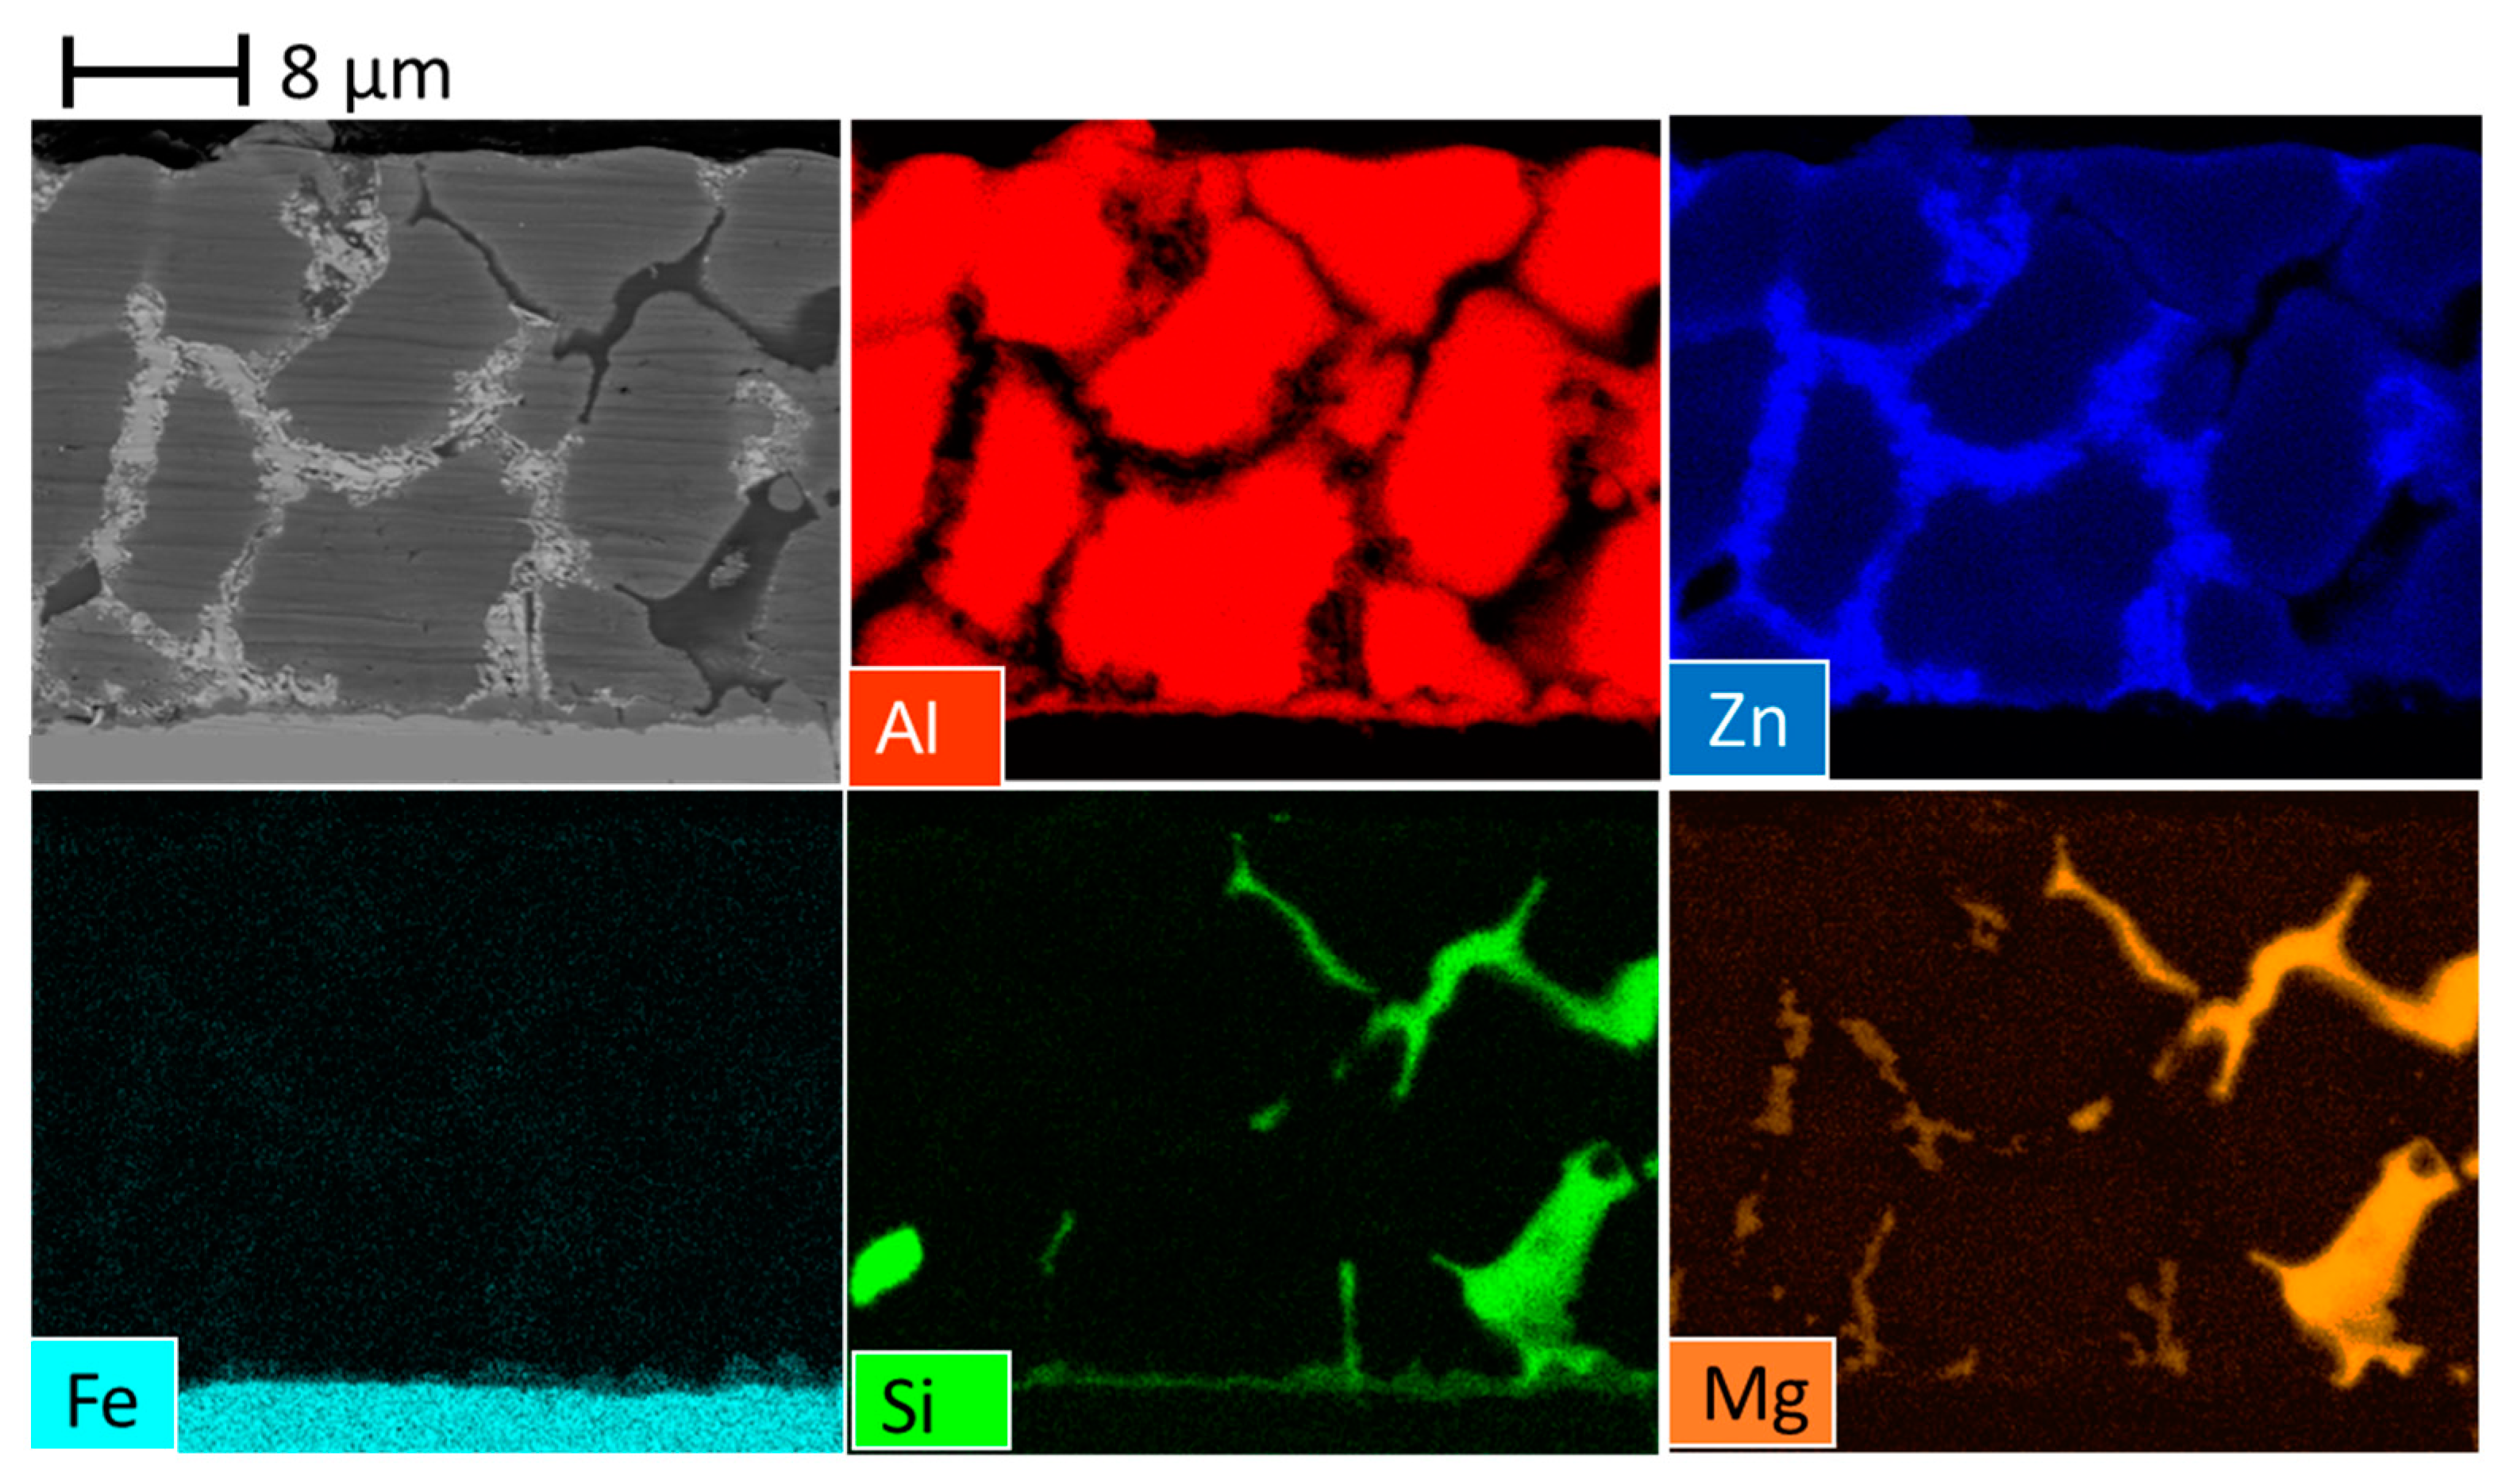
2.4.1. Phase Composition Set Up

To define all the possible phases, analyses of the BSE images combined with the EDX quantifications were made on the cross-sections (step 2 in Figure 2). Photos with several magnification levels and the quantification of at least 10 different points for each phase in the image were made to properly visualize their morphology and ensure good statistics for their chemical composition. Once the chemical compositions of the possible phases were determined from representative cross-sections, they were used to define the elemental composition threshold for the automatic phase attribution macro procedures (steps from 3 to 5 in Figure 2), further applied to other cross-sections.
EDX maps were mainly used for the identification of the phases containing Mg, Si, and/or Fe. For the attribution of the phases containing only Al and Zn, a manual threshold of the gray scale level procedure was applied to the analysis of the BSE images, allowing for the definition of Zn-rich and Zn-poor phases and their interfaces. Indeed, thanks to a strong atomic mass difference between Al (26.98 u) and Zn (65.38 u), the higher the Zn content in an Al/Zn-based phase is, the darker its visualization will be in a BSE image. Hence, their interfaces can be easily defined, for example, when Al containing some Zn in solid solution (phase Al(Zn)) and the binary phase rich in zinc (ZnAl) are in contact. The necessity to use the manual threshold of the gray scale levels was due to some variability of the contrast—brightness during acquisition of the images. The latter was unavoidable because the variability of the samples’ microstructures and compositions, and manual sample preparation, could more or less impact image brightness and contrast, leading to the need to sometimes manually adjust the contrast/brightness conditions during image acquisition.
Once the thresholds were established, the images of multiple locations were analyzed for each coating composition using home-made macros, considering both EDX quantitative mapping and the BSE imaging (step 6 in Figure 2). The Aphelion SDK 4.6.1 software can read the ASCI data from the CSV files containing a matrix with either the gray-scale level (for BSE images) or the weight percentage of each element normalized by the sum of the alloy elements and iron (for EDX maps) and retrace the phases.

2.4.2. Automatic Phase Attribution and Microstructure Analysis

Prior to quantitative microstructure analyses, the phases were attributed to each image using two different macros applied consecutively. The first macros used the BSE image and the cartography of zinc to isolate the area of the coating and to exclude the substrate and the resin. The BSE image allowed to exclude easily the zone of the resin, as it is the darkest, while the cartography of zinc, an element present in most of the phases of the coating, but not in the steel, allows to distinguish the coating from the substrate. Thus, an image, which is further named as the “mask”, of the coating can be created. The second macro was responsible for phase attribution and the quantitative analysis using the mask created by the previous macro, the BSE images, and the elemental maps of the Al, Zn, Mg, Si, and Fe.
The phase attribution to each pixel consisted of several steps. Firstly, the gray-scale threshold values were manually chosen by the user thanks to the BSE image. The following assumptions were made for this choice: based on the phase diagram of Al-Zn and the microstructure of other Al-rich coatings, it is expected that dendrites of Al, binary ZnAl, and pure Zn phases could be present. As previously noted, thanks to the atomic mass contrast of the BSE image, Al-rich phases are expected to be darker while Zn-rich phases whiter. The delimitation from the BSE analysis provides a better spatial resolution than the EDX analysis alone because of the smaller interaction volume of the BSE analysis. After this first manual gray-scale selection, a phase was attributed to each pixel automatically using previously defined criteria. The first criterion was the chemical composition based on the EDX mapping. The elemental thresholds based on the expected phases from the literature and the first measured compositions of the phases were used. One should note that some possible eutectic constituents, ternary ZnAlMg and binary ZnMg, cannot be identified by this pixel method because of their lamellar structures. They are formed by Zn2Mg and the pure Zn phase, with the main difference being lamellar interspacing and the presence of Al precipitates. These phases were identified by (1) a selection of lamellar Zn2Mg particles with a threshold determined by size, allowing for only the thin lamellar particles and no big precipitates to be considered, and (2) following the “extension” of the Zn2Mg and Zn phase, providing the zones of a lamellar structure in the areas where these phases match. Once the lamellar zones were found, an analysis of the total amount of Al, averaged through these zones, allowed for the differentiation of the ternary from the binary eutectics.
Initial verification of the procedure was made by comparison of the segmenting obtained by both methods, EDX and gray scale image analysis. When they provided the same segmentation, the assignment was considered correct; if certain points fell outside the defined thresholds, they were considered not identified. Globally, between 1.00% and 6.16% of the pixels stayed non-identified with this procedure in this work. One should note, however, that the reliability of the methods depends heavily on the resolution of the SEM and EDX data and therefore on the acquisition parameters used.
Once all the phases were identified for each pixel, it was possible to obtain information regarding the amount of the phases, the number of (isolated) clusters formed by a given phase, and their size and shape (step 7 in Figure 2). Furthermore, by applying the technique of dilatation, it is also possible to obtain the fraction of the interfaces that exist between different phases as schematically illustrated in Figure 2. The assembly of these data creates a new concept of a quantitative microstructure (Q-µstructure).
To obtain a good statistic of the measurement, at least 5 zones of 41 µm in width were analyzed with the same magnification.

3. Results and Discussion

3.1. Quantitative Microstructures of Three Coatings

An example of a typical cross-section microstructure of the coatings is presented in Figure 3, and the typical microstructures found on the extreme surface and at half thickness of different coatings can be seen in Figure 4.
The representative BSE images and the phase distributions, obtained by the quantitative analysis for the three coatings, corresponding to these images are shown in Figure 4 and Figure 5, respectively. One can see that all the coatings contain big dendrites of Al-rich phase (they were determined mainly using the gray-scale thresholding to obtain a better resolution) and interdendritic phases of different nature and amount. From Figure 5, it becomes clear that the main interdendritic phases in the AZ coating are binary ZnAl, pure Zn phase, and needles of Si. The addition of Mg results in the formation of new phases, such as Mg2Si or Zn2Mg. The sample with a low amount of aluminum contains almost no Mg2Si, but binary ZnMg eutectics with a lamellar structure. As for zinc-rich phases, with the addition of Mg, they change the morphology and are present only as a constituent of the lamellar eutectic phases (binary Zn-Zn2Mg- and ternary Zn-Zn2Mg-Al) rather than coarse ZnAl particles, observed on AZ samples. Furthermore, a thin FeAlSi intermetallic layer is formed between the steel and the coating in all the samples.
Table 2 represents the area fraction of different phases on the cross-sections of each coating, as indicated. Considering the Al-rich dendrites as a single Al-rich phase (Al(Zn) columns 2, 4, and 5 in the table), one can see that, in comparison to AZ coating, the addition of Mg increases the amount of sacrificial interdendritic phases around 2.5× times and significantly decreases the fraction of dendrites. The lowering of Al increases their amount. If Mg addition is accompanied by reducing the fraction of Al, the fraction of the dendrites is reduced, and the amount of binary ZnAl and Zn2Mg is increased by a factor of 9× times (compare AZ and L-AZM).
Table 3 describes the distribution of the interfaces between the dendrites of Al(Zn) and the interdendritic phases. Mostly, the dendrites are in contact with the binary ZnAl. However, the AZ sample has a significant fraction of the dendrites in contact with the Si phase, while in the AZM samples, some dendrites are in contact with the Mg2Si phase.
From Figure 3 and Figure 5, when the images from the extreme surface and half-thickness are compared, it is clear that there is a strong phase gradient in depth of the coating. When the coatings AZ and AZM are compared, the phases rich in Si, as Mg2Si and pure Si, nucleate at the interface with the steel and grow significantly, as can be seen by the high amount of these phases at the half-thickness. However, their amount at the extreme surface is very low, indicating that they do not grow enough to be present completely along the thickness of the coating. For the sample L-AZM, the Si-rich phases can be barely seen at either the half-thickness or the extreme surface, indicating that they are present only near the steel-coating interface. This result is in agreement with the expected solidification mechanisms of this family of coating, in which the Si phase is the first phase to nucleate [48]. Thus, it is expected that these phases will have a later influence on the corrosion mechanisms of the undamaged coating, but still can influence the sacrificial protection of steel by the coating if steel is exposed in scratches or cut edges. Furthermore, a higher amount of the Zn2Mg phase at the half-thickness in comparison to the extreme surface is evident for the L-AZM sample, indicating that the Mg phases will also not play an immediate role on the corrosion protection at the initial stages of the coating surface corrosion but could be more important for the scratch protection.

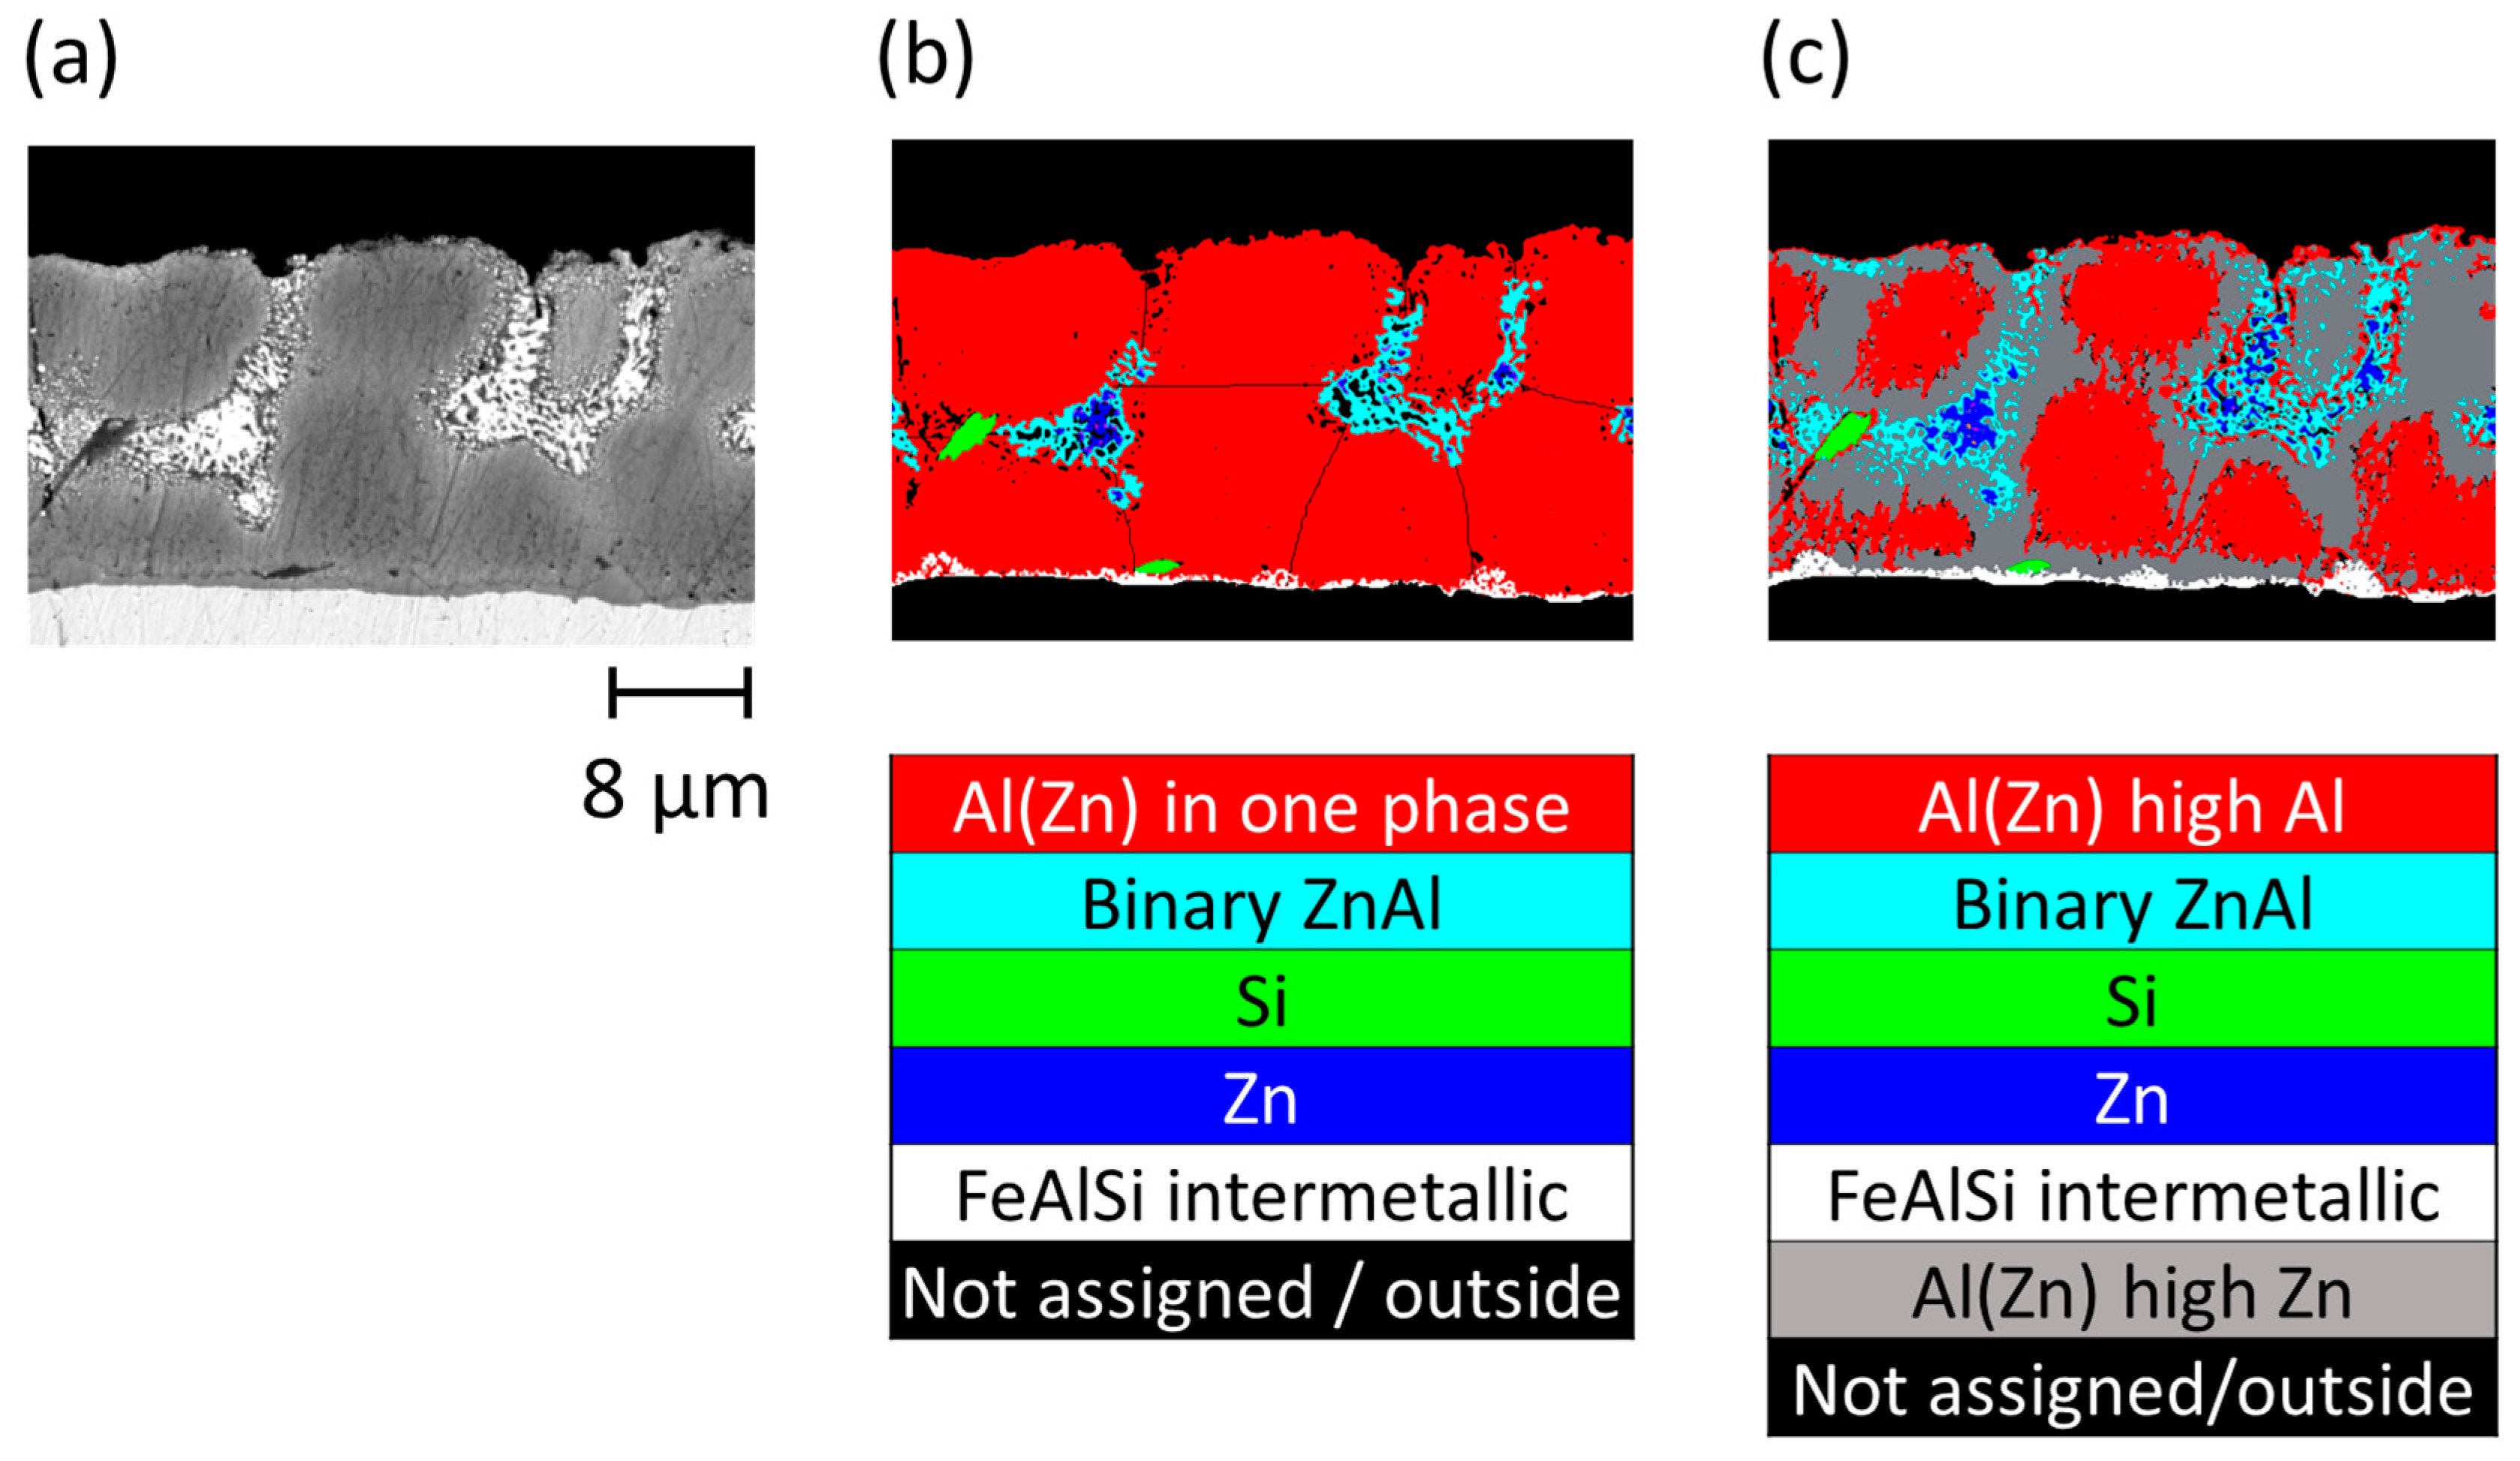
3.2. Al-Rich Dendrites on AZ

The attribution of Al-rich dendrites in Section 3.1. was made considering a homogenous phase, taking into consideration all the shades of gray inside it. Careful examination of the BSE images demonstrates a visible gradient of gray color inside the dendrite for AZ coating (not for the other two), with a darker color at the center, as it could be verified by the gradient in composition observed with the SEM-EDX quantification shown in Figure 6. When the profile of composition of aluminum and zinc inside the dendrite is analyzed at the cross-section of uncorroded samples, indeed it is possible to see that for the AZ coating, the amount of aluminum is significantly higher than at the borders, being as high as around 70 wt.% of Al in the bulk and 50 wt.% at the edges. This gradient is not detectable for the AZM and L-AZM samples (see Figure 6), for which Al content is almost constant and close to 60 wt.%. Thus, the addition of Mg to the AZ coating increases the chemical homogeneity of the Al(Zn) dendrites and decreases their interconnectivity.
In the literature, it is usually considered that the amount of Zn in the dendrite is around 40 wt.% [49]. To obtain a better understanding of the corrosion of AZ coating, it is of interest to separate the dendrite of AZ into two different components, richer (with around 70 wt.% of Al) and poorer in Al (with around 55 wt.% of Al). The creation of this new phase on the macro was made based mainly on the gray scale criteria, as it has a smaller noise than the EDX mapping. The quantitative results can be found in Table 2 (column 3 “AZ with new phase”) and the new phase identification is illustrated in Figure 7.
From the Aphelion results shown in Figure 7 and Table 2, it can be seen that almost half of the surface of the dendrites can be considered as Zn-rich. In Table 4, the analysis of the biggest cluster formed by this new phase is considered for five randomly selected representative zones of the coating cross-section, with a width of 41 µm. Taking into account the coating thickness of around 22 µm, one can conclude from the table that this phase can be percolating in the z direction because the height of the phase is in the same order of magnitude as the thickness of the coating. However, these phases do not form a percolating cluster in x-y directions because the cluster size is systematically less than 41 µm image width. Furthermore, it can be seen from Table 5, which quantitatively shows which phases are in contact with the steel substrate, that it is mainly in direct contact with the Zn-rich phase.

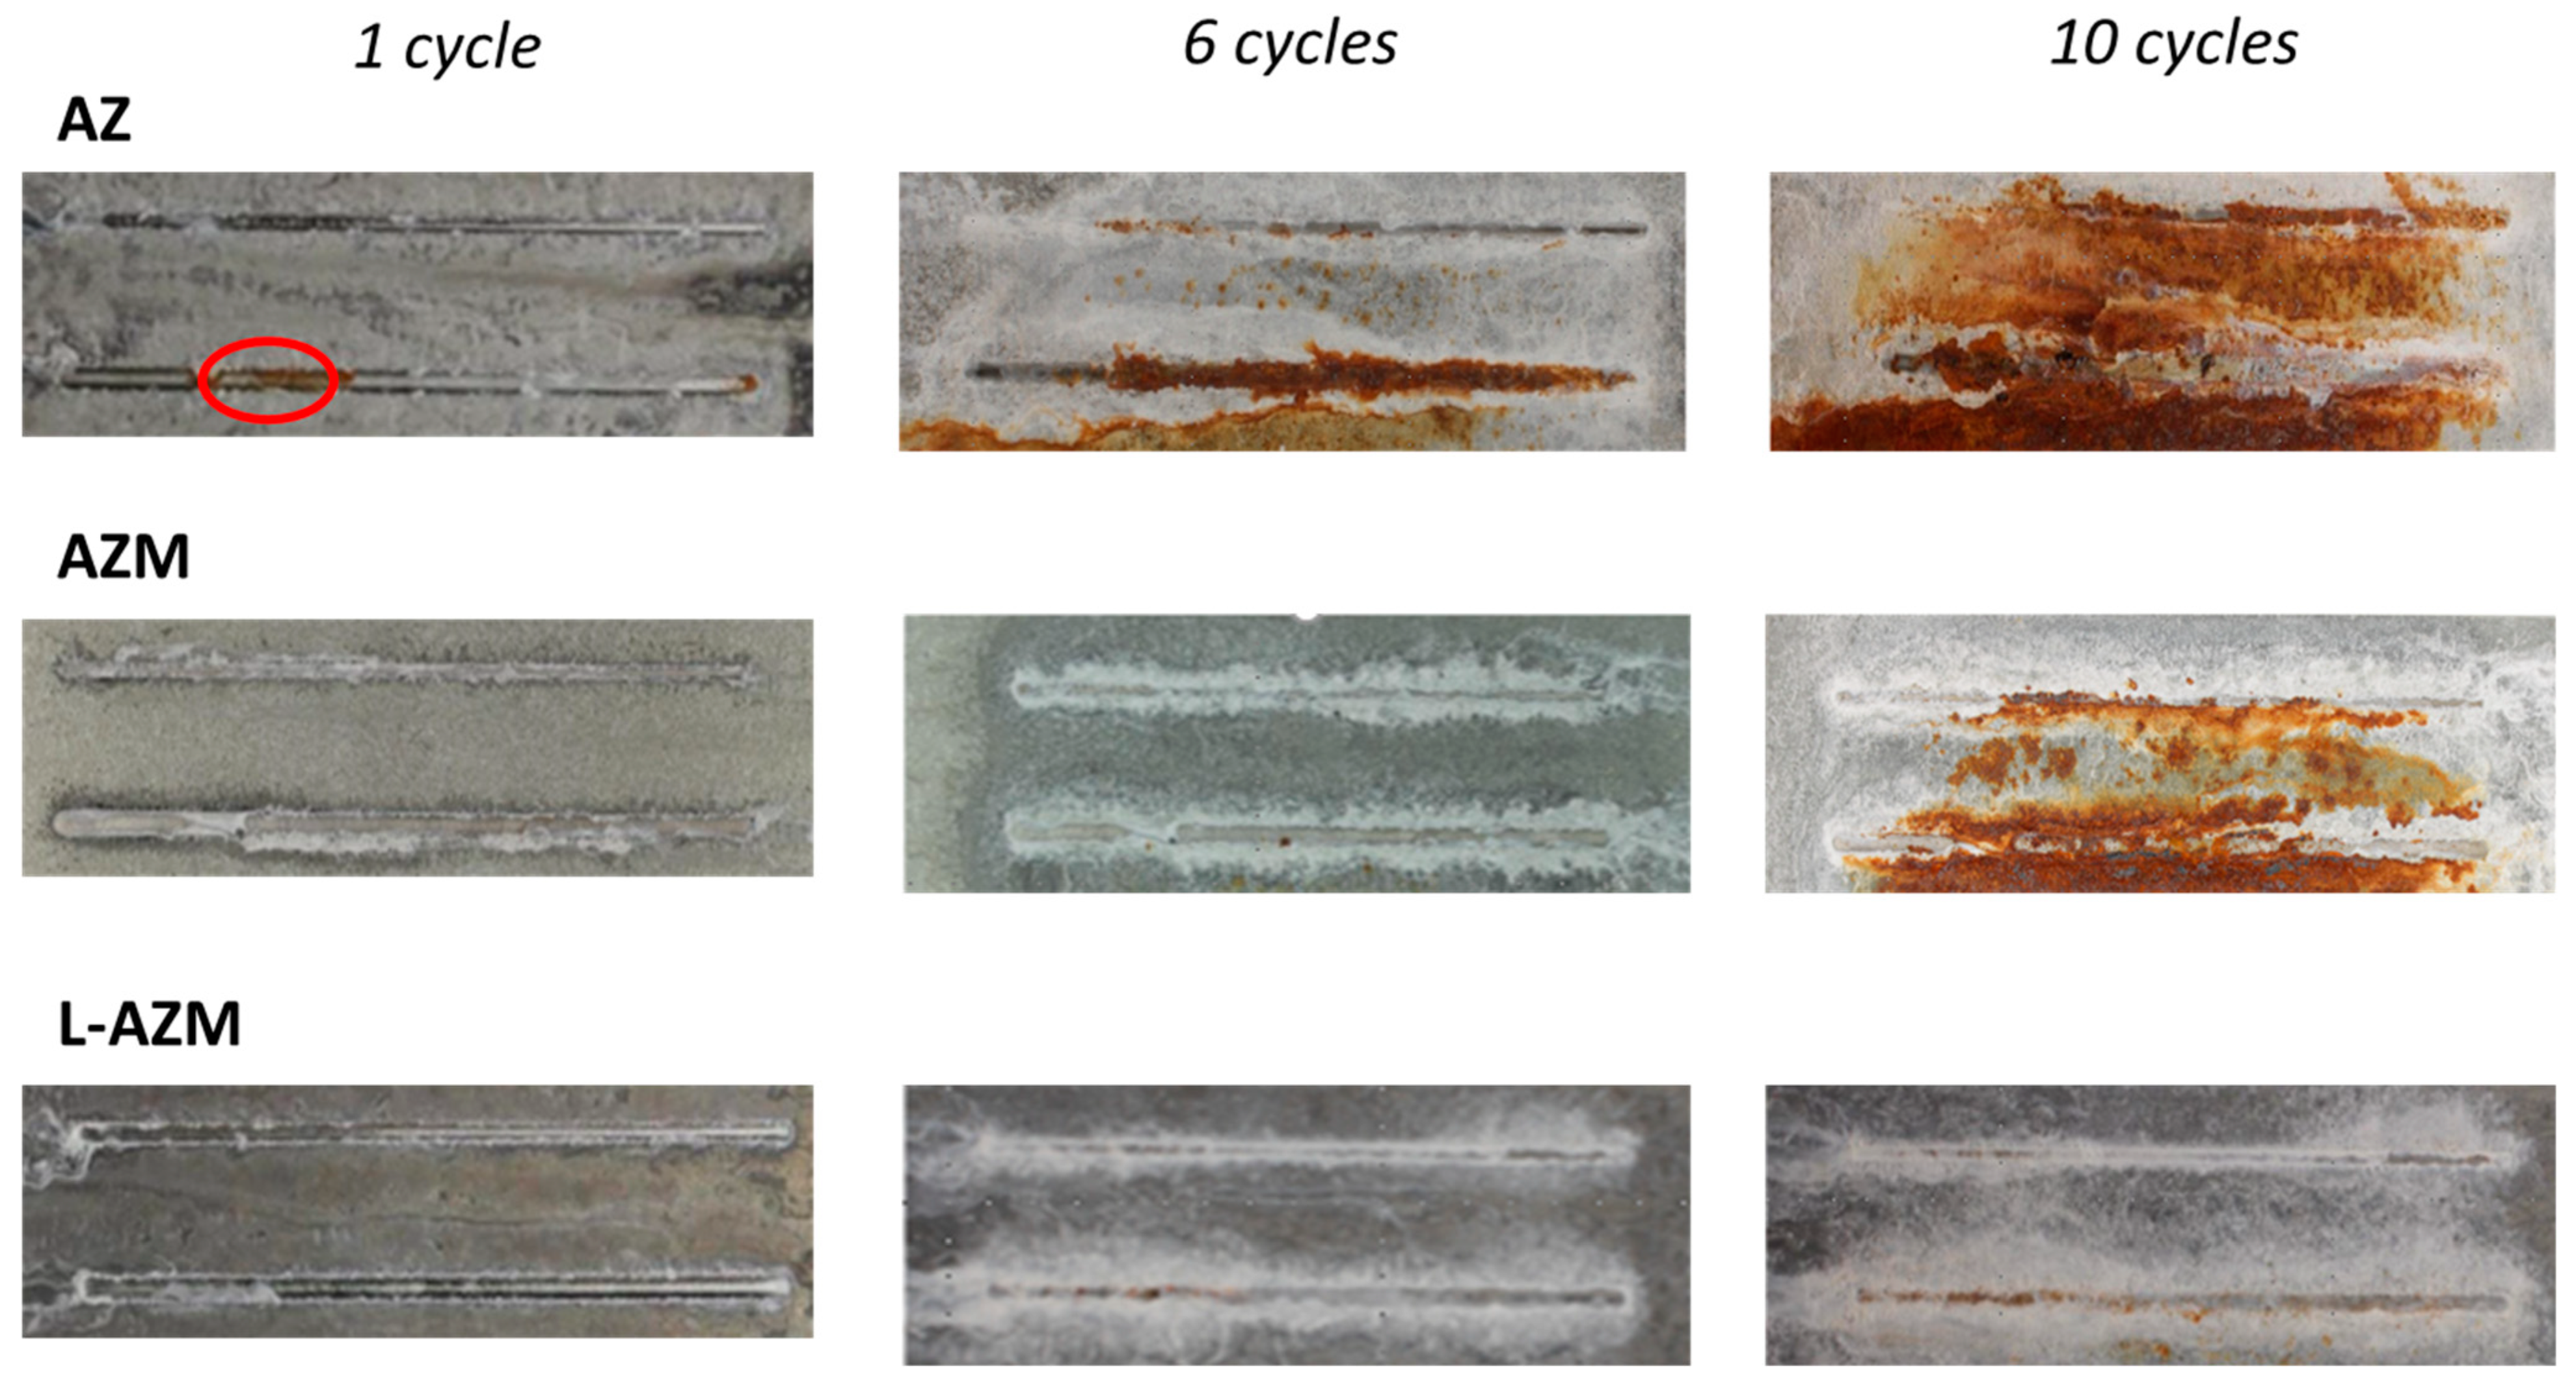
3.3. Accelerated Corrosion Tests

Macroscopic pictures in Figure 8 show the evolution of the appearance of the coatings after 1 week, 6 weeks, and 10 weeks of the cyclic corrosion test. The evolution of the scratches with different widths (2 and 3 mm) is shown to illustrate different levels of galvanic coupling between the coatings and the steel substrate. After only one week, it is possible to see that the AZ sample already shows some signs of early red rust in the scratch of 3 mm width, which is highlighted by the red circle in the figure. Furthermore, after 6 weeks of corrosion, both Mg-alloyed samples (AZM and L-AZM) still do not show red rust in the scratches, illustrating a good sacrificial protection by these coatings, while there is an increase in the amount of red rust for the AZ sample, covering the 3 mm scratch completely and at adjacent zones. With the increase in the test duration, however, red rust develops on the sample AZM, while the sample with lower Al still provides corrosion protection to the scratches.
To better understand the initial stages of corrosion, samples with only one scratch of 1 mm were subjected to the same accelerated corrosion test, but only for a period of one week. SEM observations of the scratch (Figure 9) allowed the detection of a significantly higher amount of corrosion products in the scratch for the sample with low Al in comparison to the other two samples. A slightly larger amount of corrosion products is also visible in the scratch of the AZ sample in comparison to the AZM sample.
SEM images and EDX maps of O, Al, and Zn shown in Figure 10a allow us to note a difference in the morphology of the corrosion products in the scratches made on different samples: a voluminous corrosion product on the AZ and more compact oxides on the AZM and the L-AZM. Corrosion product distribution can be visualized by the distribution of oxygen. For both the AZ and the AZM samples, corrosion penetrates deeply in the microstructure, while for L-AZM, corrosion penetration is significantly lower. By comparing the cartography of Al and O, it can be concluded that Al-rich dendrites are not consumed in the L-AZM sample, but their consumption is visible for the other two coatings. Additional observation can be made from Figure 10—Mg strongly reduces the volume and increases the compactness of corrosion products. This is coherent with the previously reported observations for ZnAl(Mg) [47,48,50] and AlSiZn(Mg) [17,51] coatings, demonstrating that Mg-alloying contributes to the rapid homogeneous coverage by protective corrosion products. In the literature, pitting was also reported for the AlSi-based coating with a small portion of Zn and Mg [51] and was attributed to selective Mg dissolution. In our case, coating consumption also seems to be less homogeneous for AZM than for L-AZM, which could probably be explained by the selective dissolution of Mg-rich phases. This hypothesis, however, needs to be taken with caution because the attack is too severe to distinguish, even in higher magnification images (Figure 10b), which phase has been consumed first.
Figure 10b presents a higher magnification view of the cross-sections of AZM and L-AZM coatings after 2 weeks of corrosion tests. One can clearly see that corrosion penetrates via interdendritic phases, which is consistent with the electrochemical prediction. The difference is clear in the cluster orientation. For AZM, the penetration is mainly oriented in depth from the coating surface to the coating/steel interface, while in L-AZM corrosion progresses much more on the surface in direction parallel to the coating surface. This is a clear indication of more interesting sacrificial protection of steel by the L-AZM coating, which is expected to take longer time to consume the coating until the steel substrate outside of the scratch and, therefore, to keep longer its sacrificial protection.
Interestingly, when the dendrite composition analysis close to the scratch is made for the corroded AZ sample after one cycle of the accelerated corrosion test, no gradient of the Al content can be found (see Figure 6). This justifies the necessity to describe the dendrites, taking into account the Al content gradient, and can also explain partial consumption of the dendrites during corrosion of the AZ coating and their stability in other coatings. Indeed, a high content of Zn in the solid solution is known to decrease the electrochemical potential of Al, making it more susceptible to corrosion.

3.4. Use of Quantitative Microstructure Data to Understand Corrosion of AlZnSi(Mg) Coatings

3.4.1. Sacrificial Capacity of Different Phases Composing the Coatings Versus Steel

From the SEM images presented in the previous sections, as well as from the quantitative results, it is noticeable that the microstructure of the AlZnSi(Mg) coatings is complex. The electrochemical potentials of these phases in a neutral NaCl solution found in the literature are shown in Table 6. From the values presented in the table, multiple galvanic couplings are expected between the substrate and the coating, as well as between the phases of the coating.
It can be seen from the table that the pure Si phase is cathodic with respect to all the other phases of the coating and steel; thus, it will create detrimental galvanic coupling in any corrosion condition. The Mg2Si phase has a low electrochemical potential and, when corroded, will liberate Mg2+ ions, which can buffer the pH at high values during precipitation of Mg(OH)2, which is favorable for the formation of compact and stable corrosion products [56]. Kairy et al. [57], however, showed that the behavior of Mg2Si when coupled with aluminum is highly dependent on the pH. At acidic and neutral pH in a chloride-containing environment, Mg2Si is anodic to Al and, at neutral pH, it can create amorphous and non-adherent corrosion products. At alkaline pH, Mg is, however, cathodic versus Al. So, a more detailed understanding of whether the Mg2Si phase is sacrificial or not in selected conditions requires localized pH measurements. Nevertheless, this is not detrimental for our study because quantitative analysis of the microstructure shows a very low fraction of Mg2Si, as can be seen in Table 2. Moreover, Table 5 demonstrates that Mg2Si is rarely in direct contact with the substrate. This suggests that the long-term sacrificial capacity of the coating should not be due to the presence of Mg2Si. At the same time, Zn and Al-rich phases, which are the main phases in contact with the steel substrate and constitute the majority of the coating, are expected to be the most important contributors to the sacrificial capacity of the coating.
The binary ZnAl, Zn2Mg, and pure Zn phases have a very low electrochemical potential, which is anodic to the steel (Table 6), and thus can be classified as sacrificial phases. The dendrites of aluminum, on the other hand, have a behavior highly dependent on the environment. It is well known that Al creates a stable passive layer at neutral pH. Chloride ions, however, can break the oxide layer, resulting in a more anodic potential [58]. Furthermore, the presence of Zn in solid solution also reduces the passivation capacity of Al [59,60]. Nevertheless, even in a chloride environment, the dendrites remain cathodic to the Zn-based interdendritic phases. Several studies indeed have shown preferential corrosion of AZ coatings, with the dendrites playing the role of a skeleton by holding the corrosion products compact in the microstructure, even in chloride-containing environments [6,61,62,63]. Similarly to Mg2Si, Zn2Mg also liberates Mg2+ ions during corrosion and can be selectively dissolved and stabilize barrier corrosion products in different environments [50,56,64] that can slow down the corrosion of the coating.
From the data reported in the literature about the sacrificial protection of Zn-Al and Al coatings for steel [18], sacrificial protection from Al and Al-rich phases (>50% of Al) still occurs in the environment with very high chloride contamination (>100 mg Cl m−2 day−1). Moreover, the addition of more Zn in Al reduces its corrosion potential by more than 100 mV [54,65]. One could therefore expect that in the accelerated tests, at least the part of the dendrites enriched by Zn could be sacrificial for the steel substrate. It is observed, however, that red rust is present from the initial cycles of the corrosion test, indicating low sacrificial protection of the dendrites, probably because the accumulated chloride concentration is not yet sufficient to activate galvanic protection by Al-rich phases. On the other hand, once the chloride content is sufficient to activate Al-dendrites, according to the data presented in Table 2, there is a high contact area of the dendrites with the Si phase in AZ. This phase is cathodic to both steel and Al and will hence create a detrimental galvanic coupling, accelerating the consumption of the dendrites but reducing their sacrificial effect for the steel.
If considering the entire coating and not individual phases, both sacrificial protection and formation of corrosion products are expected to be strongly related to the corrosion of the Zn-rich interdendritic phases, in particular, binary ZnAl. The interconnectivity of sacrificial phases could allow a better repartition of the anodic current, thus reducing the corrosion rate. Previous works have demonstrated that even 2 wt.% Mg addition to the AZ coating results in a significant increase in the interconnectivity of Zn and Zn-Mg particles [66]. AZ coatings without and with the addition of 2 wt.% of Mg demonstrated the same corrosion potential, but a corrosion current almost three times lower [15], illustrating the importance of the connectivity of the sacrificial phases. In the next section, we will discuss the application of the Q-µstructure description to understand the connectivity of the sacrificial phases and corrosion behavior of the AlZnSi(Mg) coatings.

3.4.2. Percolation Approach to Sacrificial Protection by Quaternary AlZnSi(Mg) Coatings

To verify whether interconnectivity exists or not, the sacrificial phase distribution was analyzed based on the percolation approach [36,67], introduced in Section 1. In the case of the studied system, the percolation threshold, pc, can be considered as a critical volume fraction of the sacrificial phases in the coating, which guarantees that the phases, which volume factions in the coating are higher than this threshold, can form an interconnected cluster percolating through the coating to an infinite distance, thus ensuring long term sacrificial protection. Based on the literature, the pc value for 3D systems is usually included between 10.7% and 24% [36,37]. Crystalline structures are often modeled by 3D Voronoi networks with a site percolation threshold of 14.5% [68]. For a 2D Voronoi network that could simulate a 2D film, or coating if the agglomerate size is comparable with the coating thickness, the site percolation threshold is about 71.5% [69]. Considering quantitative results presented in Table 2, it is visible that the area fraction of sacrificial interdendritic (Zn or Mg rich) phases in both the AZM and L-AZM coatings is close to or higher than the percolation threshold of the 3D-Voronoi network, while for AZ, no continuous cluster of the interdendritic Zn-rich phase is expected.
To validate if percolation indeed takes place, the width and height of the biggest continuous cluster of interdendritic phases were measured for different cross-sectional images of the three coatings, and the results are shown in Table 4 and Table 7. The height of the sacrificial cluster is in the same order of magnitude as the thickness of the coating for the AZM and L-AZM coating, indicating the percolation in the z axis. Furthermore, the cluster’s width is the same as the width of the analyzed pictures, qualitatively confirming percolation of the sacrificial phases expected from their fraction and percolation theory. For the AZ coating, the cluster size is less than the coating thickness or image width, confirming the absence of a percolating cluster, expected from the phase’s fractions.
Based on the information of the Q-µstructure, it can therefore be expected that the AZ coating will present the worst sacrificial protection among the three studied compositions, as it contains the lowest amount of sacrificial phases, no percolation, and critical coupling of the dendrites and Si phase. Furthermore, it is expected that the L-AZM will have a better performance than the AZM due to the increase in the amount of sacrificial phases, resulting in a better distribution of the anodic current and a more homogeneous formation of corrosion products.
The experimental results are in coherence with these expectations about both the overall coating performance and the sacrificial capacity of different phases. The macroscopic photos after the accelerated corrosion test in a chloride-containing environment (Figure 8) confirm the hypotheses made based on the Q-µstructure, with the sample L-AZM having the best behavior and AZ having the worst sacrificial protection.
Indeed, only small but homogeneous thickness of the L-AZM coating is corroded (Figure 10). This can be explained by taking into account that, for this coating, sacrificial phases form an extended percolating network with a lot of dangling bonds, so Al dendrite consumption is delayed, and dissolution of sacrificial phases close to the surface contributes to the protection of the scratch. Protective corrosion products are also expected to be formed homogeneously on the surface during corrosion of the interdendritic phase [50,56,70].
For the AZM sample, the red rust development is delayed; however, once started, it spreads quickly (Figure 8). This can also be explained considering both percolation and corrosion products distribution. In this coating, the fraction of the interdendritic phases is lower while the dendrites are close to the 2D percolation, so consumption of the interdendritic phases leads to a rapid penetration of corrosion in the z axis and increased galvanic coupling, which occurs not only between the scratch and sacrificial Al, but also with the newly exposed zones from the substrate far from the scratch. The creation of these preferential paths until the substrate (pits) is in agreement with the previous studies [66]. At the same time, far from the scratches, the consumption of the interdendritic phases led to an earlier start of the dendrite network consumption, visible in Figure 10, which will, in the long term, decrease their sacrificial capacity. The corrosion product formation is also less homogeneous because of the tendency to localize at cathodic zones. Comparing AZM and L-AZM, the higher amount of percolating sacrificial phases in the sample with a low amount of Al means that for the same scratch area, the anodic current density will be lower, thus reducing the corrosion rate. Taking into account the homogeneous coating corrosion, there will be a more homogeneous distribution of the corrosion products.
For the AZ sample, the most sacrificial phases are not interconnected, so they are rapidly consumed locally near the scratch (but not only) and the scratch becomes not cathodically protected. With time, the Al dendrites are activated by the accumulation of chloride; however, their sacrificial capacity seems to be insufficient at least at initial quantities of chloride accumulated in the tests used in the present work.
From the cartography of Al and O at 1 week of the accelerated test in Figure 10, it can be seen that, for L-AZM, the corrosion is restrained to the interdendritic zones and stays superficial (developed in two dimensions via interdendritic phases). For the AZM coating, the cartography of O clearly shows the formation of corrosion paths that extend until the steel substrate. In contrast, there is an initial consumption of the dendrites of Al(Zn) for the AZ and AZM. In L-AZM, the coating consumption is mostly superficial and dendrites are not consumed. For the AZ sample, the low amount of interdendritic phases, in addition to the critical galvanic coupling of the dendrites with silicon, will result in an early activation of this phase. This confirms the previous hypothesis of the growing area of the cathodic zones, which will further increase the galvanic coupling, also activating the dendrites.
The tentative corrosion mechanisms of AlZnSi(Mg)-coated steel discussed above are schematically represented in Figure 11, with the accent on the interconnectivity between the interdendritic phases in different compositions. Briefly, higher connectivity increases the resistance of aluminum-based coatings, reducing the consumption of more sacrificial phases and modifying the distribution of corrosion products. At the same time, it can facilitate the creation of corrosion paths until the substrate, generating cathodic zones. The interconnectivity of sacrificial phases can be analyzed with the Q-µstructure approach. In the long term, it is expected that the new cathodic zones created in high Al-containing coatings will further accelerate the corrosion behavior, quickly corroding the remaining phases. With lower Al, the formation of corrosion products will reduce the corrosion rate of the interdendritic zones, significantly increasing the time required for corrosion to reach the substrate.
To conclude, the results confirm that to obtain an optimal performance combining initial and long-term protection, it is important to control the quantity of sacrificial percolating phases sufficient for their percolation and ensure formation of protective corrosion products before significant consumption of the coating depth.

4. Conclusions

In this work, the concept of a Q-µstructure of quaternary coatings, containing information on the nature of the phases, their amount, shape factor, and their vicinity, was introduced and applied to understand the microstructure and sacrificial protection of steel by a AlZnSi(Mg) coating (AZ (55 wt.% Al, 1.6 wt.% Si, Zn), AZM and L-AZM). The corrosion performance of coated steels was evaluated by cyclic accelerated corrosion tests in a climatic chamber with salt spray phase using 5 wt.% NaCl neutral solution. The focus was made on the evaluation of the sacrificial capacity of the coatings for the steel substrate, simulated with samples scratched until the substrate. The results demonstrated that the Mg alloying of AlZnSi coatings and a modification of the ratio between Al and Zn in the coating, for the compositions in the range of 30 wt.% < %Al < 45 wt.%, affected both the connectivity of sacrificial interdendritic phases and the formation of protective compact corrosion products. This new family of coatings can be a promising solution for a wide range of potential applications in the industries traditionally using zinc-based coatings, such as the automotive and construction industries, but also in the energy sector; for instance, for appliances and electrical equipment such as cable trays and solar structures. Their application can be particularly interesting if zinc contamination is an issue or when both perforating and sacrificial protection are necessary.
The main observations can be summed up as follows:
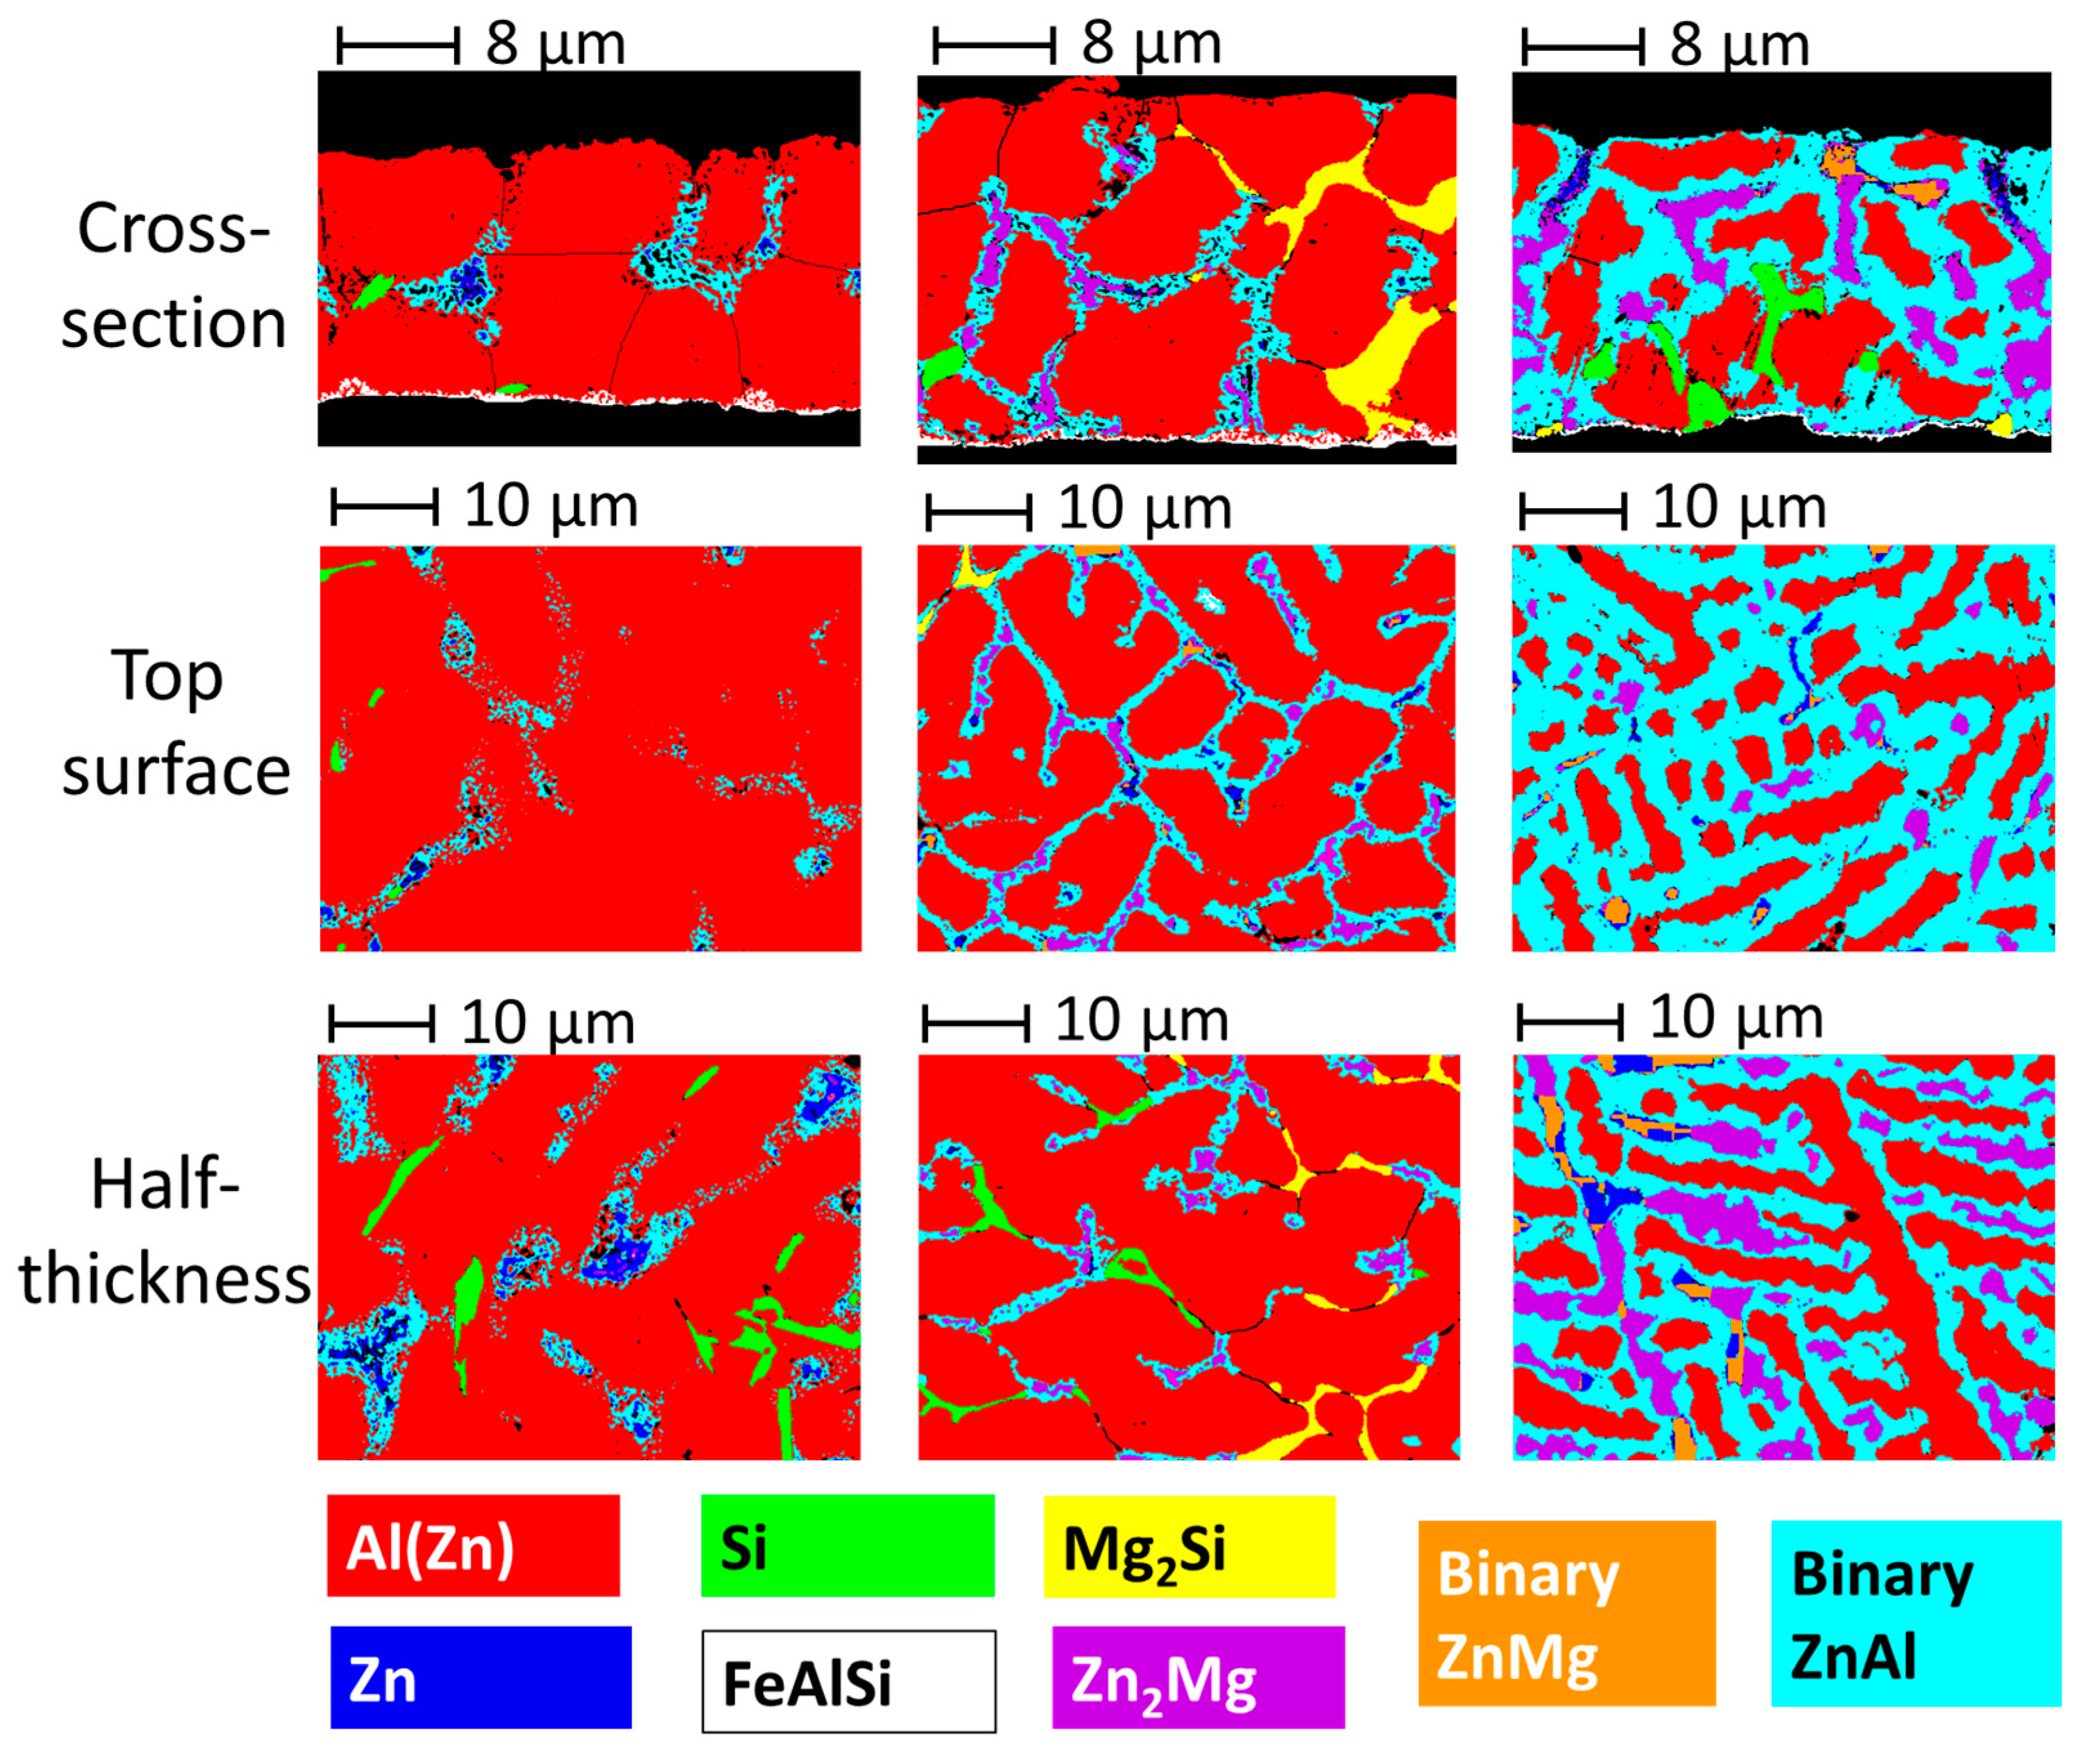
  • All the coatings contain a big fraction of Al(Zn) dendrites. For the AZ coating, a gradient of aluminum composition was observed on this phase, varying from 70 wt.% in the center to 40 wt.% at the edges. For the AZM and L-AZM, with the presence of Mg, the composition was more homogeneous, around 60 wt.%.
  • The interdendritic phases for the AZ coating are as follows: binary ZnAl, pure Si needles, and pure Zn phase.
  • The addition of Mg to the AZ coating leads to the formation of new interdendritic phases, Zn2Mg and Mg2Si, as well as an increase in the overall quantity of sacrificial phases.
  • The reduction in the amount of Al results in the formation of a binary Zn-Mg phase, as well as almost complete suppression of the formation of Mg2Si, with a significant increase in the amount of interdendritic phases, especially the binary ZnAl.
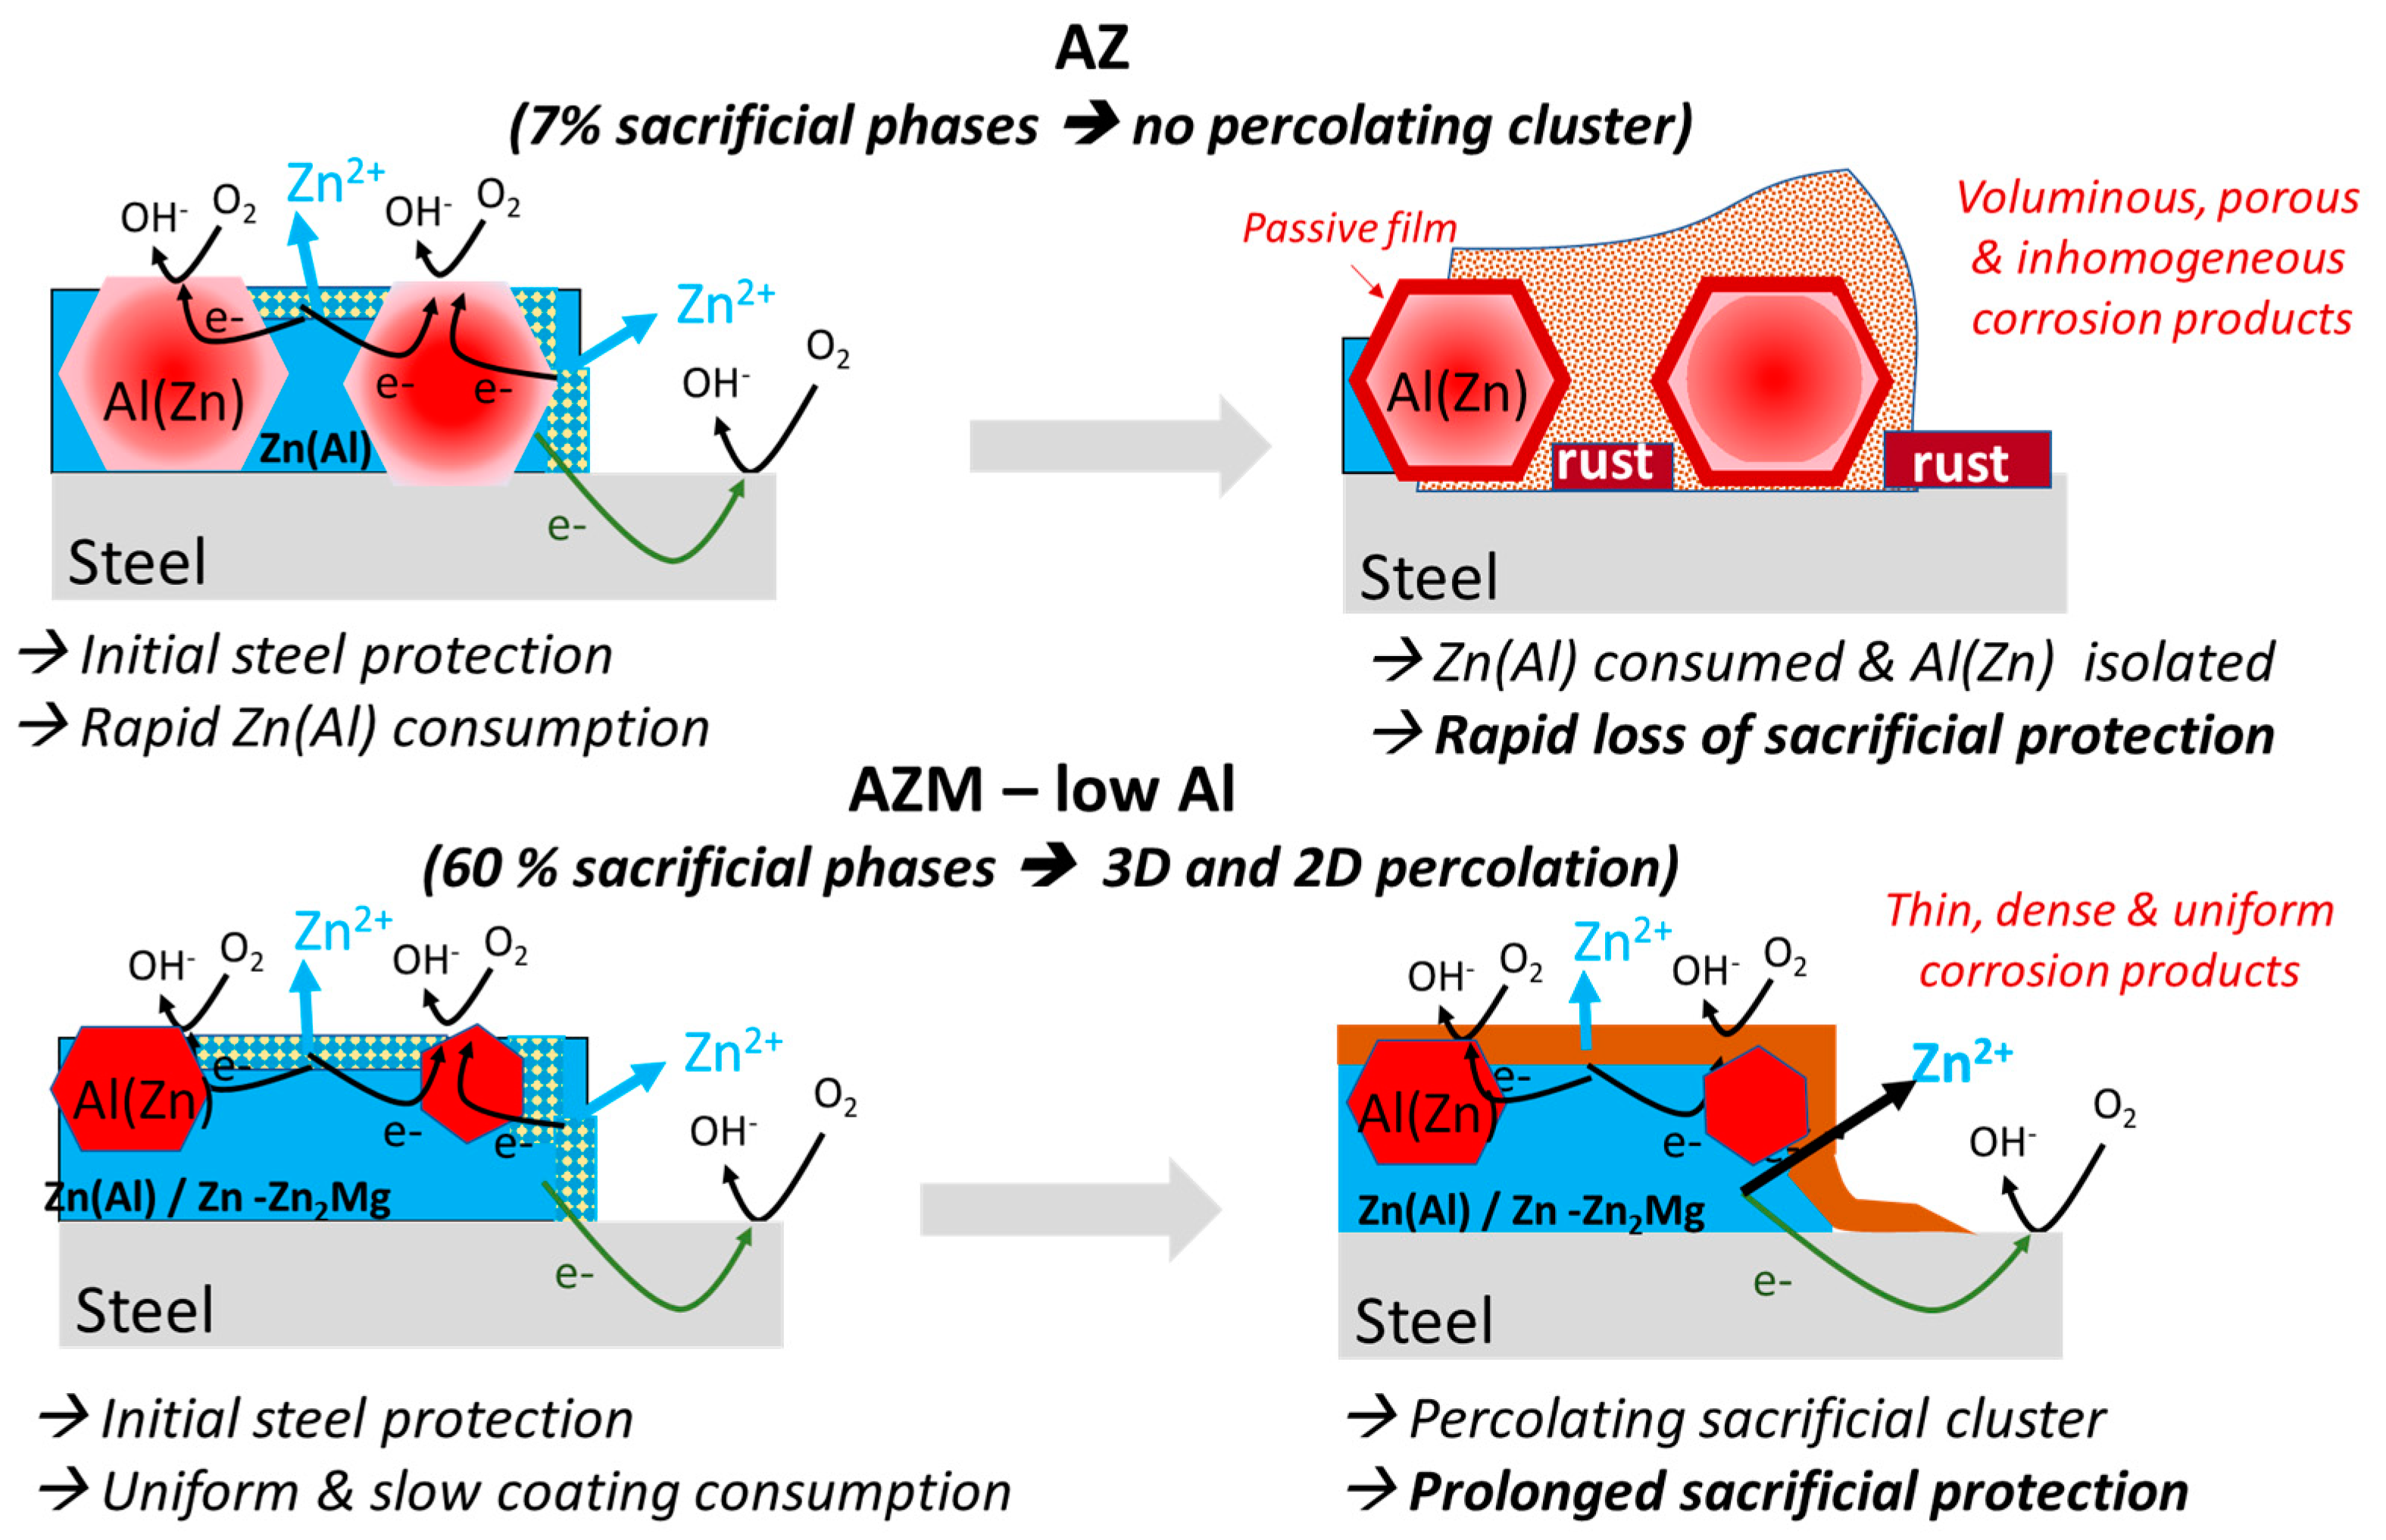
  • Quantitative analysis suggests that the interdendritic phases form a 3D percolating cluster in the AZM and L-AZM coatings, but not in AZ. Percolation of sacrificial phases should improve the sacrificial capacity of the coating as it shares the anodic current more homogeneously, reducing the corrosion rate. From a percolation approach, the L-AZM coating is expected to demonstrate the best performance for the steel protection.
  • Accelerated corrosion tests of the samples with scratches until the steel substrate confirmed the predictions from the percolation model. L-AZM has the best sacrificial protection of scratches, while AZ has the worst. The AZM took a longer time to begin the formation of red rust in comparison to AZ; however, once it was formed, it propagated quickly.
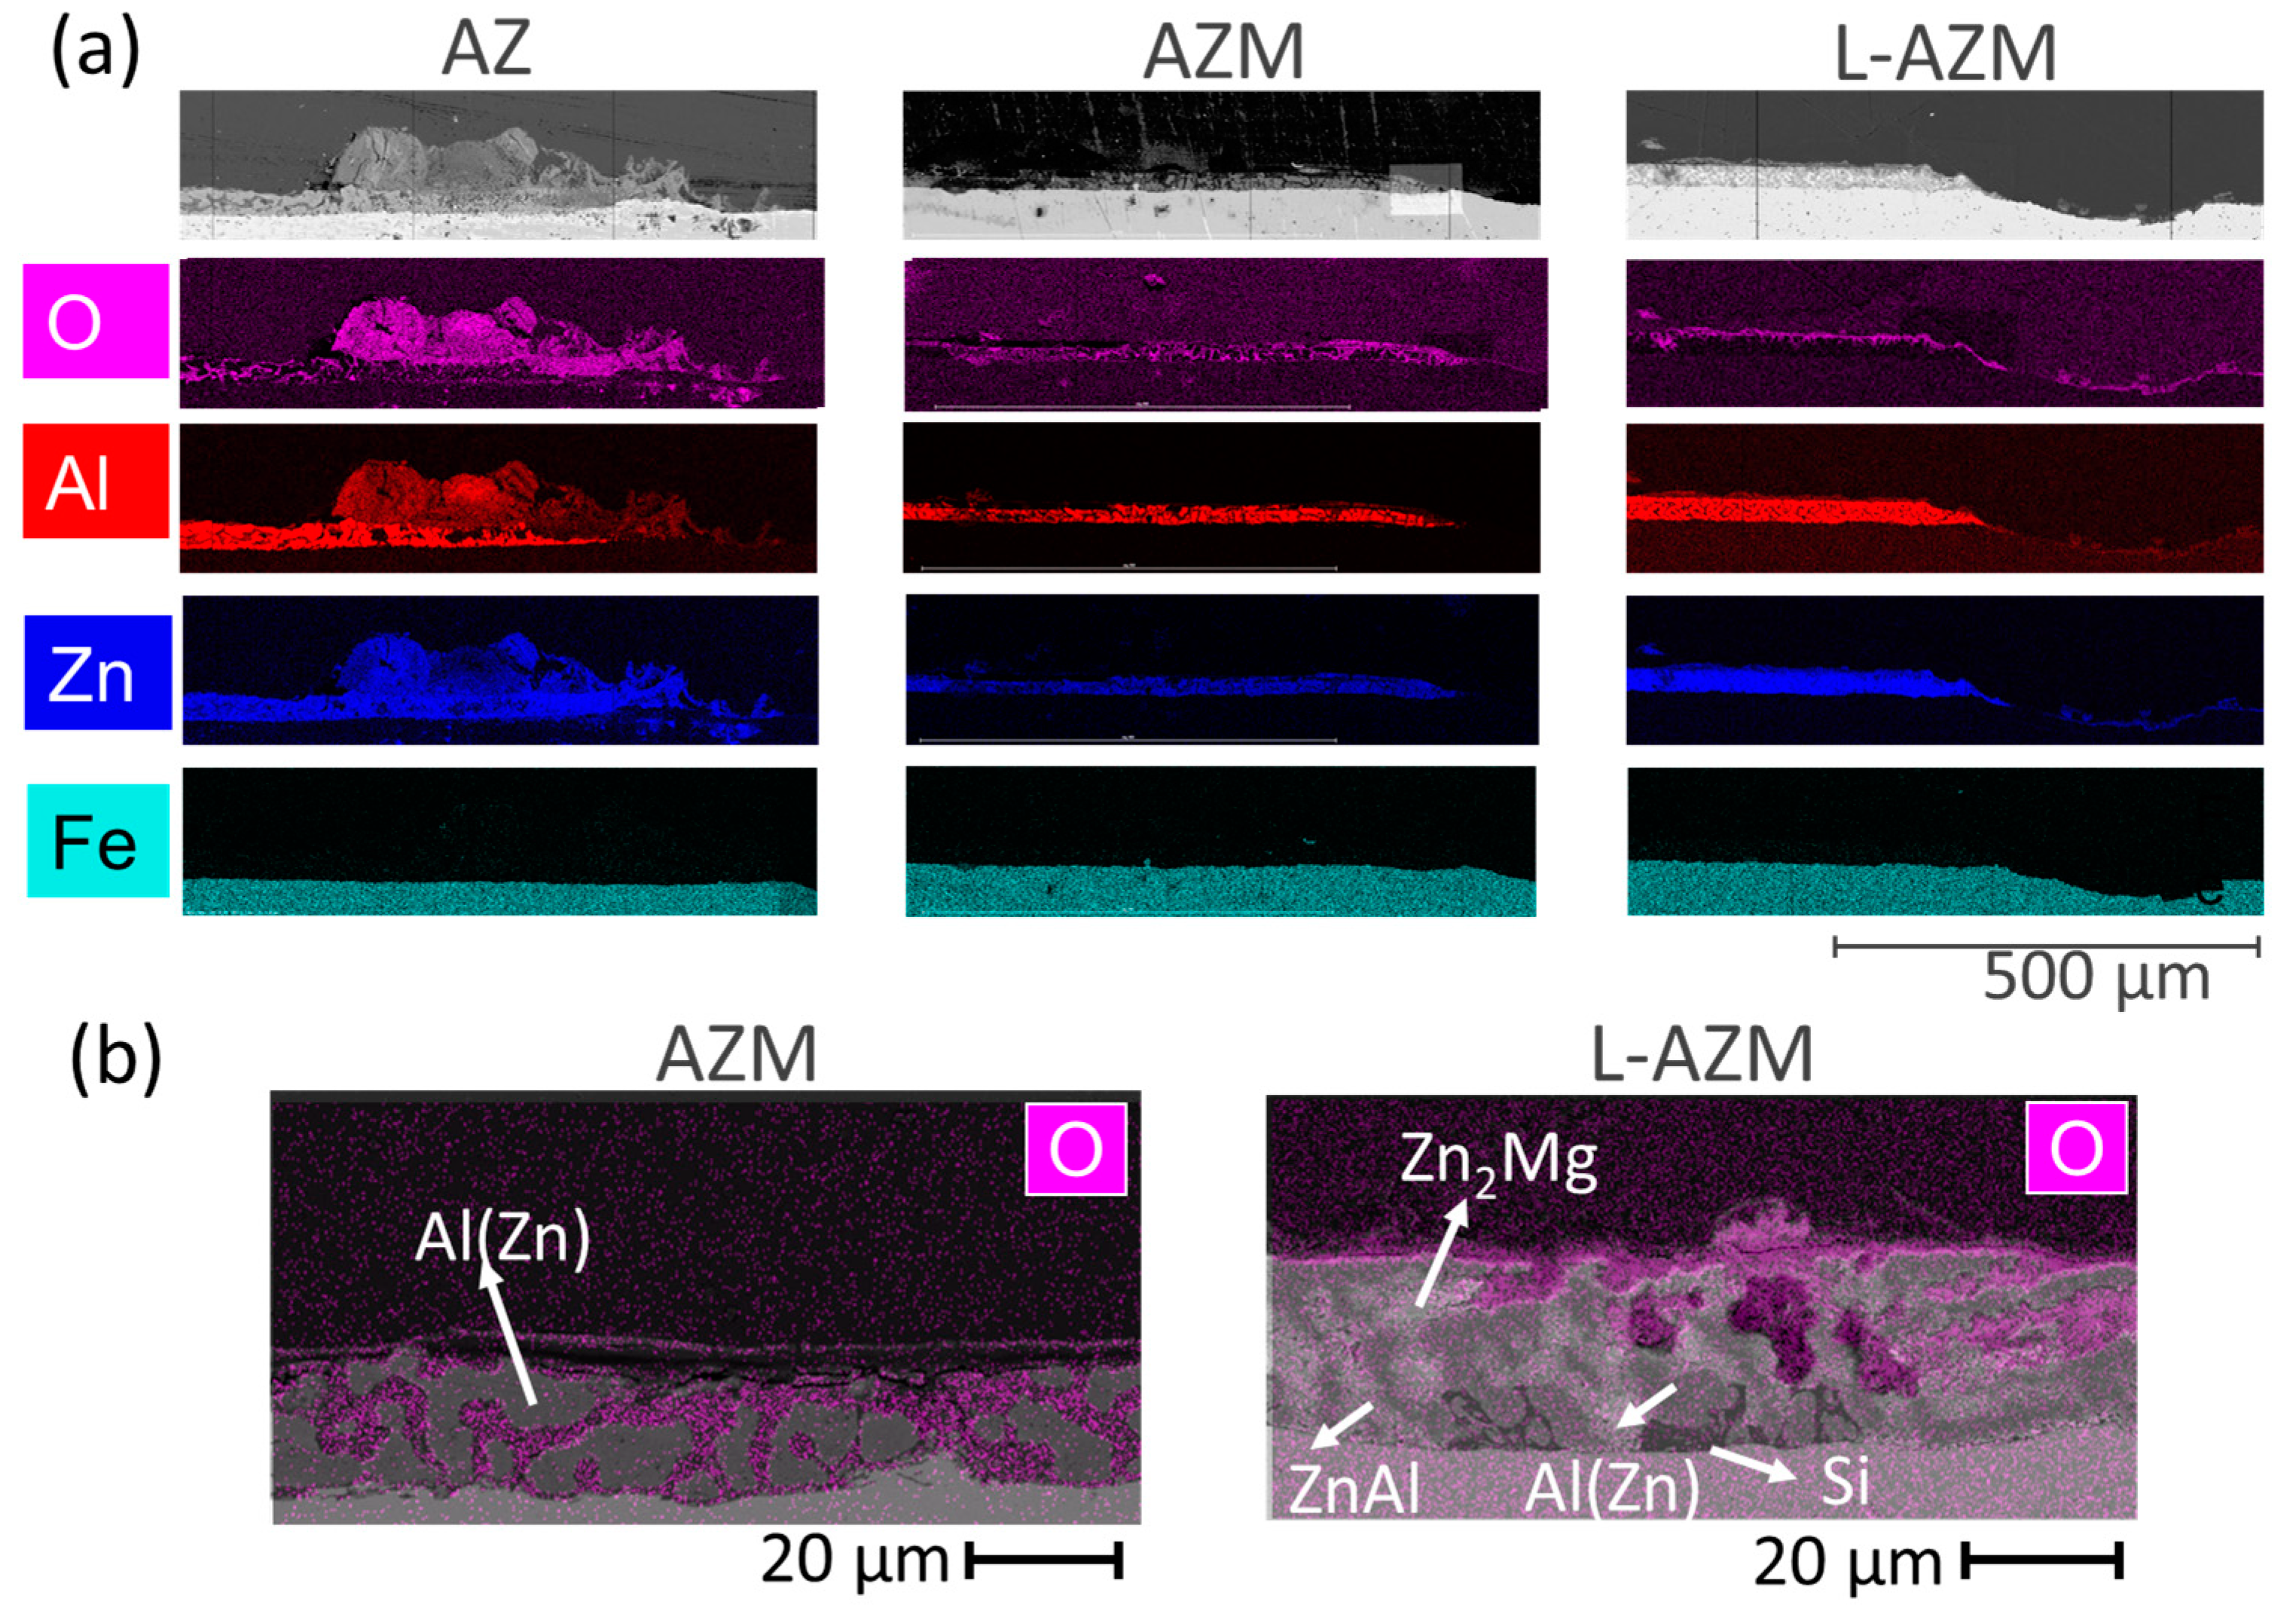
  • Combined SEM-BSE and EDX analyses of the surface and the cross-sections near the scratch confirmed the most homogeneous deposition of corrosion products in the scratch for the sample L-AZM and the lowest for the AZM. Furthermore, voluminous corrosion products were formed on the coating for the AZ sample.
  • Corrosion of the AZ coating occurred not only in the interdendritic zones, but the dendrites were also partially corroded. A strong gradient of composition was found inside the dendritic phase before corrosion, with a Zn fraction of 40% at the borders and 20% in the center. The dendritic skeleton that remained after corrosion had the composition of the central part, indicating that the corroded zones were the areas with a higher amount of Zn. Thus, the dendritic phase should be considered in two phases: more and less rich in Al.
  • Percolation, though it has the beneficial effect of reducing the anodic current, can facilitate the formation of corrosion pits until the substrate when there are not enough sacrificial phases and no formation of protective corrosion products. This increases the cathodic zones, changing the cathodic to anodic areas ratio and thus further increasing the corrosion rate of the coating. The formation of these corrosion paths was confirmed by the cross-sectional view. A more detailed analysis of the role and nature of the corrosion products will be presented in further publications.
From the methodological point of view, comparing results of the corrosion tests and the predictions about the phase connectivity from the percolation theory, shown in the work, allows us to conclude that the 2D percolation of sacrificial phases in the coating contributes to improved and longer sacrificial protection, thanks to the more homogeneous and, hence, less deep coating consumption. At the same time, only 3D percolation without 2D percolation can be dangerous for coatings because localized coating consumption can occur too quickly, and the creation of local cathodes can accelerate the overall corrosion. Additionally, in the long term, sacrificial protection by the coating should be completed by the barrier protection from corrosion products. The role of phase connectivity for the corrosion product formation needs to be further understood, but it seems that more homogenous coating consumption also creates a more homogenous corrosion product network, which is expected to be beneficial for corrosion protection.

Author Contributions

Conceptualization, T.M.A. and P.V.; methodology, T.M.A., G.A.C.S., B.R. and P.V.; software, G.A.C.S. and B.R.; validation, T.M.A., G.A.C.S., B.R. and P.V.; formal analysis, G.A.C.S.; investigation, G.A.C.S.; resources, T.M.A.; data curation, G.A.C.S.; writing—original draft preparation, G.A.C.S. and P.V.; writing—review and editing, G.A.C.S., T.M.A. and P.V.; visualization, G.A.C.S. and P.V.; supervision, T.M.A. and P.V. All authors have read and agreed to the published version of the manuscript.

Funding

This research was partly supported by the French National Agency for the Research and Technology (ANRT) with the contract number CIFRE 2022/0196. The funder was not involved in the study design, collection, analysis, interpretation of data, the writing of this article or the decision to submit it for publication.

Data Availability Statement

The raw data supporting the conclusions of this article will be made available by the authors on request.

Acknowledgments

The authors would like to thank Thomas Allély, Christian Allély, and Rémi Cavallotti for all the fruitful discussions that made this project possible.

Conflicts of Interest

Authors Guilherme Adinolfi Colpaert Sartori, Blandine Remy, and Tiago Machado Amorim were employed by the company ArcelorMittal Research SA. The remaining authors declare that the research was conducted in the absence of any commercial or financial relationships that could be construed as a potential conflict of interest.

References

  1. Koch, G. 1—Cost of corrosion. In Trends in Oil and Gas Corrosion Research and Technologies; El-Sherik, A.M., Ed.; Woodhead Publishing Series in Energy; Woodhead Publishing: Boston, FL, USA, 2017; pp. 3–30. [Google Scholar] [CrossRef]
  2. Bierwagen, G.P. Reflections on corrosion control by organic coatings. Prog. Org. Coat. 1996, 28, 43–48. [Google Scholar] [CrossRef]
  3. Spennemann, D.H.R. Stanislas Sorel and the origins of cold galvanising. Trans. IMF 2021, 99, 115–120. [Google Scholar] [CrossRef]
  4. Marder, A.; Goodwin, F. The Metallurgy of Zinc Coated Steels; Elsevier: Cambridge, MA, USA, 2023. [Google Scholar]
  5. Borzillo, A.R.; Crowley, J.E.; Horton, J.B. Ferrous Metal Article Coated with an Aluminum Zinc Alloy. U.S. Patent US3343930A, 26 September 1967. [Google Scholar]
  6. Moreira, A.R.; Panossian, Z.; Camargo, P.; Moreira, M.F.; da Silva, I.; de Carvalho, J.R. Zn/55Al coating microstructure and corrosion mechanism. Corros. Sci. 2006, 48, 564–576. [Google Scholar] [CrossRef]
  7. Monnoyer, M.; Corlu, B.; Amorim, T.M.; Dosdat, L.; Dieu, C. Interest of new generation Zn-Al3.7-Mg3.0 coatings for the industry and construction market. In Proceedings of the 10th International Conference on Zinc and Zinc Alloy Coated Steel Sheet (Galvatech 2015), Toronto, ON, Canada, 31 May–4 June 2015; Association for Iron & Steel Technology: Warrendale, PA, USA, 2015; pp. 231–238. [Google Scholar]
  8. Luba, M.; Mikołajczyk, T.; Mikolajczyk, T.; Pierozynski, B. Comparison of the Corrosion Resistance of Commercial coated steel and hot-dip Zn Coatings under Changing Environmental Conditions. Int. J. Electrochem. Sci. 2019, 14, 10306–10317. [Google Scholar] [CrossRef]
  9. Tsujimura, T.; Komatsu, A.; Andoh, A. Influence of Mg content in coating layer and coating structure on corrosion resistance of hot-dip Zn–Al–Mg–Si alloy coated steel sheet. In Proceedings of the Galvatech ’01, International Conference on Zinc and Zinc Alloy Coated Steel, Brussels, Belgium, 26–28 June 2001; pp. 145–152. [Google Scholar]
  10. Wang, S.; Zhou, W.; Chen, S.; Ma, R.; Du, A.; Zhao, X.; Fan, Y.; Li, G. Study on corrosion behavior II of hot-dipped Zn-6Al-3Mg alloy coating: Surface oxide layer and ternary eutectic corrosion. J. Alloys Compd. 2024, 1008, 176534. [Google Scholar] [CrossRef]
  11. Tanaka, S.; Honda, K.; Takahashi, A.; Morimoto, Y.; Kurosaki, M.; Shindo, H.; Nishimura, K.; Sugiyama, M. The performance of Zn–Al–Mg–Si hot-dip galvanized steel sheet. In Proceedings of the Galvatech ’01, International Conference on Zinc and Zinc Alloy Coated Steel, Brussels, Belgium, 26–28 June 2001; pp. 153–160. [Google Scholar]
  12. Morimoto, Y.; Honda, K.; Nishimura, K.; Tanaka, S.; Takahashi, A.; Scindo, H.; Kurosaki, M. Excellent corrosion-resistant Zn–Al–Mg–Si-Si alloy hot-dip galvanized steel sheet “Super Dyma”. Nippon Steel Tech. Rep. 2003, 87, 24–26. [Google Scholar]
  13. Sohn, I.-R.; Kim, T.-C.; Ju, G.-I.; Kim, M.-S.; Kim, J.-S. Development of PosMAC® Steel and Its Application Properties. Korean J. Met. Mater. 2021, 59, 613–623. [Google Scholar] [CrossRef]
  14. Wallinder, I.O.; Leygraf, C. A Critical Review on Corrosion and Runoff from Zinc and Zinc-Based Alloys in Atmospheric Environments. Corrosion 2017, 73, 1060–1077. [Google Scholar] [CrossRef]
  15. Ding, Z.-L.; Yan, B.-H.; Jin, X.-Y.; Wang, X.-J.; Zhang, J.; Jiang, S.-M.; Zhang, Q.-F. Effect of magnesium on the microstructure and corrosion resistance of 55% Al-Zn coating. In Proceedings of the 12th International Conference on Zinc and Zinc Alloy Coated Steel Sheet (Galvatech 2021), Virtual Conference, 22–24 June 2021; pp. 164–171. [Google Scholar]
  16. Li, S.; Gao, B.; Tu, G.; Hu, L.; Sun, S.; Zhu, G.; Yin, S. Effects of magnesium on the microstructure and corrosion resistance of Zn–55Al–1.6Si coating. Constr. Build. Mater. 2014, 71, 124–131. [Google Scholar] [CrossRef]
  17. Nicard, C.; Allély, C.; Volovitch, P. Effect of Zn and Mg alloying on microstructure and anticorrosion mechanisms of Al-Si based coatings for high strength steel. Corros. Sci. 2018, 146, 192–201. [Google Scholar] [CrossRef]
  18. Panossian, Z.; Mariaca, L.; Morcillo, M.; Flores, S.; Rocha, J.; Peña, J.; Herrera, F.; Corvo, F.; Sanchez, M.; Rincon, O.; et al. Steel cathodic protection afforded by zinc, aluminium and zinc/aluminium alloy coatings in the atmosphere. Surf. Coat. Technol. 2005, 190, 244–248. [Google Scholar] [CrossRef]
  19. Lee, S.; Chang, L.-M.; Skibniewski, M. Automated recognition of surface defects using digital color image processing. Autom. Constr. 2006, 15, 540–549. [Google Scholar] [CrossRef]
  20. Chen, P.-H.; Yang, Y.-C.; Chang, L.-M. Automated bridge coating defect recognition using adaptive ellipse approach. Autom. Constr. 2009, 18, 632–643. [Google Scholar] [CrossRef]
  21. Khan, A.; Ali, S.S.A.; Anwer, A.; Adil, S.H.; Meriaudeau, F. Subsea Pipeline Corrosion Estimation by Restoring and Enhancing Degraded Underwater Images. IEEE Access 2018, 6, 40585–40601. [Google Scholar] [CrossRef]
  22. Chen, P.-H.; Chang, L.-M. Artificial intelligence application to bridge painting assessment. Autom. Constr. 2003, 12, 431–445. [Google Scholar] [CrossRef]
  23. Lee, S.; Chang, L.-M.; Chen, P.-H. Performance Comparison of Bridge Coating Defect Recognition Methods. Corrosion 2005, 61, 12–20. [Google Scholar] [CrossRef]
  24. Enikeev, M.; Maleeva, M. Analysis of Corrosion Process Development on Metals by Means of Computer Vision. Eng. J. 2017, 21, 183–192. [Google Scholar] [CrossRef]
  25. Alkanhal, A. Image processing techniques applied for pitting corrosion analysis. Int. J. Res. Eng. Technol. 2014, 3, 385–391. [Google Scholar] [CrossRef]
  26. Petricca, L.; Moss, T.; Figueroa, G.; Broen, S. Corrosion Detection Using A.I: A Comparison of Standard Computer Vision Techniques and Deep Learning Model. In Computer Science & Information Technology (CS & IT); Academy & Industry Research Collaboration Center (AIRCC): Horten, Norway, 2016; pp. 91–99. [Google Scholar] [CrossRef]
  27. Wint, N.; Cooze, N.; Searle, J.R.; Sullivan, J.H.; Williams, G.; McMurray, H.N.; Luckeneder, G.; Riener, C. The Effect of Microstructural Refinement on the Localized Corrosion of Model Zn-Al-Mg Alloy Coatings on Steel. J. Electrochem. Soc. 2019, 166, C3147–C3158. [Google Scholar] [CrossRef]
  28. Sullivan, J.; Cooze, N.; Gallagher, C.; Lewis, T.; Prosek, T.; Thierry, D. In situ monitoring of corrosion mechanisms and phosphate inhibitor surface deposition during corrosion of zinc–magnesium–aluminium (ZMA) alloys using novel time-lapse microscopy. Faraday Discuss. 2015, 180, 361–379. [Google Scholar] [CrossRef]
  29. Malla, A.D.; Sullivan, J.H.; Penney, D.J.; Goldsworthy, M.; Britton, D.; Williams, G.; Goodwin, F.; Cardoso, A.P. Mechanistic investigation on the influence of coating weights on the corrosion behaviour of hot-dip-galvanised Zn-Mg-Al coatings. NPJ Mater. Degrad. 2024, 8, 78. [Google Scholar] [CrossRef]
  30. Mopon, M.; Mol, A.; Garcia, S.J. Effect of delayed inhibitor supply on AA2024-T3 intermetallic activity: A local in situ analysis with reflected microscopy. Corros. Sci. 2024, 230, 111910. [Google Scholar] [CrossRef]
  31. Shkirskiy, V.; Kanoufi, F. Reflective microscopy for mechanistic insights in corrosion research. Curr. Opin. Electrochem. 2023, 39, 101259. [Google Scholar] [CrossRef]
  32. Denissen, P.J.; Homborg, A.M.; Garcia, S.J. Interpreting Electrochemical Noise and Monitoring Local Corrosion by Means of Highly Resolved Spatiotemporal Real-Time Optics. J. Electrochem. Soc. 2019, 166, C3275–C3283. [Google Scholar] [CrossRef]
  33. Raffin, F.; Makogon, A.; Kanoufi, F.; Echouard, J.; Shkirskiy, V.; Volovitch, P. Initial cathodic reactivity of intermetallic particles in 7175 aluminum alloy buried under 6 µm thick anodized oxide layer revealed by in-situ reflective microscopy. Electrochim. Acta 2024, 492, 144155. [Google Scholar] [CrossRef]
  34. Chen, C.-L.; Thomson, R. The combined use of EBSD and EDX analyses for the identification of complex intermetallic phases in multicomponent Al–Si piston alloys. J. Alloys Compd. 2009, 490, 293–300. [Google Scholar] [CrossRef]
  35. Haberlah, D.; Owen, M.; Botha, P.W.; Gottlieb, P. Sem-EDS-Based Protocol for Subsurface Drilling Mineral Identification and Petrological Classification. In Proceedings of the 10th International Congress for Applied Mineralogy (ICAM), Trondheim, Norway, 1–5 August 2011; Broekmans, M.A.T.M., Ed.; Springer: Berlin/Heidelberg, Germany, 2012; pp. 265–273. [Google Scholar] [CrossRef]
  36. Müller, M.; Stiefel, M.; Bachmann, B.-I.; Britz, D.; Mücklich, F. Overview: Machine Learning for Segmentation and Classification of Complex Steel Microstructures. Metals 2024, 14, 553. [Google Scholar] [CrossRef]
  37. Stauffer, D.; Aharony, A. Introduction to Percolation Theory, 2nd ed.; Transferred to Digital Print; Taylor & Francis: London, UK, 2003. [Google Scholar]
  38. Kim, S.; Choi, S.; Oh, E.; Byun, J.; Kim, H.; Lee, B.; Lee, S.; Hong, Y. Revisit to three-dimensional percolation theory: Accurate analysis for highly stretchable conductive composite materials. Sci. Rep. 2016, 6, 34632. [Google Scholar] [CrossRef]
  39. Thommerel, E.; Valmalette, J.; Musso, J.; Villain, S.; Gavarri, J.; Spada, D. Relations between microstructure, electrical percolation and corrosion in metal—Insulator composites. Mater. Sci. Eng. A 2002, 328, 67–79. [Google Scholar] [CrossRef]
  40. Zhao, F.; Ling, Y.; Hu, Y.; Wang, W.; Bai, Y.; Yang, Z.; Zhang, Z. The role of secondary phase precipitates in zircaloy corrosion: From point defects to local percolation. Corros. Sci. 2024, 229, 111856. [Google Scholar] [CrossRef]
  41. Lehockey, E.; Brennenstuhl, A.; Thompson, I. On the relationship between grain boundary connectivity, coincident site lattice boundaries, and intergranular stress corrosion cracking. Corros. Sci. 2004, 46, 2383–2404. [Google Scholar] [CrossRef]
  42. Sieradzki, K.; Newman, R.C. A Percolation Model for Passivation in Stainless Steels. J. Electrochem. Soc. 1986, 133, 1979–1980. [Google Scholar] [CrossRef]
  43. McCafferty, E. Graph theory and the passivity of binary alloys. Corros. Sci. 2000, 42, 1993–2011. [Google Scholar] [CrossRef]
  44. VDA 621-415; Testing of Corrosion Protection of Vehicle Paint by Alternating Cycles Test. Ascott Analytical: Berlin, Germany, 1982. Available online: https://www.ascott-analytical.com/test-standards/vda-621-415/ (accessed on 4 February 2024).
  45. Popova, K.; Prošek, T. Mechanism of Zinc Corrosion in Accelerated Corrosion Tests. Mater. Corros. 2025, 56, 581–588. [Google Scholar] [CrossRef]
  46. Eggert, F. Effect of the Silicon Drift Detector on EDAX Standardless Quant Methods. Microsc. Today 2020, 28, 34–39. [Google Scholar] [CrossRef]
  47. Maffre Gervais Gauthier, G.P.; Bruno, L.; Julien, R.; Damien, E.; Mélanie, F.; Arthur, D.; Hugo. ‘Aphelion SDK’, ADCIS. Available online: https://www.adcis.net/en/aphelion-sdk/ (accessed on 19 September 2024).
  48. Selverian, J.H.; Marder, A.R.; Notis, M.R. The effects of silicon on the reaction between solid iron and liquid 55 wt pct Al−Zn baths. Met. Trans. A 1989, 20, 543–555. [Google Scholar] [CrossRef]
  49. Yadav, A.; Katayama, H.; Noda, K.; Masuda, H.; Nishikata, A.; Tsuru, T. Effect of Al on the galvanic ability of Zn–Al coating under thin layer of electrolyte. Electrochim. Acta 2006, 52, 2411–2422. [Google Scholar] [CrossRef]
  50. Prosek, T.; Persson, D.; Stoulil, J.; Thierry, D. Composition of corrosion products formed on Zn–Mg, Zn-Al and Zn–Al–Mg in model atmospheric conditions. Corros. Sci. 2014, 86, 231–238. [Google Scholar] [CrossRef]
  51. Kim, S.O.; Yang, W.S.; Kim, S.J. Effects of the Combined Addition of Zn and Mg on Corrosion Behaviors of Electropainted AlSi-Based Metallic Coatings Used for Hot-Stamping Steel Sheets. Materials 2020, 13, 3379. [Google Scholar] [CrossRef]
  52. Rosalbino, F.; Carlini, R.; Parodi, R.; Zanicchi, G.; Scavino, G. Investigation of passivity and its breakdown on Fe3Al–Si and Fe3Al–Ge intermetallics in chloride-containing solution. Corros. Sci. 2014, 85, 394–400. [Google Scholar] [CrossRef]
  53. Birbilis, N.; Buchheit, R.G. Electrochemical Characteristics of Intermetallic Phases in Aluminum Alloys. J. Electrochem. Soc. 2005, 152, B140–B151. [Google Scholar] [CrossRef]
  54. Li, J.; Dang, J. A Summary of Corrosion Properties of Al-Rich Solid Solution and Secondary Phase Particles in Al Alloys. Metals 2017, 7, 84. [Google Scholar] [CrossRef]
  55. Mouanga, M.; Berçot, P. Comparison of corrosion behaviour of zinc in NaCl and in NaOH solutions; Part II: Electrochemical analyses. Corros. Sci. 2010, 52, 3993–4000. [Google Scholar] [CrossRef]
  56. Azevedo, M.S.; Allély, C.; Ogle, K.; Volovitch, P. Corrosion mechanisms of Zn(Mg,Al) coated steel: 2. The effect of Mg and Al alloying on the formation and properties of corrosion products in different electrolytes. Corros. Sci. 2015, 90, 482–490. [Google Scholar] [CrossRef]
  57. Kairy, S.K.; Birbilis, N. Clarifying the Role of Mg2Si and Si in Localized Corrosion of Aluminum Alloys by Quasi In Situ Transmission Electron Microscopy. Corrosion 2020, 76, 464–475. [Google Scholar] [CrossRef]
  58. Zhang, X.; Vu, T.-N.; Volovitch, P.; Leygraf, C.; Ogle, K.; Wallinder, I.O. The initial release of zinc and aluminum from non-treated Galvalume and the formation of corrosion products in chloride containing media. Appl. Surf. Sci. 2012, 258, 4351–4359. [Google Scholar] [CrossRef]
  59. Salinas, D.R.; García, S.G.; Bessone, J.B. Influence of alloying elements and microstructure on aluminium sacrificial anode performance: Case of Al–Zn. J. Appl. Electrochem. 1999, 29, 1063–1071. [Google Scholar] [CrossRef]
  60. Idusuyi, N.; Oluwole, O.O. Aluminium Anode Activation Research—A Review. 2012. Available online: https://www.researchgate.net/publication/256543719_Aluminium_Sacrificial_Anode_Activation_-_A_Review (accessed on 20 September 2024).
  61. LeBozec, N.; Thierry, D.; Persson, D.; Stoulil, J. Atmospheric Corrosion of Zinc-Aluminum Alloyed Coated Steel in Depleted Carbon Dioxide Environments. J. Electrochem. Soc. 2018, 165, C343–C353. [Google Scholar] [CrossRef]
  62. Ho, C.Y.; Wang, J.Y. Investigation of microstructure related to corrosion evolution, mechanical and electrochemical properties on doped Si of binary Zn–Al coating. Mater. Chem. Phys. 2023, 301, 127656. [Google Scholar] [CrossRef]
  63. Friel, J.J. Atmospheric Corrosion Products on Al, Zn, and AlZn Metallic Coatings. Corrosion 1986, 42, 422–426. [Google Scholar] [CrossRef]
  64. Shkirskiy, V.; Maltseva, A.; Ogle, K.; Volovitch, P. Corrosion mechanisms of Zn(Mg,Al) coated steel: The effect of HCO3 and NH4+ ions on the intrinsic reactivity of the coating. Electrochim. Acta. 2017, 153, 159–169. [Google Scholar] [CrossRef]
  65. Calderón, J.P.; Barragán, J.L.R.; Fierro, J.I.B.; Mejía, H.C.; González, C.D.A.; Vázquez, V.R.; Sánchez, K.P.; Torres-Mancera, M.T.; Retes-Mantilla, R.F.; Rodríguez-Díaz, R.A. Corrosion Behavior of Al Modified with Zn in Chloride Solution. Materials 2022, 15, 4229. [Google Scholar] [CrossRef] [PubMed]
  66. Li, J.; Hreso, D. Morphology of 55% Al-Zn coating and the Al-Zn coating with Mg additions. In Proceedings of the 10th International Conference on Zinc and Zinc Alloy Coated Steel Sheet (Galvatech 2015), Toronto, ON, Canada, 31 May–4 June 2015; Association for Iron & Steel Technology: Warrendale, PA, USA, 2015; pp. 852–860. [Google Scholar]
  67. Xie, Y.; Artymowicz, D.M.; Lopes, P.P.; Aiello, A.; Wang, D.; Hart, J.L.; Anber, E.; Taheri, M.L.; Zhuang, H.; Newman, R.C.; et al. A percolation theory for designing corrosion-resistant alloys. Nat. Mater. 2021, 20, 789–793. [Google Scholar] [CrossRef]
  68. Jerauld, G.R.; Scriven, L.E.; Davis, H.T. Percolation and conduction on the 3D Voronoi and regular networks: A second case study in topological disorder. J. Phys. C Solid State Phys. 1984, 17, 3429–3439. [Google Scholar] [CrossRef]
  69. Becker, A.M.; Ziff, R.M. Percolation thresholds on two-dimensional Voronoi networks and Delaunay triangulations. Phys. Rev. E 2009, 80, 041101. [Google Scholar] [CrossRef]
  70. Prosek, T.; Nazarov, A.; Le Gac, A.; Thierry, D. Coil-coated Zn–Mg and Zn–Al–Mg: Effect of climatic parameters on the corrosion at cut edges. Prog. Org. Coat. 2015, 83, 26–35. [Google Scholar] [CrossRef]
Figure 1. Schema of the three views used during the SEM-EDX analysis for the characterization of the microstructure of the coatings: (1) cross-section, (2) extreme surface view, and (3) half thickness view.
Metals 15 00476 g001
Figure 2. Schematic representation of the development and functioning of the quantitative analysis.
Metals 15 00476 g002
Figure 3. SEM-BSE and EDX cartographies of Al, Zn, Si, Mg, and Fe of the AZM sample.
Metals 15 00476 g003
Figure 4. SEM-BSE images of the microstructure of the coatings AZ (left column), AZM (middle column), and L-AZM (right column) at the cross-section, extreme surface, and half-thickness, as indicated.
Metals 15 00476 g004
Figure 5. Aphelion phase identification of the microstructures of the coatings AZ (left column), AZM (middle column), and L-AZM (right column) at the three views: the cross-section, extreme surface, and half-thickness, as indicated.
Metals 15 00476 g005
Figure 6. Gradient of composition of the elements Al and Zn at the dendrites of Al for the AZ, AZM, and L-AZM uncorroded coatings and AZ coating after 1 cycle of corrosion in NaCl environment near the scratched zone, measured by quantification of SEM-EDS measurements.
Metals 15 00476 g006
Figure 7. SEM image of the AZ coating (a) with identification of the phases using only one Al(Zn) phase (b) and separation of dendrites in two Al(Zn) phases, containing higher and lower Al content (c). The dendrite’s zones with a low amount of Al are shown in gray.
Metals 15 00476 g007
Figure 8. Macroscopic photos of the AZ, AZM, and L-AZM after 1, 6, and 10 cycles of accelerated corrosion test in NaCl environment, as indicated. The initial width of the scratches, made in the coatings preliminary to the test, was 2 mm (upper scratches) and 3 mm (lower scratches). The AZ sample presents the earliest red rust appearance (highlighted by the red circle), while the AZM sample presents a good initial protection, but once the red rust appears, it quickly propagates. L-AZM presents the best long-term sacrificial protection between the three coatings.
Metals 15 00476 g008
Figure 9. BSE image of the surface of the 1 mm scratch after one cycle of the accelerated corrosion test 3CT. It can be clearly seen that the L-AZM has the highest deposition of corrosion products in the scratch in comparison with AZ and AZM samples.
Metals 15 00476 g009
Figure 10. (a) Cross-section SEM-BSE images + EDX mapping of O, Al, and Zn of the AZ, AZM, and L-AZM samples with a 1 mm scratch after one cycle of the accelerated corrosion test 3CT. AZ produced the most voluminous corrosion product, while L-AZM produced the most compact one, with the lowest coating consumption. (b) Higher magnification SEM-BSE images with the overlay of the EDX mapping of 0 for the AZM and L-AZM samples after two cycles of accelerated corrosion test.
Metals 15 00476 g010
Figure 11. Schematic representation of the proposed corrosion and steel protection mechanisms of AlZnSi(Mg) coating in chloride-containing environments in a zone near a scratch until the substrate.
Metals 15 00476 g011
Table 1. Chemical composition and thickness of the coatings AZ, AZM, and L-AZM.
SampleAl (wt.%)Si (wt.%)Mg (wt.%)ZnThickness (µm)
AZ55%1.6%Bal.22.43 ± 4.33
AZM55%1–2%2–4%Bal.24.88 ± 0.94
L-AZM30–40%1–2%2–4%Bal.22.17 ± 1.66
Table 2. Area fraction of different phases in the cross-section of the AZ, AZM, and L-AZM coatings. Data for AZ coatings are presented in 2 columns, considering only one phase Al(Zn) for Al-rich dendrites (column “AZ standard”) and with the separation of the dendrites in high and low Al areas Al(lowZn) and Al(highZn) (column “AZ new”, see Section 3.2 for details).
AZ StandardAZ NewAZML-AZM
PhaseSurfaceSDSurfaceSDSurfaceSDSurfaceSD
TOTAL100.000.00100.000.00100.000.00100.000.00
Al(Zn)82.374.8744.88 (Al(lowZn))5.9668.217.0432.493.83
Binary ZnAl4.832.686.183.2718.637.3744.644.45
Mg2Si0.000.000.000.002.492.220.350.58
Si2.461.522.411.520.730.582.582.65
Zn2.160.841.520.550.150.000.520.55
Intermetallic1.960.002.900.001.530.450.860.00
Zn2Mg0.040.000.030.003.561.6711.912.28
Ternary0.000.000.000.000.000.000.000.00
Binary ZnMg0.010.000.010.000.150.002.853.21
Al(high Zn) 38.843.63
Not assigned6.162.863.221.004.551.103.801.14
Table 3. Fraction (%) of the Al(Zn) dendrites border line length in contact with different phases. Binary ZnAl is clearly the major phase in contact with the dendrites; however, the AZ and L-AZM coatings have significant contact between their dendrites and the Si phase, while in the AZM, this occurs with the Mg2Si phase.
% Al(Zn) Dendrites Border Line in Contact with
SampleBinary ZnAl PhaseZn2Mg PhaseMg2Si PhaseSi Phase
AZ80.60.00.019.4
AZM84.91.710.03.4
L-AZM88.71.60.09.7
Table 4. Linear dimensions of the interconnected cluster formed by the proposed new Zn-rich phase in AZ coating.
Size of the Al(High Zn) Phase for AZ Coating (µm)
Zone1Max height20
Max width30
Zone2Max height14
Max width19
Zone3Max height21
Max width25
Zone4Max height15
Max width25
Zone5Max height15
Max width29
Table 5. Fraction (%) of the interface of the steel substrate in contact with different phases of the AZ coating (average value and standard deviation (SD)), taking into consideration the separation of the dendrites of Al into two different phases with high and low Al content.
Coating
Phase in Contact with Steel (%)AZAZML-AZM
Dendrite’s zone with high Al5.84 ± 1.6769.21 ± 16.0119.03 ± 15.34
Binary ZnAl0.38 ± 0.4321.47 ± 14.1643.2 ± 27.86
Zn2Mg009.11 ± 12.86
Mg2Si05.73 ± 6.6212.43 ± 9.34
Si19.63 ± 12.613.59 ± 5.0816.22 ± 20.75
Dendrite’s zone with low Al74.15 ± 12.96--
Table 6. Electrochemical potentials, E, of the phases present in the Al-based coatings compared to iron (steel) in neutral chloride solution with a concentration between 0.1 and 0.8 M. Reference is given in brackets. The phases can be classified as either sacrificial (with a lower corrosion potential than the steel) or cathodic (with a higher corrosion potential than the steel).
PhaseFeAlSi
intermetallic
SiFe (steel)AlZnZn(Al) (binary)Zn2MgMg2Si
E
(V vs. SCE)
−0.59 [52]−0.44 [53]−0.6−0.94 [54]−1.06 [55]−1.04 [53]−1.09 [53]−1.35 [53]
Table 7. The size of the biggest particle of the sacrificial interdendritic phases (including binary ZnAl, binary lamelar Zn/Zn2Mg, intermetallic Zn2Mg and Mg2Si). The >d indicates that the phases’ width is higher than the width of the picture, meaning that the sacrificial phases create an interconnected network in the x axis. The height for the AZM and L-AZM samples is of the same order of magnitude as the thickness of the coating, meaning that it is interconnected in the z axis.
SampleHeight of Sacrificial Phases (µm)Width of Sacrificial Phases (µm)
AZ5.69.6
AZM21>d
L-AZM26.6>d
Disclaimer/Publisher’s Note: The statements, opinions and data contained in all publications are solely those of the individual author(s) and contributor(s) and not of MDPI and/or the editor(s). MDPI and/or the editor(s) disclaim responsibility for any injury to people or property resulting from any ideas, methods, instructions or products referred to in the content.

