Article

Finite Element Simulation and Process Analysis for Hot-Forming WE43 Magnesium Alloy Fasteners: Comparison of Crystal Plasticity with Traditional Method

School of Mechanical and Automotive Engineering, Shanghai University of Engineering Science, Shanghai 101600, China
*
Author to whom correspondence should be addressed.
Metals 2025, 15(5), 475; https://doi.org/10.3390/met15050475
Submission received: 10 March 2025 / Revised: 5 April 2025 / Accepted: 14 April 2025 / Published: 23 April 2025
(This article belongs to the Special Issue Modeling, Simulation and Experimental Studies in Metal Forming)

Abstract

:
The WE43 magnesium alloy has gained attention in orthopedic implants due to its biodegradable properties, particularly for fabricating degradable fasteners. However, research on its hot-forming processes remains limited, primarily focusing on macroscopic finite element mechanical analyses. This study introduces a simplified high-temperature upsetting process and employs a mesoscale crystal plasticity finite element method to model the thermoforming behavior of WE43 fasteners for the first time. Comparative analyses with conventional finite element methods reveal that the crystal plasticity finite element method effectively captures the influence of microstructural evolution on macroscopic deformation. Additionally, temperature effects (25–650 °C) on mechanical performance were systematically evaluated. The results demonstrate that temperatures between 350 °C and 450 °C optimize formability, balancing thermal softening and strain hardening. The crystal plasticity finite element method framework provides enhanced predictive accuracy for micro–macro interactions, offering critical insights for designing biodegradable magnesium alloy implants.

1. Introduction

Magnesium (Mg) alloys have garnered significant attention for structural applications due to their exceptional combination of low density, high specific strength, and favorable stiffness retention across a broad temperature range (room temperature to 300 °C) [1]. More importantly, their unique biocompatibility and tunable biodegradation kinetics, which closely match the biomechanical properties of human bone tissue, have positioned them as a frontier material in developing next-generation absorbable implants [2,3]. This dual functionality has particularly revolutionized research paradigms in trauma surgery and orthopedics, where transient mechanical support with synchronized degradation–bone remodeling is critically required [4,5,6].
As a common fastener, the design of bolts is crucial for connection reliability and structural strength [7]. Maxillofacial fixation devices, including plates, bolts, and screws, serve as critical components in craniofacial surgical interventions. These biocompatible constructs demonstrate versatile applications spanning from corrective osteotomies in orthognathic surgery to the secondary stabilization of autologous bone grafts in craniofacial reconstruction. Notably, their biomechanical functionality proves indispensable in post-traumatic skeletal defect restoration, where anatomical contour preservation and load-bearing capacity maintenance are paramount [8]. In 2013, Syntellix AG (Hannover, Germany) pioneered the commercialization of a novel Mg-based bone fixation screw (CS series) fabricated from a WE43 (Mg-Y-RE-Zr) alloy via patented thermomechanical processing [9], where Y represents yttrium, RE represents rare earth elements, and Zr represents zirconium. At present, it is mainly used for correcting tarsal and metatarsal bones (mainly in hallux valgus), as well as treating scaphoid fractures. During the bone healing process, stabilization and reinforcement are primarily achieved through orthopedic implant fasteners. Magnesium-based fixation apparatuses, which serve this crucial consolidation function, are visually demonstrated in Figure 1. These medical components typically consist of orthopedic fasteners and structural supports for skeletal reconstruction [6].
The quality and performance of fasteners are significantly influenced by process parameters in addition to forming precision and material properties. The improper selection of process parameters during the forming process may lead to critical defects such as inhomogeneous microstructure distribution and stress concentration, potentially resulting in workpiece cracking [10,11,12]. Due to the hexagonal close-packed (HCP) structure characteristic of magnesium and most magnesium alloys, which predominantly activates basal slip systems with limited available slip systems during room temperature deformation, these materials exhibit restricted plasticity and inferior creep resistance [13,14,15]. Therefore, it is necessary to use hot processing to deform magnesium alloys. Consequently, magnesium alloys present greater challenges in pressure processing and demonstrate poorer formability compared to non-ferrous metals like aluminum and copper [16,17]. These inherent characteristics significantly influence the processability during thermal processing, subsequently affecting microstructural evolution and precipitation states. Wang and Bos [18] systematically investigated the influence of assembly torque range, thread engagement length, and aperture dimensions on the connection performance of as-cast blind-hole threaded fasteners in AM60B magnesium components. Hwang and Chang [19] developed manufacturing techniques for LZ91 magnesium alloy M1.4 screws with finite element validation.
However, current research on hot-heading forming technology for bolt fasteners using thermally stable Mg-RE alloys remains insufficient. Most existing studies about magnesium-based fasteners employ the conventional finite element method (FEM), which assumes isotropy at the macroscale level without considering microstructural effects. The crystal plasticity theory establishes a robust computational framework within continuum mechanics for modeling deformation mechanisms in magnesium alloys, particularly addressing the slip and twinning phenomena [20]. The synergistic integration of this theoretical framework with FEM is termed the crystal plasticity finite element method (CPFEM) [21]. This multiscale approach captures important microscale phenomena such as crystallographic grain orientations, dislocation interactions, and texture and also enables the quantitative prediction of localized plastic deformation by explicitly resolving crystallographic orientation dependencies and anisotropic hardening behaviors [22]. This highlights the necessity of adopting mesoscopic-scale CPFEM to gain more intuitive insights into deformation mechanisms during processing and provide crucial theoretical guidance for optimizing thermal deformation parameters in industrial applications.
To assess the feasibility of hot-forging WE43 magnesium alloy fasteners, this study investigates the integrated modeling of bolt design and molding processes while evaluating process-induced performance variations. Through FEM and CPFEM simulations, the hot-forging behavior of M1.4 magnesium alloy bolts are computationally reconstructed, with a comparative analysis conducted on the microstructure–macroscopic forming behavior correlations.

2. Material, Method, and Model Design

2.1. Material Properties

The material used in this study is a commercially rolled WE43 magnesium alloy plate (Chongqing Tongce Technology Co., Ltd., Chongqing, China). The composition range of the WE43 magnesium alloy, according to the GB/T 5153-2016 standard [23], is as follows: 2.0–2.5 wt.% Nd, other RE (e.g., Gadolinium (Gd)) ≤ 1.9 wt.%, 3.7–4.3 wt.% Y, 0.4–1.0 wt.% Zr, and balanced Mg. The density of the WE43 magnesium alloy is 1.84 × 10³ kg/m3, the Young’s modulus is 45 GPa, and Poisson’s ratio is 0.35 [24,25].

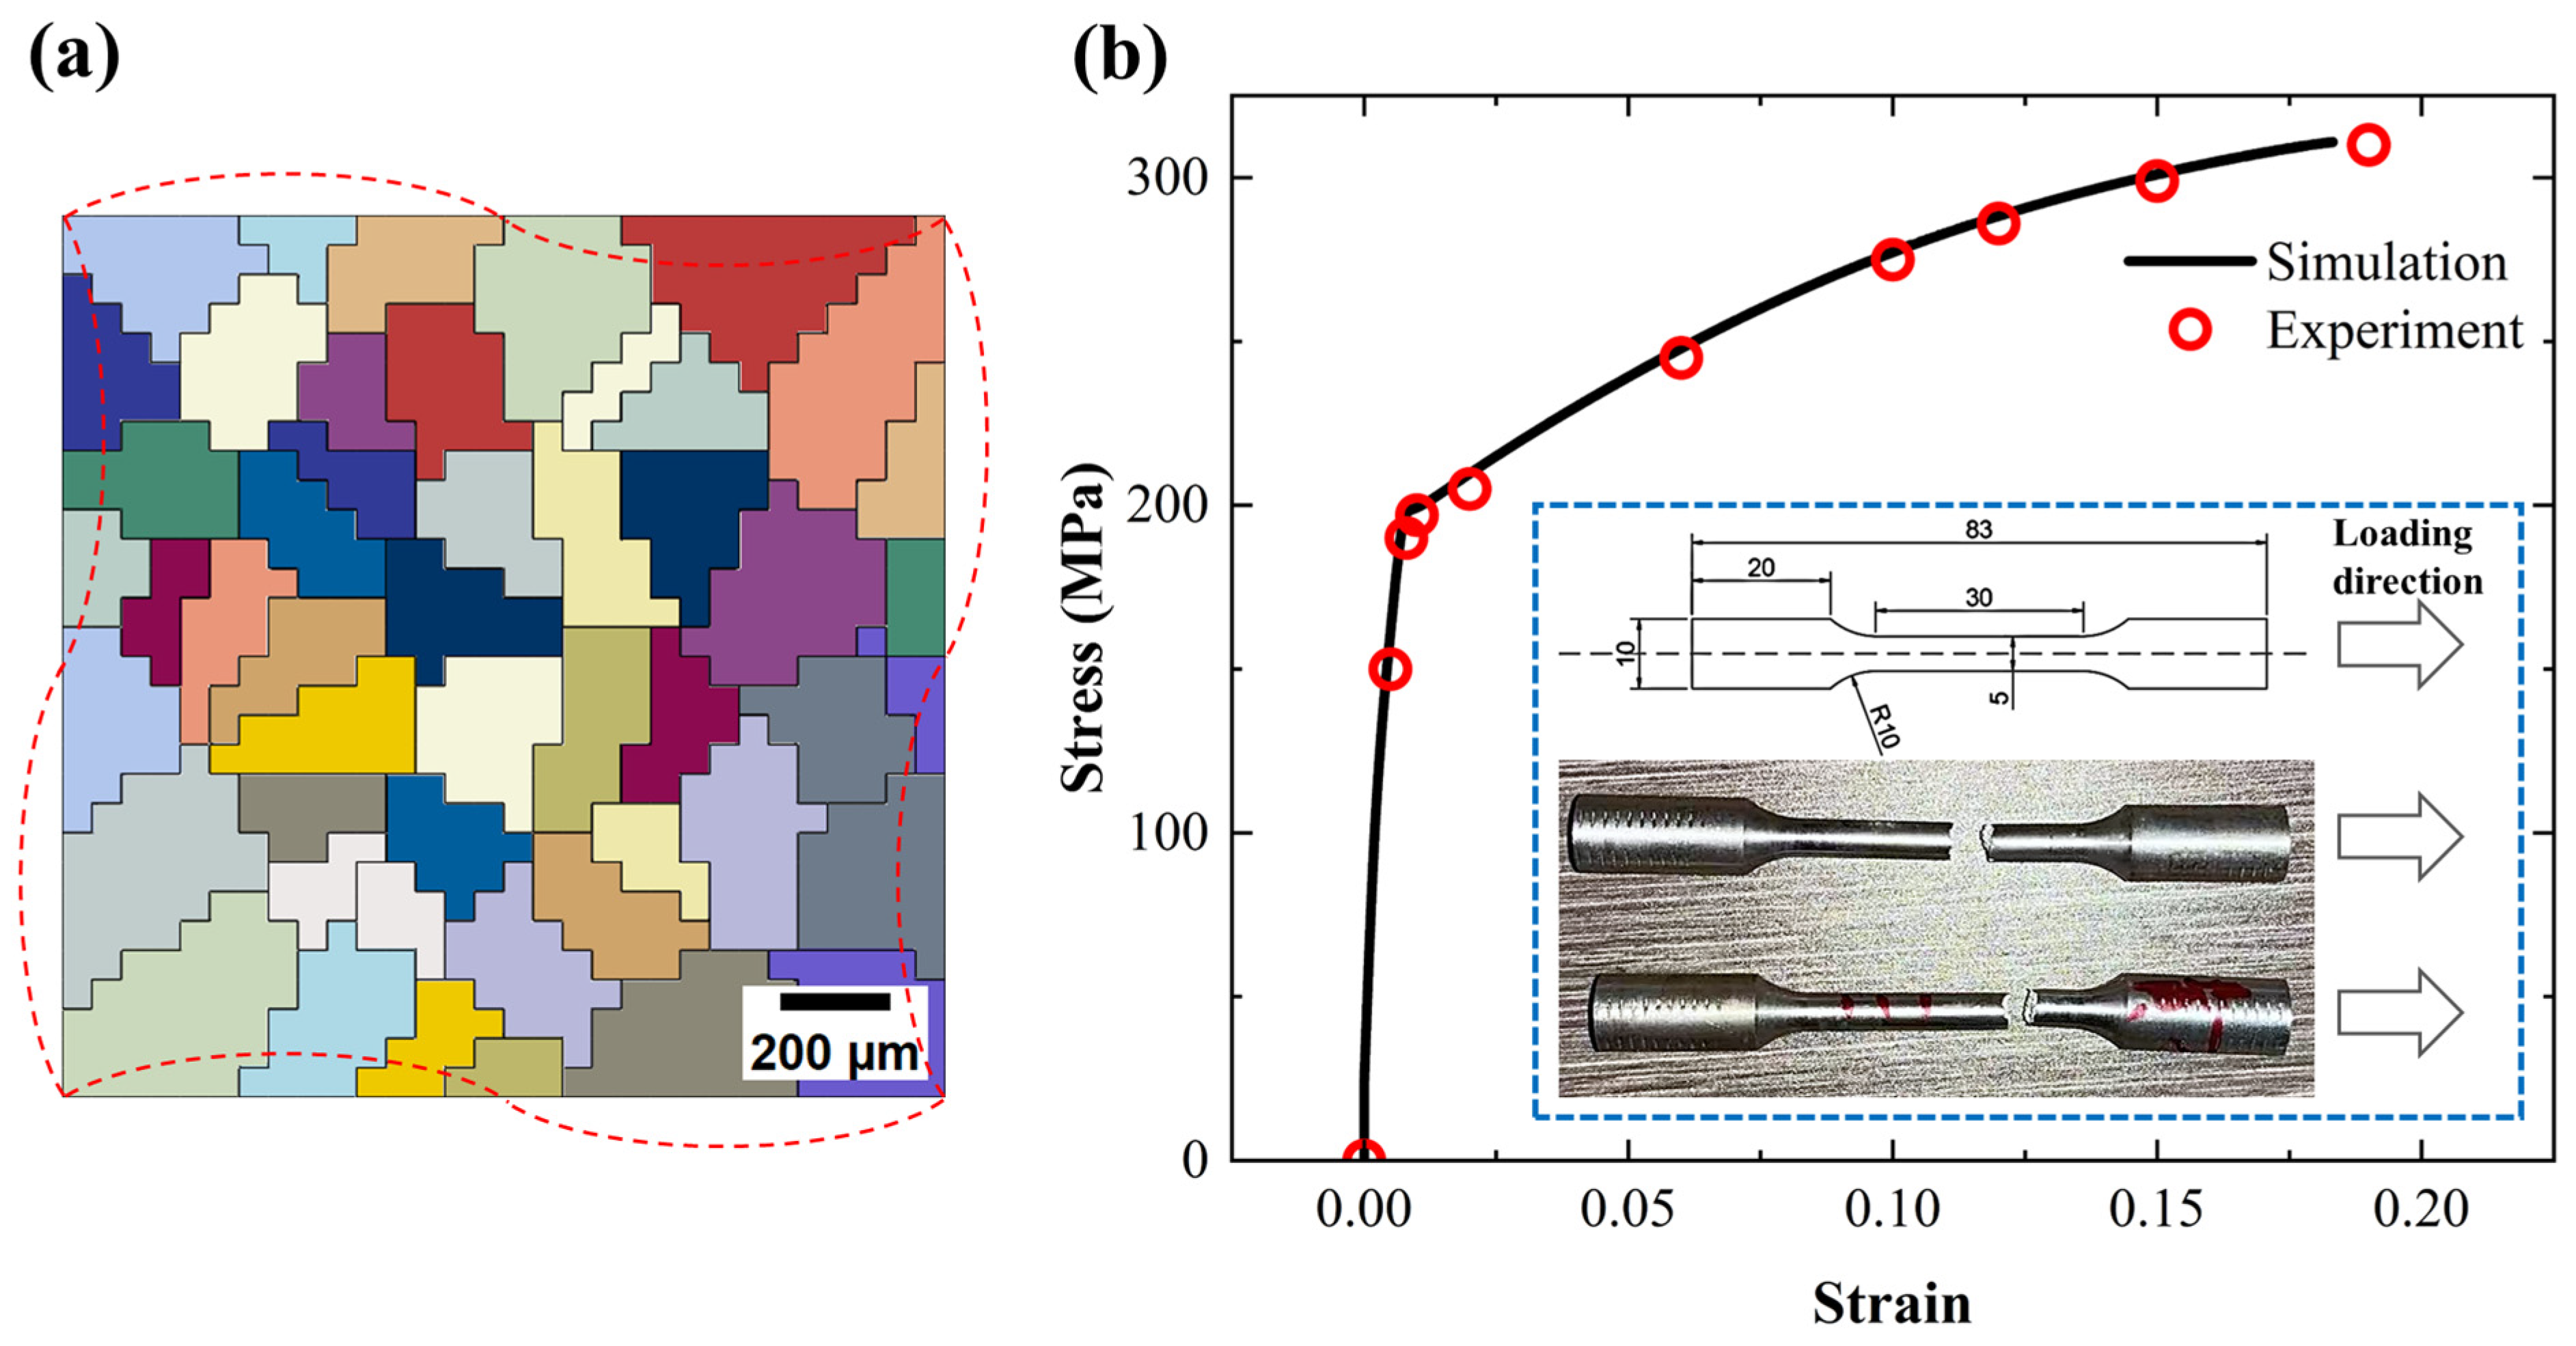
2.2. Uniaxial Tensile Tests

Uniaxial tensile tests were conducted using a TSE105D microcomputer-controlled electronic universal testing machine (Shenzhen Wance Testing Machine Co., Ltd. Shenzhen, China) at 25 °C, with a constant strain rate of 0.001 s−1 until fracture. Mechanical polishing was performed to achieve a surface roughness of Ra = 0.8. Two samples along the transverse direction were tested to ensure experimental repeatability. Strain measurements were recorded using an extensometer. The specimens were cylindrical in shape, with a diameter of 5 mm and a gauge length of 30 mm.

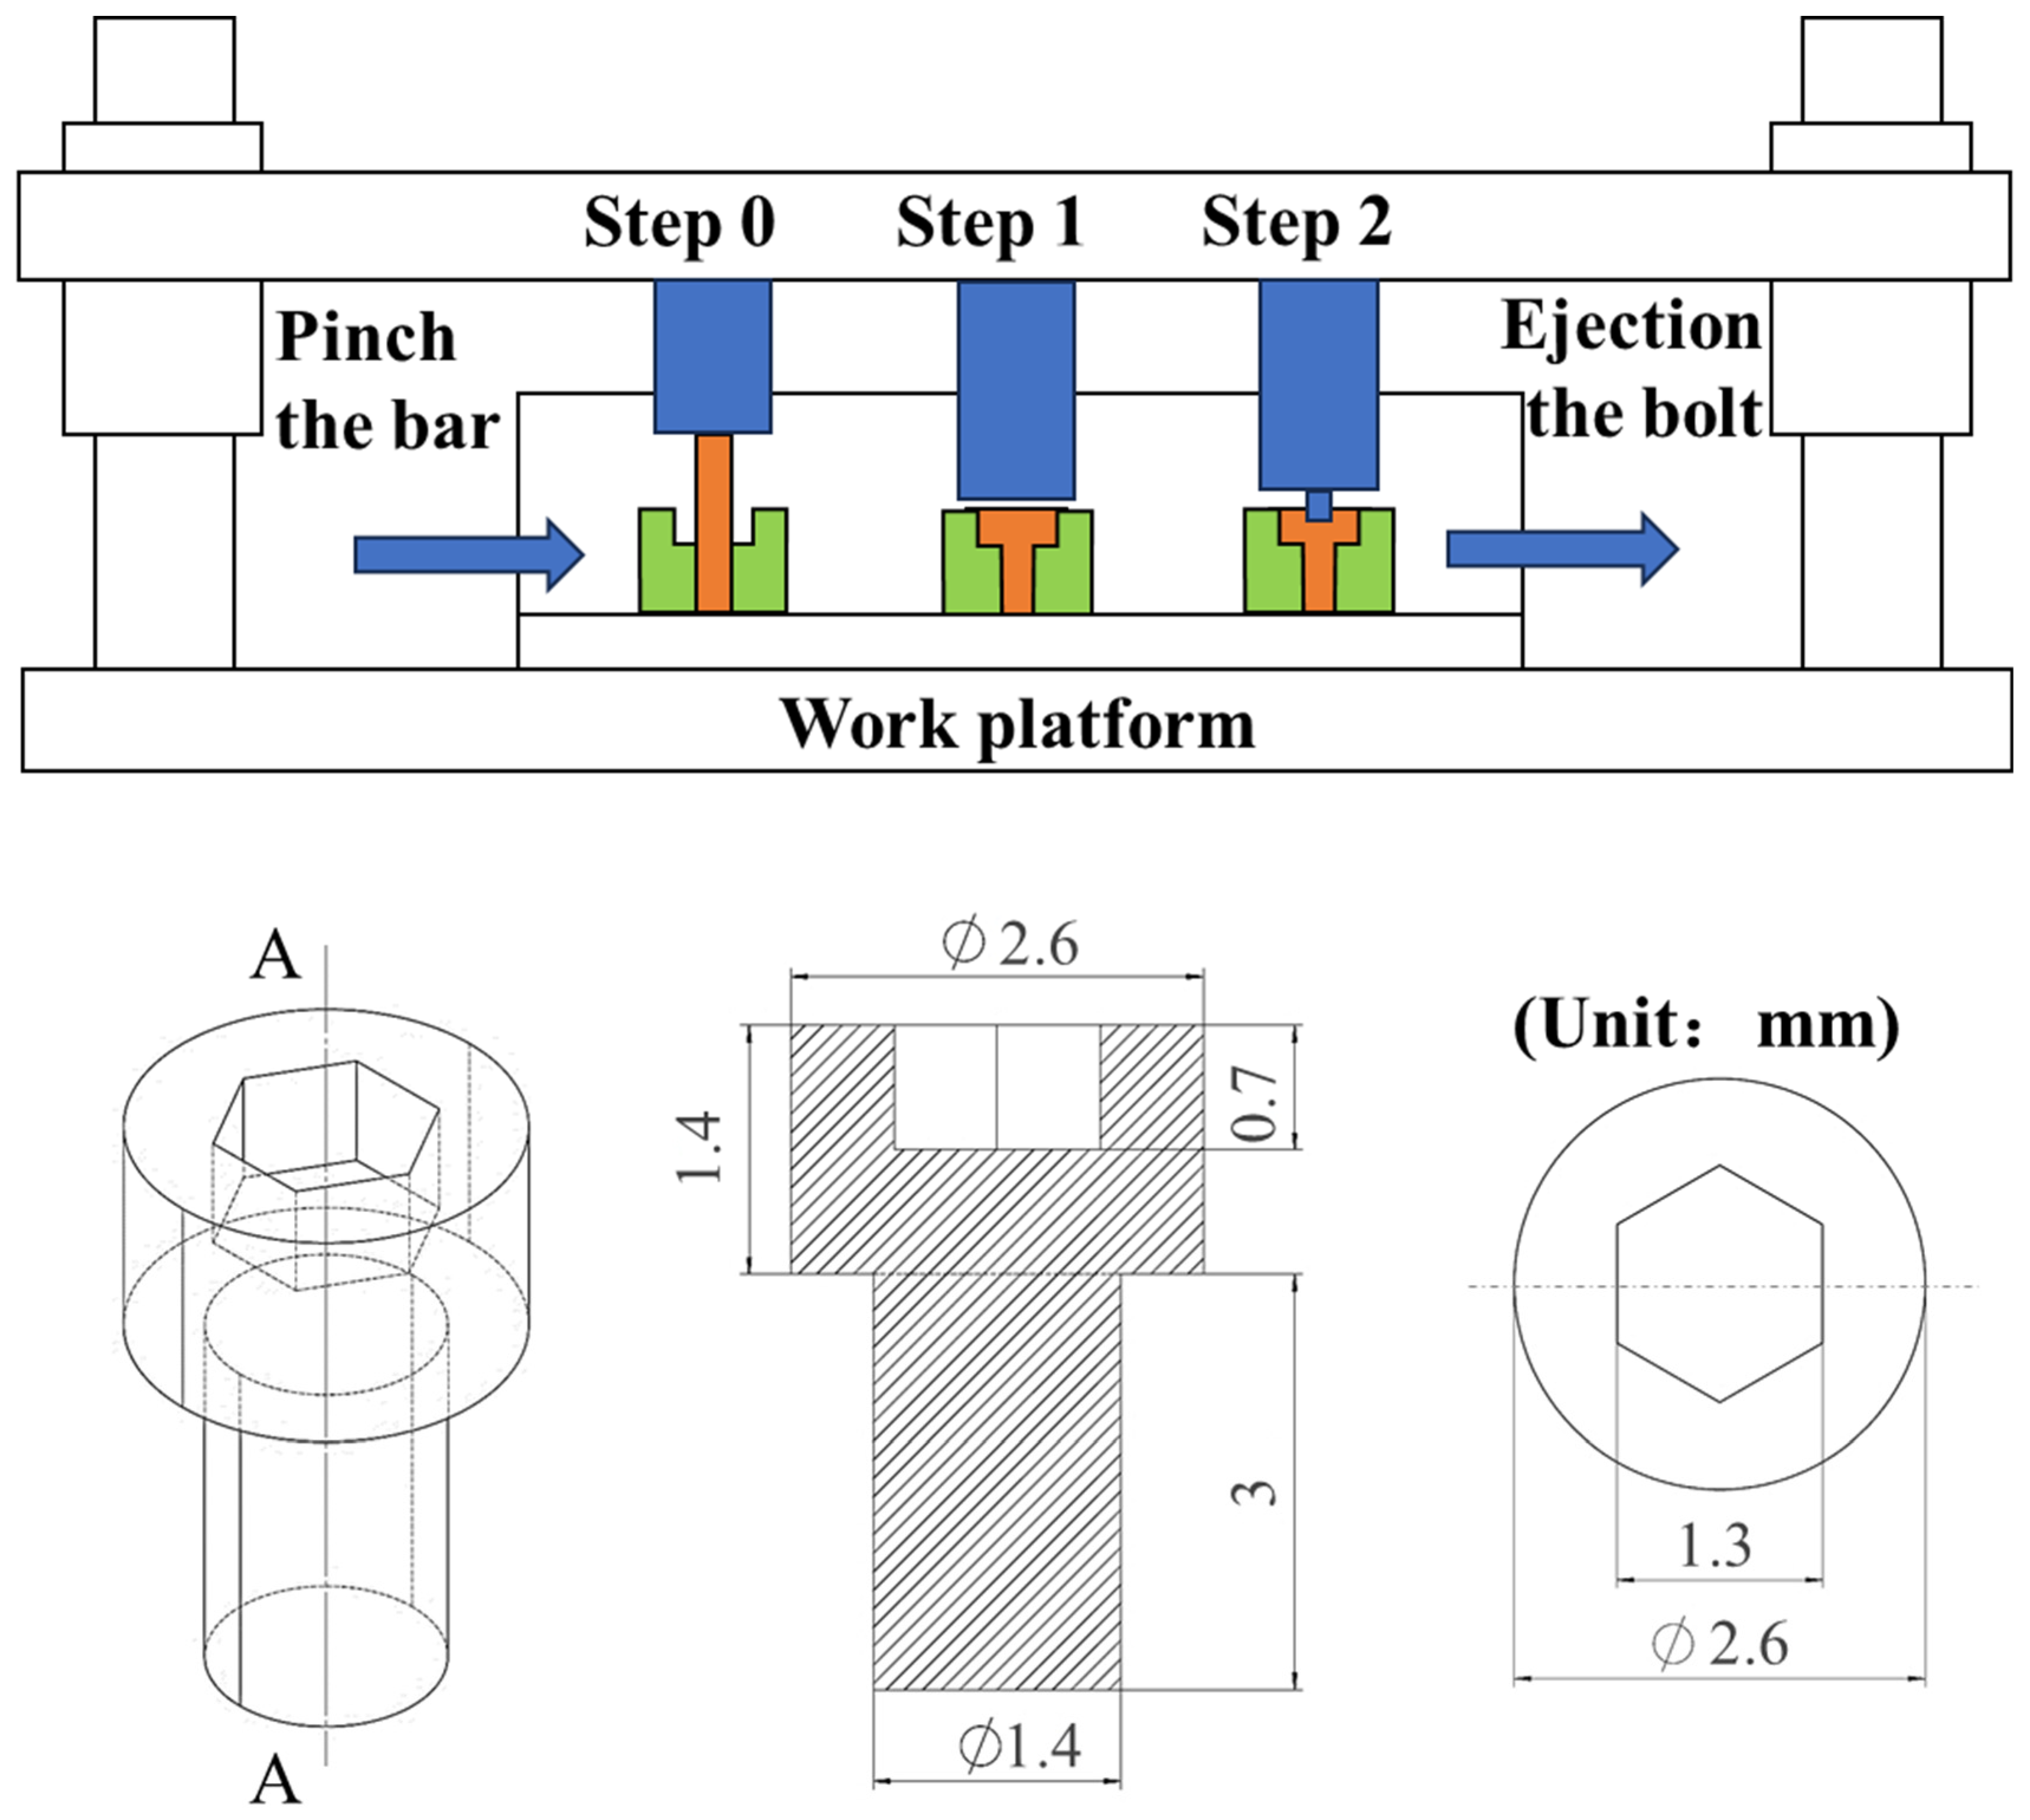
2.3. Fastener and Forming Process Design

The fastener geometry was designed in compliance with Chinese National Standard GB/T70.1 [26] specifications for M1.4 hexagonal head bolts, featuring critical dimensions as follows, with the complete geometric configuration illustrated in Figure 2: 1.4 mm shank diameter, 3 mm shank length, 2.6 mm head outer diameter, 1.3 mm head height, 1.3 mm hex socket width across flats, and 0.7 mm socket depth. The hot-forging system, which is all made of Cr12 cold-work die steel, comprises a multi-station work platform, a die holder, dual punch assemblies, and precision-matched dies. This investigation streamlines conventional hot forging into two sequential phases: primary head forming followed by hex socket creation.
In the initial forming stage, a cylindrical rare earth magnesium alloy billet (Ø1.4 × 7.16 mm) undergoes compressive deformation within the first die cavity to forge the 1.4 mm thick bolt head. The total volume of the bolt is 11.017 mm3. The preformed component is subsequently transferred to the secondary workstation where a hexagonal punch simultaneously extrudes the internal hex socket and ejects the near-net-shape fastener through controlled radial material flow.
Given the elevated raw material costs of rare earth magnesium alloys and the limited empirical database for their thermomechanical processing, the implementation of physics-based simulation becomes imperative. Advanced numerical modeling provides critical insights for parameter optimization, particularly in predicting microstructure-sensitive deformation behavior that conventional trial-and-error approaches cannot economically capture.

2.4. Modeling of Hot-Forming Process

This study used the CPFEM and the traditional FEM to model the hot-forming process of internal hexagonal bolts, as shown in Figure 3. The CPFEM simulation visualizes the blank material through dual representations: a composite display of finite element mesh superimposed on crystalline grains and an alternative perspective revealing only the grain architecture with hidden mesh components. The simulation was carried out step by step, consisting of the head forming and inner hexagonal forming steps. The traditional FEM simulation was conducted in Abaqus software, version 6.14, using a dynamic explicit analysis step that considers temperature changes. To ensure the accuracy of the model, the mold temperature was set to room temperature by default, without considering the microstructure details of the WE43 magnesium alloy. The contact surface between the bolt and the mold adopted a friction contact model, with a friction coefficient set at 0.35 based on Banijamali and Yang’s previous works [27,28] and a percentage of energy dissipation generated by friction set at 0.5. This setting helps ensure the accurate simulation of material flow and avoid virtual results caused by excessive slip. In the simulations of Steps 1 and 2, a rigid non-deformable model was used to model the upper and lower molds. During the simulation process, the method of loading the punch of the upper mold was through applying a displacement load. ALE adaptive grid control was added with an input frequency of 10, remeshing sweeps per increment of 3, and initial remeshing sweeps of 3. The entire simulation model used a temperature displacement coupled mesh, C3D8RT. In the upsetting head model of Step 1, 66,744 mesh elements were used, while in the hexagonal hole-forming model of Step 2, 56,876 mesh elements were used.
A comparative analysis was conducted across five distinct mesh configurations under 250 °C thermal conditions. In Step 1, the strains in the x-direction (LE11) and z-direction (LE33) were selected as validation parameters, with element counts systematically varied as 8424; 38,880; 53,200; 66,744; and 86,229. In Step 2, the strain in the y-direction (LE22) served as the critical indicator, employing the element counts varied as 7608; 21,516; 50,680; 56,876; and 71,784.
Table 1 shows the comparison results of the distinct mesh. The baseline configuration (8424 and 7608 elements) exhibited significant deviations in all metrics, which confirms insufficient mesh resolution. The refined meshes (38,880–86,229 and 21,516–71,784 elements) demonstrated fewer errors and stabilized responses near the asymptotic mean values, which indicated mesh convergence. In comparison, the 66,744-element and 56,876-element mesh were adopted as the solution, balancing numerical accuracy and computational feasibility. This configuration reduces discretization errors while maintaining tractable simulation durations.
For the CPFEM, the analysis steps also adopted a dynamic explicit analysis considering temperature. Due to its detailed requirements for microstructure details and high computational costs, it is not practical to directly apply fine mesh partitioning to the entire fastener model for a structural scale analysis. Therefore, this study only introduced grain division based on the traditional FEM model to simplify the calculation process. Figure 3 shows the division of grains, and the Voronoi method was used to generate the grain model. The average grain size is 280 μm [29]. Specifically, in the upsetting head model of Step 1, 482 grains were divided, while in the hexagonal hole-forming model of Step 2, 475 grains were divided. Grain division is mainly used to analyze the microstructure evolution of materials during deformation and help establish more accurate crystal plasticity models.
In this work, hot-upsetting-forming simulations were conducted across a temperature range from 25 °C (room temperature control group) to 650 °C, specifically at 250 °C, 350 °C, 450 °C, 550 °C, and 650 °C, to establish thermal deformation behavior benchmarks. In order to meet the actual engineering processing strain rate, the pressing speed was set at 0.3 mm/s and 0.04 mm/s in Step 1 and Step 2, and the corresponding strain rate was 0.05 s−1 and 0.03 s−1, respectively.

3. Crystal Plasticity Framework

The deformation behavior of WE43 magnesium alloys under elevated temperatures exhibits distinct characteristics compared to room temperature conditions. At high-temperature regimes (typically above 200 °C), dislocation slip becomes the predominant deformation mechanism, controlled by non-basal slips at various strain rates and temperatures, while twinning activity is significantly suppressed [30]. Hence, the present study focuses exclusively on dislocation-mediated slip mechanisms.
The total deformation gradient tensor F t o t a l can be decomposed into the thermal part F T and mechanical part F . The mechanical deformation gradient tensor F consists of the elastic part F e and plastic part F p [31,32,33]:
F t o t a l = F F T = F e F p F T
where the lattice rotation is determined by F e , and F p does not cause lattice rotation or deformation. T represents the current temperature, and the temperature change T can be calculated by T = T T f o r m e r (where T f o r m e r represents former time temperature).
The velocity gradient tensor L is computed by F :
L = F ˙ F 1
and can be additively decomposed into its elastic part L e and plastic part L p :
L = F ˙ e F e 1 + F e F ˙ p F p 1 F e 1 = L e + L p
The plastic velocity gradient L p in the intermediate configuration is
L p = F ˙ p F p 1
As the plastic deformation of metal materials is based on dislocation slip, the plastic velocity gradient L p can be expressed as [34,35]
L p = α = 1 N s γ ˙ α m α n α
where N s is the number of slip systems, γ ˙ α is the plastic slip rate, and m α and n α are the unit vectors of the slip direction of slip system α and the normal direction of the slip surface, respectively. The normal slip direction and slip plane in the deformed configuration are given by
m e α = F e m α  
n e α = n α F e 1  
According to Schmid’s law, the slip system will be activated when the magnitude of the resolved shear stress (RSS) τ α is greater than the critical resolved shear stress (CRSS) τ c α . The RSS τ α can be defined as
τ α = σ : m e α n e α
where σ is the Cauchy stress tensor.
The shearing rate of slip γ ˙ α can be expressed as
γ ˙ α = γ ˙ 0 α e x p G k B T
where γ ˙ 0 α and k B are the reference slip rate and Boltzmann’s constant and G represents the average magnitude of the activation energy requisite:
G = Q 1 τ α τ c α ψ q
where Q , ψ , and q are the activation energy for mobile dislocations and parameters associated with the barrier profile and shape of the enthalpy curve.
Combining Equations (9) and (10), the shearing rate of slip γ ˙ α can be expressed as
γ ˙ α = γ ˙ 0 α e x p Q k B T 1 τ α τ c α ψ q s g n τ α
The inverted form of the enthalpy-based slip law is
τ v α = τ c α 1 l n γ ˙ α γ ˙ 0 α k B T Q 1 ψ 1 q s g n γ ˙ α
By utilizing the reverse form of the slip law, the efficiency of the solution process can be accelerated [36,37]. According to Equation (12), the derivatives of shear stresses solved in the forward case is
d γ ˙ α d τ α = γ ˙ α Q ψ q k B T τ c α 1 τ α τ c α ψ q 1 τ α τ c α ψ 1
and the derivative with the slip rates solved in the reverse case can be described as
d τ v α d γ ˙ α = k B T τ c α γ ˙ α Q ψ q 1 l n γ ˙ α γ ˙ 0 α k B T Q 1 q 1 ψ ψ l n γ ˙ α γ ˙ 0 α k B T Q 1 q q   f o r   γ ˙ α > 0  
The shear rate of slip system α, including the temperature effect, can be described by the modified Orowan equation [38,39]:
τ c α ε ˙ , T = τ 0 α + τ H P α ε ˙ , T + τ f o r α ε ˙ , T + τ s u b α ε ˙ , T
In this context, τ 0 α is the initial CRSS and τ H P α is a barrier term that reflects the influence of grain size.
τ H P α ε ˙ , T = k H P α μ α b α d m f p α
where b α is the Burgers vector, k H P α is the Hall–Petch-like coefficients, μ α is the shear modulus, and d m f p α is the grain size.
In Equation (15), the impact that the accumulation of forest dislocation density ρ f o r α has on the evolution of slip resistance is reflected by τ f o r α :
Δ   ρ f o r α = k 1 ρ f o r α k 2 ε ˙ , T ρ f o r α γ ˙ α Δ t
where k 1 and k 2 are the coefficient for rate-insensitive dislocation storage and dislocation dynamic recovery, respectively. The relationship between coefficient k 1 and k 2 is [40,41]
k 2 = k 1 ξ b α g α 1 K B T D α b 3 l n ε ˙ ε ˙ 0
where ξ , g α , D α , and ε ˙ 0 are the dislocation interaction parameter, effective activation enthalpy, drag stress, and reference strain rate (set as 10−7 s−1), respectively.
Similar to τ f o r α , τ s u b α evolves with the substructure dislocation density ρ s u b :
Δ   ρ s u b = ζ α f α ρ s u b k 2 ρ f o r α γ ˙ α Δ t
where ζ and f α are the rate coefficient and fraction of recovery rate, respectively.
Typically, the geometric factor χ , which is defined as a dislocation interaction matrix, is represented as a diagonal matrix [42,43].
  τ f o r α ε ˙ , T = μ α b α χ 2 ρ f o r α
  τ s u b α ε ˙ , T = μ α b α k s u b ρ s u b l n 1 b α ρ s u b
where χ is set to a value of 0.81, and the empirical constant k s u b is assigned a value of 0.086 [44].
Figure 4 illustrates a flow chart for the calculation procedure of the CPFEM. The user-defined material subroutine (UMAT) was integrated into the finite element software ABAQUS® by implementing it through the material property interface. During the simulation process, the subroutine read and updated state variables at each computation step. This implementation enabled crystal plasticity simulations that accurately capture material deformation behavior under hot-upsetting-forming conditions. The solution of the residual was performed using Newton–Raphson iteration until the residual became less than 10−8 MPa.
The five independent single-crystal elastic parameters for the Mg alloy are C 11 = 59,300, C 12 = 25,700, C 13 = 21,400, C 33 = 61,500, and C 44 = 16,400 (all in MPa) [45,46]. The shear modulus was calculated using the Hill average method [47]. Table 2 shows all the parameters required for the above CPFEM model. The polycrystalline representative volume element (RVE) was divided into the cell aggregates with an average grain size identical to that of the formed specimen for uniaxial tensile simulation via the Voronoi tessellation method, as illustrated in Figure 5a. The RVE was discretized using C3D8 hexahedral elements, with periodic boundary conditions implemented to enhance computational accuracy and result reliability. Figure 5b compares the tensile stress–strain curves obtained from the CPFEM simulations and experimental results under the aforementioned parameters, along with specimen dimensions and fracture morphology.

4. Results and Discussion

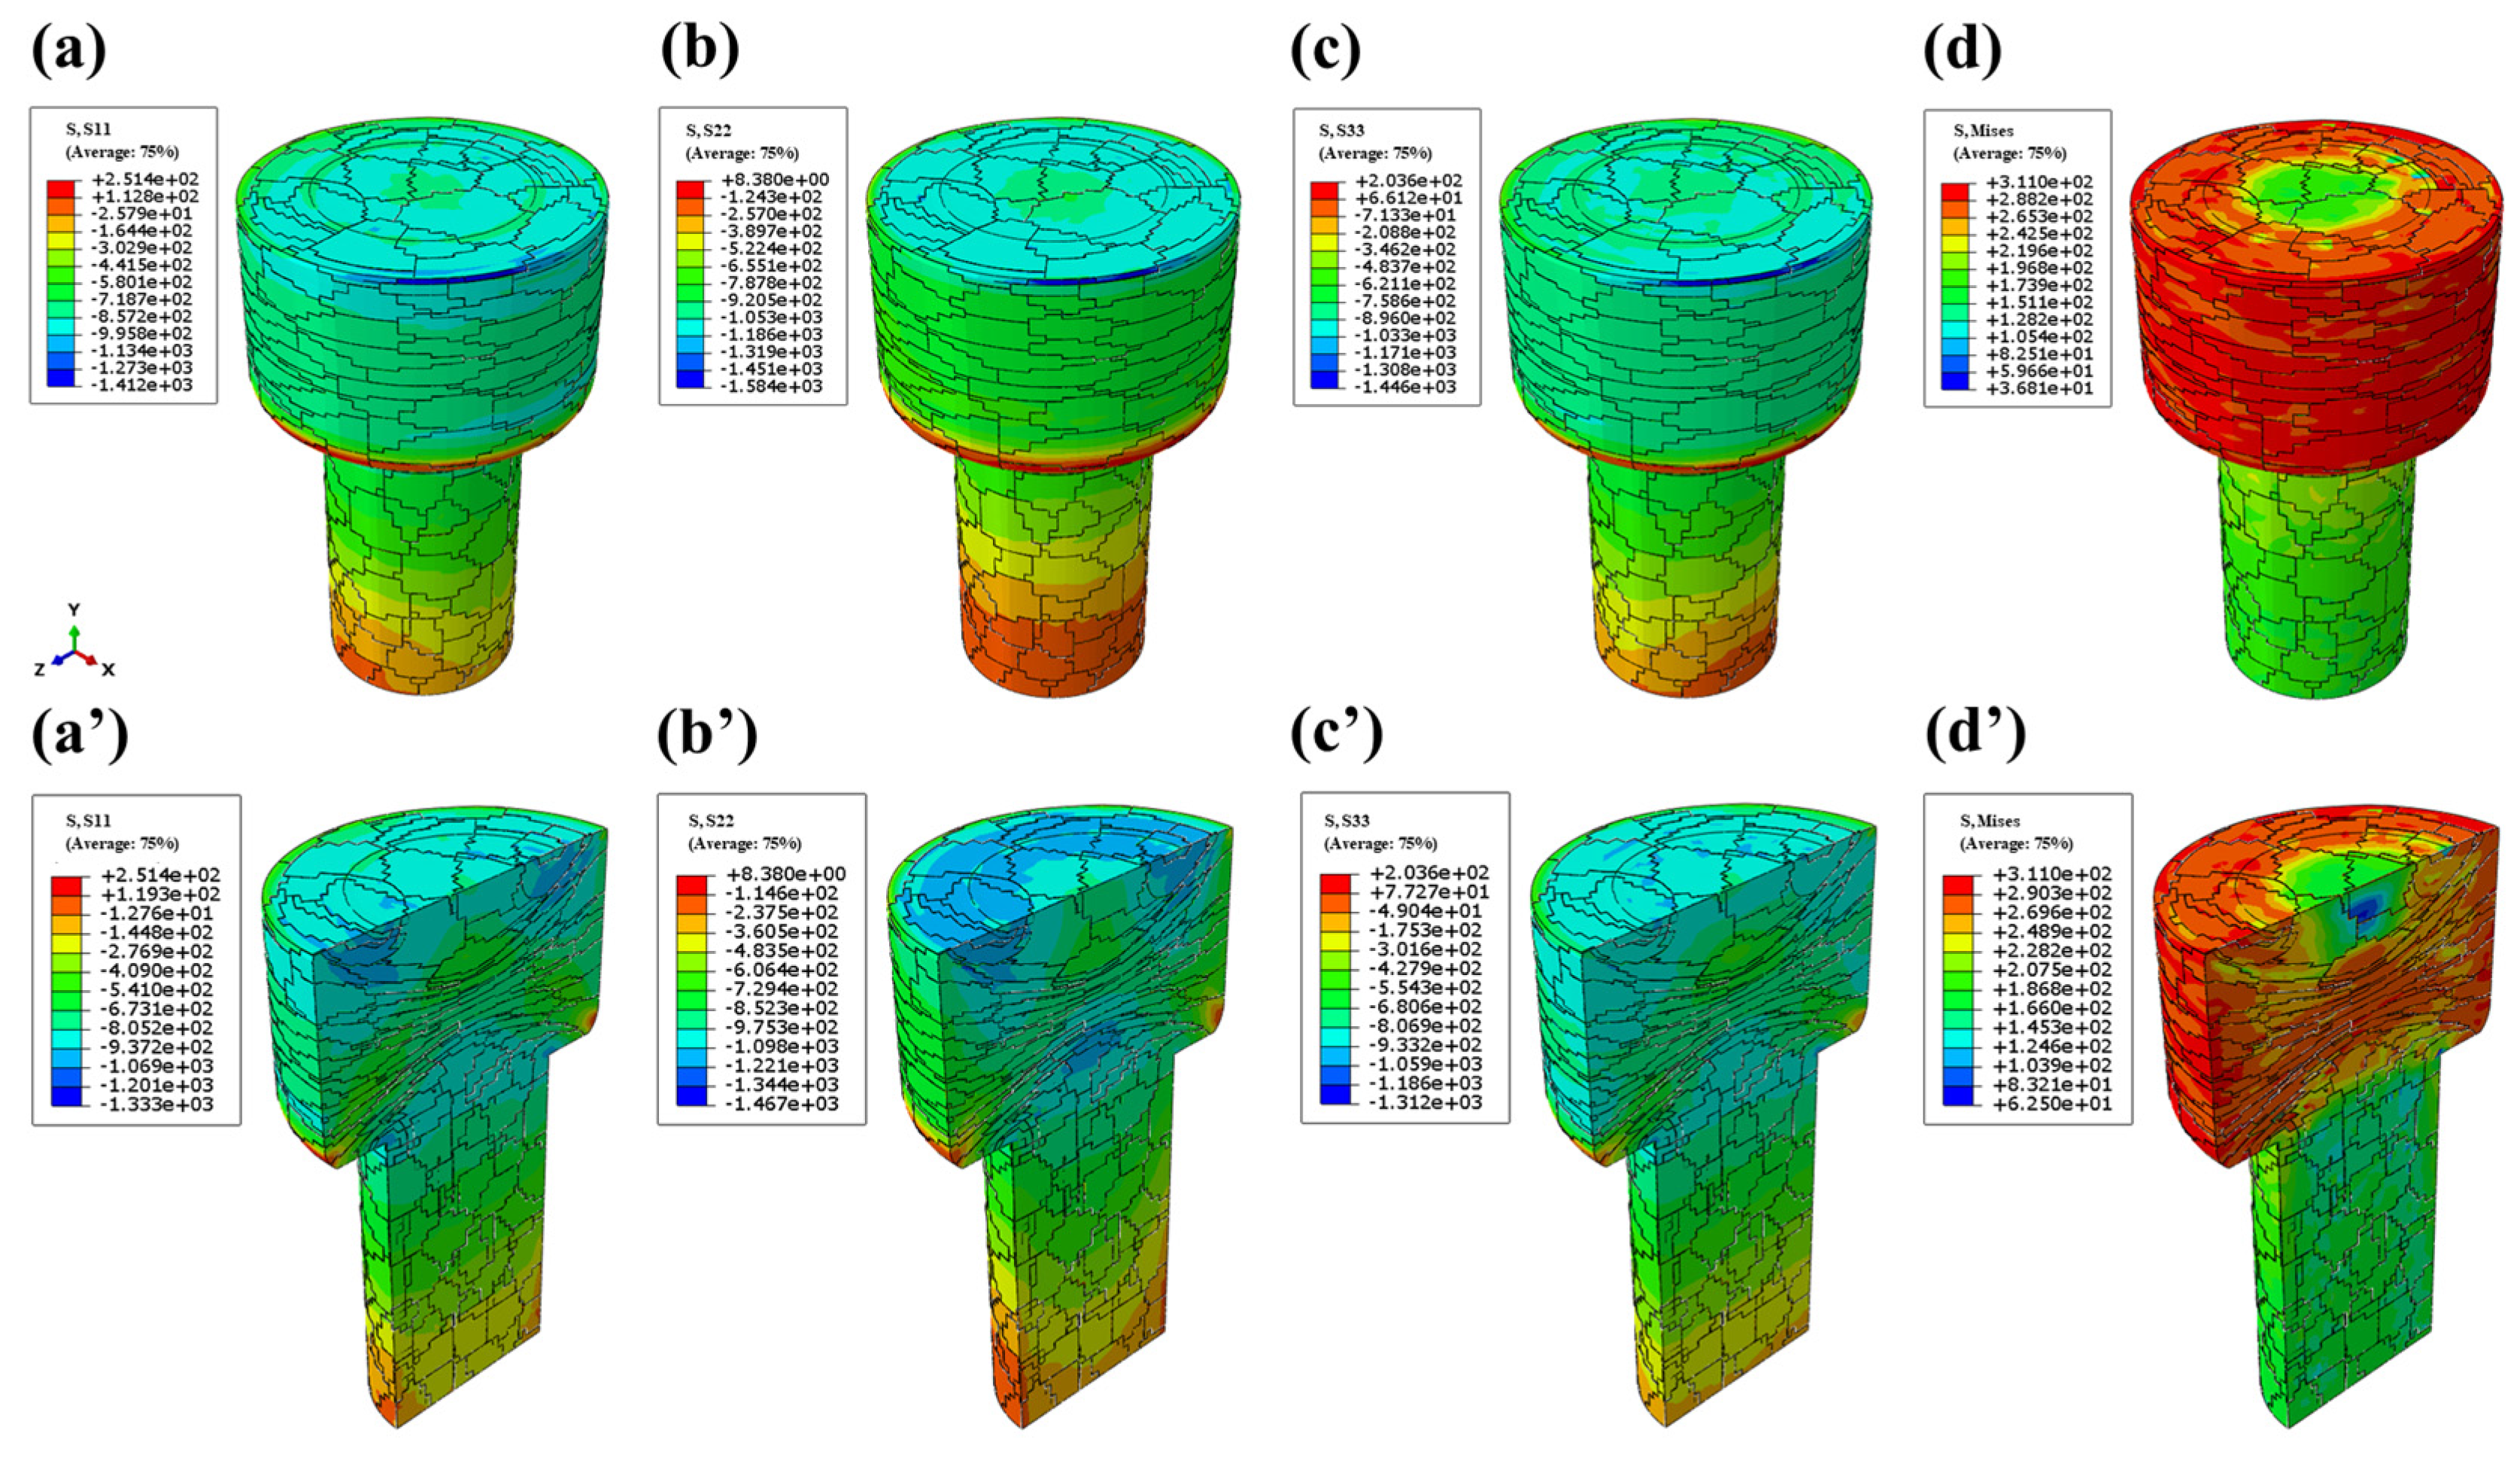
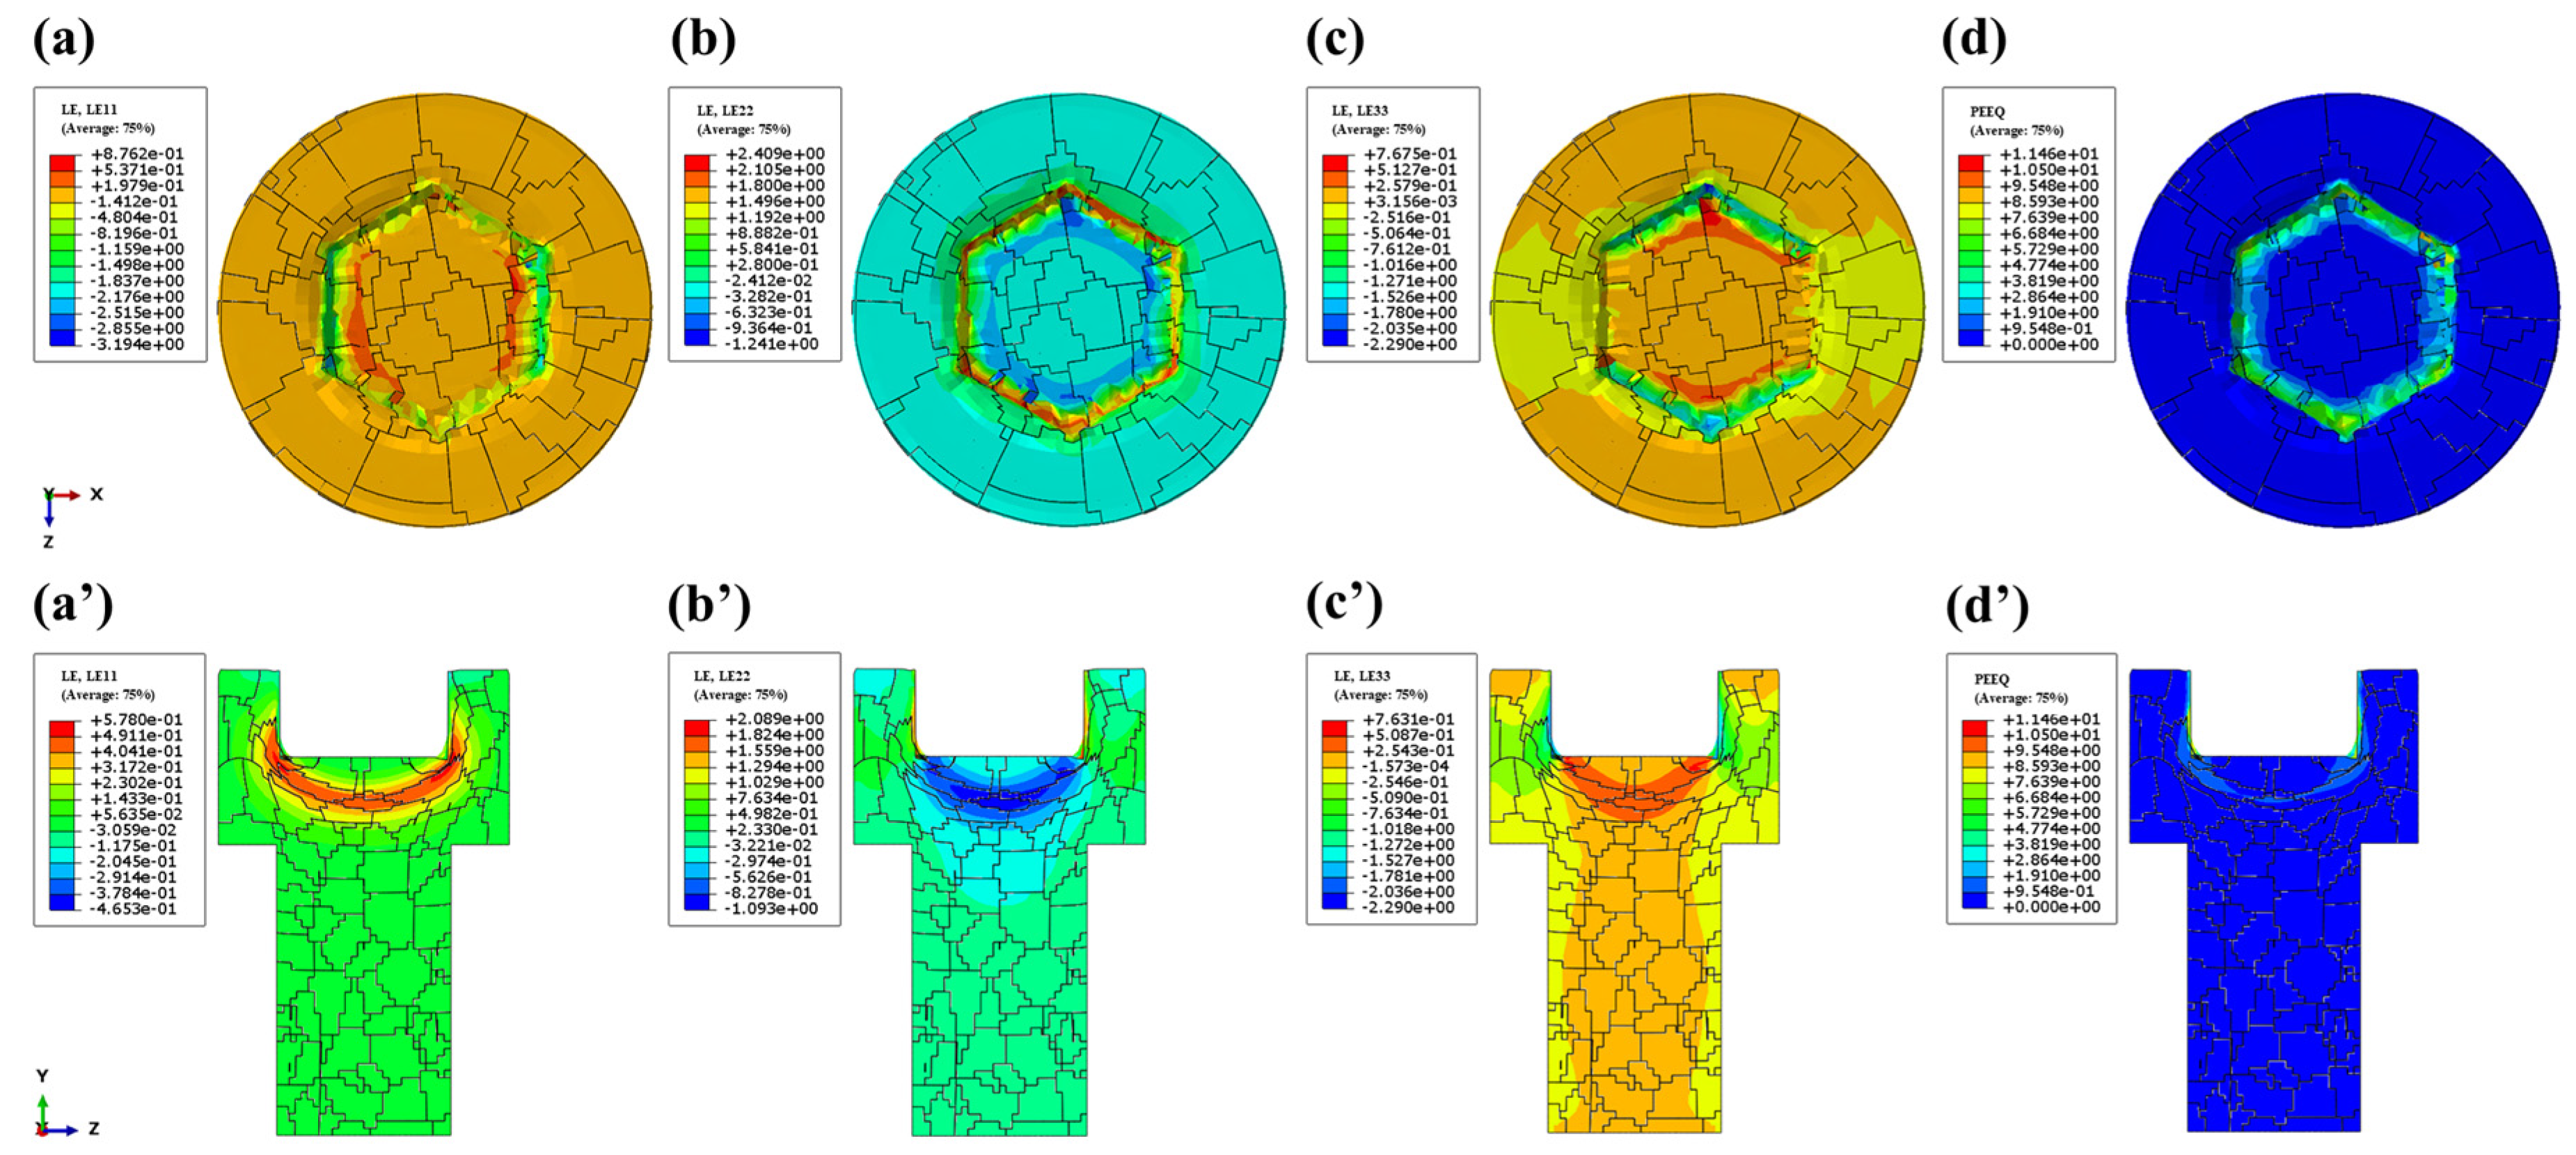
4.1. Comparison of Crystal Plasticity and Traditional Finite Element Simulation

For the head-forming phase, the simulation parameters were set at 250 °C with a deformation velocity of 0.3 mm/s. Figure 6 presents the post-forming strain contour maps, including components along the x-axis, y-axis (compressive deformation direction), z-axis, PEEQ, and corresponding cross-sectional views. The analysis reveals a non-uniform strain distribution pattern, where maximum strain concentrations occur in the central region and peripheral edges of the head’s upper/lower extremities, reaching a peak equivalent plastic strain value of 1.763. Conversely, low-strain zones were observed at the contact interface between the head’s upper surface and forming die.
The deformation mechanism exhibits biaxial tensile expansion along the x-z plane, resulting in maximum strain accumulation at the central region of the head in both the x- and z-directional strain contours. Notably, high-strain zones propagate along 45° angular orientations, forming distinct shear band patterns. This strain localization phenomenon indicates significant susceptibility to shear-induced fracture during processing. To mitigate this failure mode, material flow properties should be enhanced through process parameter optimization or material modifications.
As illustrated in Figure 7, the stress contour maps demonstrate a characteristic stress gradient with elevated stress concentrations in the central region and diminished stress levels along peripheral lateral surfaces. Conventional FEM simulations exhibited congruent stress distribution patterns across the x-, y-, and z-axes, dominated predominantly by compressive stresses. The von Mises stress profiles reveal a marked stress asymmetry between the upper and lower sections of the head, with peak stress magnitudes reaching 311 MPa in the upper region. While these FEM-derived upsetting results align with prior experimental and numerical studies in macroscopic mechanical behavior characterization, inherent limitations persist in capturing grain-scale evolution during deformation, particularly regarding its influence on localized stress–strain partitioning. This resolution gap underscores the necessity for multiscale modeling approaches integrating crystal plasticity or in situ microstructural characterization to advance deformation mechanism analysis.
The incorporation of crystallographic grain structures into CPFEM simulations substantially improves the characterization of grain-scale mechanical interactions. Figure 8 displays triaxial strain distributions (x-, y-, and z-directions) and corresponding PEEQ contour maps. While both the FEM and CPFEM exhibit similar spatial distribution patterns, the CPFEM predictions demonstrate systematically higher strain magnitudes across all principal directions. Notably, the y-direction strain in the CPFEM achieves a 49.4% increase compared to the FEM, with 3–5% enhancements observed in other directions. This quantitative enhancement correlates with the significantly intensified heterogeneous strain localization observed in CPFEM results, which contrasts sharply with the quasi-homogeneous strain patterns generated by the conventional FEM simulations. The fundamental distinction arises from the CPFEM’s explicit consideration of crystallographic slip system activation and intergranular constraint effects during plastic deformation.
The material deformation exhibits distinct characteristics across the principal axes. In the compressive y-direction, the central head regions demonstrate severe grain distortion with flattened morphology under axial compression, concurrently exhibiting longitudinal elongation due to tensile stress coupling in x-z planes. The contact area between the material and the mold has large friction, where the deformation of the grain is suppressed, making the strain in this part at a lower level compared to the central part. Moreover, stress concentration is more likely to occur at the grain boundary. It can be seen that the CPFEM framework successfully resolves the microscale deformation heterogeneity that the conventional continuum-level FEM intrinsically obscures, particularly in capturing anisotropic strain partitioning between hard and soft grain orientations and the stress concentration at triple junction regions.
Figure 9 presents the CPFEM-derived stress contour maps, revealing non-uniform stress distribution characteristics across the head’s upper section. Notably, peripheral constraint effects during compression and frictional interactions at the tool–workpiece interface induce distinct stress concentrations along both the upper and lower edge regions, complementing the central high-stress zone. This computational advancement fundamentally differs from the conventional FEM through the explicit incorporation of intergranular mechanical interactions governing localized stress triaxiality states and crystallographic texture-dependent deformation mechanisms.
The CPFEM framework demonstrates superior resolution in capturing microstructural stress concentrators, where the max stress point is at grain boundary triple junctions, and there are high strain partitioning disparities between adjacent grains. These findings validate the CPFEM’s enhanced predictive capability for heterogeneous thermomechanical deformation.
Figure 10 and Figure 11 present the FEM-derived strain and stress contour maps characterizing the hexagonal socket forming process, respectively. Figure 10 shows that the pronounced strain concentrations along the socket walls under combined compression–shear loading contrast with the constrained strain accumulation at tool–workpiece contact zones. The biaxial tensile stresses along the x-z axes propagate through the bolt head, inducing secondary tensile strain components in the socket walls. Figure 11 shows that the maximum von Mises stress (311 MPa) concentrates at upper socket corners, and the steep stress gradients develop between high-stress socket regions and low-stress shank areas.
In contrast to the conventional FEM, the CPFEM demonstrates superior capability in characterizing morphological and dimensional variations of crystalline grains, thereby effectively revealing microscopic irregularities on hexagonal inner hole walls. As illustrated in Figure 12 and Figure 13 depicting strain and stress distributions, the CPFEM results present the enhanced resolution of surface imperfections in the hexagonal hole. While subtle intergranular differences influence local strain patterns, both simulation approaches exhibit consistency in macroscopic stress distribution.
Notably, significant stress concentration occurs at the lower edge of the hexagonal hole wall and the upper periphery of the outer circumference, attributable to intensified local plastic deformation. Conversely, reduced stress levels observed in the top contact region between the die and workpiece indicate constrained deformation due to mold confinement.

4.2. Influence of Temperature on Forming Performance

To systematically investigate the influence of deformation temperature on fastener-forming processes and reveal the dynamic evolution mechanism of temperature fields, it is essential to incorporate temperature field parameters in numerical simulations. This experiment maintained a constant die temperature at 25 °C while setting material initial temperatures at six gradients: 25 °C, 250 °C, 350 °C, 450 °C, 550 °C, and 650 °C. Figure 14a–f illustrates the temperature distribution characteristics after hexagonal hole forming under different initial temperatures.
Figure 14g,h compares the temperature variations between the edge, central core, and hole periphery. The temperature difference between the hole and the center shows a distinct two-stage downward trend as the initial temperature goes up. From 25 °C to 450 °C, the difference reduces monotonically from 128.9 °C to 4.4 °C, with a steep drop in the 25–250 °C range (128.9 °C→40.8 °C, a decrease of 68.3%). This indicates that the heat conduction efficiency improves along with the increase in temperature. When the temperature reaches 550 °C, the temperature difference becomes negative (−26 °C), and it further drops to −62.8 °C at 650 °C. The turning point at 450 °C marks the shift from the positive temperature gradient of the hole to the negative temperature gradient. At an ambient temperature (25 °C), the hole periphery experiences a peak temperature surge to 153.9 °C (ΔT = 128.9 °C vs. central zone), exceeding the initial temperature by 484.8%, which represents that severe friction-induced heating dominates the thermal response. The edge regions show paradoxical cooling to 22 °C (ΔT = −3 °C vs. central zone) due to heat dissipation through die contact. The thermal shock effect is evidenced by the steep radial gradient between the hole and central zone. In the range of 350–650 °C, preheating initiates competing thermal transport mechanisms. The central zone maintains near-initial temperatures. The edge zone temperature decreases monotonically from 161.2 °C to 274.1 °C with the initial temperature increase. The hole periphery zone develops progressive temperature deficits at 550 °C and 650 °C, indicating strain-induced heating surpasses conductive losses.
Figure 15a–f displays the distribution characteristics of the PEEQ and von Mises stress after hexagonal hole forming at different initial temperatures. High PEEQ zones concentrate in the shear bands of the hole walls, with peak von Mises stress occurring at the head–die contact edges. The stress distribution on the head of the bolt becomes more non-uniform as the temperature goes up. Under the 350 °C conditions, the PEEQ distribution expands to the center head region, while the stress concentration migrates to geometric transition zones under 250 °C, indicating enhanced material ductility with temperature rise.
Figure 15g provides quantified comparisons of the extreme values. The minimum von Mises stress exhibited multi-stage evolution characteristics. From 25 to 250 °C, it increased from 45.31 MPa to 75.44 MPa, indicating the suppression effect of thermal softening. At 350 °C, it decreased to 55.14 MPa, reflecting the local stress redistribution induced by dynamic recrystallization. Between 450 and 650 °C, the stress fluctuated within the range of 53.64–63.15 MPa. Notably, the stress at 450 °C rebounded to 60.01 MPa (an 8.8% increase compared with 350 °C), demonstrating the fine-grain strengthening effect that balances both deformation resistance and ductility requirements. The minimum PEEQ exhibited a V-shaped trajectory, decreasing by 32.2% from 12.32 MPa at 25 °C to 8.347 MPa at 350 °C, followed by a 16.15% rebound to 9.695 MPa at 650 °C. When the temperature rose to 350 °C, the minimum PEEQ first exceeded zero, signaling the material’s entry into the microplastic deformation stage. However, the maximum PEEQ concurrently decreased to 8.347 (representing a 29.6% reduction compared with the 250 °C condition). This phenomenon indicates that the competitive effect between dislocation slip and dynamic recovery significantly suppressed the accumulation of macroscopic plasticity, thereby avoiding the risk of sudden failure. Minor plastic strains were able to relieve local stress concentrations through grain boundary sliding while maintaining the overall structural integrity. In contrast to the secondary PEEQ increase and stress fluctuations (63.15→53.64 MPa) observed in the 550–650 °C temperature range, the 350–450 °C interval exhibited superior stability. These nonlinear variations originate from temperature-sensitive multi-mechanism coupling effects. Below 350 °C, dislocation-multiplication-dominated work hardening and local dynamic recovery jointly regulate the stress distribution; upon reaching 450 °C and above, dynamic recrystallization-induced fine-grain strengthening and softening effects compete with each other. Meanwhile, the synergistic interaction between the strain-rate sensitivity evolution and dynamic recovery processes further modulates the plastic response.
Figure 16a,b show the variation in the average von Mises stress vs. PEEQ and plastic strain vs. total strain along the y-direction of the hexagonal-hole-forming head over time at different temperatures. Temperature has a significant impact on both the stress and plastic strain evolution of the bolt head. As the temperature increases from 25 °C to 650 °C, the peak stress gradually decreases, while the peak plastic strain gradually increases. At 25 °C, the stress reaches its highest value of 270.48 MPa. At 650 °C, the peak value advanced to 251.08 MPa. This indicates that the increase in temperature not only weakens the load-bearing capacity of the material but also accelerates the process of stress redistribution. Figure 16b reveals that the plastic strain increases significantly with the deformation process, indicating continuous plastic strain accumulation, and demonstrates temperature-gradient characteristics. During the early stage of upsetting, the average plastic strain values at different temperatures exhibited negligible differences. However, as the process progresses, the temperature significantly affects the accumulation of plastic strain values, leading to a marked divergence, and higher temperatures result in a higher final plastic strain.

5. Conclusions

This study simplifies the manufacturing process of fasteners into head-upsetting and inner hexagonal-hole-forming processes. The CPFEM and traditional FEM were used to simulate the hot-upsetting process of WE43 magnesium alloy bolts, and the influence of deformation temperature on fastener forming was compared and analyzed. The main research contents and conclusions are as follows:
  • During the head-upsetting process, the strain concentration area is distributed along the 45°direction, which is prone to shear fracture, while local stress accumulation is observed during the formation of hexagonal holes.
  • The temperature has a significant impact on the average stress and PEEQ in the forming behavior. The optimal formability occurs at 350–450 °C, where thermal softening dominance balances the strain-hardening rate with thermal softening coefficient.
  • Compared with the conventional FEM, the CPFEM can capture the shape and size differences of grains more finely, revealing the microscopic irregularities of the inner hexagonal pore walls. Through detailed grain scale modeling, the formation of deformation zones, stress concentration, and their impact on the final product quality can be analyzed in depth, providing a theoretical basis for further optimizing the forming process.

Author Contributions

A.J.: Software, Methodology, Investigation, Data Curation, Writing—Original Draft. Y.H.: Conceptualization, Project Administration, Funding Acquisition, Writing—Review and Editing. Z.Z.: Software, Methodology, Validation, Writing—Review and Editing. Z.Y.: Data Curation, Formal Analysis, Visualization, Writing—Review and Editing. Y.S.: Data Curation, Visualization, Writing—Review and Editing. All authors have read and agreed to the published version of the manuscript.

Funding

This work was supported by the National Natural Science Foundation of China (Grants No. 51874245).

Data Availability Statement

The original contributions presented in this study are included in the article. Further inquiries can be directed to the corresponding author.

Conflicts of Interest

All participating authors declare that they have no conflicts of interest in this work. We once again solemnly declare that there are no conflicts of interest with the submitted work, such as commercial interests or ancillary interests.

References

  1. Tsakiris, V.; Tardei, C.; Clicinschi, F.M. Biodegradable Mg alloys for orthopedic implants—A review. J. Magnes. Alloys 2021, 9, 1884–1905. [Google Scholar] [CrossRef]
  2. Sommer, N.G.; Hirzberger, D.; Paar, L.; Berger, L.; Ćwieka, H.; Schwarze, U.Y.; Herber, V.; Okutan, B.; Bodey, A.J.; Willumeit-Römer, R.; et al. Implant degradation of low-alloyed Mg–Zn–Ca in osteoporotic, old and juvenile rats. Acta Biomater. 2022, 147, 427–438. [Google Scholar] [CrossRef] [PubMed]
  3. Staiger, M.P.; Pietak, A.M.; Huadmai, J.; Dias, G. Magnesium and its alloys as orthopedic biomaterials: A review. Biomaterials 2006, 27, 1728–1734. [Google Scholar] [CrossRef] [PubMed]
  4. Henderson, S.E.; Verdelis, K.; Maiti, S.; Pal, S.; Chung, W.L.; Chou, D.-T.; Kumta, P.N.; Almarza, A.J. Magnesium alloys as a biomaterial for degradable craniofacial screws. Acta Biomater. 2014, 10, 2323–2332. [Google Scholar] [CrossRef]
  5. Rout, P.K.; Roy, S.; Rathore, D. Recent advances in the development of Mg-Ca-Zn alloys as biodegradable orthopedic implants. Mater. Today Proc. 2024, 115, 24–30. [Google Scholar] [CrossRef]
  6. Yang, Y.; He, C.; E, D.; Yang, W.; Qi, F.; Xie, D.; Shen, L.; Peng, S.; Shuai, C. Mg bone implant: Features, developments and perspectives. Mater. Des. 2020, 185, 108259. [Google Scholar] [CrossRef]
  7. Wang, D.; Xu, W. Fatigue failure analysis and multi-objective optimisation for the hybrid (bolted/bonded) connection of magnesium–aluminium alloy assembled wheel. Eng. Fail. Anal. 2020, 112, 104530. [Google Scholar] [CrossRef]
  8. Turvey, T.; Proffit, W.; Phillips, C. Biodegradable fixation for craniomaxillofacial surgery: A 10-year experience involving 761 operations and 745 patients. Int. J. Oral Maxillofac. Surg. 2011, 40, 244–249. [Google Scholar] [CrossRef]
  9. Söntgen, S.; Keilig, L.; Kabir, K.; Weber, A.; Reimann, S.; Welle, K.; Bourauel, C. Mechanical and numerical investigations of biodegradable magnesium alloy screws for fracture treatment. J. Biomed. Mater. Res. Part B Appl. Biomater. 2023, 111, 7–15. [Google Scholar] [CrossRef]
  10. Lashgari, H.; Zangeneh, S. Numerical and experimental failure analysis of wind turbine blade fastener. Eng. Fail. Anal. 2024, 156, 107837. [Google Scholar] [CrossRef]
  11. Liu, X.; Kang, Y.; Lozhnikov, P.; Shchelkanov, A.; Wang, B. A novel stress-guided method to simultaneously improve fatigue resistance and anti-loosening of threaded fastener. Eng. Fail. Anal. 2025, 170, 109293. [Google Scholar] [CrossRef]
  12. Qi, M.; Wei, X.; Lu, H.; Yang, X.; Qu, X.; Zhang, L.; Zhao, X.; Yan, H.; Jiang, Y.; Dong, H. Effect of microstructure on hydrogen embrittlement resistance of 1400 MPa grade fastener 42CrMoVNb steel. J. Mater. Res. Technol. 2025, 35, 4099–4108. [Google Scholar] [CrossRef]
  13. Wang, X.; Xu, D.; Wu, R.; Peng, Q.; Jin, L.; Xin, Y.; Zhang, Z.; Liu, Y.; Chen, X.; Chen, G.; et al. What is going on in magnesium alloys? J. Mater. Sci. Technol. 2018, 34, 245–247. [Google Scholar] [CrossRef]
  14. Panchal, M.; Kaushik, L.; Ravi, K.R.; Khatirkar, R.; Choi, S.-H.; Singh, J. Recent advances in the in-plane shear testing of Mg alloy sheets. J. Magnes. Alloys 2023, 11, 405–424. [Google Scholar] [CrossRef]
  15. Shi, B.; Yang, C.; Peng, Y.; Zhang, F.; Pan, F. Anisotropy of wrought magnesium alloys: A focused overview. J. Magnes. Alloys 2022, 10, 1476–1510. [Google Scholar] [CrossRef]
  16. Sheng, L.; Du, B.; Hu, Z.; Qiao, Y.; Xiao, Z.; Wang, B.; Xu, D.; Zheng, Y.; Xi, T. Effects of annealing treatment on microstructure and tensile behavior of the Mg-Zn-Y-Nd alloy. J. Magnes. Alloys 2020, 8, 601–613. [Google Scholar] [CrossRef]
  17. Xu, X.; Chen, X.; Du, W.; Geng, Y.; Pan, F. Effect of Nd on microstructure and mechanical properties of as-extruded Mg-Y-Zr-Nd alloy. J. Mater. Sci. Technol. 2017, 33, 926–934. [Google Scholar] [CrossRef]
  18. Wang, G.G.; Bos, J. A study on joining magnesium alloy high pressure die casting components with thread forming fasteners. J. Magnes. Alloys 2018, 6, 114–120. [Google Scholar] [CrossRef]
  19. Hwang, Y.M.; Chang, C.Y. Finite element analysis and die design of heading processes of magnesium alloy screws. IOP Conf. Ser. Mater. Sci. Eng. 2016, 131, 012003. [Google Scholar] [CrossRef]
  20. Yaghoobi, M.; Voyiadjis, G.Z.; Sundararaghavan, V. Crystal Plasticity Simulation of Magnesium and Its Alloys: A Review of Recent Advances. Crystals 2021, 11, 435. [Google Scholar] [CrossRef]
  21. Peirce, D.; Asaro, R.J.; Needleman, A. An analysis of nonuniform and localized deformation in ductile single crystals. Acta Metall. 1982, 30, 1087–1119. [Google Scholar] [CrossRef]
  22. Tong, X.; Li, Y.; Fu, M. Modelling of grain size effects in progressive microforming using CPFEM. Int. J. Mech. Sci. 2024, 267, 108971. [Google Scholar] [CrossRef]
  23. GB/T 5153-2016; Designation and Composition of Wrought Magnesium and Magnesium Alloys. China Nonferrous Metals Industry Association: Beijing, China, 2016.
  24. Chen, J.; Dong, F.; Liu, S. Design and Mechanical Performance Evaluation of WE43 Magnesium Alloy Biodegradable Stents via Finite Element Analysis. Metals 2024, 14, 704. [Google Scholar] [CrossRef]
  25. Kubásek, J.; Dvorský, D.; Čavojský, M.; Roudnická, M.; Vojtech, D. WE43 magnesium alloy—Material for challenging applications. Met. Mater. 2019, 57, 159–165. [Google Scholar] [CrossRef]
  26. GB/T70.1; Hexagon Socket Head Cap Screws. China Machinery Industry Federation: Beijing, China, 2008.
  27. Banijamali, S.M.; Najafi, S.; Sheikhani, A.; Palizdar, Y. Dry tribological behavior of hot-rolled WE43 magnesium matrix composites reinforced by B4C particles. Wear 2022, 508–509, 204487. [Google Scholar] [CrossRef]
  28. Yang, L.; Zhao, Y.; Dong, Y.; Yang, J.; Wang, S.; Wang, C.; Bai, J.; Xue, F.; Chu, P.K.; Chu, C. Hybrid chondroitin sulfate-tailored phosphate coatings for improved corrosion and wear resistance of WE43 magnesium alloy. Surf. Coat. Technol. 2025, 503, 132012. [Google Scholar] [CrossRef]
  29. Cheng, T.; Zeng, Y.; Cui, Z.; Fan, L.; Li, S.; Miao, J.; Xu, S.; Liu, M. Preparation of nanoprecipitates and ultrafine grains for WE43 alloy to enhance mechanical properties by pre-aging treatment prior to extrusion. J. Alloys Compd. 2025, 1013, 178607. [Google Scholar] [CrossRef]
  30. Xiang, C.; Xu, Y.; Yang, Y.; Ding, H.; Wang, Z. Plastic deformation mechanisms and constitutive modeling of WE43 magnesium alloy at various strain rates and temperatures. J. Mater. Res. Technol. 2024, 29, 4110–4128. [Google Scholar] [CrossRef]
  31. Peirce, D.; Asaro, R.J.; Needleman, A. Material rate dependence and localized deformation in crystalline solids. Acta Metall. 1983, 31, 1951–1976. [Google Scholar] [CrossRef]
  32. Asaro, R.J. Micromechanics of Crystals and Polycrystals. Adv. Appl. Mech. 1983, 23, 1–115. [Google Scholar]
  33. Asaro, R.J.; Needleman, A. Texture development and strain hardening in rate dependent polycrystals. Acta Metall. 1985, 33, 923–953. [Google Scholar] [CrossRef]
  34. Hill, R.; Rice, J. Constitutive analysis of elastic-plastic crystals at arbitrary strain. J. Mech. Phys. Solids 1972, 20, 401–413. [Google Scholar] [CrossRef]
  35. Asaro, R.; Rice, J. Strain localization in ductile single crystals. J. Mech. Phys. Solids 1977, 25, 309–338. [Google Scholar] [CrossRef]
  36. Zhou, Z.; Huo, Y.; Wang, Z.; Demir, E.; Jiang, A.; Yan, Z.; He, T. Experimental investigation and crystal plasticity modelling of dynamic recrystallisation in dual-phase high entropy alloy during hot deformation. Mater. Sci. Eng. A 2025, 922, 147634. [Google Scholar] [CrossRef]
  37. Hardie, C.; Long, D.J.; Demir, E.; Tarleton, E.; Dunne, F.P. A robust and efficient hybrid solver for crystal plasticity. Int. J. Plast. 2023, 170, 103773. [Google Scholar] [CrossRef]
  38. Gao, T.; Zhao, D.; Zhang, T.; Jin, T.; Ma, S.; Wang, Z. Strain-rate-sensitive mechanical response, twinning, and texture features of NiCoCrFe high-entropy alloy: Experiments, multi-level crystal plasticity and artificial neural networks modeling. J. Alloys Compd. 2020, 845, 155911. [Google Scholar] [CrossRef]
  39. Orowan, E. Problems of plastic gliding. Proc. Phys. Soc. 1940, 52, 8–22. [Google Scholar] [CrossRef]
  40. Beyerlein, I.J.; Tomé, C.N. A dislocation-based constitutive law for pure Zr including temperature effects. Int. J. Plast. 2008, 24, 867–895. [Google Scholar] [CrossRef]
  41. Essmann, U.; Mughrabi, H. Annihilation of dislocations during tensile and cyclic deformation and limits of dislocation densities. Philos. Mag. A 1979, 40, 731–756. [Google Scholar] [CrossRef]
  42. Madec, R.; Devincre, B.; Kubin, L.P. From Dislocation Junctions to Forest Hardening. Phys. Rev. Lett. 2002, 89, 255508. [Google Scholar] [CrossRef]
  43. Mecking, H.; Kocks, U. Kinetics of flow and strain-hardening. Acta Met. 1981, 29, 1865–1875. [Google Scholar] [CrossRef]
  44. Feather, W.G.; Ghorbanpour, S.; Savage, D.J.; Ardeljan, M.; Jahedi, M.; McWilliams, B.A.; Gupta, N.; Xiang, C.; Vogel, S.C.; Knezevic, M. Mechanical response, twinning, and texture evolution of WE43 magnesium-rare earth alloy as a function of strain rate: Experiments and multi-level crystal plasticity modeling. Int. J. Plast. 2019, 120, 180–204. [Google Scholar] [CrossRef]
  45. Ganesan, S.; Yaghoobi, M.; Githens, A.; Chen, Z.; Daly, S.; Allison, J.E.; Sundararaghavan, V. The effects of heat treatment on the response of WE43 Mg alloy: Crystal plasticity finite element simulation and SEM-DIC experiment. Int. J. Plast. 2021, 137, 102917. [Google Scholar] [CrossRef]
  46. Githens, A.; Ganesan, S.; Chen, Z.; Allison, J.; Sundararaghavan, V.; Daly, S. Characterizing microscale deformation mechanisms and macroscopic tensile properties of a high strength magnesium rare-earth alloy: A combined experimental and crystal plasticity approach. Acta Mater. 2020, 186, 77–94. [Google Scholar] [CrossRef]
  47. Hill, R. The Elastic Behaviour of a Crystalline Aggregate. Proc. Phys. Soc. Sect. A 1952, 65, 349. [Google Scholar] [CrossRef]
  48. Patra, A.; Chaudhary, S.; Pai, N.; Ramgopal, T.; Khandelwal, S.; Rao, A.; McDowell, D.L. ρ-CP: Open source dislocation density based crystal plasticity framework for simulating temperature- and strain rate-dependent deformation. Comput. Mater. Sci. 2023, 224, 112182. [Google Scholar] [CrossRef]
Figure 1. Magnesium-based fixation apparatuses for medical devices: (ad) illustrate the typical bone fixation devices, whereas (e) represents the treatment process of metatarsal fracture using Mg screw (red arrows). (a) X-ray imaging of metatarsal fracture (red circle); (b) on the day of surgery, and (c–e) X-ray images at 1, 3 and 5 months post-surgery. Reprinted from Ref. [6].
Metals 15 00475 g001
Figure 2. Design of the fastening process and the design dimensions of the M1.4 bolt fastener. (A—A represents the cutting plane.)
Metals 15 00475 g002
Figure 3. Established CPFEM and FEM models to simulate the hot-forming process of M1.4 hexagonal socket bolts.
Metals 15 00475 g003
Figure 4. Flow chart for the calculation procedure of the CPFEM.
Metals 15 00475 g004
Figure 5. (a) Illustration of RVE and applied periodic boundary conditions; (b) comparison of tensile stress–strain curve between CPFEM simulation and experiment with specimens’ morphology.
Metals 15 00475 g005
Figure 6. FEM simulation of the head-forming stage strain: (a) x-direction; (b) y-direction; (c) z-direction; (d) equivalent plastic strain contour map, where (a’d’) are the corresponding sectional views.
Metals 15 00475 g006
Figure 7. FEM simulation of the head-forming stage stress: (a) x-direction; (b) y-direction; (c) z-direction; (d) von Mises stress contour map, where (a’d’) are the corresponding sectional views.
Metals 15 00475 g007
Figure 8. The CPFEM simulation of the head-forming stage strain: (a) x-direction; (b) y-direction; (c) z-direction; (d) equivalent plastic strain contour map, where (a’d’) are the corresponding sectional views.
Metals 15 00475 g008
Figure 9. The CPFEM simulation of the head-forming stage stress: (a) x-direction; (b) y-direction; (c) z-direction; (d) von Mises stress contour map, where (a’d’) are the corresponding sectional views.
Metals 15 00475 g009
Figure 10. The FEM simulation of the hexagonal-socket-forming stage strain: (a) x-direction; (b) y-direction; (c) z-direction; (d) equivalent plastic strain contour map, where (a’d’) are the corresponding sectional views.
Metals 15 00475 g010
Figure 11. The FEM simulation of the hexagonal-socket-forming stage strain: (a) x-direction; (b) y-direction; (c) z-direction; (d) von Mises stress distribution map, where (a’d’) are the corresponding sectional views.
Metals 15 00475 g011
Figure 12. The CPFEM simulation of the hexagonal-socket-forming stage strain: (a) x-direction; (b) y-direction; (c) z-direction; (d) equivalent plastic strain contour map, where (a’d’) are the corresponding sectional views.
Metals 15 00475 g012
Figure 13. The CPFEM simulation of the hexagonal-socket-forming stage strain: (a) x-direction; (b) y-direction; (c) z-direction; (d) von Mises stress distribution map, where (a’d’) are the corresponding sectional views.
Metals 15 00475 g013
Figure 14. Temperature field distribution contour maps of the internal hexagon upsetting process at (a) 25 °C; (b) 250 °C; (c) 350 °C; (d) 450 °C; (e) 550 °C; and (f) 650 °C. (g) Comparison and (h) difference between the edge, central core, and hole periphery temperature.
Metals 15 00475 g014
Figure 15. PEEQ and von Mises stress distribution contour maps of the internal hexagon upsetting process at (a) 25 °C; (b) 250 °C; (c) 350 °C; (d) 450 °C; (e) 550 °C; and (f) 650 °C and (g) a comparison.
Metals 15 00475 g015
Figure 16. Average (a) von Mises stress vs. PEEQ and (b) plastic strain vs. strain along the loading direction of the head at different temperatures during the formation process of hexagonal holes.
Metals 15 00475 g016
Table 1. Comparison of different mesh results in Step 1 and Step 2.
MeshLE11LE33 MeshLE22
Step 184240.84050.8358Step 276081.17
38,8800.88730.888321,5162.048
53,2000.86750.870550,6802.158
66,7440.87370.868656,8762.171
86,2290.87260.873671,7842.152
Table 2. Constitutive parameters of CPFEM.
ParameterUnitBasalPrismPyram
〈a〉
Pyram
〈c + a〉
μ α GPa17.3---
b α m3.21 × 10−103.21 × 10−106.12 × 10−106.12 × 10⁻¹⁰
γ ˙ 0 α [48]s−110.01251.0 × 10−3
Q [48]J6 × 10−201.92 × 10−197.8 × 10−195.46 × 10⁻²⁰
ψ [48]-0.20.20.30.2
q [48]-1.71.71.51.7
k 1 [44]m−17 × 1073 × 1081 × 1081 × 108
k H P α [44]-0.10.030.050.05
τ 0 α [44]MPa3197215230
g α [44]-4 × 10−33 × 10−34 × 10−34 × 10−3
D α [44]MPa245250285285
Disclaimer/Publisher’s Note: The statements, opinions and data contained in all publications are solely those of the individual author(s) and contributor(s) and not of MDPI and/or the editor(s). MDPI and/or the editor(s) disclaim responsibility for any injury to people or property resulting from any ideas, methods, instructions or products referred to in the content.

