Abstract
Semi-solid processes of aluminium alloys, characterised by the coexistence of solid and liquid phases, offer advantages in terms of mechanical properties and fatigue resistance, thanks to the more globular microstructure. Thermodynamic models can be used to analyse the solidification behaviour and to predict the solidification window, ΔT. The CALPHAD method enables the calculation of the phases formed during solidification and the optimisation of alloy composition to meet specific industrial requirements. This study aims to assess how thermodynamic properties in both liquid and solid phases affect the ΔT. Initially, the influence of thermodynamic properties of pure components and interaction parameters was analysed in simplified regular binary systems. To compare these findings with real industrial systems, Al-based alloys were examined. Using available databases, the ΔT was estimated via the CALPHAD method adding alloying elements commonly found in secondary Al-alloys. Finally, the same minority alloying elements were added to Al-Si 8 and 11 wt.% alloys, and the corresponding ΔT were calculated. Cr, Fe, Mg, Mn, and Ti increase the ΔT, while Cu, Ni, and Zn decrease it. The obtained results may serve as a valuable tool for interpreting phenomenological observations and understanding the role of minority elements in the semi-solid processing of secondary Al-Si casting alloys.
1. Introduction
The use of aluminium alloys to produce thin-walled components for the automotive industry has been constantly increasing in the last years, thanks to the high recyclability of these alloys and the density of aluminium, which is about one-third compared to iron. These components are traditionally prepared via high-pressure die casting (HPDC) processes; however, in recent years, foundry processes using semi-solid materials have been considered in the industry. A semi-solid state refers to a condition where the material exists as a mixture of both solid and liquid phases. This typically occurs within a specific temperature range between the solidus and liquidus temperatures of the alloy, which defines the solidification window (ΔT), or mushy zone. Semi-solid processing of aluminium alloys is a manufacturing technique that combines high production rates with quality parts, offering advantages due to the shear thinning behaviour of semi-solid slurries [1].
Semi-solid processes create a non-dendritic microstructure, characterised by near-globular primary particles surrounded by a liquid matrix, which influences properties such as tensility, fatigue, wear, and corrosion resistance. Various methods have been developed for semi-solid processing, including a technique using fine gas bubbles to create convection for modifying grain structure [2].
While primarily used for aluminium and magnesium alloys, there is a drive to expand applications to wrought compositions and higher-temperature alloys [3]. Today, the main semi-solid processes for Al-alloys are the Gas-Induced Superheated-Slurry, the Rheo-Metal, and the Swirling Enthalpy Equilibration Device, having different capabilities and application areas [4]. In semi-solid mixtures, the rheology depends on both solid fraction and particle aggregation. Barbe et al. studied a semi-solid Ag-Cu alloy, finding high viscosities, suggesting an interconnected network of solid particles [5]. They observed two aggregation regimes depending on shear rate: compact clusters and random networks. Although on a laboratory scale, with small quantities of metal, it is relatively simple to control the temperatures during the process, on an industrial scale, operating with tens or hundreds of kilograms of material for each casting, this solidification window must be as large as possible. In semi-solid processes, it is necessary to operate in the temperature range where the liquid phase and solid particles coexist (mushy zone). Several models have been developed to address the complexities of mushy zones. A simple model with an explicit solution has been proposed, which uses observed mushy zone width and structure as a basis. This model involves parameters related to the equilibrium temperature gradient and dendritic structure, which can be estimated experimentally [6].
Regular solutions are a model for mixtures that exhibit non-ideal behaviour while maintaining certain simplifying assumptions. Guggenheim introduced the concept, describing regular solutions as having equal-sized molecules with short-range interactions and no volume change upon mixing [7]. This model allows for the calculation of thermodynamic properties in both substitutional and interstitial alloys [8]. The regular solution model, initially applied to stoichiometric phases and ionic melts, has been extended to various phases and systems, leading to the development of more complex models. For example, it serves as the foundation of the sublattice model, which has become a cornerstone in computational thermodynamics. This framework, now commonly referred to as the Compound Energy Formalism (CEF), has been widely used to characterise various phases, driven by the demand for precise descriptions of thermodynamic phase stability across diverse materials containing multiple elements [9].
In a previous study [10], the effect of the presence of minority alloy elements on ΔT, in the range of compositions allowed for AlSi9Cu3(Fe) secondary commercial alloys, was investigated using the CALPHAD method [11]. AlSi9Cu3(Fe) (EN46000) has found wide application in HPDC processes. As can be seen in Table 1, AlSi9Cu3(Fe) alloys have quite a wide allowed composition range; therefore, two batches of the same alloys can have very different compositions.

Table 1.
Composition range of a commercial alloy AlSi9Cu3(Fe).
The aim of this work is to evaluate how thermodynamic properties in the liquid and solid phases influence the amplitude of ΔT. Initially, the role of the thermodynamic properties of pure components and of interaction parameters of solutions was investigated for simplified regular binary systems. In order to compare the obtained results with real systems of industrial interest, several Al-based alloys were considered. Using available databases, the solidification window was estimated using the CALPHAD method for the addition of alloying elements (Cu, Cr, Fe, Mg, Mn, Ni, Ti, Zn) usually found in secondary alloys. Finally, the same minority alloy elements were added to Al-Si8 and Al-Si11 wt.% alloys, and the corresponding solidification windows were calculated. The aim was to evaluate the application of semi-solid processes to alloys with at the extremes of the accepted range for the Si content, as reported in Table 1. The final goal was to compare the results of this study with those obtained in a previous study carried out on the AlSi9Cu3(Fe) alloys [10]. The presented results can serve as a tool to explain phenomenological observations and to identify the role of minority elements in semi-solid processes for secondary Al-alloys.
2. Materials and Methods
As a first approximation, the enthalpy of mixing can be expressed by applying the regular solution model [12], which assumes that the enthalpy of mixing (ΔHmix) is only dependent on the bond energies of adjacent atoms. This assumption is valid if the system with A and B atoms before mixing has the same volume of the system of A and B atoms after mixing, so that interatomic distances and bond energies are independent of composition. Therefore, if the weighted average of enthalpies of separated components is assumed as a reference, ΔHmix can be expressed as:
where XA and XB are the molar fraction of A and B components in the alloy and Ω is the regular interaction parameter. If Ω = 0 both in the liquid and solid phases, both solutions are ideal. If the A-B bonds are stronger than the average of A-A and B-B bonds, Ω is negative, whereas if it is the opposite, Ω is positive. A negative Ω value stabilises the mixture, favouring the miscibility of A and B, while a positive Ω value leads to the formation of miscibility gaps. When a miscibility gap is present in the solid phase, it can result in a eutectic transformation from the liquid phase.
ΔHmix = Ω·XA·XB
In the frame of the regular solution model, the total free energy (G) of a binary phase (liquid or solid) for a specific temperature (T) and composition can be calculated as:
where GA and GB are, respectively, the free energy of A and B components, and ΔSid is the entropy of mixing for an ideal solution. It turns out that G depends only on the thermodynamic properties of pure components and on the value of Ω. To calculate the phase diagram, the free energy of both solid and liquid phases, each with a different interaction parameter, must be evaluated as a function of composition and temperature.
G = XA·GA + XB·GB + Ω·XA·XB − TΔSid
In the following, the Gibbs free energy of the binary solid and liquid solutions has been calculated according to the regular solution model, assuming that A and B components have the same crystal structure in the solid state. Two arbitrary components, A and B, have been defined, with a melting temperature of 800 K and 1200 K, respectively. As a starting point, an enthalpy of fusion ΔSfus = 10.0 J/mol*K has been fixed for both components. This value is close to that shown by numerous elements [13,14] (e.g., Al 11.5 J/mol*K) and is in agreement with Richard’s rule [15]. As a consequence, the enthalpy of fusion, ΔHfus, for A and B, was equal to 8.0 kJ/mol and 12.0 k J/mol, respectively. The interaction parameters between the two components in the liquid (Ωliq) and in the solid (Ωsol) phases have been changed to quantify the corresponding variation of ΔT for various compositions of the alloy, with XB up to 0.125. The selected XB values were in the range of concentrations of minority and trace elements in secondary alloys. In order to establish the role of ΔSfus of the pure components, other values have been considered (ΔSfus = 8.0 and 12.0 J/mol*K), maintaining the same melting temperatures, and ΔHfus has been changed accordingly.
Phase diagrams were calculated both with the Pandat 2024 software and Thermo-calc 2022b software. At the beginning, ideal solutions (Ωliq = Ωsol = 0) were considered, then the interaction parameters between the two components were modified both in the liquid (Ωliq from −10 to 10 kJ/mol) and in the solid (Ωsol from −25 to 50 kJ/mol) phases, calculating the corresponding variation in ΔT for a fixed composition. Moreover, using the TCAL8 database (Al-Alloys v8.1) with Thermo-calc 2022b software, binary Al-based phase diagrams with Cu, Fe, Mn, Mg, Zn, Cr, Ni, and Ti were calculated, and solidification windows were determined for various compositions. Elements were selected considering minority constituents in recycled Al-alloys [10]. Finally, using the same approach, Al-Si-based pseudo-binary phase diagrams, containing minority constituents in the alloy, were calculated, keeping the silicon value fixed to 8 and 11 wt.% and the Al as a complement.
3. Results and Discussion
3.1. Regular Solutions
First, the solidification window ΔT was calculated, varying Ωsol from −25 to 50 kJ/mol and keeping the liquid phase as ideal, i.e., Ωliq = 0 kJ/mol. Afterward, the calculations were extended to evaluate the results for Ωliq −10 and 10 kJ/mol. The phase diagrams of the arbitrary A-B system for Ωsol −15, 0, and 15 kJ/mol are shown in Figure 1, considering Ωliq values equal to −10, 0, and 10 kJ/mol. It can be clearly observed that the shape of phase diagrams changes with the nine combinations of Ωsol and Ωliq. The vertical blue lines indicate the composition (XB = 0.05) considered for the calculation of the difference between the liquidus and the solidus curves. It is worth noting, especially in Figure 1a,c, that ΔT is increasing when the Ω values for the liquid and solid phases are different from each other.
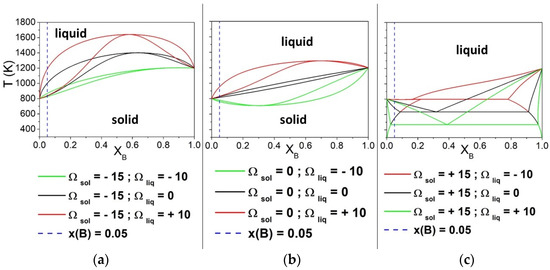
Figure 1.
Phase diagrams of binary A-B solutions obtained by varying the interaction parameters Ωsol and Ωliq (kJ/mol). The vertical line indicates the compositions (XB = 0.05) considered for the calculation of ΔT. Both pure components have ΔSfus = 10 J/mol*K. The interaction parameter of the liquid phase was equal to −10, 0 and + 10 kJ/mol, while that of the solid phase was maintained constant equal to −15 kJ/mol (a), 0 kJ/mol (b) and +15 kJ/mol (c).
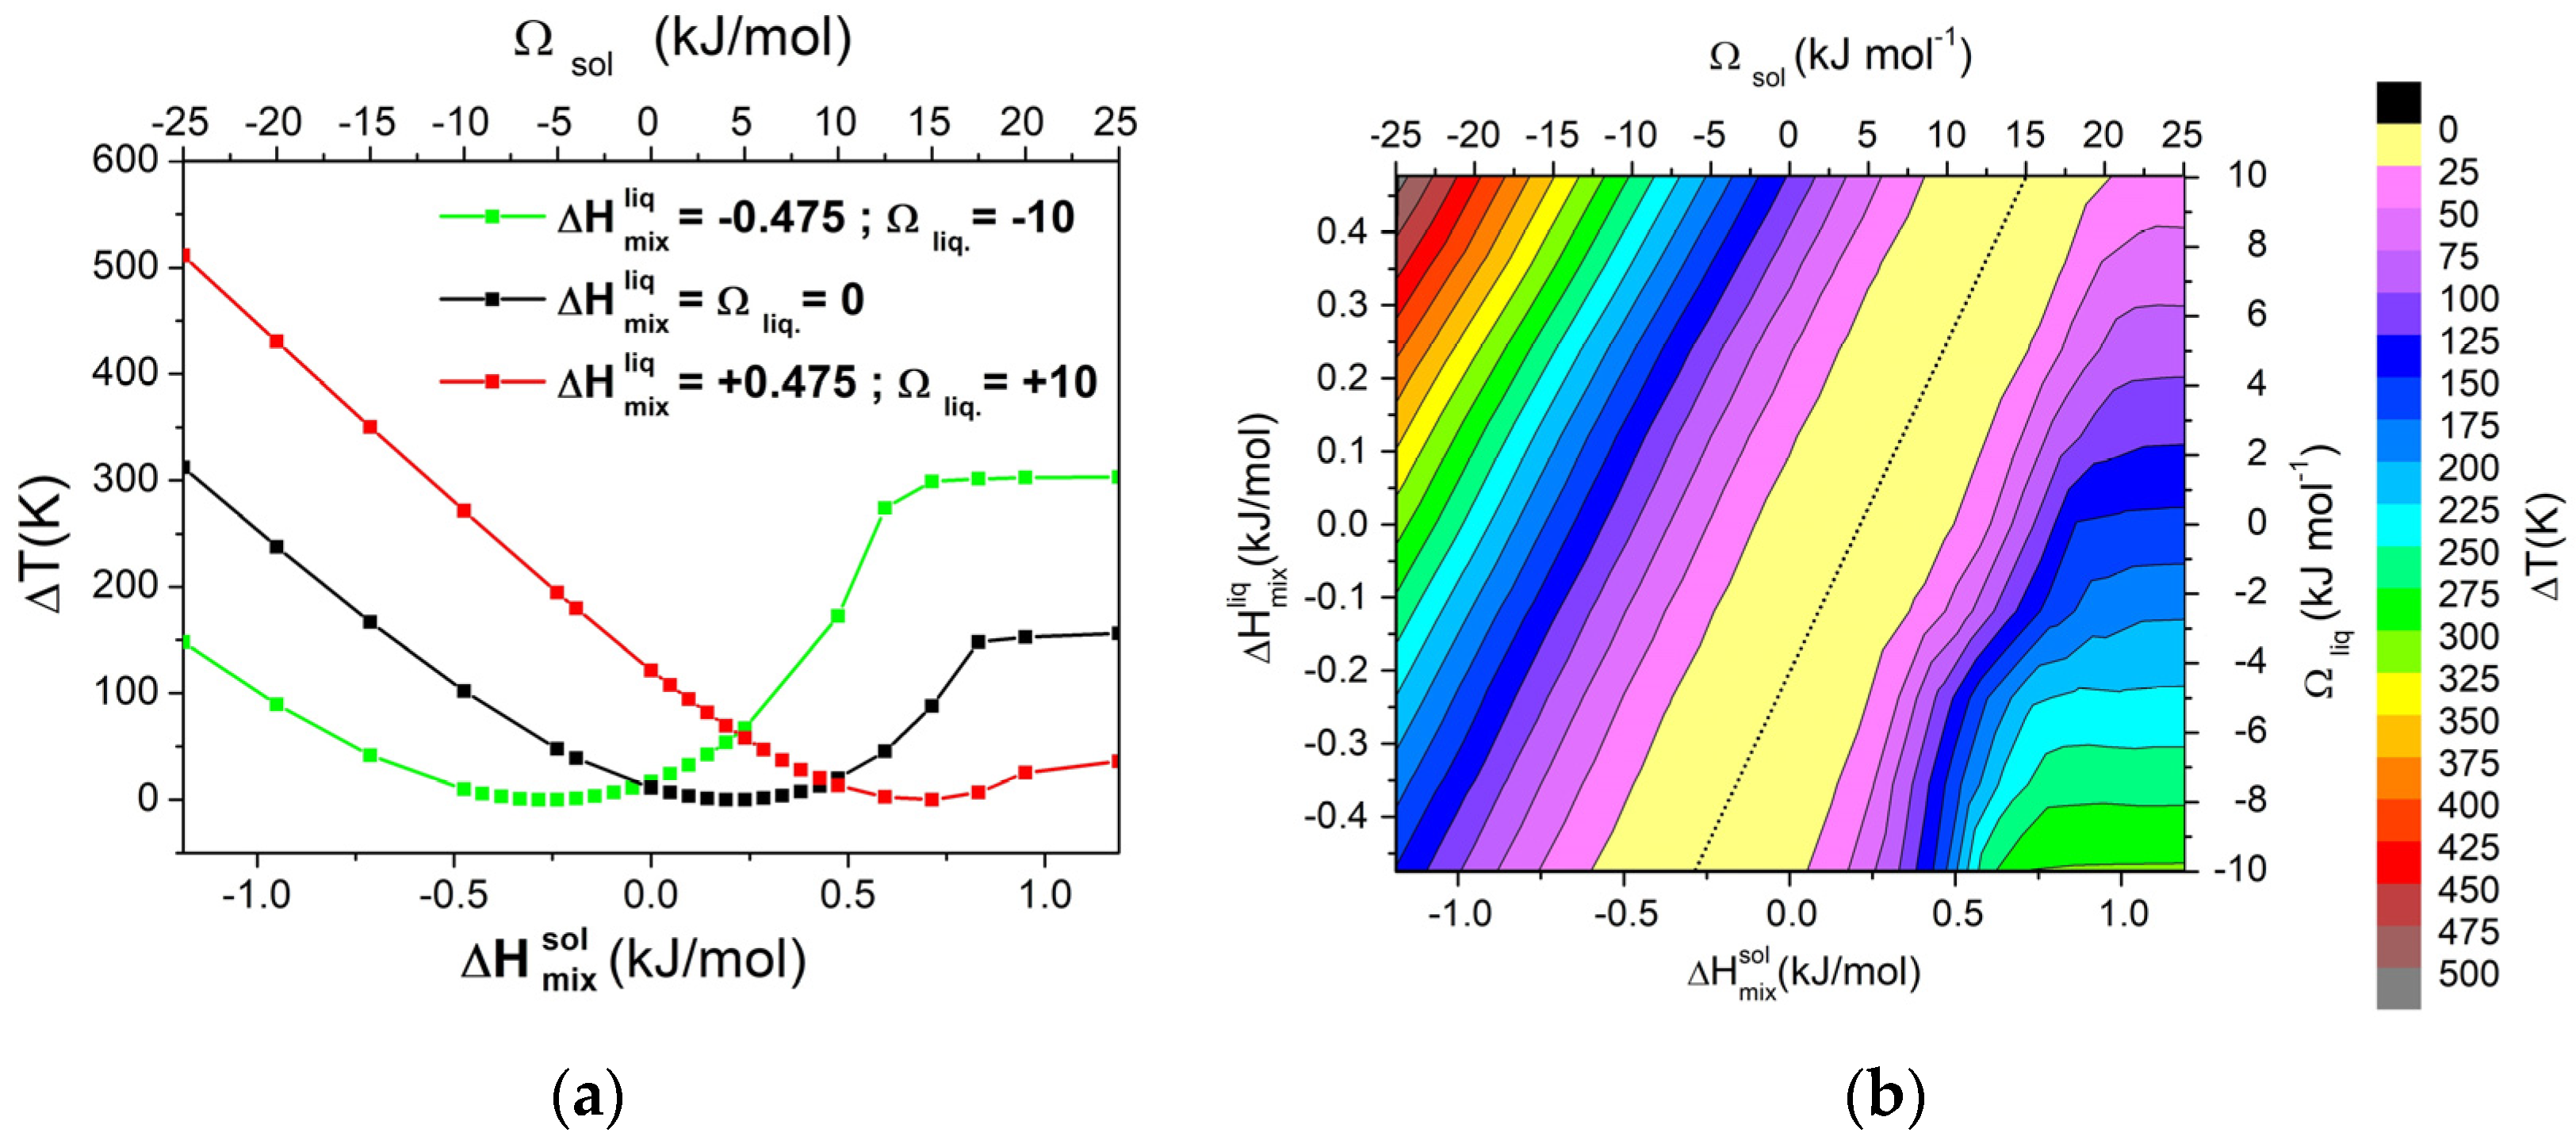
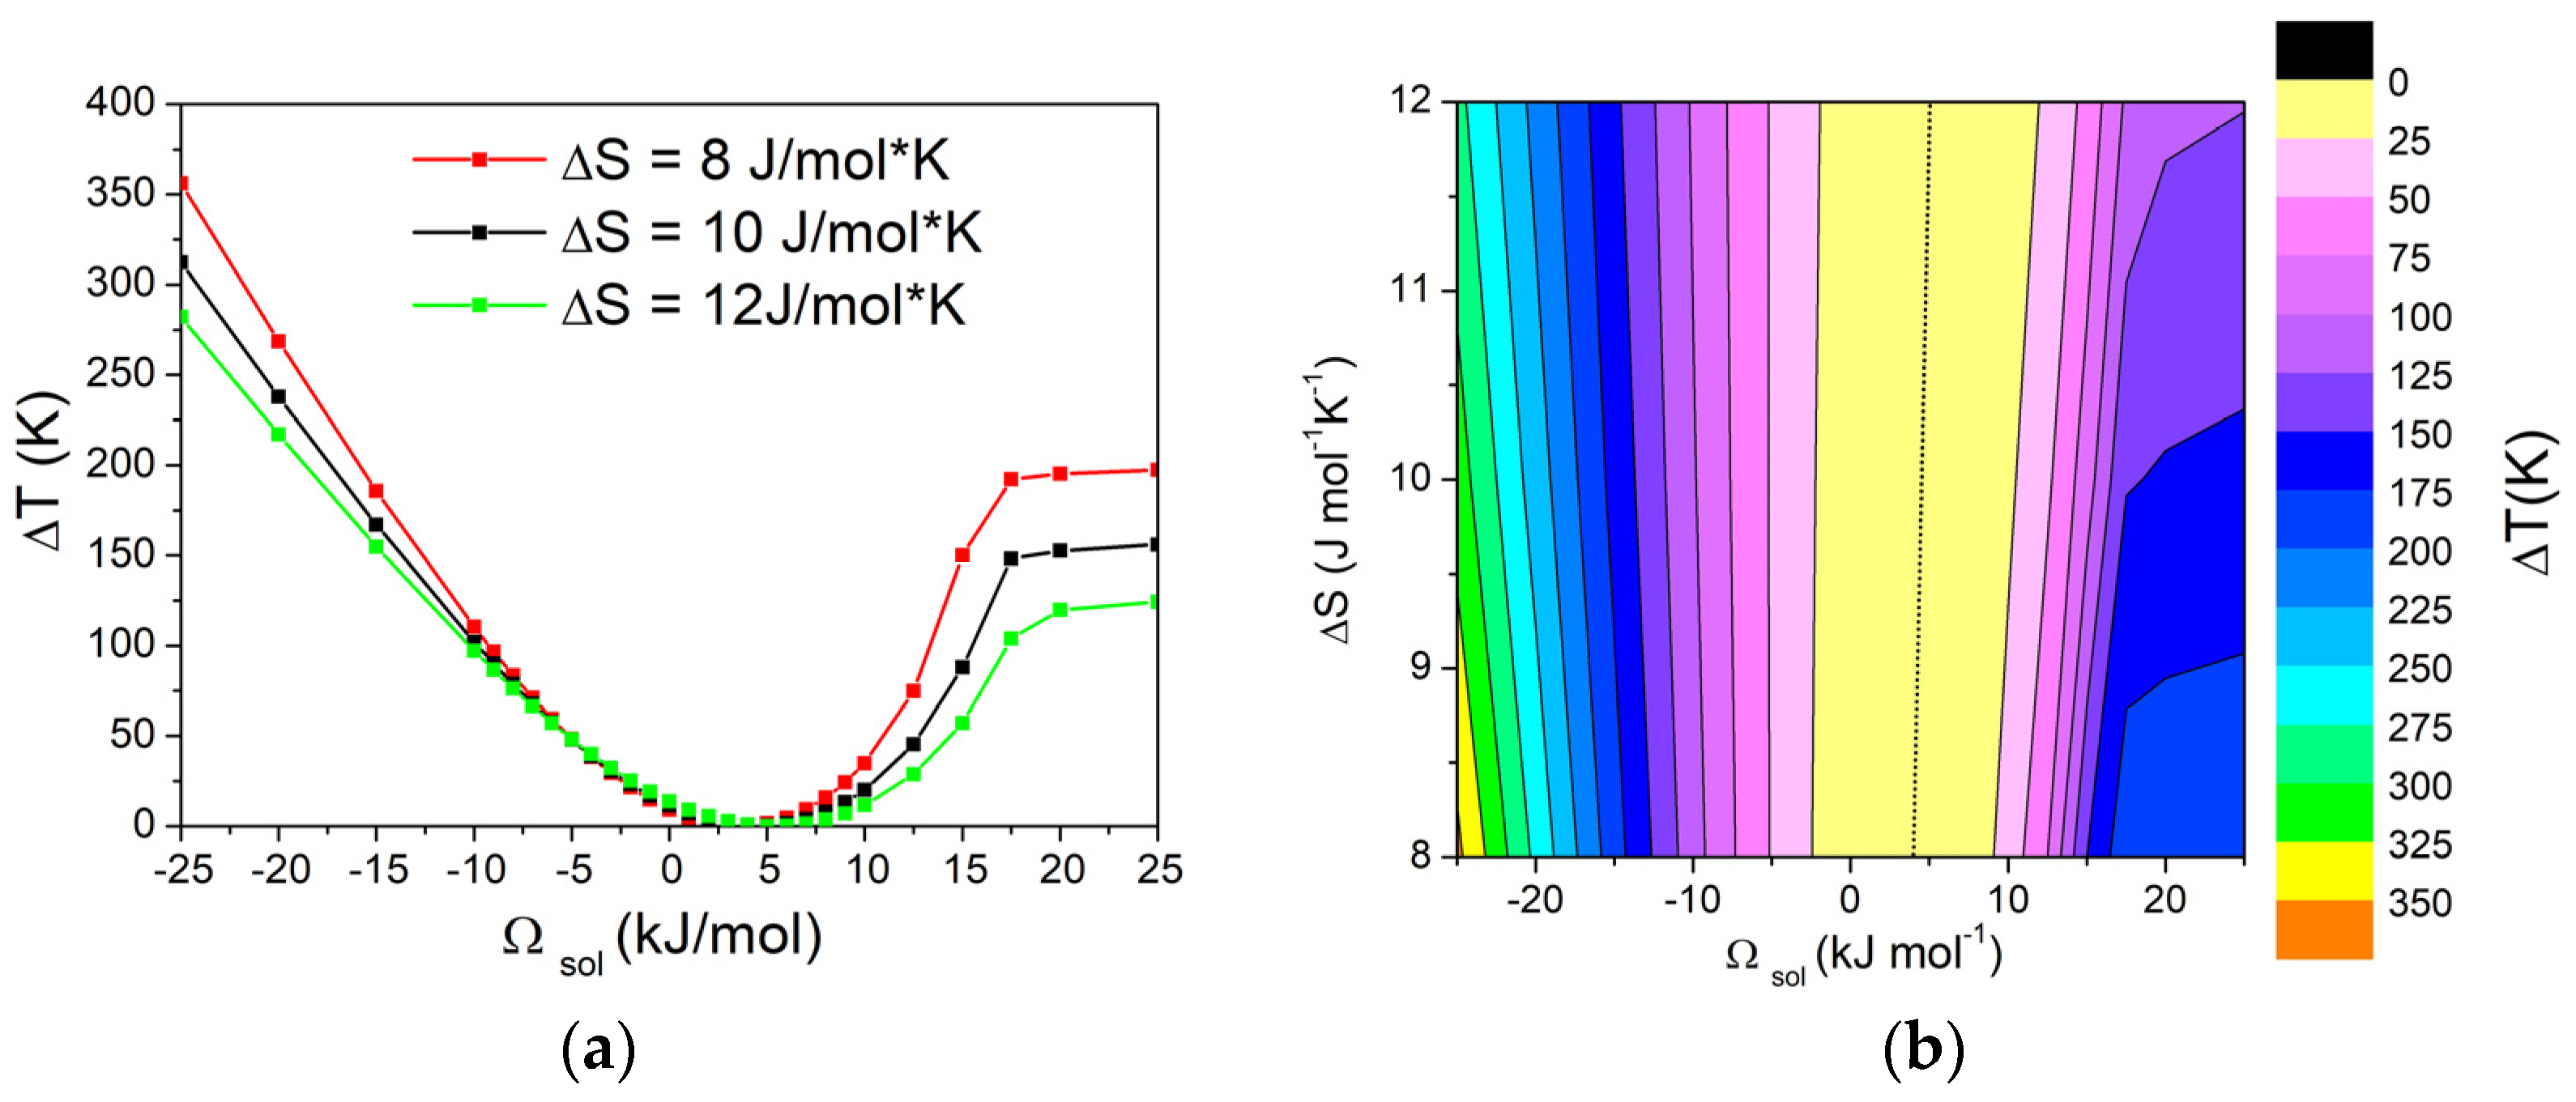
Previous results were extended to systematically evaluate the variation of ΔT with respect to the interaction between the A and B components. By considering different values for the interaction parameters, ΔHmix at XB = 0.05 was calculated for both the solid and liquid phases. As an example, considering three different values of ΔHmix for the liquid phase, the dependence of ΔT as a function of ΔHmix for the solid phase is reported in Figure 2a. In the same figure, the corresponding values of Ωsol are reported in the top axis. In all cases, ΔT reaches a minimum in correspondence of a specific value of ΔHmix for the solid phase, which depends on ΔHmix for the liquid phase. In order to identify possible trends, a matrix that covered the entire range Ωliq from −10 to 10 kJ/mol and Ωsol from −25 to 50 kJ/mol has been constructed. The graphical representation as contour lines of the dependence of the ΔT on both values of Ωsol and Ωliq is reported in Figure 2b. From the obtained graph, it can be observed that increasing ΔT requires moving away from the diagonal, i.e., to differentiate the interaction parameter between liquid and solid phases. For high positive values of Ωsol, the system forms a eutectic. In these cases, ΔT becomes quite independent from the Ωsol and it depends only on Ωliq, i.e., the behaviour of the alloy in the liquid state.
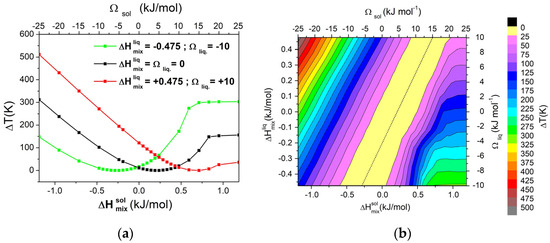
Figure 2.
(a) Dependence of ΔT from ΔHmix for the solid phase (or Ωsol) in a binary regular A-B system, calculated with XB = 0.05, for three different values of ΔHmix for the liquid phase (or Ωliq); (b) Contour lines of ΔT. Both pure components have ΔSfus = 10 J/mol*K. The dashed line indicates a zero value of ΔT.
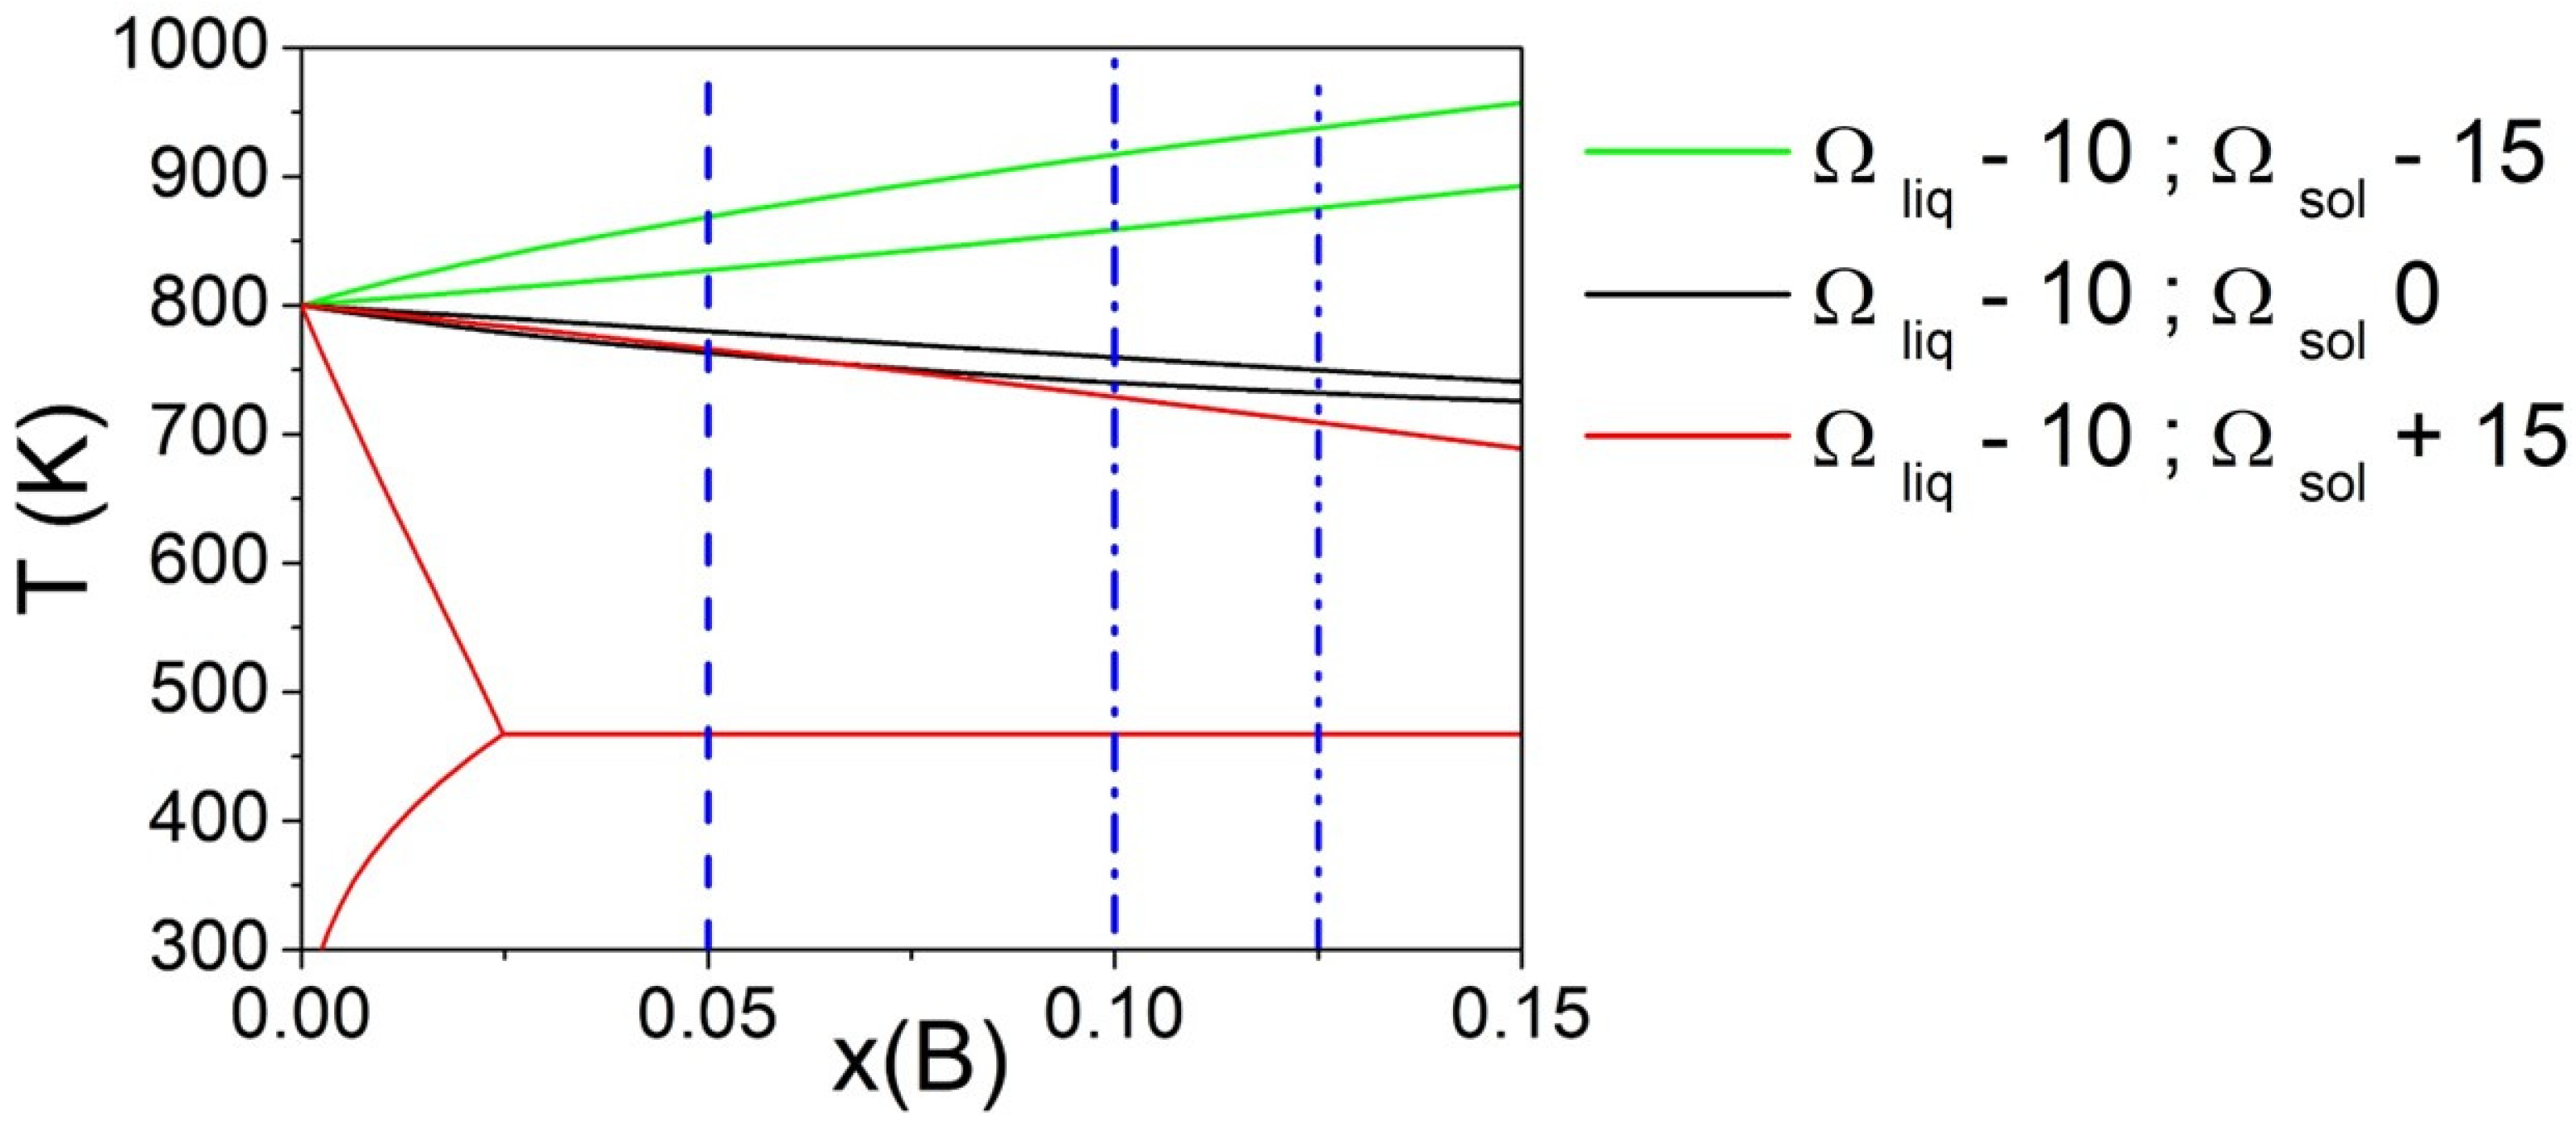
Phase diagrams calculated fixing Ωliq = −10 kJ/mol and considering Ωsol values equal to −15, 0 and 15 kJ/mol are reported in Figure 3. The vertical lines indicate three different compositions of the alloy (XB = 0.05, 0.10, and 0.125) considered for the calculation of ΔT. It can be seen that for Ωsol values equal to −15 and 0 kJ/mol, the variation of ΔT for selected compositions is almost negligible, while for Ωsol = 15 kJ/mol, it becomes significant due to the presence of a eutectic transformation.
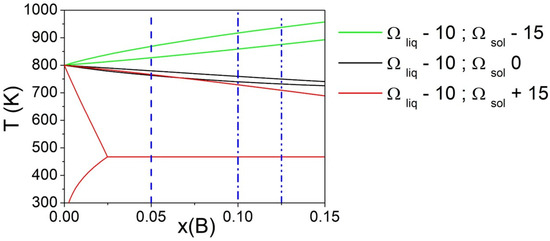
Figure 3.
Phase diagrams of a binary A-B system with fixed Ωliq and varying Ωsol (kJ/mol). The vertical line indicates three different compositions (XB = 0.05, 0.10, and 0.125) considered for the calculation of ΔT. Both pure components have ΔSfus = 10 J/mol*K.
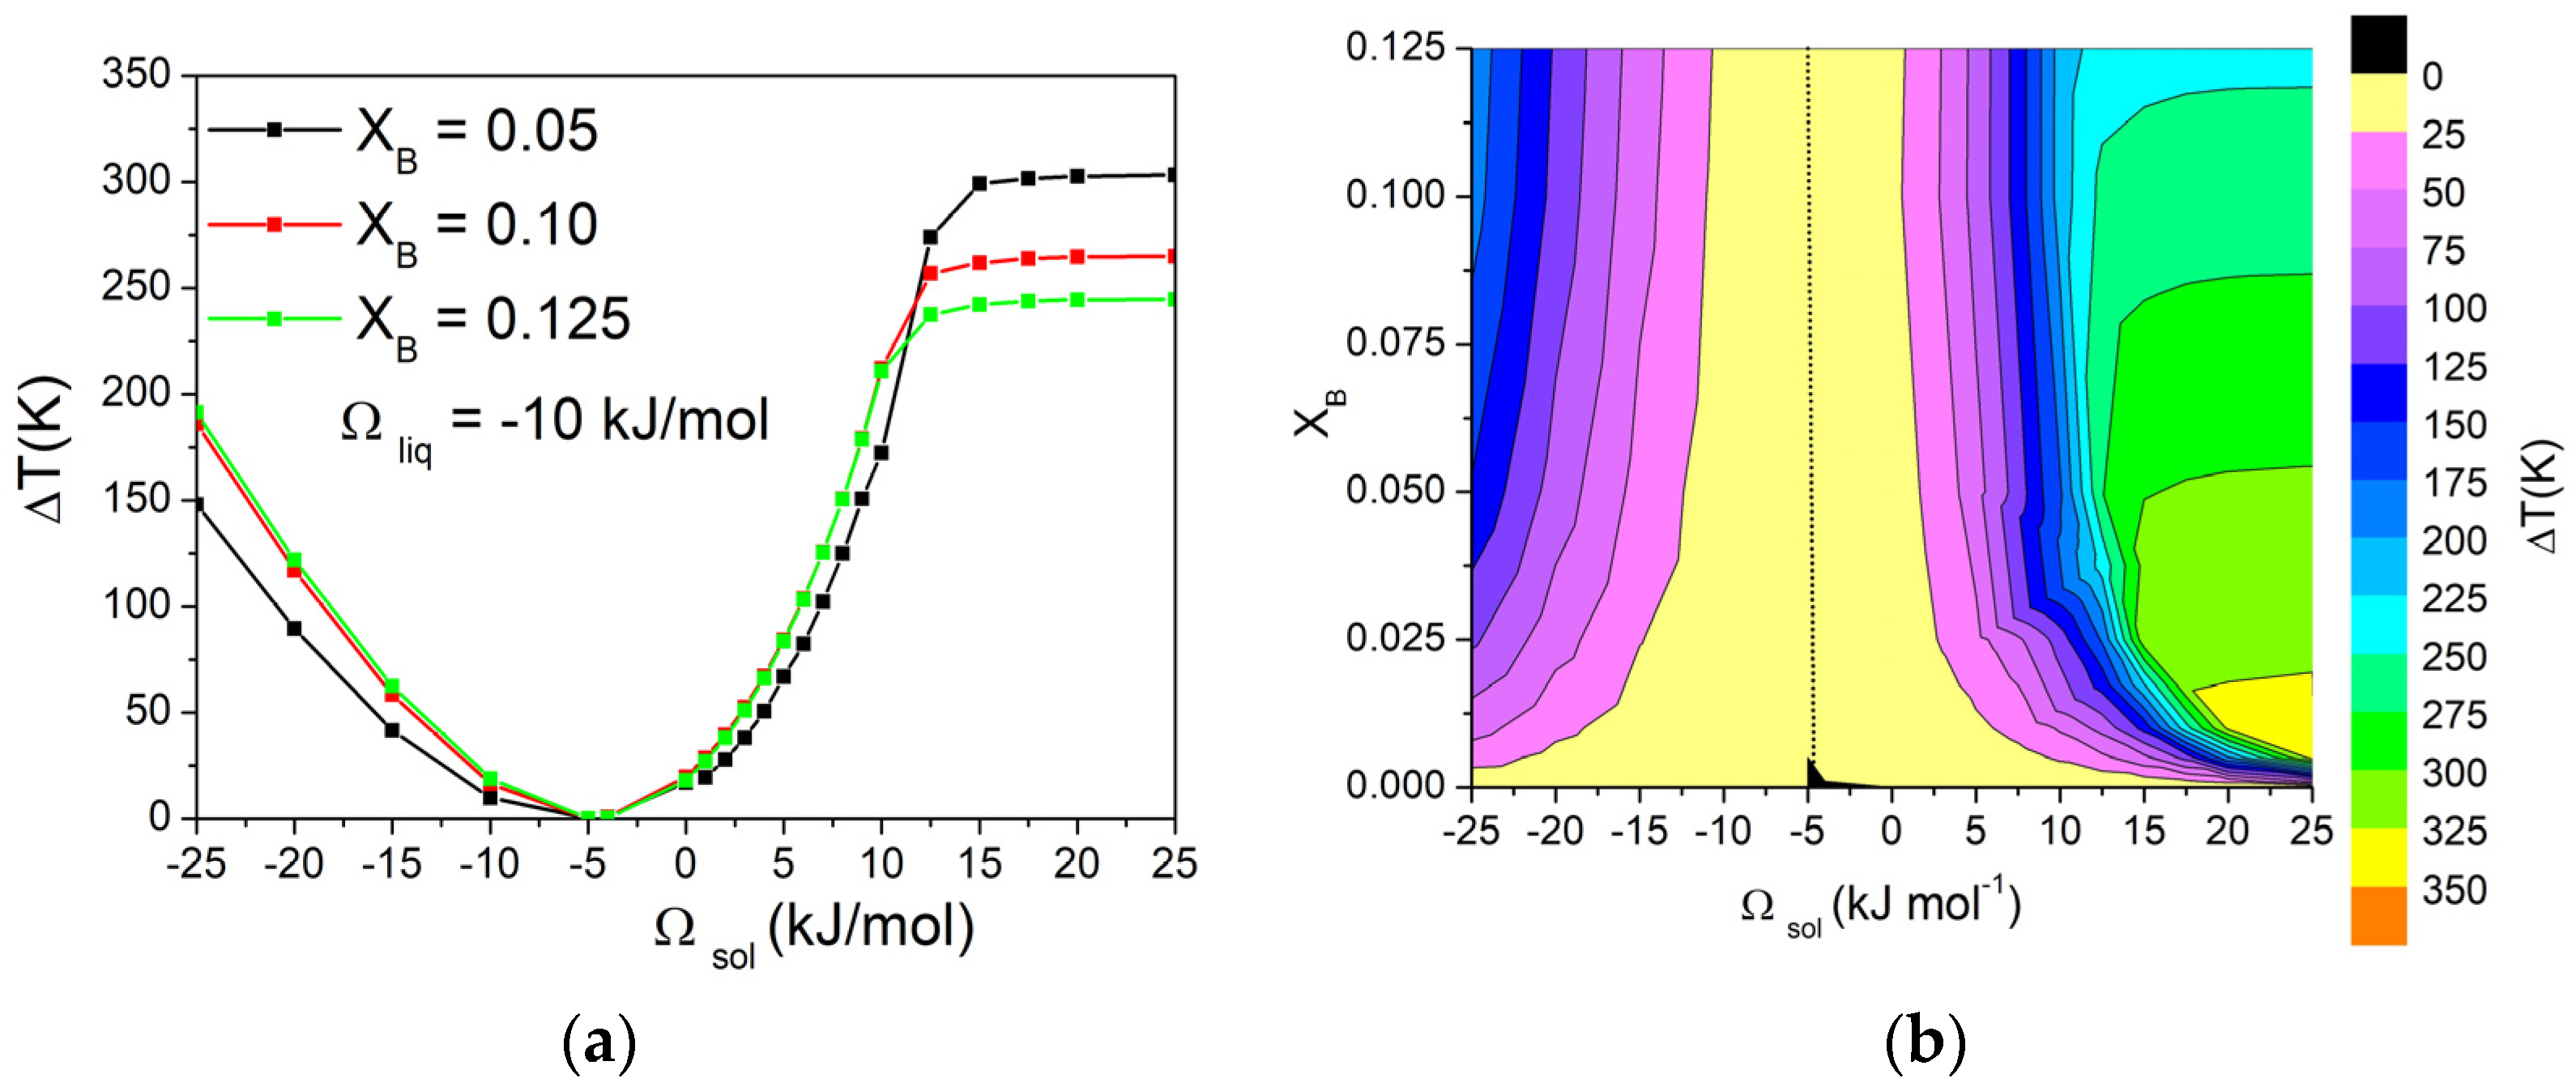
Then, the effect of modifying the composition of the alloy on the ΔT was investigated by keeping the value of Ωliq at −10 kJ/mol and building a matrix of Ωsol and XB values (−25 kJ/mol < Ωsol < +25 kJ/mol, 0 < XB < 0.125). The values of ΔT on this matrix were then represented using contour curves to better evaluate the presence of trends. The dependence of ΔT on Ωsol for three different values of XB is reported in Figure 4a, and the corresponding graphical representation as contour lines of ΔT values as a function of Ωsol and XB is shown in Figure 4b.

Figure 4.
(a) Dependence of ΔT on Ωsol in a binary A-B system calculated with Ωliq = −10 kJ/mol for three different values of XB. (b) Contour lines of ΔT, with dotted line corresponding to ΔT = 0 K. Both pure components have ΔSfus = 10 J/mol*K.
From these graphs, it can be observed that, for values of Ωsol from −25 to 10 kJ/mol, the contour lines are almost vertical, indicating no variations in ΔT when changing the composition of the alloy. For higher values of Ωsol, the system forms a eutectic, and ΔT becomes quite independent from the Ωsol, while the dependence from the composition becomes significant. In fact, as already shown in Figure 3, ΔT depends on the shape of the phase diagram. When both liquidus and solidus lines are considered as a function of composition, the biphasic liquid–solid area remains almost constant. On the other hand, when a eutectic reaction is present, the eutectic temperature is constant, while the liquidus temperature decreases as a function of composition. Consequently, the biphasic liquid–solid area shrinks as the composition approaches the eutectic point. Conversely, on the right side of the eutectic composition, the opposite trend would be observed.
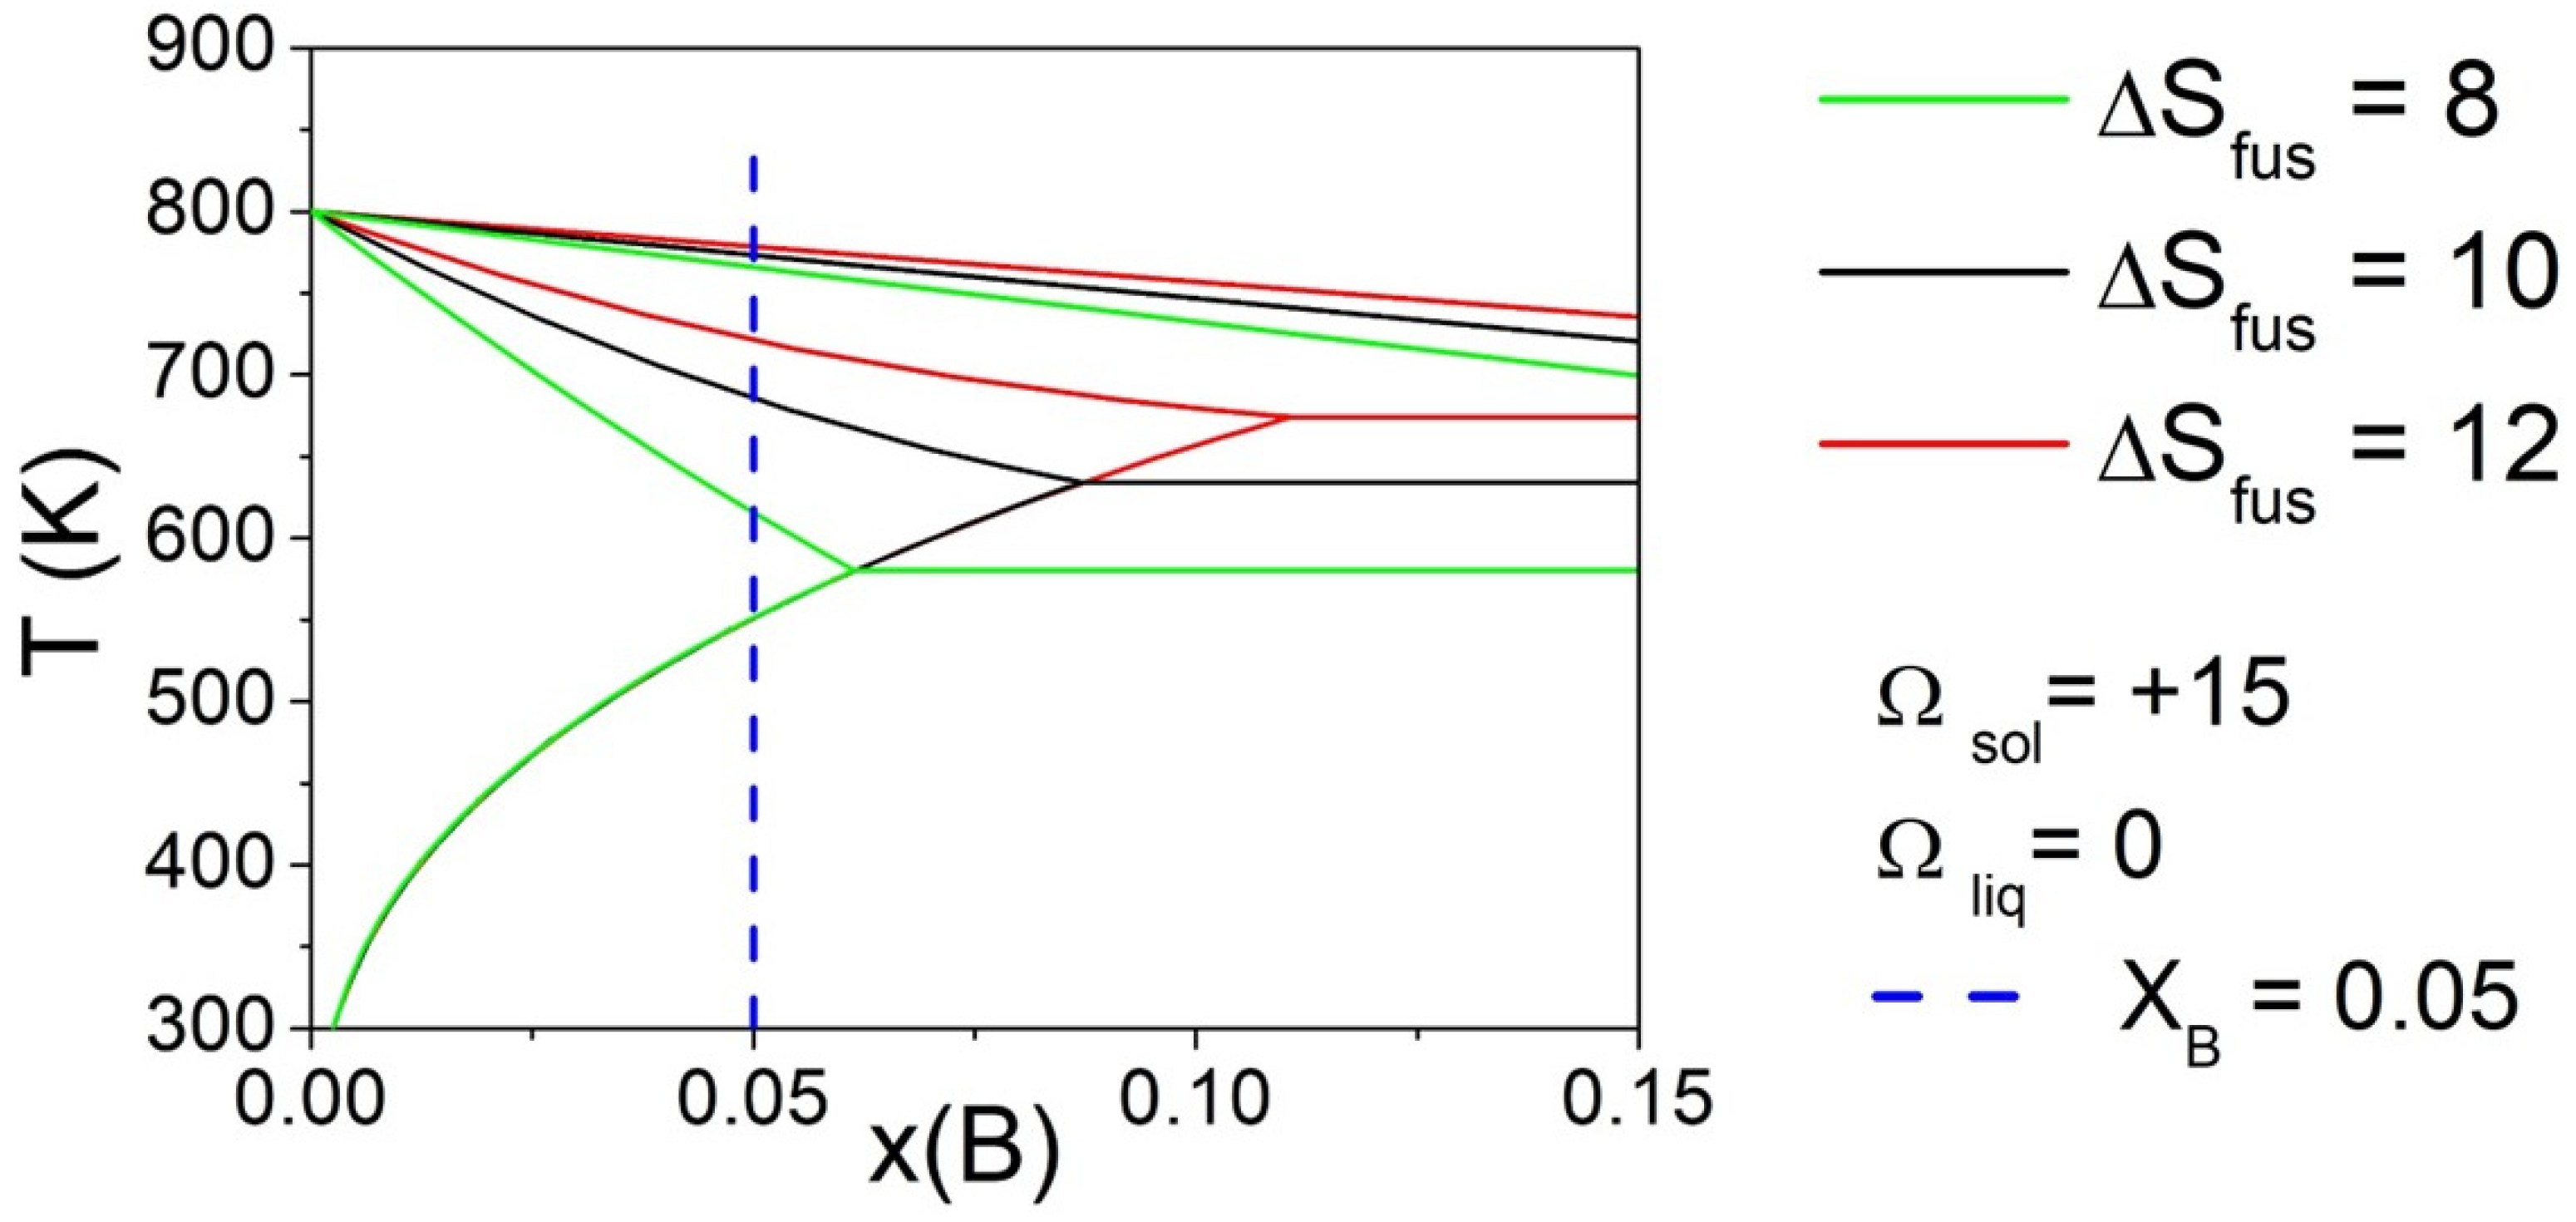
Finally, the effect of the ΔSfus of pure components was evaluated by fixing three different values (i.e., 8, 10, and 12 J/mol*K), maintaining the same value of Ωsol and Ωliq, for both elements. Phase diagrams calculated fixing Ωliq = 0 kJ/mol and Ωsol = 15 kJ/mol are reported in Figure 5 for selected values of ΔSfus of pure components. The vertical line indicates the composition of the alloy (XB = 0.05) considered for the calculation of ΔT. It can be observed that, varying the ΔSfus of pure components, a significant variation in ΔT was obtained. In particular, the liquidus temperature remained nearly constant, but the eutectic temperature decreased significantly reducing the ΔSfus value of pure components, bringing the solidus temperature to lower values, and then increasing the value of ΔT.
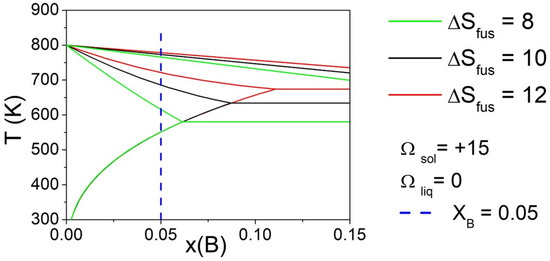
Figure 5.
Phase diagrams of a binary A-B system calculated with fixed Ωliq = 0 kJ/mol and Ωsol = 15 kJ/mol, varying ΔSfus of pure components. The vertical line indicates the compositions (XB = 0.05) considered for the calculation of ΔT.
The obtained results were used to construct a matrix of values, showing the dependence of ΔT on both ΔSfus of pure components and Ωsol, while keeping Ωliq fixed. The variation in ΔT with Ωsol in the range from –15 kJ/mol to 15 kJ/mol, with Ωliq fixed at 0 kJ/mol and different values of ΔSfus, is reported in Figure 6a. Additionally, the graphical representation using contour lines of the dependence of the ΔT on Ωsol and ΔSfus of pure components is shown in Figure 6b. Based on the obtained results, it can be seen that, with values of Ωsol from –25 kJ/mol to 10 kJ/mol, the contour lines are almost vertical, suggesting that ΔT is independent of the entropy of fusion (ΔSfus) of pure components. On the contrary, for higher values of Ωsol, the system forms a eutectic and, in these cases, ΔT becomes largely independent of Ωsol, while the influence of ΔSfus of pure components becomes significant, as already shown in Figure 5. In particular, higher values of ΔT can be obtained with lower values of ΔSfus of pure components.

Figure 6.
(a) Dependence of ΔT from Ωsol in a binary A-B system calculated with Ωliq = −10 kJ/mol for three different values (8, 10, and 12 J/ mol*K) of ΔSfus of pure components. (b) Contour lines of ΔT, with dotted line corresponding to ΔT = 0 K. Values have been calculated for XB = 0.05.
3.2. Al Binary Systems
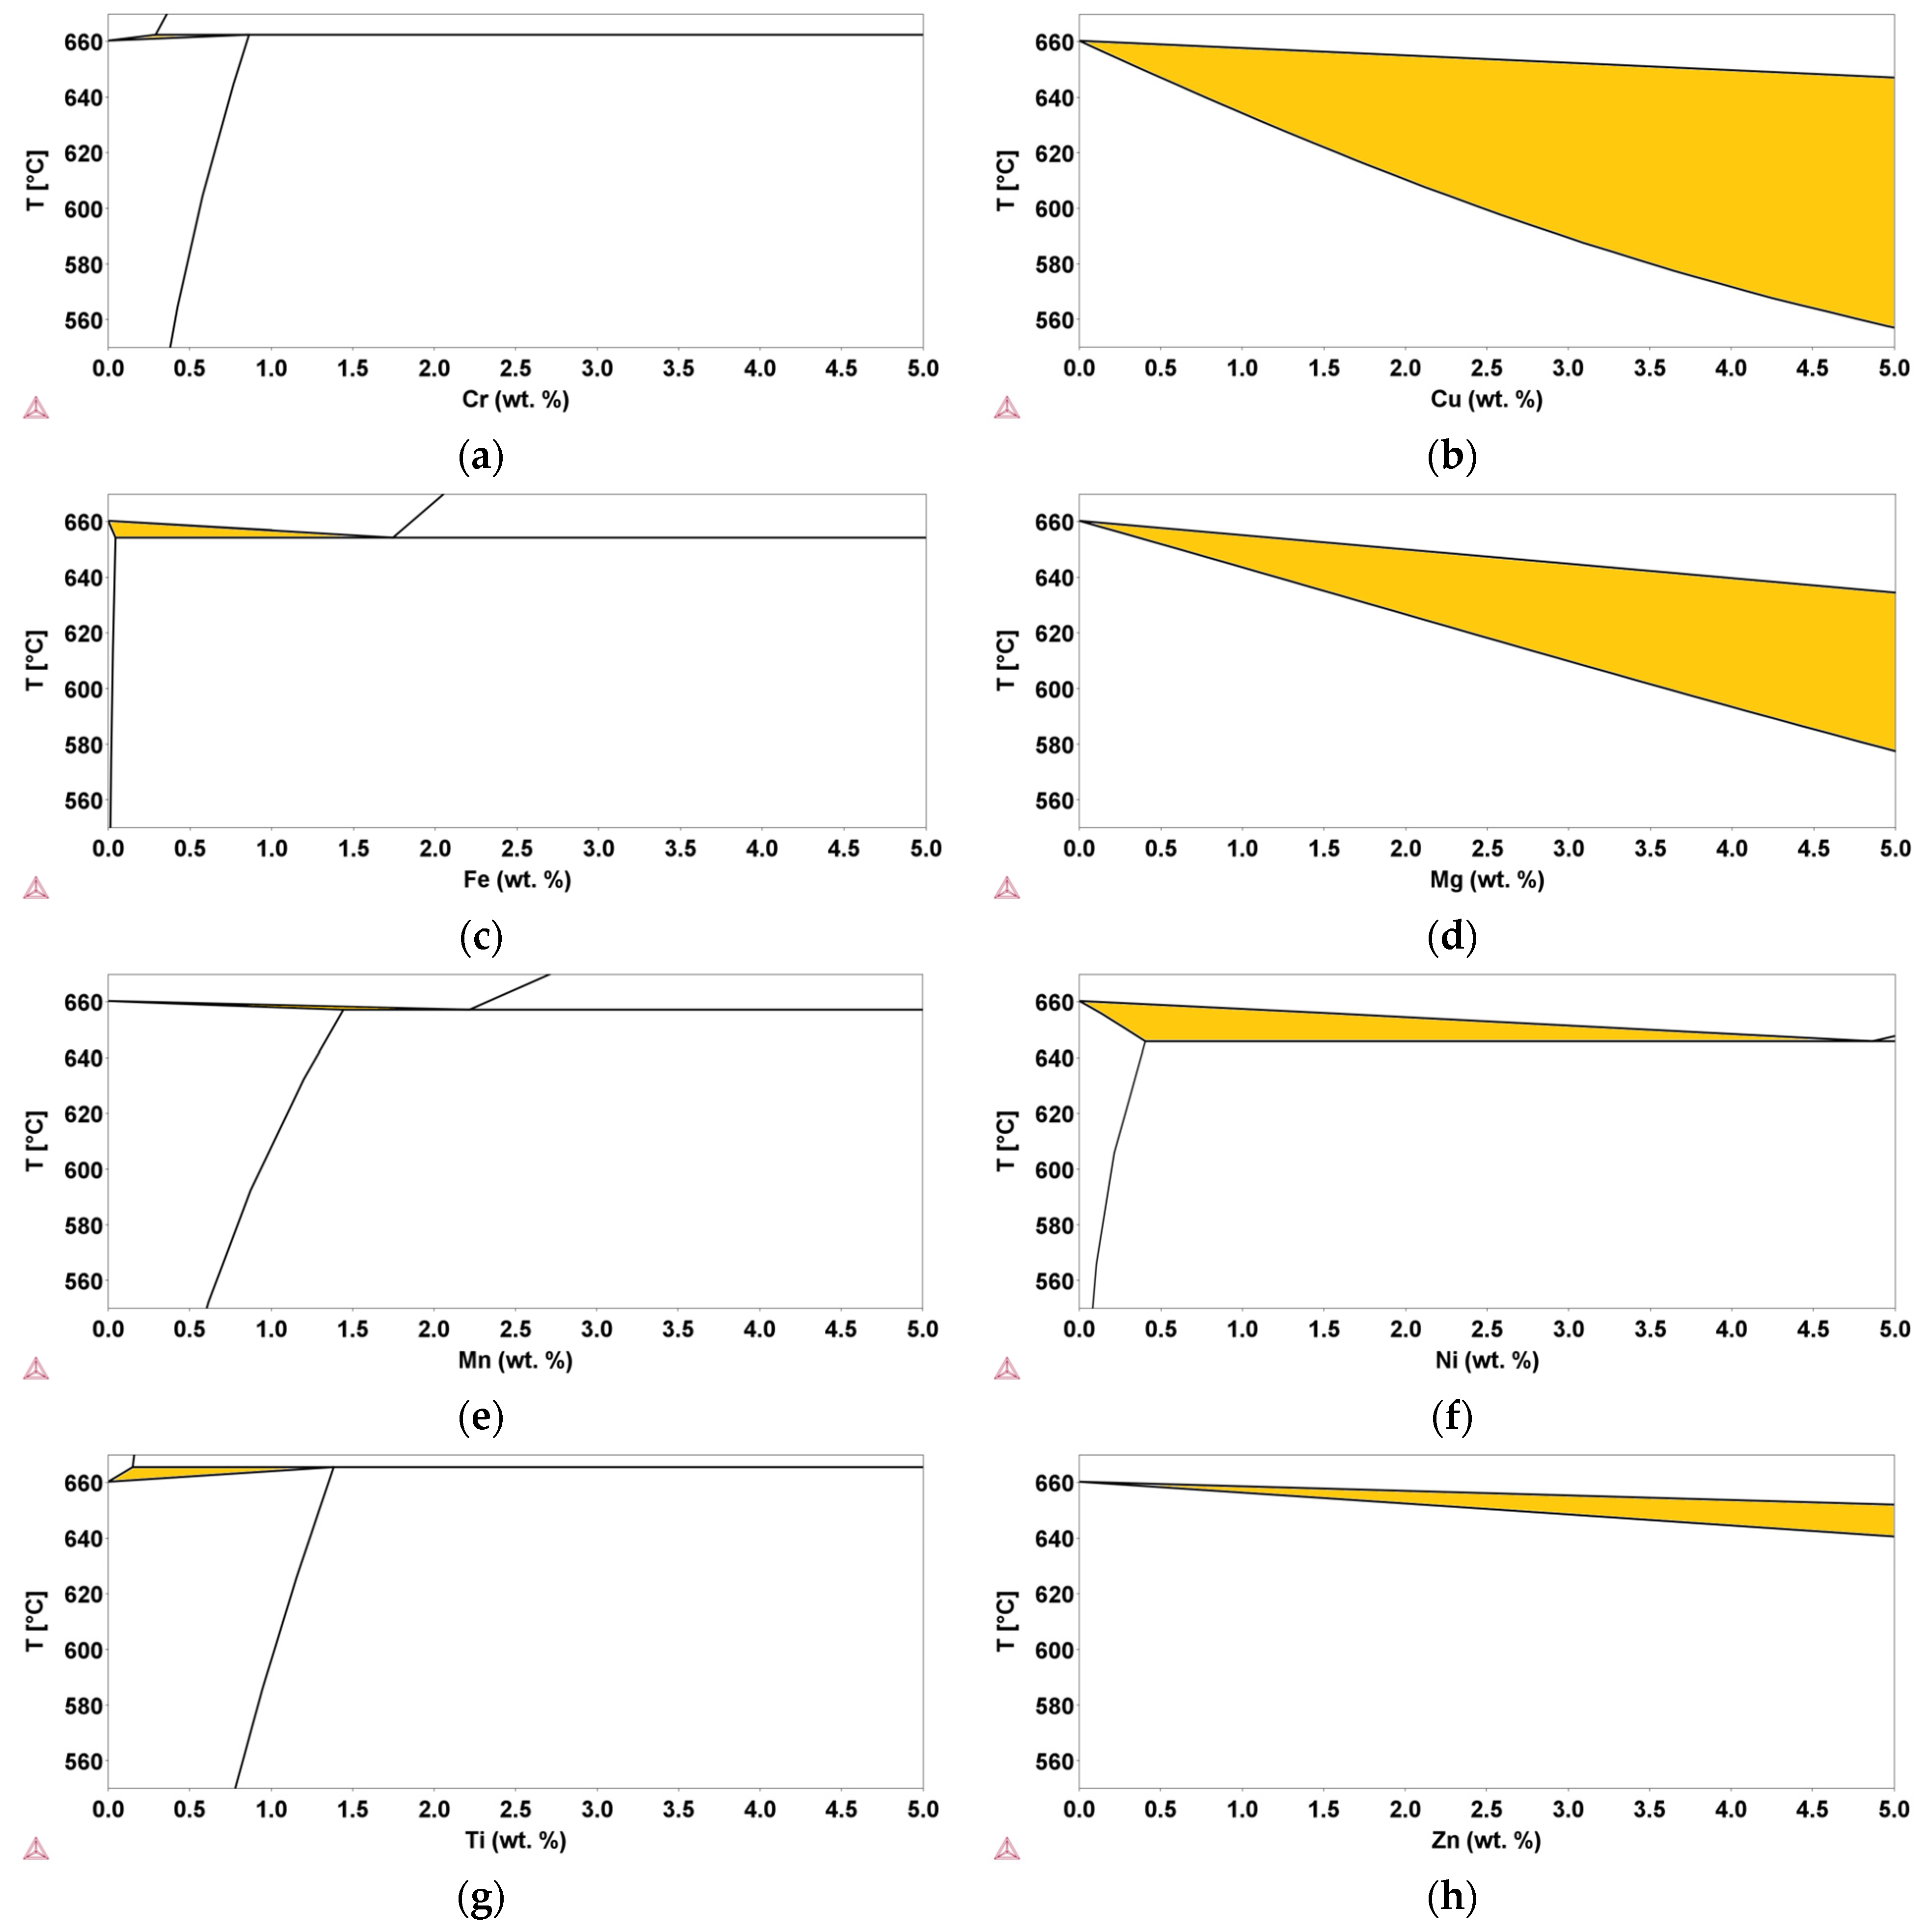
In order to identify the role of possible contaminants in recycled Al-Si alloys, the results of this study were compared with CALPHAD thermodynamic calculations based on available databases. Calculations were carried out in the range of concentrations for contaminants allowed for commercial EN AC-46000 secondary Al-alloys. Using the CALPHAD method, binary Al-E phase diagrams, where E indicates the element considered (i.e., E = Cu, Cr, Fe, Mg, Mn, Ni, Ti, Zn), were investigated. The results of the calculated phase diagrams in the Al-rich side are shown in Figure 7, and the corresponding values of ΔT are reported in Table 2.
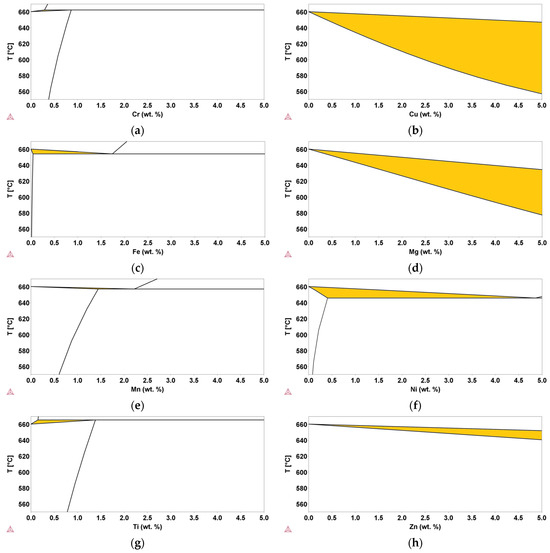
Figure 7.
Binary Al-E phase diagrams in the Al-rich side. (a,b,c,d,e,f,g,h) are for Cr, Cu, Fe, Mg, Mn, Ni, Ti, Zn, and Al, respectively. The highlighted area represents the semi-solid range.
Table 2.
ΔT values (in K) calculated for Al-E binary phase diagrams, with various elements as E, considering x = 0.2, 0.5, 1.0, and 5.0 wt.%.
The highlighted areas in Figure 7 are those in which the liquid and the fcc solid solution coexist. It is evident that both thermodynamic properties and content of the added E element have a significant effect on the ΔT values. In some cases, ΔT clearly increases with the addition of the elements (i.e., E = Cu, Mg, Mn, and Zn), whereas in other cases (i.e., E = Fe, Ti, and Cr), it progressively decreases. In some cases, the ΔT value cannot be determined over the entire range of interest because of the coexistence window between the liquid phase and α-(Al,E) fcc solid solution closes at lower concentrations (i.e., E = Cr, Fe, Mn, Ni, and Ti), or the trend is not unique and depends on the concentration value (i.e., E = Ni).
In order to identify the potential influence of mixing properties on ΔT values, the ΔHmix value was calculated at various compositions for both the liquid and the fcc solid solution. A fixed temperature of 855 K was selected in order to consider a temperature range of interest for semi-solid processes. The results for compositions equal to 0.2 and 0.5 wt.% are summarised in Table 2. As expected, the ΔHmix values increased with the content of the E added element, but the trend was different with respect to the regular solutions previously considered. As an example, the addition of Ti to Al leads to a negative value of ΔHmix for the fcc solid solution at 0.2 wt.%, which becomes positive for further additions (not shown in Table 3), suggesting the occurrence of an immiscibility gap.
Table 3.
ΔHmix values (in kJ/mol) calculated for the fcc solid solution and liquid phases for Al-E binary systems with various elements as E, considering compositions of 0.2 and 0.5 wt.%.
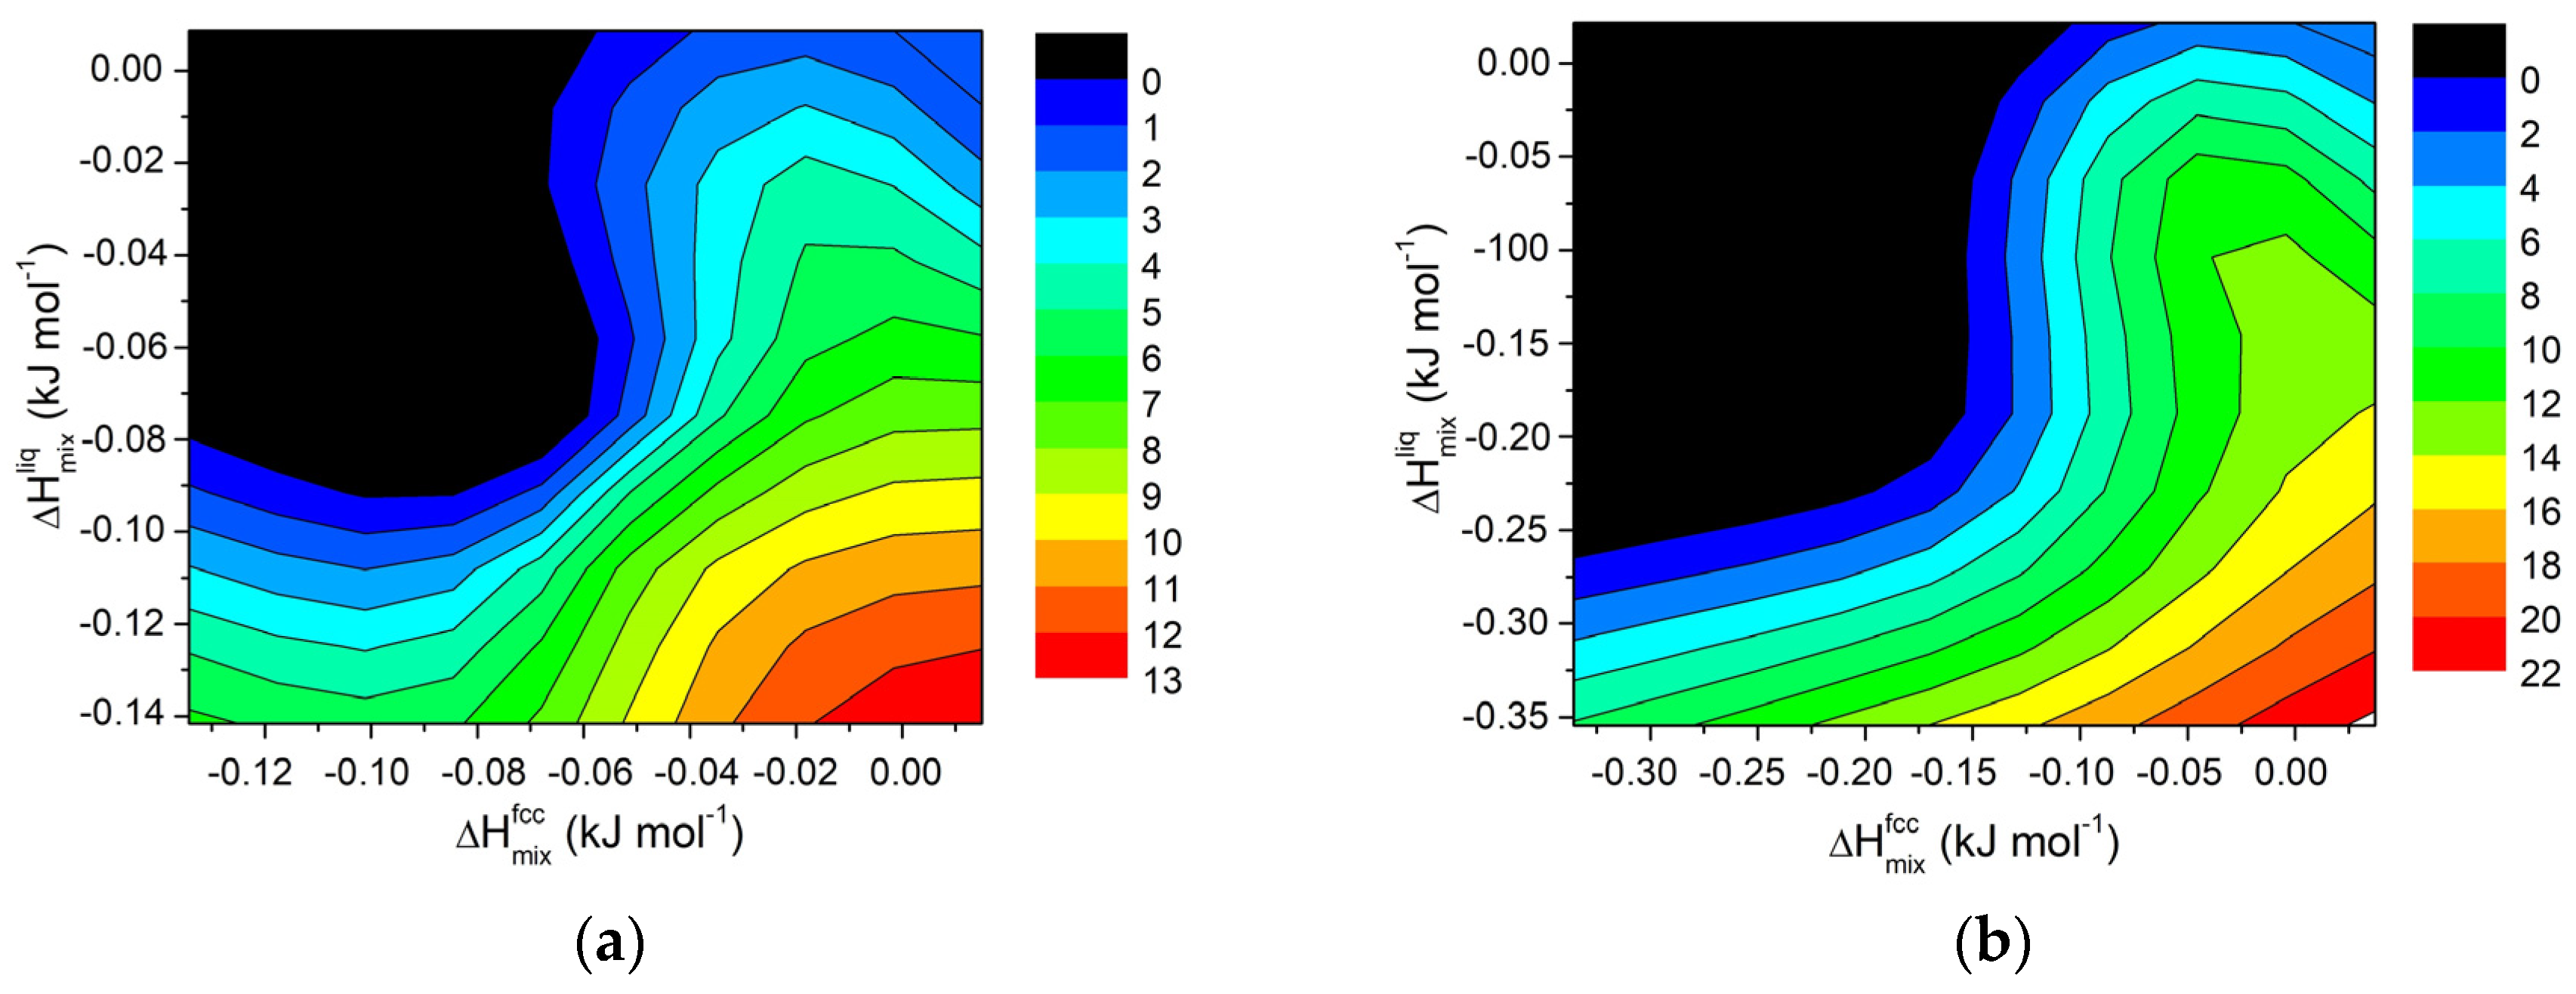
Starting from the calculated values of ΔHmix and ΔT for various systems, contour maps were generated for selected compositions, and the results are shown in Figure 8. Although the trend is less distinct than in regular solutions, the findings confirm that in order to extend the semi-solid range in Al-based alloys, a divergence between the mixing properties of the fcc solid solution and liquid phases is necessary.
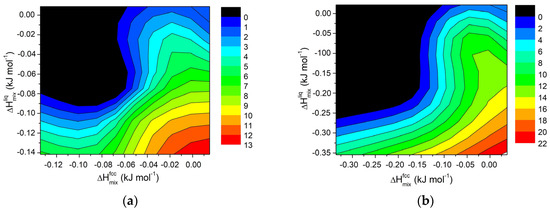
Figure 8.
Contour lines for ΔT in Al-E binary systems (E = Cu, Cr, Fe, Mg, Mn, Ni, Ti, Zn) at 855 K for a fixed composition of element E equal to (a) 0.2 wt.% and (b) for 0.5 wt.%.
3.3. Al-Si8 and Al-Si11 Ternary Systems
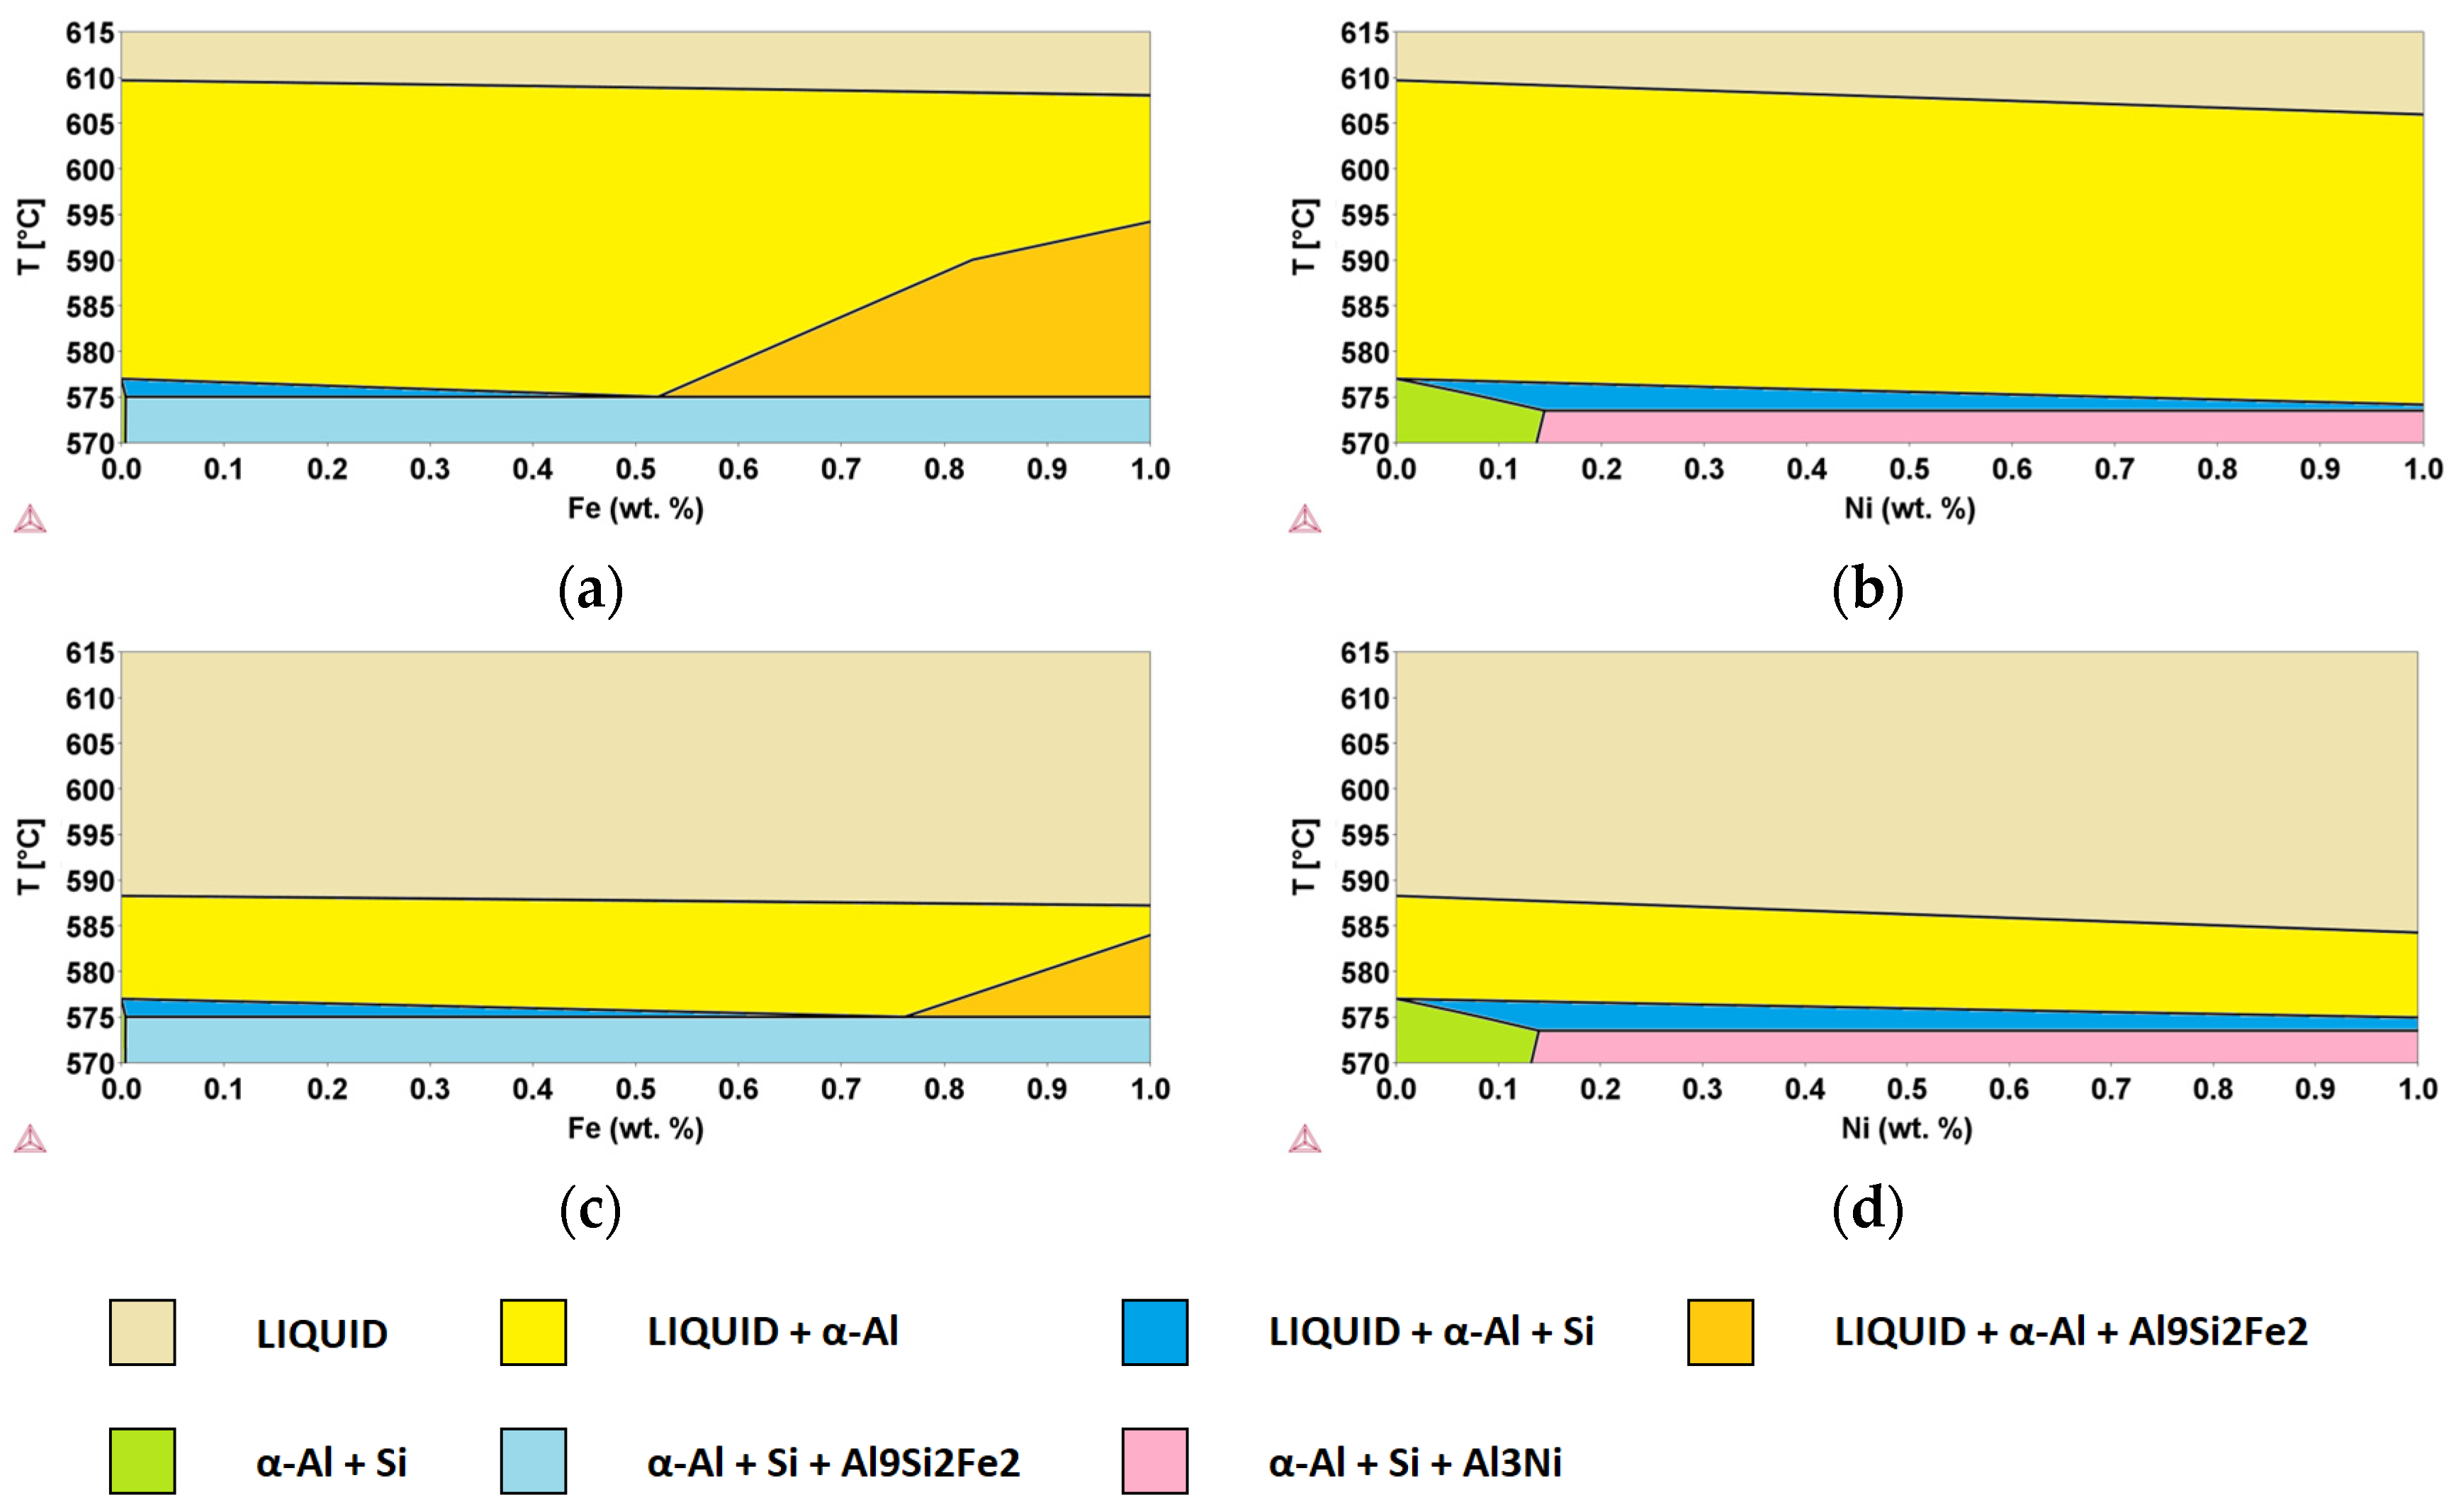
In order to better identify the role of minority elements in secondary Al-alloys to be used in semi-solid processes, ternary alloys derived from the Al-Si system were considered. Using the same thermodynamic database as in the previous section and starting from the assessed binary Al-Si system, Al-Si-E pseudo-binary phase diagrams were simulated using the CALPHAD approach, fixing the Si content to 8 and 11 wt.% while still considering the same E elements (i.e., x = Cu, Cr, Fe, Mg, Mn, Ni, Ti, Zn) [10]. As examples, Al-Si8-Fe, Al-Si8-Ni, Al-Si11-Fe, and Al-Si11-Ni pseudo-binary phase diagrams are shown in Figure 9. The yellow areas indicate the zone of existence of the liquid phase together with the α-Al fcc solid solution, while in the orange areas, the Al9Si2Fe2 phase is also present. In all cases, in the identified ranges, the semi-solid slurry is present, allowing for semi-solid processes.
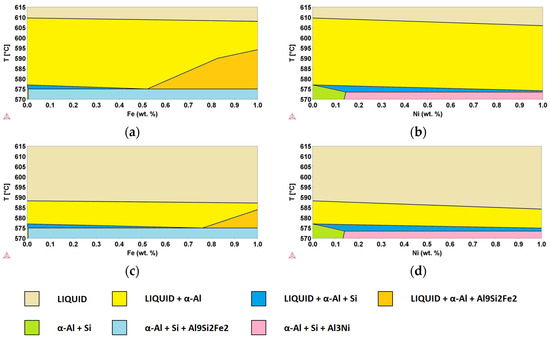
Figure 9.
Pseudo-binary (a) Al-Si8-Fe, (b) Al-Si8-Ni, (c) Al-Si11-Fe, and (d) Al-Si11-Ni phase diagrams, calculated using the CALPHAD method. Phases present in different areas are highlighted.
It can be observed that the addition of Fe leads to an increase in ΔT with respect to the binary Al-Si alloy, whereas Ni decreases it. This effect is enhanced by increasing the content of the additional component, leading to a variation from 32.7 K for the binary system Al-Si8 up to 33.1 K (+0.4 K) and 31.8 K (0.9 K) for the addition of 1.0 wt.% of Fe and Ni, respectively. If we consider the Al-Si11-E pseudo-binary phase diagrams, for the same additions of Fe and Ni, we had a variation from 11.3 K for the binary system Al-Si11, up to 12.2 K (+0.9 K) and 9.3 K (−2.0 K), respectively. Al-Si8 alloys, with a temperature gap of 32.7 K, are suitable for semi-solid processes, while Al-Si11 alloys, with a temperature gap of 11.3, are not adequate. However, both cases have been studied because they correspond to the extremes of acceptability for the alloys of interest.
Further calculations were performed to evaluate the variation in ΔT values considering various amounts of added elements (i.e., x = 0.2, 0.5 and 1.0 wt.%), and the corresponding results are shown in Table 4 and Table 5 for Al-Si8-E and Al-Si11-E systems, respectively. It can be observed that, for the elements considered, the variation in ΔT is always within a few degrees across the entire range of composition studied. The results show that, with respect to the Al-Si8 (32.7 K) and Al-Si11 (11.3 K) alloys, the presence of some elements (Cr, Fe, Mg, Mn, Ti) causes an increase of the semis-solid region, while other elements (Cu, Ni, Zn) have the effect of decreasing this interval.
Table 4.
ΔT values (in K) calculated from Al-Si8-E pseudo-binary phase diagrams, with various elements as E, considering x = 0.2, 0.5, and 1.0 wt.%.
Table 5.
ΔT values (in K) calculated from Al-Si11-E pseudo-binary phase diagrams, with various elements as E, considering x = 0.2, 0.5, and 1.0 wt.%.
In order to identify the possible role of the thermodynamic interactions between the E element and the Al-Si system, the enthalpy of mixing was calculated as a function of the content of the E element for Al-Si8-E and Al-Si11-E ternary systems, both in the liquid and in the fcc solid solution. A fixed temperature T = 855 K was arbitrarily chosen for the calculations to fix a suitable temperature for semi-solid processes. Calculations were performed for selected compositions (i.e., 0.2, 0.5, and 1.0 wt.%), and the results are reported in Table 6 and Table 7 for Al-Si8-E and Al-Si11-E ternary systems, respectively.
Table 6.
ΔHmix values (in kJ/mol) calculated for the fcc solid solution and liquid phases for Al-Si8-E ternary systems with various elements as E, considering compositions of 0.2, 0.5, and 1.0 wt.%.
Table 7.
ΔHmix values (in kJ/mol) calculated for the fcc solid solution and liquid phases for Al-Si11-E ternary systems with various elements as E, considering compositions of 0.2, 0.5, and 1.0 wt.%.
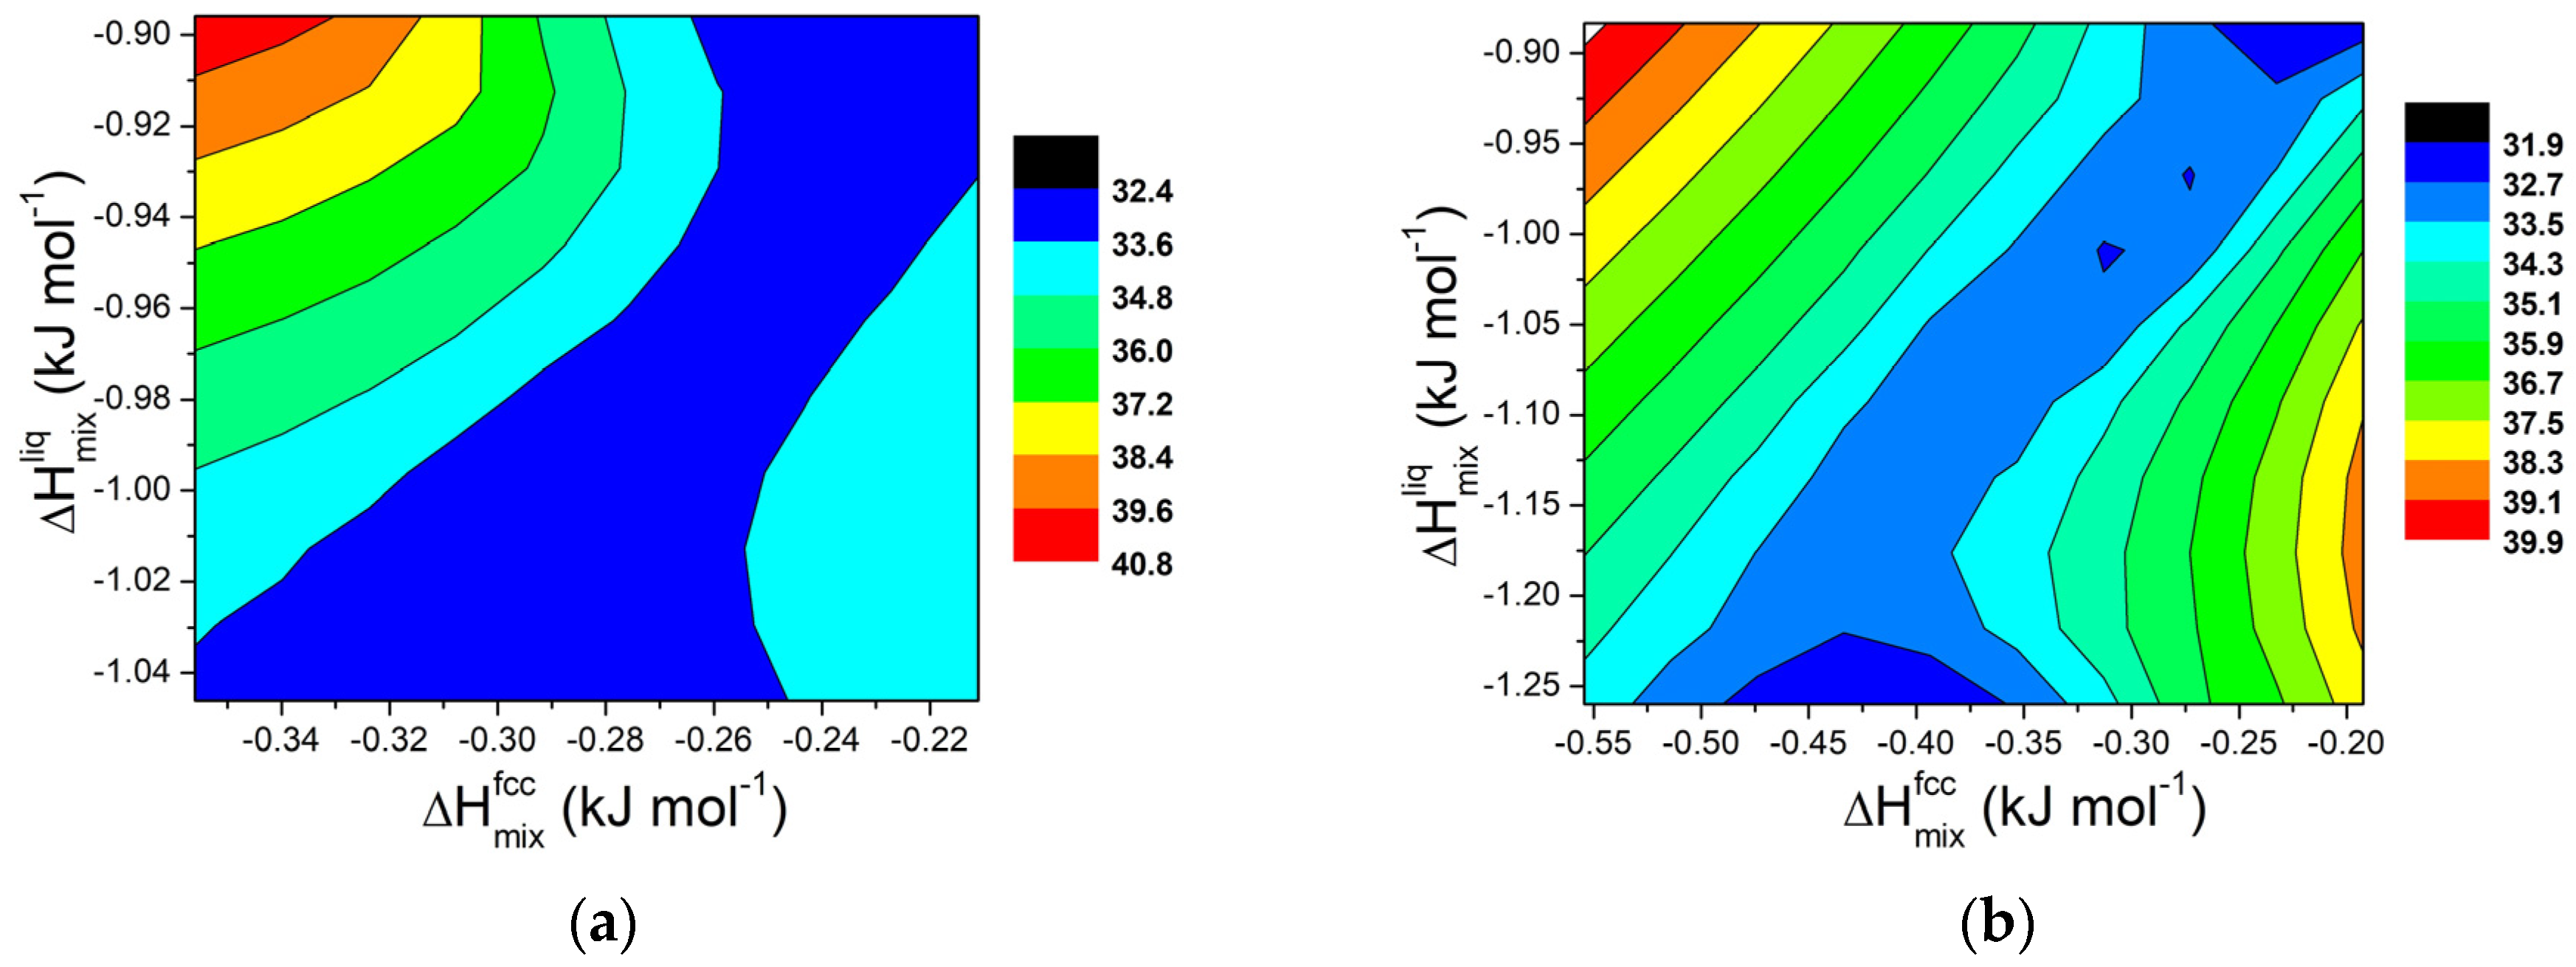
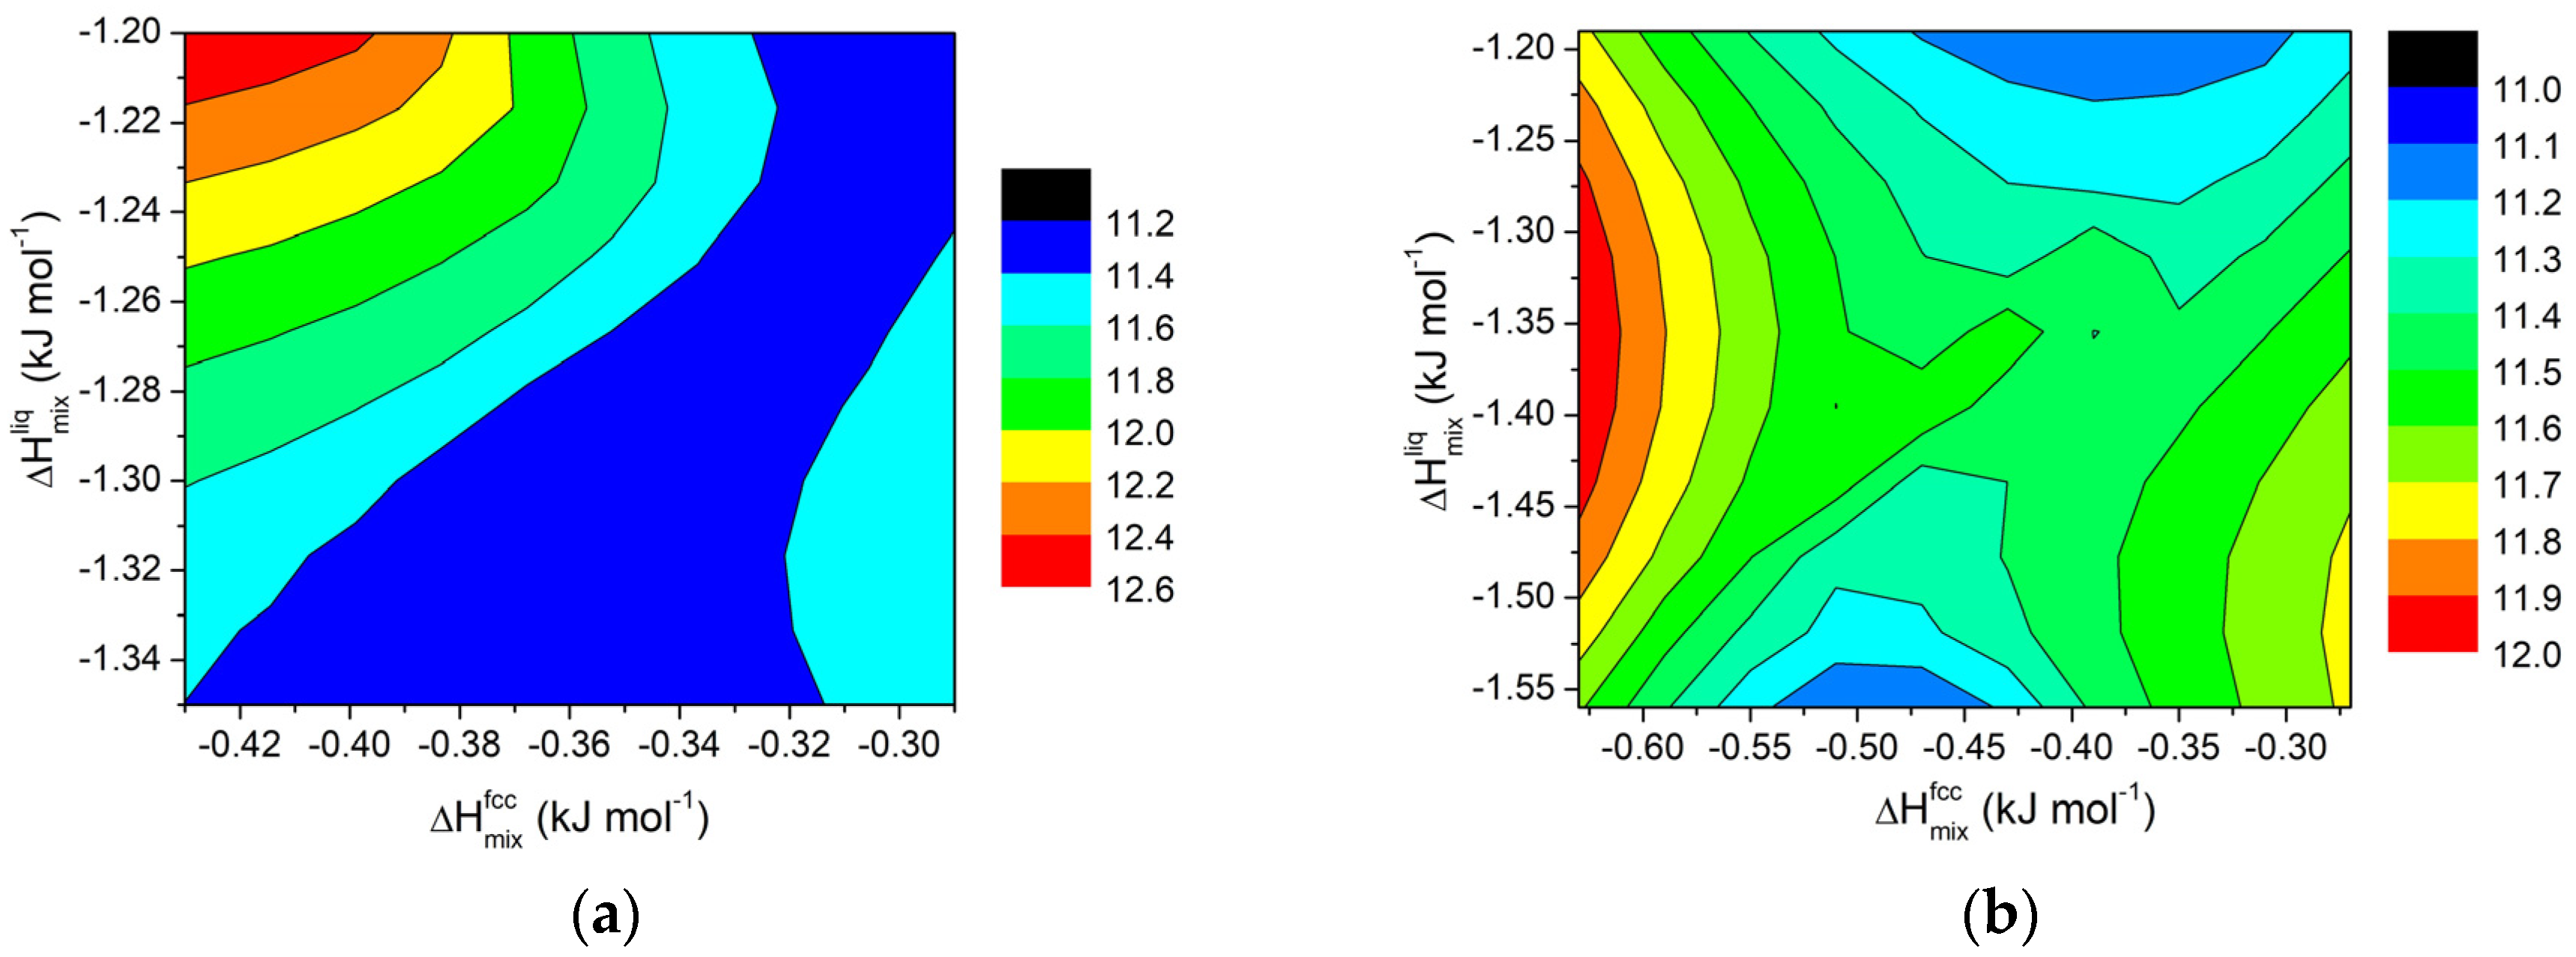
For ternary mixtures, based on the calculated values of ΔHmix and ΔT for various systems, contour maps were also been calculated for selected compositions (i.e., 0.2 and 0.5 wt.%). The results are shown in Figure 10 and Figure 11 for Al-Si8-E and Al-Si11-E ternary systems, respectively.
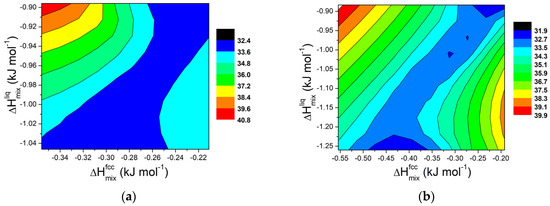
Figure 10.
Contour lines for ΔT in Al-Si8-E ternary systems (E = Cu, Cr, Fe, Mg, Mn, Ni, Ti, Zn) at 855 K for (a) x = 0.2 wt.% and (b) for x = 0.5 wt.%.
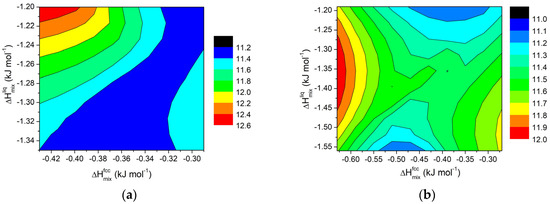
Figure 11.
Contour lines for ΔT in Al-Si11-E ternary systems (E = Cu, Cr, Fe, Mg, Mn, Ni, Ti, Zn) at 855 K for (a) x = 0.2 wt.% and (b) for x = 0.5 wt.%.
For small amounts of added elements, the trend follows a pattern similar to that observed for regular solutions and for binary systems, as evidenced in Figure 10a and Figure 11a (x = 0.2 wt.%). It is worth noting that, for such a small addition of external components, the effect on ΔT for the AlSi11 systems is rather limited, well within a few degrees. On the contrary, for the AlSi8 systems, the interval is around 8K.
For higher amounts of added elements, a different behaviour can be observed, as shown in Figure 10b and Figure 11b for x = 0.5 wt.%. In this case, more distinct trends can be observed for ΔT when ΔHmix values for fcc solid solution and liquid phases are changed. In particular, in the AlSi11 systems, for constant values of ΔHmix for the liquid phase, a minimum appears in the middle of the plot. This result reinforces the idea that, to extend the semi-solid range in Al alloys, a divergence between the mixing properties of the fcc solid solution and liquid phases is required.
4. Conclusions
This study examines the impact of various factors on the liquidus–solidus temperature difference (ΔT) in Al-based alloys within the context of semi-solid processing. Phase diagrams of an A-B system were calculated using the regular solution model, considering variations in the Ωsol and Ωliq parameters. It was found that ΔT increases when Ωsol and Ωliq differ, with significant changes occurring when the interaction parameters between solid and liquid phases are opposed. For high Ωsol values, eutectic formation causes ΔT to depend primarily on Ωliq, whereas at lower Ωsol values, ΔT is only minimally affected by composition.
Changes in the entropy of fusion (ΔSfus) of pure components also significantly affect ΔT. Decreasing ΔSfus lowers both the eutectic and solidus temperatures, resulting in a higher ΔT. However, the influence of ΔSfus on ΔT is more pronounced when Ωsol is high, with ΔT becoming largely independent of Ωsol in such cases.
This study also explored the role of contaminants in recycled Al-Si alloys by comparing the results of CALPHAD thermodynamic investigations. Binary phase diagrams were calculated for various elements (Cu, Cr, Fe, Mg, Mn, Ni, Ti, Zn), revealing that the addition of these elements significantly affects ΔT. Elements like Cu, Mg, Mn, and Zn tend to increase ΔT, while elements such as Fe, Ti, and Cr decrease it. Furthermore, this study examined the role of mixing enthalpy (ΔHmix) on ΔT. ΔHmix was calculated for various compositions at a fixed temperature of 855 K, relevant for semi-solid processing. The results indicated that ΔHmix increases with the concentration of the added element, but for some elements, like Ti, an immiscibility gap was observed.
For AlSi8- and Al-Si11-based ternary alloys, ΔT values were calculated for various amounts, comparable with the acceptable range for commercial recycled alloys, of the same added elements, showing that the impact of these elements on the solidification window is relatively limited. Elements like Cr, Fe, Mg, Mn, and Ti increase the semi-solid range, while Cu, Ni, and Zn reduce it. The findings suggest that a divergence between the mixing properties of the fcc solid solution and liquid phases is necessary to extend the semi-solid range in Al alloys.
The obtained results provide valuable insights into the role of minority elements in semi-solid processes, which can help in explaining phenomenological observations and guide the development of secondary Al-alloys for industrial applications.
Author Contributions
Conceptualization, S.F. and M.B.; methodology, S.F. and M.B.; software, S.F. and M.P.; validation, M.P., A.C. and M.B.; formal analysis, S.F.; investigation, S.F.; resources, M.B. and A.C.; data curation, S.F.; writing—original draft preparation, S.F.; writing—review and editing, M.P., A.C. and M.B.; visualization, M.P., A.C. and M.B.; supervision, A.C.; project administration, M.B.; funding acquisition, A.C. and M.B. All authors have read and agreed to the published version of the manuscript.
Funding
The authors acknowledge support from the Project CH4.0 under the MUR program “Dipartimenti di Eccellenza 2023–2027” (CUP: D13C22003520001). Simone Ferraro acknowledges financial support from MUR in the framework of PON R&I 2014–2020, Action IV.5 on Green-related topics (D.M. 1061/2021) and the collaboration with the industrial partner 2a s.p.a—Foundry Division.
Data Availability Statement
The original contributions presented in this study are included in the article. Further inquiries can be directed to the corresponding author.
Conflicts of Interest
The authors declare no conflicts of interest.
Abbreviations
The following abbreviations are used in this manuscript:
| CALPHAD | Computer Coupling of Phase Diagrams and Thermochemistry |
| CEF | Compound Energy Formalism |
| fcc | Face-centred cubic |
| HPDC | High-pressure die casting |
| INSTM | Consorzio Interuniversitario Nazionale per la Scienza e Tecnologia dei Materiali |
| SSM | Semi-solid metallurgy |
References
- Modigell, M.; Pola, A.; Tocci, M. Rheological characterization of semi-solid metals: A review. Metals 2018, 8, 245. [Google Scholar] [CrossRef]
- Kirkwood, D.; Kapranos, P.; Suéry, M.; Atkinson, H.V.; Young, K.P. Semi-Solid Processing of Alloys, 1st ed.; Springer: Berlin/Heidelberg, Germany, 2010. [Google Scholar] [CrossRef]
- Atkinson, H.V. Alloys for semi-solid processing. Solid State Phenom. 2013, 192–193, 16–27. [Google Scholar] [CrossRef]
- Jarfors, A.E.W. A comparison between semisolid casting methods for aluminium alloys. Metals 2020, 10, 1368. [Google Scholar] [CrossRef]
- Barbé, J.C.; Perez, M.; Papoular, M. Microstructure and viscosity of semi-solid mixtures. J. Phys. Condens. Matter. 2000, 12, 2567–2577. [Google Scholar] [CrossRef]
- Solomon, A.D.; Wilson, D.G.; Alexiades, V. A mushy zone model with an exact solution. Lett. Heat Mass Transf. 1982, 9, 319–324. [Google Scholar] [CrossRef]
- Guggenheim, E.A. The statistical mechanics of regular solutions. Proc. R. Soc. London. Ser. A—Math. Phys. Sci. 1935, 148, 304–312. [Google Scholar] [CrossRef]
- Oates, W.A.; Flanagan, T.B. Thermodynamic properties of regular interstitial solutions. J. Mater. Sci. 1981, 16, 3235–3243. [Google Scholar] [CrossRef]
- Sundman, B.; Dupin, N.; Sluiter, M.H.F.; Fries, S.G.; Guéneau, C.; Hallstedt, B.; Kattner, U.R.; Selleby, M. The Legacy of “The Regular Solution Model for Stoichiometric Phases and Ionic Melts”. J. Phase Equilibria Diffus. 2024, 45, 934–964. [Google Scholar] [CrossRef]
- Jung, J.G.; Cho, Y.H.; Lee, J.M.; Kim, H.W.; Euh, K. Designing the composition and processing route of aluminum alloys using CALPHAD: Case studies. Calphad 2019, 64, 236–247. [Google Scholar] [CrossRef]
- Ferraro, S.; Bongiovanni, A.; Lopez, I.S.; Palumbo, M.; Baricco, M.; Castellero, A. CALPHAD Optimization of the Composition of EN AC-46000 Secondary Alloys for Semi-Solid Casting Processes. Solid State Phenom. 2023, 347, 171–176. [Google Scholar] [CrossRef]
- Porter, D.A.; Easterling, K.E.; Sherif, M.Y. Phase Transformations in Metals and Alloys, third ed.; CRC Press: Boca Raton, FL, USA, 2009. [Google Scholar]
- David, R.L. CRC Handbook of Chemistry and Physics for the 21st Century; CRC Press: Boca Raton, FL, USA, 1989. [Google Scholar]
- Dinsdale, A.T. SGTE data for pure elements. Calphad 1991, 15, 317–425. [Google Scholar] [CrossRef]
- Tiwari, G.P. Modification of richard’s rule and correlation between entropy of fusion and allotropic behaviour. Met. Sci. 1978, 12, 317–320. [Google Scholar] [CrossRef]

Disclaimer/Publisher’s Note: The statements, opinions and data contained in all publications are solely those of the individual author(s) and contributor(s) and not of MDPI and/or the editor(s). MDPI and/or the editor(s) disclaim responsibility for any injury to people or property resulting from any ideas, methods, instructions or products referred to in the content. |
© 2025 by the authors. Licensee MDPI, Basel, Switzerland. This article is an open access article distributed under the terms and conditions of the Creative Commons Attribution (CC BY) license (https://creativecommons.org/licenses/by/4.0/).