Article

Fatigue Behaviors of Resistance Spot Welds for 980 MPa Grade TRIP Steel

1
Joining R&D Group, Korea Institute of Industrial Technology, Incheon 21999, Korea
2
School of Mechanical Design Engineering, Hanyang University, Seoul 04763, Korea
3
Department of Materials Science & Engineering, Seoul National University, Seoul 08826, Korea
*
Authors to whom correspondence should be addressed.
Metals 2019, 9(10), 1086; https://doi.org/10.3390/met9101086
Submission received: 23 September 2019 / Revised: 7 October 2019 / Accepted: 8 October 2019 / Published: 10 October 2019

Abstract

:
The fatigue life of the resistance spot weld of 980 MPa grade transformation induced plasticity (TRIP) steel was investigated and failure modes and fracture surfaces according to the fatigue load were analyzed. The fatigue life according to the nugget size was observed by using two electrodes with face diameters of 8 mm and 10 mm. When an electrode face diameter with 10 mm was used, the nugget size was large, and the fatigue life was further increased. After the fatigue test, three types of failure modes were observed, namely pull-out, plug, and heat affected zone (HAZ) failure, depending on the fatigue load. The fracture surfaces in each failure mode were analyzed. In all failure modes, a crack was initiated in the HAZ region, which is the interface between the two materials in all failure modes. In the case of pull-out failure, the crack propagates as if it surrounds the nugget at the outer edge of the nugget. In the case of HAZ failure, the crack propagates in the thickness direction of the material and outward in the nugget shell. Plug failure occurs with pull-out failure and HAZ failure mixed. The propagation patterns of cracks were different for each failure mode. The reason why the failure mode and the fracture surface are different according to the fatigue load is that the propagation speed of the fatigue crack is fast when the fatigue load is relatively large and is slow when the fatigue load is low.

1. Introduction

Environmental regulations are strengthened with interest in issues such as fine dust and carbon dioxide emission. In the automotive industry, emissions of automobiles must be reduced, and one of the solutions is to decrease vehicle weight. This could increase gas mileage and consequently reduce emissions of pollutants [1]. Thus, lightweight materials such as aluminum and carbon fiber reinforced plastics (CFRP) are increasingly used [2,3]. Advanced high strength steel (AHSS) is suitable for heavy steel used parts such as body, chassis, and suspensions, because the parts have required high strength as well as excellent safety and impact resistance. However, as the strength of the material increase, the elongation decreases due to the decrease of the plasticity, so that the AHSS with increased ductility is continuously being developed.
First generation steels consist mainly of ferrite-based microstructure, including dual phase (DP) steel, transformation induced plasticity (TRIP) steel, complex phase (CP) steel, and martensitic (MART) steel [4]. Second generation steels, which have higher strength and elongation than first generation steel, include twinning induced plasticity (TWIP) steels. Second generation steels have high mechanical properties due to the addition of various alloying elements, but they are difficult to commercialize because of their low weldability and high cost [5]. Third generation steels have lower strength and elongation than the second generation steel, but are improving its mechanical properties through new processes, alloying elements, and grain refinement to commercialize it. The third generation steels include quenching and partitioning (Q&P) steel [6].
Because of the short process time, highly productive resistance spot welding is widely used in the automotive industry and is used more than 3000 times for car body assembly [7,8,9]. However, since the resistance spot welds of the car body are exposed to repeated and irregular loads, the structural performance deteriorates and fatigue failure frequently occurs [10]. The resistance spot welds, which are the lap joint geometry, are mainly exposed to the shear load, but the vertical load is applied. Due to the geometric shape and stress state of resistance spot welds, stress concentration occurs and fatigue cracks start around the resistance spot welds [11]. Therefore, understanding fatigue behavior, which includes crack initiation and propagation, is important to guarantee the durability and life of the car body. The fatigue life of welds is mainly investigated by fatigue tests and the resulting stress-number (S-N) curves are used to confirm fatigue life according to various fatigue loads. However, there is a limit to observe fatigue behavior with the S-N curves alone.
Many studies have been carried out on the failure mode and fatigue behavior of resistance spot welds for various materials. Vural et al. conducted a fatigue test after resistance spot welding of austenitic and galvanized steels, and derive S-N curves [12]. They observed fatigue performance, crack length, and fracture surface according to weld combination and nugget size. In addition, the material constants of the materials used in the Paris-Erdogan equation of fatigue crack growth model were calculated and the crack growth rates were compared. Zhao et al. carried out tensile shear tests on resistance spot welds of DP600 steel and studied the effects of electrode force on tensile shear strength and fracture energy absorption, failure mode, and microstructure [13]. As a result, it was concluded that the nugget size was affected by failure mode, tensile shear load, and fracture energy. Radakovic and Tumuluru predicted failure modes in tensile shear tests through the finite elements method (FEM) and analyzed for failure mechanism [14]. They obtained an equation to predict the fracture loads required for pull-out and interfacial failure. In order to evaluate the mechanical properties of the resistance spot weld, Chao conducted the tensile test and cross tensile test and studied the failure mechanism [15]. They claim that pull-out failure occurs as the nugget rotates and the tensile load is applied and then the necking occurs outside the nugget, resulting in crack initiations around the nugget’s periphery. Interfacial failure occurs inside nugget and a critical parameter of material that changes failure mode of the weld. Wang et al. carried out the fatigue test for the resistance spot weld of 1.5 GPa grade boron steel [16]. After the fatigue test, the failure mode occurred was classified as fracture propagating around the circumference of the nugget and fracture propagating in a direction perpendicular to the load. They suggested that fatigue cracks initiate mainly at the notch of the heat affected zone (HAZ) and occur at the interface of the two materials and showed crack initiation and transgranular fractures and cleavage facets in the propagation area.
The studies of fatigue behavior of resistance spot welding are mainly based on analysis rather than experimental study. Many studies on failure mode are focused on fracture surface observation after the tensile shear test rather than fatigue test. In addition, the papers that observe fatigue behavior and fracture surface were limited to the analysis of the mechanical properties of the weld and failure mode by observing the microstructure. Thus, to understand the macroscopic fracture shape such as failure mode is difficult because fracture surface from microstructure only shows a localized area of crack initiation and propagation.
Therefore, in this study, the purpose was to observe the entire fracture surface depending on the failure mode that occurred after the fatigue test. Resistance spot welding was performed for 980 MPa grade TRIP steel. Two types of the electrode with different electrode face diameters were used to observe the fatigue behavior according to the nugget size. The electrode force and welding time were fixed, and the welding current was used before the expulsion. Fatigue life according to fatigue load was investigated, and the failure mode was classified according to fatigue load. The fracture surface for failure mode was observed throughout, and fatigue behavior such as initiation and propagation of cracks were analyzed from the microstructure.

2. Experimental Procedures

The material used in this study was 980 MPa grade TRIP steel with a thickness of 1.2 mm. Chemical composition and mechanical properties are shown in Table 1 and Table 2, respectively.
The tensile strength and elongation of the material used in this study was obtained from tensile test (AG-300kNX Plus, Shimadzu, Kyoto, Japan) and crosshead velocity was set at 10 mm/min. The welding power source was a medium frequency direct current resistance spot welder (MFDC, Dawonsys, Ansan, Korea). The dome-type electrodes of Cu-Cr alloy with electrode face diameters of 8 and 10 mm, respectively, were used (Figure 1a). In order to prepare the tensile test specimens, the test specimens having a width of 30 mm and a length of 100 mm were subjected to resistance spot welding with a 30 mm overlapping portion as shown in Figure 1b. The welding current used was the current just before the expulsion, and the detailed welding conditions are shown in Table 3. The cross section of the weld was cut in the width direction of the specimen, polished, etched in 9% Nital solution for about 10 s, and observed with an optical microscope (OM, SZ61, Olympus, Tokyo, Japan).
The tensile test, microhardness test, and fatigue test were carried out to evaluate the mechanical properties of the weld. The strain rate used in the tensile test (AG-300kNX Plus, Shimadzu, Kyoto, Japan) was set at 10 mm/min according to the standards of the American Welding Society (AWS D8.9M:2012) [17]. The hardness of the welds was measured using micro Vickers hardness tester (HM-101, Mitutoyo, Kawasaki, Japan) and the indentation load used was 200 g. Fatigue tests were performed using a fatigue testing instrument (Instron 8801, Instron, Norwood, MA, USA) with a 5-ton capacity. To ensure reliability, the fatigue test was conducted twice for each fatigue load and sample. When the fatigue test was carried out, a 30 mm × 30 mm shim was attached to both sides to prevent the moment applied to the weld (Figure 1b). The frequency was set to 40 Hz and the stress ratio between minimum and maximum load (R = Lmin/Lmax) was set to 0.1. The fatigue life was measured by controlling the maximum load (Lmax) at intervals of 1 kN from 8 kN to 1 kN, and the fatigue limit was set to 2 × 10⁶ cycles.
The fatigue test was stopped when the fracture occurred or fatigue limit was reached. The specimens were cut in the width direction and observed with a scanning electron microscope (SEM, Quanta 200F, Thermo Fisher, Waltham, MA, USA) to observe the microstructure of the fatigue fracture after the fatigue test.

3. Results and Discussion

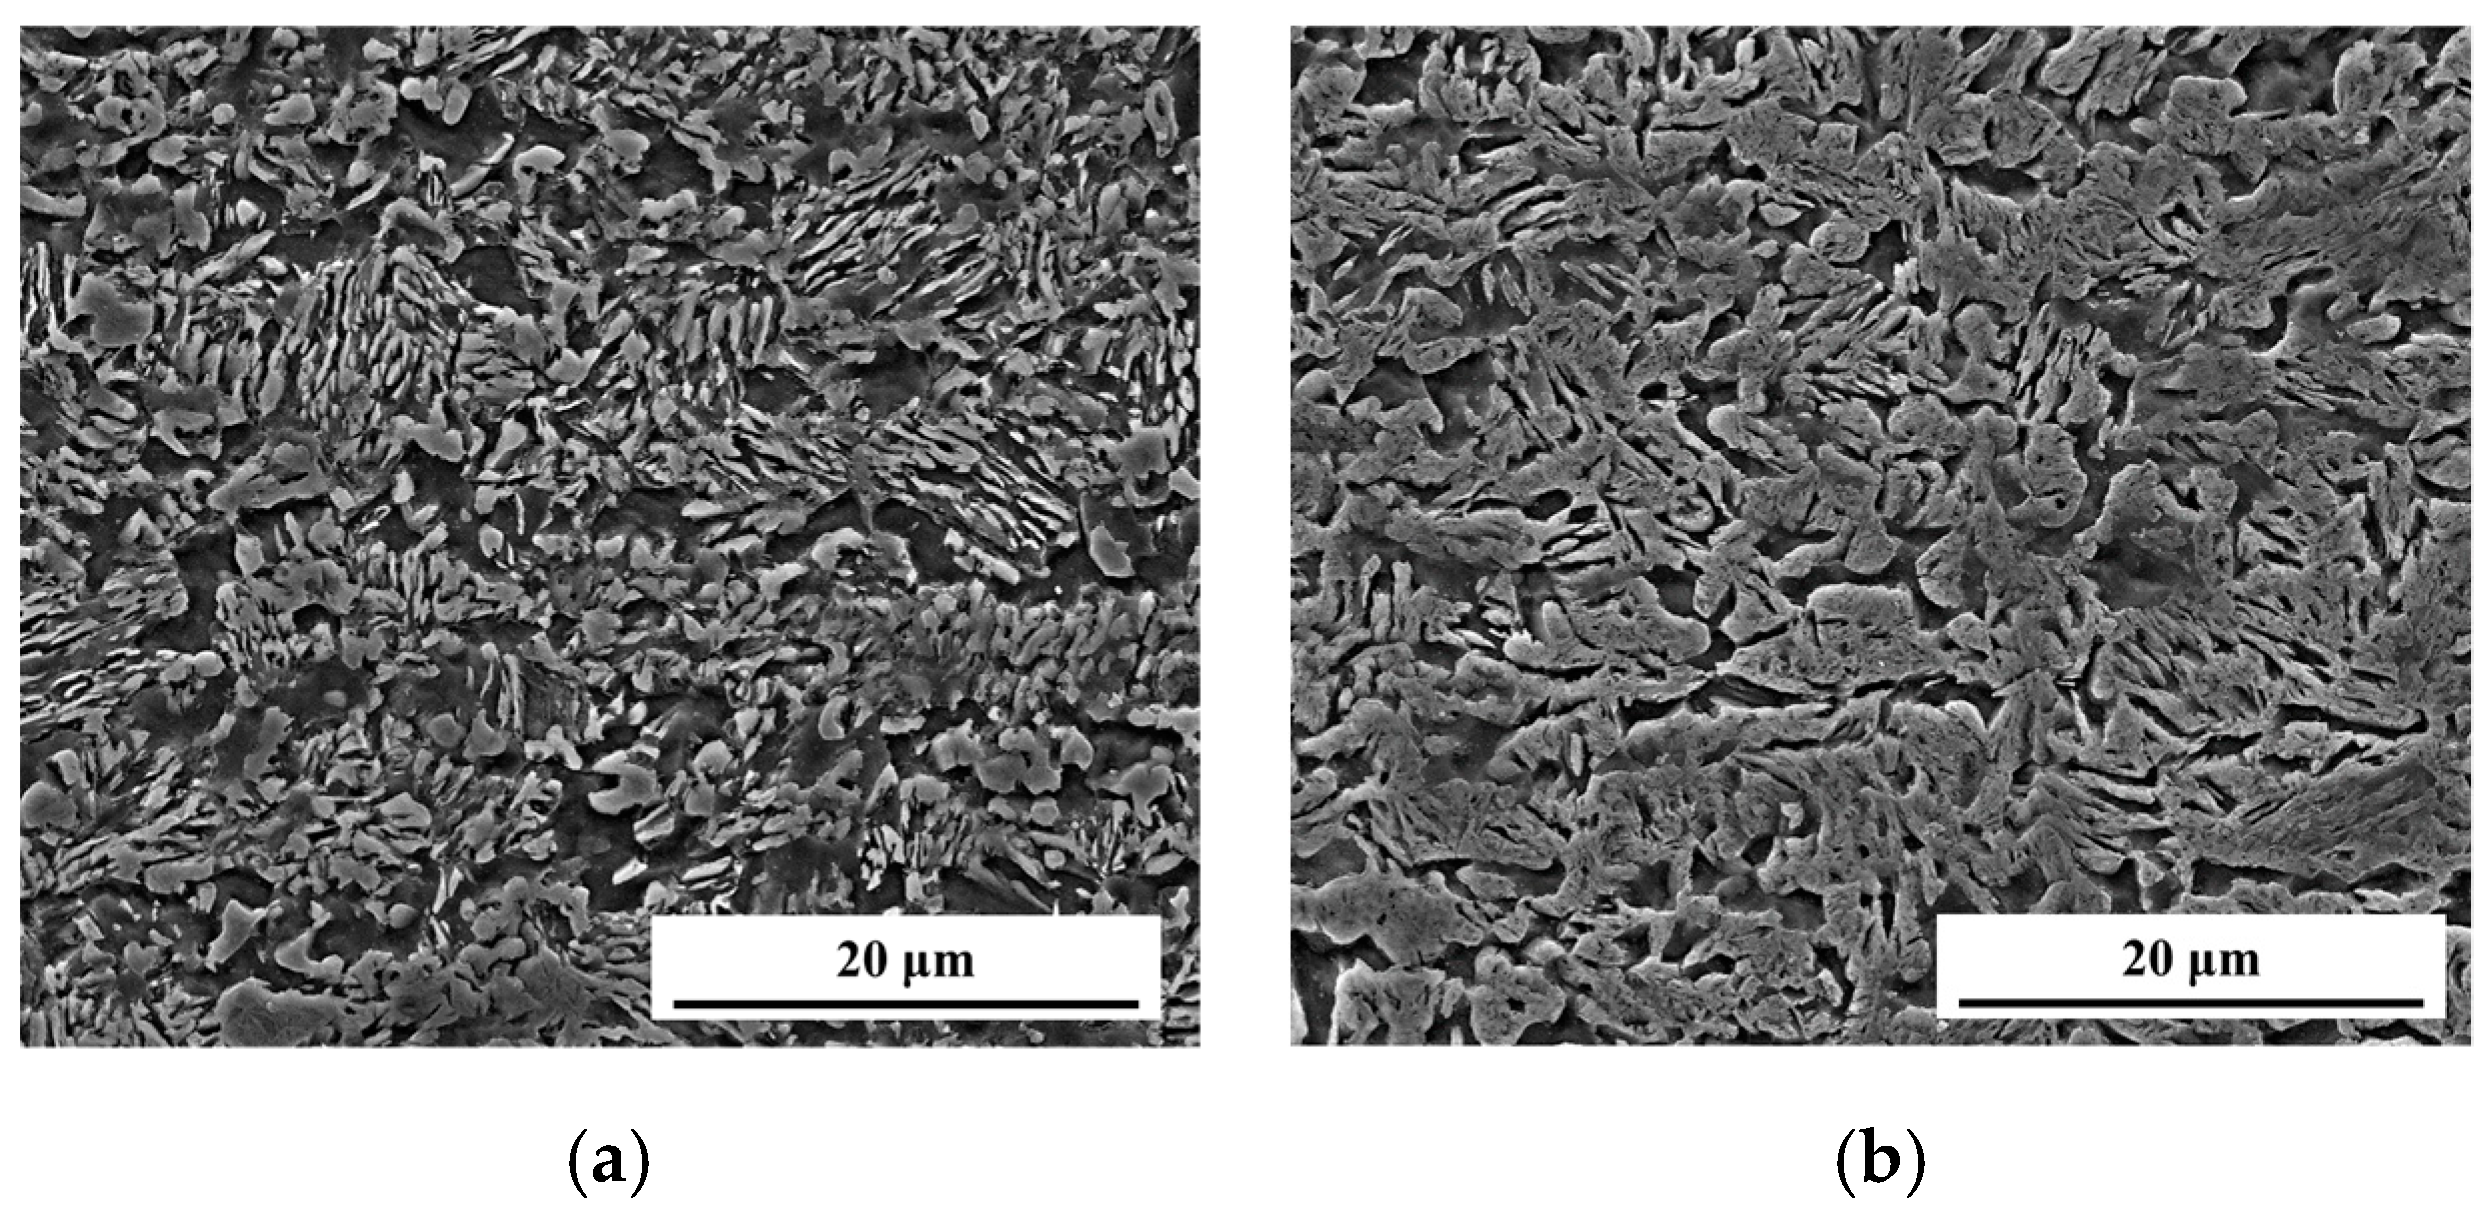
3.1. Mechanical Properties and Microstructure

Figure 2 shows the cross section of the weld when the electrode face diameter is 8 and 10 mm, respectively. As shown in Table 4, the nugget sizes were 5.1 and 5.7 mm, respectively, and the tensile shear strengths were 12.5 and 15.5 kN, respectively. Nugget size and tensile shear strength at the electrode face diameter of 10 mm were higher than those of electrode face diameter of 8 mm. Tension shear test results showed pull-out failure at both electrode face diameters of 8 mm and 10 mm (Table 4), and the fracture shape is shown in Figure 3. Figure 4 shows the results of hardness measurements of welds according to the size of the electrode face diameter. The average hardness of the base metal (BM) was 320, 318 HV0.2 and the hardness of the fusion zone (FZ) was 539 and 542 HV0.2, respectively, depending on the type of electrode face diameter. There was no significant difference in the hardness of the welds due to the difference of size in electrode face diameter. Since the austenite was transformed into martensite as the molten metal was cooled at a rate of 10–104 °C/s due to the cooling water flowing through the electrode during the resistance spot welding process, the hardness of the FZ was drastically increased [18,19] as compared with base metal. Hardness in HAZ was higher than BM and lower than FZ. It has been reported that the softening phenomenon occurs in HAZ when hardness is lower than BM in DP980, Q & P980, B1500HS, etc. [16,20,21]. In the presence of martensite in the BM, HAZ softening phenomena are observed by sub-critical HAZ (SCHAZ) with tempered martensite, inter-critical HAZ (ICHAZ) with ferrite and martensite, and upper-critical HAZ (UCHAZ) with the coarse grain [22]. In this study, HAZ softening did not occur because there was no martensite in the BM.
Figure 5 shows the microstructure of the base material, HAZ, and FZ. In general, the microstructure of TRIP steel consists of ferrite, bainite, retained austenite, and a small portion of martensite [23]. As shown in Figure 5a, the base material of 980 MPa grade TRIP steel used in this study is composed of ferrite and elongated bainite. Due to the combination of these microstructures, the hardness of the BM was approximately 320 HV. HAZ is divided into two areas, which are SCHAZ near BM and UCHAZ near FZ. The microstructure of SCHAZ was tempered by the bainite present in the BM (Figure 5b) because the peak temperature reached a temperature below Ac3. Since UCHAZ reaches the peak temperature above Ac3, ferrite and bainite of the base material are transformed into austenite. Then, due to the high cooling rate, the microstructure is composed of martensite, ferrite, and bainite (Figure 5c) [24]. FZ is completely melted and transformed into austenite. Thereafter, the microstructure was composed of two phases of martensite and bainite (Figure 5d) due to the high cooling rate during cooling, and the hardness of FZ was about 540 HV.

3.2. Fatigue Test

Figure 6 shows the load-number of cycles to failure curves of the resistance spot welding specimen obtained by fatigue test using two kinds of electrodes. In both face diameter conditions (8 mm and 10 mm), fatigue life decreased as the fatigue load increased. For the electrode face diameters of 8 mm and 10 mm, the fatigue limit of 2 × 10⁶ cycles was reached when the fatigue loads were 1 kN and 2 kN, respectively. The fatigue life of the electrode face diameter of 10 mm was longer than that of 8 mm. When the fatigue load was 5–8 kN, the fatigue life of the 10 mm electrode was about two times longer, and the fatigue life difference was decreased at the lower load. In this study, the fatigue life was increased when the nugget size was large. As the nugget size of the resistance spot weld increases, the joint area increases and the stress concentration decreases [25].
Generally, failure modes of resistance spot welds during the tensile test are classified into three types. The first mode is a pull-out failure in which the nugget is pulled out from the BM or HAZ. The second mode is an interfacial failure in which the crack progresses through the nugget. The third mode is the partial interfacial failure in which the pull-out failure and the interfacial failure coexist [9,26]. In addition, failure modes of the fatigue test are reported to cause pull-out failure as well as tensile test, and there is also a failure mode propagating along the width direction of the specimen [12,16].
In this study, three types of failure modes occurred due to fatigue load are shown in Figure 7 and Table 5. In case of the electrode face diameter of 8 mm, pull-out failure occurred in the fatigue load between 7 kN and 8 kN, plug failure at the fatigue load between 5 kN and 6 kN, and HAZ failure at the fatigue load between 2 kN and 4 kN, respectively. Furthermore, when the electrode face diameter was 10 mm, no pull-out failure occurred, plug failure occurred at fatigue load between 5 kN and 8 kN, and HAZ failure occurred at fatigue load between 3 kN and 4 kN. When the electrode face diameter was 10 mm, the nugget size was larger than that of electrode face diameter of 8 mm; thus, the load bearing capacity was increased, which meant no pull-out failure occurred [27]. In the case of the electrode face diameter of 8 mm, the failure modes were well characterized; the specimens and fractured shapes are shown in Figure 8. Figure 9 shows the propagation direction of cracks for each failure mode.
The red arrows of OM images in the XY plane and of schematic diagram in the XZ plane indicate the cross-sectional direction of the crack propagation. Pull-out failure is a failure mode in which the crack propagates around the nugget, and the nugget is completely pulled out from the base material and the HAZ (Figure 8a and Figure 9b). In contrast, the crack in HAZ failure mode propagates in a direction perpendicular to the load (Figure 8c). The crack propagation in Figure 9d spreads to the base material outside the nugget than the propagation direction of the pull-out failure and propagates in the thickness (Z-direction). The plug failure is a failure mode in which the pull-out failure and the HAZ failure are mixed. The crack spreads about 30% over the entire circumference of the nugget and propagates in the direction perpendicular to the load (Figure 8b). The propagation direction of the plug failure is similar to that of the pull-out failure, but the crack propagates in the HAZ region, which is slightly further from the nugget (Figure 9c).

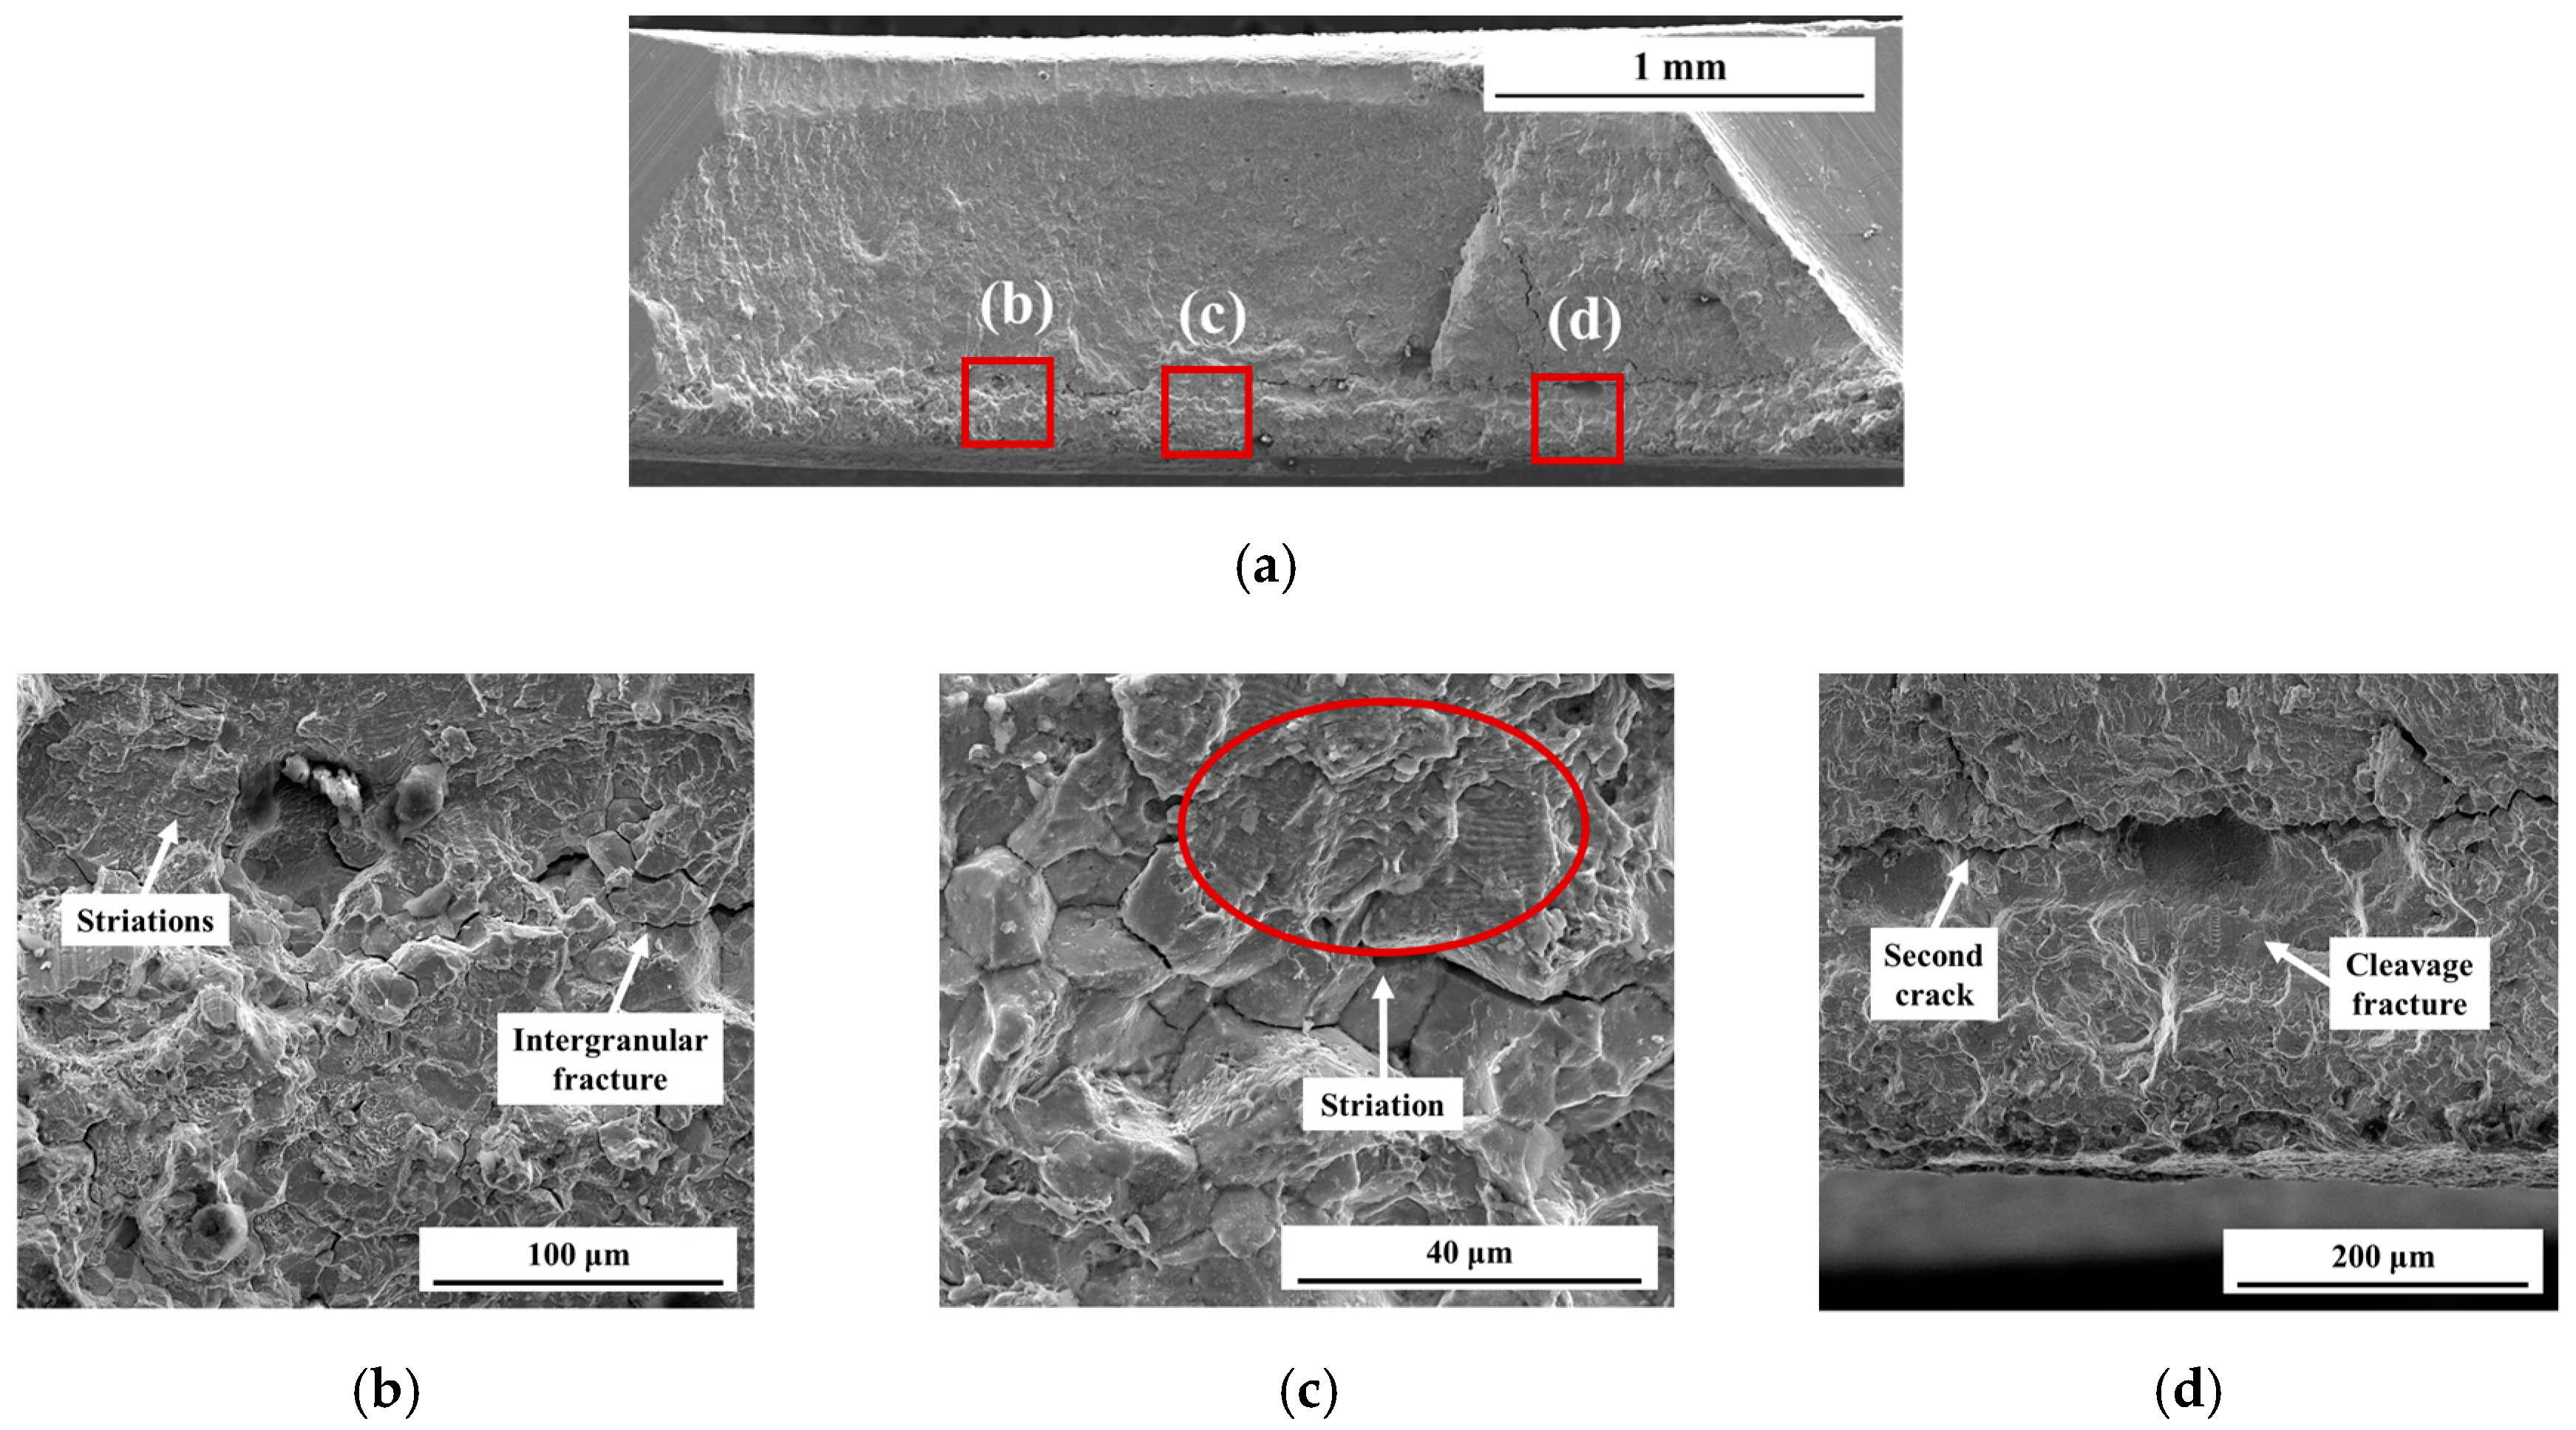
3.3. Fracture Surface

As shown in Figure 10, in order to observe the initiation and propagation of fatigue cracks, the specimen of Figure 8 was cut and observed with OM. Figure 10a shows the viewpoint direction and failure position. The location indicated by the red circle is a notch where stress concentration occurs due to thermal cycling during resistance spot welding, and necking occurs when a tensile load is applied [14,15]. Therefore, a crack was generated and propagated in the notch. As shown in the fracture surface of the pull-out failure (Figure 10b), the nugget was broken and the plug failure and HAZ failure occurred due to the propagation of the crack to the base material (Figure 10c,d). Therefore, the area of the fracture surface increased in the order of pull-out, plug, and HAZ failure. Pull-out failure and plug failure have a shape in which the cracks gather from outside to inside, because the crack propagates around the circumference of the nugget when first propagated, and HAZ failure spreads from the inside to the outside.
Figure 11, Figure 12 and Figure 13 show the result of observing the fracture surface using SEM. Figure 11 shows the fracture profile when the pull-out failure occurs. Figure 11a shows the brittle surface as a whole, and intergranular fracture occurred at the interface between the material and the material. When the location of the intergranular fracture was observed at high magnification (Figure 11b), intergranular fracture and dimple occurred from the bottom to the middle, and striations occurred due to the fatigue crack progression at the upper part. At this time, since the direction perpendicular to the direction of the striation is the direction of crack propagation, it can be seen that the cracks have propagated upward (Figure 11c). As shown in Figure 11d, similar to Figure 11b, there is an intergranular fracture in the lower part, and striation, second crack, and cleavage fracture were observed. When a tensile load is applied, fracture occurs at the grain boundary where the bonding force between atoms is weakest, and phenomena such as cleavage fracture and slip occur [27]. Therefore, cracks initiated at the lower end of the fracture surface where the intergranular fracture occurred, and the intergranular fracture occurred in the wide area of the lower part, and the crack was initiated in multiple.
Figure 12 shows the fracture surface when a plug failure occurs. Figure 12a shows a relatively ductile fracture surface compared to the pull-out failure. In Figure 12b, where cracks were initiated, there is the inclusion at the interface. On the basis of the inclusions, the left part has striations with upward cracks and the cleavage fracture to the right. The striations at the area near the crack initiation were extended upward (Figure 12c) and the striations at the crack propagating region (Figure 12d) were also all extended upward. The degree of striations at the edges was reduced. This is because the plug failure tears the BM at the edge when the nugget is ripped from the center. This is because the plug failure mode tears the nugget at the center and tears the BM at the edge.
Figure 13 shows the fracture surface of HAZ failure. Figure 13a shows the ductile fracture surface, where the propagation direction of the crack was radially outward from the center, unlike the pull-out failure. Unlike other failure modes, HAZ failure has many cleavage fractured areas. In the crack initiation area (Figure 13b), cleavage fracture occurs in the dark part of the lower part, and all other areas are composed of striations. All other areas consist of striations (Figure 13c). In the crack propagation area, less cleavage fracture occurs and most of the area is composed of striations (Figure 13d).

4. Conclusions

980 MPa grade TRIP steel was subjected to resistance spot welding, and mechanical properties and microstructure were analyzed. In addition, the fracture surface was observed according to the failure mode after the fatigue test. The conclusion is as follows.
  • Nugget sizes were 5.1 mm and 5.7 mm for electrode diameters of 8 mm and 10 mm, respectively. The tensile strengths were 12.5 kN and 15.5 kN, respectively, and the larger the electrode diameter, the larger the tensile strength. For both electrode diameters, the failure mode at the tensile test was a pull-out failure.
  • Fatigue life increased with decreasing fatigue load. When the electrode face diameter was 10 mm, the nugget size was larger and the fatigue life was higher. This is because the nugget size increases and the load bearing capacity increases.
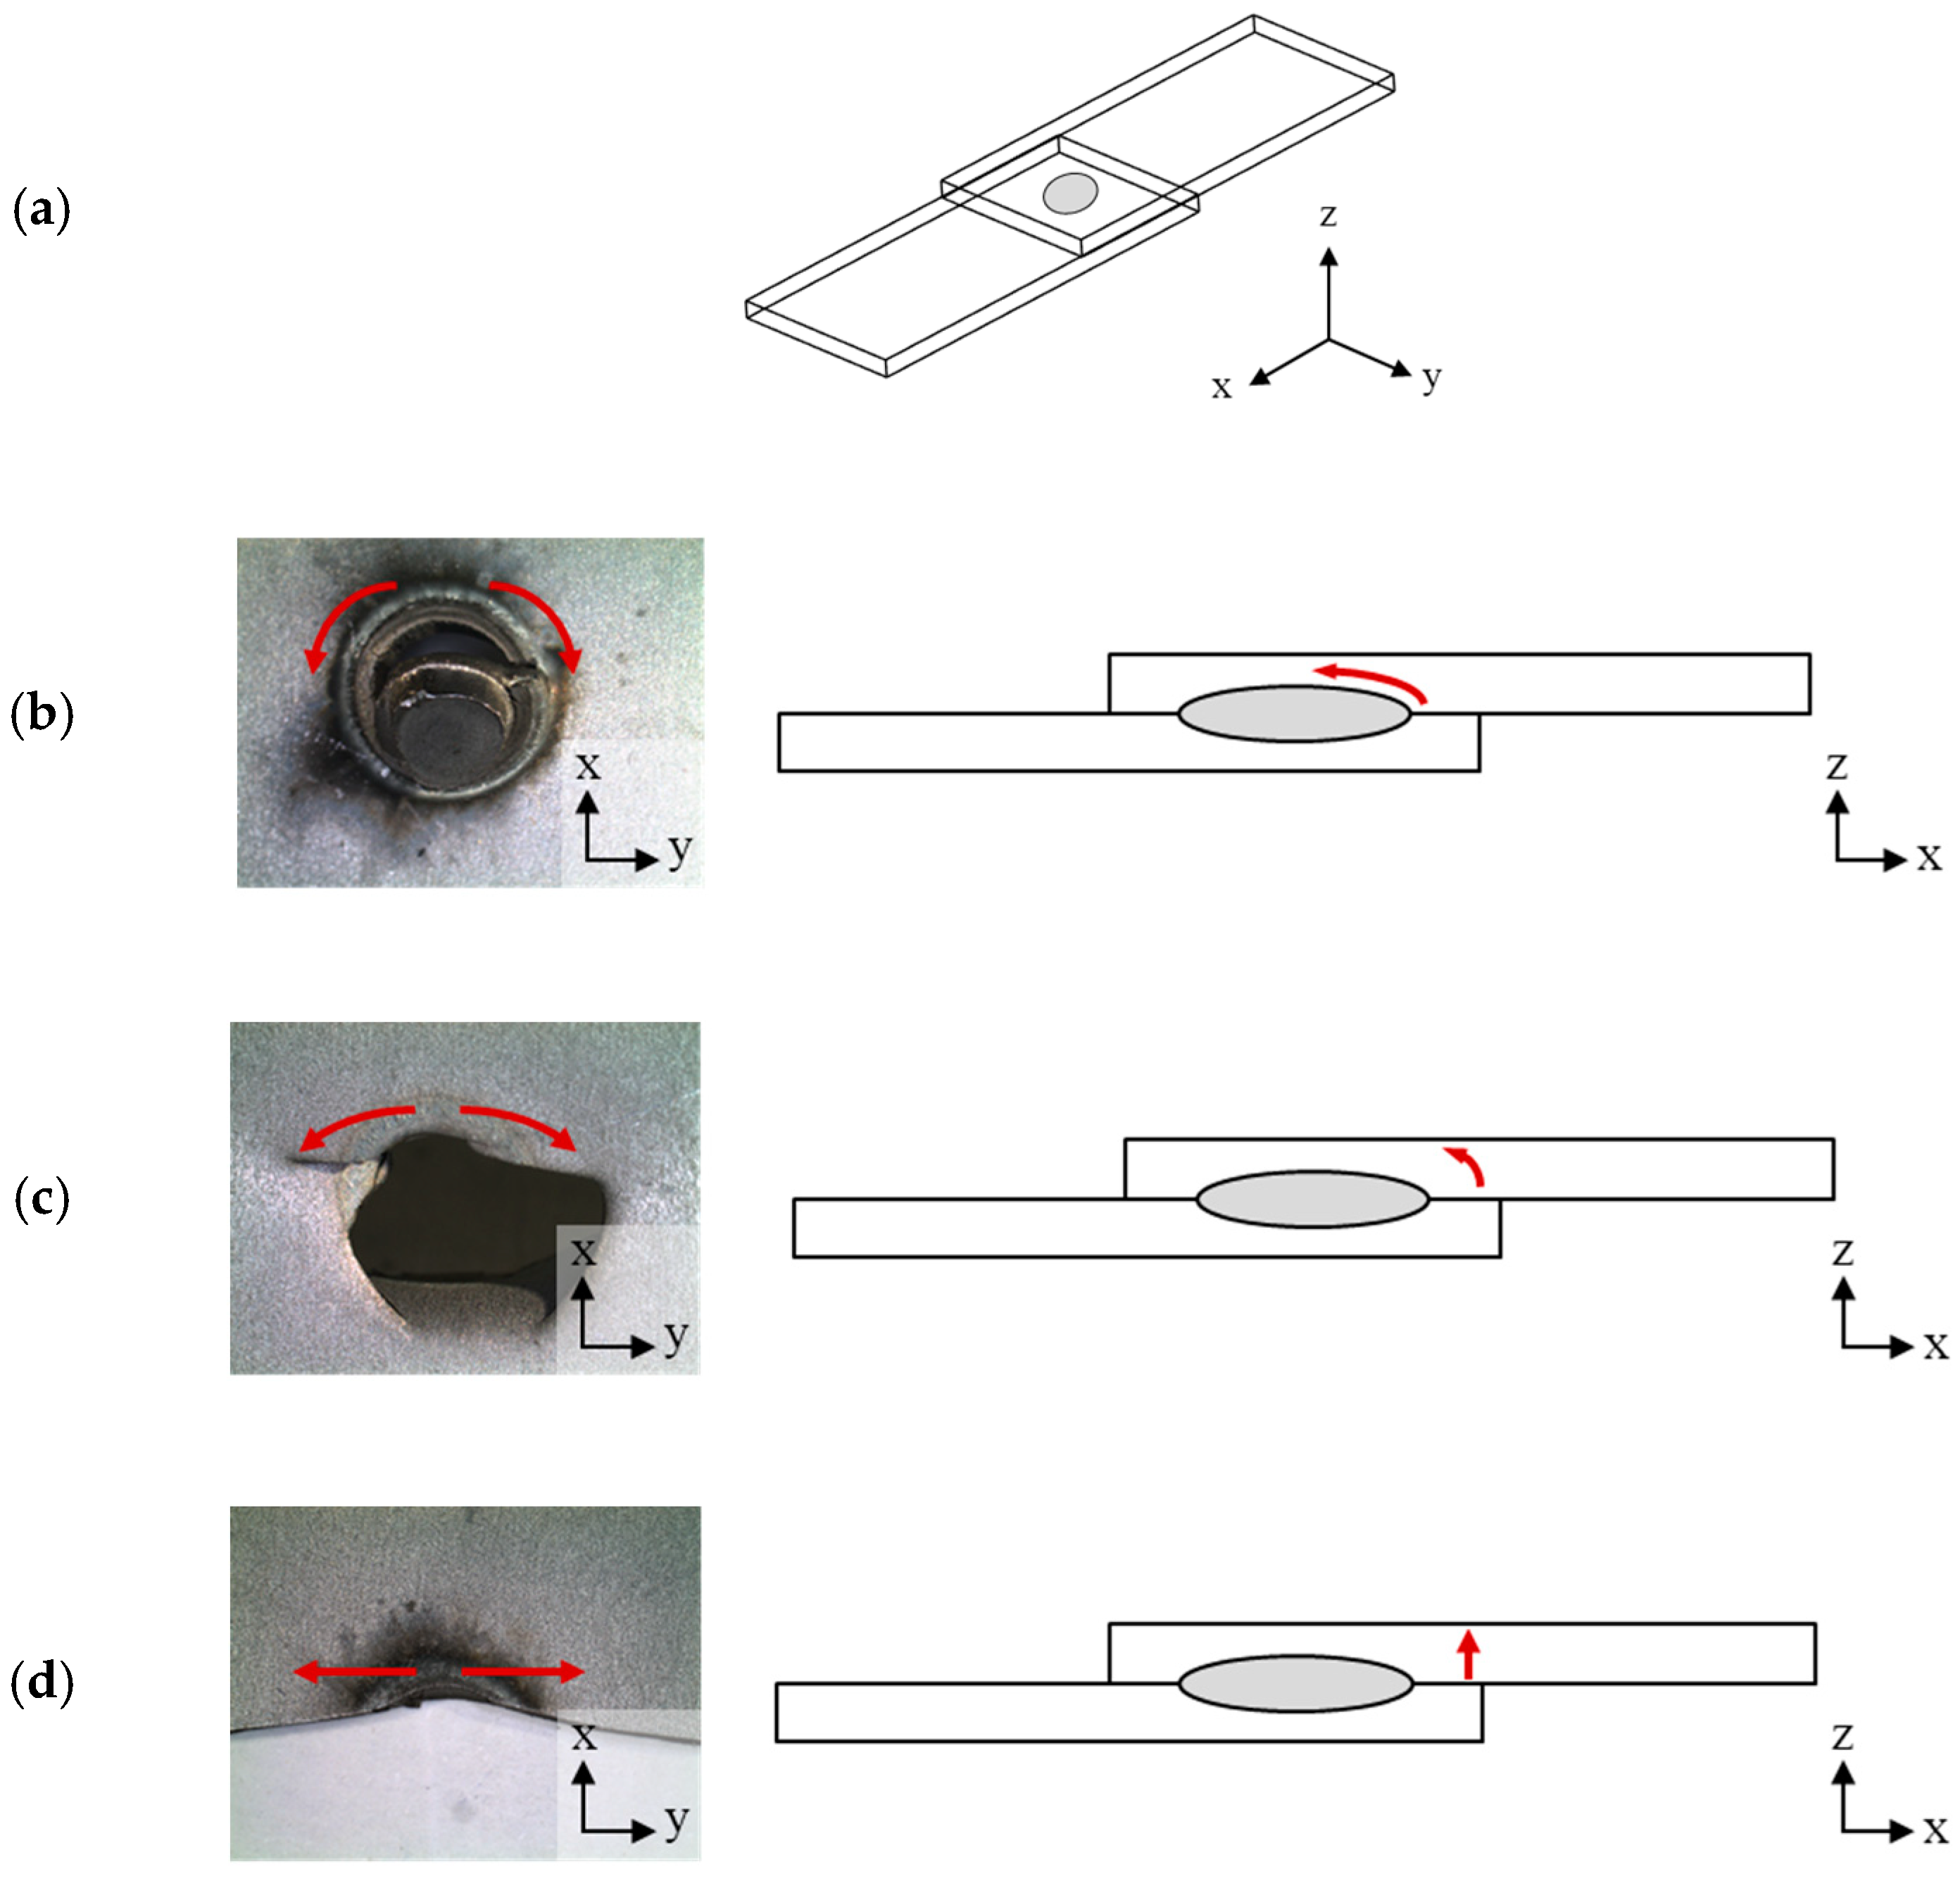
  • Three kinds of failure modes such as pull-out, plug, and HAZ failure occurred according to the fatigue load. In all fracture modes, cracks were initiated at one or several locations in the interfacial and notch regions of the two materials. In fracture surface, striations, cleavage fractures, dimples, and intergranular fractures were observed.
  • The behavior of crack propagation was different in three failure modes. Pull-out failure propagated as the cracks gathered from outside of the nugget to the inside, HAZ failure propagated as the crack propagated outward from the inside of the nugget, and the plug failure propagated with the other two failure modes mixed.

Author Contributions

Conceptualization, M.K. and Y.-M.K.; Formal analysis, H.C. and S.N.; Funding acquisition, M.K.; Investigation, H.C., S.N., and I.H.; Methodology, I.H. and Y.-M.K.; Project administration, M.K.; Supervision, J.H.O., M.K., and Y.-M.K.; Writing—original draft, H.C.; Writing—review and editing, M.K. and Y.-M.K.

Funding

This research was funded by the Technology Innovation Industrial Program funded by the Ministry of Trade, Industry and Energy (MOTIE, Korea) (Development of Car Body Modularization Technology using Advanced Cold Forming and Welding Technologies of Low Density GIGA Grade Light Steel Sheets).

Conflicts of Interest

The authors declare no conflict of interest.

References

  1. Jeanneau, M.; Pichant, P. The trends of steel products in the European automotive industry. Rev. de Métallurgie Int. J. Metall. 2000, 97, 1399–1408. [Google Scholar] [CrossRef]
  2. Smith, B.; Spulber, A.; Modi, S.; Fiorelli, T. Technology Roadmaps: Intelligent Mobility Technology, Materials and Manufacturing Processes, and Light Duty Vehicle Propulsion; Technical Report; Center for Automotive Research: Ann Arbor, MI, USA, 2017. [Google Scholar]
  3. Schultz, R.A. Metallic Material Trends for North American Light Vehicles. Available online: https://www.buildusingsteel.org/~/media/Files/Autosteel/Great%20Designs%20in%20Steel/GDIS%202007/21%20-%20Metallic%20Material%20Trends%20for%20North%20American%20Light%20Vehicles.pdf (accessed on 23 September 2019).
  4. Zhu, X.; Ma, Z.; Wang, L. Current Status of Advanced High Strength Steel for Auto-making and Its Development in Baosteel. Available online: http://www.baosteel.com/english_n/e07technical_n/021702e.pdf (accessed on 23 September 2019).
  5. Sigh, S.; Nanda, T. A Review: Production of third generation advanced high strength steels. Int. J. Sci. Res. Dev. 2014, 2, 388–392. [Google Scholar]
  6. Matlock, D.K.; Speer, J.G. Third generation of AHSS: Microstructure Design Concepts. In Proceedings of the International Conference on Microstructure and Texture in Steels and Other Materials, Jamshedpur, India, 5–7 February 2008; pp. 185–205. [Google Scholar]
  7. Mortimer, J. Jaguar uses X350 car to pioneer use of self-piercing rivets. Ind. Robot. 2001, 28, 192–198. [Google Scholar] [CrossRef]
  8. Pouranvari, M.; Mousavizadeh, S.M.; Marashi, S.P.H.; Goodarzi, M.; Ghorbani, M. Influence of fusion zone size and failure mode on mechanical performance of dissimilar resistance spot welds of AISI 1008 low carbon steel and DP600 advanced high strength steel. Mater. Des. 2011, 32, 1390–1398. [Google Scholar] [CrossRef]
  9. Sun, X.; Stephens, E.V.; Khaleel, M.A. Effects of fusion zone size and failure mode on peak load and energy absorption of advanced high strength steel spot welds under lap shear loading conditions. Eng. Fail. Anal. 2008, 15, 356–367. [Google Scholar] [CrossRef]
  10. Fermér, M.; Svensson, H. Industrial experiences of FE-based fatigue life predictions of welded automotive structures. Fatigue Fract. Eng. Mater. Struct. 2001, 24, 489–500. [Google Scholar]
  11. Rahman, M.M.; Rosli, A.B.; Noor, M.M.; Sani, M.S.M.; Julie, J.M. Effects of spot diameter and sheets thickness on fatigue life of spot welded structure based on FEA approach. Am. J. Appl. Sci. 2009, 6, 137–142. [Google Scholar] [CrossRef]
  12. Vural, M.; Akkuş, A.; Eryürek, B. Effect of welding nugget diameter on the fatigue strength of the resistance spot welded joints of different steel sheets. J. Mater. Process. Technol. 2006, 176, 127–132. [Google Scholar] [CrossRef]
  13. Zhao, D.W.; Wang, Y.X.; Zhang, L.; Zhang, P. Effects of electrode force on microstructure and mechanical behavior of the resistance spot welded DP600 joint. Mater. Des. 2013, 50, 72–77. [Google Scholar] [CrossRef]
  14. Radakovic, D.J.; Tumuluru, M. Predicting resistance spot weld failure modes in shear tension tests of advanced high-strength automotive steels. Weld. J. 2008, 87, 96–105. [Google Scholar]
  15. Chao, Y.J. Ultimate strength and failure mechanism of resistance spot weld subjected to tensile, shear, or combined tensile/shear loads. J. Eng. Mater. Technol. 2003, 125, 125–132. [Google Scholar] [CrossRef]
  16. Wang, B.; Duan, Q.Q.; Yao, G.; Pang, J.C.; Zhang, Z.F.; Wang, L.; Li, X.W. Fatigue fracture behaviour of spot welded B1500HS steel under tensile-shear load. Fatigue Fract. Eng. Mater. Struct. 2015, 38, 914–922. [Google Scholar] [CrossRef]
  17. Gould, J.E.; Khurana, S.P.; Li, T. Predictions of microstructures when welding automotive advanced high-strength steels. Weld. J. 2006, 85, 111–116. [Google Scholar]
  18. Han, Z.; Orozco, J.; Indacochea, J.E.; Chen, C.H. Resistance spot welding: A heat transfer study. Weld. J. 1989, 68, 363–371. [Google Scholar]
  19. Wang, B.; Duan, Q.Q.; Yao, G.; Pang, J.C.; Li, X.W.; Wang, L.; Zhang, Z.F. Investigation on fatigue fracture behaviors of spot welded Q&P980 steel. Int. J. Fatigue 2014, 66, 20–28. [Google Scholar]
  20. Hernandez, V.H.B.; Panda, S.K.; Kuntz, M.L.; Zhou, Y. Nanoindentation and microstructure analysis of resistance spot welded dual phase steel. Mater. Lett. 2010, 64, 207–210. [Google Scholar] [CrossRef]
  21. Safanama, D.S.; Marashi, S.P.H.; Pouranvari, M. Similar and dissimilar resistance spot welding of martensitic advanced high strength steel and low carbon steel: metallurgical characteristics and failure mode transition. Sci. Technol. Weld. Join. 2012, 17, 288–294. [Google Scholar] [CrossRef]
  22. Khan, M.I.; Kuntz, M.L.; Biro, E.; Zhou, Y. Microstructure and Mechanical Properties of Resistance Spot Welded Advanced High Strength Steels. Mater. Trans. 2008, 49, 1629–1637. [Google Scholar] [CrossRef] [Green Version]
  23. Tamizi, M.; Pouranvari, M.; Movahedi, M. Welding metallurgy of martensitic advanced high strength steels during resistance spot welding. Sci. Technol. Weld. Join. 2016, 22, 327–335. [Google Scholar] [CrossRef]
  24. Vural, M.; Akkus, A. On the resistance spot weldability of galvanized interstitial free steel sheets with austenitic stainless steel sheets. J. Mater. Process. Technol. 2004, 153, 1–6. [Google Scholar] [CrossRef]
  25. Alizadeh-Sh, M.; Marashi, S.P.H.; Pouranvari, M. Microstructure–properties relationships in martensitic stainless steel resistance spot welds. Sci. Technol. Weld. Join. 2014, 19, 595–602. [Google Scholar] [CrossRef]
  26. Pouranvari, M.; Asgari, H.R.; Mosavizadch, S.M.; Marashi, P.H.; Goodarzi, M. Effect of weld nugget size on overload failure mode of resistance spot welds. Sci. Technol. Weld. Join. 2007, 12, 217–225. [Google Scholar] [CrossRef]
  27. Kang, C.-Y. Fracture Mechanism and Micro Fractography - Intergranular Fracture and Fracture at High Temperature. J. KWS 2004, 22, 6–8. [Google Scholar]
Figure 1. Schematic images of (a) electrode shape and (b) specimen size.
Metals 09 01086 g001
Figure 2. Cross section images of welded specimen using different electrode face diameters (a) 8 mm, (b) 10 mm.
Metals 09 01086 g002
Figure 3. Fracture shape after tensile test: electrode face diameter of (a) 8 mm, (b) 10 mm.
Metals 09 01086 g003
Figure 4. Vickers hardness profile of welded specimens using the electrodes with different diameters.
Metals 09 01086 g004
Figure 5. Microstructure of (a) base metal (BM), (b) sub-critical heat affected zone (SCHAZ), (c) upper-critical heat affected zone (UCHAZ), and (d) fusion zone (FZ).
Metals 09 01086 g005aMetals 09 01086 g005b
Figure 6. Load-Number of cycles to failure curves of 980 MPa steel spot welded specimens.
Metals 09 01086 g006
Figure 7. Failure modes after fatigue test: (a) pull-out failure, (b) plug failure, and (c) HAZ failure.
Metals 09 01086 g007
Figure 8. Failure shapes with various failure modes at electrode face diameter of 8 mm: (a) pull-out failure, (b) plug failure, and (c) HAZ failure.
Metals 09 01086 g008
Figure 9. (a) Three dimensional schematic diagram indicating specimen. Crack propagation direction (red arrow) with various failure types: (b) pull-out failure, (c) plug failure, and (d) HAZ failure.
Metals 09 01086 g009
Figure 10. (a) Schematic diagram indicating fracture position (red circle) and view direction (black arrow). Fracture surface images with various failure types: (b) pull-out failure, (c) plug failure, and (d) HAZ failure.
Metals 09 01086 g010
Figure 11. Fatigue fracture surface at pull-out failure mode: (a) overall view, (b) occurrence area of intergranular fracture, (c) occurrence area of striation, and (d) occurrence area of cleavage fracture.
Metals 09 01086 g011
Figure 12. Fatigue fracture surface at plug failure mode: (a) overall view, (b) crack initiation area, (c) occurrence area of striation, and (d) crack propagation area.
Metals 09 01086 g012
Figure 13. Fatigue fracture surface at HAZ mode: (a) overall view, (b) crack initiation area, (c) occurrence area of striation, and (d) crack propagation area.
Metals 09 01086 g013
Table 1. Chemical composition (wt.%) of base metal used in this study.
CSiMnFe
0.201.592.50Bal.
Table 2. Mechanical properties of base metal used in this study.
Ultimate Tensile Strength (MPa)Total Elongation (%)
102121
Table 3. Resistance spot welding conditions used in this study.
ParametersCondition 1Condition 2
Electrode face diameter (mm)810
Electrode force (kN)33
Welding current (kA)67
Welding time (ms)417417
Holding time (ms)167167
Table 4. Effect of welding conditions on specimen properties: Nugget size, tensile shear strength, and failure mode.
Electrode Face Diameter8 mm10 mm
Nugget size5.1 mm5.7 mm
Tensile shear strength12.5 kN15.5 kN
Failure modePull-out failurePull-out failure
Table 5. Fatigue failure modes of welds with electrode face diameters of 8 mm and 10 mm according to the fatigue load.
Load (kN)Electrode Face Diameter
8 mm10 mm
1--
2HAZ failure-
3HAZ failureHAZ failure
4HAZ failureHAZ failure
5Plug failurePlug failure
6Plug failurePlug failure
7Pull-out failurePlug failure
8Pull-out failurePlug failure

