Article

Market Commonality and Competition in Communities—An Empirical Study Based on Bidding Data of the Construction Market

School of Management Science and Real Estate, Chongqing University, Chongqing 400045, China
*
Author to whom correspondence should be addressed.
Buildings 2021, 11(10), 435; https://doi.org/10.3390/buildings11100435
Submission received: 18 August 2021 / Revised: 16 September 2021 / Accepted: 21 September 2021 / Published: 26 September 2021
(This article belongs to the Section Construction Management, and Computers & Digitization)

Abstract

:
In contrast to traditional enterprise rivalry, the construction market competition is irregular on the surface due to the randomization of client targets and the one-time competition organization, which conflicts with construction businesses’ perceptions of the nature and future trend of rivalry. Therefore, contractors urgently need to accurately understand the competitive environment in which they will operate. In construction, few empirical studies exist on competitive environments from the standpoint of enterprise-to-enterprise competitive interactions. Based on market commonality, several hypotheses concerning the competitive pattern of the construction market have been proposed. To test these, a model of competing relationship networks is created using 7402 bid-winner notices for construction projects in Chongqing, China, from 2015 to 2018, followed by quantitative analysis and discussion of the model’s characteristic features. The findings suggest that there is a “community-type” rivalry in the building market, which represents the essential characteristics of market commonality. The research shows that the competitive action of construction enterprises is affected by construction technology, industrial division of labor and regional markets, and the competitive relationship between them tends to be “strong-strong”. This study reveals that the “community” competitive relationship in the construction industry may be a unique phenomenon, expands the application and development of market commonality and enterprise clusters in the construction economy, and provides theoretical guidance for construction enterprises to accurately recognize competitive behavior and decision making.

1. Introduction

In a market setting where competition is vital, every firm is seeking to thrive in a market full of competitors [1]. Competitive corporations maintain their market position and dispatch weak competitors via market competition. With different growth and seasonality patterns, Airbnb has expanded a new market in the traditionally highly competitive Paris hotel industry, which didn’t trigger direct competition with hotels [2]. Toyota focuses on small-scale products and boosts their production in order to shape cost advantages and adapt to consumer market segmentation requirements [3]. Pepsi and Coca-Cola compete in homogeneity, but they strive to differentiate in terms of product promotion and marketing channels [4]. These competitions occur across industries, but similarities in relatively stable target customers, supply chains, manufacturing chains, and competition patterns exist [5], which predictably creates a competitive environment, with competitors, competitive behavior, and competitive methods as elements.
Construction businesses compete in a different way than businesses that produce consumer items. The former is based on a customer’s unique request for a building product or service [6], whereas the latter is based on mass manufacturing and uniform operation. Three basic questions challenge construction companies frequently: What are your options for competition? Who are your rivals? What is the best way to win the contest? The global industrial chain and supply chain have been reformed, competitive products have grown more flexible, and the competitive frontiers of firms have grown blurred since the beginning of the 21st century. In many nations, strong competition has compelled local construction firms to investigate and compete in the international construction industry [7]. As information exchange technology advances, a broader market for service outsourcing develops, firms gain more integrable competitive resources and opportunities for engagement in non-core business competitiveness [8]. It is more difficult than ever for construction companies to answer these three basic questions.
Academic circles have examined the competitive characteristics of construction firms from a variety of angles. To illustrate, some analysts emphasize the importance of experience and intuition in construction firms’ competitive decision making, which implies that timing and goals are evidently subjective [9]. Additionally, some scholars have noted that while construction firms should aim for competitive markets with their products and services [10], their survival is contingent upon business needs, project profitability, clients, engineering consultants, and enterprise competitiveness [11]. There are also studies that link the construction market’s specific competitive environment to competitive decision making, arguing for proper consideration of the distinctions between bid/no-bid and mark-up decisions [6,12]. When making BNB decisions, decision makers consider the enterprise’s size, categorization, and client type [13], and then choose one of three mark-up strategies: cost-based, competition-based, or customer-based [14]. Besides, several novel measuring techniques were proposed to objectively assess the market environment, such as concentration, entropy, Gini coefficient, and the Herfindahl-Hirschman index [15].
Enterprise competition is an age-old economic problem. The theoretical system of enterprise competition has a rich and diverse knowledge base as a result of scholars’ sustained efforts, and the theoretical system of enterprise competition’s decision making, competitive process, and competitive intensity expertly guides contractors in carrying out competitive activities. However, as previously stated, the existing theory does not adequately address the three fundamental problems concerning construction enterprise competitiveness, most notably a dearth of actual research based on competitive interaction. When examining the competitive environment and competitive strategies available to construction firms, the analytical paradigm of general business rivalry is constrained by the demand for data accessibility and universality of outcomes.
To compensate for the existing academic gap, this study analyzed the competition data of Chongqing construction businesses and discovered that construction market competitiveness is defined by an organizational form characterized by “communities”. If new entrants do not pay attention to this trait, they will experience competition failure or incur large competitive costs. The novel results in the enterprise economy and management discipline discussed in this paper will assist construction firms in rethinking the market competition environment, improving their understanding of market competition laws, and identifying adequate competition space.

2. Literature Review

2.1. Competition in the Construction Market

Enterprise competition theory can be constructed from both process and state perspectives [16]. The competitive environment, according to state theory, is defined as the aggregate performance of competitive outcomes. According to Ye, Lu [17], tools such as the Herfindahl index, Gini coefficient, and entropy can be used to quantify the state of the international construction market and its competitive trend. Said and Bartusiak [18] discovered that the competition between local and non-local construction firms is asymmetrical after calculating concentration, launch rate, enterprise share, enterprise survival, enterprise development scale, and other indicators of the industrial housing market.
In the Canadian construction market, studies have shown that the number of bids and contracts fluctuates seasonally, and the smaller the project amount, the more fellows [19]. In China, sizeable state-owned construction enterprises dominate the market competition, which is reflected in the ratio of the quantity and proportion of contracts [20]. On the contrary, in Australia [21], Portugal [22], and the United States, small and medium-sized construction enterprises have a much broader survival space. Scholars also found that the phenomenon of the clustering of international construction enterprises, in which European construction enterprises were concentrated in Europe, was a form of competition that Asian construction enterprises rarely participated in [7].
Scholars also advocate the use of process theory to explain the meaning of competition in construction enterprises, and argue that competitive interactivity and dynamic evolution deserve more attention from enterprises. The competition of construction enterprises is mainly embodied in the bidding process, which is characterized by phased interaction, time-limited preparation, and centralized bidding [6]. In competitive decision making, construction enterprises should carefully evaluate the enterprise’s resource reserves, strategic development needs, competitors, and other factors, which does not exclude the fact that the enterprise may abandon the bidding opportunity because the evaluation results are adverse [23]. The changing environment of the construction market competition is partly caused by the interactions of competitors [24], which simultaneously forms the basis of enterprise bidding decisions [25]. Construction firms compete with the goal of winning contracts [26,27], and quotations are characterized by obvious randomness [28]. The fierce competition in the market causes enterprises to realize that it is difficult to win only by means of low costs, and that they can not substantially respond to the owners’ demands in the future [29,30]. The market position of enterprises changes with each bid, and the competitive boundaries become more open as a result of business activity [18,19]. In a word, the competition of construction enterprises is a complex, dynamic, and circular feedback process [9,31].

2.2. Market Commonality

The concentration of highly specialized skills, knowledge, institutions, competitors, related businesses, and mature customers provides the possibility for enterprises to maintain a sustainable competitive advantage [32], and thus the phenomenon of “market commonality” occurs. As a core concept of competitive dynamics, market commonality refers to the overlapping space of competitors in the market, which acts as the main driving force of enterprise competition [33] and the logical starting point of dynamic competitive strategy [34]. In competitive dynamics, market commonality mirrors the relative position and competitive relationship of competitors [35]. The MC–RS framework, which is made up of market commonality and resource similarity, predicts how companies interact effectively with their rivals [33]. In practice, market commonality theory operates appropriately in the management of competitor identification and prediction [35,36], the measurement of enterprise competition willingness [37], and the maintenance of enterprise relationships [38].

2.3. The Theory of Industrial Clusters

In industrial economics, the commonality of the market implies industrial clusters. Influenced by the competitive landscape and market maturity, industrial clusters widely survive in developed economies [32,39]. Michael Porter defines industrial clusters as “interrelated companies and institutions with geographical concentration in specific areas” [32]. Regardless of the choice of vertical cluster or horizontal cluster of the industrial chain, industrial clusters are oriented to improve the competitiveness of enterprises [40]. IT companies in Silicon Valley, the Italian fashion industry, and the German as well as Dutch chemical industry use the horizontal cluster model of the industry chain to promote the rapid development of the industry. As a cluster phenomenon in the field of market competition, a competitor cluster is an external form of competitor–consumer interaction, a result of fierce competition and closing to cooperation [39]. Clusters are not uniform; mutual distrust, excessive competition, and differentiated competition will make competitor clusters border their limits [41].
Similarly, in construction market competition, market convergence and industrial clusters exist. According to the AMC (awareness–motivation–capability) analysis model [35], the foundation of market commonality is comprised of competitors’ motivational, resource, and strategic commonality, all of which apply to the construction industry. In the construction industry, where information is scarce and times are competitive, it is difficult for businesses to accurately identify and forecast competitor behavior [6]. However, the similarity between customer demand and business resources enables enterprises to address these issues [20,42]. Additionally, the construction market’s overall characteristics imply the existence and influence of market commonality. When the enterprise market space overlaps, a number of external factors such as geographical location, product service, and customer base dominate the competitive behavior of construction enterprises [36,42], and a commonality then emerges that corresponds to the overall characteristics of the construction market competition [43]. The previous theoretical analysis implies that, as contractors have similar competitive codes, empirical study on contractor rivalry and interaction will establish the existence of commonality in the construction industry, which will dispel the myth of random competition and enrich the understanding of the competitive pattern of the industry.

3. Hypotheses

Obtained from market commonality, the competition of construction enterprises occurs in a specific group, and the commonality of enterprise resources, service objects, competitive products and competitive means drives the enterprises to streams of actions [33,35]. According to the principle of industrial clusters, the phenomenon of members gathering together for some reason is a “cluster” [39,44], put differently, a “community” in social networks [45]. There are many visible organizations in the construction industry, such as trade associations, bidding rings, and group companies [46], in which enterprises have similar realistic backgrounds and behavior patterns. Construction enterprises’ competition is aimed at the project contracts designated by the owners, operate mainly in the way of “the bottom price winning a bid”, limited by the enterprise qualification, and it is the owners who ask all of these [47]. From the perspective of market commonality, the construction market will have a “community-style” competitive relationship. Therefore, a first hypothesis is presented in this paper.
Hypothesis 1 (H1).
There is a “community” competitive relationship in the construction market.
As the mainstream organizational form of competition in the construction market, communities may include a given competitive behavior or not. It takes time to foment the core competitiveness of enterprises, since the constraints of resources, technology, ability, and the scope of competition of construction enterprises are difficult to change frequently [48]. The limited scope of competition makes the competitors of a given enterprise stable in fixed groups, which are similar in enterprise size and business expertise [49]. Therefore, a second hypothesis is put forward.
Hypothesis 2 (H2).
Competition of construction firms mainly occurs within the community.
Within the community, the more times a business bids, the more it knows about the rivals’ identities, strategies, and intentions. This kind of competitive relationship with nearly complete information guides enterprises who are looking for bids to form object dependence [42]. Except for a few large and experienced enterprises, most construction enterprises can only compete within a settled community [20]. Within the community, competitors may also come to an invisible consensus that a particular competitor is preempted to win the bid, creating a competitive illusion [50]. Therefore, the more enterprises that bid, the more understanding of the rivals will be achieved, and it becomes more likely that enterprises’ competitive actions will be limited to the settled community. Then, a third hypothesis is put forward in this paper.
Hypothesis 3 (H3).
The more times a contractor bids, the more focused its competitive relationship is.
The result of bidding is closely related to the survival and development of construction enterprises [51]. It is generally believed that the competitiveness of enterprises is limited, and the number of times they can win bids is limited. That is, the more bids there are, the lower the probability of winning the bid. However, in the community relationship supported by market commonality, the more times a firm bids, the more opportunities there is to enhance the understanding of similar competitors through a “trial and error” method. Then, they will adjust the competitive quotation and competitive strategy in due course [29]. This kind of decision making, based on experience and learning, can help enterprises with limited information and time to make a decision on whether to bid or not and improve their hit rate. Therefore, a fourth hypothesis is presented:
Hypothesis 4 (H4).
Within the community, the more bids an enterprise has, the greater the probability of winning the bid.

4. Methodology

4.1. The Materials

Chongqing’s regional construction market is one of the fastest growing in China. The construction sector’s output value increased from $76.97 billion in 2013 to $131.69 billion in 2020. Its growth rate and volume are remarkable, indicating the emergence of China’s domestic construction markets. In China, it is the government’s website through which the government announces public projects, including the project’s name, districts and counties, three prospective bidders, the winning bid price, and the project’s duration. From March 2015 to August 2018, a total of 7402 public project bids in Chongqing were collected, involving 3088 contractors. The types of construction projects included public buildings (36%), municipal road constructions (22%), engineering designs (9%), EPCs (16%), management consultations (14%) and industrial projects (3%).
It is acceptable that only three candidates will be treated as research materials out of dozens of bidders. On the one hand, in many mature markets characterized by competition and innovation, such as information technology, batteries, and jeans, three market leaders are frequently followed by smaller competitors. This is referred to as “The Rule of Three” [52]. On the other hand, each bidding round resulted in the exit of a few to dozens of genuine competitors. However, only three of them are eligible to appear on board following an evaluation. The competition between them is the focal point and true reflection of the competition network that underpins each bid. Contractors are represented by vertices, and their antagonistic relationship is described by lines. The three contractors identified in each bidding announcement are connected, resulting in the formation of a triangular competitive network. Of these networks, 7402 are superimposed to create a simplified relationship network that reflects the competitive environment during a given time period. Because competition is interconnected and repeatable, this network’s competition line is undirected and weighted.

4.2. Measures

4.2.1. A Community Detection Model

The existence of communities in the construction market competition depends on the suitability of community detecting. Generally speaking, there are many algorithms for community detection, such as LPA, TopGC, SLPA [53], etc. The Louvain algorithm used in this study is based on a modular greedy heuristic algorithm, has a good effect on dot-multilateral network graph clustering, avoids missing small associations, and does not need to preset the number of societies [54]. Modularity Q can be defined as an expression, as in the following example [45]:
Q = 1 2 m i , j [ ω i , j s i · s j 2 m ] δ ( c i , c j ) δ ( μ , ν ) = { 1   w h e n   μ = = ν 0   e l s e
where m is the total number of lines, which is the total number of times of competition in the market. c i and c j are communities to which vertices i and j belong. ω i , j is the value of the line between vertices i and j, which is the number of repeated instances of competition between contractors i and j. s i is the vertex weight of vertex i, which is the number of times the contractor i has participated in the competition. s i is defined as:
s i = j N i ω i , j
N i is the aggregation of adjacent vertices, which is the aggregation of contractors competing with contractor i.
The Louvain algorithm initially takes each vertex as a community, merges each vertex with its adjacent vertices in turn, and calculates whether their modularity Q varies more than 0. If it is greater than 0, the vertex is placed into the community where the neighbor is located, and then iterated until the communities do not change. Then, the communities are treated as a vertex and iterate the modularity until it does not change. The observation of the distribution of competition relationships inside and outside the community involves the network position of both competitors. The most direct way is to test whether two competitors in each competition relationship belong to the same community. Based on the results of the previous community classification, vertices are classified into respective communities. By checking whether the two nodes belong to the same community number, the co-occurrence probability P ( c i , c j ) is calculated. The definitions are as follows:
P ( c i , c j ) = i , j δ ( c i , c j ) m

4.2.2. Distribution of Bidding Frequency

With the growth of contractors’ size, competition has shifted from project-centered to rival-centered [11], and large contractors will use more competition methods such as mergers and acquisitions [55]. These phenomena imply that, with more and more competition, it is not random that mature contractors launch a competition, but that they should have a certain directivity. This speculation requires an analysis of the correlation between new competition relationships and new competitors, which means relevance between new lines and new vertices. This analysis can be made from the perspective of a line or vertex. From the perspective of a line, a classical method is to test the correlation between the line weight and the product of the degree of the vertices on the line [56].
ω i , j ~ ( k i · k j ) θ
where degree k i indicates the number of vertices connected with vertex i in the network, that is, the number of neighbors competing with contractor i. If there is a correlation between the two, it shows that with the increase in the number of competitions between the two contractors, the network will be more likely to attract new contractors to participate in it, which is called topological characteristics.
From the view of a vertex, the distribution of bidding frequency is valuable to discuss, i.e., the distribution of line weights. The following formula can be used to calculate the discrete coefficient Y i   of the line weight distribution [57].
Y i = j N i   [ ω i , j s i ] 2
This index has the advantage of observing the discreteness of the line weights of high-degree vertices, that is, whether competitors are stable or random for a contractor who frequently bids. The greater the dispersion coefficient, the more concentrated the competition relationship. On the other hand, the lower the dispersion coefficient, the more dispersed the signal is.

4.2.3. Prediction Model of Winning Bid Number

The more tenders submitted, the more experience accumulated, and the better the understanding of market demand, competitors, and the industrial development environment is, the more successful constructors are. As a result, the number of successful bids should be positively correlated with the total number of bids. Otherwise, contractors will give up the opportunity because they are not motivated confidently.
Variable n i is defined as the number of times the contractor wins the bid. Regression analysis was carried out with s i as the independent variable and n i as the dependent variable. The expression of n i is as follows:
n i = f ( s i )

5. Data Analysis

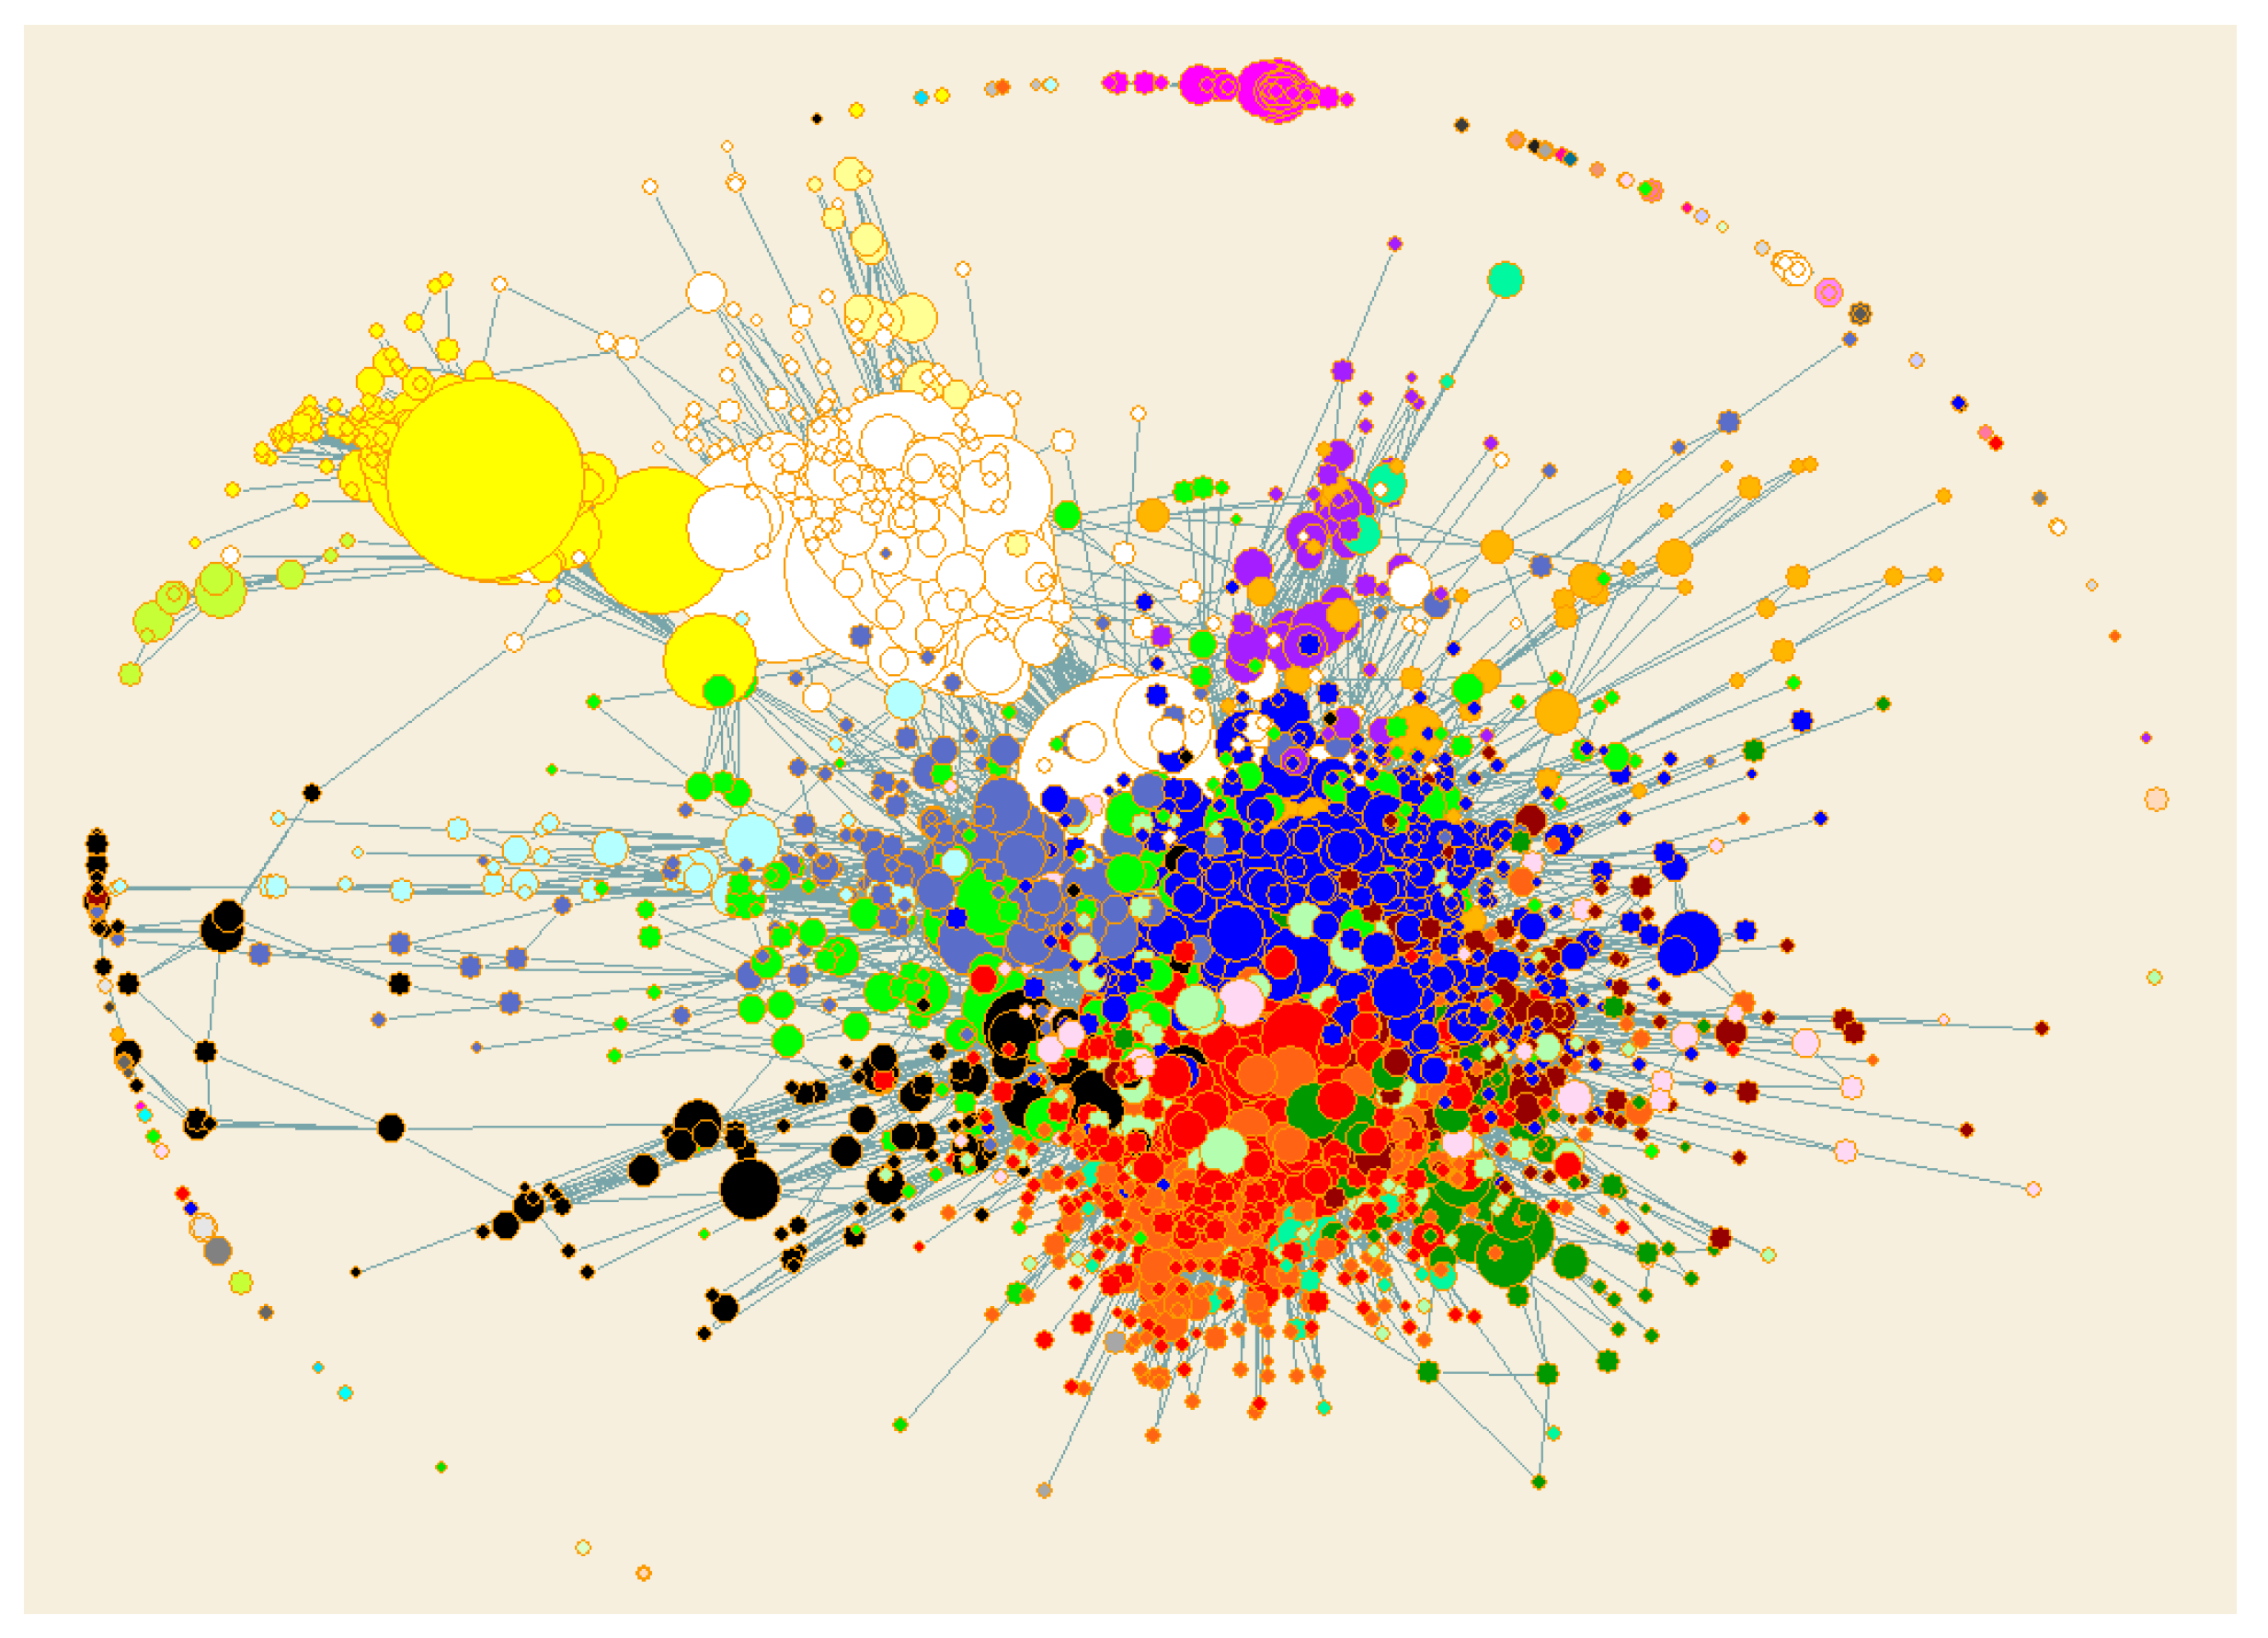
5.1. Community Detection

Figure 1 shows the results of community detection. This network diagram includes 3349 contractors, and the size of nodes corresponds to the cumulative competition times of them, i.e., vertices weights. Different colors indicate different communities that contractors belong to. Figure 1 includes a leading competitive network (middle area) composed of 3088 firms, eight specialized markets (including elevator, electromechanical, railway, PPP projects, waterproofing, etc.), and local markets with small network sizes. The others are clusters of contractors with only one or two occurrences at the periphery of the market.
The total number of detected communities was 87, of which 21 contained 93.97% of the contractors in the network. The remaining 6% only appeared once or twice, distributed in some independent and small-scale communities composed of two to five firms. The relationship between contractors within each community is stronger than that outside of them. Among them, 984 construction firms are the largest, accounting for 31.87% of all contractors. The second largest community consists of 361 construction firms, accounting for 11.69%. The third and fourth are composed of 110 construction firms and 53 design firms, respectively. Figure 1 proves that the competition relationship in the construction market is gathering. The communities not only exist, but also show hierarchical differences in scale.
Based on the communities that have been detected, we tested whether each competitive relationship takes place within the same community, i.e., whether the enterprises at both ends of each line belong to the same community. The results showed that 75.87% of them occur within the same community. Therefore, Hypothesis 1 and Hypothesis 2 are valid.

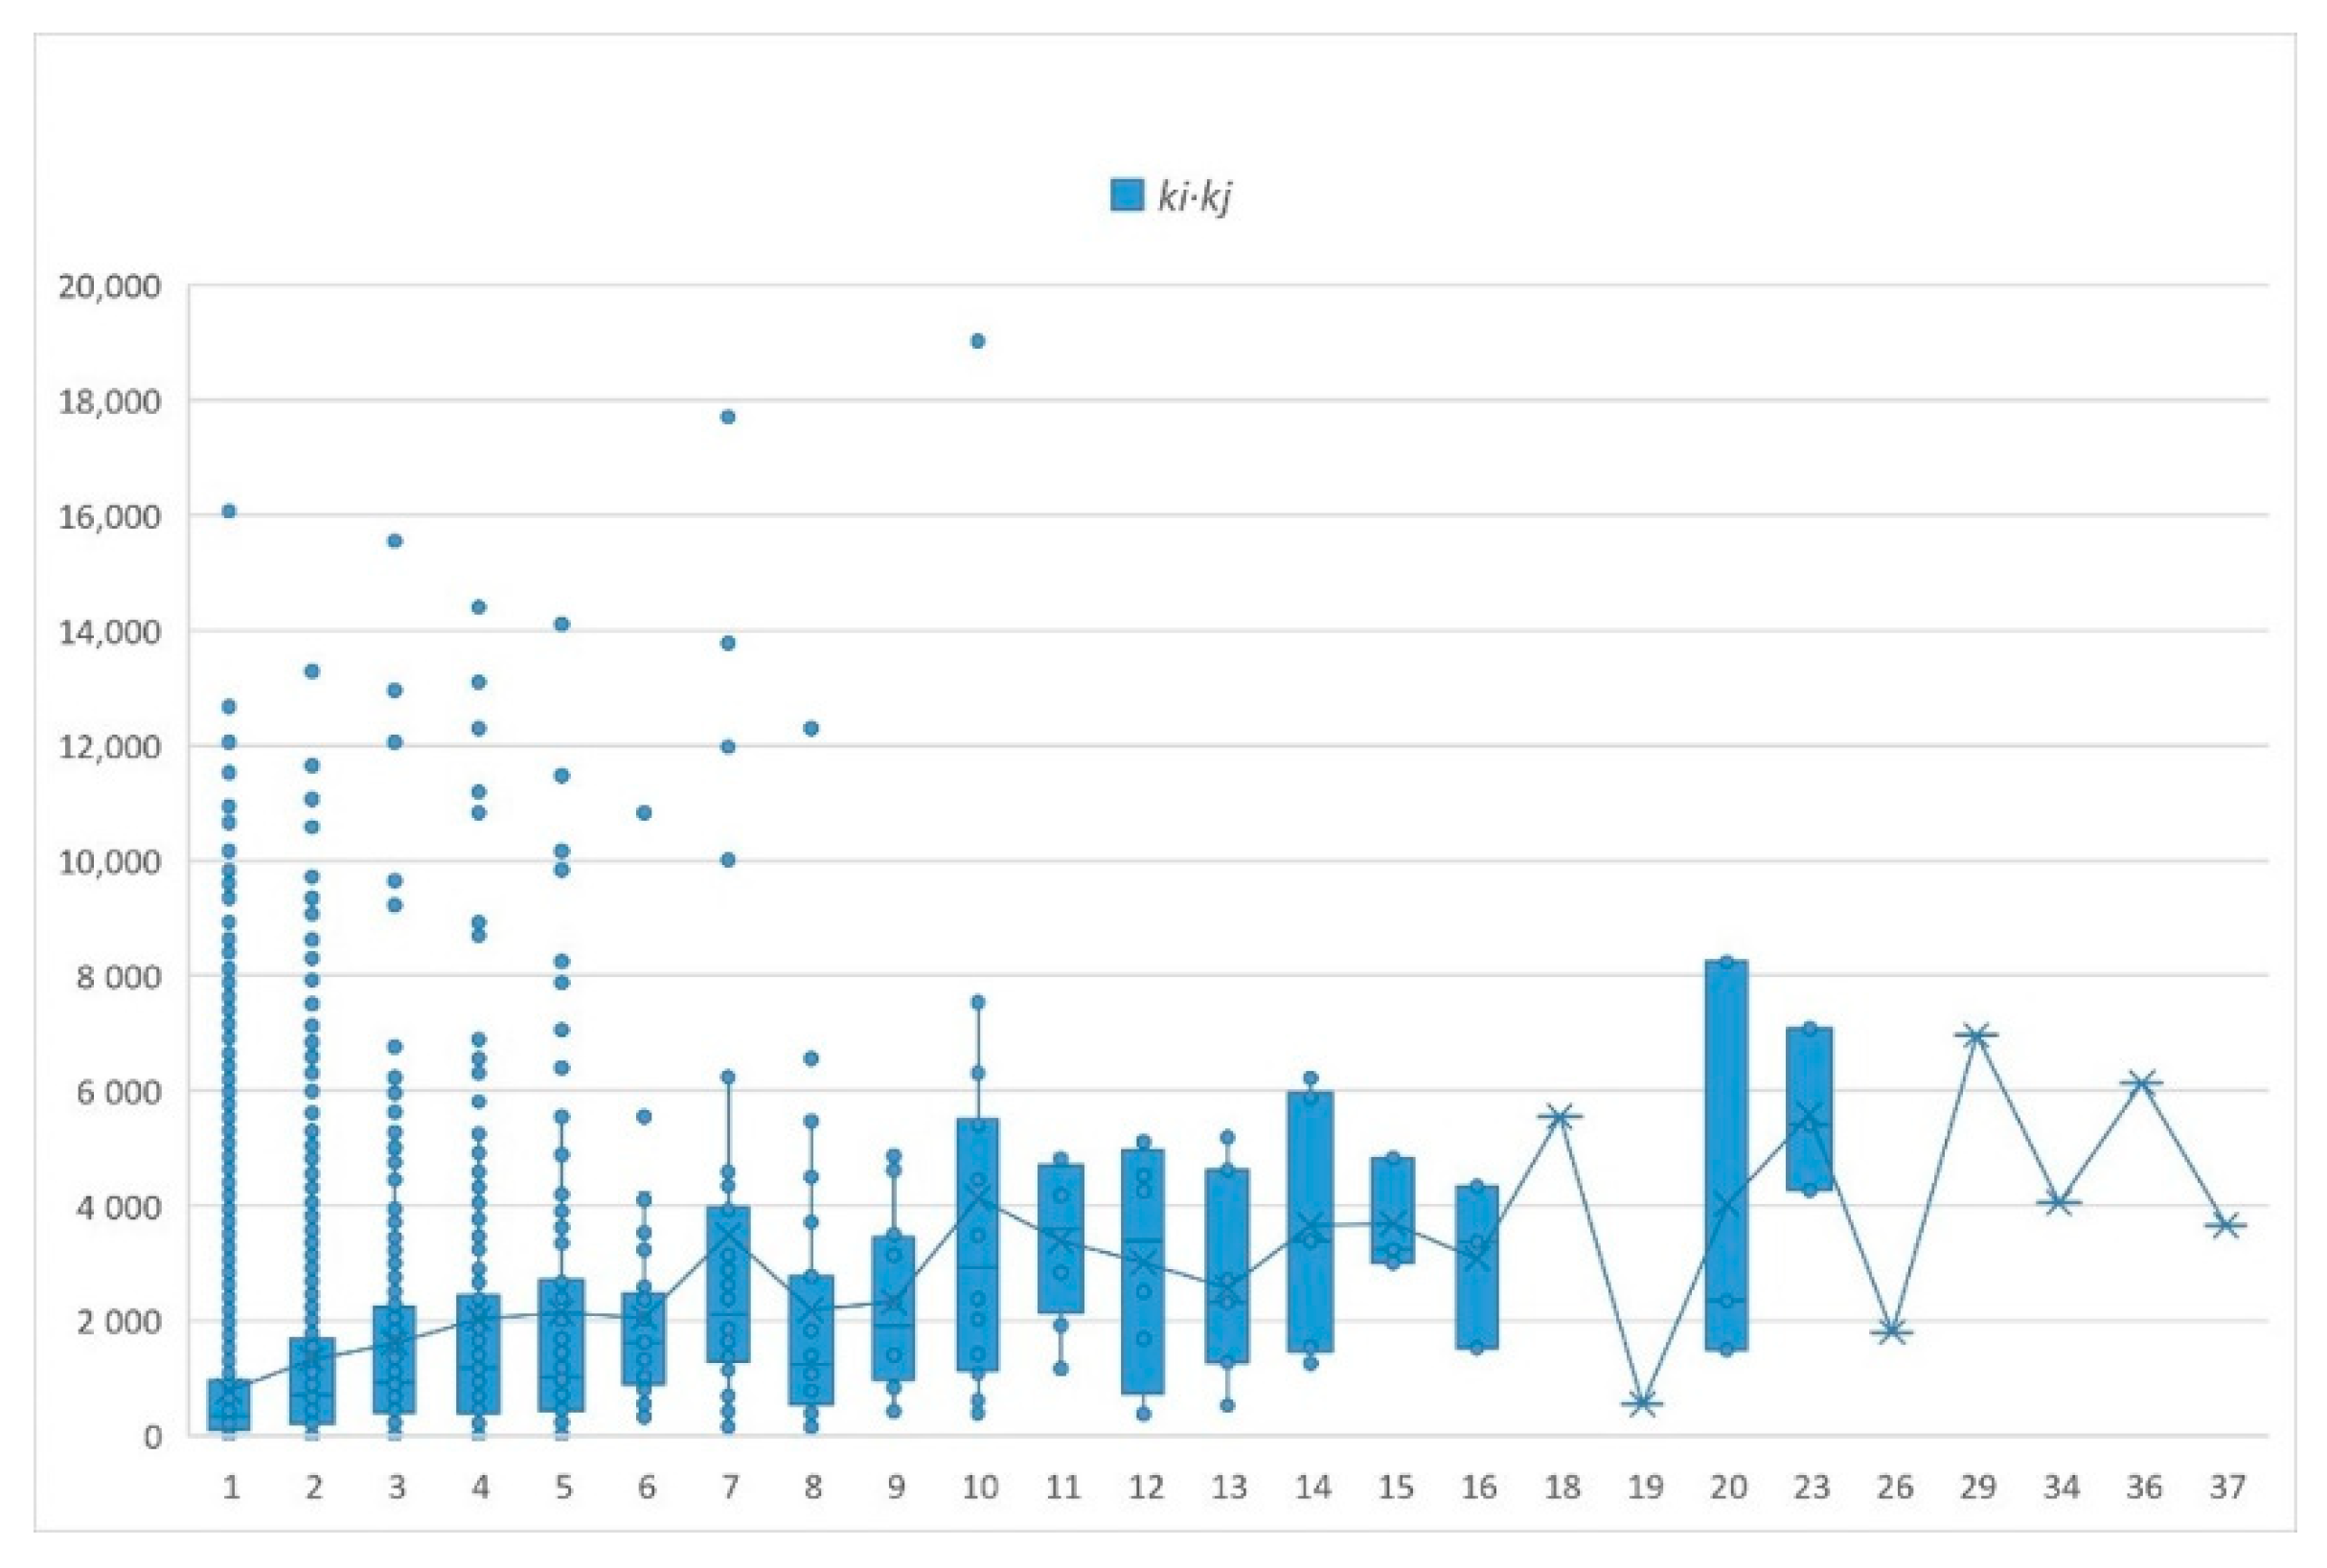
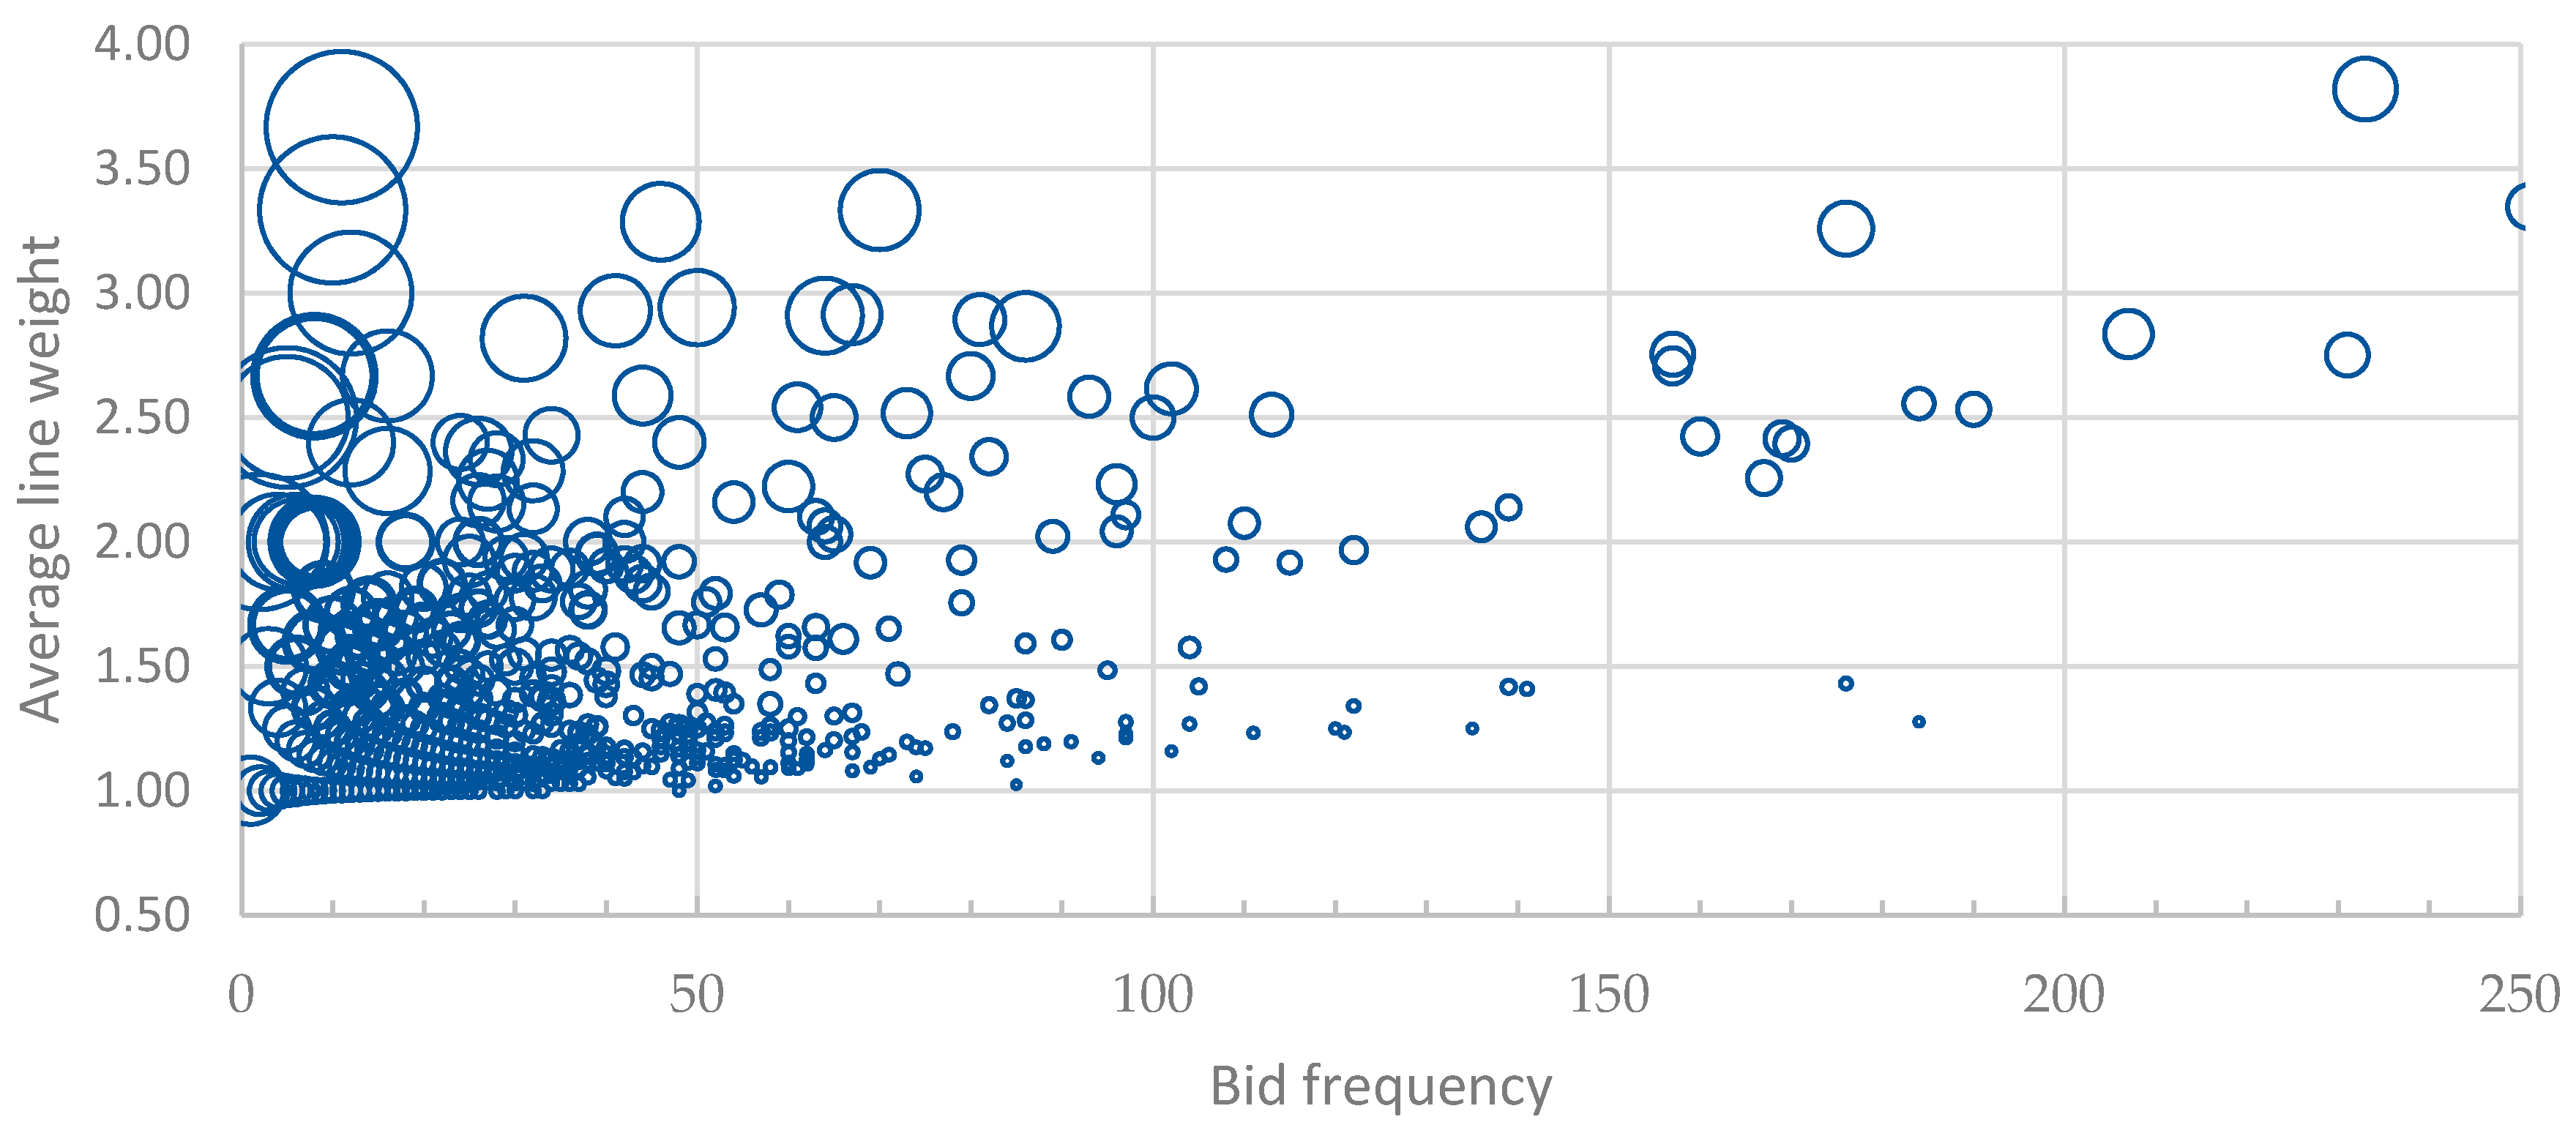
5.2. Distribution of Bidding Frequency

According to Barrat’s [55] formula, the correlation coefficient in this example is 0.219. It can be considered that there is no significant correlation between w i j and k i k j . From the lower and upper quartiles in the box plot in Figure 2, the following speculation can be made. With the increase in bidding frequency between two competitors, new competitors continuously join the competition network of the two competitors. However, this trend did not continue. After bidding frequency between two contractors reaches nearly seven times, the increase in number of new competitors tends to fluctuate, and k i k j starts to disperse.
The results of the analysis based on Almass’s formula are depicted in Figure 3. The horizontal axis in the table represents the number of times a contractor bid, while the vertical axis represents the average number of times a contractor issued a competition relationship. The vertices’ radius is equal to the discrete coefficient. The larger the radius, the more uneven the distribution of the number of bids. For this contractor, a large number of bids occurred with a few competitors. On the contrary, a smaller radius means that the contractors’ bidding times are evenly distributed in its competitive network. Figure 3 demonstrates two interesting phenomena. Firstly, certain comparable contractors have a higher average line weight and discrete coefficient than others in each interval group in the table. Secondly, on average, as bid times increase, the average line weight increases and the discrete coefficient approaches the median value. To summarize, Hypothesis 3 is true.

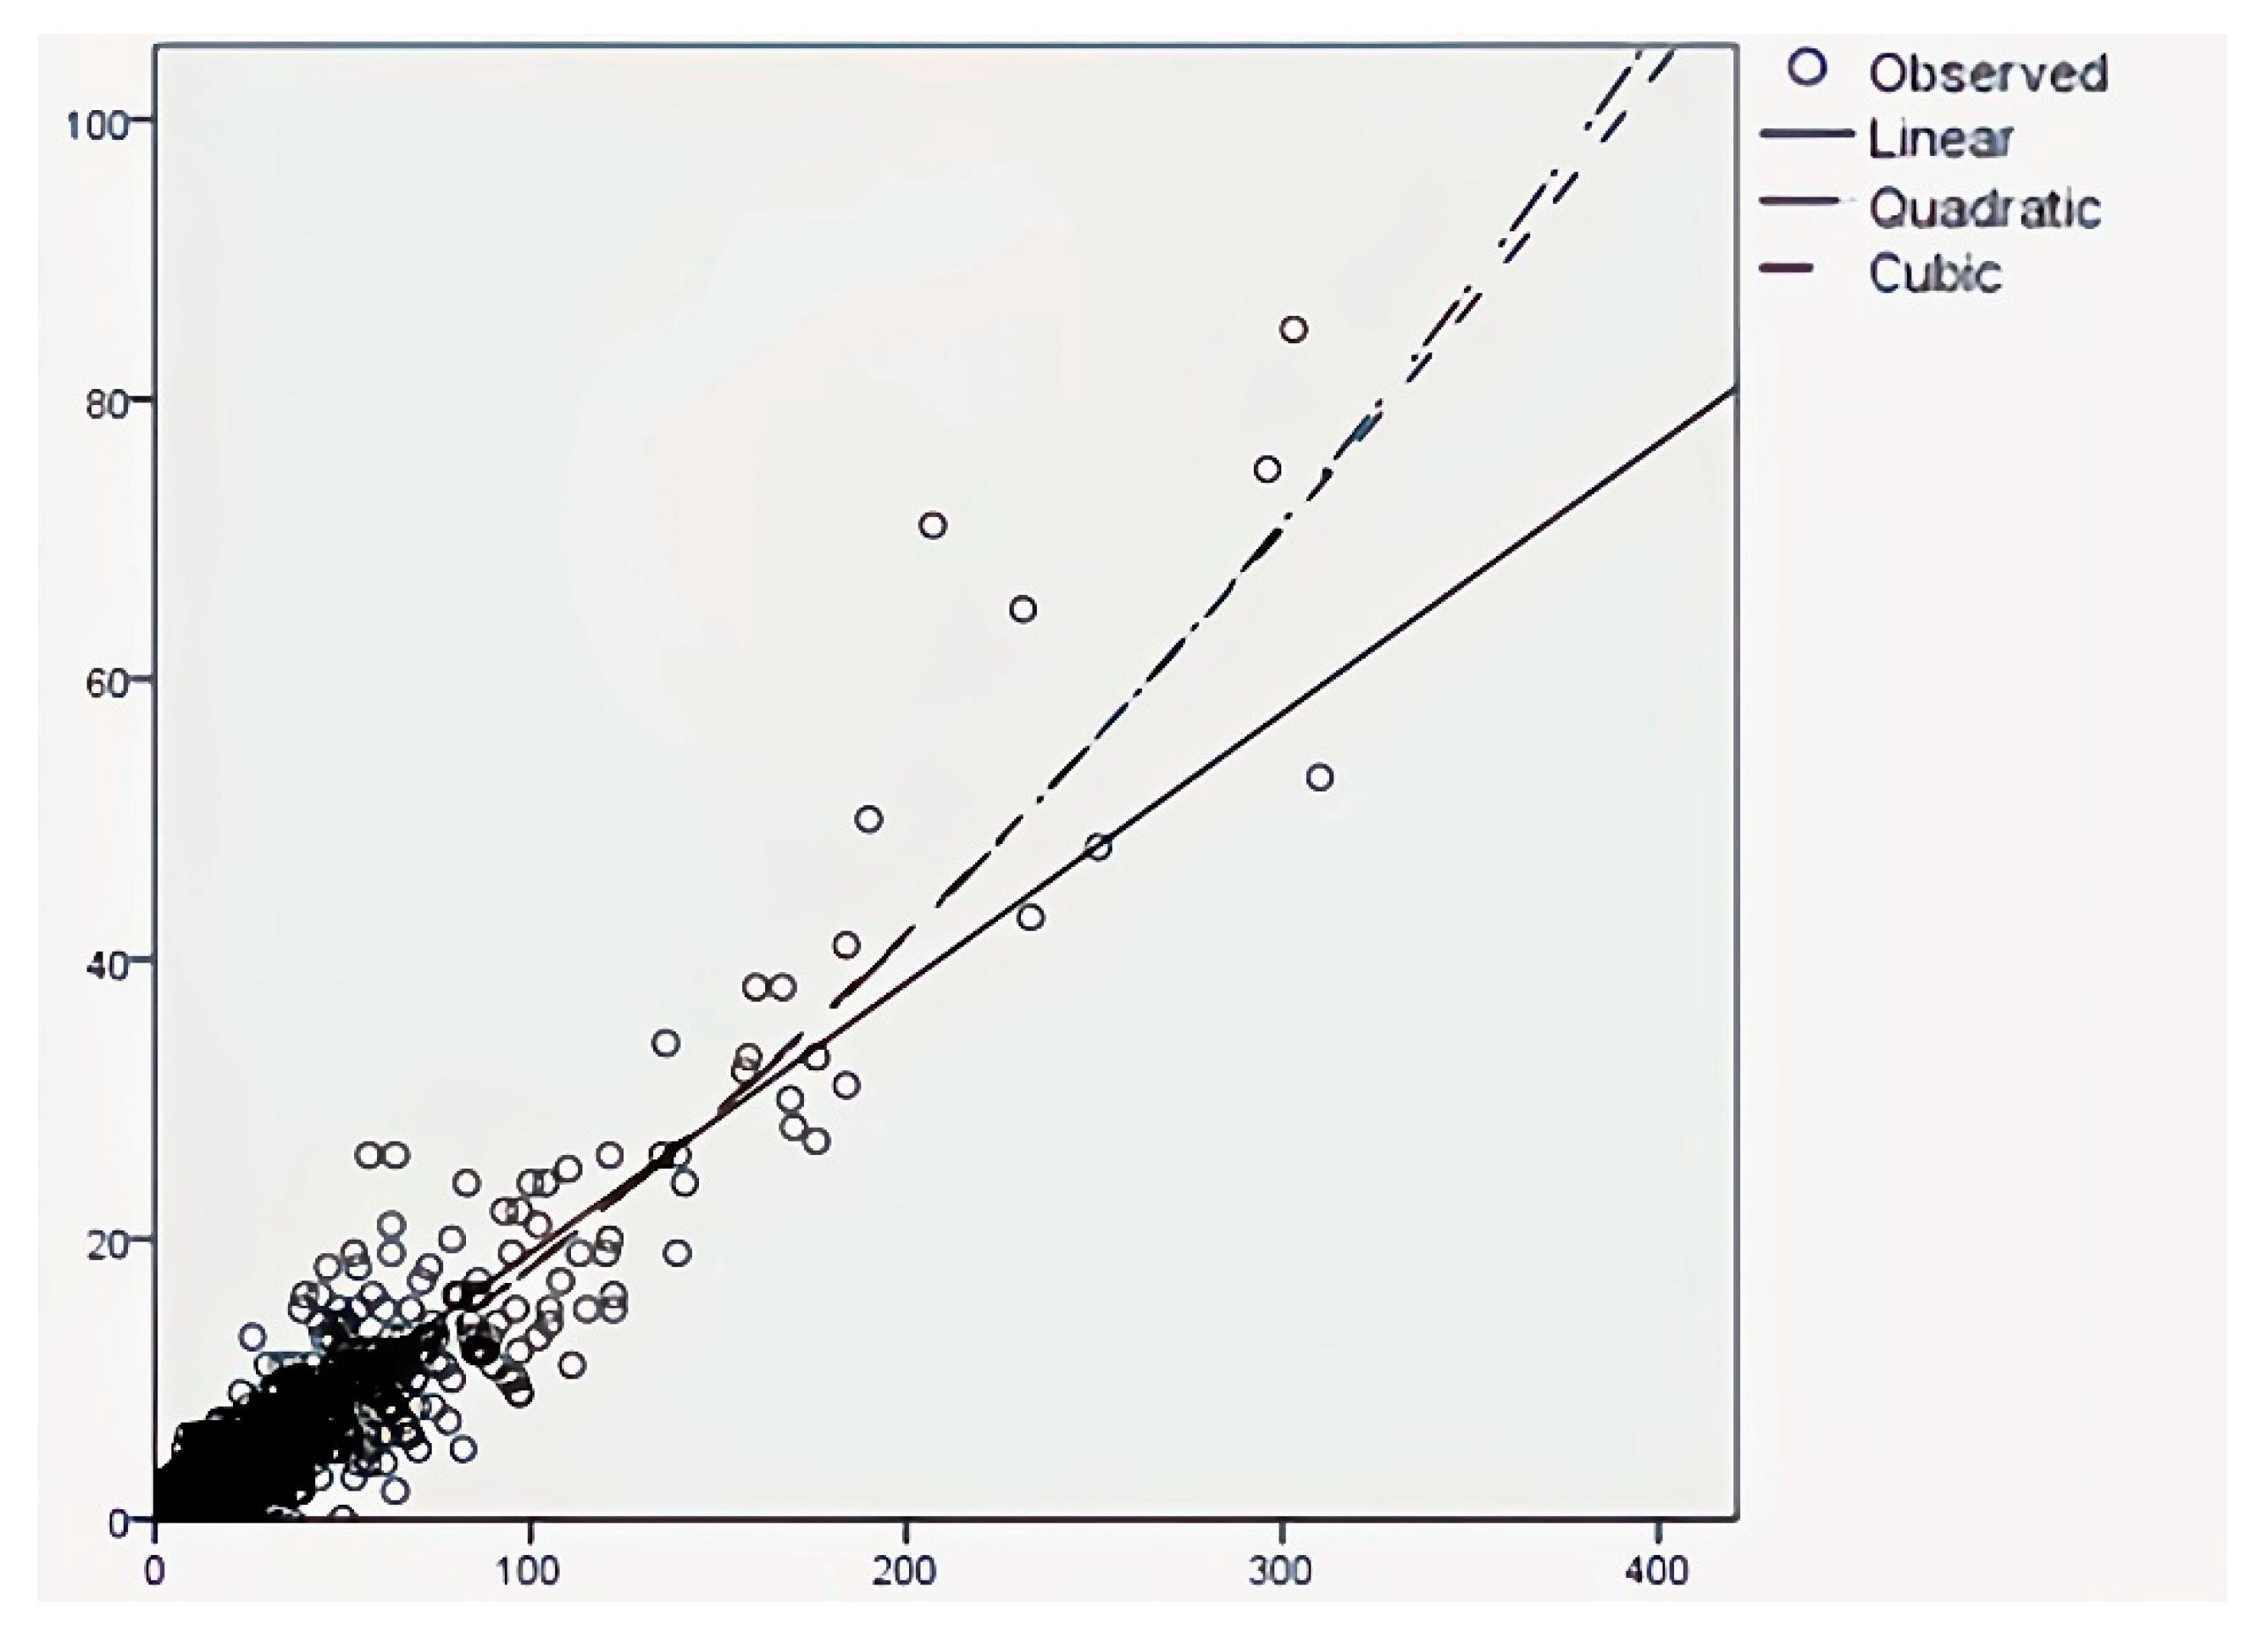
5.3. Prediction Model of Winning Bid Number

According to the distribution of scatter plots, the relationship between them may be primary, quadratic, or cubic. The results, such as those shown in Figure 4, are all acceptable, but the quadratic and cubic regression results are relatively better. It is presumed that in the construction market, there is a positive correlation between the number of bids S I and the number of winning bids N w i n . The formula is the following quadratic function:
N w i n = 0.0003 S i 2 + 0.149 S i + 0.128
The above results supported Hypothesis 4.

6. Findings and Discussion

6.1. Community: Different Scales but Significant Background Differences

Communities of various sizes have demonstrated that the construction market is organized in a “archipelagic” fashion, with internal competition within these communities being stronger than competition between communities. Contractors with experience in construction, design, and project management form the backbone of the network, accounting for 94% of all contractors. These contractors come from a variety of professional backgrounds, which means that a few of them are active in a variety of communities. On the one hand, these communities reflect the market’s demand distribution for various services. On the other hand, it demonstrates that the barrier between these three areas cannot prevent all businesses from operating, and contractors motivated by self-interest may overcome the barrier to cross-border operation. Large, seasoned construction firms are more likely to compete internationally [20]. For instance, Shanghai Construction Group, as a large state-owned construction enterprise, can compete in construction, design, engineering consulting, and other businesses concurrently.
Simultaneously, this study discovered several completely isolated communities, most of which share a common professional background, such as elevator, electromechanical, or railway. Impressively, a group of local construction contractors in Chongqing’s Yunyang County has formed an autonomous community, most likely influenced by the region or other relevant factors. Although these communities are small in size, ranging from a few firms to more than a dozen, they retain the topological properties of social networks.
At first glance, competitions appear to have clustered within communities, which is largely the result of market commonality. On the basis of the communities’ history and characteristics, it can be concluded that the external factors to which contractors must adapt the most are specialization, technical barriers, and administrative areas. These factors, in conjunction with their resource constraints, exacerbate the lack of information, increased transaction costs, and excessive competitive risk faced by competitors outside the association, while also limiting the scope of competitors within the communities, gradually defining the construction market’s boundaries and commonalities [58]. Although each bid is driven by customer demand, the competitive environment of construction enterprises remains inextricably linked to its competitive history and internal resources [35], which is projected and revealed through market commonality. In contrast to the chemical, retail, and other industries, the construction industry’s market commonality is more reflected in the customers, specialization, and technology, and this paper reveals the construction market’s characteristics through community competition.

6.2. Network Growth: Topology and Thickening

As shown in Figure 2, the fluctuation in the correlation between weight w i j and vertices degree k i is indicative of the construction market’s dynamics. The competition network of contractors as a whole, and particularly the numerous small and medium-sized contractors, adheres to the rule of scale-free distribution. It reinforces the notion that competition among small and medium-sized contractors is extremely close to perfect. Small and medium-sized construction enterprises have very limited bargaining power, and owners and projects play a significant role in their competition [21]. The enterprise should achieve a large enough scale as quickly as possible during this phase to increase its chances of survival. Figure 2 demonstrates why this is the case.
In Figure 3, when the competition between two given construction enterprises is repeated enough times, the average line weight increases and the discrete coefficient converges. Then, few new contractors can join the competition network, whose central position has been occupied by experienced and powerful contractors. When those veterans decide to bid for a new contract, it is difficult for newcomers to pose a substantial threat. In this stage, the new competition is mainly veteran-to-veteran, rather than veteran-to-recruit, which social network analysis refers to as “thickening.” At this time, the competition relationship network, or the competitive environment of large constructors, has changed fundamentally. The asymmetry of the competition relationship between strong and weak constructors is obvious, as evidenced not only by the competitiveness gap [59], but also by a radically different competitive environment. Strong constructors’ competition environment has an increase in concentration levels, which possibly weakened competition [60].
Numerous large networks (e.g., the Internet) exhibit a scale-free distribution as a result of two general mechanisms: (i) the network continuously expands by adding new vertices; (ii) new vertices are preferentially connected to well-connected sites [61,62]. However, in the construction market, the two general mechanisms do not adequately account for the “thickening” transformation of the construction market’s competition network. This could be as a result of overlapping niche markets [7] or as a result of a bid-rigging organization perpetuating the competitive illusion [50]. These findings lend credence to the notion that as market commonalities fluctuate and competitive advantage persists, strong enterprises become more reliant on and appreciative of rival behavior [36]. These findings corroborate those of Chen, who discovered that competition between construction firms of varying strengths is also asymmetrical [33]. Additionally, when competition in the construction industry reaches a certain level, the elements or modes of competition change in part. For instance, large firms frequently engage in mergers and acquisitions in order to stay competitive. While the number of competitors has decreased, the competition among survivors has intensified to an extent that goes far beyond price [63].

6.3. Bid Times: Scale-Free and Positively Correlated with Winning Times

The scale-free nature of bid times indicates that a small number of contractors occupy a large number of bidding opportunities, while the majority of contractors have few. A scale-free characteristic is a common characteristic of many social networks, and the construction market is one of them, which reveals that the overall competition in the construction market is fierce, but not chaotic. The small product differentiation, the large number of contractors, and the low entry and exit barriers indicate that the construction market is at the stage of monopoly competition and is a typical market form.
One unexpected finding is that more than one-third of the contractors have never won any contract, including some contractors who have bid dozens of times. There are two possible explanations: firstly, the entry and exit threshold of the construction market is not high, which exacerbated competition; secondly, maybe there is an illusion of fierce competition caused by the behavior of bid-rigging [50]. Excessive competition and bid-rigging do exist in the construction market [7], and scholars’ researches on these phenomena are fruitful. Either explanation implies that the construction market is a “lemon market” with information asymmetry and adverse selection. The scale-free nature of the network emerged as a reliable predictor of the fact that most contractors are at information disadvantage in the bidding stage. In this situation, an abnormally low price will occur, and the contractor is likely to compensate for the early losses through jerry-building and claims after signing the contract [26].
The positive correlation between the number of winning bids and the number of bids supports the notion that the bidding system, as an incentive and selection mechanism, is sufficient. For contractors, more bidding is the only way to accrue more contracts and more market share. As can be seen from Figure 3, the winning bid rate tends to accelerate with an increase in the number of bids by enterprises. The scale of return has an essential impact on the willingness and ability of firms to compete in a complex market [62], which is true of the construction market. It is worth emphasizing further that the competition of construction market consists of two levels: project and market [24]. Although prevailing contractors can only perceive the project level because of limited rationality, experienced contractors pay more attention to long-term market benefits in the bidding stage [11]. For the accelerated growth of the number of winning bids, there is an explanation: there is a higher probability of winning bids and return, so large constructors have a stronger willingness to compete, and a longer-term perspective of competition.
This willingness to compete will be fueled by good historical gains. However, as the identity and ability of competitors to fight back become clearer, they will be curbed in the case of multi-point competition [64]. When multi-market contacts are made between construction firms and the market commonality is high, anti-competitive may be formed through mutual restraint [36].

7. Conclusions and Limitation

Based on the theory of market commonality, this study reconstructs, analyzes, and discusses the state of construction market competition from a social network perspective. The study demonstrates that competition in the construction market is actually community-styled, which appears random and disorderly on the surface. To begin, three factors have been identified as critical to contractors’ competitiveness: technology, specialization, and administrative area. Competitors who share these three characteristics are more dangerous than others. Second, the positive feedback loop of competition incentives exists in the construction market, where more competitive constructors earn higher returns, are more willing to compete, and have a greater incentive to target competitors. Following that, the study discovered that the competitive environment in which construction enterprises operate is inversely proportional to their competitiveness. To ensure survival, new entrants must rapidly expand their scale and competitiveness. After achieving a competitive position, constructors’ competitive strategy must adapt to the competitive environment, which means shifting the focus of decision making away from the customer and toward the competitor, and even seeking cooperation with evenly matched adversaries. In practice, this paper argues that competition in the construction market is stage-specific, and that competitors of varying sizes should be clear about their respective positioning and competitive strategies. Theoretically, as an extension of the theory of market commonality to the construction market competition, this article demonstrates that it is possible to analyze and explain the competitive behavior and law of construction firms on a micro to macro level.
Despite these achievements, this study was limited by its designed boundaries. Firstly, given the reality of over three thousand contractors, this study can only assume that their growth history and trajectory are identical. Concentrating more on the differences between the individual contractors may yield interesting findings. Secondly, in light of the background of China’s economy, the conclusions of this study will be more applicable to developing countries’ quickly growing construction markets. After social network analysis is applied to more regional construction markets, the differences in the competitive pattern of regional markets may appear from different perspectives. In addition, with sufficient data, future work can focus on the evolution of the competitive relationship network of fixed contractors, which could be helpful to understand the interaction between contractors.

Author Contributions

Conceptualization, K.Y.; data curation, K.C.; funding acquisition, K.Y.; resources, K.C.; writing—original draft, K.C.; writing—review & editing, K.Y. Both authors have read and agreed to the published version of the manuscript.

Funding

This research was funded by the National Natural Science Foundation of China, grant number 71871033.

Institutional Review Board Statement

Not applicable.

Informed Consent Statement

Not applicable.

Data Availability Statement

Restrictions apply to the availability of these data. Data was obtained from www.cqjsxx.com and are available http://www.cqjsxx.com/webcqjg/GcxxFolder/zhongbiao.aspx with the permission of www.cqjsxx.com.

Conflicts of Interest

The authors declare no conflict of interest.

References

  1. Porter, M.E. Michael Porter on competition. Antitrust Bull. 1999, 44, 841. [Google Scholar]
  2. Heo, C.Y.; Blal, I.; Choi, M. What is happening in Paris? Airbnb, hotels, and the Parisian market: A case study. Tour. Manag. 2019, 70, 78–88. [Google Scholar] [CrossRef]
  3. Dyer, J.H. Specialized supplier networks as a source of competitive advantage: Evidence from the auto industry. Strateg. Manag. J. 1996, 17, 271–291. [Google Scholar] [CrossRef]
  4. Blecharz, P.; Stverkova, H.; Destech Publicat, I. Customers’ Evaluation of Coca Cola and Pepsi Cola. In Proceedings of the 2016 2nd International Conference on Education and Management Science, Beijing, China, 28–29 May 2016. [Google Scholar]
  5. Porter, M. Competitive Advantage of Nations. Harv. Bus. Rev. 1990, 68, 73–93. [Google Scholar]
  6. El-Mashaleh, M.S. Empirical Framework for Making the Bid/No-Bid Decision. J. Manag. Eng. 2013, 29, 200–205. [Google Scholar] [CrossRef]
  7. Zhao, Z.Y.; Xu, K.; Zuo, J.; Tang, C. Developing the International Construction Contracting Market: Enterprise Niche Approach. J. Manag. Eng. 2017, 33, 04016027. [Google Scholar] [CrossRef]
  8. Fountain, J.; Langar, S. Building Information Modeling (BIM) outsourcing among general contractors. Autom. Constr. 2018, 95, 107–117. [Google Scholar] [CrossRef]
  9. Chua, D.K.H.; Li, D.Z.; Chan, W.T. Case-Based Reasoning Approach in Bid Decision Making. J. Constr. Eng. Manag. 2001, 127, 35–45. [Google Scholar] [CrossRef]
  10. Tulacz, G.J. ENR 2018 Top 400 Contractors: The Market Keeps on Rolling. 2018. Available online: https://www.enr.com/articles/44507-enr-2018-top-400-contractors-the-market-keeps-on-rolling (accessed on 10 December 2019).
  11. Egemen, M.; Mohamed, A.N. A framework for contractors to reach strategically correct bid/no bid and mark-up size decisions. Build. Environ. 2007, 42, 1373–1385. [Google Scholar] [CrossRef]
  12. Setiawan, H.; Erdogan, B.; Ogunlana, S.O. Competitive Aggressiveness of Contractors: A Study of Indonesia. Procedia Eng. 2015, 125, 68–74. [Google Scholar] [CrossRef] [Green Version]
  13. Bageis, A.S.; Fortune, C. Factors affecting the bid/no bid decision in the Saudi Arabian construction contractors. Constr. Manag. Econ. 2009, 27, 53–71. [Google Scholar] [CrossRef]
  14. Olatunji, O.A.; Aje, O.I.; Makanjuola, S. Bid or no-bid decision factors of indigenous contractors in Nigeria. Eng. Constr. Arch. Manag. 2017, 24, 378–392. [Google Scholar] [CrossRef]
  15. Ye, K.; Jiang, W.; Shen, L. Project competition intensity (PCI) in the construction market: A case study in China. Constr. Manag. Econ. 2008, 26, 463–470. [Google Scholar] [CrossRef]
  16. Spence, M. Cost reduction, competition, and industry performance. Econom. J. Econom. Soc. 1984, 52, 101–121. [Google Scholar] [CrossRef]
  17. Ye, K.; Lu, W.; Jiang, W. Concentration in the international construction market. Constr. Manag. Econ. 2009, 27, 1197–1207. [Google Scholar] [CrossRef]
  18. Said, H.M.; Bartusiak, J. Regional Competition Analysis of Industrialized Homebuilding Industry. J. Constr. Eng. Manag. 2018, 144, 04017108. [Google Scholar] [CrossRef]
  19. Polyachenko, S.; Rankin, J.; Shukla, D.; Yevdokimov, Y. A Comparative Analysis of Perceived and Revealed Levels of Competition in the Construction Industry and Its Implications for Technological Change. In Proceedings of the Canada Canadian Society for Civil Engineering Annual Conference, CSCE 2019, Laval, QC, Canada, 12–15 June 2019. [Google Scholar]
  20. Wang, G.; Xia, C.; Cao, D. State and determinants of inter-regional market entry practices in the Chinese construction industry: Evidence from national quality award projects. Eng. Constr. Arch. Manag. 2020, 27, 1461–1477. [Google Scholar] [CrossRef]
  21. Shokri-Ghasabeh, M.; Chileshe, N. Critical factors influencing the bid/no bid decision in the Australian construction industry. Constr. Innov. 2016, 16, 127–157. [Google Scholar] [CrossRef]
  22. Horta, I.; Camanho, A.; Da Costa, J.M. Performance assessment of construction companies: A study of factors promoting financial soundness and innovation in the industry. Int. J. Prod. Econ. 2012, 137, 84–93. [Google Scholar] [CrossRef]
  23. Korkmaz, S.; Messner, J.I. Competitive positioning and continuity of construction firms in international markets. J. Manag. Eng. 2008, 24, 207–216. [Google Scholar] [CrossRef]
  24. Zhao, Z.-Y.; Tang, C.; Zhang, X.; Skitmore, M. Agglomeration and Competitive Position of Contractors in the International Construction Sector. J. Constr. Eng. Manag. 2017, 143, 04017004. [Google Scholar] [CrossRef] [Green Version]
  25. Chen, M.-J.; Miller, D. Competitive dynamics: Themes, trends, and a prospective research platform. Acad. Manag. Ann. 2012, 6, 135–210. [Google Scholar] [CrossRef]
  26. Lo, W.; Lin, C.L.; Yan, M.R. Contractor’s Opportunistic Bidding Behavior and Equilibrium Price Level in the Construction Market. J. Constr. Eng. Manag. 2007, 133, 409–416. [Google Scholar] [CrossRef]
  27. Ellis, J.; Edwards, D.; Thwala, W.; Ejohwomu, O.; Ameyaw, E.; Shelbourn, M. A Case Study of a Negotiated Tender within a Small-to-Medium Construction Contractor: Modelling Project Cost Variance. Building 2021, 11, 260. [Google Scholar] [CrossRef]
  28. Takano, Y.; Ishii, N.; Muraki, M. A sequential competitive bidding strategy considering inaccurate cost estimates. Omega 2014, 42, 132–140. [Google Scholar] [CrossRef]
  29. Kim, H.J.; Reinschmidt, K.F. A dynamic competition model for construction contractors. Constr. Manag. Econ. 2006, 24, 955–965. [Google Scholar] [CrossRef]
  30. De Clerck, D.; Demeulemeester, E. Creating a More Competitive PPP Procurement Market: Game Theoretical Analysis. J. Manag. Eng. 2016, 32, 04016015. [Google Scholar] [CrossRef]
  31. Zhu, J.; Shi, Q.; Wu, P.; Sheng, Z.; Wang, X. Complexity Analysis of Prefabrication Contractors’ Dynamic Price Competition in Mega Projects with Different Competition Strategies. Complexity 2018, 2018, 5928235. [Google Scholar] [CrossRef]
  32. Porter, M.E. Clusters and the new economics of competition. Harv. Bus. Rev. 1998, 76, 77–90. [Google Scholar]
  33. Chen, M.-J. Competitor analysis and interfirm rivalry: Toward a theoretical integration. Acad. Manag. Rev. 1996, 21, 100–134. [Google Scholar] [CrossRef]
  34. Smith, K.G.; Ferrier, W.J.; Ndofor, H. Competitive dynamics research: Critique and future directions. Handb. Strateg. Manag. 2001, 315, 361. [Google Scholar]
  35. Chen, M.-J.; Miller, D. Reconceptualizing competitive dynamics: A multidimensional framework. Strat. Manag. J. 2015, 36, 758–775. [Google Scholar] [CrossRef]
  36. Zhong, Z. The Identification of Enterprise Dynamic Competitor Based on Cluster Analysis. In Proceedings of the 2011 International Conference on Information Management, Innovation Management and Industrial Engineering, Shenzhen, China, 26–27 November 2011. [Google Scholar]
  37. Nadkarni, S.; Chen, T.; Chen, J. The clock is ticking! Executive temporal depth, industry velocity, and competitive aggressiveness. Strat. Manag. J. 2016, 37, 1132–1153. [Google Scholar] [CrossRef] [Green Version]
  38. Carter, C.R.; Kosmol, T.; Kaufmann, L. Toward a Supply Chain Practice View. J. Supply Chain Manag. 2016, 53, 114–122. [Google Scholar] [CrossRef]
  39. Delgado, M.; Porter, M.E.; Stern, S. Clusters, convergence, and economic performance. Res. Policy 2014, 43, 1785–1799. [Google Scholar] [CrossRef] [Green Version]
  40. Preissl, B.; Solimene, L. The Dynamics of Clusters and Innovation; Physica-Verlag: Heidelberg, Germany, 2003; Volume 62, p. 527. [Google Scholar] [CrossRef]
  41. Sellitto, M.A.; Luchese, J. Systemic Cooperative Actions among Competitors: The Case of a Furniture Cluster in Brazil. J. Ind. Compet. Trade 2018, 18, 513–528. [Google Scholar] [CrossRef]
  42. Shash, A.A. Factors considered in tendering decisions by top UK contractors. Constr. Manag. Econ. 1993, 11, 111–118. [Google Scholar] [CrossRef]
  43. Boss, D.S. Competitive Landscape Shifts: The Influence of Strategic Entrepreneurship on Shifts in Market Commonality. Acad. Manag. Rev. 2018, 43, 349–370. [Google Scholar]
  44. Hrdy, C.A. Cluster competition. Lewis Clark L. Rev. 2016, 20, 981. [Google Scholar]
  45. Blondel, V.D.; Guillaume, J.-L.; Lambiotte, R.; Lefebvre, E. Fast unfolding of communities in large networks. J. Stat. Mech. Theory Exp. 2008, 2008, P10008. [Google Scholar] [CrossRef] [Green Version]
  46. Baker, W.E.; Faulkner, R.R. The Social Organization of Conspiracy: Illegal Networks in the Heavy Electrical Equipment Industry. Am. Sociol. Rev. 1993, 58, 837. [Google Scholar] [CrossRef] [Green Version]
  47. Ye, K.; Zeng, D.; Wong, J. Competition Rule of the Multi-Criteria Approach: What Contractors in China Really Want? J. Civ. Eng. Manag. 2018, 24, 155–166. [Google Scholar] [CrossRef] [Green Version]
  48. Hu, E.-H.; Shan, H.-M.; Chen, Y. Discernment and Comprehensive Fuzzy Evaluation of Enterprises’ Core Competence. Syst. Eng. 2004, 1, 48–51. [Google Scholar]
  49. Zhao, Z.-Y.; Guo, X.-L.; Chang, R.-D. Market Concentration and Competitive Intensity of the International Engineering Contracting Industry. J. Constr. Eng. Manag. 2019, 145, 04019026. [Google Scholar] [CrossRef]
  50. Morselli, C.; Ouellet, M. Network similarity and collusion. Soc. Netw. 2018, 55, 21–30. [Google Scholar] [CrossRef]
  51. Kale, S.; Arditi, D. Competitive Positioning in United States Construction Industry. J. Constr. Eng. Manag. 2002, 128, 238. [Google Scholar] [CrossRef]
  52. Thierer, A. The Rule of Three: The Nature of Competition in the Digital Economy. 2012. Available online: https://www.forbes.com (accessed on 10 December 2019).
  53. Harenberg, S.; Bello, G.; Gjeltema, L.; Ranshous, S.; Harlalka, J.; Seay, R.; Padmanabhan, K.; Samatova, N. Community detection in large-scale networks: A survey and empirical evaluation. Wiley Interdiscip. Rev. Comput. Stat. 2014, 6, 426–439. [Google Scholar] [CrossRef] [Green Version]
  54. Traag, V.A.; Waltman, L.; van Eck, N.J. From Louvain to Leiden: Guaranteeing well-connected communities. Sci. Rep. 2019, 9, 5233. [Google Scholar] [CrossRef]
  55. Reina, G.J.T.A.P. ENR 2019 Top 225 International Design Firms: Market Is on an Uncertain Path. 2019. Available online: https://www.enr.com/articles/47254-enr-2019-top-225-international-design-firms-market-is-on-an-uncertain-path (accessed on 10 December 2019).
  56. Barrat, A.; Barthelemy, M.; Pastor-Satorras, R.; Vespignani, A. The architecture of complex weighted networks. Proc. Natl. Acad. Sci. USA 2004, 101, 3747–3752. [Google Scholar] [CrossRef] [Green Version]
  57. Almaas, E.; Kovács, B.; Vicsek, T.; Oltvai, Z.N.; Barabasi, A. Global organization of metabolic fluxes in the bacterium Escherichia coli. Nat. Cell Biol. 2004, 427, 839–843. [Google Scholar] [CrossRef] [Green Version]
  58. Marbukh, V. Effect of bounded rationality on tradeoff between systemic risks & economic efficiency in networks. In Proceedings of the 2016 Eighth International Conference on Ubiquitous and Future Networks (ICUFN), Vienna, Austria, 5–8 July 2016; pp. 353–355. [Google Scholar]
  59. Markman, G.D.; Gianiodis, P.T.; Buchholtz, A. Factor-Market Rivalry. Acad. Manag. Rev. 2009, 34, 423–441. [Google Scholar] [CrossRef]
  60. Grullon, G.; Larkin, Y.; Michaely, R. Are US Industries Becoming More Concentrated? Rev. Financ. 2019, 23, 697–743. [Google Scholar] [CrossRef] [Green Version]
  61. Barabási, A.-L.; Albert, R. Emergence of Scaling in Random Networks. Science 1999, 286, 509–512. [Google Scholar] [CrossRef] [Green Version]
  62. Hortaçsu, A.; Puller, S.L. Understanding strategic bidding in multi-unit auctions: A case study of the Texas electricity spot market. Rand J. Econ. 2008, 39, 86–114. [Google Scholar] [CrossRef]
  63. Betts, M.; Ofori, G. Strategic planning for competitive advantage in construction. Constr. Manag. Econ. 1992, 10, 511–532. [Google Scholar] [CrossRef]
  64. Miller, D.; Chen, M.-J. Sources and Consequences of Competitive Inertia: A Study of the U.S. Airline Industry. Adm. Sci. Q. 1994, 39, 1–23. [Google Scholar] [CrossRef]
Figure 1. Communities in the construction market.
Buildings 11 00435 g001
Figure 2. Correlation curve between line weight and product of vertices weight.
Buildings 11 00435 g002
Figure 3. Bid frequency, average line weight, and discrete coefficient.
Buildings 11 00435 g003
Figure 4. Curve regression of bids and winning bids.
Buildings 11 00435 g004
Publisher’s Note: MDPI stays neutral with regard to jurisdictional claims in published maps and institutional affiliations.

