Article

Numerical Investigation on Energy Efficiency of Heat Pump with Tunnel Lining Ground Heat Exchangers under Building Cooling

1
College of Civil Engineering, Hunan University, Changsha 410082, China
2
Shenzhen Transportation Design & Research Institute Co., Ltd., Shenzhen 518003, China
3
Institute of Geotechnical Engineering, Southeast University, Nanjing 210096, China
*
Authors to whom correspondence should be addressed.
Buildings 2021, 11(12), 611; https://doi.org/10.3390/buildings11120611
Submission received: 6 November 2021 / Revised: 1 December 2021 / Accepted: 2 December 2021 / Published: 4 December 2021

Abstract

:
For mountain tunnels, ground heat exchangers can be integrated into the tunnel lining to extract geothermal energy for building heating and cooling via a heat pump. In recent decades, many researchers only focused on the thermal performance of tunnel lining Ground Heat Exchangers (GHEs), ignoring the energy efficiency of the heat pump. A numerical model combining the tunnel lining GHEs and heat pump was established to investigate the energy efficiency of the heat pump. The inlet temperature of an absorber pipe was coupled with the cooling load of GHEs in the numerical model, and the numerical results were calibrated using the in situ test data. The energy efficiency ratio (EER) of the heat pump was calculated based on the correlation of the outlet temperature and EER. The heat pump energy efficiencies under different pipe layout types, pipe pitches and pipe lengths were evaluated. The coupling effect of ventilation and groundwater flow on the energy efficiency of heat pump was investigated. The results demonstrate that (i) the absorber pipes arranged along the axial direction of the tunnel have a greater EER than those arranged along the cross direction; (ii) the EER increases exponentially with increasing absorber pipe pitch and length (the influence of the pipe pitch and length on the growth rate of EER fades gradually as wind speed and groundwater flow rate increase); (iii) the influence of groundwater conditions on the energy efficiency of heat pumps is more obvious compared with ventilation conditions. Moreover, abundant groundwater may lead to a negative effect of ventilation on the heat pump energy efficiency. Hence, the coupling effect of ventilation and groundwater flow needs to be considered for the tunnel lining GHEs design.

1. Introduction

In China, the main source of building energy consumption is fossil energy, which amounts to 0.3 billion tonnes of coal equivalent per year [1]. The massive consumption of fossil energy has led to a series of problems, such as waste of resources and environmental degradation. Therefore, it is imperative to replace fossil energy with environment-friendly energy, especially in building cooling and heating, which is over 40% of building consumption [2]. Geothermal energy is a renewable and low-carbon energy source [3]. Ground-embedded structures, e.g., piles [4,5], underground diaphragm walls [6] and tunnel linings [7], can be coupled with ground source heat pump (GSHP) systems to extract geothermal energy for building heating and cooling. Many researchers pay attention to the tunnel lining Ground Heat Exchangers (GHEs) because of a large heat exchange area and no drilling, compared to traditional borehole GHEs. For the tunnel in a mountain environment, the tunnel lining GHEs can meet the energy requirement of adjacent users, such as the village away from the tunnel entrance of 1–2 km [8]. Moreover, the tunnel management center is usually only a few hundred meters from the tunnel entrance, which is a good option for using geothermal energy extracted by the tunnel lining GHEs. Figure 1 presents the diagram of the tunnel lining GHEs, the geothermal energy is transferred to tunnel lining GHEs by absorber pipes equipped between the primary and secondary linings, then absorbed geothermal energy is applied to heat and cool the building via the heat pump.
The ground heat exchangers (GHEs) and heat pumps are the essential parts of the GSHP system. At present, there are many studies on the tunnel lining GHEs. Adam and Markiewicz [9] installed energy geotextiles into the tunnel lining GHEs in the experimental section of the Lainzer tunnel, which enhances efficiency of tunnel lining GHEs construction. Zhang et al. [10] assessed the thermal efficiency of tunnel lining GHEs in a mountain environment; the influencing factors on thermal performance of tunnel lining GHEs were further analyzed. Some research works showed that the groundwater conditions can improve thermal efficiency of tunnel lining GHEs, which help to recover ground temperature [11,12]. Di Donna and Barla [13] investigated the influence of hydraulic conductivity, thermal conductivity, groundwater temperature, and flow velocity on thermal performance of tunnel lining GHEs using a 3D numerical model of tunnel lining GHEs with a constant inlet temperature of absorber pipe. Ventilation conditions can improve the thermal performance of tunnel lining GHEs [14,15]. Li et al. [16] found that the effect of diurnal air temperature variation on the temperature of fluid inside the absorber pipe was slight and hysteretic. Dornberger et al. [17] proposed a design chart to summarize the effect of airflow characteristics in the tunnel on the geothermal energy potential of tunnel lining GHEs based on a 3D numerical model of tunnel lining GHEs. In this model, the convective heat transfer boundary was set on the tunnel internal surface to simulate the airflow inside the tunnel. Zhang et al. [18] conducted laboratory model tests to investigate the effect of ventilation and groundwater flow on the thermal efficiency of tunnel lining GHEs. The results showed that the temperature field of the surrounding rock was uneven under the influence of ventilation and groundwater flow, and the absorber pipes should be arranged upstream of the groundwater flow field. The geological conditions and ventilation conditions depend on the environment, which are the significant indicators to assess the heat exchange capacity of tunnel lining GHEs. Moreover, optimizations of tunnel lining GHEs design parameters and operation mode are also important [8]. Ogunleye et al. [19,20] investigated the effect of the design parameters and operation mode on tunnel thermal efficiency by the numerical methods. In this numerical model, the varying tunnel air temperature was imposed on the tunnel internal surface, the results showed that the absorber pipe length had the most significant impact, and an optimal intermittent ratio was necessary for improving thermal performance of tunnel lining GHEs.
The GSHP system changes not only the temperature of the building environment but also the temperature of the underground environment. The heat is injected into the underground by GHEs in cooling mode, which will induce a decrease in heat pump energy efficiency. However, most of the above studies only focused on the thermal performance of tunnel lining GHEs, ignoring heat pump energy efficiency. Hence, evaluation of the energy efficiency of heat pump under different absorber pipe layout types, pipe pitches and pipe lengths by a numerical model combining the tunnel lining GHEs and heat pump was necessary. In this model, the inlet temperature of the absorber pipe varied with time based on the cooling load. Meanwhile, the variation in the energy efficiency with pipe pitch and pipe length under different groundwater and ventilation conditions also were investigated. Based on the above numerical results, optimizations of the design parameters of the tunnel lining GHEs were discussed deeply, and some engineering suggestions for tunnel lining GHEs were given.

2. Methodology

2.1. Mathematical Formulation

The complex heat transfer process of the tunnel lining GHEs concerns convective heat transfer of liquid inside the absorber pipe, the convective heat transfer of tunnel air, and conduction heat transfer of a composite solid medium. To reduce computational costs, the assumptions were as follows: (1) the thermal properties of the solid medium are constant; (2) the thermal contact resistance of tunnel lining and surrounding rock is ignored [15,19]; (3) the heat transfer of absorber pipe wall follows a quasi-steady state [15].
The conduction heat transfer equation of tunnel secondary and primary lining can be as follows:
ρ i C p , i T i t = · ( k i · T i ) + Q i ( i = 1 , 2 )
where T i denotes the temperature (°C); ρ i denotes the density (kg/m3); k i denotes the thermal conductivity (W/m °C); C p , i denotes the specific heat capacity (J/(kg °C)); Q i denotes the heat source (W/m3); denotes the time (s); and i = 1, and 2 are the secondary lining and primary lining.
When the groundwater flow field was considered in the model, the rock was regarded as a porous medium. The heat transfer governing equations are as follows:
( ρ C p ) e f f T r t + ( ρ C p v f ) e f f T r = ( k e f f T r )
( ρ C p ) e f f = ( 1 ε p ) ρ r C p , r + ε p ρ f C p , f
k e f f = ( 1 ε p ) k r + ε p k f
where ρ f denotes the density of the water (kg/m3); C p , f denotes the specific heat capacity of the water (J/(kg °C)); k f denotes the thermal conductivity of the water (W/(m °C)); T r denotes the temperature of the surrounding rock (°C); ρ r denotes the density of the surrounding rock (kg/m3); C p , r denotes the specific heat capacity of the surrounding rock (J/(kg °C)); k r denotes the thermal conductivity of the surrounding rock (W/(m °C)); ( ρ C p ) e f f denotes the effective volumetric heat capacity (J/(m3 °C)); k e f f denotes the effective thermal conductivity (J/(kg °C)); v f denotes the groundwater flow rate (m/s); and ε p denotes porosity.
In the groundwater seepage field, Darcy’s law is usually employed to simulate the groundwater flow within a porous medium, and the governing equations are as follows:
ε p ρ f t + ( ρ f v f ) e f f = 0
v f = κ μ f ( p f + ρ f g D )
κ = K h μ w ρ w g
where κ denotes the permeability (m2); μ w denotes the dynamic viscosity of the water (Pa s); p f denotes the pore pressure in the ground (Pa); g denotes the gravitational acceleration vector (m2/s); D denotes the elevation along the direction of the vertical coordinate (m); and Kh denotes the hydraulic conductivity (m/s).
The transient convective heat transfer equations of liquid inside the absorber pipe are presented below.
The momentum equation is given by:
ρ L u L t = p L 1 2 f D ρ L d h | u L | u L
The continuity equation is defined as:
ρ L t + ( ρ L u L ) = 0
The energy conservation equation is:
ρ L A C p , L T L t + ρ L A C p u L T L = ( A k L T L ) + 1 2 f D ρ L A d h | u L | 3 + q w a l l
q w a l l = h c ( T 1 T L )
h c = 2 π 1 d p , i n h i n + 1 k p ln ( d p , o u t d p , i n )
h i n = N u k L d h
where ρ L denotes the liquid density (kg/m3); C p , L denotes the liquid specific heat capacity (J/(kg °C)); k L denotes the thermal conductivity of the liquid (W/(m °C)); u L denotes liquid flow velocity (m/s); p L denotes liquid pressure (Pa); f D denotes the Darcy friction factor; d h denotes the hydraulic diameter (m); d p , o u t and d p , i n denote the outer and inner diameters of the absorber pipe (m), respectively; A denotes the inner cross-section of the pipe (m2); k p denotes the thermal conductivity of the absorber pipe (W/m °C); q w a l l denotes the heat flux (W/m); h c denotes the equivalent convective heat transfer coefficient (W/m °C); h i n denotes the convective heat transfer coefficient of the internal film of the pipe (W/m2 °C); and T L denotes the liquid temperature (°C).

2.2. Initial and Boundary Conditions

The initial ground temperature can be expressed as:
T 0 ( y , t ) = T M + A S e y ω 2 a r cos ( ω t y ω 2 a r )
where T M denotes the annual average temperature at the ground surface; A S denotes the amplitude of the ground surface temperature variation; ω denotes the angular frequency of the annual temperature variation, ω = 2π/365; and a r is the rock thermal diffusivity.
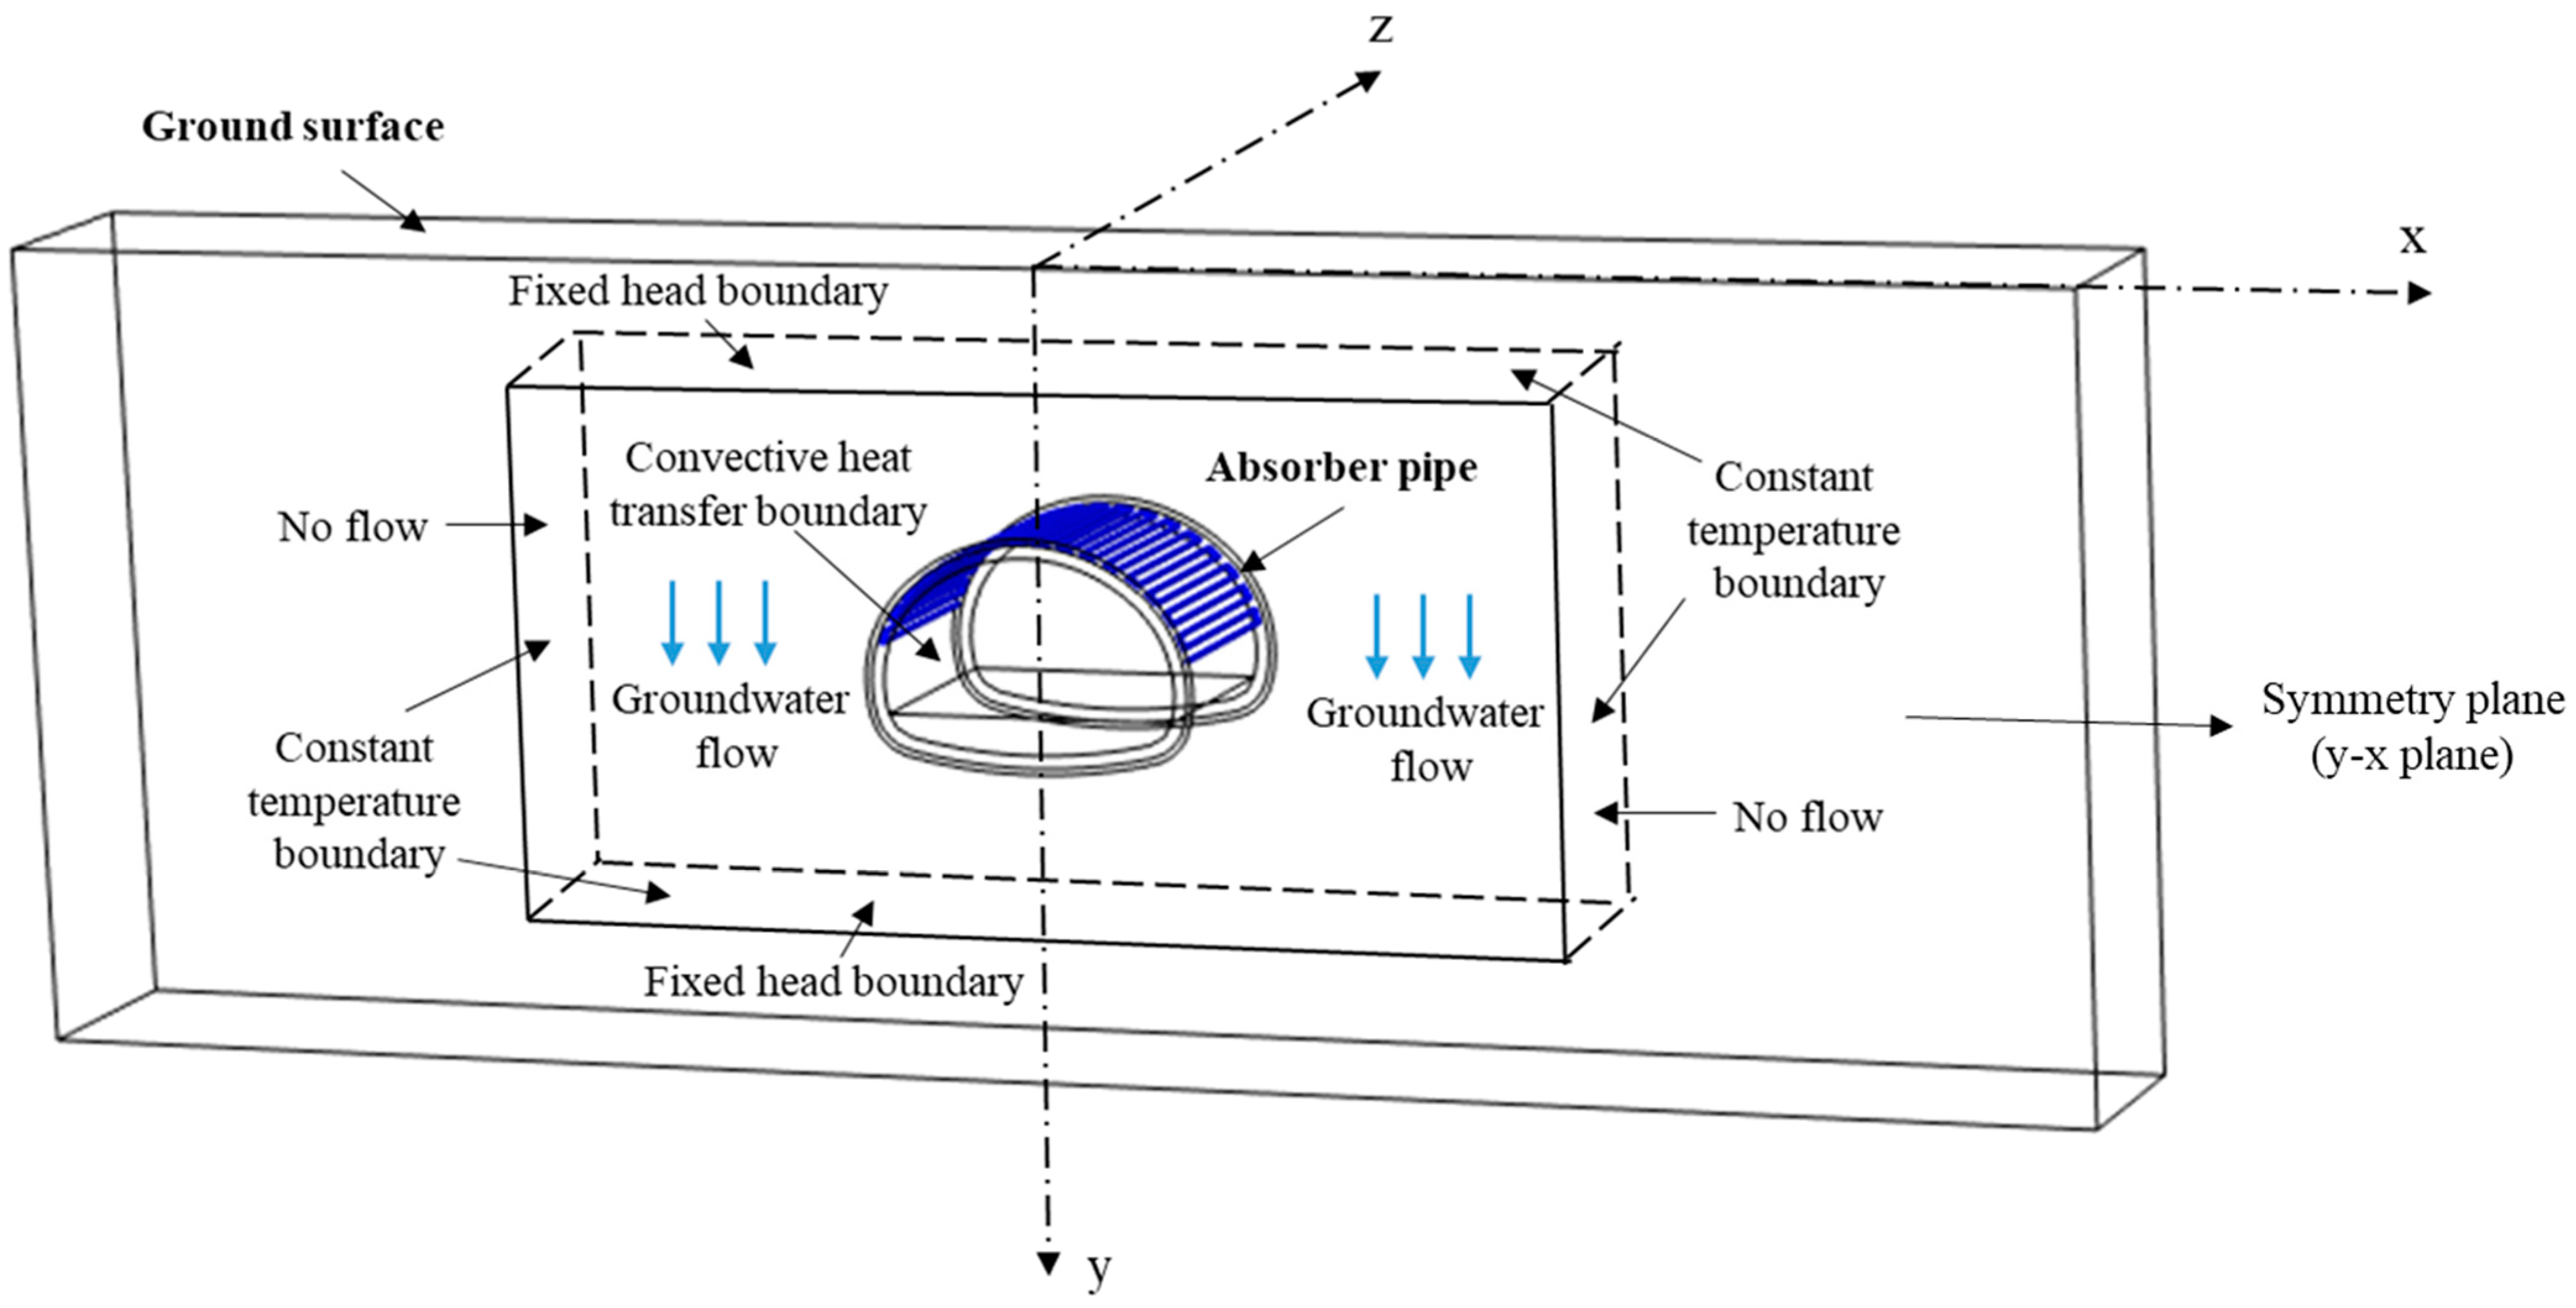
The depth of ground temperature fields influenced by the air temperature is about 10–15 m [14]. The tunnel GHEs are located in the constant temperature layer with sufficient depth. The influence of air temperature on the temperature fields of surrounding rock can be neglected [14,15,21]. Hence, the constant temperature boundary conditions are imposed on the far-field boundaries. The adiabatic boundary conditions are imposed on the vertical surfaces crossing the tunnel axis due to the symmetry of the heat transfer model.
The dynamic air temperature is applied to interface of the tunnel and air as a convective heat transfer boundary to simulate airflow in the tunnel, which is defined as:
k 1 T 1 = h ( T 1 T a i r ( t ) )
where T a i r ( t )  denotes the time-dependent air temperature (°C), and h the denotes convection heat transfer coefficient (CHTC) (W/m2 °C).
The CHTC can be written as [22,23]:
h = a V b   +   c
where V denotes wind speed (m/s); parameters a, b and c are 4.2, 1 and 6.2, respectively [15].
To simulate the groundwater flow, a hydraulic head difference is set on the upper and lower boundaries. The no-flow temperature boundary conditions are set on the lateral boundaries, which are shown in Figure 2.

2.3. Heat Pump Integration

The GHEs can be used in the GSHP system to meet the building load. The GHEs’ load in the cooling modes are written as:
Q G H E C o o l i n g ( t ) =   Q b C o o l i n g ( t ) + Q h p C o o l i n g ( t )
The energy efficiency ratio (EER) is applied to assess the heat pump energy efficiency in cooling modes. The EER is written as:
E E R ( t ) =   Q b C o o l i n g ( t ) Q h p C o o l i n g ( t )
where Q h p C o o l i n g ( t ) denotes the heat pump energy consumption (W); Q b C o o l i n g ( t ) denotes the load of the building; and Q G H E C o o l i n g ( t ) denotes the cooling load of the tunnel lining GHEs (W).
The EER can be calculated by a quadratic function of the outlet temperature [24,25]. The EER equation used in this study is given by:
E E R ( t ) = M - N T o u t ( t ) + S T o u t ( t ) 2
The parameters M, N and S of the heat pump model (Equation (19)) offered by the manufacturer [26] are 9.08, 0.179 and 0.00102, respectively, which are used in this study. The EER function could be easily extended to other different types of heat pumps.
As shown in Figure 3, the inlet temperature depends on the cooling load of the tunnel lining GHEs.
This inlet temperature can be calculated by:
T i n ( t ) = T o u t ( t ) + Q G H E ( t ) ρ L u L A C p , L
where   T i n   ( t ) denotes the inlet temperature (°C);   T o u t ( t ) denotes the outlet temperature (°C); and Q G H E ( t ) denotes the cooling load of the tunnel lining GHEs (W).

3. Numerical Model

3.1. Model Validation

COMSOL Multiphysics software was employed to develop a 3D heat transfer numerical model of the tunnel lining GHEs.
The results of the field tests performed on real-scale tunnel lining GHEs section of Linchang Tunnel were reported in [10], which were used to verify the heat transfer model. The inner diameter of the tunnel was 5.7 m, and the secondary and primary linings had thicknesses of 35 cm and 17 cm. The other model parameters are presented in Table 1. A numerical model with a length of 100 m, a width of 60 m, and a height of 11 m was developed. Figure 4 presents the 3D view of the proposed heat transfer model.
In order to determine enough elements to achieve convergence, a grid-dependent numerical study was performed, and a finer grid was used around the absorber pipe. As shown in Table 2, the outlet temperature in continuous mode converged at 2,326,849 elements, achieving a grid-size independent solution. Figure 5 shows the experimental and numerical outlet temperatures of absorber pipe. The experimental outlet temperature of the absorber pipe has a large oscillation due to the periodic operation of the heat pump. The numerical results showed agreement with the experimental results. Therefore, we believe that the numerical model can accurately simulate the operation of tunnel lining GHEs.

3.2. Parametric Numerical Study

In the parametric numerical study, the operation of the tunnel lining GHEs was considered for three months of cooling. The model of the tunnel in Section 3.1 was used to perform the parametric numerical study. The measured air temperature was set on the boundary between the air and tunnel internal surface to simulate the effect of airflow. Different groups of tunnel lining GHEs could be arranged parallelly to meet the building cooling load. This study focused on one group of tunnel lining GHEs to investigate the effect of the tunnel lining GHEs parameters (absorber pipe layout types, pipe pitches and pipe lengths) on the energy efficiency of the heat pump. The temperature difference between the inlet and outlet was set to 5 °C according to the Design Code for Heating Ventilation and Air Conditioning of Civil Buildings (in China) [27], which corresponds to a tunnel lining GHEs cooling load of 5.235 kW. The maximum wind speed was determined to be 5 m/s according to the monitoring data of the wind speed range [15]. The porosity of the surrounding rock is assumed as 10% for simulating the groundwater flow. The parameters of parametric study are presented in Table 3.

4. Energy Efficiency of Heat Pump with Tunnel Lining GHEs

4.1. Effect of GHEs Absorber Pipe Layout Types on Heat Pump Energy Efficiency

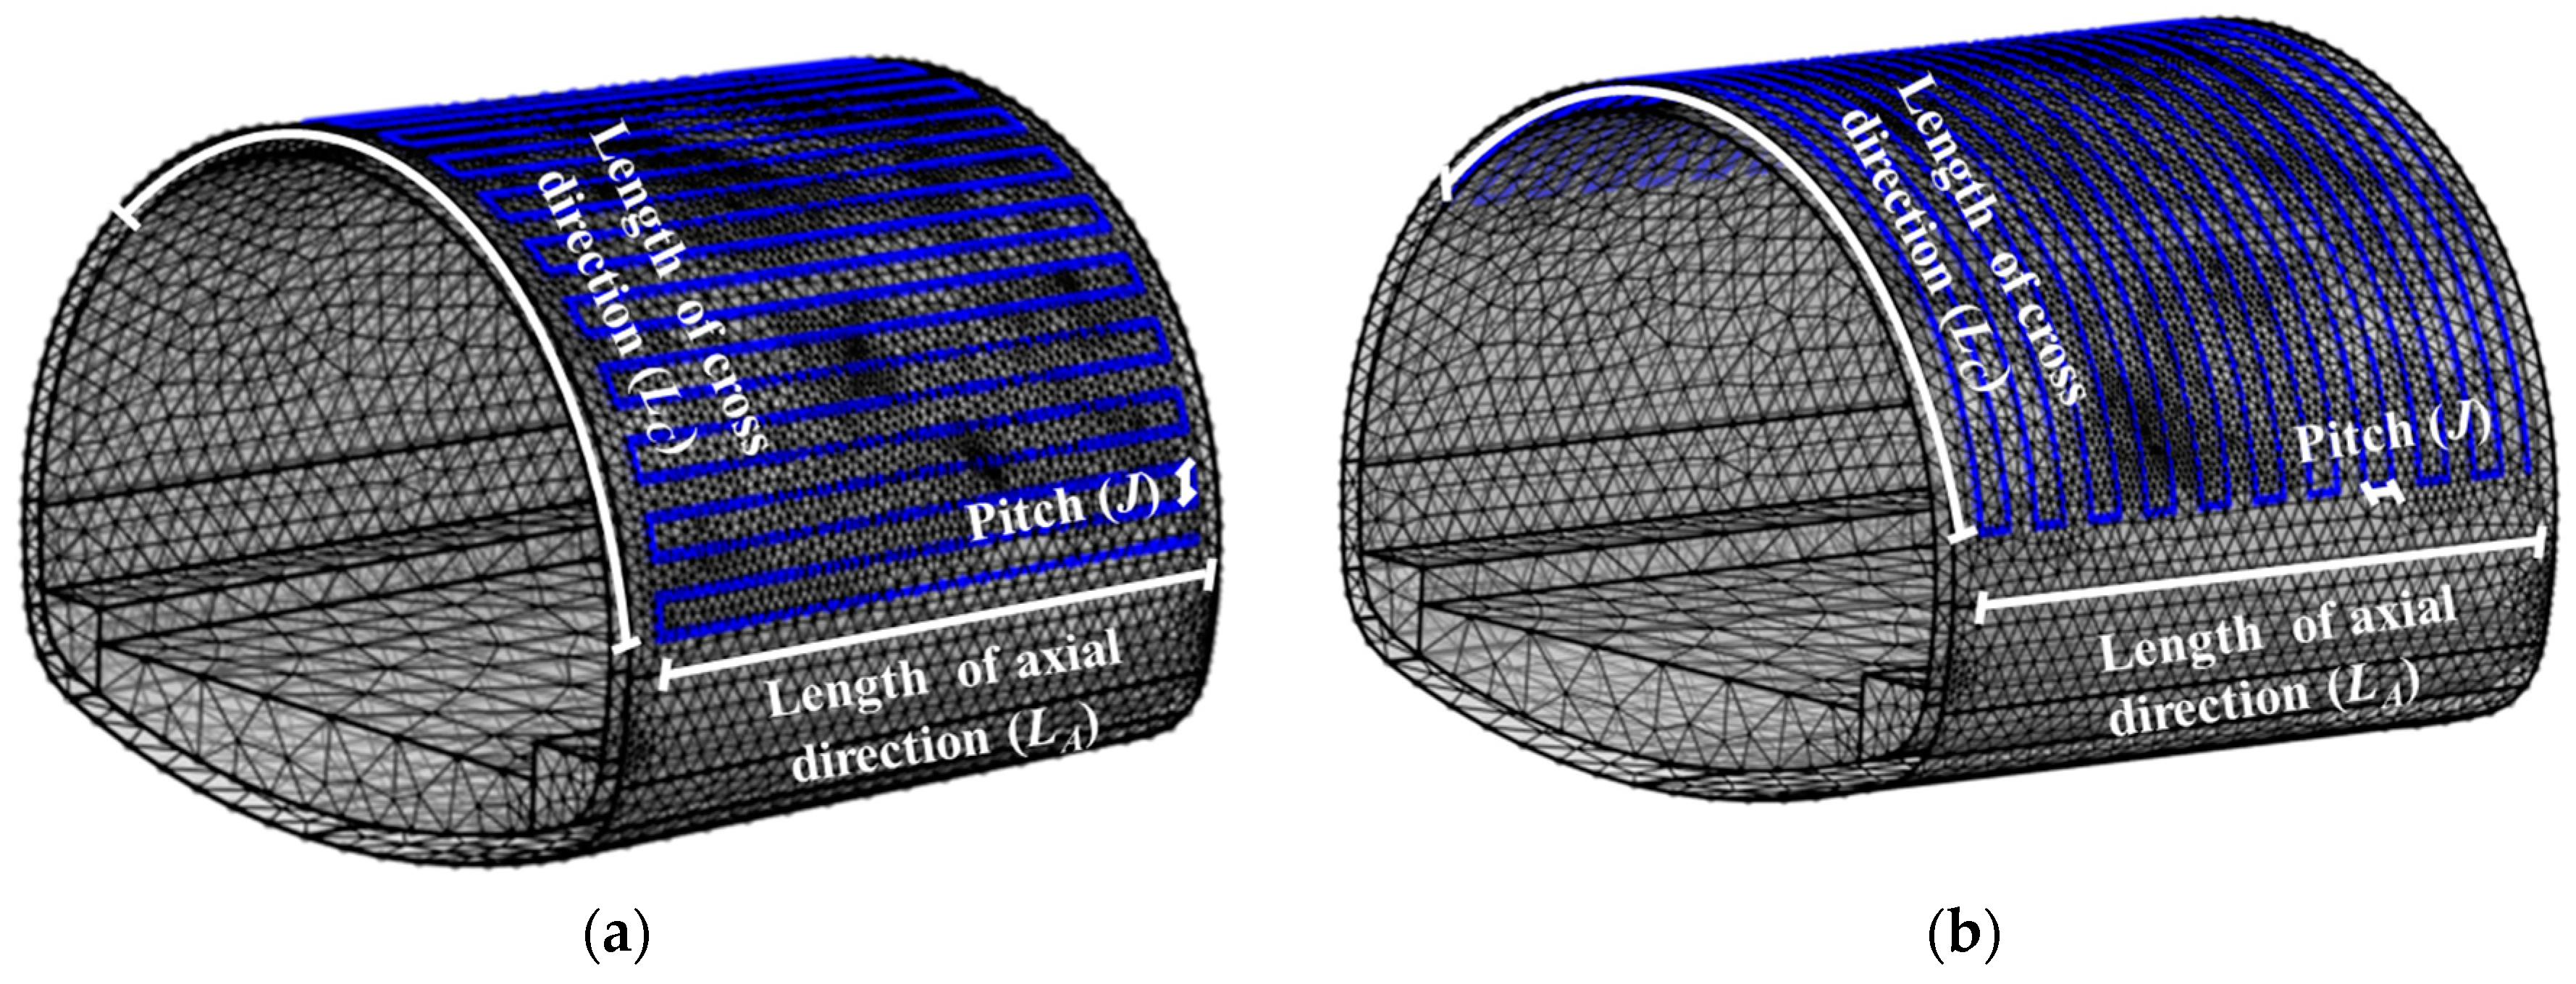
As shown in Figure 6, the absorber pipe layout types contain a type-1 absorber pipe arranged along the cross direction of the tunnel and a type-2 absorber pipe arranged along the axial direction of the tunnel. The area and length of the absorber pipe layout can be calculated by Equation (21).
{ L t o t a l = [ ( L C / J ) + 1 ] × L A + L C A = L C × L A
where Ltotal denotes the absorber pipe length (m); LC denotes the length along the tunnel cross direction (m); LA denotes the length along the axial direction of the tunnel (m); J denotes the absorber pipe pitches (m); and A denotes the area of the absorber pipe layout (m2).
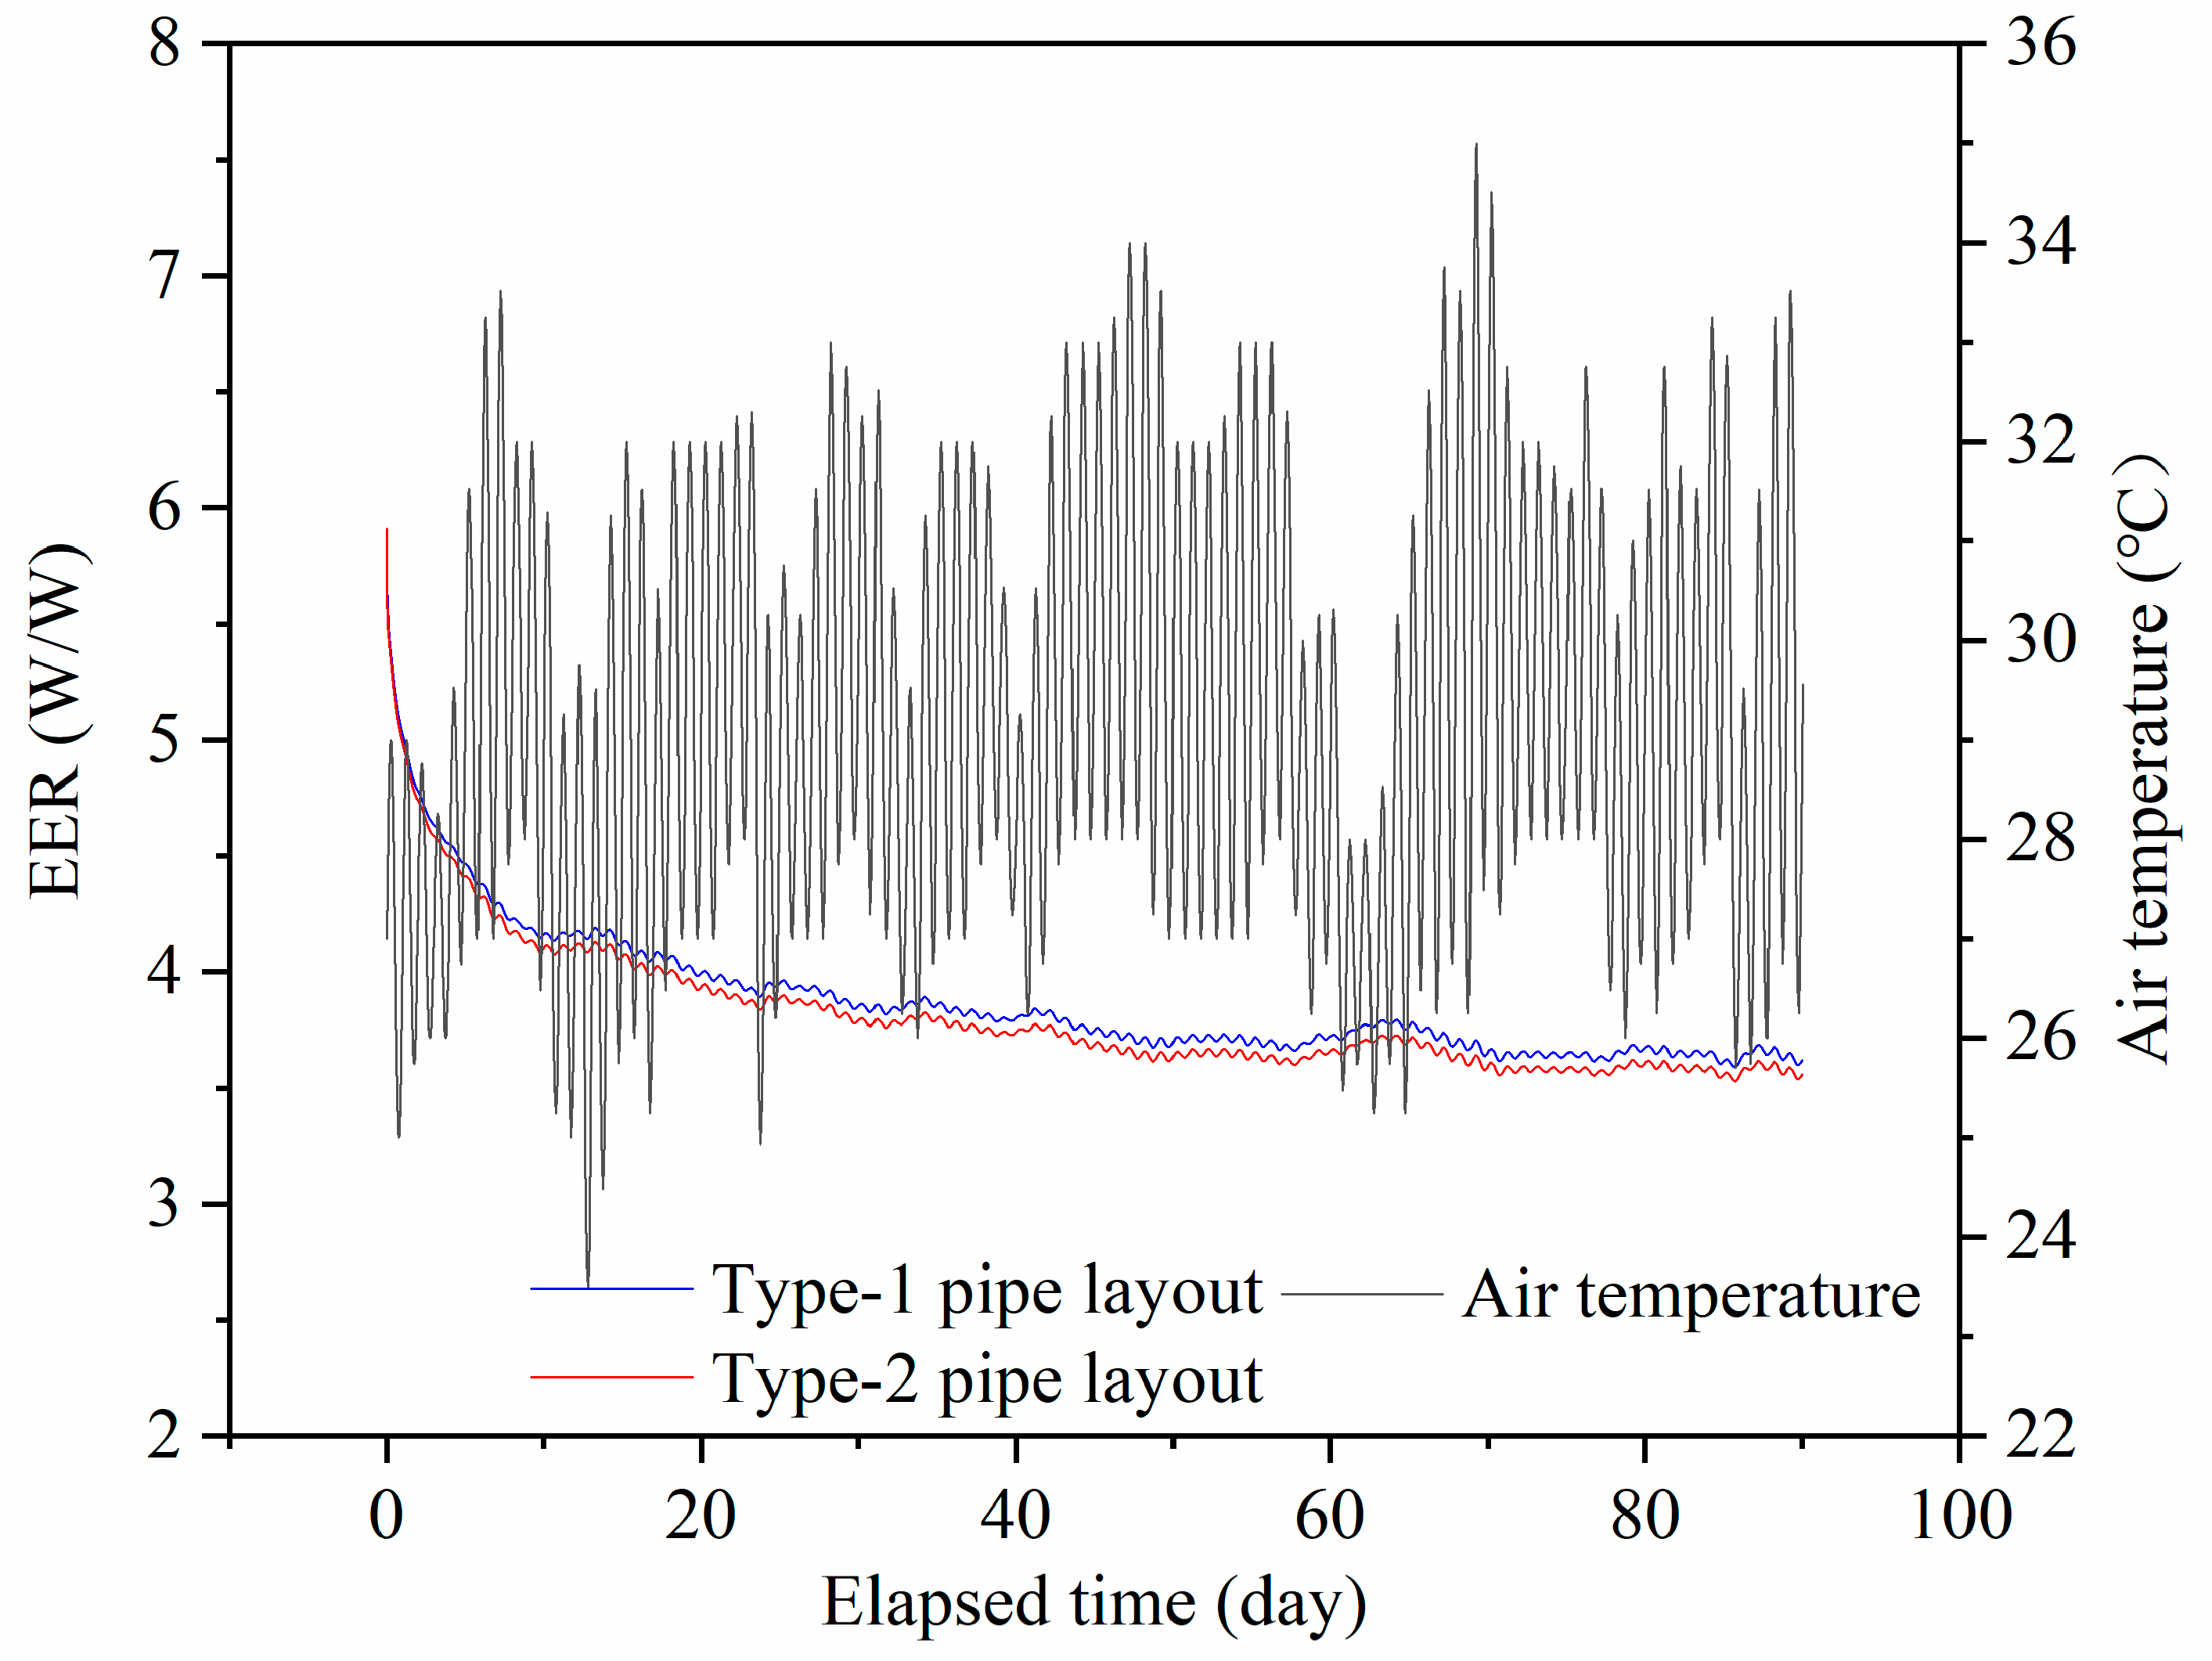
To facilitate a comparison between the effects of different absorber pipe layout types on the heat pump energy efficiency, the area and length of the type-1 absorber pipe are the same as those of the type-2 absorber pipe. The area and length of the two types of absorber pipe layouts are 100 m2 and 220 m. As shown in Figure 7, the EERs of two types of absorber pipes layout decreased with the elapsed time for 90 days. The EER values of two types of absorber pipes layout reached 3.56 and 3.62 on the 90th day, respectively, and the EER values of the type-2 absorber pipe were greater than EER values of the type-1 absorber pipe, indicating that the type-2 absorber pipe layout was better than the type-1 absorber pipe layout.
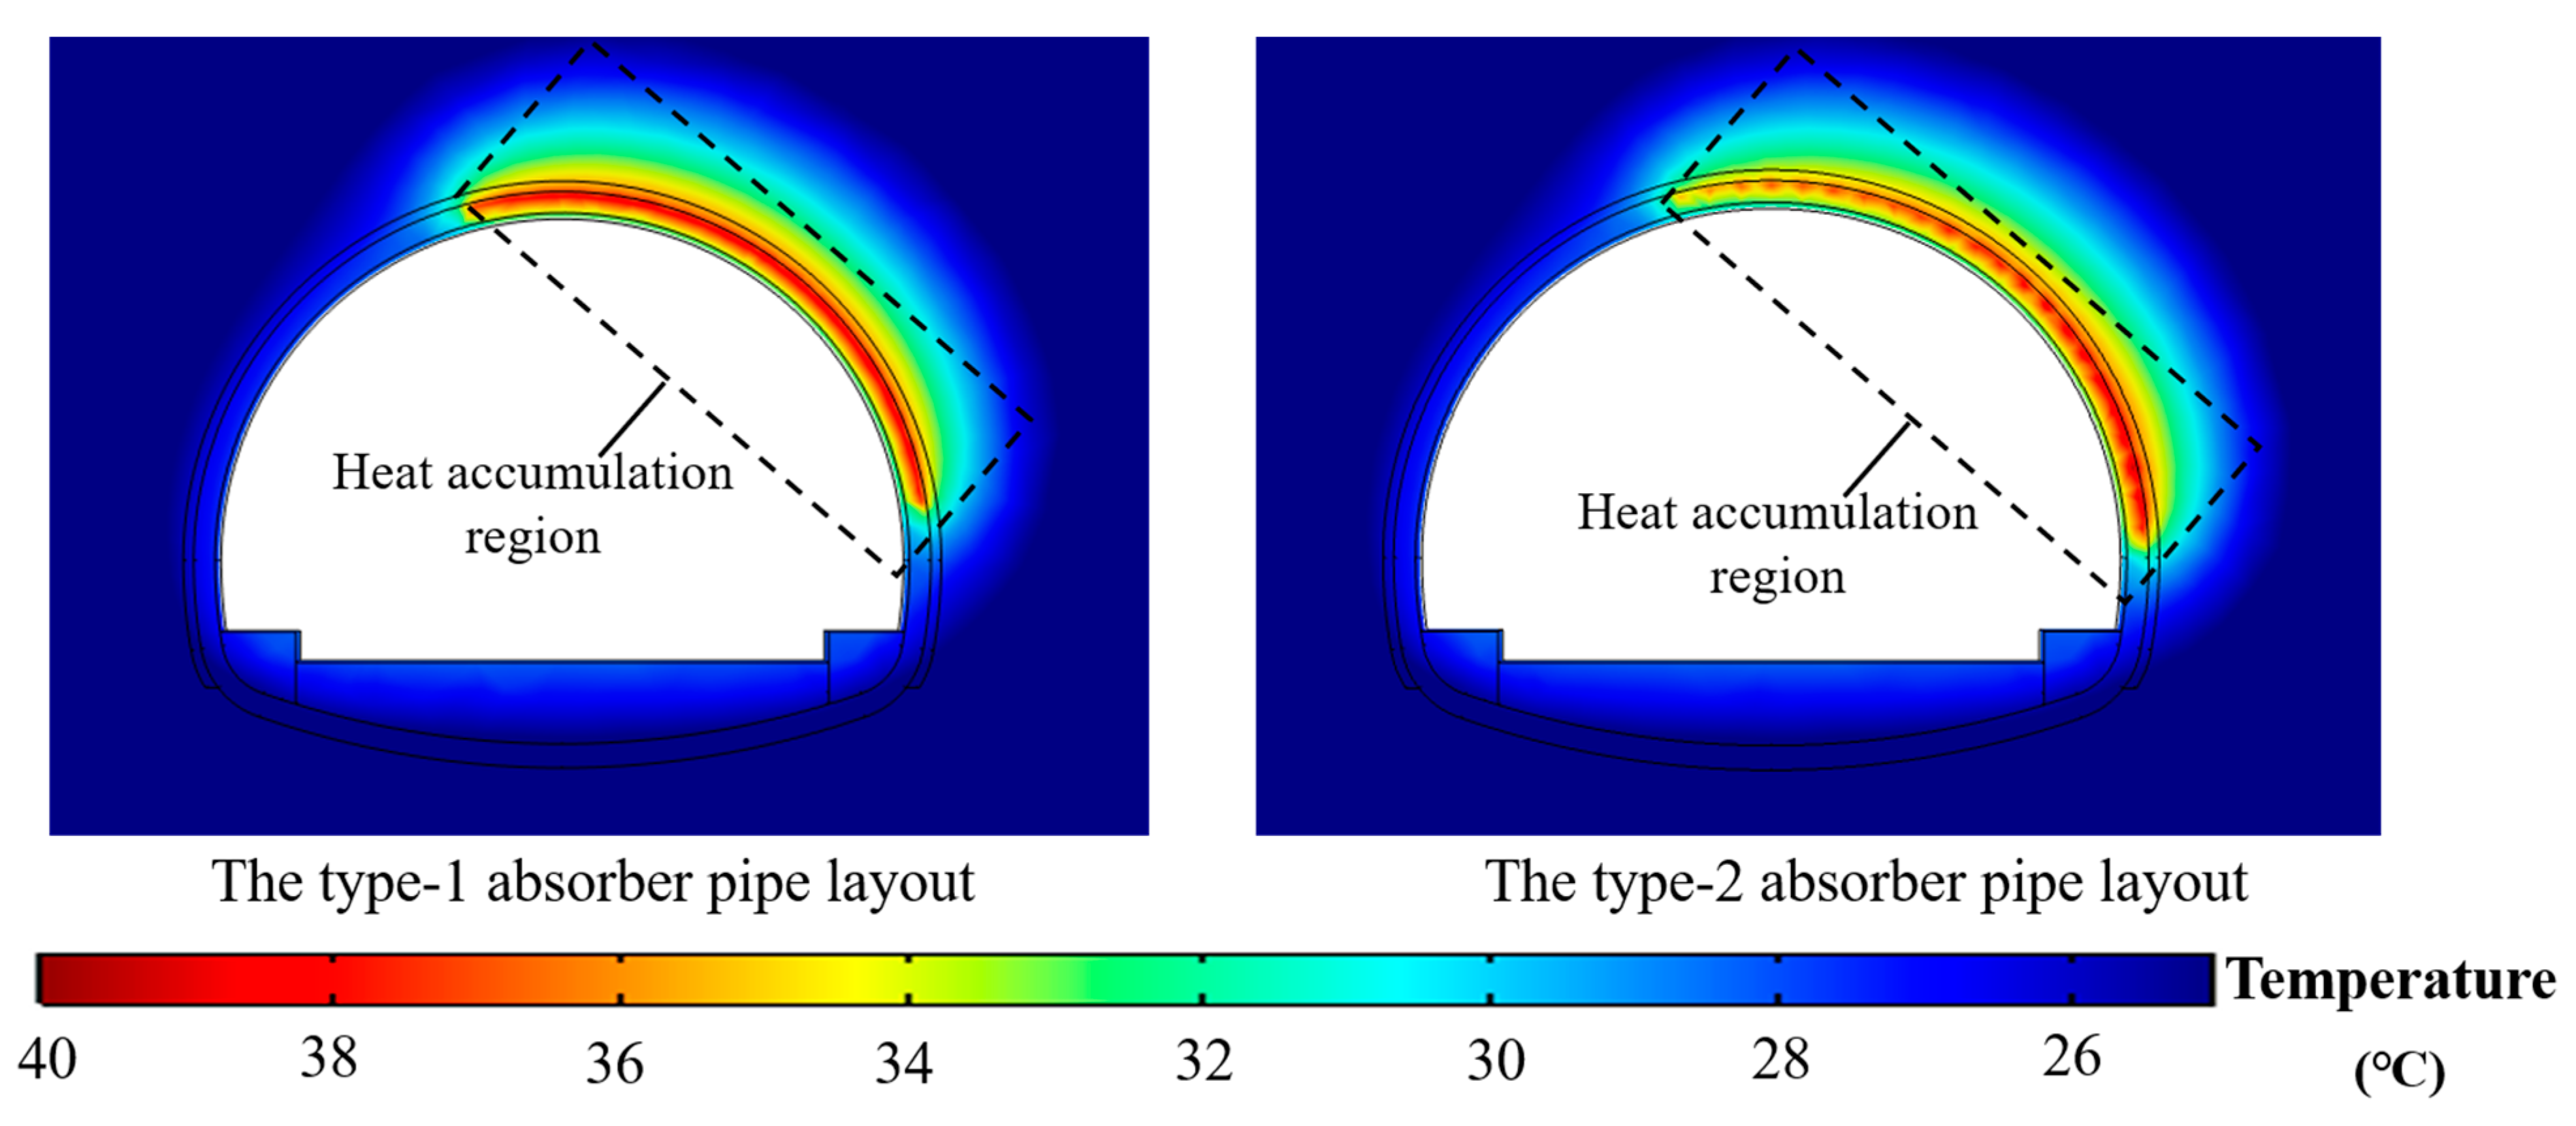
To analyze the above results, the temperature field around the absorber pipe at the center of the tunnel model is presented, as shown in Figure 8.
From Figure 8, it is apparent that more heat accumulated around the type-1 absorber pipe compared with the type-2 absorber pipe, leading to a decrease in the EER. Figure 9 depicts the heat transfer schematic of different absorber pipe layout types at the tunnel surface. The heat transfer direction of type-1 absorber pipe was mainly along the axial direction of the tunnel, while the heat transfer direction of type-2 absorber pipe was mainly along the cross direction of the tunnel. Moreover, heat accumulated easily between the different groups of absorber pipes. Hence, there was more heat accumulation in the tunnel model with the type-1 layout compared with tunnel model with the type-2 layout.
Although the temperature change along the axial direction of tunnel and the buoyancy effect were not considered in this model, it was acceptable that the convective heat transfer boundary between the tunnel surface and air was used to simulate the convective heat transfer of tunnel air. Zhang et al. (2016) found that there was mainly forced convection along the axial direction of the tunnel in the mountain tunnel, and the maximum temperature difference between different temperature measurement points within the same cross section was only 0.18 °C, which meant that the temperature variation of the cross section could be neglected for the mountain tunnel. Peltier et al. (2019) found that constant values of the convection heat transfer coefficient could be used to describe the heat transfer performance in the tunnels driven by airflows when no disturbances of the thermal and velocity boundary layers were encountered with the longitudinal distance. This study focused on the mountain tunnel, a section of the mountain tunnel with a length of 11 m was used to investigate the effect of ventilation on the thermal performance of tunnel lining GHEs qualitatively. Hence, the variation in wind speed and air temperature could be neglected. In summary, compared with the type-1 layout, the type-2 layout exhibited a greater EER, recommending for the mountain tunnel lining GHEs design.

4.2. Effect of GHEs Absorber Pipe Pitch on Heat Pump Energy Efficiency

Based on the above results, the type-2 absorber pipe layout arranged along the axial direction of the tunnel had the higher heat pump energy efficiency. Hence, the type-2 absorber pipe layout was used in the investigation on the effect of GHEs absorber pipe pitch on the heat pump energy efficiency, and the absorber pipe length was fixed at 291.1 m.
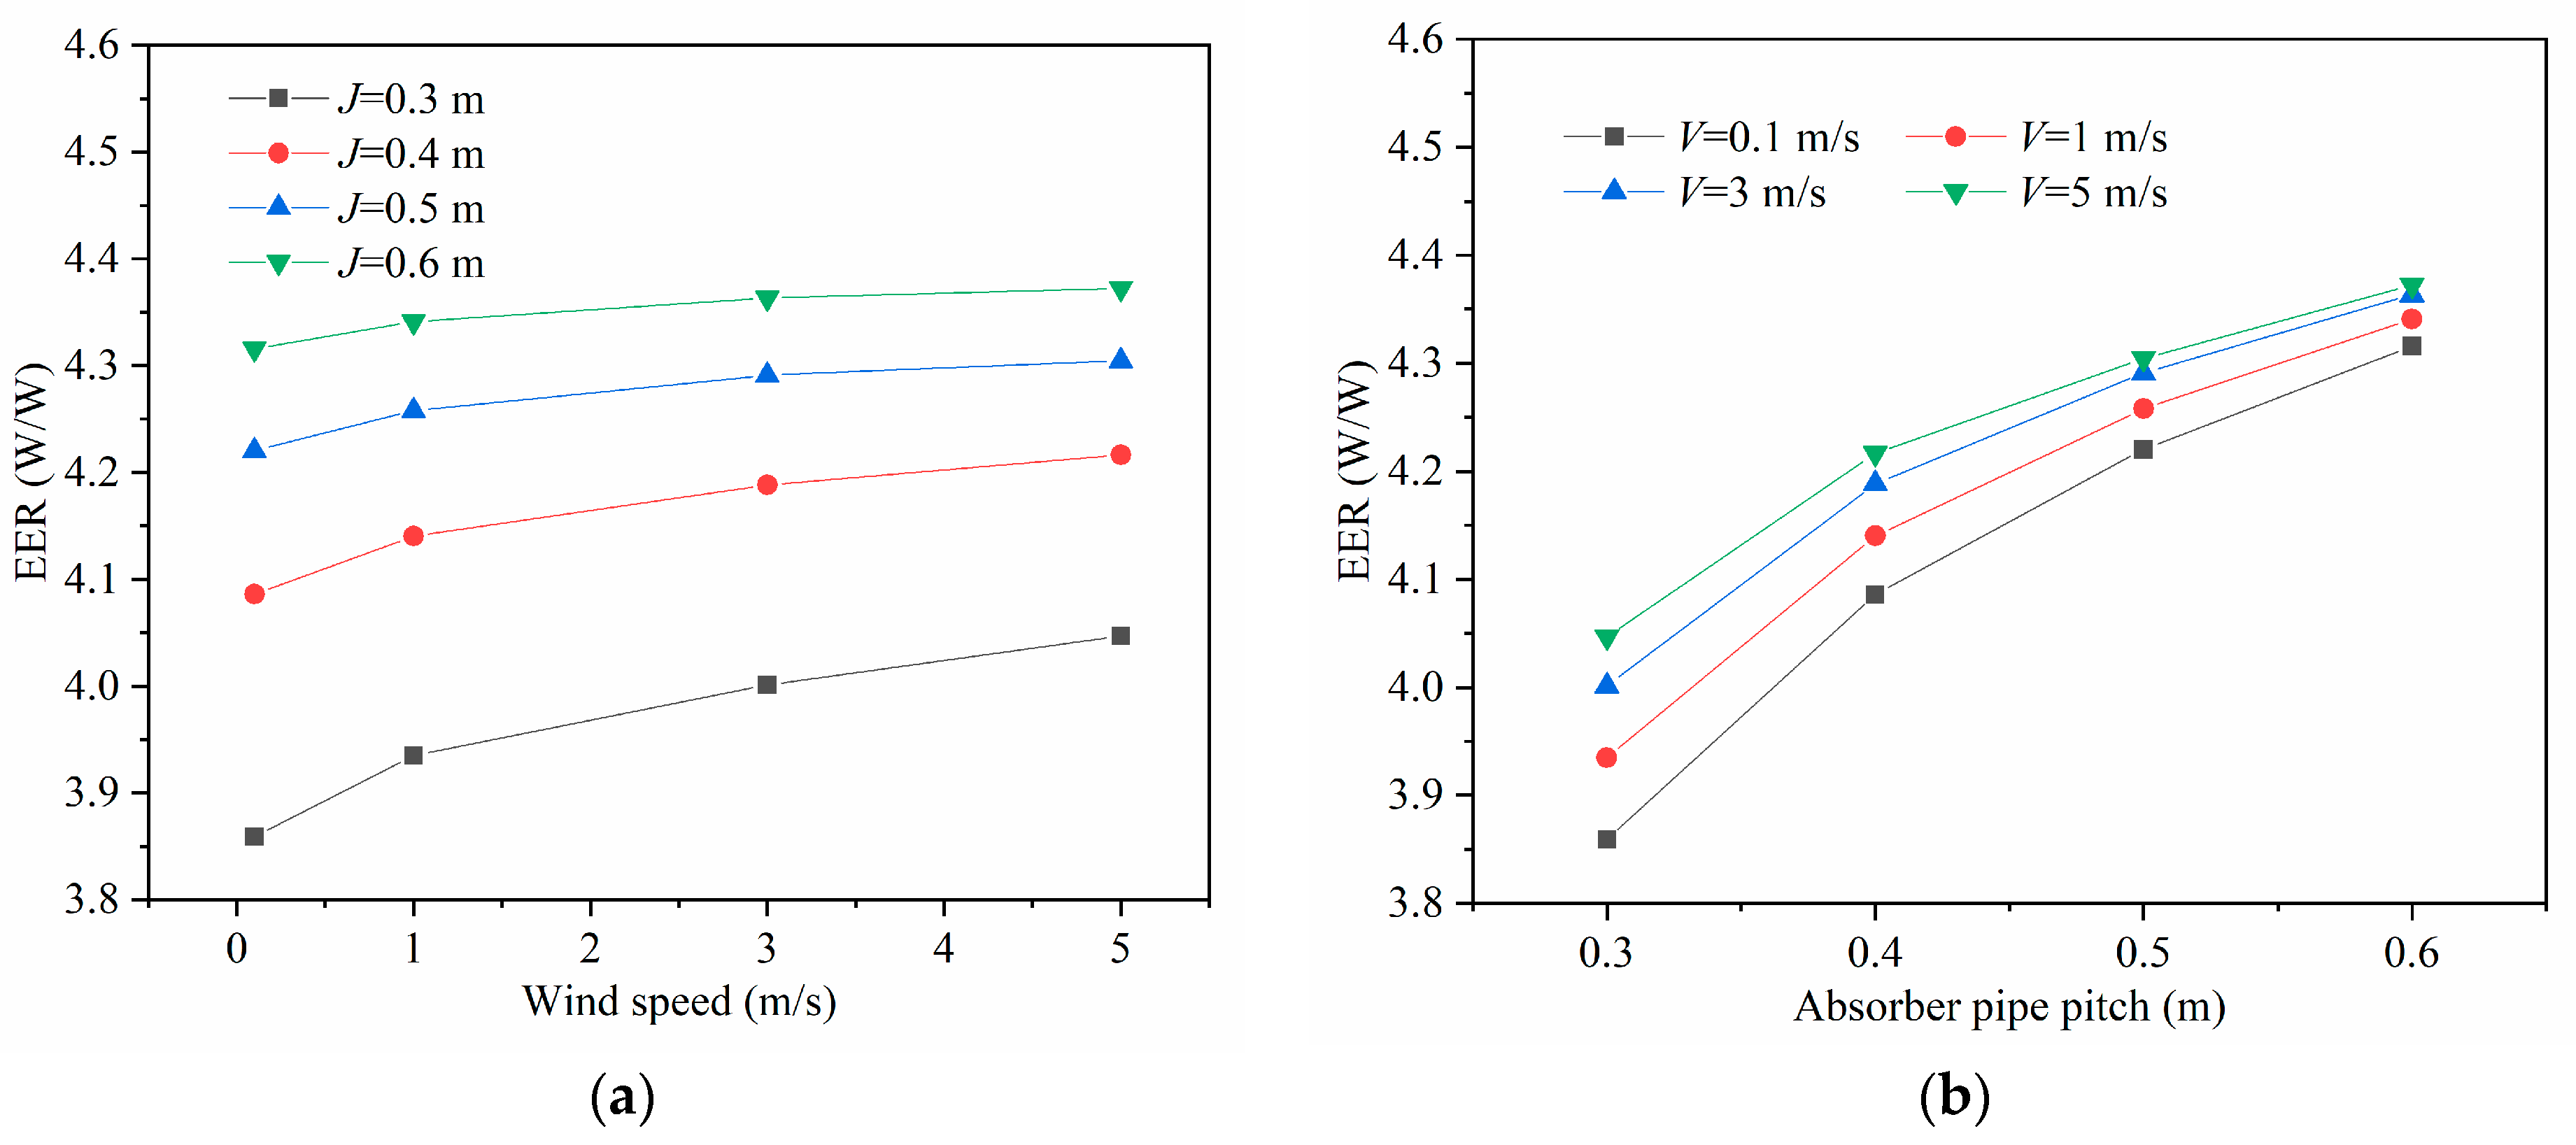
As shown in Figure 10a, the EER increased exponentially with increasing wind speed for the same pitch. As shown in Figure 10b, the EER increased exponentially with an increase in the absorber pipe pitch. The influence of the pitch on the growth rates of EER had a diminishing trend as the wind speed increased. When the wind speed was 0.1 m/s, the growth rates of the EER corresponding to the absorber pipe pitches ranging from 0.3 to 0.4 m, 0.4 to 0.5 m, and 0.5 to 0.6 m were 5.88%, 3.29%, and 2.26%, respectively. When the wind speed was 5 m/s, the growth rates of the EER corresponding to the absorber pipe pitches ranging from 0.3 to 0.4 m, 0.4 to 0.5 m, and 0.5 to 0.6 m were 4.19%, 2.09%, and 1.58%, respectively.
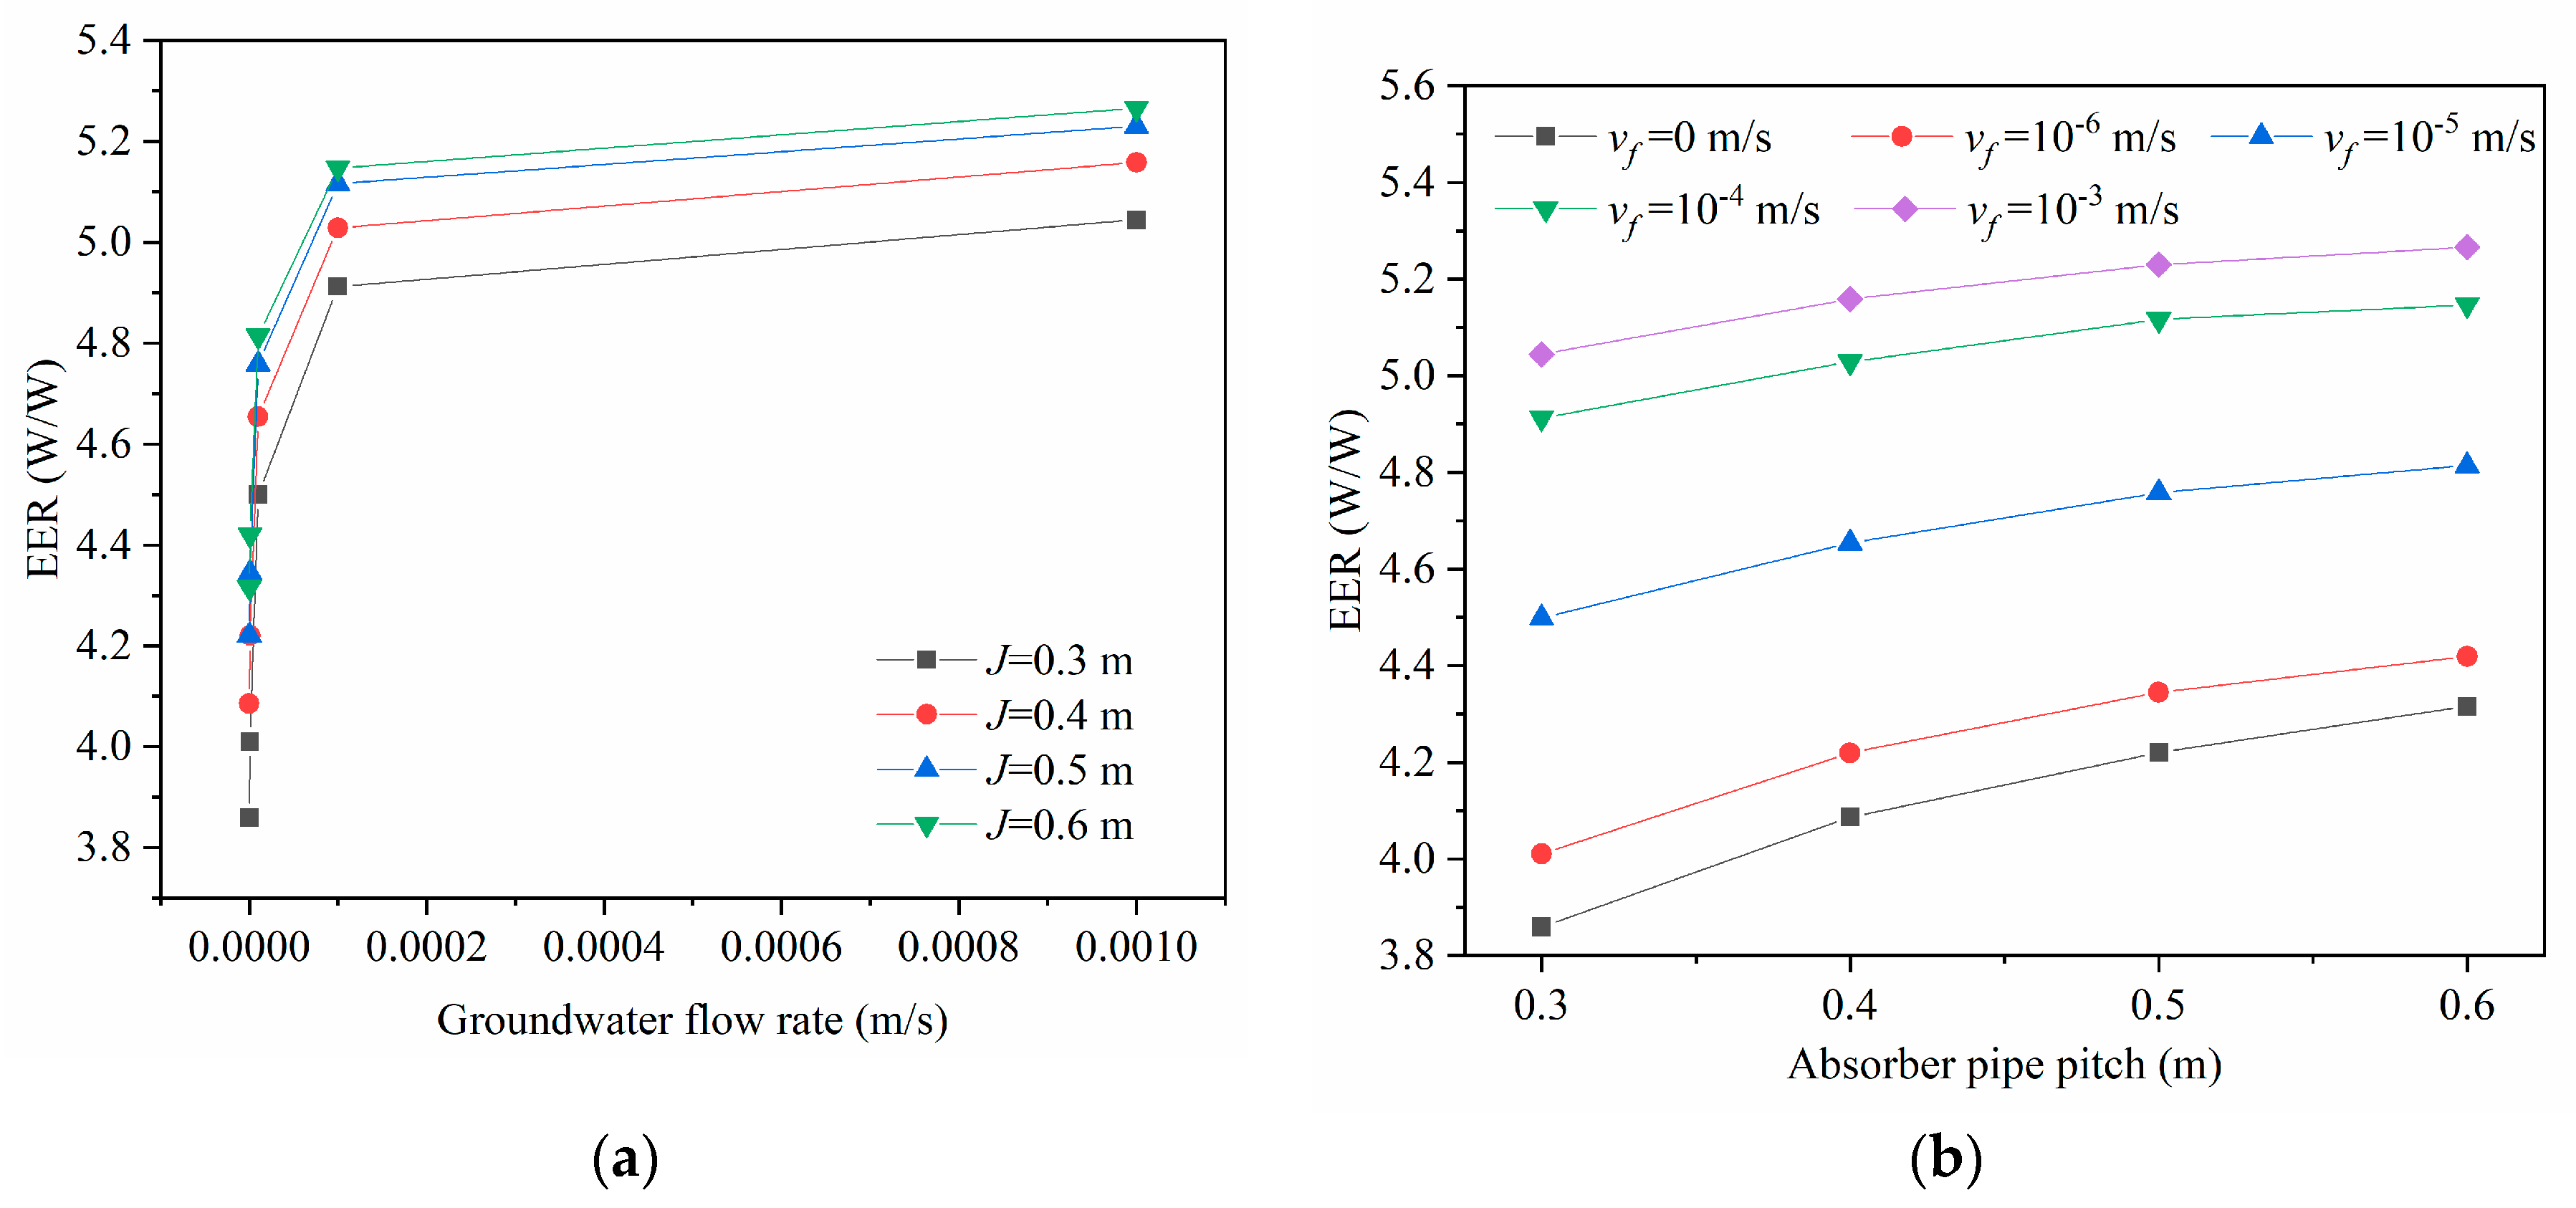
As shown in Figure 11a, the EER increased exponentially with increasing groundwater flow rate for the same pitch. The EER increased dramatically when the groundwater flow rates were from 0 m/s to 10−4 m/s. For instance, the EER under the pitch of 0.3 m increased from 3.86 to 4.91, resulting in a rate of increase of 27.20%, when the groundwater flow rates were from 0 m/s to 10−4 m/s. However, the growth rate of the EER was low when the groundwater flow rate was from 10−4 m/s to 10−3 m/s, resulting in a growth rate of 2.69%. As shown in Figure 11b, the influence of the pitch on the growth rates of EER had a diminishing trend as the groundwater flow rate increased. When the groundwater flow rate was 0 m/s, the growth rates of the EER corresponding to the absorber pipe pitches ranging from 0.3 to 0.4 m, 0.4 to 0.5 m, and 0.5 to 0.6 m were 5.88%, 3.29%, and 2.26%, respectively. When the groundwater flow rate was 10−3 m/s, the growth rates of the EER corresponding to the absorber pipe pitches ranging from 0.3 m to 0.4 m, 0.4 m to 0.5 m, and 0.5 m to 0.6 m were 2.26%, 1.38%, and 0.69%, respectively.

4.3. Effect of GHEs Absorber Pipe Length on Heat Pump Energy Efficiency

The absorber pipe length was the most influential factor in the thermal performance of the tunnel GHEs [18]. To investigate the effect of GHEs absorber pipe length on heat pump energy efficiency, the variations in the EER with increasing the absorber pipe length under the same absorber pipe pitch of 0.5 m on the 90th day are plotted in Figure 12 and Figure 13.
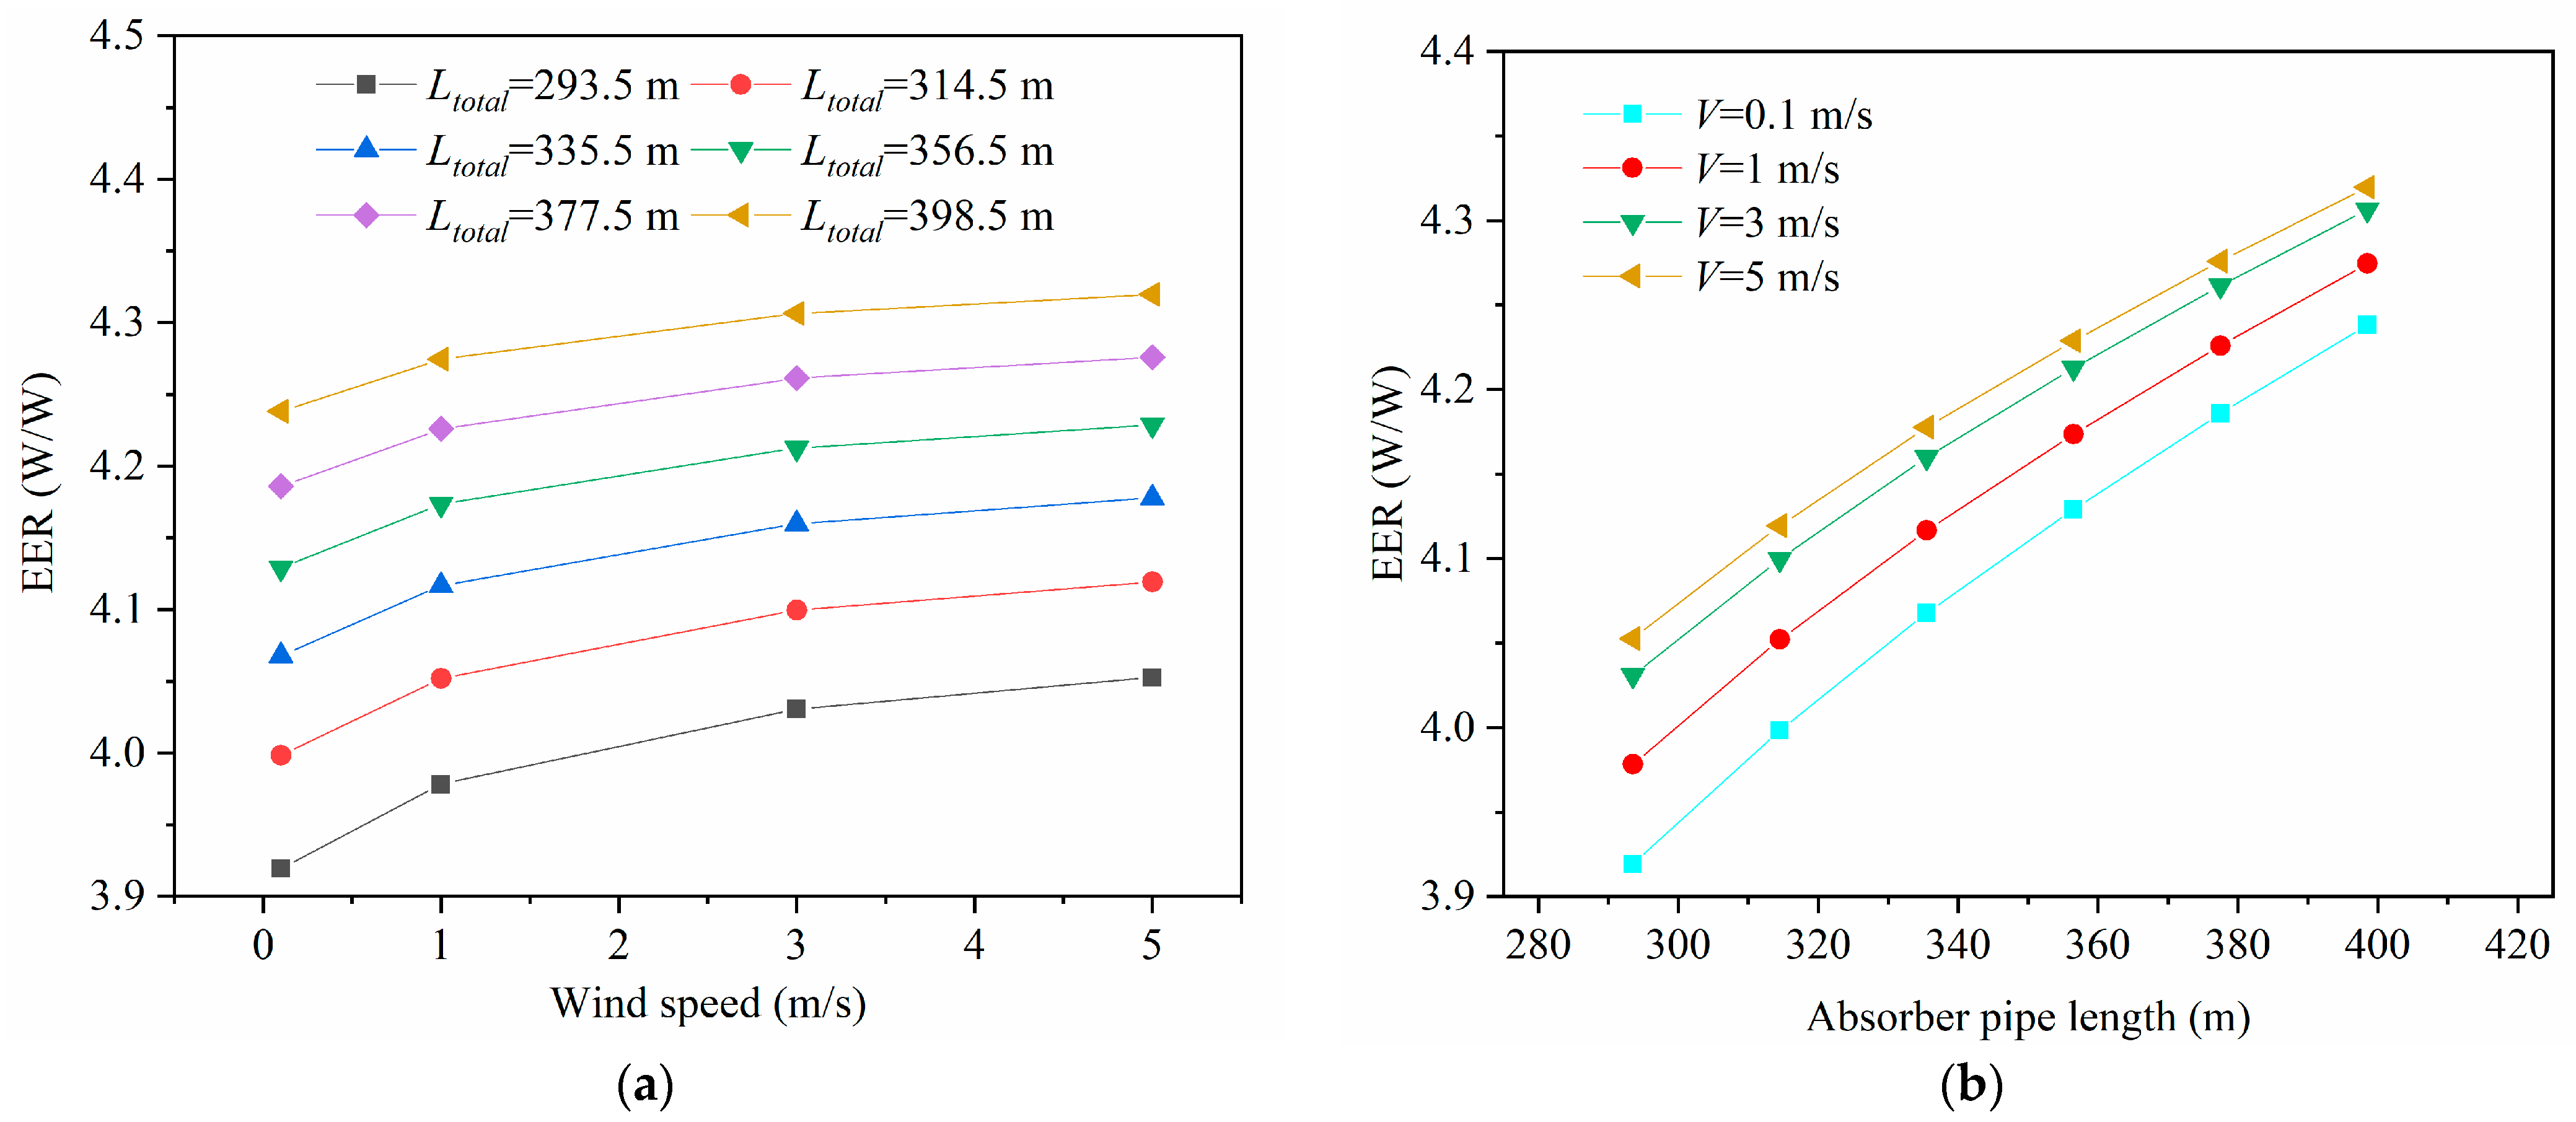
As shown in Figure 12a, the EER increased exponentially with increasing wind speed for the same length. As shown in Figure 12b, the EER increased exponentially with an increase in the absorber pipe length. The influence of the length on the growth rates of EER had a diminishing trend as the wind speed increased. The absorber pipe length ranged from 293.5 m to 398.5 m. When the wind speed was 0.1 m/s, the EER increased from 3.92 to 4.24, resulting in a rate of increase of 8.16% in the EER. When the wind speed was 5 m/s, the EER increased from 4.05 to 4.32, resulting in a rate of increase of 6.67% in the EER.
As shown in Figure 13a, the EER increased exponentially as groundwater flow rate increased for the same length. Groundwater conditions could enhance the heat pump energy efficiency significantly. For instance, when the groundwater flow rate increased from 0 m/s to 10−5 m/s, the EER under the absorber pipe length of 293.5 m increased from 3.92 to 4.52, resulting in a rate of increase of 15.31%. As shown in Figure 13b, the influence of the length on the growth rate of EER had a diminishing trend with increasing groundwater flow rate. For instance, the absorber pipe length ranged from 293.5 m to 398.5 m. When the groundwater flow rate was 0 m/s, the EER increased from 3.92 to 4.23, resulting in a rate of increase of 7.91% in the EER. When the groundwater flow rate was 10−3 m/s, the EER increased from 5.04 to 5.24, resulting in a rate of decrease of 3.97% in the EER.

4.4. Discussion

Based on the above results, the effects of the mountain tunnel lining GHEs design parameters and coupling effect of the ventilation and groundwater flow on the heat pump energy efficiency were discussed deeply in this section.
According to Section 4.2, increasing absorber pipe pitch could enhance the heat pump energy efficiency. However, the pipe pitch could not increase freely when designing the tunnel lining GHEs. As shown in Figure 10 and Figure 11, the growth rate of the EER decreased with increasing the pipe pitch. The growth rate of the EER would fall further when the wind speed and groundwater flow rate are increased. Moreover, increasing pipe pitch would lead to a larger layout area, which might be beyond the available layout area of the tunnel. Tinti et al. [8] believed that the design code of tunnel lining GHEs depended on the largest heat exchange surface area, the lowest pressure drops and investment cost. Hence, the pipe pitch design needs to consider the largest heat exchange area and shortest pipe length. The shortest pipe length can be determined based on the minimum EER [9], which is regarded as the critical pipe length. As shown in Figure 12 and Figure 13, it can be seen that the good ventilation and groundwater conditions can decrease the critical pipe length, which is helpful to save the cost. Hence, cost savings can be accomplished by arranging the absorber pipes in the tunnel section with good ventilation and groundwater conditions.
To investigate the coupling effect of ventilation and groundwater flow on the heat pump energy efficiency, the absorber pipe pitch and length were fixed at 0.5 m and 293.5 m, respectively. The EERs of the heat pump under the different wind speeds and groundwater flow rates are presented in Figure 14. The effect of wind speed on the growth rate of EER reduced gradually with increasing groundwater flow rate, and the effect of groundwater flow rate on the growth rate of EER also decreased gradually as the wind speed increased. This is because the larger wind speed and groundwater flow rate are helpful to slow down the heat accumulation of the surrounding rock. Ventilation and groundwater conditions share responsibility for improvements in heat pump energy efficiency. It is worth noting that when the groundwater flow velocity reached 10−3 m/s, the ventilation did not enhance the EER. This is because the abundant groundwater reduced heat accumulation significantly, which led to a lower temperature of the absorber pipe than the air temperature. Hence, the coupling effect of ventilation and groundwater flow is significant for the tunnel lining GHEs design. Moreover, as shown in Figure 14, the groundwater conditions have a greater influence on the heat pump energy efficiency compared with the ventilation conditions.

5. Conclusions

In this paper, a numerical model of coupling the tunnel lining GHEs and heat pump was established to investigate the effects of the absorber pipe layout type, absorber pipe pitch, absorber pipe length, wind speed and groundwater flow rate on the energy efficiency of heat pump. The main conclusions can be summarized as follows:
(1)
For the mountain tunnel, the absorber pipe arranged along the axial direction of the tunnel exhibits a higher energy efficiency for the heat pump with tunnel lining GHEs compared with the absorber pipe arranged along the cross direction of the tunnel.
(2)
The EER increases exponentially with increasing absorber pipe pitch and length. The influences of pipe pitch and length on the growth rate of EER show a diminishing trend as the wind speed and groundwater flow rate increase.
(3)
The influence of groundwater flow on the heat pump energy efficiency is more remarkable than that of tunnel ventilation. Moreover, abundant groundwater may lead to a negative effect of ventilation on the heat pump energy efficiency. Hence, the coupling effect of ventilation and groundwater flow needs to be considered for the tunnel lining GHEs design.

Author Contributions

Conceptualization, G.Z. and L.Z; methodology, X.L. and C.L.; software, C.L.; validation, G.Z.; formal analysis, X.L. and C.L.; investigation, X.L. and C.L.; resources, X.L.; data curaion, X.L. and C.L.; writing—original draft preparation, X.L., C.L.; writing—review and editing, G.Z., L.Z.; supervision, G.Z. and L.Z.; project administration, B.W. All authors have read and agreed to the published version of the manuscript.

Funding

This research received no external funding.

Institutional Review Board Statement

Not applicable.

Informed Consent Statement

Not applicable.

Data Availability Statement

The data presented in this study are available on request from the corresponding author. The data are not publicly available due to privacy issues.

Conflicts of Interest

The authors declare no conflict of interest.

References

  1. Building Energy Conservation Research Center of Tsinghua University. Annual Report on China Building Energy Efficiency, 2019 ed.; China Building Industry Press: Beijing, China, 2019. [Google Scholar]
  2. Huang, S.F.; Xie, L.Y.; Lu, L.; Zhang, X.S. Design method for heating towers used in vapor-compression heat pump systems. Build Environ. 2021, 189, 107532. [Google Scholar] [CrossRef]
  3. Lund, J.W.; Boyd, T.L. Direct utilization of geothermal energy 2015 worldwide review. Geothermics 2016, 60, 66–93. [Google Scholar] [CrossRef]
  4. Jiang, G.; Lin, C.; Shao, D.; Huang, M.; Lu, H.; Chen, G.; Zong, C. Thermo-mechanical behavior of driven energy piles from full-scale load tests. Energy Build. 2021, 233, 110668. [Google Scholar] [CrossRef]
  5. Yang, W.B.; Lu, P.F.; Chen, Y.P. Laboratory investigations of the thermal performance of an energy pile with spiral coil ground heat exchanger. Energy Build. 2016, 128, 491–502. [Google Scholar] [CrossRef]
  6. Rui, Y.; Yin, M. Thermo-hydro-mechanical coupling analysis of a thermo-active diaphragm wall. Can. Geotech. J. 2018, 55, 720–735. [Google Scholar] [CrossRef] [Green Version]
  7. Brandl, H. Energy foundations and other thermo-active ground structures. Geotechnique 2006, 56, 81–122. [Google Scholar] [CrossRef]
  8. Tinti, F.; Boldini, D.; Ferrari, M.; Lanconelli, M.; Kasmaee, S.; Bruno, R.; Egger, H.; Voza, A.; Zurlo, R. Exploitation of geothermal energy using tunnel lining technology in a mountain environment. A feasibility study for the Brenner Base tunnel—BBT. Tunn. Undergr. Space Technol. 2017, 70, 182–203. [Google Scholar] [CrossRef]
  9. Adam, D.; Markiewicz, R. Energy from earth-coupled structures, foundations, tunnels and sewers. Geotechnique 2009, 59, 229–236. [Google Scholar] [CrossRef]
  10. Zhang, G.Z.; Xia, C.C.; Yang, Y.; Sun, M.; Zou, Y.C. Experimental study on the thermal performance of tunnel lining ground heat exchangers. Energy Build. 2014, 77, 149–157. [Google Scholar] [CrossRef]
  11. Barla, M.; Di Donna, A.; Perino, A. Application of energy tunnels to an urban environment. Geothermics 2016, 61, 104–113. [Google Scholar] [CrossRef]
  12. Insana, A.; Barla, M. Experimental and numerical investigations on the energy performance of a thermo-active tunnel. Renew. Energy 2020, 152, 781–792. [Google Scholar] [CrossRef]
  13. Di Donna, A.; Barla, M. The role of ground conditions on energy tunnels’ heat exchange. Environ. Geotech. 2016, 3, 214–224. [Google Scholar] [CrossRef]
  14. Bidarmaghz, A.; Narsilio, G.A. Heat exchange mechanisms in energy tunnel systems. Geomech. Energy Environ. 2018, 16, 83–95. [Google Scholar] [CrossRef]
  15. Zhang, G.Z.; Xia, C.C.; Zhao, X.; Zhou, S. Effect of ventilation on the thermal performance of tunnel lining GHEs. Appl. Therm. Eng. 2016, 93, 416–424. [Google Scholar] [CrossRef]
  16. Li, C.; Zhang, G.; Xie, Y.; Liu, X.; Cao, S. Numerical investigation of energy tunnel lining ground heat exchangers in a mountain environment. IOP Conf. Ser. Earth Environ. Sci. 2021, 861, 072127. [Google Scholar] [CrossRef]
  17. Dornberger, S.C.; Rotta Loria, A.F.; Zhang, M.; Bu, L.; Epard, J.-L.; Turberg, P. Heat exchange potential of energy tunnels for different internal airflow characteristics. Geomech. Energy Envirion. 2020, 100229. [Google Scholar] [CrossRef]
  18. Zhang, G.Z.; Liu, S.Y.; Zhao, X.; Ye, M.; Chen, R.F.; Zhang, H.L.; Yang, J.D.; Chen, J.W. The coupling effect of ventilation and groundwater flow on the thermal performance of tunnel lining GHEs. Appl. Therm. Eng. 2017, 112, 595–605. [Google Scholar] [CrossRef]
  19. Ogunleye, O.; Singh, R.M.; Cecinato, F.; Chan Choi, J. Effect of intermittent operation on the thermal efficiency of energy tunnels under varying tunnel air temperature. Renew. Energy 2020, 146, 2646–2658. [Google Scholar] [CrossRef]
  20. Ogunleye, O.; Singh, R.M.; Cecinato, F. Assessing the thermal efficiency of energy tunnels using numerical methods and Taguchi statistical approach. Appl. Therm. Eng. 2021, 185, 116377. [Google Scholar] [CrossRef]
  21. Ma, C.J.; Donna, A.D.; Dias, D.; Zhang, J.M. Numerical investigations of the tunnel environment effect on the performance of energy tunnels. Renew. Energy 2021, 172, 1279–1292. [Google Scholar] [CrossRef]
  22. Defraeye, T.; Blocken, B.; Carmeliet, J. Convective heat transfer coefficients for exterior building surfaces: Existing correlations and CFD modelling. Energy Convers. Manag. 2011, 52, 512–522. [Google Scholar] [CrossRef] [Green Version]
  23. Liu, J.; Heidarinejad, M.; Gracik, S.; Srebric, J. The impact of exterior surface convective heat transfer coefficients on the building energy consumption in urban neighborhoods with different plan area densities. Energy Build. 2015, 86, 449–463. [Google Scholar] [CrossRef]
  24. Zhang, L.F.; Chen, J.Y.; Wang, J.Q.; Huang, G.S. Estimation of soil and grout thermal properties for ground-coupled heat pump systems: Development and application. Appl. Therm. Eng. 2018, 143, 112–122. [Google Scholar] [CrossRef]
  25. Zhang, L.F.; Huang, G.S.; Zhang, Q.; Wang, J.G. An hourly simulation method for the energy performance of an office building served by a ground-coupled heat pump system. Renew. Energy 2018, 126, 495–508. [Google Scholar] [CrossRef]
  26. Zhang, C.X.; Hu, S.T.; Liu, Y.F.; Wang, Q. Optimal design of borehole heat exchangers based on hourly load simulation. Energy 2016, 116, 1180–1190. [Google Scholar] [CrossRef]
  27. Ministry of Housing and Urban-Rural Development of the People’s Republic of China. Design Code for Heating Ventilation and Air Conditioning of Civil Buildings; GB50736-2012; China Architecture & Building Press: Beijing, China, 2012. [Google Scholar]
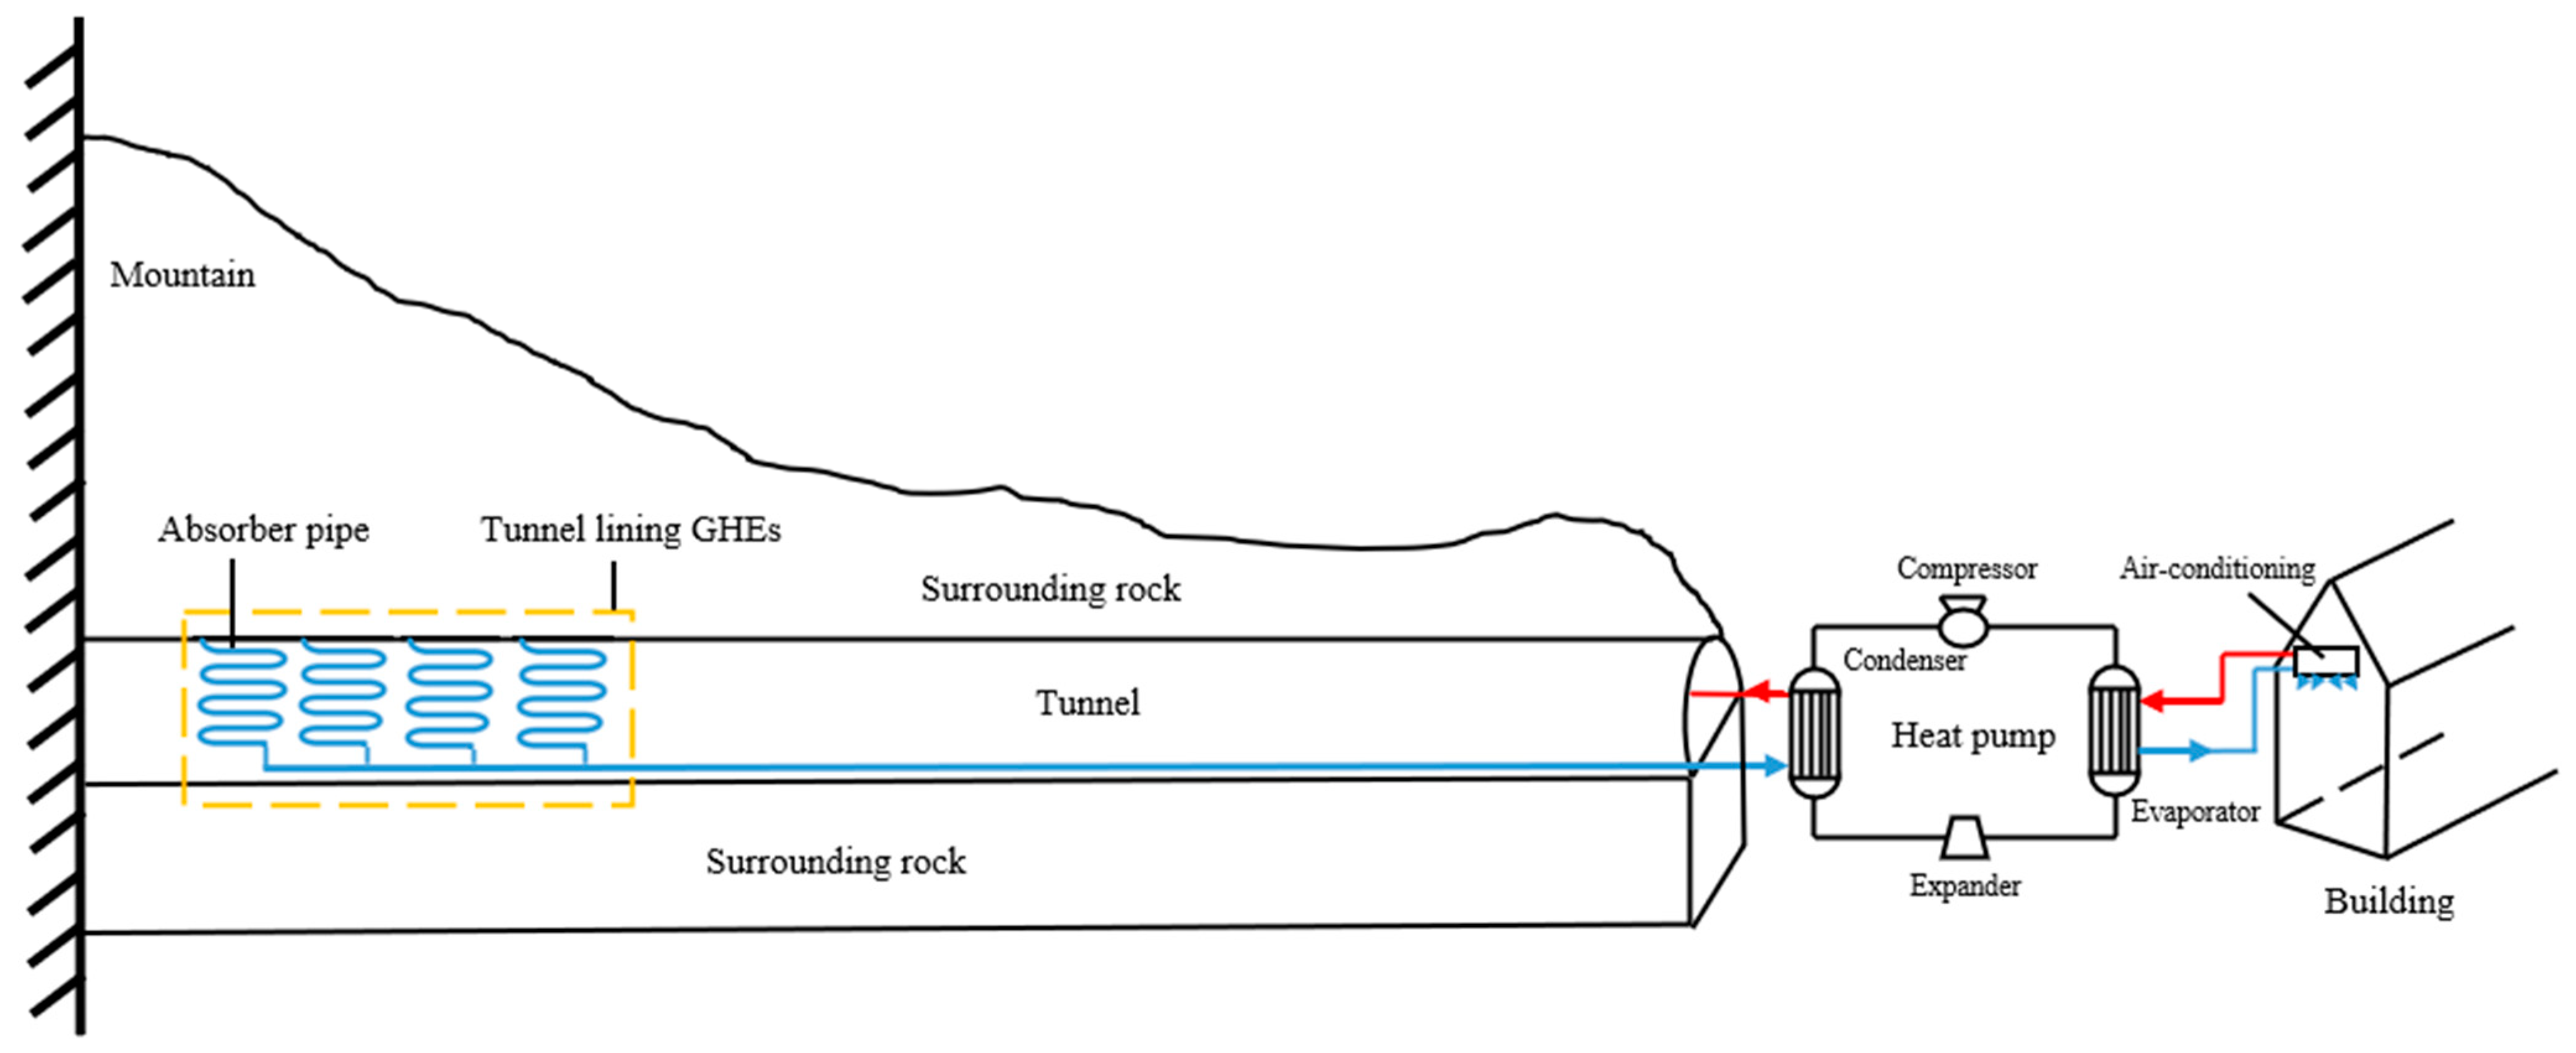
Figure 1. Diagram of tunnel lining GHEs.
Buildings 11 00611 g001
Figure 2. Schematic of heat transfer model.
Buildings 11 00611 g002
Figure 3. Schematic of inlet temperature variation.
Buildings 11 00611 g003
Figure 4. A 3D view of proposed heat transfer model.
Buildings 11 00611 g004
Figure 5. Numerical and experimental results.
Buildings 11 00611 g005
Figure 6. (a) Type-1 layout and (b) type-2 layout.
Buildings 11 00611 g006
Figure 7. Variation in EER with the elapsed time.
Buildings 11 00611 g007
Figure 8. Ground temperature distributions of different absorber pipe layout types.
Buildings 11 00611 g008
Figure 9. (a) Heat transfer schematic of type-1 absorber pipe layout at tunnel surface. (b) Heat transfer schematic of type-2 absorber pipe layout at tunnel surface.
Buildings 11 00611 g009
Figure 10. (a) Variation in EER with wind speed under different absorber pipe pitches. (b) Variation in EER with absorber pipe pitch under different wind speeds.
Buildings 11 00611 g010
Figure 11. (a) Variation in EER with groundwater flow rate under different absorber pipe pitches. (b) Variation in EER with absorber pipe pitch under different groundwater flow rates.
Buildings 11 00611 g011
Figure 12. (a) Variation in EER with wind speed under different absorber pipe lengths. (b) Variation in EER with absorber pipe length under different wind speeds.
Buildings 11 00611 g012
Figure 13. (a) Variation in EER with groundwater flow rate under different absorber pipe lengths. (b) Variation in EER with absorber pipe length under different groundwater flow rates.
Buildings 11 00611 g013
Figure 14. Coupling effect of ventilation and groundwater flow on energy efficiency.
Buildings 11 00611 g014
Table 1. Parameters of model.
MaterialParametersUnitValue
RockMass density (ρr)kg/m32530
Thermal conductivity (kr)W/m °C3.22
Specific heat capacity (Cp,r)J/kg °C1670
Tunnel liningMass density (ρ1, ρ2)kg/m32400
Thermal conductivity (k1, k2)W/m °C1.85
Specific heat capacity (Cp,1, Cp,2)J/kg °C970
Inner diameter (dt,in)m5.7
Primary lining thickness (б1)m0.17
Secondary lining thickness (б2)m0.35
Absorber pipeThermal conductivity (kp)W/m °C0.32
Inner diameter (dp,in)mm23
Outer diameter (dp,out)mm32
Flow velocity (uL)m/s0.6
Pipe pitch (J)m0.5
Pipe length (L)m70
Carrier liquidThermal conductivity (kL)W/m °C0.56
Specific heat capacity (Cp,L)J/kg °C4200
Mass density (ρL)kg/m31000
Table 2. Grid study.
Elements Number Temperature (°C)
1,362,8528.46
1,662,1528.42
1,971,6998.38
2,326,8498.36
2,666,9518.36
Table 3. Parameters of parametric numerical study.
CharacteristicUnitValue
Pipe pitch (J)m0.3, 0.4, 0.5 S, 0.6
Pipe length (L)m250–400
Wind speed (V)m/s0.1 S, 1, 3, 5
Groundwater flow rate (vf)m/s0 S, 10−6, 10−5, 10−4, 10−3
The parameters with subscripts are the standard values when the other parameters are investigated.
Publisher’s Note: MDPI stays neutral with regard to jurisdictional claims in published maps and institutional affiliations.