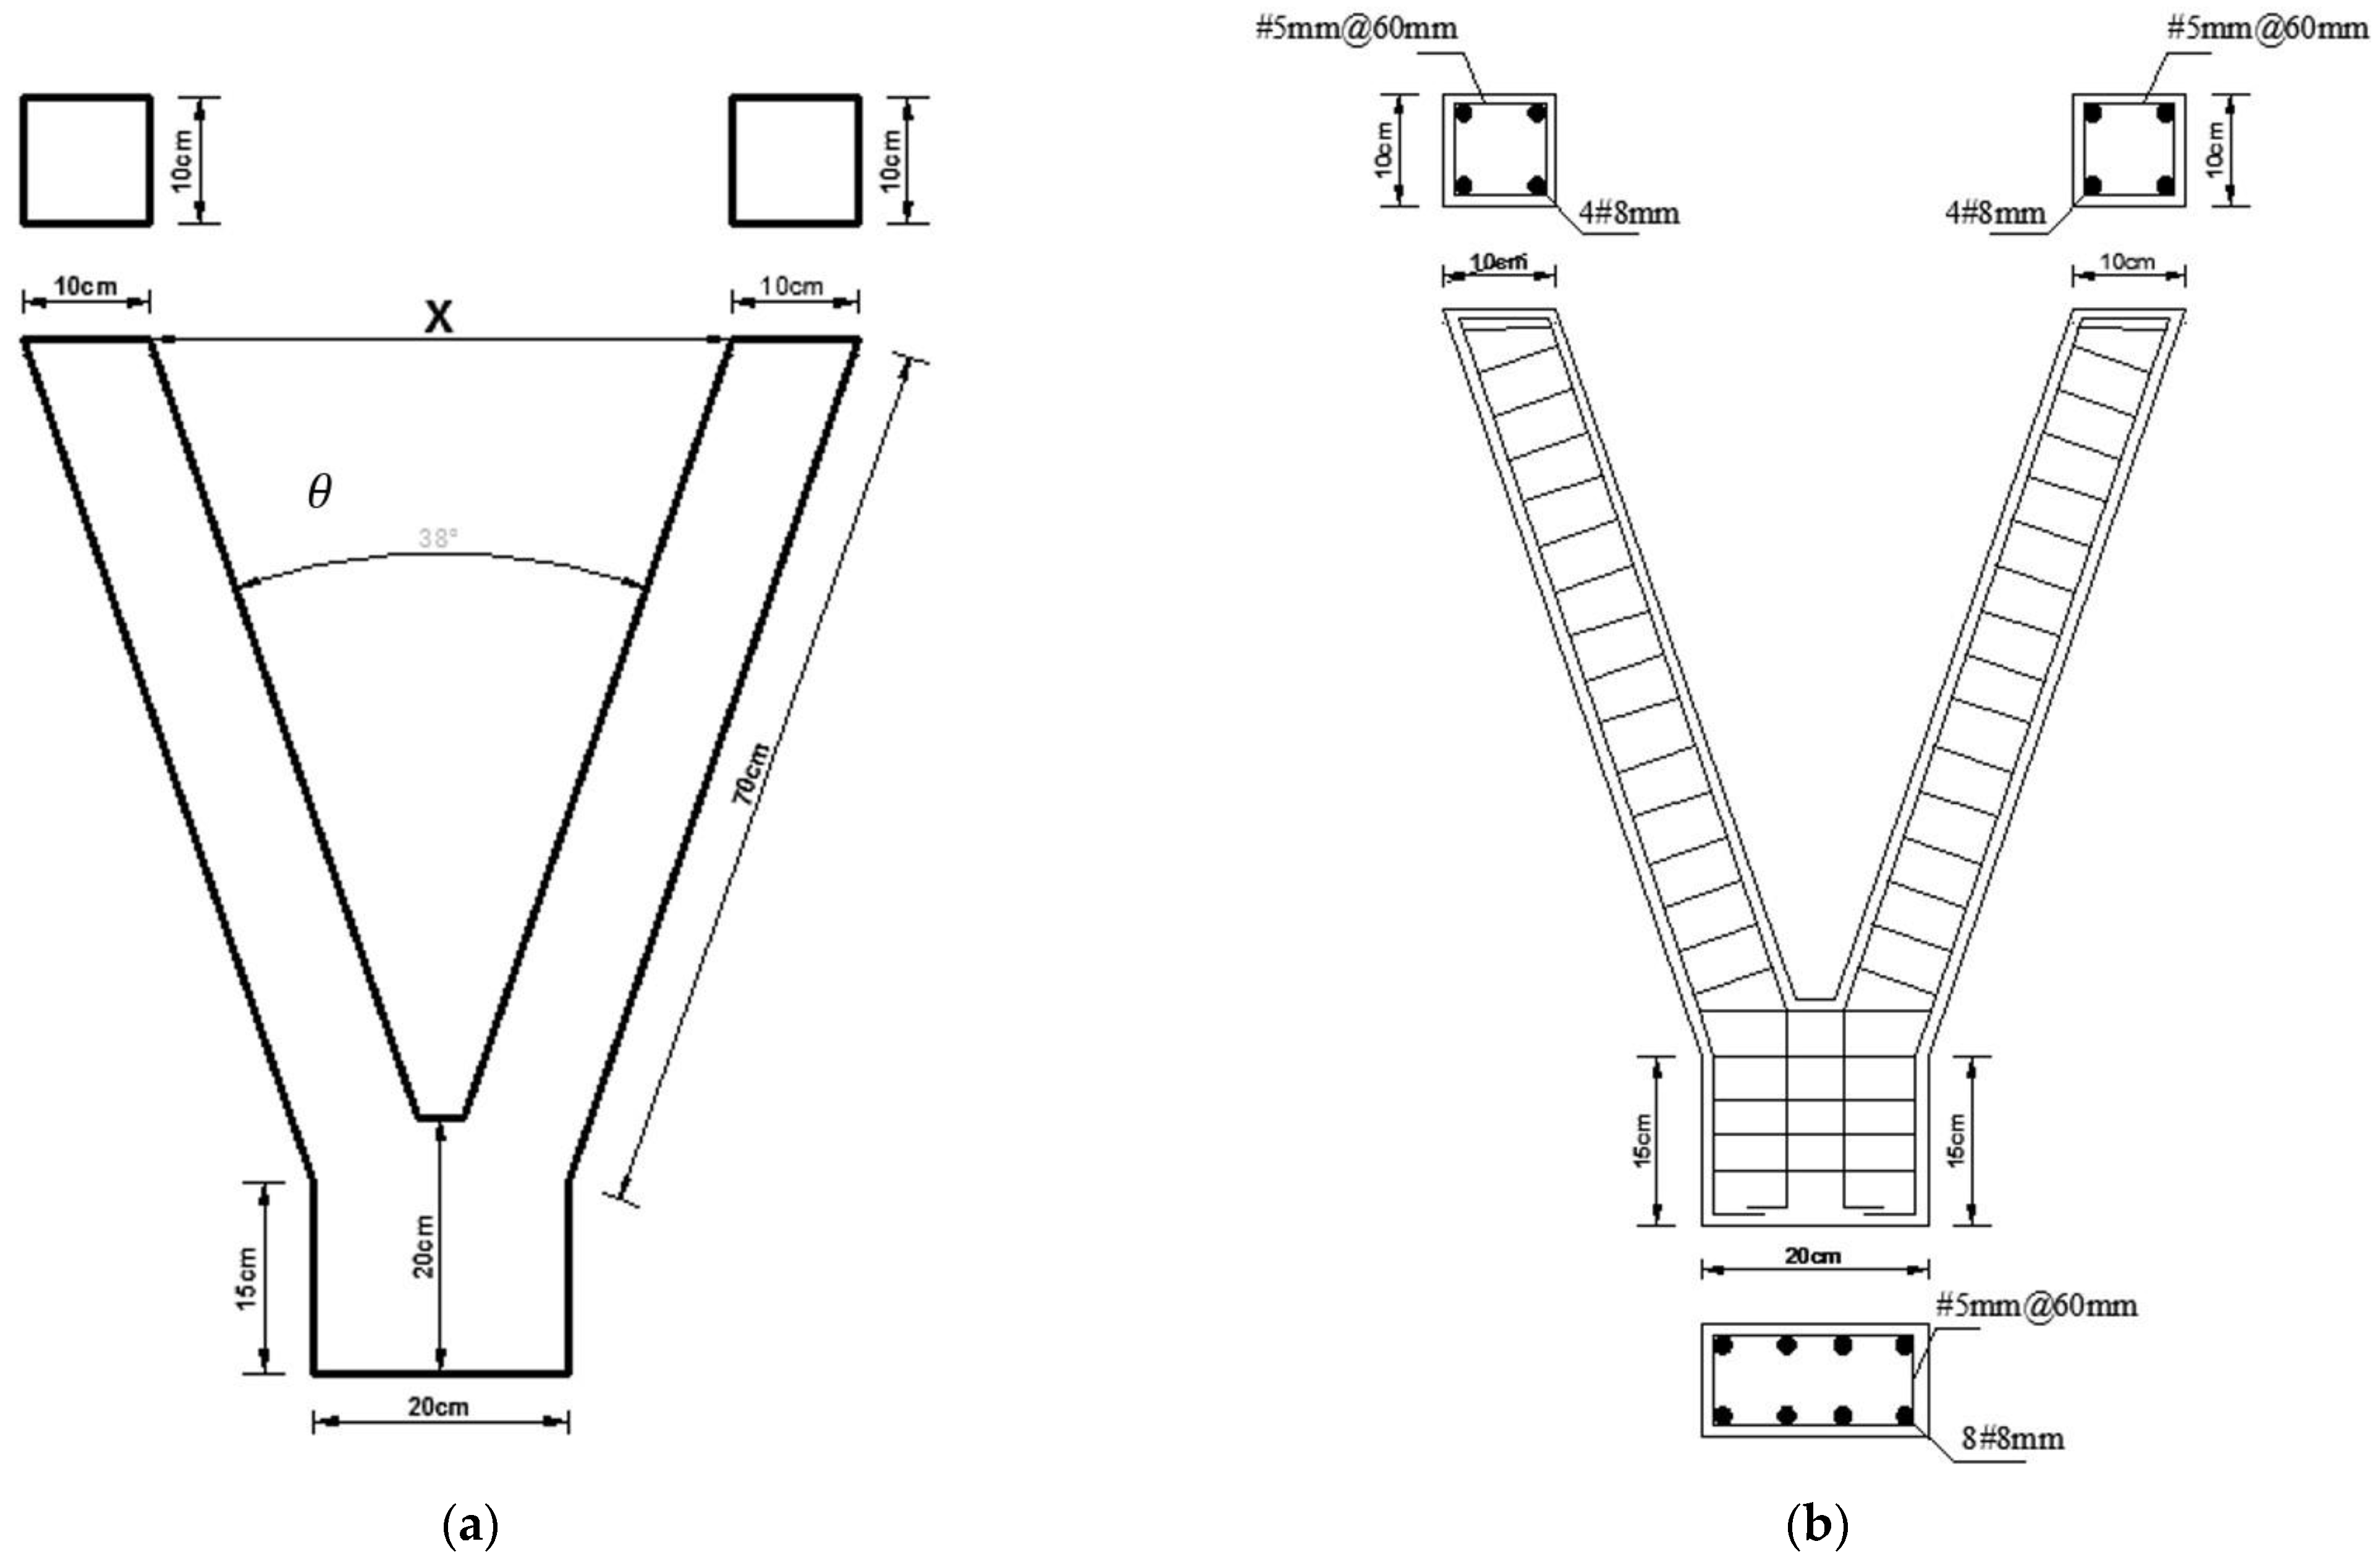
Figure 1.
(a) Configurations of V-shaped column and (b) reinforcement details.
Figure 1.
(a) Configurations of V-shaped column and (b) reinforcement details.
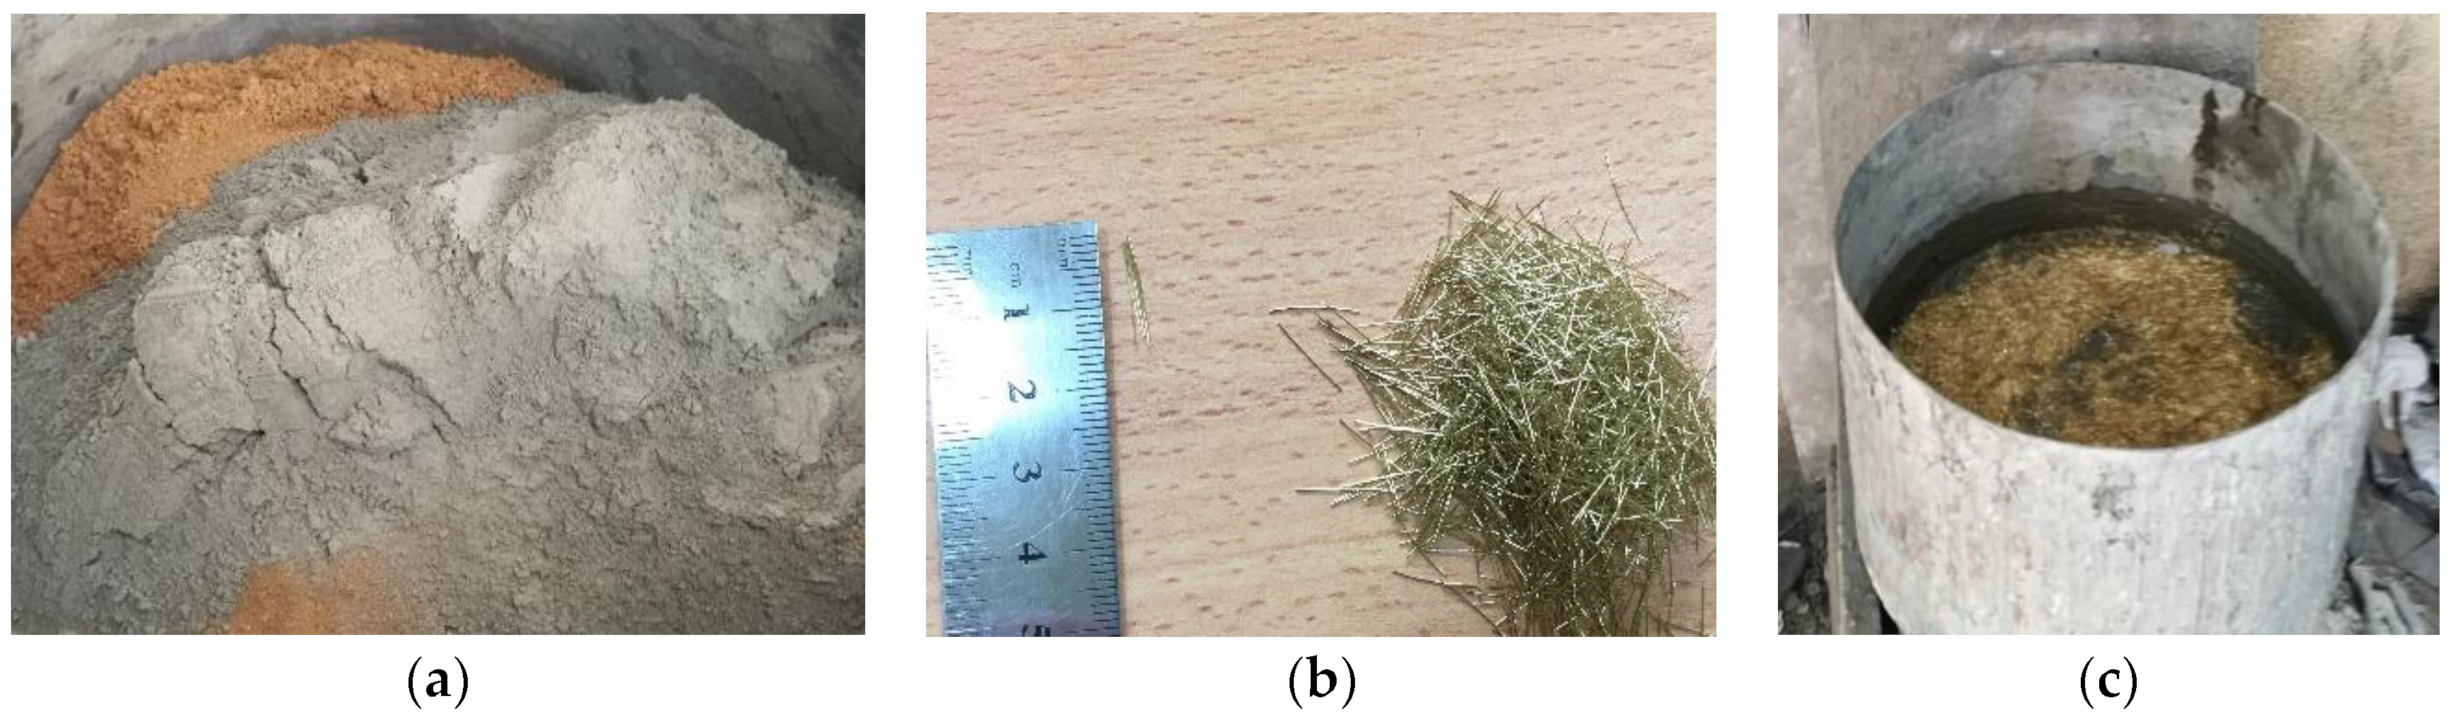
Figure 2.
Concrete mix components: (a) sand–cement, (b) MSSF, and (c) adding fiber to mixture.
Figure 2.
Concrete mix components: (a) sand–cement, (b) MSSF, and (c) adding fiber to mixture.
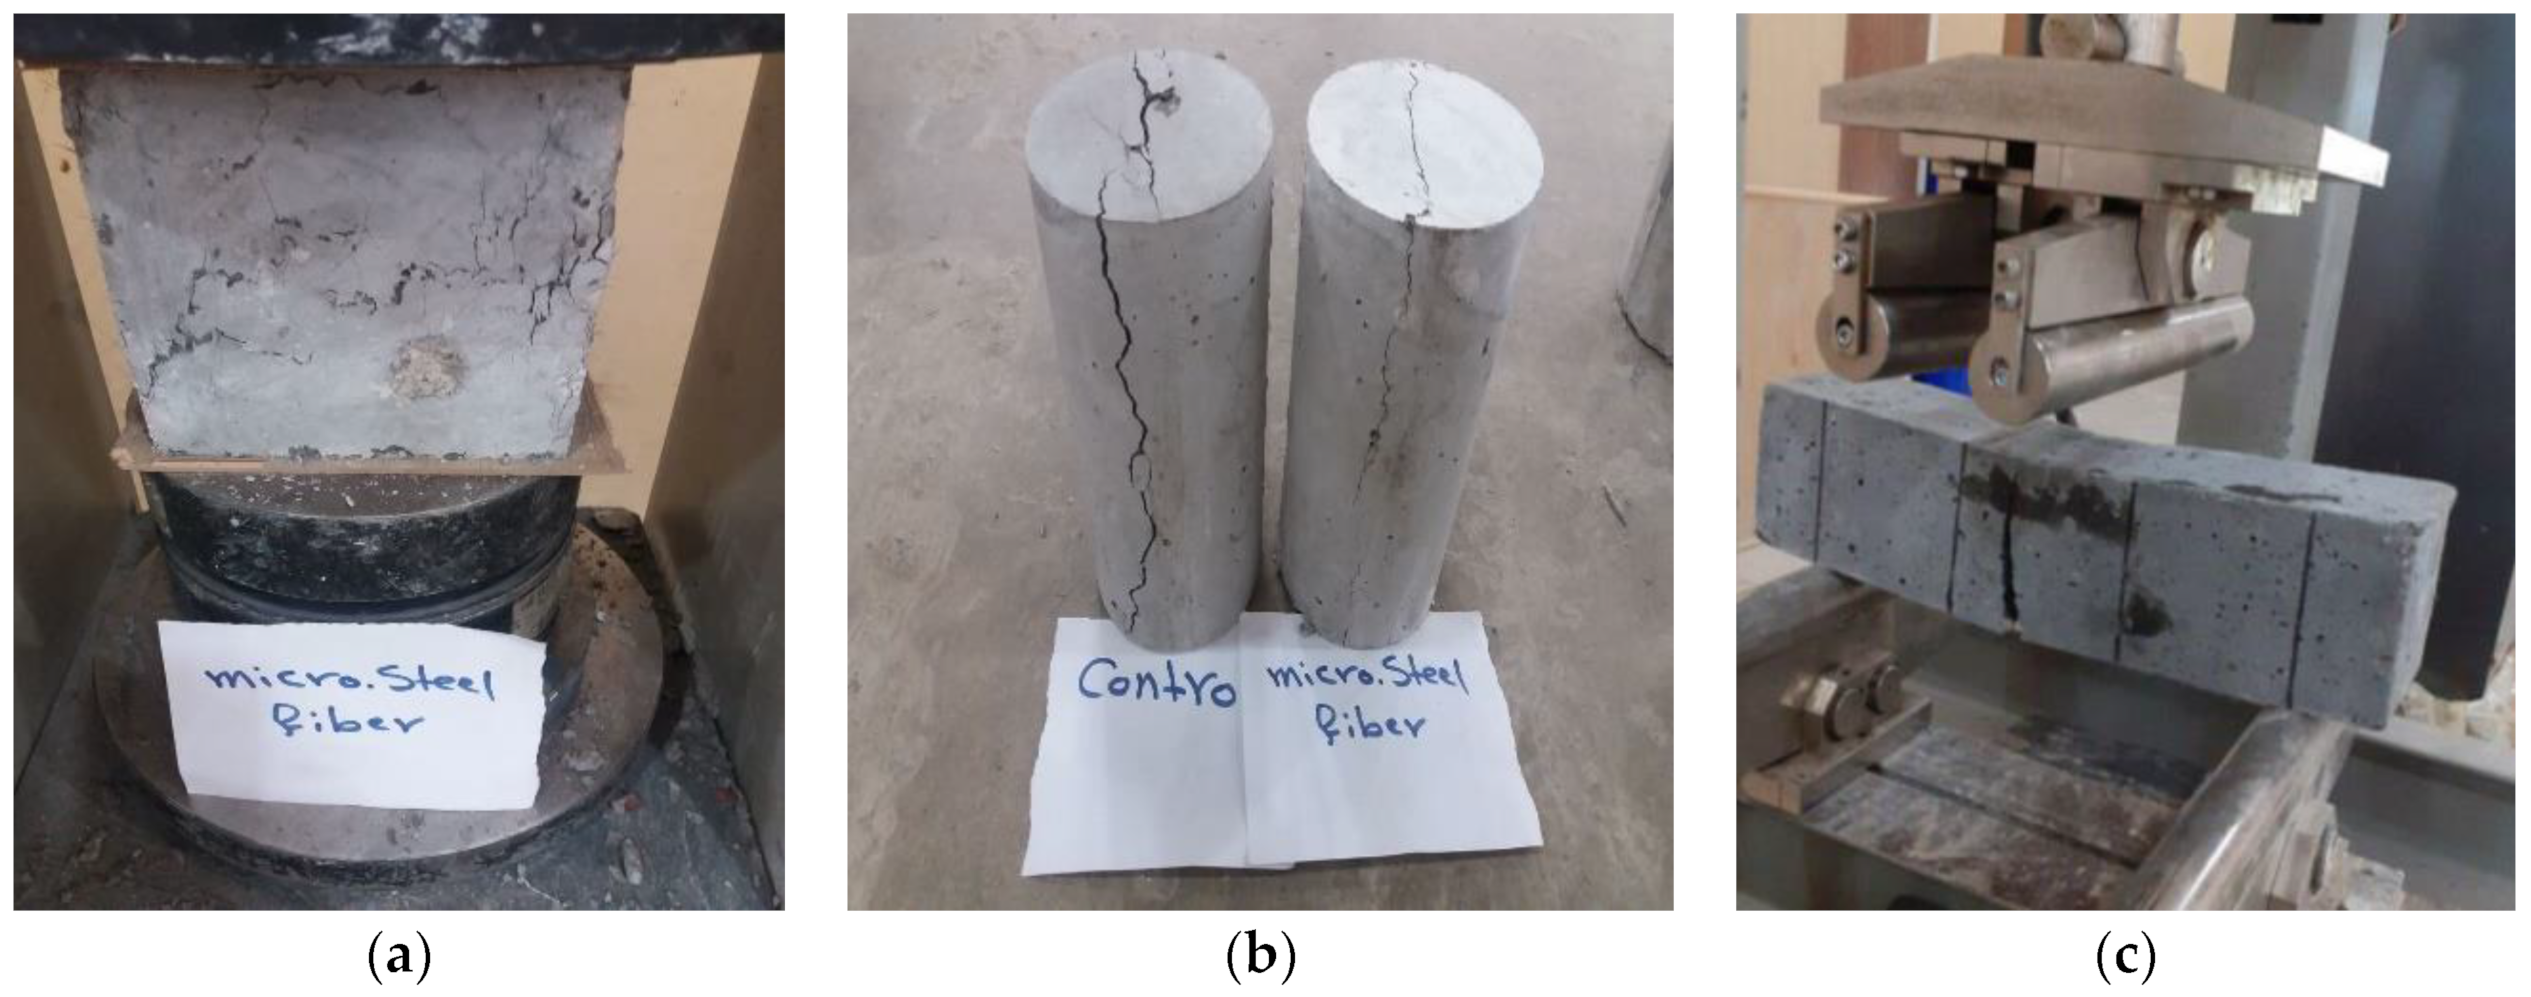
Figure 3.
(a) Compressive strength test, (b) splitting strength test, and (c) flexural test.
Figure 3.
(a) Compressive strength test, (b) splitting strength test, and (c) flexural test.
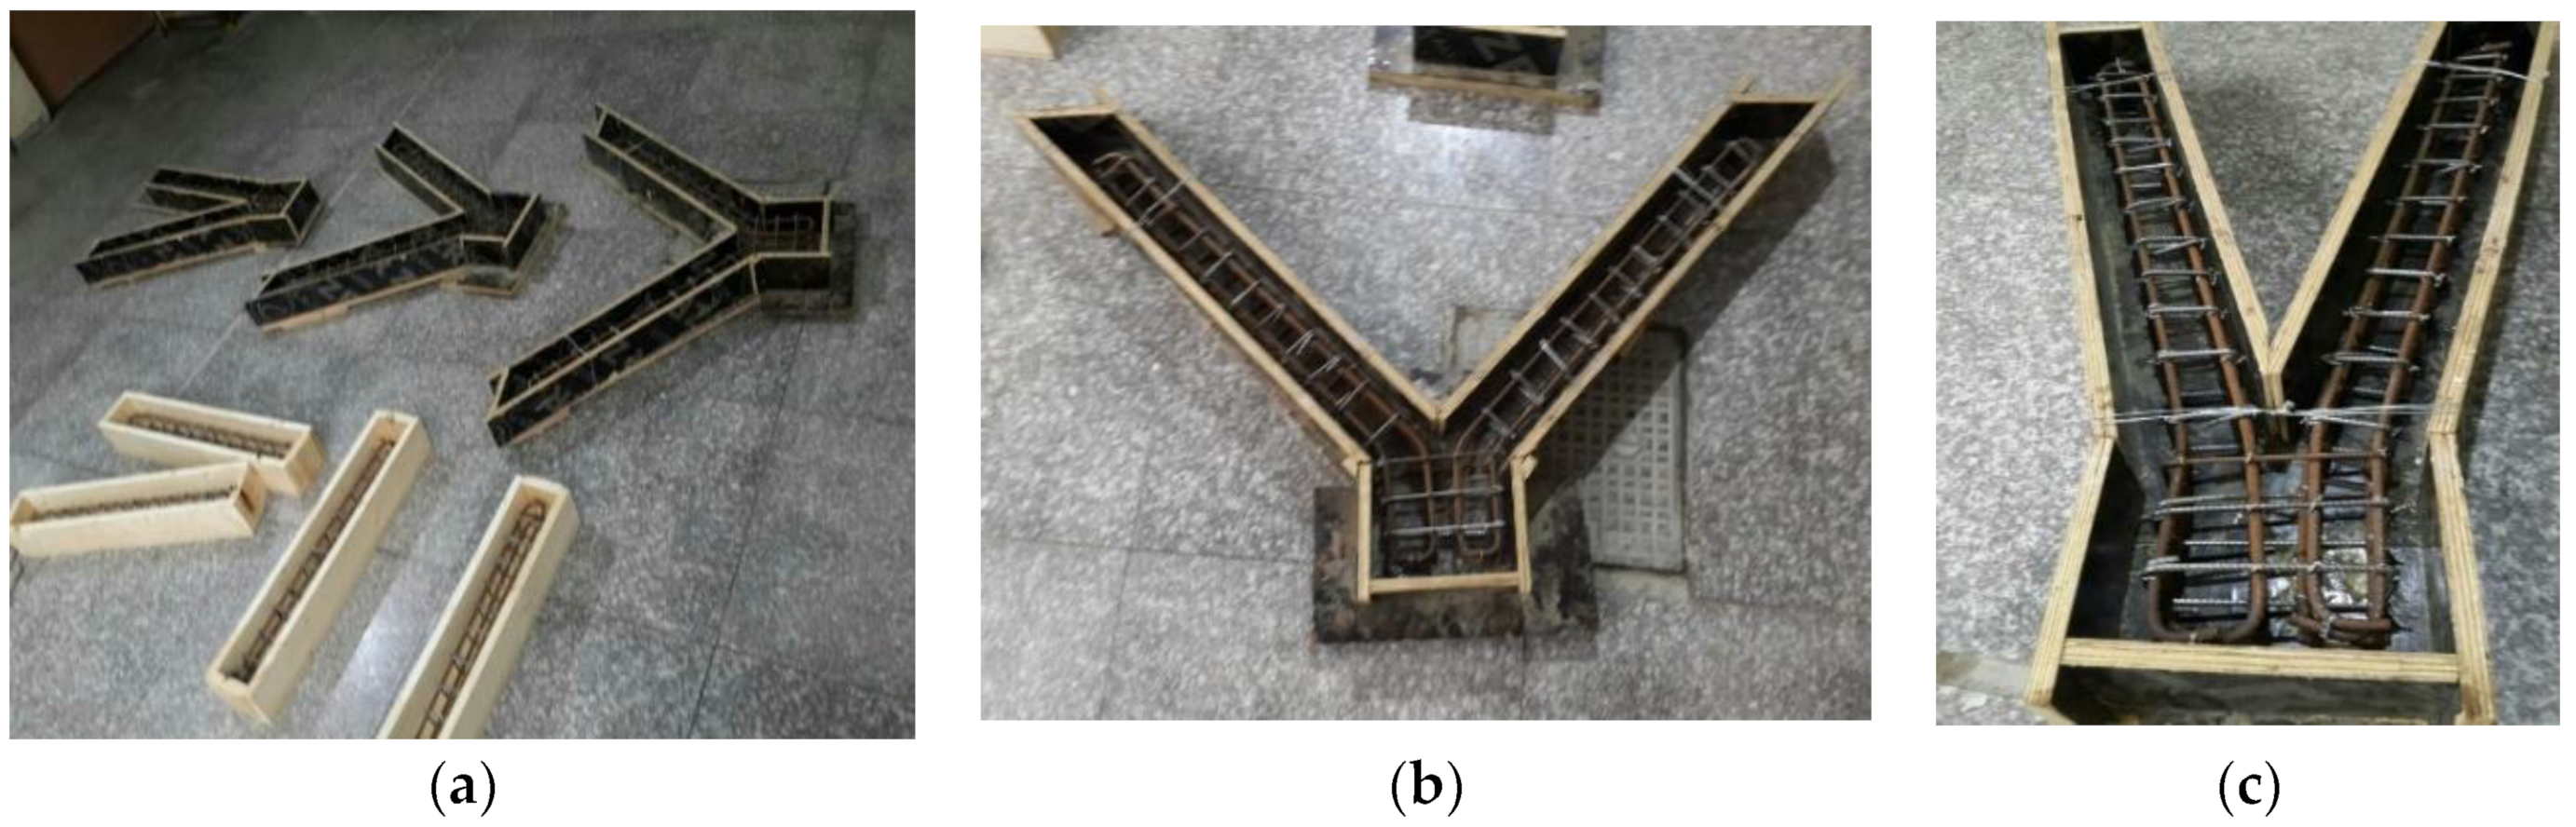
Figure 4.
(a) All models, (b,c) details of reinforcement and details of V-shape.
Figure 4.
(a) All models, (b,c) details of reinforcement and details of V-shape.
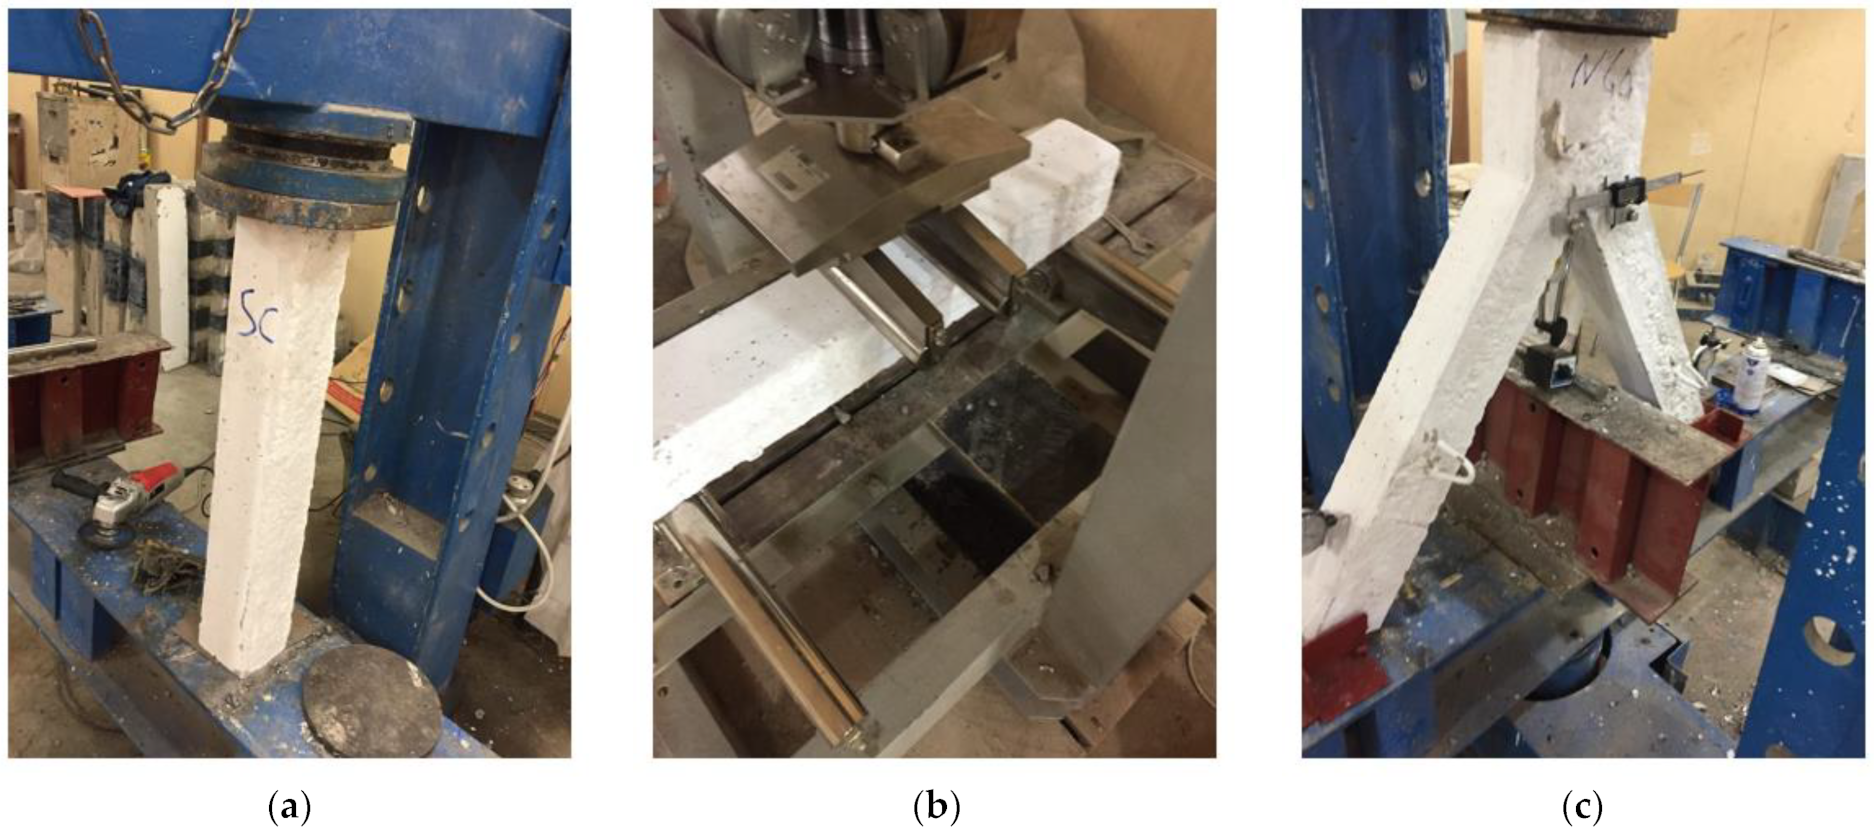
Figure 5.
Test setups for (a) vertical column test, (b) beam test, (c) V-shaped column test.
Figure 5.
Test setups for (a) vertical column test, (b) beam test, (c) V-shaped column test.
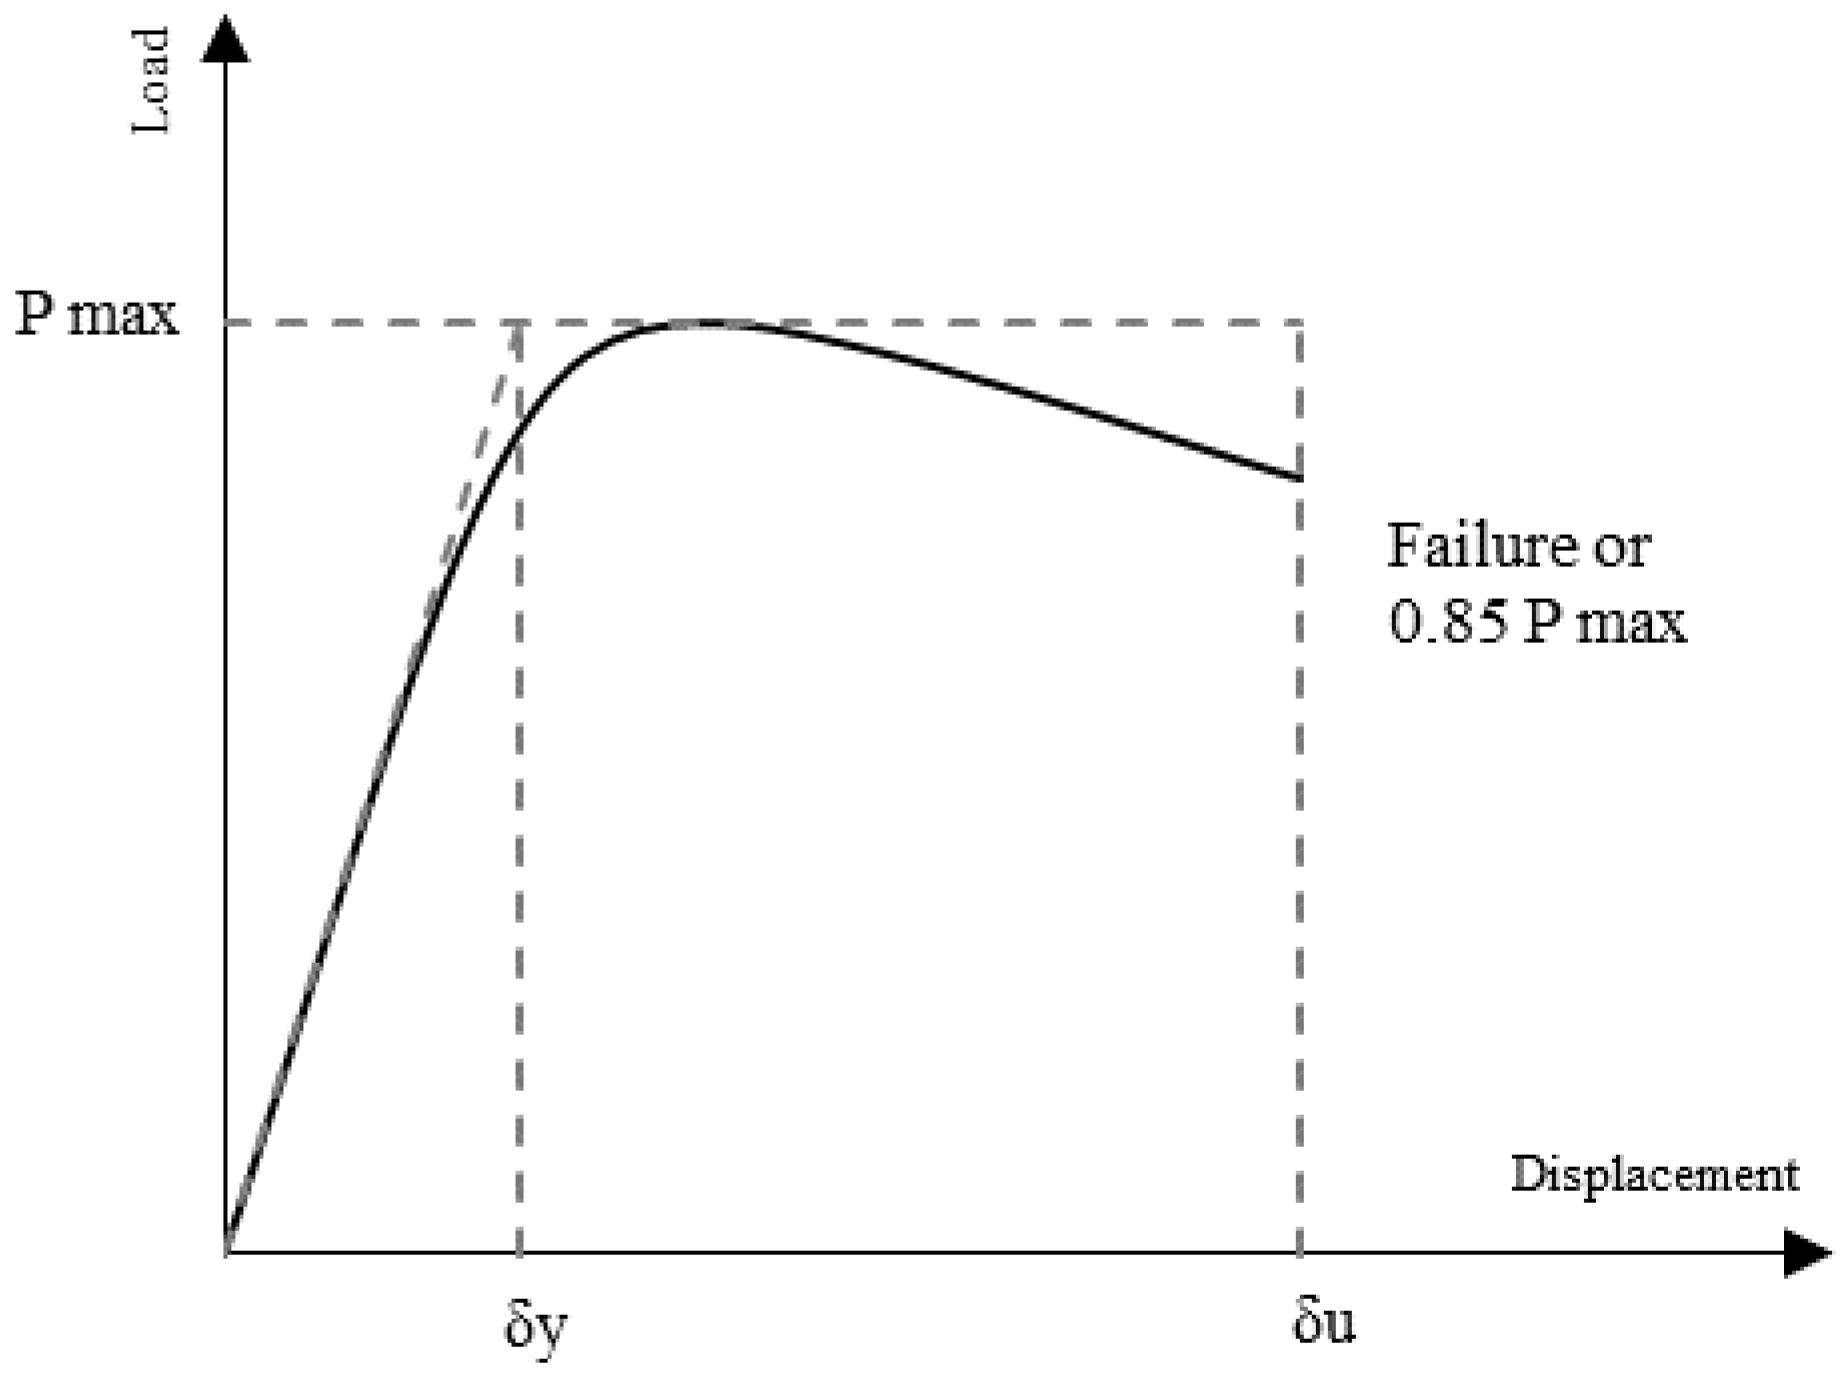
Figure 6.
Determination of yield and ultimate displacements of columns, adapted from ref. [
36].
Figure 6.
Determination of yield and ultimate displacements of columns, adapted from ref. [
36].
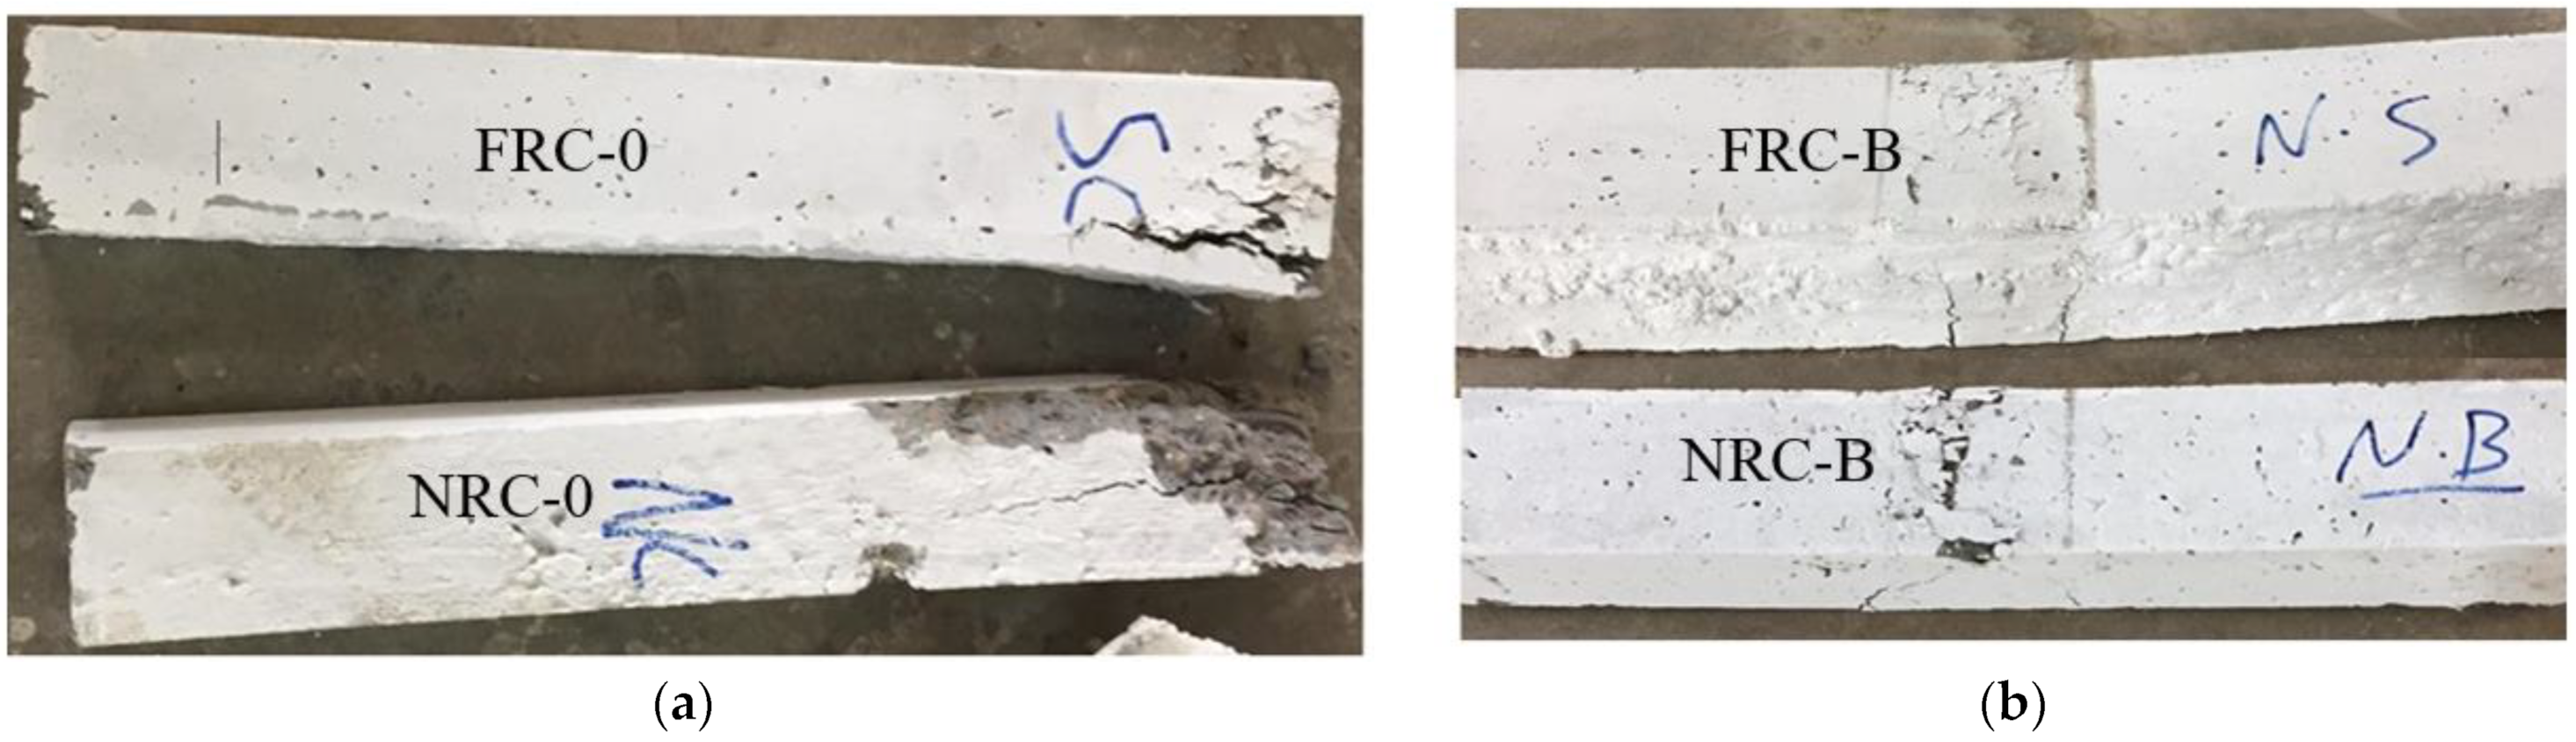
Figure 7.
Failure mode of NRC and FRC (a) columns and (b) beams.
Figure 7.
Failure mode of NRC and FRC (a) columns and (b) beams.
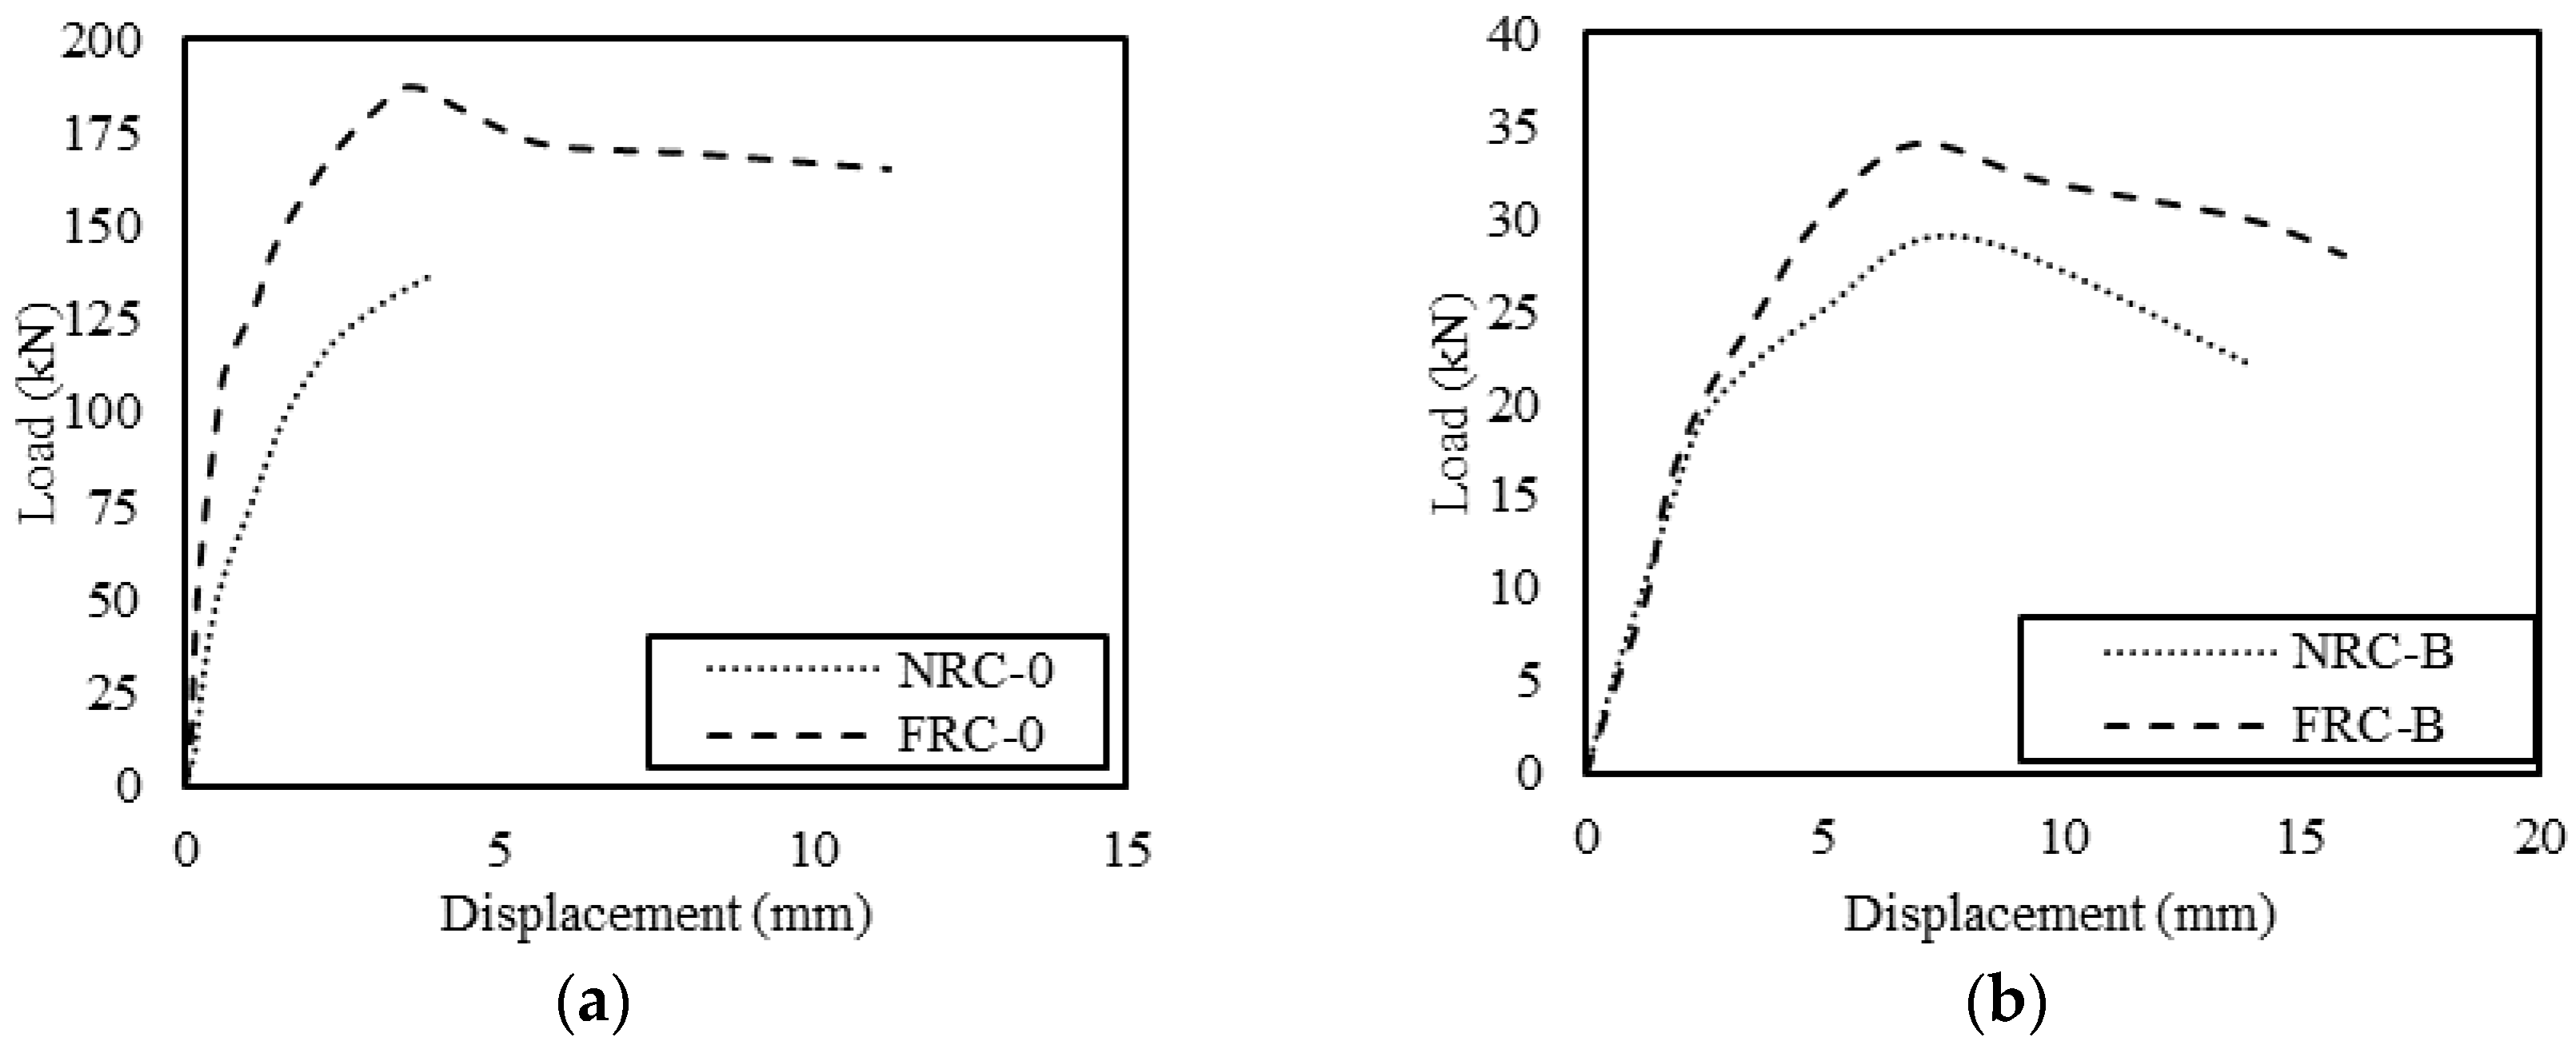
Figure 8.
Load–axial deformation of NRC-0 and FRC-0 (a) columns and (b) beams.
Figure 8.
Load–axial deformation of NRC-0 and FRC-0 (a) columns and (b) beams.
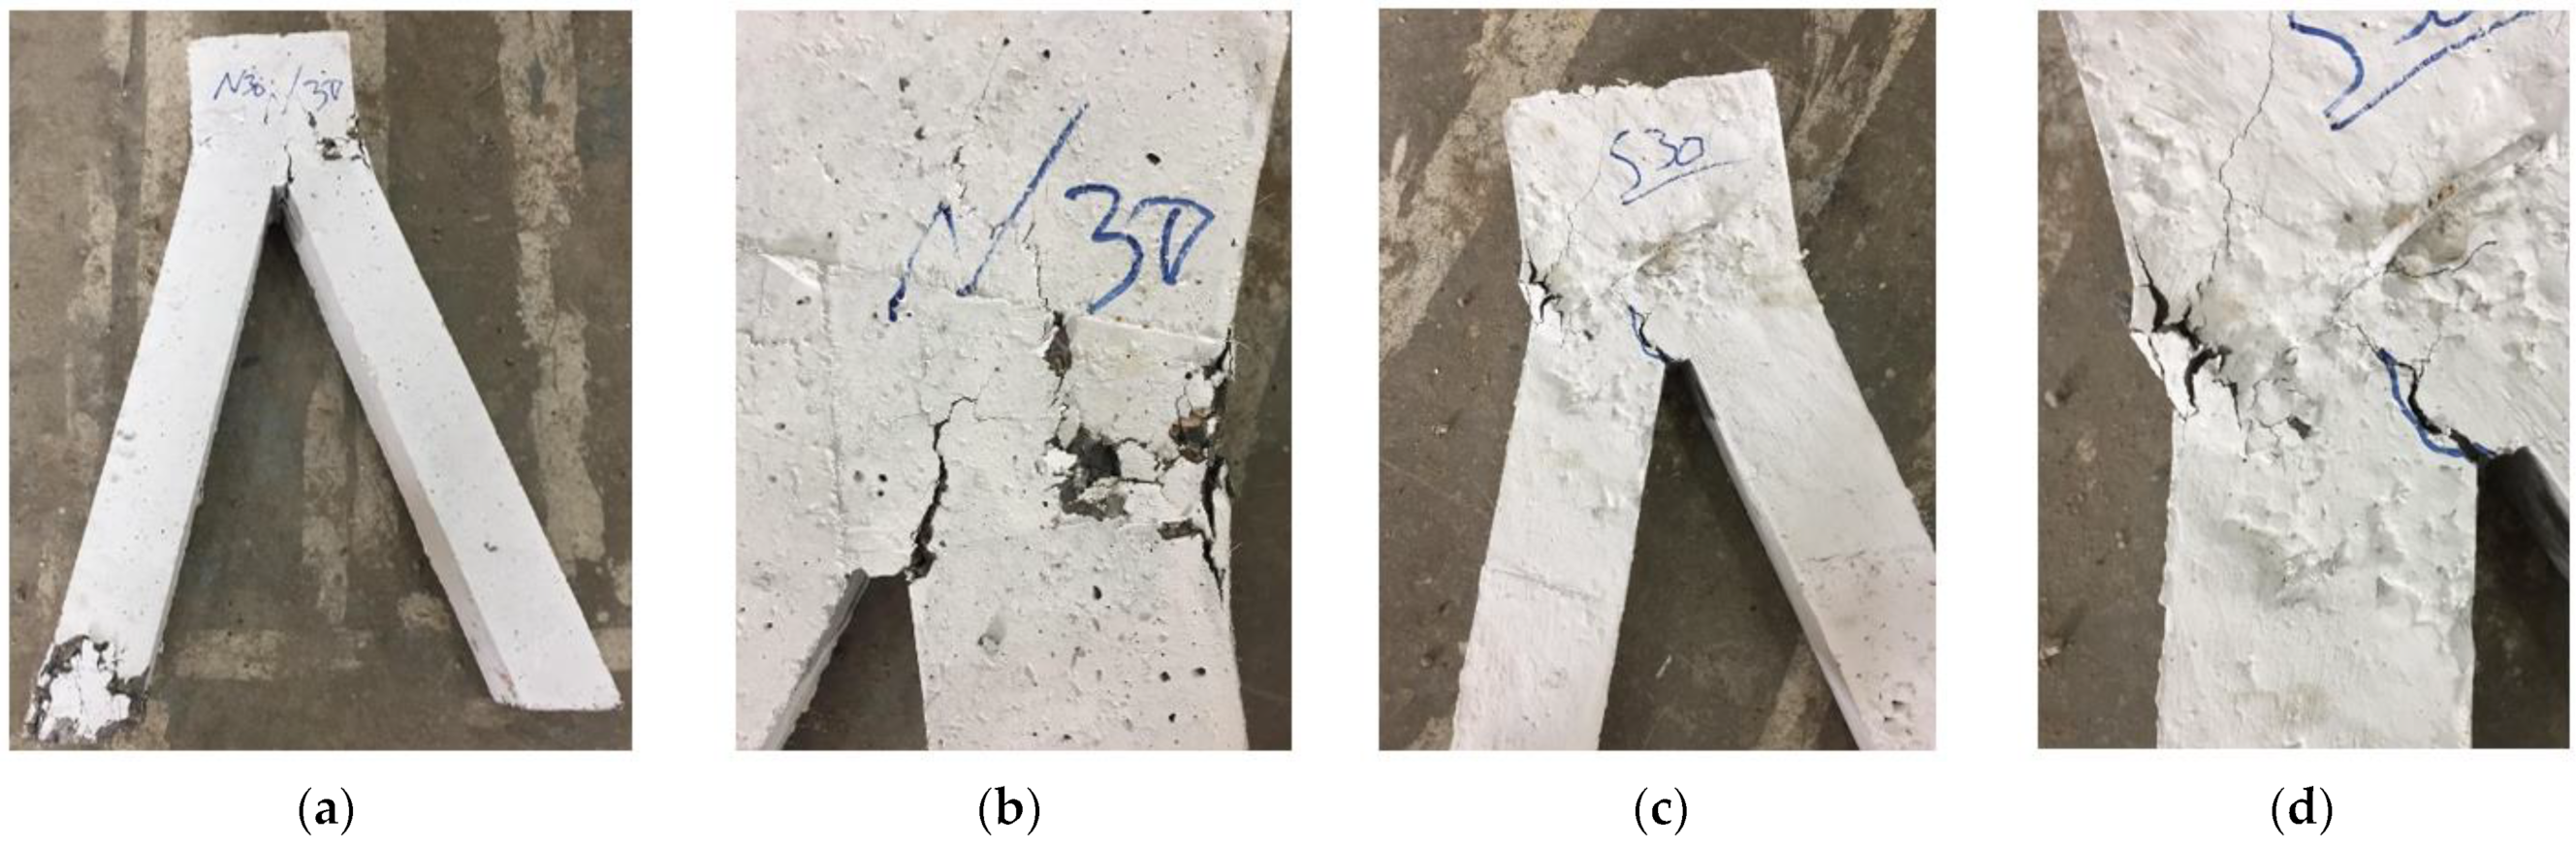
Figure 9.
V-shaped columns with 30° angle (a) NRC-30, (b) NRC-30 failure zone, (c) FRC-30, and (d) FRC-30 failure zone.
Figure 9.
V-shaped columns with 30° angle (a) NRC-30, (b) NRC-30 failure zone, (c) FRC-30, and (d) FRC-30 failure zone.
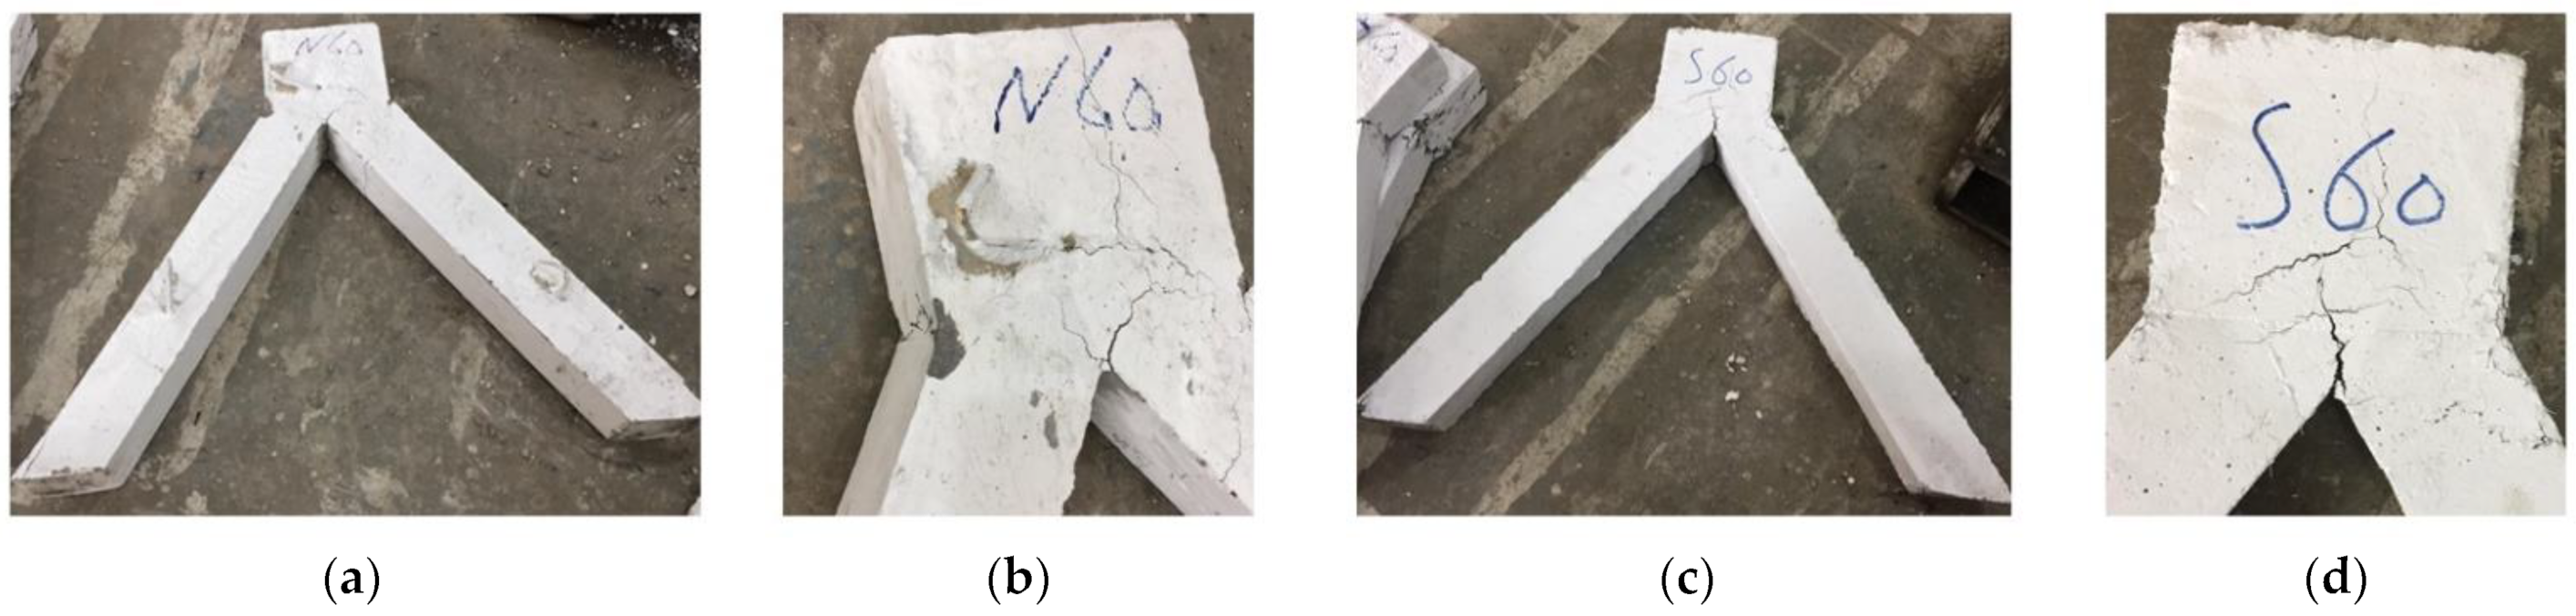
Figure 10.
V-shaped columns with 60° angle (a) NRC-60, (b) NRC-60 failure zone, (c) FRC-60, and (d) FRC-60 failure zone.
Figure 10.
V-shaped columns with 60° angle (a) NRC-60, (b) NRC-60 failure zone, (c) FRC-60, and (d) FRC-60 failure zone.
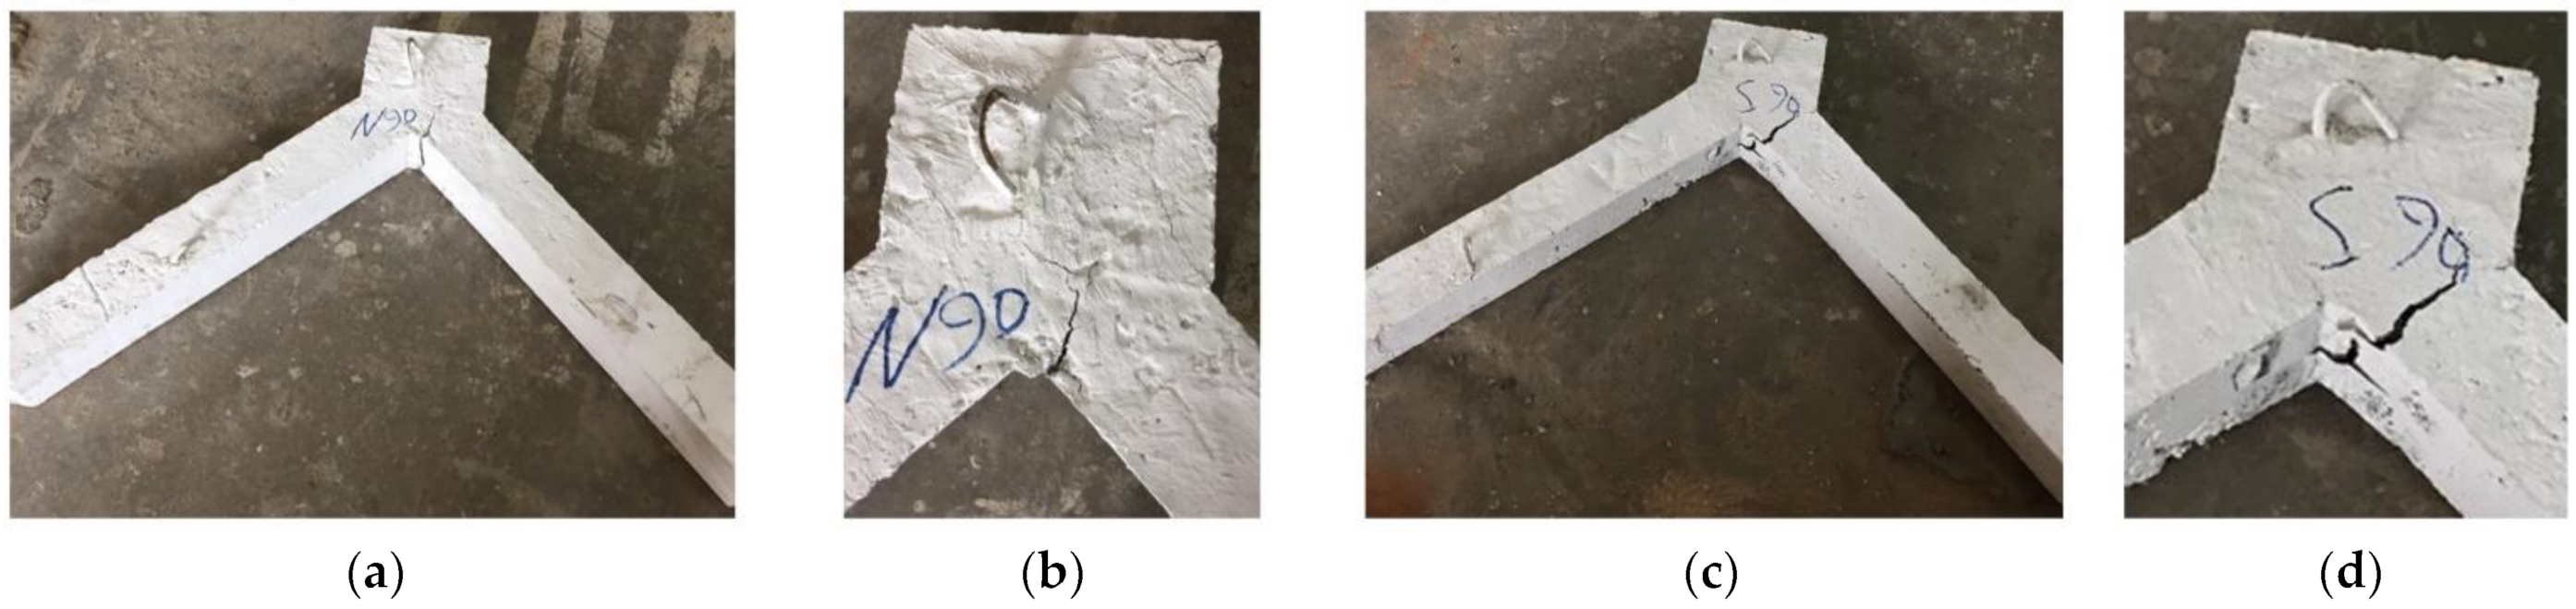
Figure 11.
V-shaped columns with 90° angle (a) NRC-90, (b) NRC-90 failure zone, (c) FRC-90, and (d) FRC-90 failure zone.
Figure 11.
V-shaped columns with 90° angle (a) NRC-90, (b) NRC-90 failure zone, (c) FRC-90, and (d) FRC-90 failure zone.
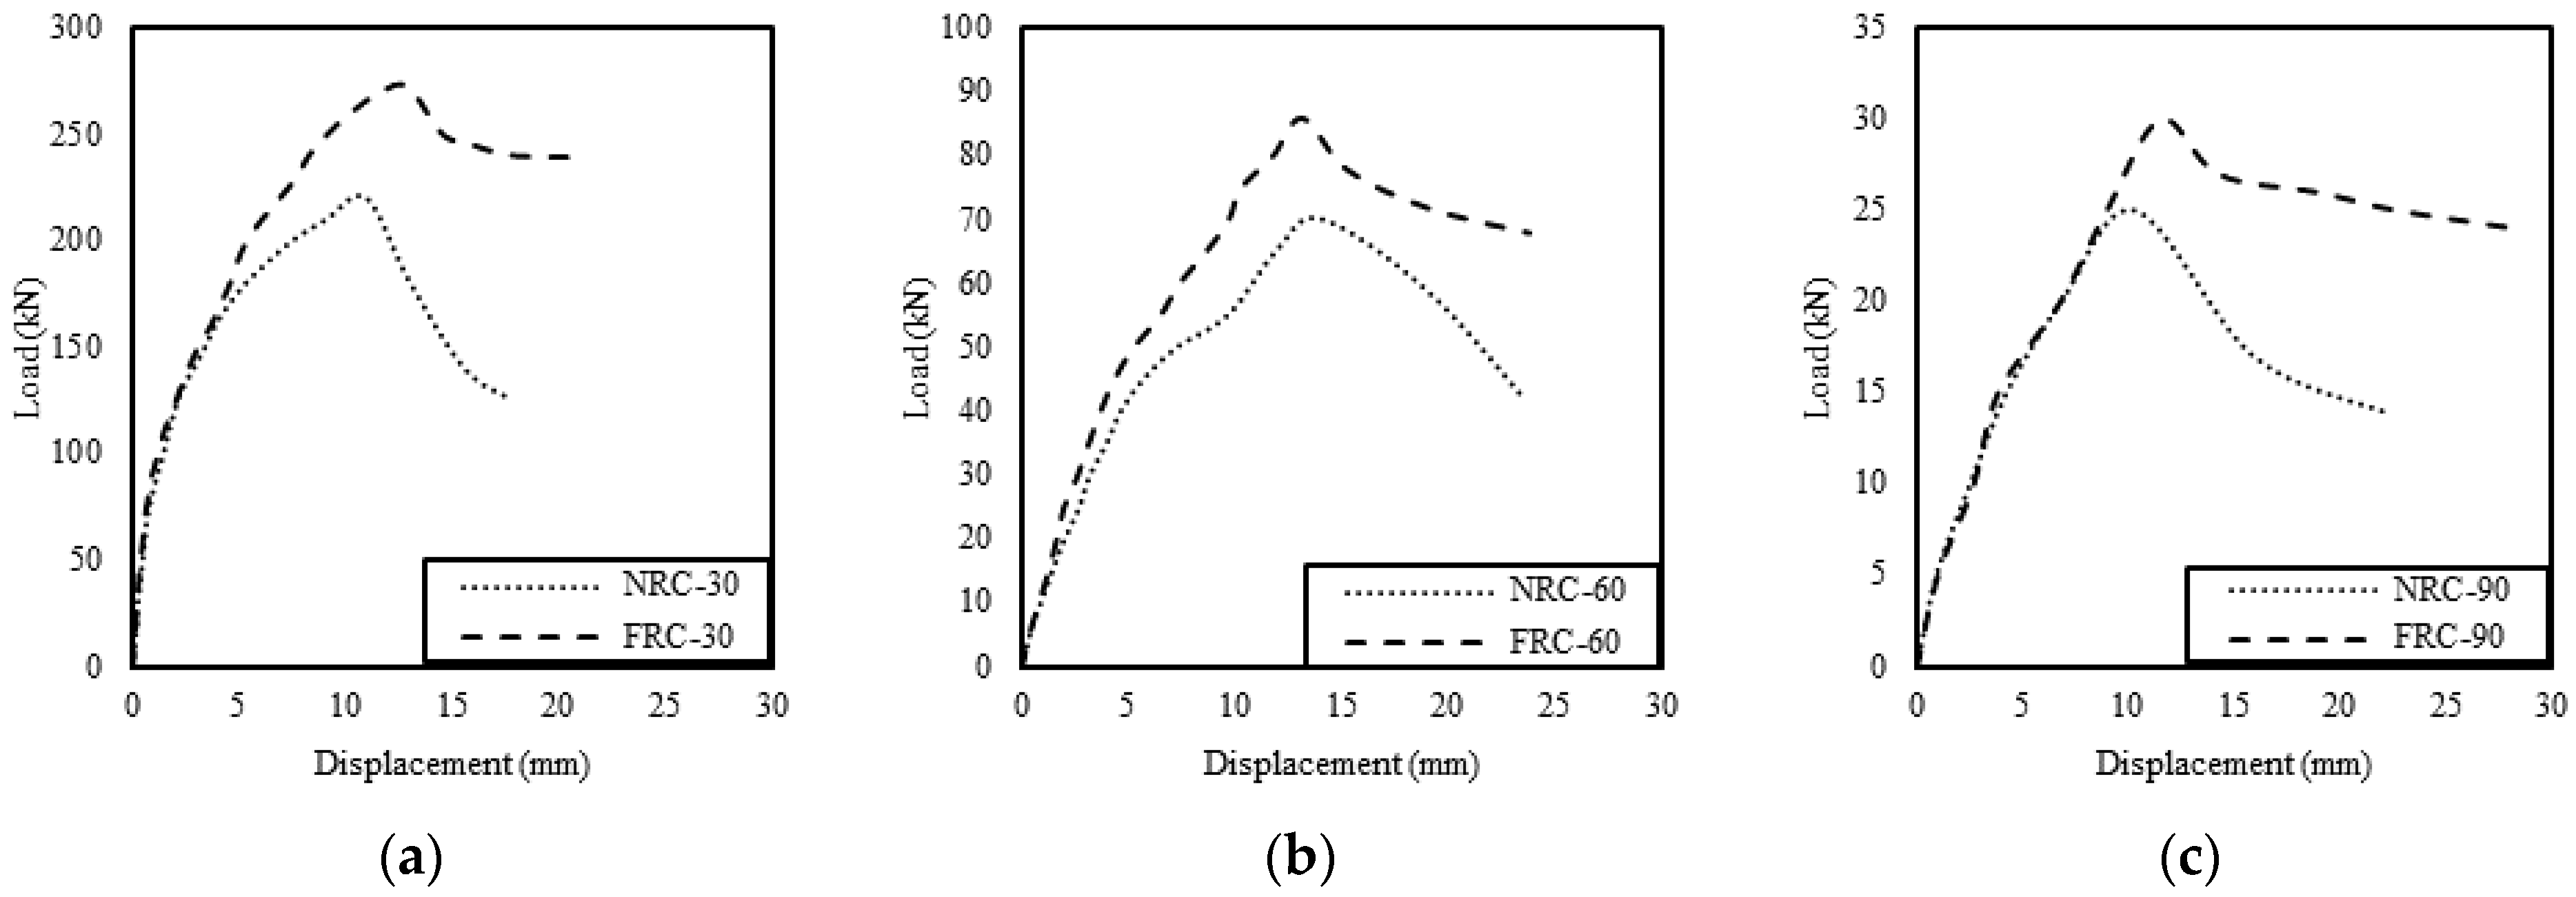
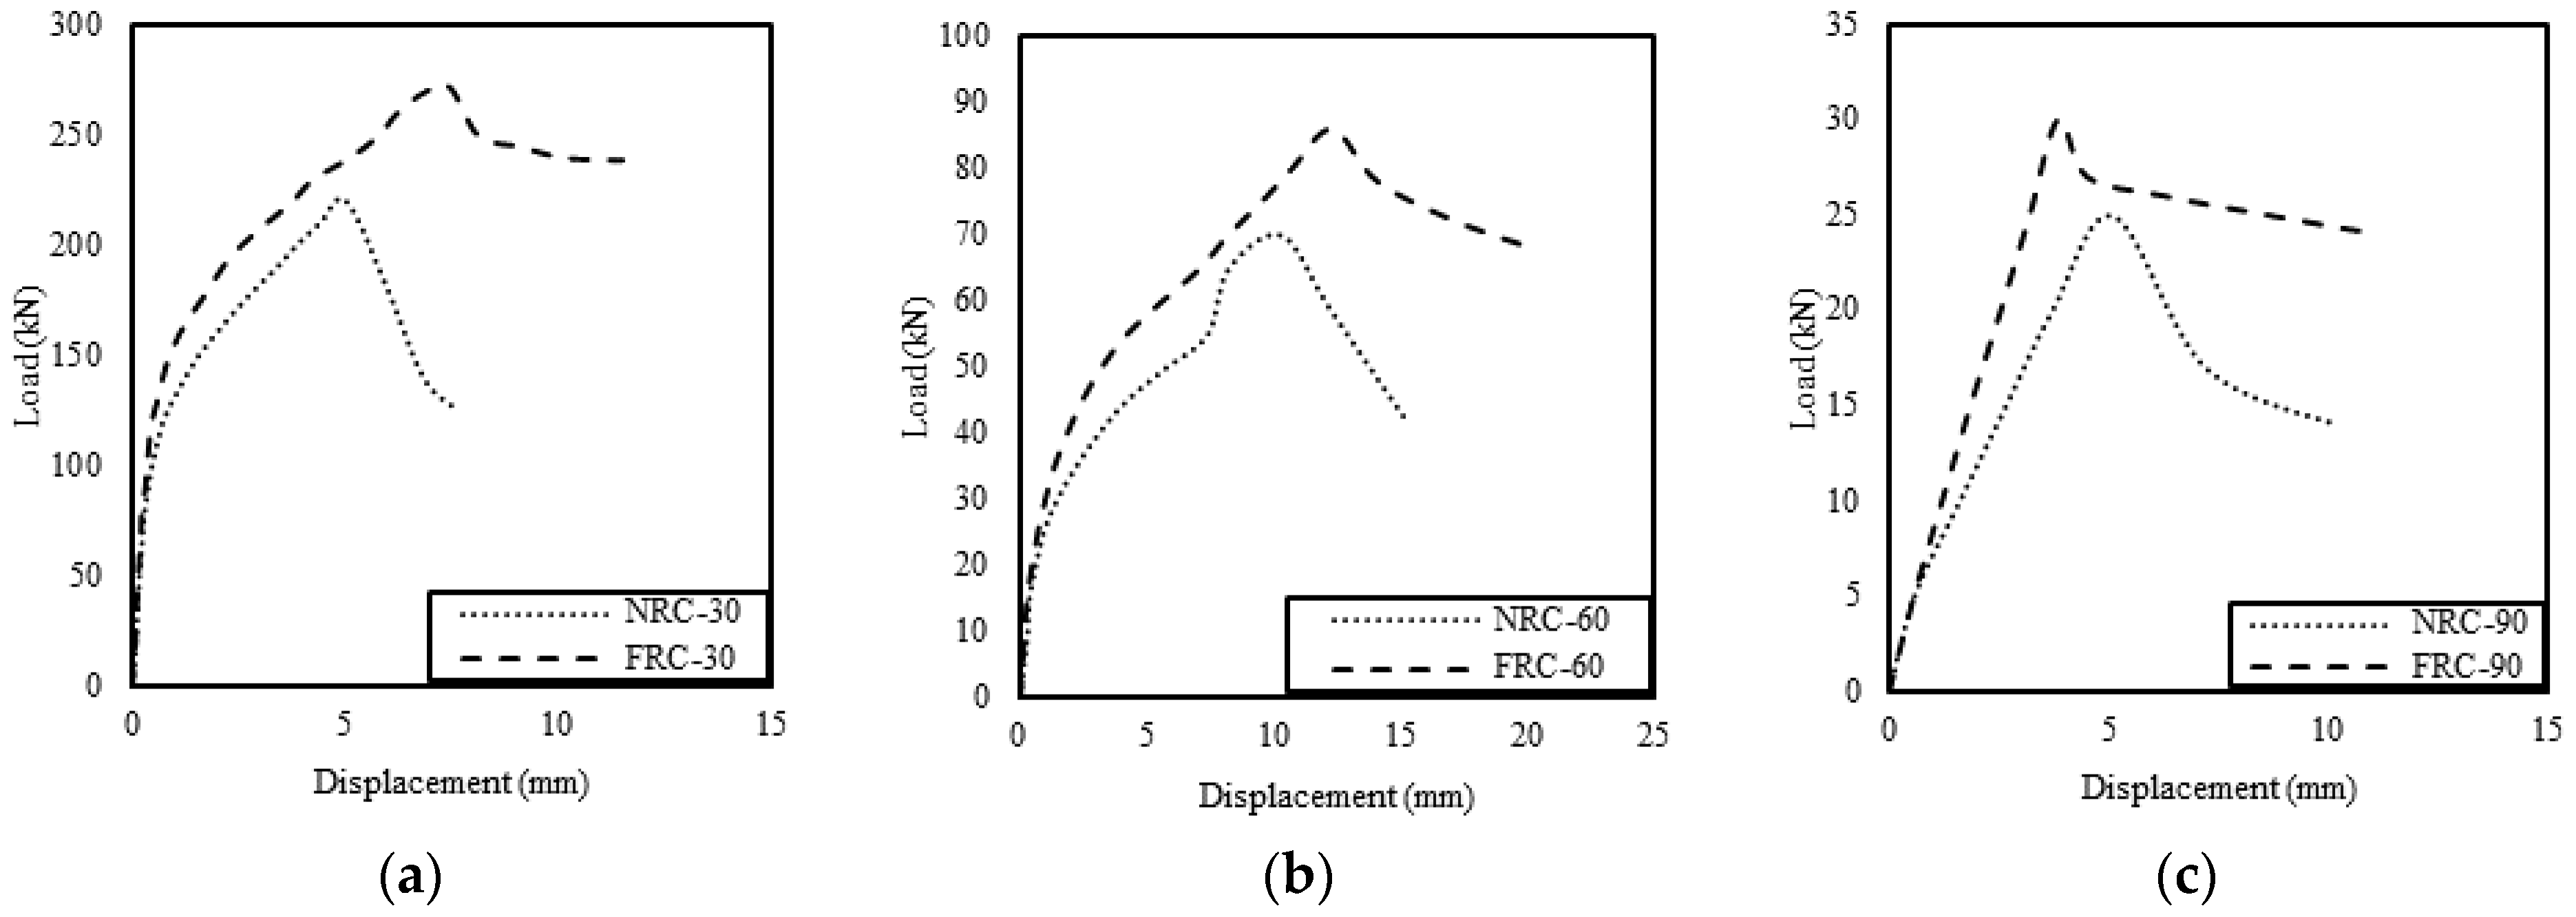
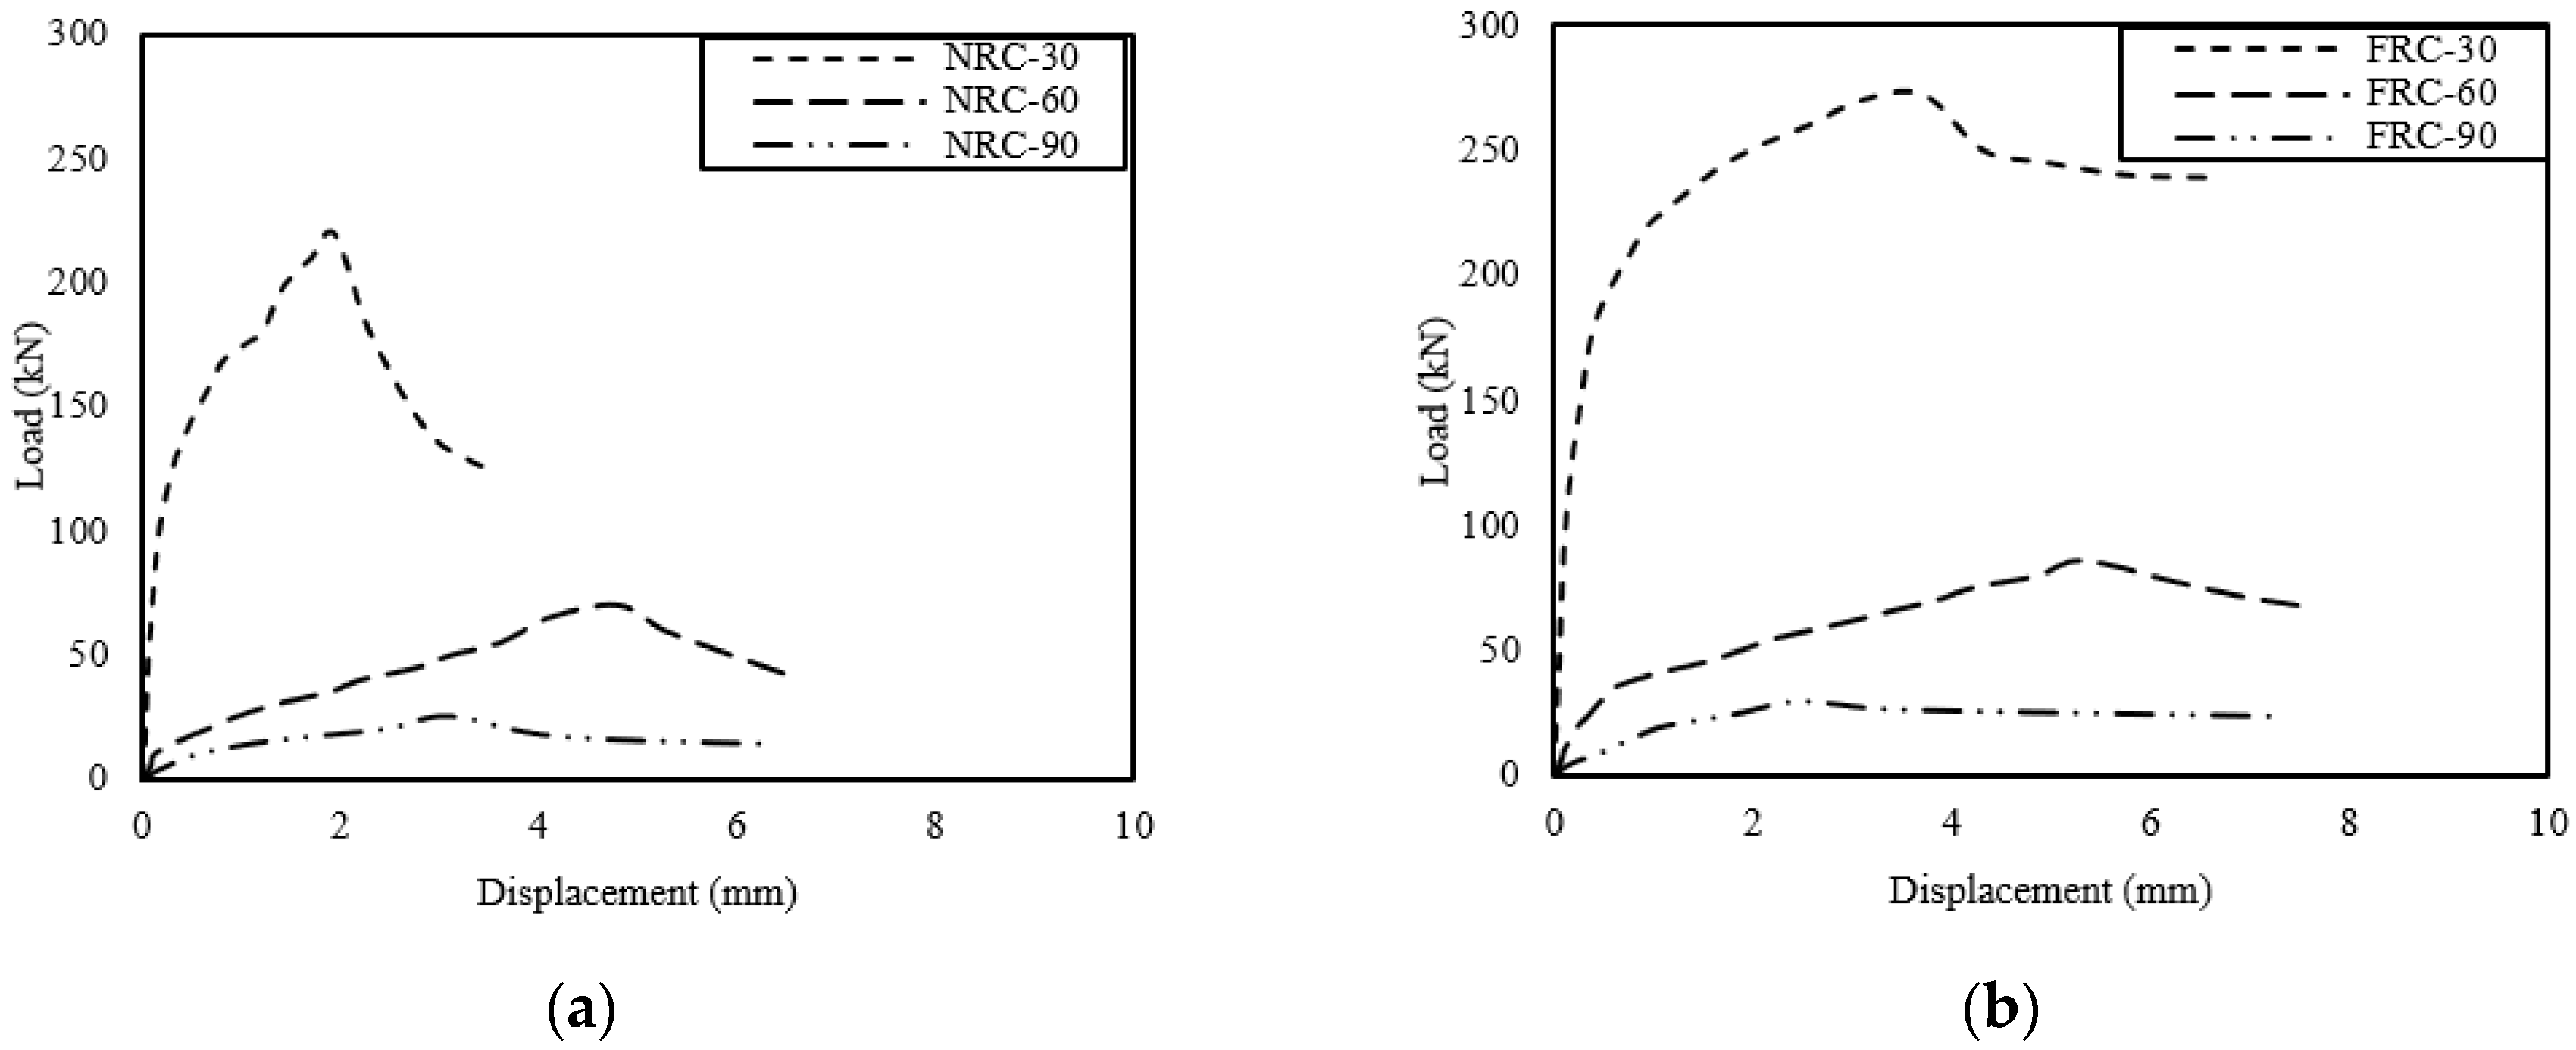
Figure 12.
Load–vertical deflection of V-shaped columns with (a) 30°, (b) 60°, and (c) 90° angles.
Figure 12.
Load–vertical deflection of V-shaped columns with (a) 30°, (b) 60°, and (c) 90° angles.
Figure 13.
Load–horizontal displacement of V-shaped columns with (a) 30°, (b) 60°, and (c) 90° angles.
Figure 13.
Load–horizontal displacement of V-shaped columns with (a) 30°, (b) 60°, and (c) 90° angles.
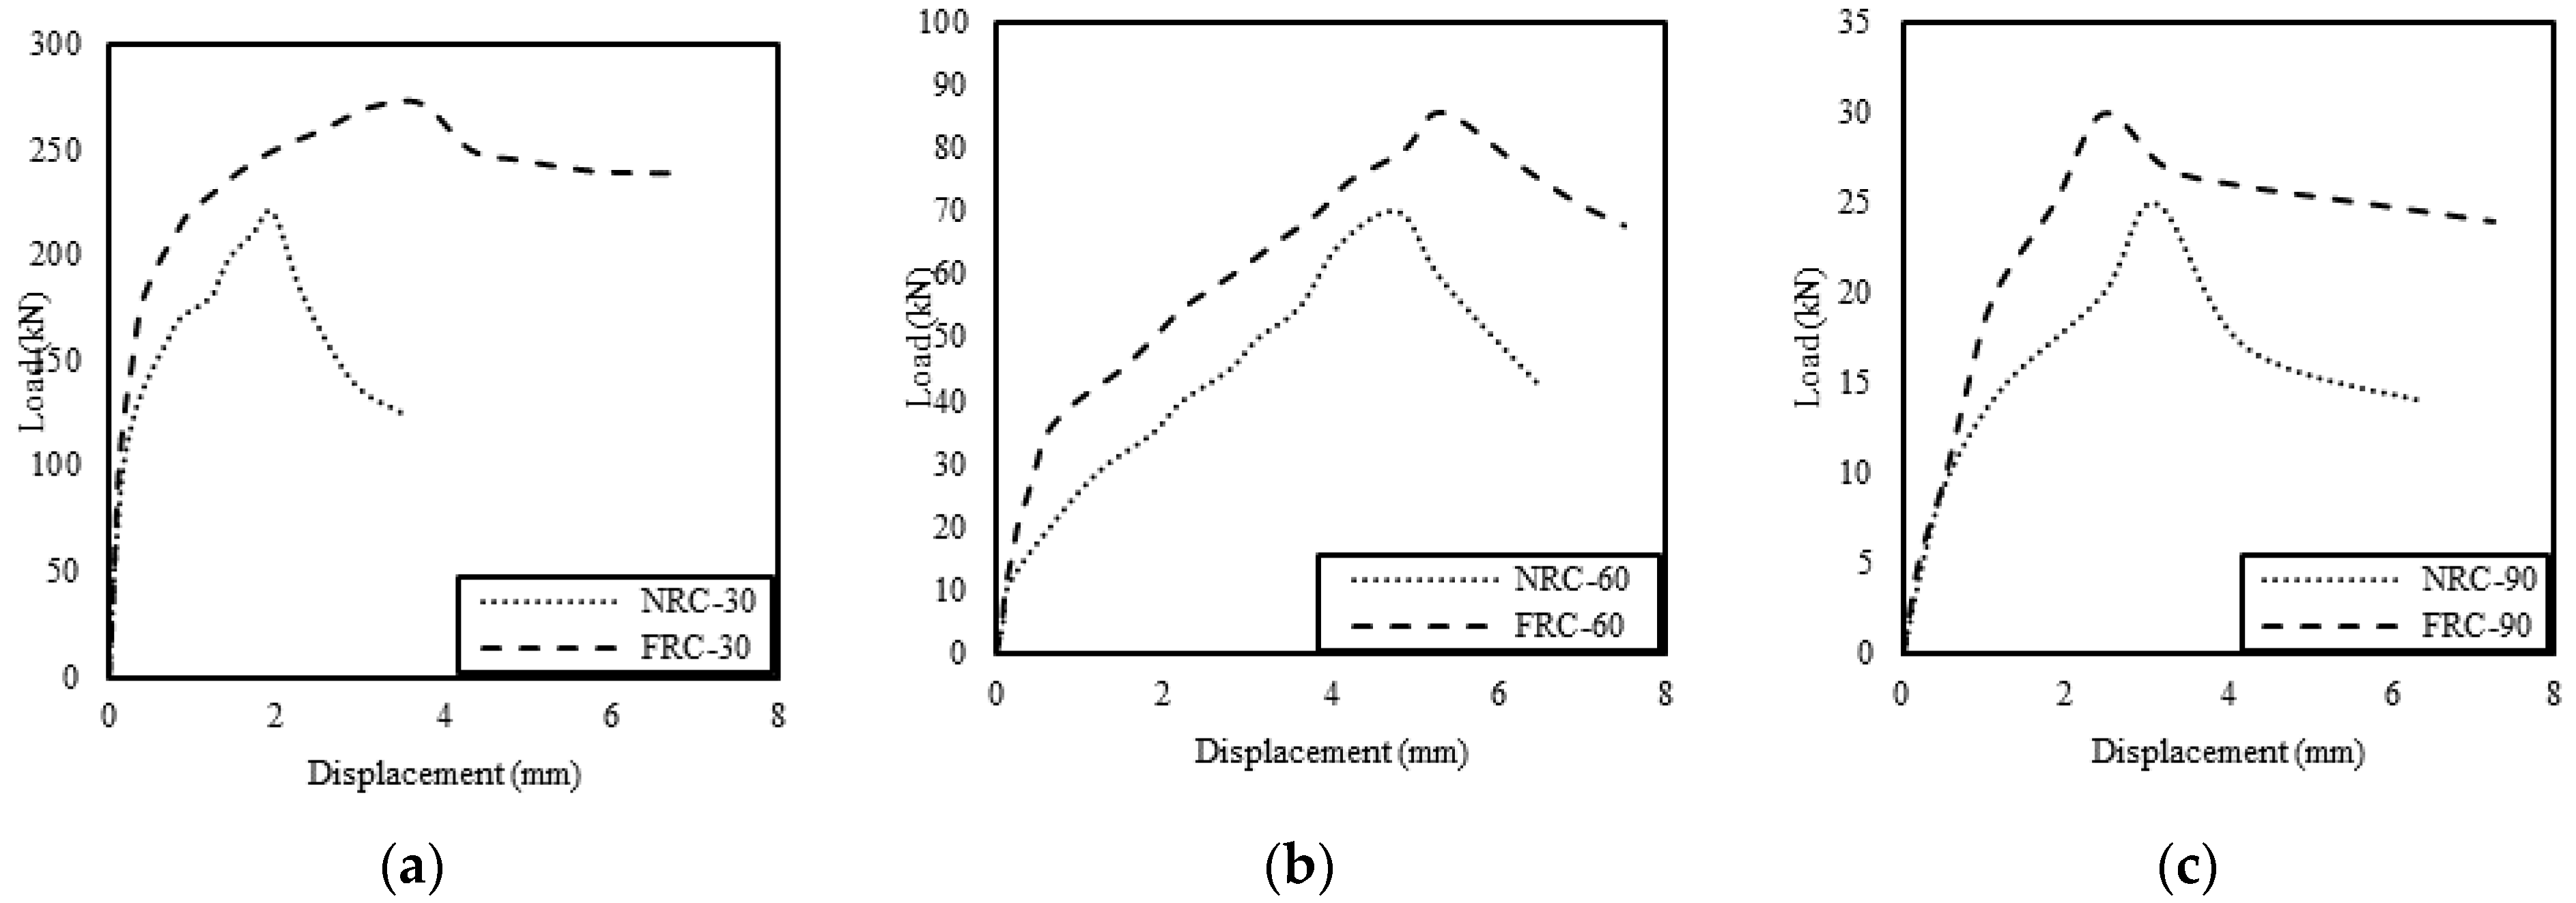
Figure 14.
Load–relative displacement of V-shaped columns with (a) 30°, (b) 60°, and (c) 90° angles.
Figure 14.
Load–relative displacement of V-shaped columns with (a) 30°, (b) 60°, and (c) 90° angles.
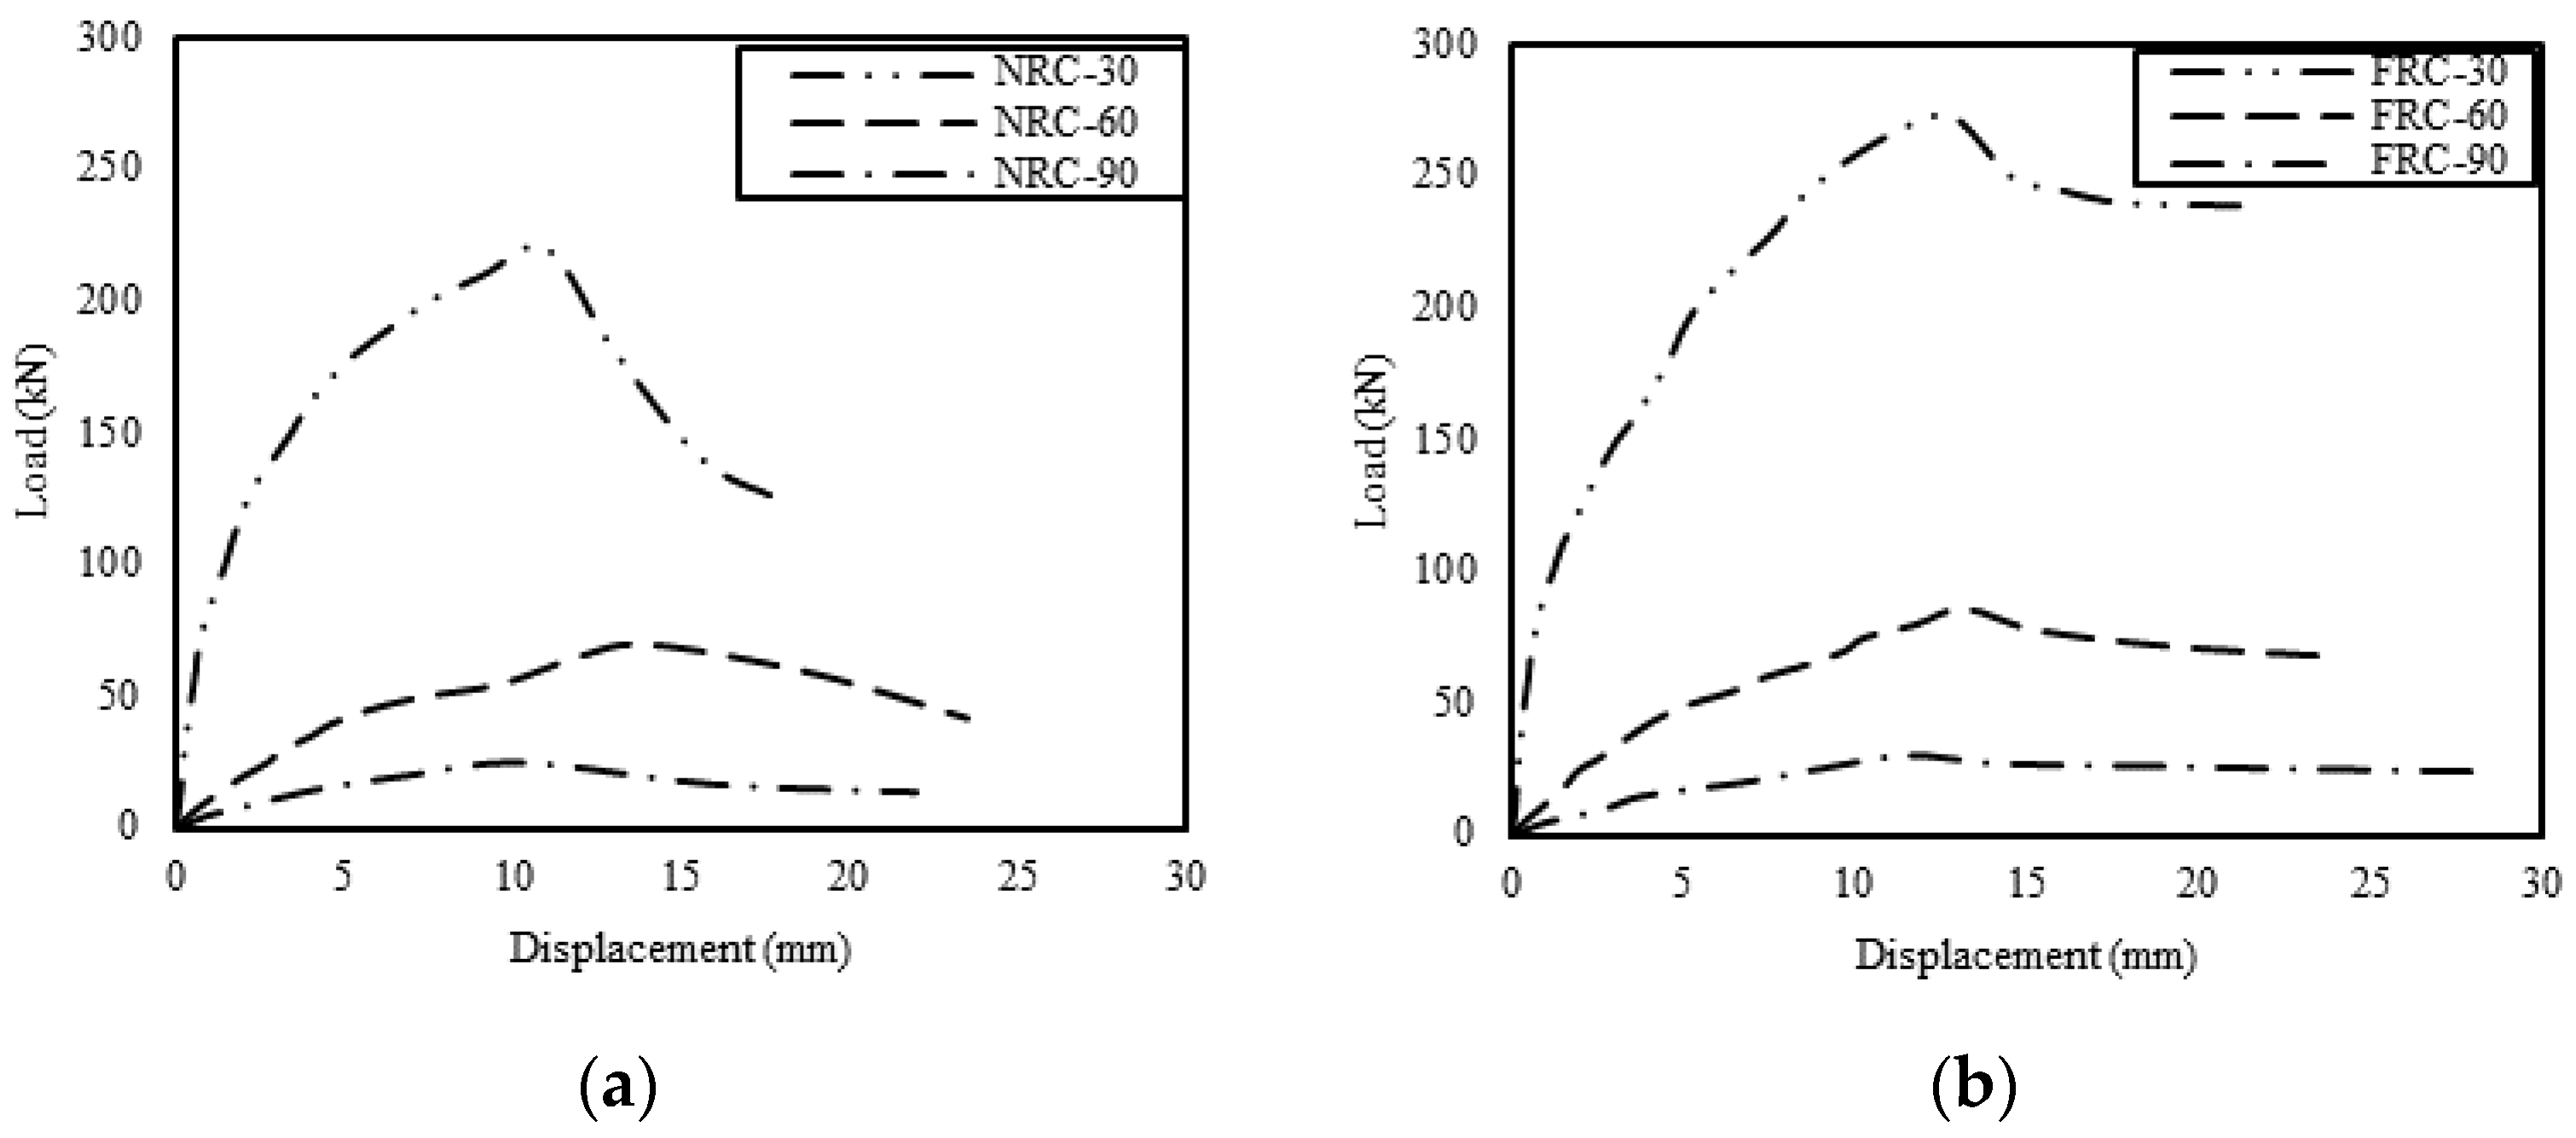
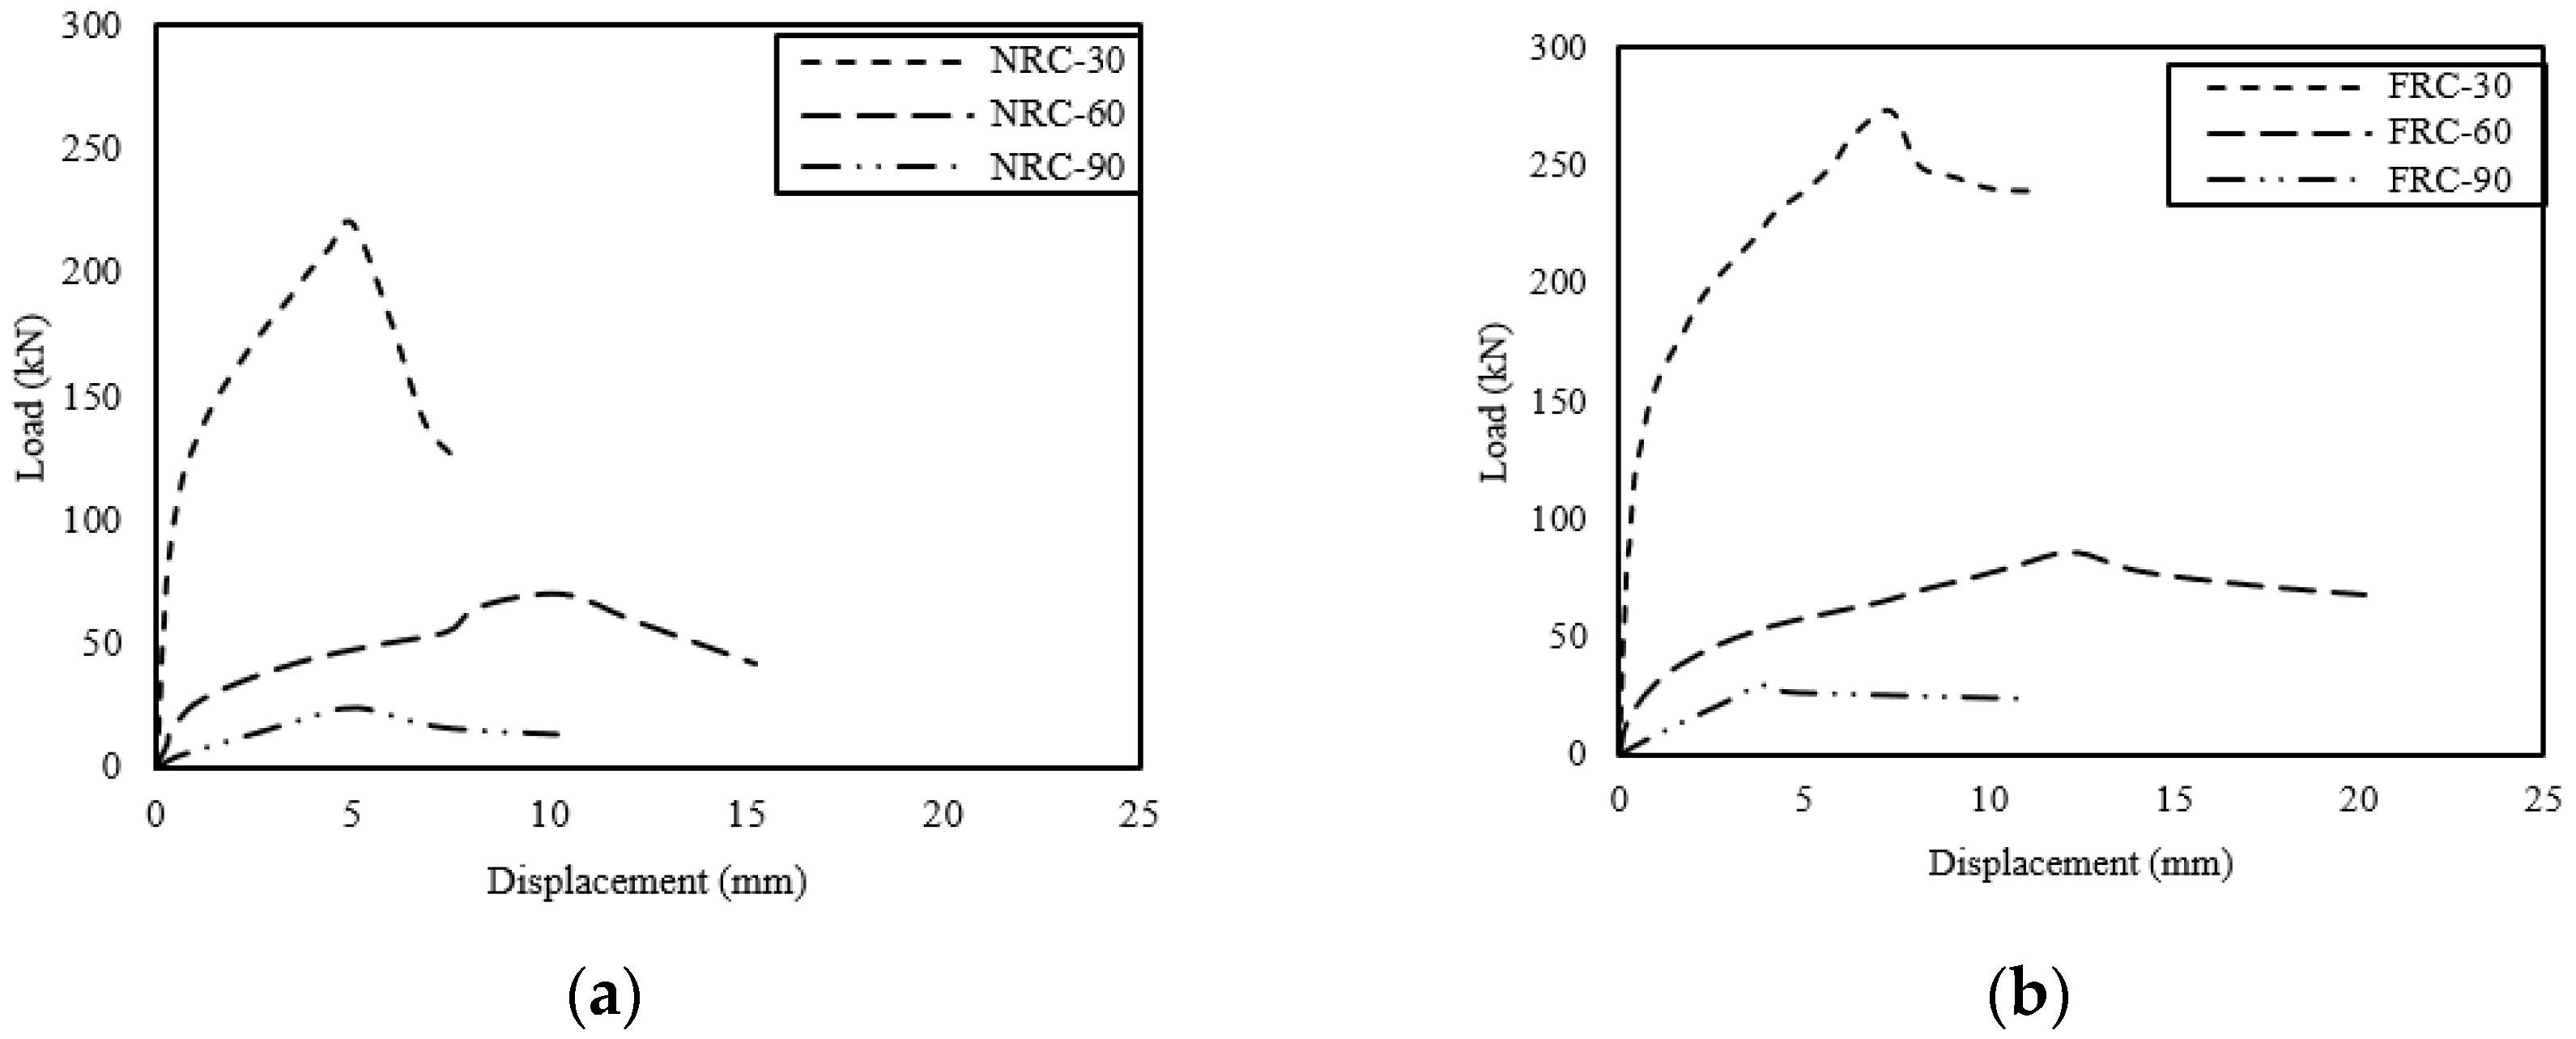
Figure 15.
Load–vertical deflection comparison between V-shaped columns of (a) NSC and (b) FRC specimens.
Figure 15.
Load–vertical deflection comparison between V-shaped columns of (a) NSC and (b) FRC specimens.
Figure 16.
Load–horizontal deflection comparison between V-shaped columns of (a) NRC and (b) FRC specimens.
Figure 16.
Load–horizontal deflection comparison between V-shaped columns of (a) NRC and (b) FRC specimens.
Figure 17.
Load–relative deflection comparison between V-shaped columns of (a) NRC and (b) FRC specimens.
Figure 17.
Load–relative deflection comparison between V-shaped columns of (a) NRC and (b) FRC specimens.
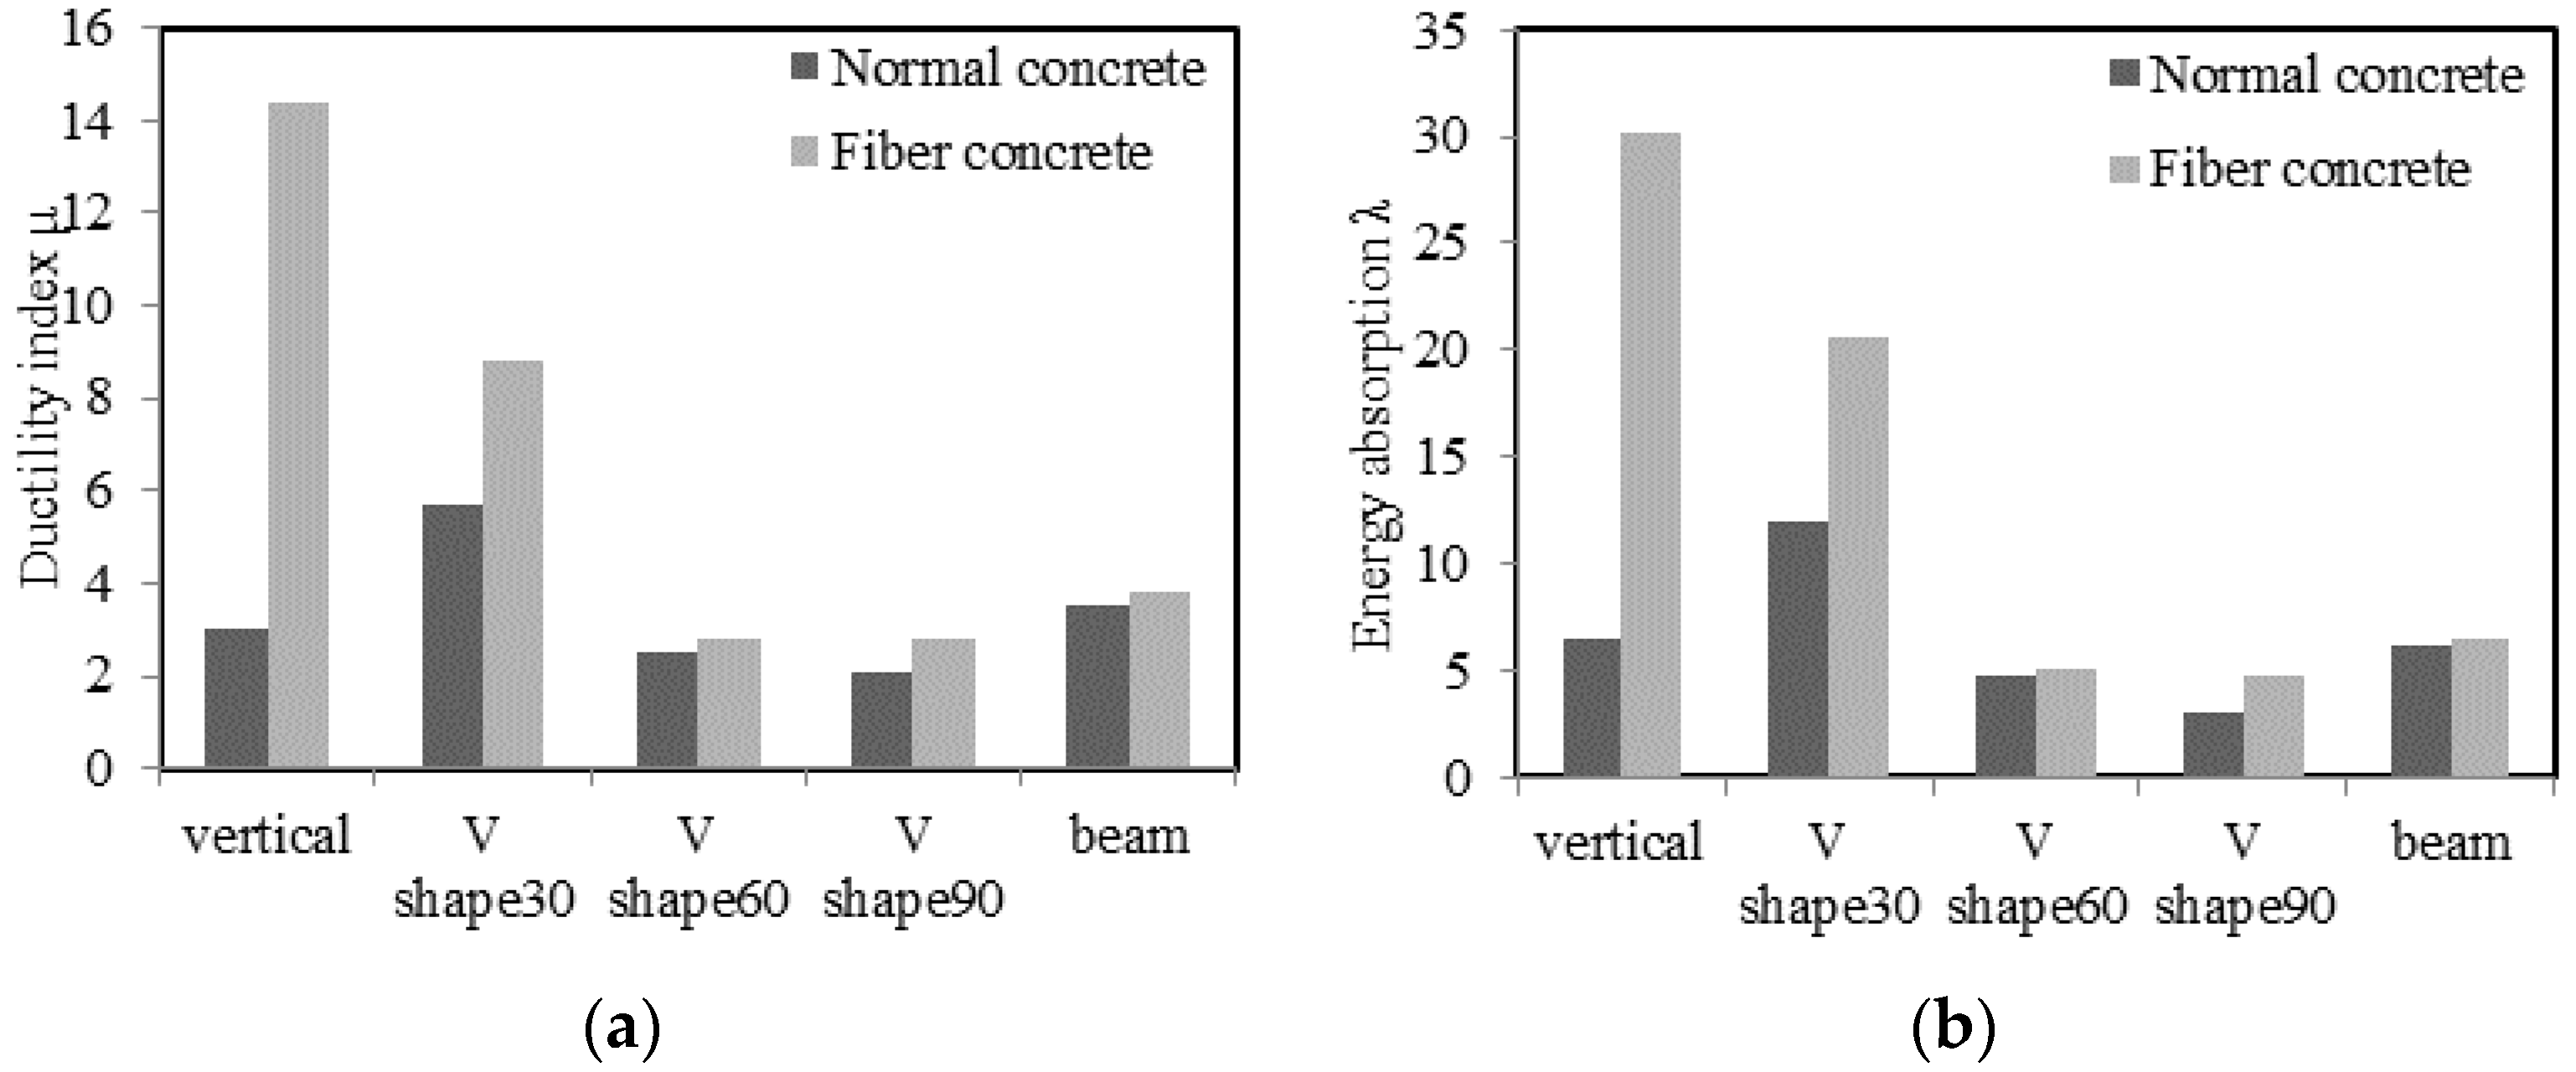
Figure 18.
(a) Ductility index and (b) energy absorption of NRC and FRC specimens.
Figure 18.
(a) Ductility index and (b) energy absorption of NRC and FRC specimens.
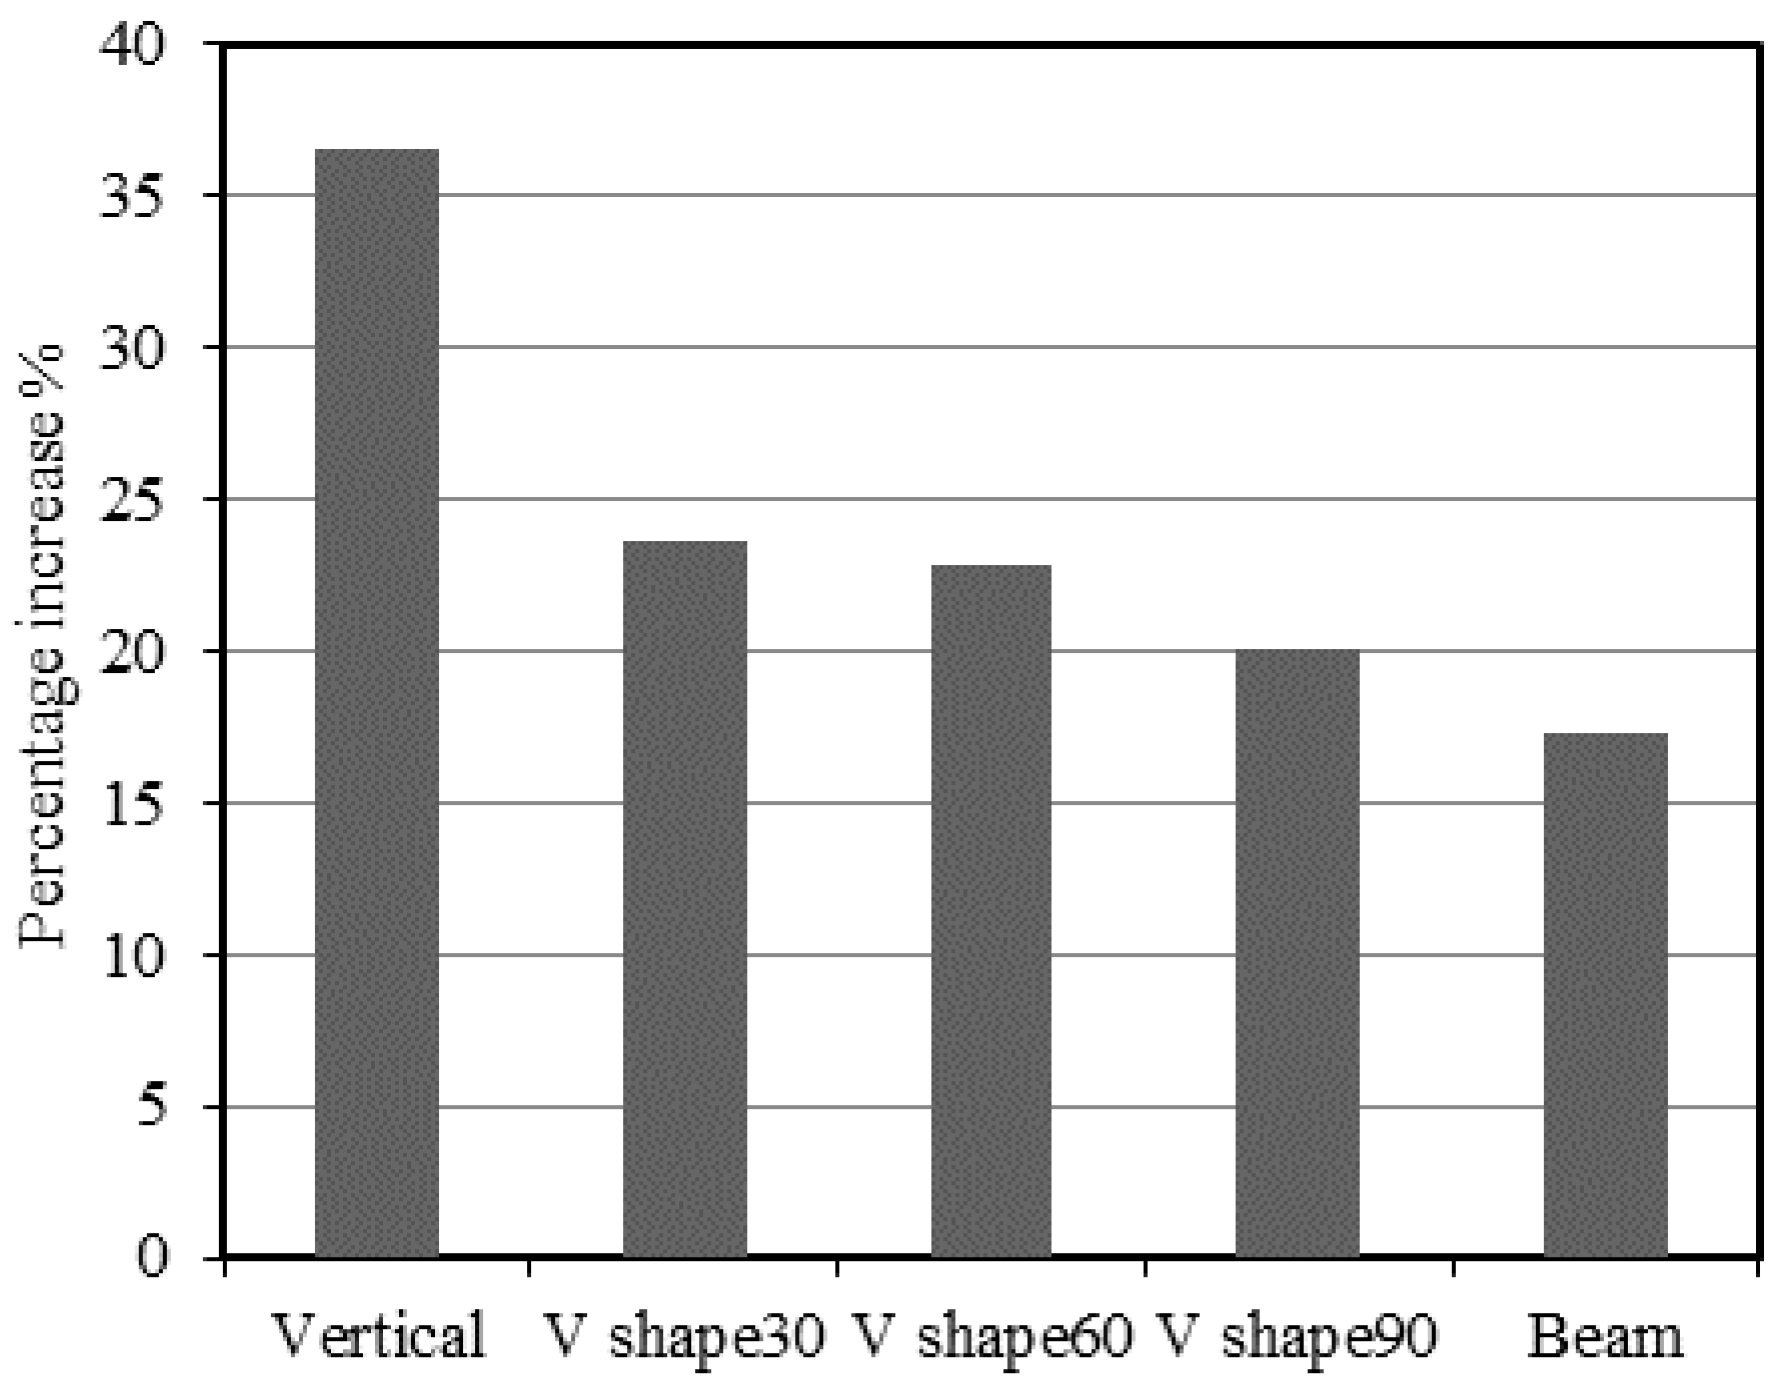
Figure 19.
Percentage increase in the ultimate loads of FRC specimens compared to the corresponding NRC specimens.
Figure 19.
Percentage increase in the ultimate loads of FRC specimens compared to the corresponding NRC specimens.
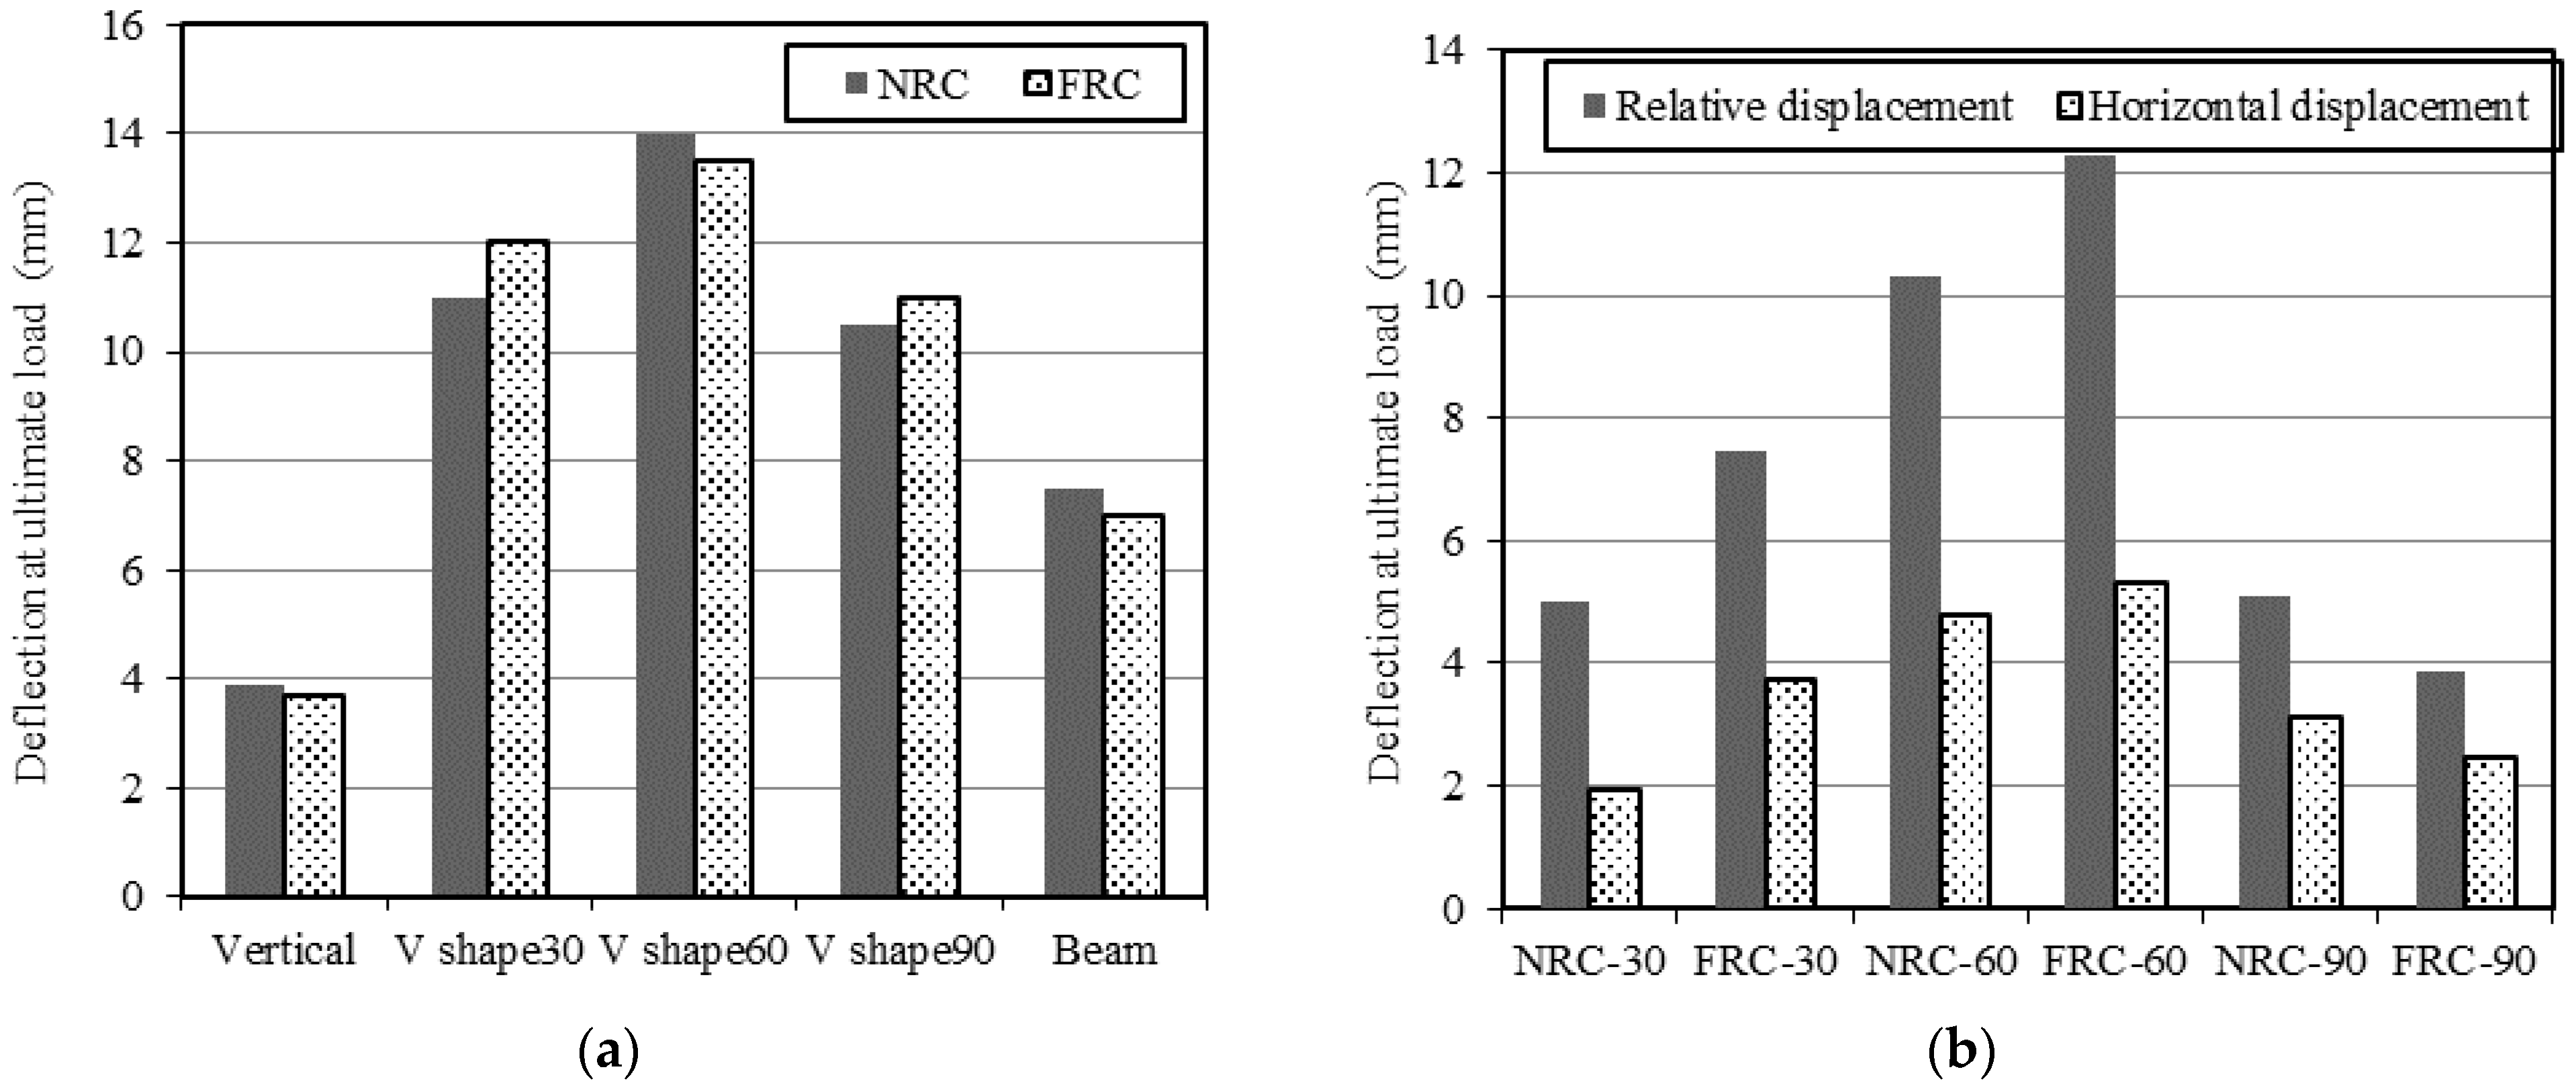
Figure 20.
(a) Deflection at ultimate load for the NSC and FRC specimens; (b) relative displacement and horizontal displacement at ultimate load.
Figure 20.
(a) Deflection at ultimate load for the NSC and FRC specimens; (b) relative displacement and horizontal displacement at ultimate load.
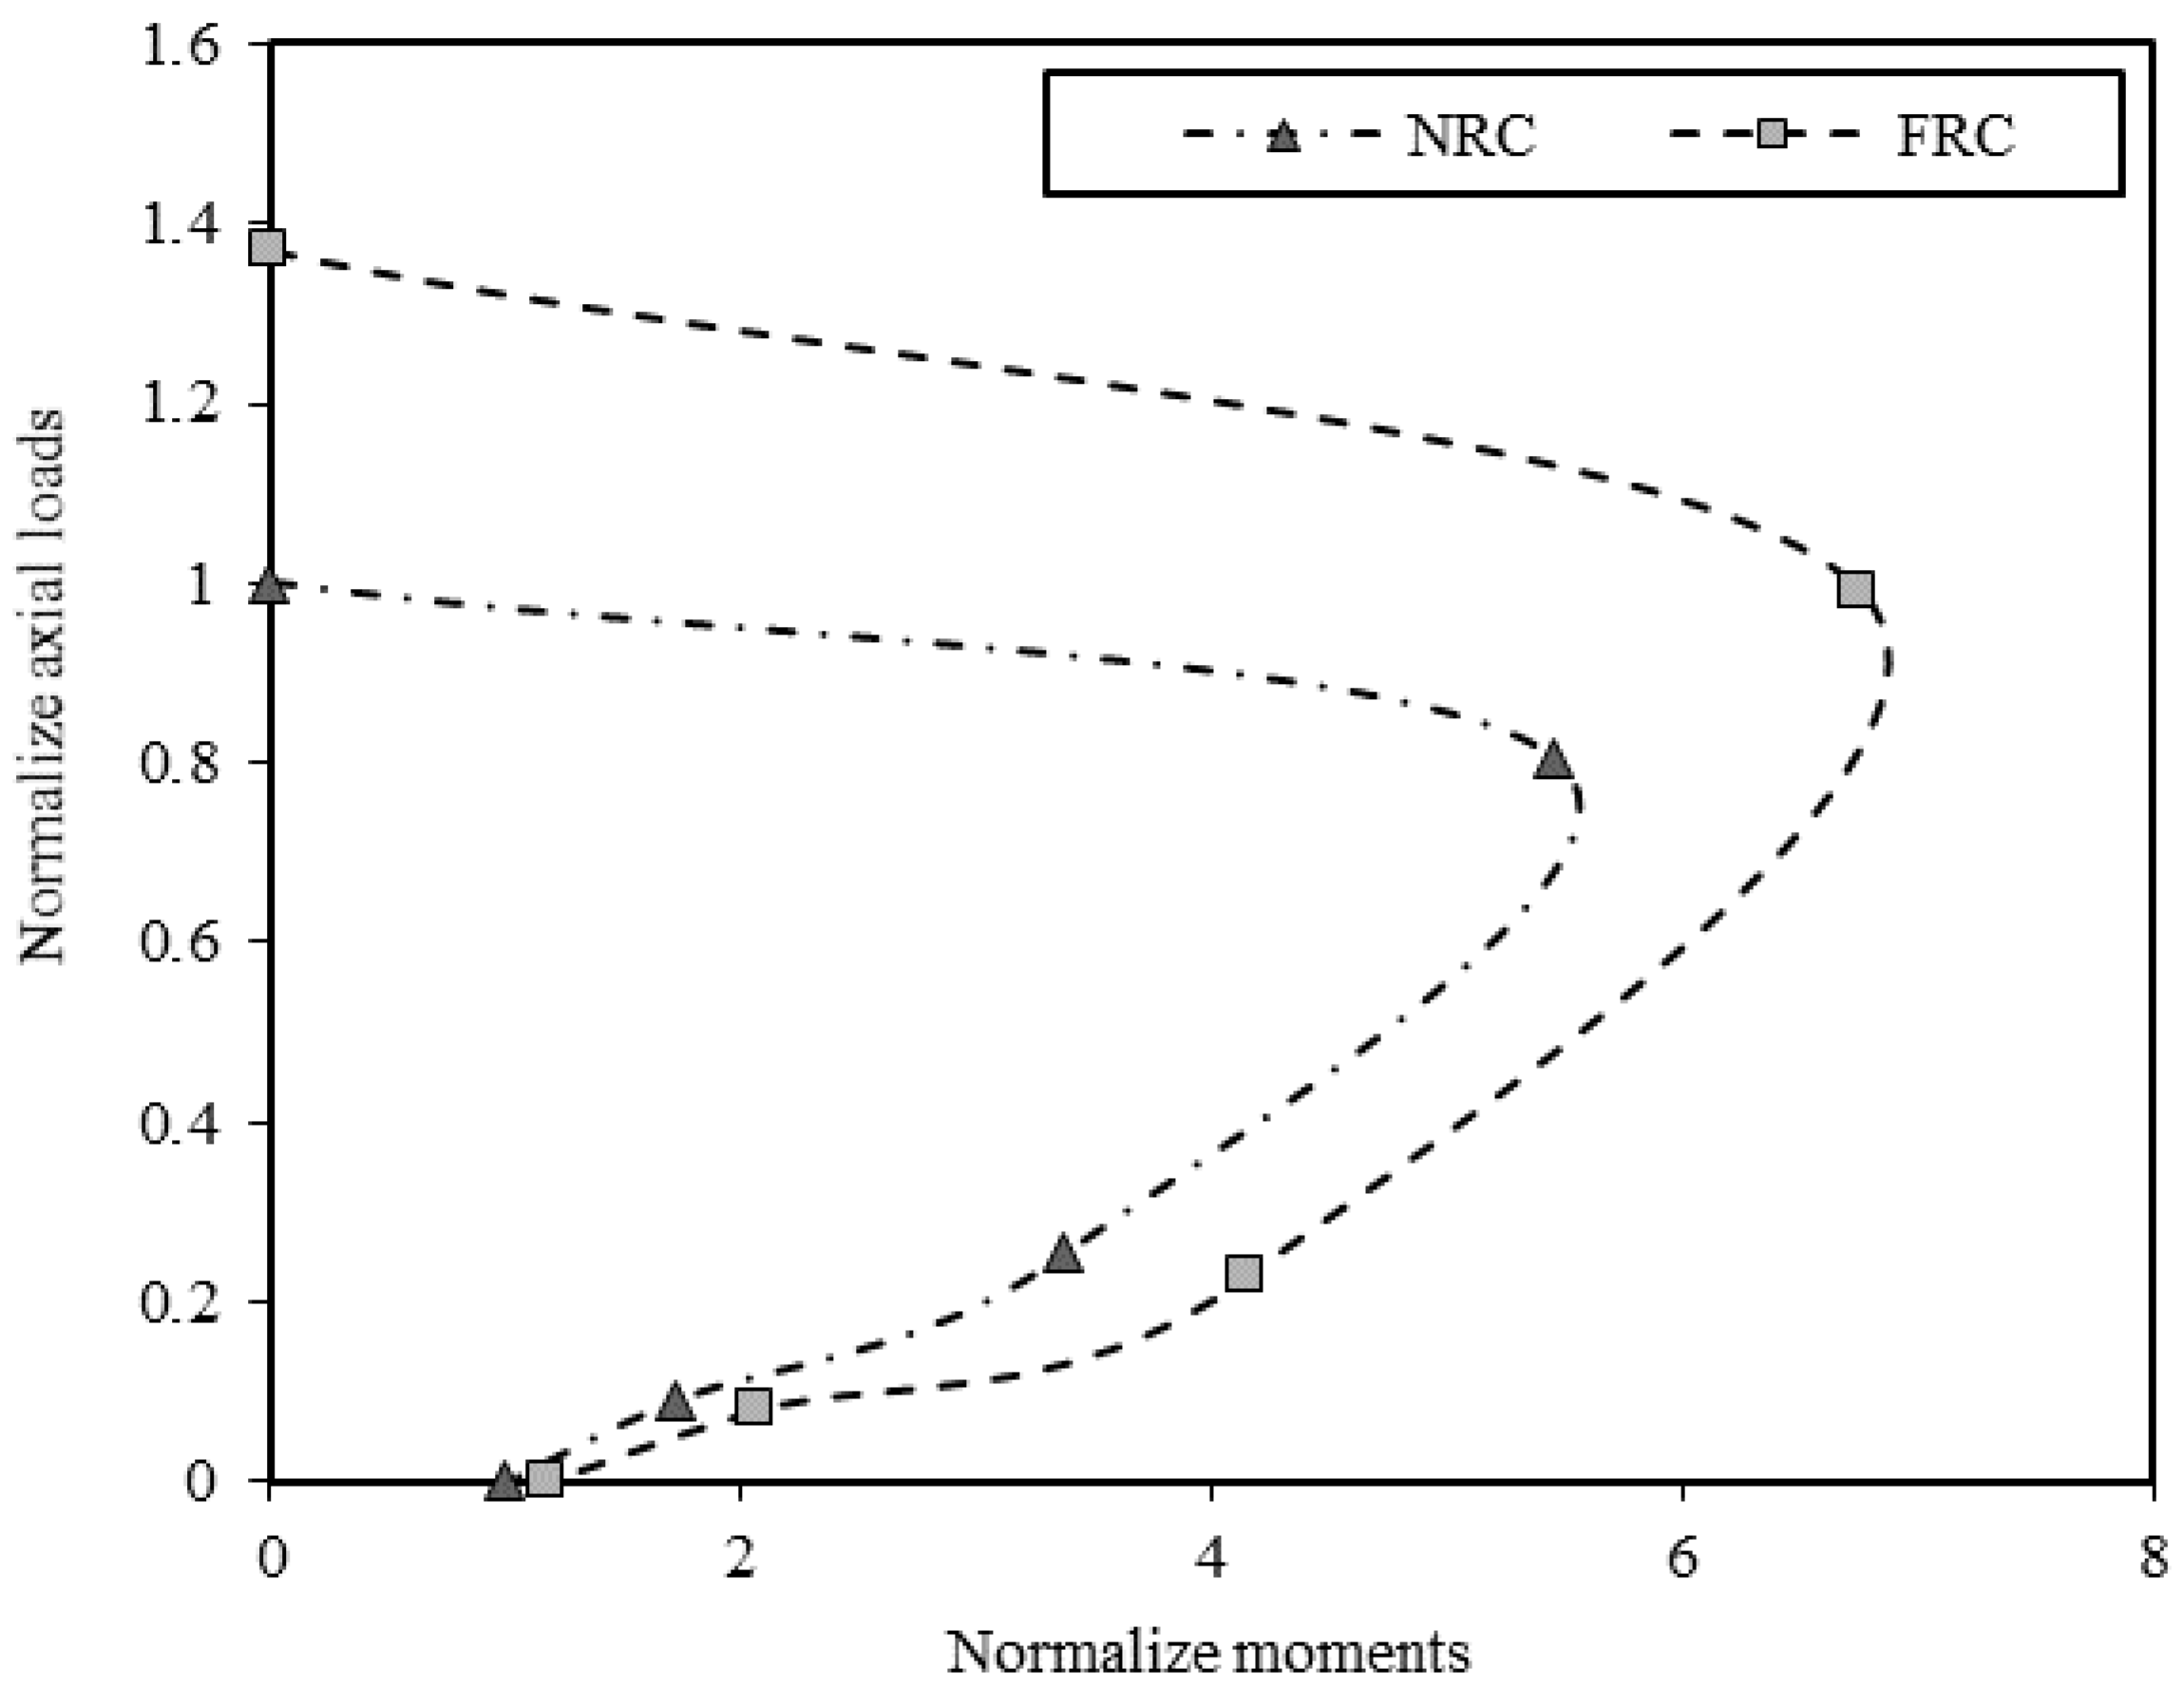
Figure 21.
Normalized experimental (P–M) interaction curve.
Figure 21.
Normalized experimental (P–M) interaction curve.
Table 1.
Specimen details.
Table 1.
Specimen details.
| Specimen ID | Material | Specimen Configuration | X (cm) | |
|---|
| NRC-0 | NSC | Column | - | - |
| NRC-30 | NSC | V-shape-1 | 36 | 30 |
| NRC-60 | NSC | V-shape-2 | 70 | 60 |
| NRC-90 | NSC | V-shape-3 | 100 | 90 |
| NRC-B | NSC | Beam | - | - |
| FRC-0 | SFRC | Column | - | - |
| FRC-30 | SFRC | V-shape-1 | 36 | 30 |
| FRC-60 | SFRC | V-shape-2 | 70 | 60 |
| FRC-90 | SFRC | V-shape-3 | 100 | 90 |
| FRC-B | SFRC | Beam | - | - |
Table 2.
Details of mix proportion and properties.
Table 2.
Details of mix proportion and properties.
| Materials and Properties | Amount |
|---|
| Mix water/cement ratio | 0.46 |
| MSSF | 1.5% of specimen volume |
| Maximum Size Aggregate (mm) | 14 |
| Slump (cm) | 8–10 |
| Water (kg/m3) | 207 |
| Cement (kg/m3) | 450 |
| Fine aggregate (kg/m3) | 723 |
| Coarse aggregate (kg/m3) | 1010 |
Table 3.
Mechanical properties of NSC and FRC mixes.
Table 3.
Mechanical properties of NSC and FRC mixes.
| Details | Splitting Tensile (ft) (MPa) | Flexural Strength (ff) (MPa) | Compression Strength (fcu′) (MPa) | Brittleness Ratio |
|---|
| NSC | 2.94 | 3.97 | 32.5 | 8.19 |
| FRC | 3.92 | 5.12 | 38.9 | 7.6 |
Table 4.
Loading test results and ductility for columns and beams.
Table 4.
Loading test results and ductility for columns and beams.
| Specimen ID | NRC-0 | FRC-0 | NRC-B | FRC-B |
|---|
| Yield load (kN) | 84 | 115 | 22 | 27 |
| Corresponding axial deformation at yield load (mm) | 1.3 | 0.8 | 3.5 | 4.15 |
| Ultimate load (kN) | 137 | 187 | 29 | 34 |
| Deformation at ultimate load (mm) | 3.9 | 3.6 | 7.9 | 6.89 |
| Post deformation at 85% post ultimate load (mm) | 3.9 | 11.5 | 12.4 | 15.6 |
| Ductility index (μ) | 3 | 14.4 | 3.5 | 3.8 |
| Energy absorption (λ) | 6.5 | 30.2 | 6.1 | 6.5 |
Table 5.
First cracking load at each location.
Table 5.
First cracking load at each location.
| Specimen ID | Inner Point (kN) | Inner Face (kN) | Outer Face (kN) | Failure Load (kN) |
|---|
| NRC-30 | 142 | 165 | 175 | 220 |
| NRC-60 | 12 | 30 | 47 | 70 |
| NRC-90 | 5 | 20 | Not appeared | 25 |
| FRC-30 | 182 | 213 | 258 | 272 |
| FRC-60 | 28 | 47 | 58 | 86 |
| FRC-90 | 7 | 12 | 27 | 30 |
Table 6.
Relative displacement and horizontal displacement at ultimate load.
Table 6.
Relative displacement and horizontal displacement at ultimate load.
| Specimen ID | NRC-30 | FRC-30 | NRC-60 | FRC-60 | NRC-90 | FRC-90 |
|---|
| Relative displacement at ultimate load (mm) | 1.95 | 3.72 | 4.8 | 5.32 | 3.1 | 2.45 |
| Horizontal displacement at ultimate load (mm) | 5.02 | 7.45 | 10.32 | 12.3 | 5.1 | 3.85 |
Table 7.
V-shaped columns’ test results and ductility.
Table 7.
V-shaped columns’ test results and ductility.
| Specimen ID | NRC-30 | FRC-30 | NRC-60 | FRC-60 | NRC-90 | FRC-90 |
|---|
| Yield load (kN) | 125 | 135 | 48 | 59 | 19 | 21.5 |
| Vertical deflection to yield load (mm) | 2.2 | 2.5 | 7.2 | 6.8 | 6.3 | 7.5 |
| Ultimate load (kN) | 220 | 272 | 70 | 86 | 25 | 30 |
| Vertical deflection to ultimate load (mm) | 11 | 12.9 | 14 | 13.15 | 10.3 | 11.5 |
| Post vertical deflection at 85% post ultimate load (mm) | 12.5 | 22 | 18 | 19 | 13 | 21 |
| Ductility index μ | 5.7 | 8.8 | 2.5 | 2.8 | 2.1 | 2.8 |
| Energy absorption λ | 12 | 20.6 | 4.7 | 5.1 | 3.1 | 4.7 |
Table 8.
Compressive stiffness and flexural stiffness of specimens.
Table 8.
Compressive stiffness and flexural stiffness of specimens.
| Specimen ID | Compression Stiffness Kc (kN/mm) | Flexural Stiffness Kf (kN/mm) | Kc/Kf |
|---|
| NRC-0 | 93.2 | - | - |
| FRC-0 | 166.7 | - | - |
| NRC-30 | 76.5 | 45.8 | 1.67 |
| FRC-30 | 90.8 | 48.7 | 1.87 |
| NRC-60 | 9.1 | 6.8 | 1.34 |
| FRC-60 | 11 | 7.9 | 1.39 |
| NRC-90 | 4.4 | 2.7 | 1.63 |
| FRC-90 | 4.8 | 3 | 1.6 |
| NRC-B | - | 7.1 | - |
| FRC-B | - | 7.3 | - |
Table 9.
Summary of compressive strength, ductility, and stiffness for all specimens.
Table 9.
Summary of compressive strength, ductility, and stiffness for all specimens.
| Specimen ID | Yield Load (kN) | Vertical Deflection to Yield Load (mm) | Ultimate Load (kN) | Vertical Deflection to Ultimate Load (mm) | Relative Displacement at Ultimate Load (mm) | Horizontal Displacement at Ultimate Load (mm) | Compression Stiffness Kc (kN/mm) | Flexural Stiffness Kf (kN/mm) |
|---|
| NRC-0 | 137 | 3.9 | 137 | 3.9 | - | - | 93.2 | - |
| FRC-0 | 165 | 2.92 | 187 | 11.2 | - | - | 166.7 | - |
| NRC-30 | 125 | 2.2 | 220 | 11 | 1.95 | 5.02 | 76.5 | 45.8 |
| FRC-30 | 135 | 2.5 | 272 | 12.9 | 3.72 | 7.45 | 90.8 | 48.7 |
| NRC-60 | 48 | 7.2 | 70 | 14 | 4.8 | 10.32 | 9.1 | 6.8 |
| FRC-60 | 59 | 6.8 | 86 | 13.15 | 5.32 | 12.3 | 11 | 7.9 |
| NRC-90 | 19 | 6.3 | 25 | 10.3 | 3.1 | 5.1 | 4.4 | 2.7 |
| FRC-90 | 21.5 | 7.5 | 30 | 11.5 | 2.45 | 3.85 | 4.8 | 3 |
| NRC-B | 22 | 7.9 | 29 | 14 | - | - | - | 7.1 |
| FRC-B | 28 | 6.86 | 34 | 15.9 | - | - | - | 7.3 |


