1. Introduction
Earthquakes are considered as the most catastrophic natural disasters that have devastated several civilizations during history. Global death toll caused by earthquakes varies from 700 to 298,000 annually [
1]. Developing countries located in active seismic zones have the most fatalities and damages caused by earthquakes [
2]. Iran is one the most earthquake prone countries with the most catastrophic events [
3,
4]. Generally, 8% of the most destructive earthquakes occurred in this country [
5]. Tehran, the political and economic capital city of Iran, is globally one of the most populated cities with a high seismic risk [
6,
7]. The seismic catalog of Tehran shows that the return period of severe earthquakes in the urban areas is about 150 years, and the last relatively high magnitude (M > 7) earthquake occurred in 1830 [
8]. This necessitates new efficient methods of structural seismic retrofitting with construction [
9,
10,
11]. High urban population and building density, in addition to the concentration of resources in Tehran, increase the complexity of the crisis management plans in the case of earthquakes; therefore, a detailed evaluation of vulnerabilities and corresponding mitigation plans are required [
7].
Building failures are the major cause of fatality and economic loss due to earthquakes [
2]. Public facilities, such as health care clinics and hospitals, have a critical role during the post crisis management of disasters; it is essential to assess their seismic vulnerability in order to have realistic preparation, response–action strategies, and effective earthquake hazard management. Casualty rate increases are reported for weaker buildings within high seismic risk zones [
2]. For instance, Iran’s Bam earthquake was more catastrophic than California’s Paso Robles earthquake; although the magnitude was similar, the building designs complied with codes strictly in United States compared to other regions [
2].
Figure 1 demonstrates the seismic hazard map of Iran based on correlation with the metropolitan area of Tehran. This map is based on peak ground acceleration (PGA) for a return period of 475 years [
12].
Fragility curves are considered as one of the best tools to evaluate the vulnerability of buildings based on the evaluation of the probability of structural damages due to an earthquake as a function of ground motion indices and design parameters. Fragility curves show the probability of failure versus peak ground acceleration. Hence, any point on the curve represents the probability of exceedance of the damage parameter, which could be lateral drift, story drift, base shear, etc., for a given ground motion intensity parameter [
13]. If the intensity of the ground motion is normalized and classified due to the spectral displacement, some limiting values for the damage parameters could be defined, such as slight to complete damage states. For an earthquake with the spectral intensity corresponding to weak shaking, the exceedance probability for the slight damage is quite high and the levels defined by the higher damage states, such as moderate, extensive, and complete, are considered negligible. Whereas, in the case of an earthquake with strong intensity, the building is more likely to cross the damage states of slight and moderate. Hence, the exceedance probability for the extensive damage state is more than that of the complete damage state [
14].
The evaluation of seismic vulnerability of buildings is based on the data about seismicity of the area, including the ground motion parameter, i.e., peak ground acceleration (PGA) and spectral displacement, and the building characteristics such as type, age, and rise of structures [
15]. For this purpose, fragility curves and damage probability matrices are used as tools to estimate the probable damage. In addition, fragility curves illustrate the probability of exceeding a specific damage state at different ground motion intensities, and they are drawn based on damage probability matrices defined according to the earthquake catalog of each area [
16,
17,
18]. Several buildings in Iran were not built based on updated seismic codes; thus, an up-to-date fragility curve system used in developed countries such as the Hazards US software program (HAZUS) developed by the Federal Emergency Management Agency (FEMA) might not be applicable for all types of buildings in this country.
The first vulnerability analysis for Iran was used after the Manjil–Rudbar earthquake [
19], and within a year, the Iran building code organizations contracted the Japan International Cooperation Agency (JICA) to develop the first fragility curves for the country based on nine categories and experimental results of the Manjil–Rudbar earthquake [
20]. JICA developed fragility curves based on the ATC-13 method and other studies [
15,
19]. The first fragility curves considering PGA for masonry buildings in Iran were developed in 2006 by Jalalian [
21]. Recent fragility curves for unreinforced masonry buildings were derived mathematically [
22]. Kazemi et al. derived fragility curves for typical irregular frames with concrete shear walls [
23]. Several studies used various curves and techniques developed for vulnerability evaluations and assessments [
24,
25,
26,
27]. European studies also investigated structural failures after earthquakes in Italy [
28,
29] and developed fragility curves for steel and masonry structures [
30,
31]. Later, Sadeghi et al. combined empirical fragility curves for Iran and those derived for other regions (such as the European studies, Applied Technology Council project 13 (ATC13), and HAZUS) by considering seismic code and engineering judgment. Subsequently, they developed a more comprehensive vulnerability curve for 42 building types [
15].
In this study, the distribution of potential seismic damage is estimated based on the worst case scenario considering the building-type of hospitals in the capital city of Tehran. For this purpose, the fragility curves developed for Iran, such as the curves developed by Jalalian [
19] and JICA [
20], are compared with ATC13 [
32], HAZUS [
33], Vision [
34], and FEMA273 [
35], and the worst case scenario causing the most potential damage is defined for each damage state. Ultimately, the potential damages for hospitals of Tehran are represented based on the most conservative curves for their type at each damage state.
2. Building Taxonomy of Hospitals in Tehran
According to the data provided by the Iranian Road, Housing, and Urban Department Research Center (IDRC), buildings in Tehran are classified based on the year of construction, structural type, and height. The early fragility curves for Iran classified the buildings based on their construction year, before and after 1990, for steel frame and concrete moment resistant frame structures, based on the first version of the Iran seismic code [
36]. Subsequently, the updated version of the code [
37] was used by Sadeghi et al. to develop fragility curves leading to the general classifications, which included three groups: pre-code, moderate-code, and high-code [
15]. Their work included existing fragility curves such as HAZUS, ATC13, and similar studies, and proposed vulnerability curves for low-rise, mid-rise, and high-rise buildings, based on a combination of engineering judgment and logic-tree approach. They verified their results with historical earthquakes in Iran, such as Manjil and Bam [
15].
The hospitals in Tehran are classified into three general categories: steel frame (including moment resistant frame and steel braced frame), reinforced concrete frame (including moment resistant concrete and shear wall concrete frame), and masonry and brick. It is noted that the data show no wooden structures are used for hospitals [
20,
36,
37,
38]. Renovations and secondary reinforced structures are not considered for this study because the information on the type of renovation for all of the hospitals is not available. The brick masonry is classified separately from other masonry buildings such as stone; however, in the taxonomy for vulnerability analysis, they are categorized as a single masonry type. The heights of buildings are divided into three categories: low-rise (one to three stories), mid-rise (four to seven stories), and high-rise (more than eight stories) accordingly.
The seismic vulnerability models developed have classified the fragility curves based on different building taxonomy. However, these classifications could be normalized and used for a similar building type. The equivalent classifications of the four building types of hospitals in Tehran are listed based on existing developed fragility curves.
Table 1 shows these equalized categories based on FEMA273 [
35], ATC13 [
32], Vision 2000 [
34], HAZUS [
33], JICA [
20], and Jalalian [
21].
There were 255 active health care facilities located in the Tehran metropolitan area. The structural characteristics of only 105 of them were provided for this study. These characteristics comprise type, height, and construction year.
Figure 2 shows the distribution of the health care facility buildings in Tehran in which hospitals and health care services are shown separately. In addition, based on the ease of access to the health care facilities, the city is divided into five major districts: north, east, west, center, and south. The red dashed lines on
Figure 2 show these districts. Density of hospitals varies in these districts.
Table 2 summarizes the density of the hospitals in these five major districts based on the number of hospitals per 100,000 population and the number of hospitals per 1000 hectare. According to the illustrated data, the southern district has the greatest residential population; however, the central district has the highest density of hospitals. Moreover, it is observed that the distribution of hospitals in the five main districts of Tehran is not correlated to the population dispersion.
3. Discussion and Comparisons of Fragility Curves for Seismic Vulnerability Investigations of the Tehran Metropolitan Area
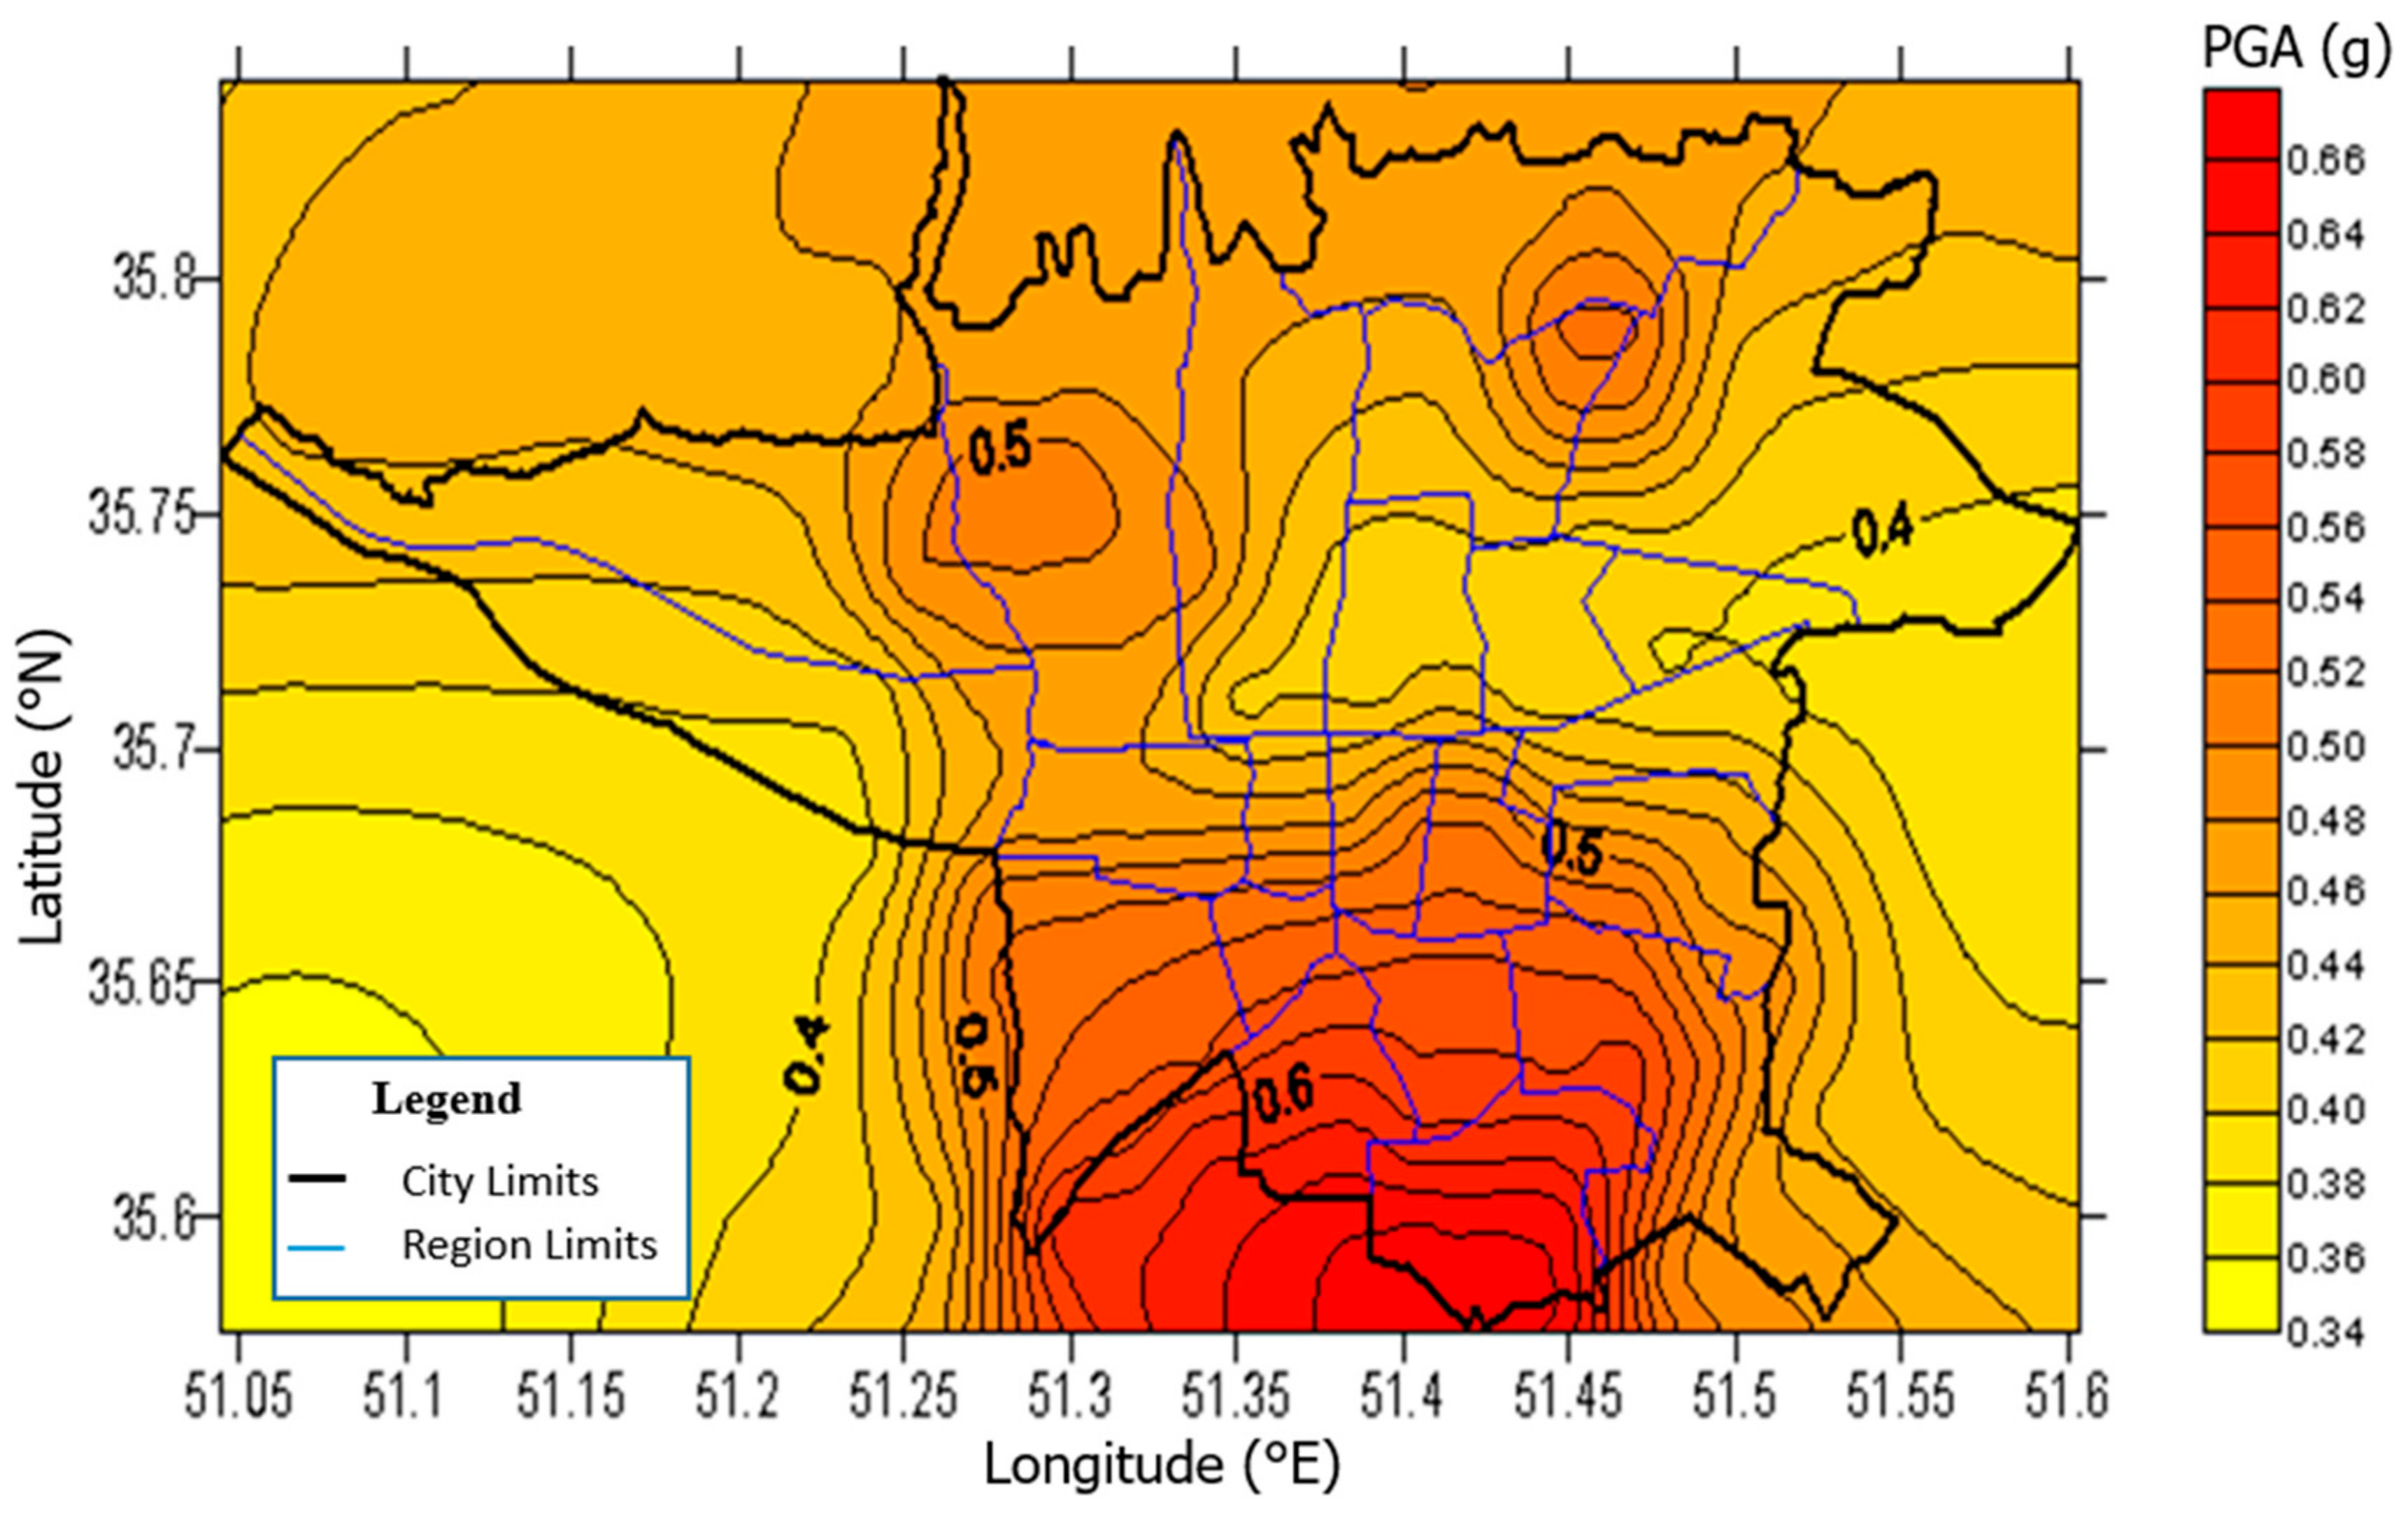
In order to estimate the potential damages in the worst case scenario condition, the existing fragility curves for different types of hospital buildings in Tehran metropolitan are compared at an average peak ground acceleration (PGA) for the city of Tehran. For this purpose, the hazard map of surface PGA considering the shear waves within 30 m from the surface, and with a 475-year return period is used to select the average PGA for comparison and normalization of the damage probability matrices [
39,
40,
41].
Figure 3 shows the seismic hazard map of Tehran on the surface for a 475-year return period [
40]. According to
Figure 3, the average PGA for the entire city of Tehran is 0.5 g and this average for the five major districts varies within 0.4 g to 0.6 g. Hence, 0.5 g is used for comparison and normalization. Later, the PGA of each region is used in the vulnerability analysis of hospitals.
The damage state levels of American vulnerability curves comprising FEMA273 [
35], ATC13 [
32], Vision 2000 [
34], HAZUS [
33] are quantitatively compared with JICA and Jalalian fragility analysis based on their range of possible loss ratio.
Table 3 shows the possible loss ratios for the five fragility curves used in this study. The 100% damage indicates the complete failure of the structure. The only exception represented in the Jalalian study is that the maximum damage would occur if 60% of buildings are ruined. The performance of each building type is characterized based on these corresponding damage states regarding any of the applicable vulnerability schemes. According to this comparison, four general damage states: 0–10%, 10–50%, and 50–100%, are the most common and could be used for final analysis of hospital vulnerability. These damage states are slight, with 0–10% damage; moderate, with 10–50% damage; extensive, with 50–100% damage; and complete, which indicates collapse of the structure. The extensive damage shows that the buildings have at least 50% damage but less than the complete failure.
In order to estimate the worst case scenario for the three building types of hospitals in each of these damage state ranges, the probability of damage at average PGA of 0.5 g are compared and the fragility curve with the higher estimated loss is chosen.
Table 4,
Table 5 and
Table 6 show the probability of damage at different damage states for steel frame, concrete frame, and masonry buildings, respectively.
It is noted that there were not a sufficient number of steel frame buildings in the Northridge and Chi-Chi earthquakes; therefore, FEMA and Vision2000 do not have any applicable curves for this type of building. As shown in
Table 4, estimations based on ATC13 and pre-code HAZUS curves have more than a 40% difference in all stages. JICA only developed curves for complete damage state and Jalalian does not encompass steel frame buildings. Therefore, considering the highest estimated damage in all four stages, HAZUS fragility curves were chosen for all stages of damage in steel frame buildings.
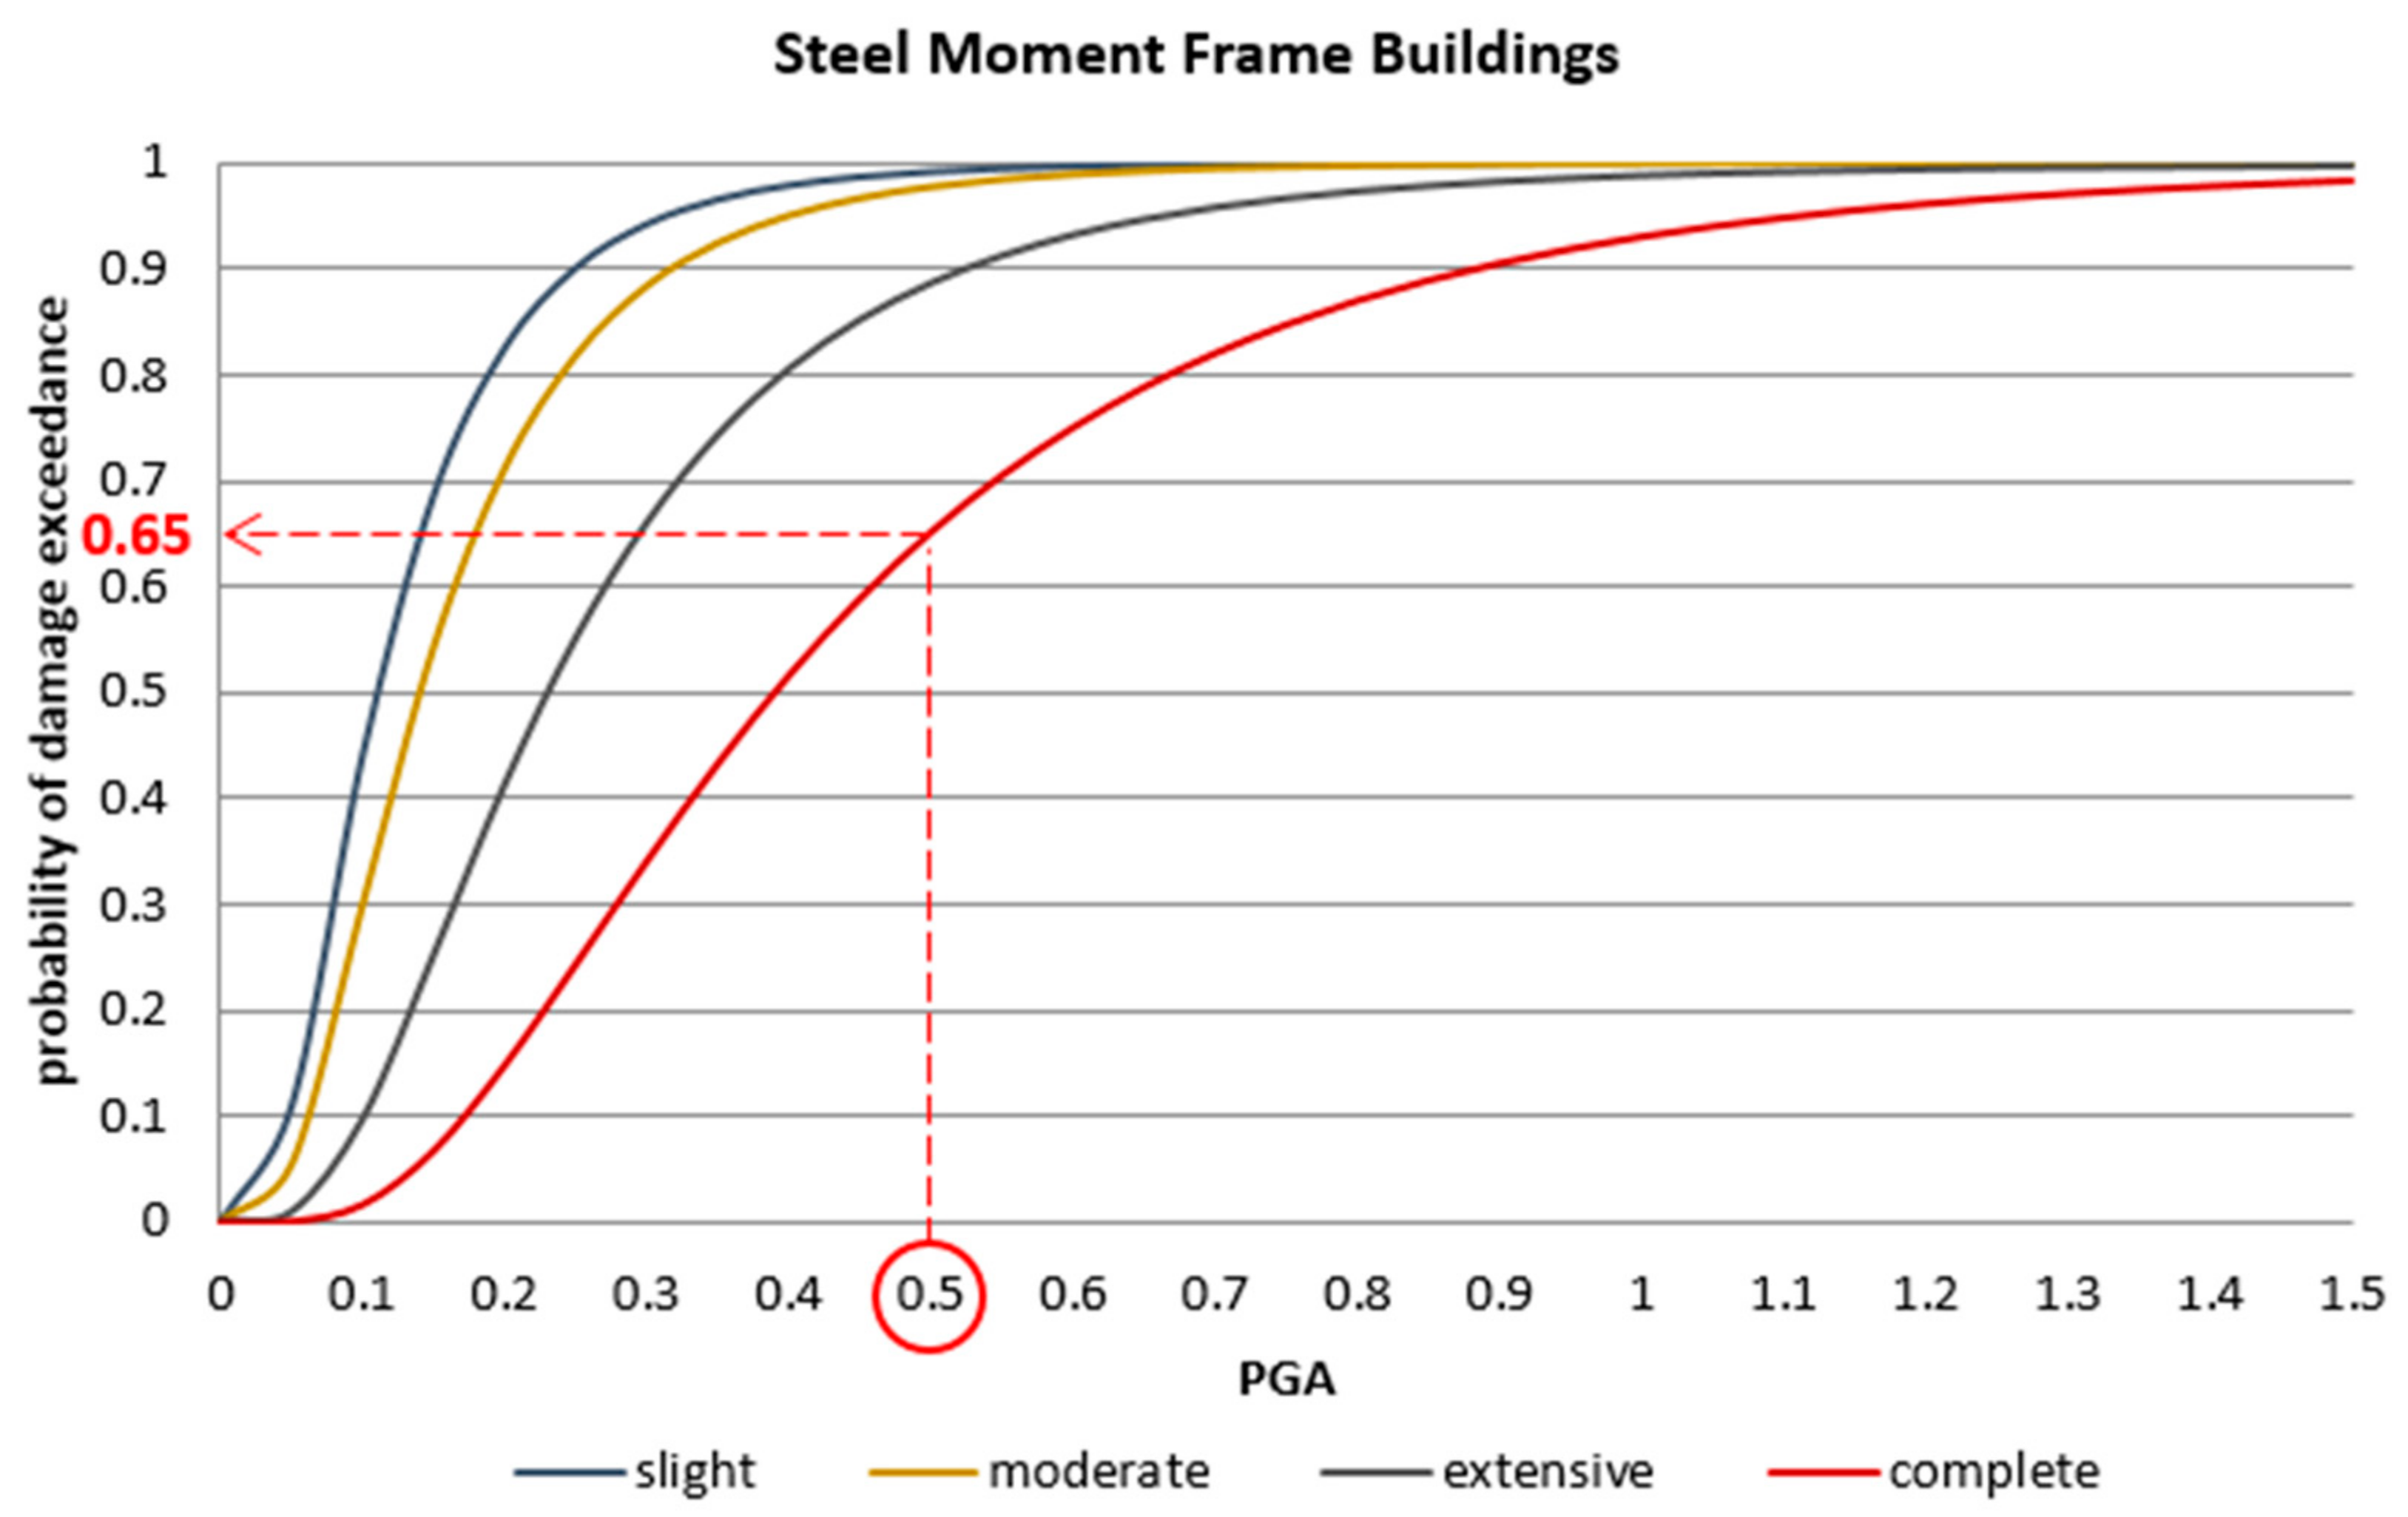
In order to demonstrate the method of comparison, the fragility curves of HAZUS for common steel movement frame buildings in four damage states are shown in
Figure 4. It can be seen that for an average PGA of 0.5 g, the probabilities of the damage exceedance are 65%, 90%, 97%, and 100%, respectively, for the complete, extensive, moderate, and slight damage states. The damage probabilities for other fragility curves were estimated similarly and listed in
Table 4,
Table 5 and
Table 6.
For concrete frame buildings, ATC13 and Vision2000 have an optimistic estimation, as shown in
Table 5. Jalalian fragility curves estimate complete damage to all buildings; however, its fitted curves are not realistic due to the consideration of only a few concrete frame buildings in the dataset. HAZUS curves indicate more loss at all damage states other than the complete damage state, for which JICA has a better estimation. Hence, in this study, JICA fragility curves are used for complete damage state and HAZUS is used for the three other damage states.
The HAZUS, JICA, and Jalalian datasets include unreinforced masonry buildings. Jalalian’s vulnerability study includes Iran’s buildings located in different cities. There are 10–20% differences between damage state limits for Jalalian and the conservative HAZUS vulnerability studies. According to the Jalalian study, at PGA of 0.5 g, 48% of buildings experience more than 60% damage; however, HAZUS estimates that 85% of buildings are prone to more than 50% damage. Hence, the second is considered for slight, moderate, and extensive damage states of masonry buildings. It is noted that JICA only proposed fragility curves for complete damage and its estimation is higher than the HAZUS fragility curve. Therefore, for complete damage states, JICA fragility curves are more conservative, which is demonstrated in
Table 6.
Comparing
Table 4,
Table 5 and
Table 6 indicates that the probability of damage to steel frame structures and concrete structures is almost similar with at most a 7% difference, using the same fragility curve. Based on the JICA studies, three different concrete frame structures are classified in Iran [
20]. According their fragility curves, the best type of reinforce concrete in Iran has a similar performance as a steel frame structure; however, the lower-level concrete frames have poorer performance. The probability of damage in the best reinforced concrete is 57%, while this number increases to almost 100% in the other two types of concrete frames. In the hospitals of Tehran, the best quality concrete frame was used [
36,
37]; hence, the performance of steel frame structures and reinforced concrete structures are identical in complete damage state.
4. Developing Seismic Vulnerability Zoning Maps Based on the Inverse Distance Squared Weighted Interpolation
The probability of damage at the four different damage states of slight, moderate, extensive, and complete are estimated. The correspondence percent loss range for these damage states are 0–10%, 10–50%, 50–100%, and 100%, respectively. According to
Table 4,
Table 5 and
Table 6, HAZUS has the most conservative estimation of the probable damage for the first three stages, and JICA fragility curves have the most conservative estimation for the complete stage. The only exception is HAZUS for steel frame buildings, which is more conservative at the complete state as well. The maximum potential PGA for a 475-year return period at the location of each hospital is considered for this calculation. This approximate PGA at the location of each hospital is used in fragility curves for all of the four damage states, and the probability of the exceedance damage is evaluated. For example, for complete damage state, JICA has the most significant probable damage at 0.5 g; hence, JICA is selected as the considered fragility curve. Subsequently, for a single hospital located at the very west side of the city, the corresponding PGA based on a 457-year return period is 0.42. This is the PGA used to calculate the damage probability of that single hospital using the JICA fragility curve. For all of the 105 hospitals, this probability is assessed at four damage states. The final hazard maps are produced for each damage state using the evaluated damage for the 105 characterized hospitals and interpolated for any point in between. Finally, the seismic hazard zoning maps are developed using the inverse distance squared weighted interpolation method in which the damage probability is estimated for every 10 hectares (100,000 m
2) for each district, based on the maximum 12 closest hospitals within a 5 km radius. Based on the spacing of the scattered hospitals, the most common interpolation methods for seismic zoning, such as polynomial and simple kriging [
42], are implemented in which the weighted inverse distance squared had the least residuals. Equation (1) is used for this calculation:
where P
block is the damage probability of every hectare, P
i is the damage probability of the closest hospitals within 5 km of the target block, and d
i is distance of the block to the known hospitals.
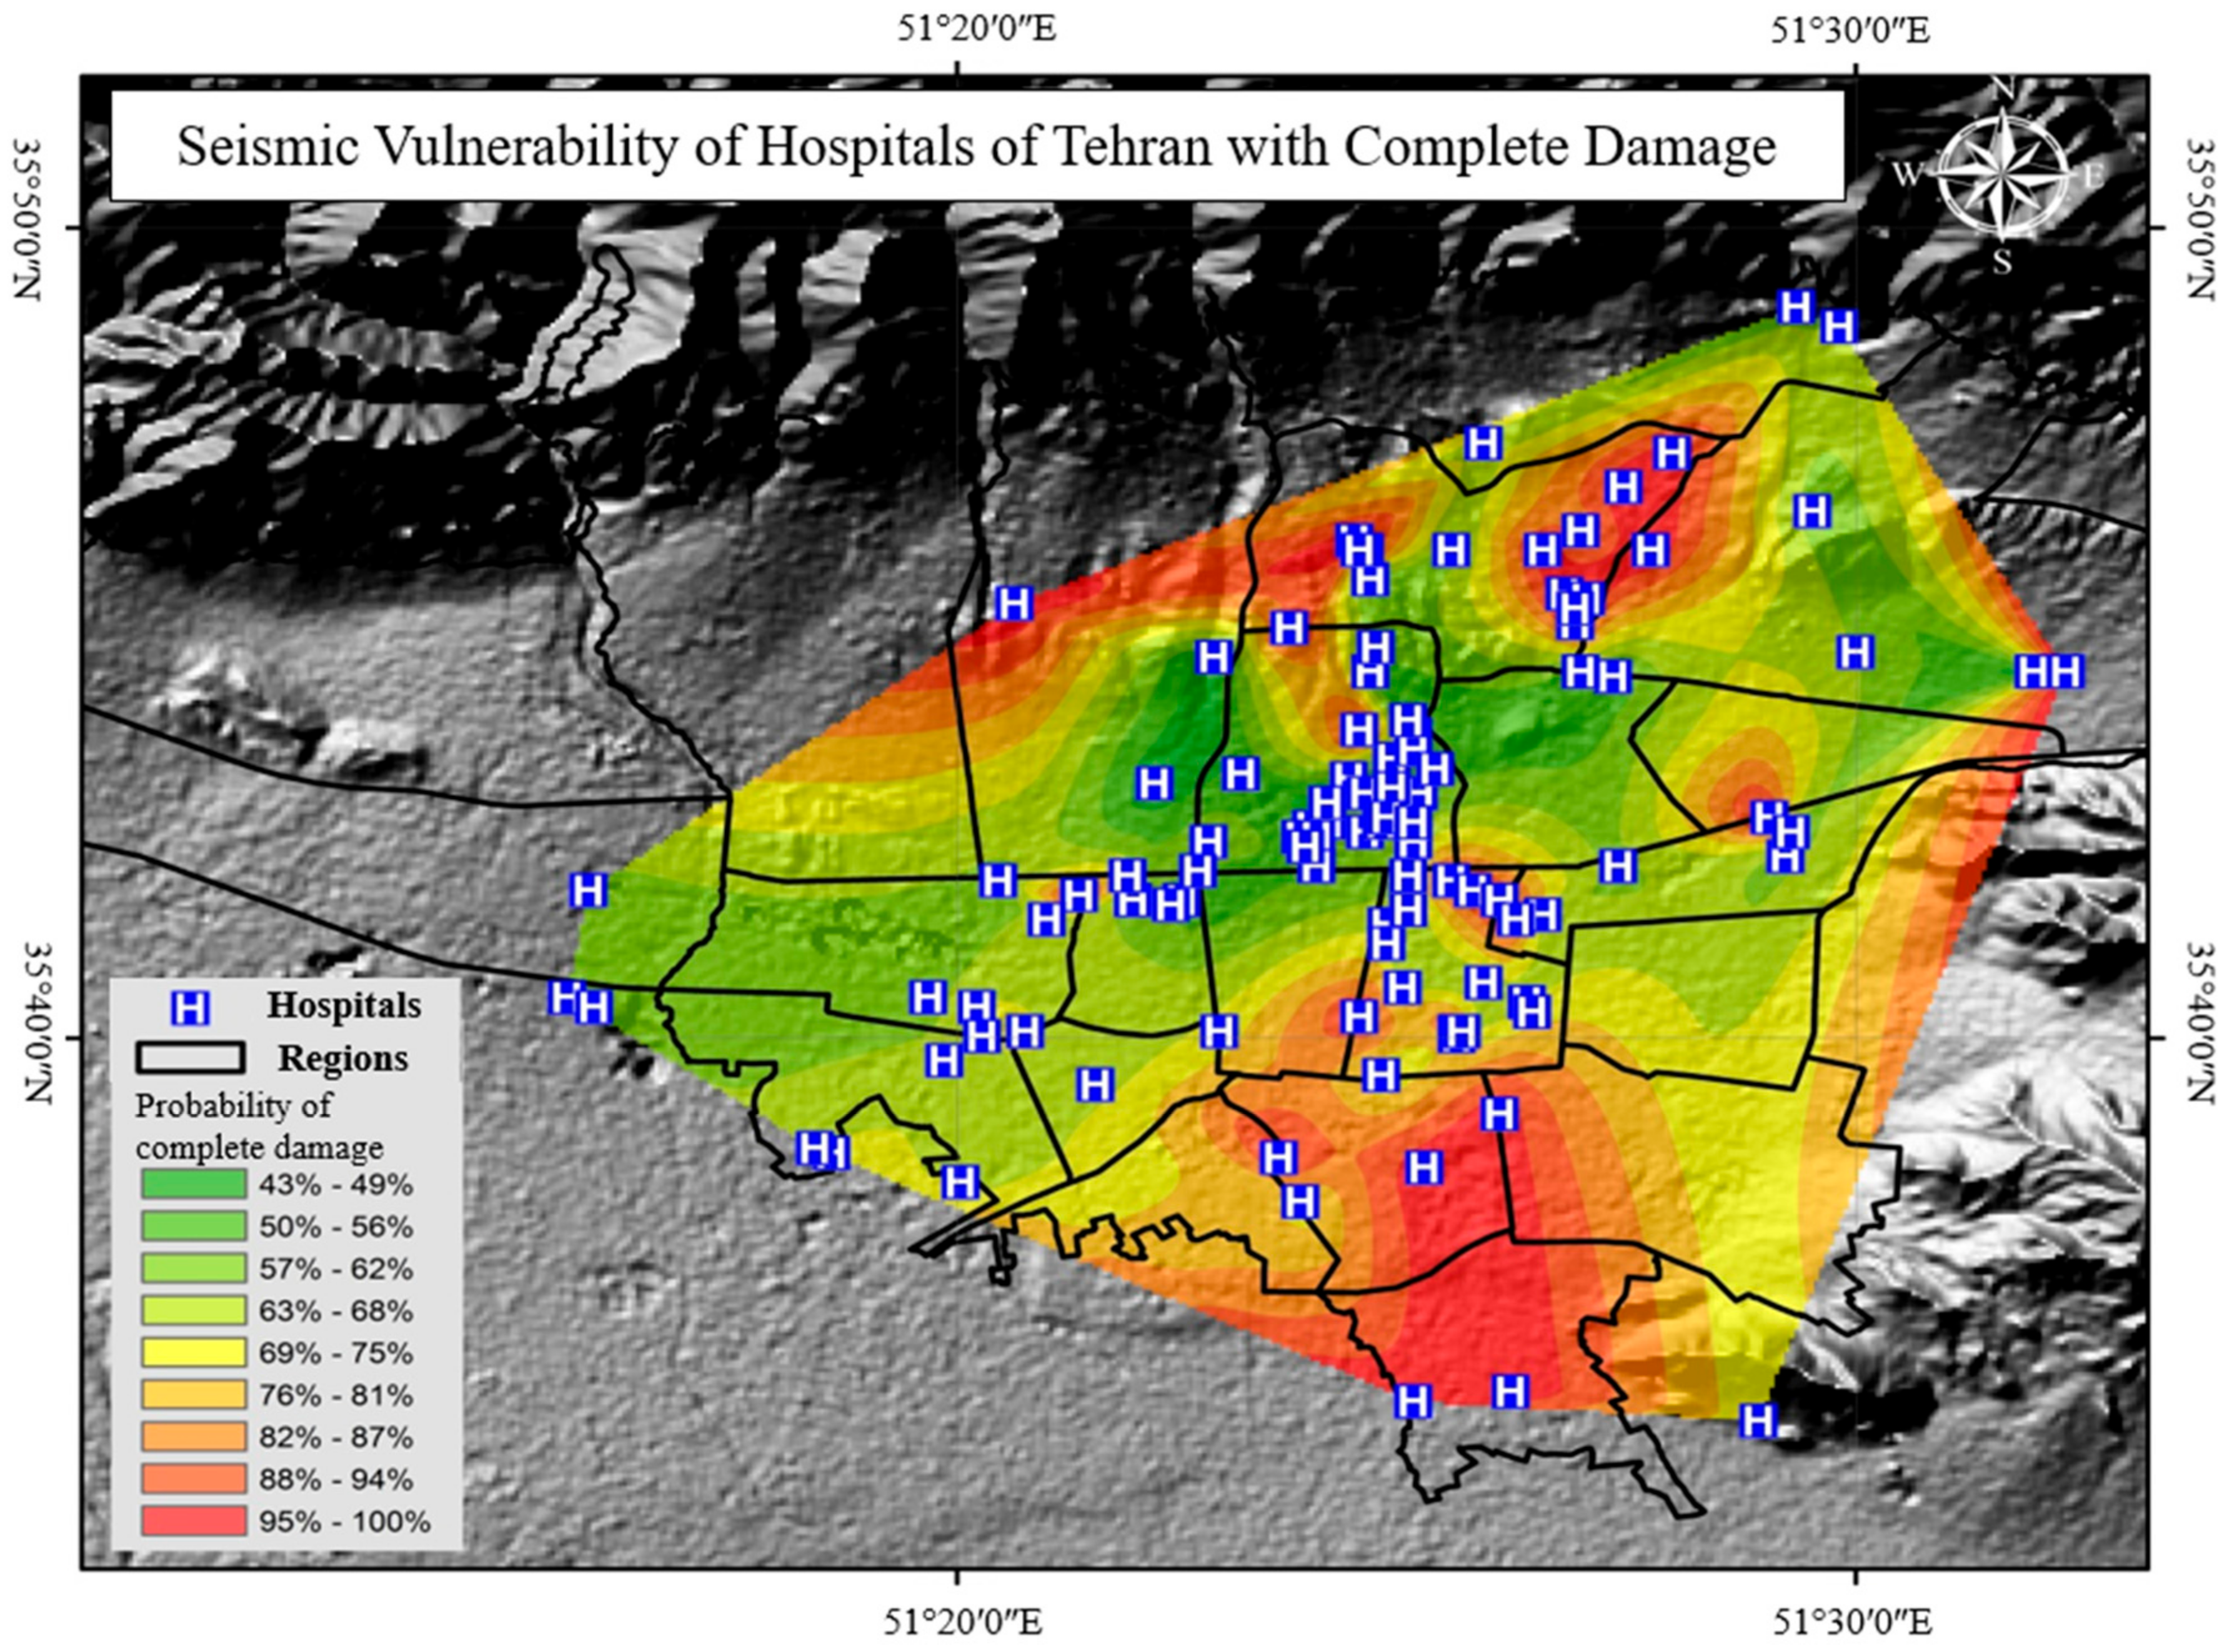
Figure 5 and
Figure 6 demonstrate the estimated damage. It is shown that the southern district of Tehran has the most seismic vulnerability despite its high population and lower density of hospitals compared to the other four districts. According to
Figure 5, the average probability of complete collapse of hospitals in central part of Tehran, with a density of nine facilities per 100,000 population, is approximately 60%. This probability at the southern district increases to 72% in average, and more than 90% for the most severe cases. Although some hospitals located in the northern district are more than 80% probable to completely fail, the average probability of structural failure in this district is about 59%, and the minimum probability of failure in all districts is 43%.
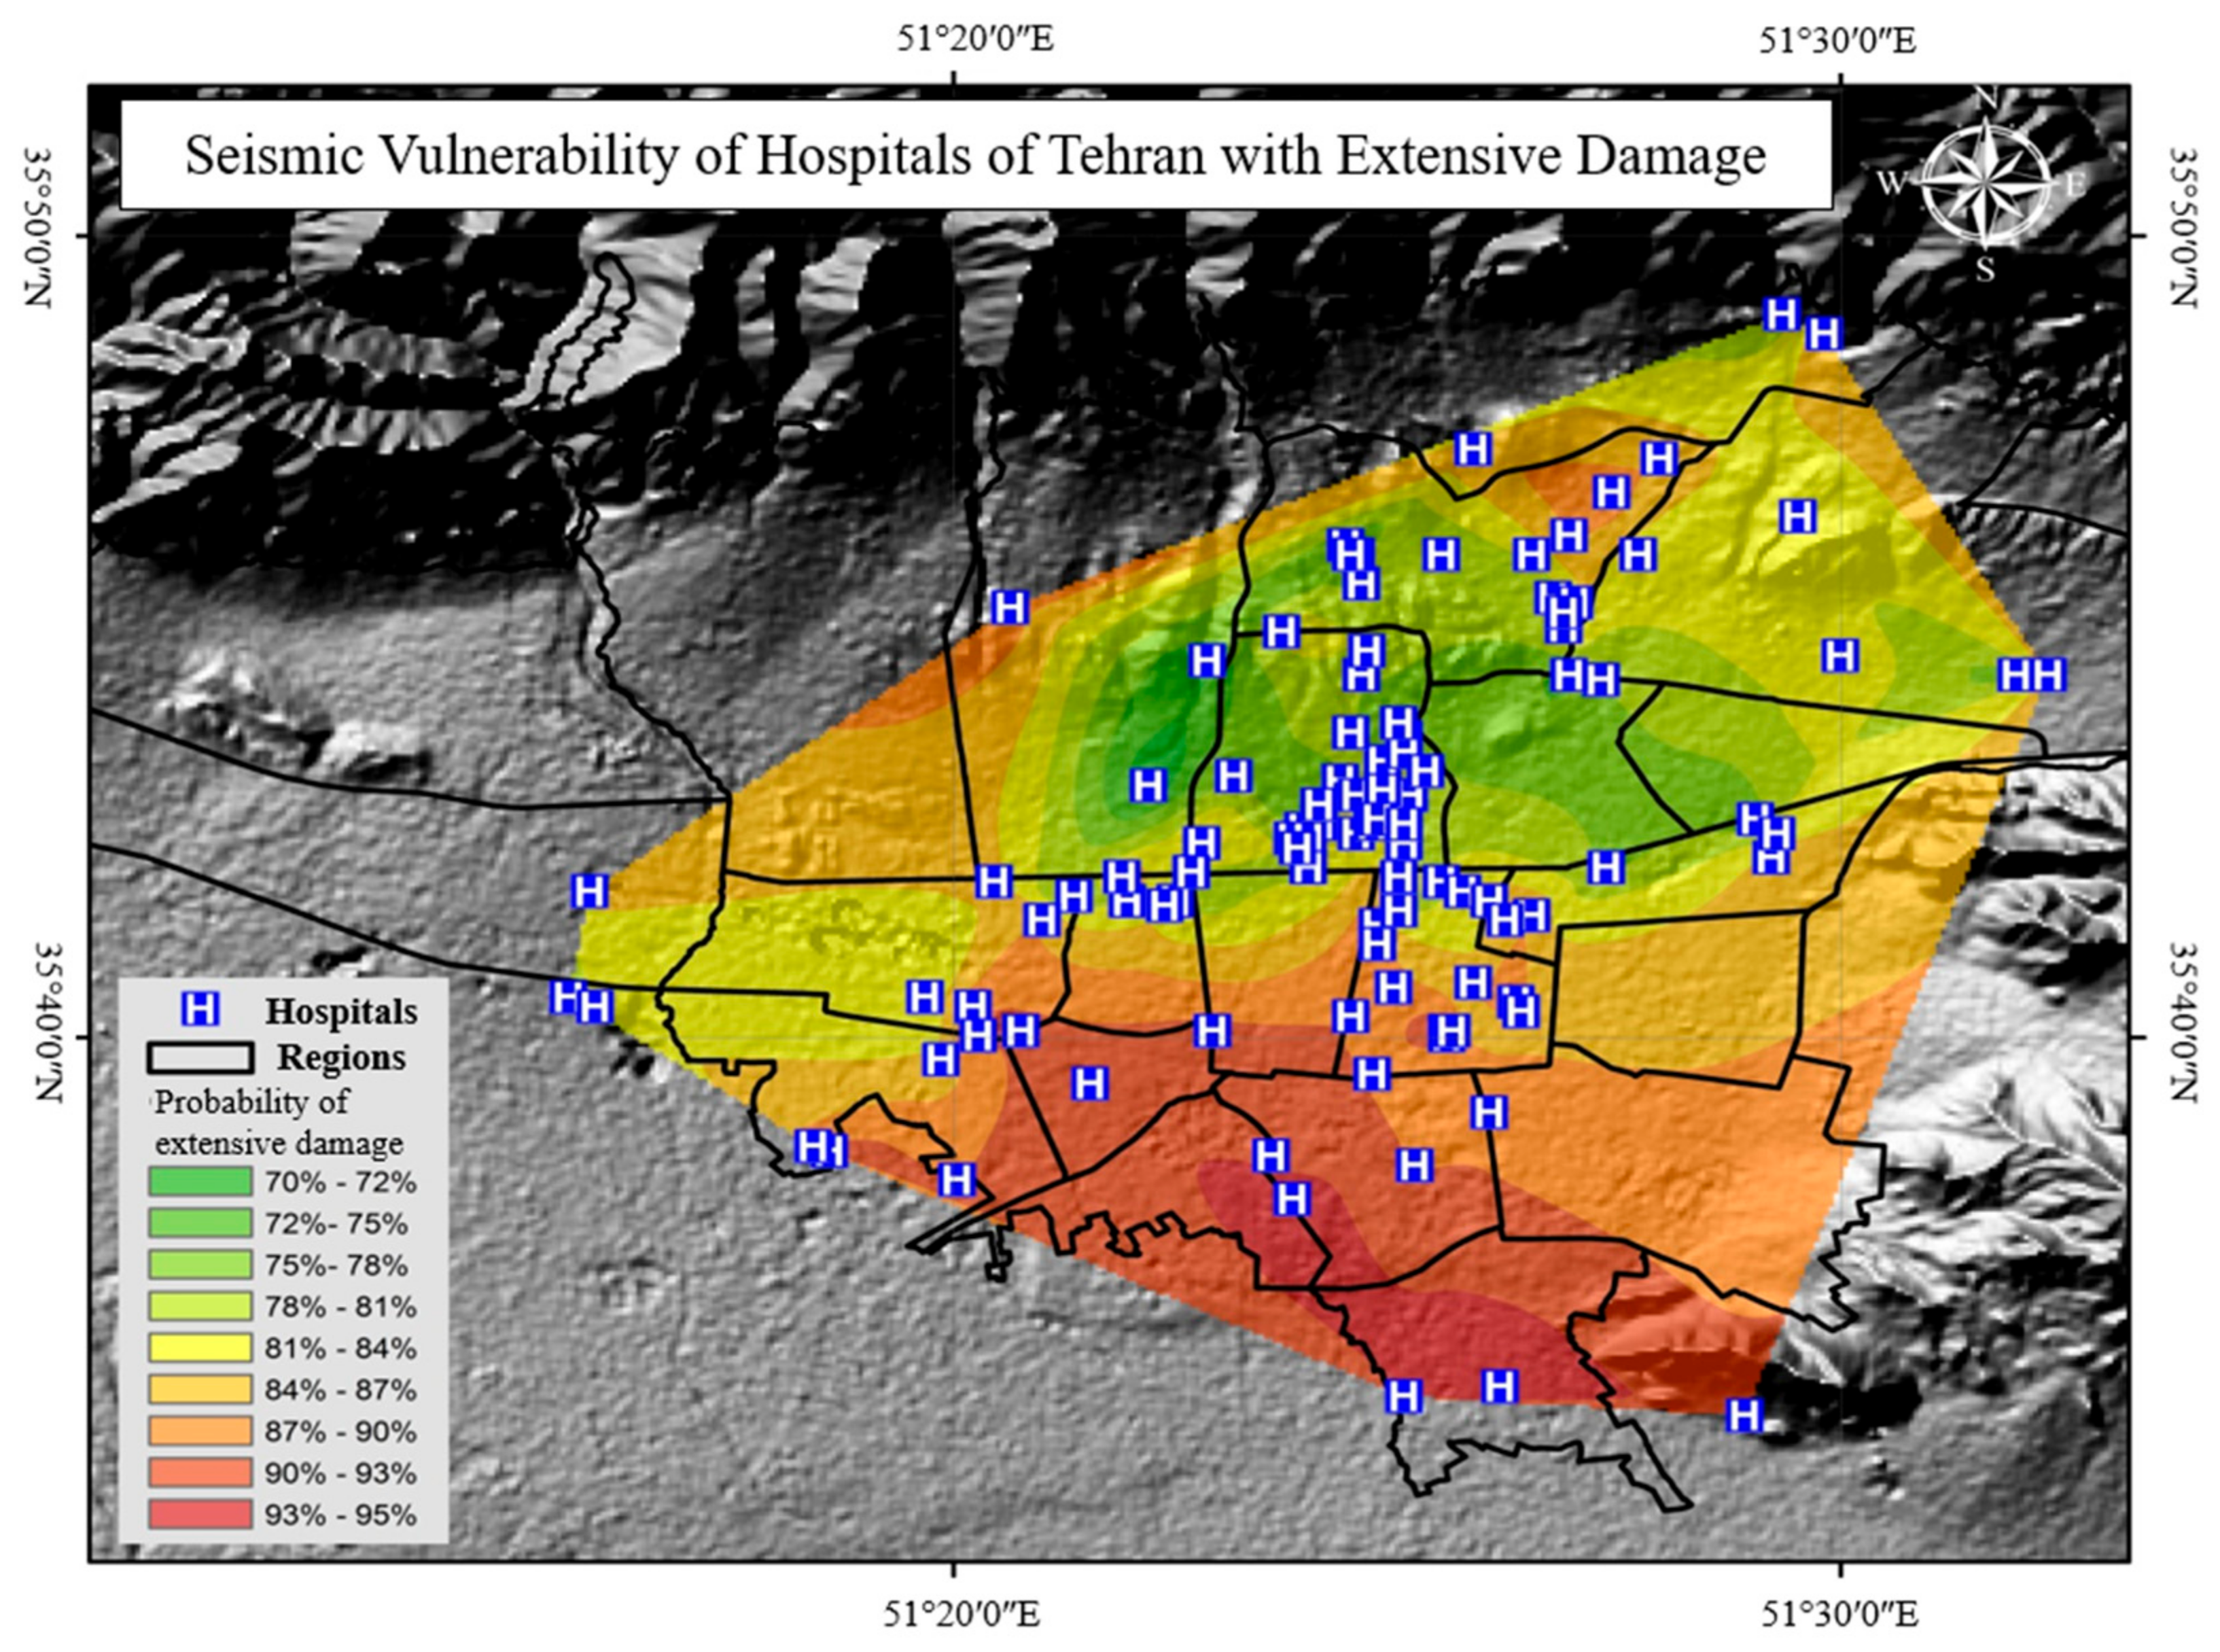
Similarly, it is observed in
Figure 6 that the probability of extensive damage is highest in the southern district of Tehran. The extensive damage state with more than 50% disturbance to the buildings is life threatening, and the health care facilities would not be operable in most of the cases. The level of damage at the central district with the highest hospital density is 85% in average. It is observed that all of the health care facilities in Tehran have more than 70% probability of extensive damage in the case of a potential earthquake with the average PGA of 0.4 g to 0.6 g.
As observed in
Figure 7, the southern district is the most vulnerable and the eastern district has the least vulnerability. The average probability of moderate damage is more than 95% in the city of Tehran, which means almost every hospital could potentially lose at least half of its operability. The eastern district has the minimum probability of extensive damage, which is about 90%.
As the estimated PGA for hospitals of Tehran is more than 0.4 g, the slight damage state vulnerability curves are less applicable due to the increase in probability of slight damage in more intense earthquakes. It is noted that the light damage of less than 2% could be neglected over the normalization of this study as it is shown in
Figure 8, in which the probability of slight damage in all districts is approximately 100%. The minimum probable complete damage in
Figure 8 is 95%.
5. Observations and Discussions
It is observed that in the case of a potential earthquake based on the return period of a 475-year estimation, all of the hospitals of Tehran would face more than 95% slight damage, more than 90% moderate damage, more than 70% extensive damage, and more than 43% complete damage. According to the results, the damages to health care services in the southern parts of Tehran are at higher risk and severity.
Table 7 demonstrates the average probabilities of the four damage states with average PGAs and density of the hospitals located in all five major districts. It is observed that health centers are mostly concentrated in the center of Tehran; however, the residential population is concentrated in the southern, eastern and northern districts. The most vulnerable districts for health care service systems in the aftermath of a potential earthquake are located in the southern district of Tehran, where there are about two hospitals per 100,000 population and almost all of which would face moderate to extensive damage. This scenario is the worst for earthquakes with higher magnitudes. According to the results, the disaster management plans of Tehran should be proactively reinforcing the critical structures such as health care clinics and hospitals before any major earthquakes occur in the city.
The high seismic vulnerability of southern Tehran was also analyzed by Kamranzad et al. In their study, they calculated earthquake risk assessment for Tehran considering site specifications and population density [
7], for which the buildings need to be fortified effectively [
43]. Similar studies suggest that the same district in southern Tehran has high vulnerability of building loss and physical damages [
44,
45,
46]. The nonstructural damage, medical equipment loss, functionality rate of hospitals, and infrastructure damage can complete the results of this study in future work.
The major contributing factors in vulnerability zoning maps are the ground motion level on the surface considering the local site response in terms of PGA and structure taxonomy. The site response is gathered from the earthquake hazard map of Tehran with a return period of 475 years (
Figure 3), which is integrated from seismogenic sources, including faults and geological features, and seismicity of the area, including the historical and instrumental seismic catalog of Tehran. The final PGA shown on the map is computed by a probabilistic model considering site-to-source distance, local soil properties, and fault mechanism [
7,
12]. The taxonomy of structures includes its age, height, and type. Therefore, the results of this study are influenced by site parameters, such as site-to-source distances and site conditions, but not as direct inputs. Kamranzad et al. considered surface rupture width and length, and near field effects such as cracks to account for seismic risk analysis of buildings in Tehran [
7]; similarly, as future work, rupture zones can be considered in estimating vulnerability of healthcare centers. Moreover, the certainty of estimation can potentially increase using local fragility curves with real data, including data from earthquakes in Iran [
15]. Future work may include site specification characteristics, local fragility curves, and smaller districts. The same vulnerability analysis can include all buildings in the city of Tehran if their taxonomies are available. Additionally, using local fragility curves, a similar comparison and analysis can be applied to different cities.
6. Conclusions
Hospitals are critical structure in response to natural disasters such as earthquakes. The vulnerability of hospitals to potential earthquakes is critical in preventive seismic crisis management plans. In this study, the vulnerability studies of ATC13, Vision2000, FEMA, HAZUS, JICA, and Jalalian are compared and the most conservative experimental fragility curves for hospitals of Tehran are chosen based on the largest estimated damages for four damage states: slight (0–1% damage), moderate (10–50% damage), extensive (50–100% damage), and complete (100% damage). For this purpose, these vulnerability curves are compared in a normalized damage state classification using an average PGA for the city of Tehran. Based on this comparison, HAZUS proposed the most conservative estimation for slight, moderate, and extensive states, and JICA estimated the most damages at the complete state for two types of hospital buildings, including concrete frame and unreinforced masonry. For steel frame buildings, HAZUS is the most cautious analysis for all of the other damage states. The differences between HAZUS and JICA for the complete damage state are 8%, 40%, and 16% for steel frame, concrete frame, and masonry buildings, respectively.
The hospitals of Tehran are classified within five major districts with different density of health care facilities per capita and per area. In all of the districts, the minimum probability of the complete damage is 43%, and the average probability of complete damage in the five districts varies from 56% in the eastern Tehran to 72% in southern Tehran. The probability of moderate and extensive damage is the most in the southern district with an average of 99% and 91%, respectively. The density of the hospitals in this district, however, is about two per 100,000 population, which makes this district a major concern in the case of a crisis. The density of hospitals in central Tehran is four times larger than the southern district, and the probability of moderate to extensive damage in the center is 2–6% less compared to the southern areas. The northern, eastern, and western districts have 1.5–3 hospitals per 100,000 population, and have more than 95% and 81% average probability for moderate to extensive damage, respectively. These results are in a good agreement with overall vulnerability studies for entire city of Tehran [
44,
45,
46].
The overall seismic vulnerability maps indicate the health care facilities in southern part Tehran are at the most risk in case of an earthquake and require extreme reinforcement in order to be prepared for future seismic hazards. Consequently, the result of this study is an advantageous reference for improvement of earthquake preparation plans and modification of crisis response strategies based on understanding the most critical areas in the aftermath of an earthquake.


