Abstract
In this paper, five reinforced concrete double-corbel specimens with the same designed bearing capacity are produced according to the triangular-truss method (TTM) in GB 50010-2010. Corbels with different dimensions and reinforcement configurations are obtained by separately varying the concrete compressive strength and shear span. The differences in the mechanical performance and load-bearing capacity of the corbels are compared to evaluate the accuracy and rationality of the TTM under specific variables. Then, the accuracy in predicting the load-bearing capacity of GB 50010-2010, ACI 318-19, EC 2, CSA A23.3-04, the softened strut-and-tie method, and the Russo strut-and-tie method is compared. The results show that the safety factor (ratio of the actual bearing capacity to the designed bearing capacity) of the TTM is increased from 1.419 to 1.718 when the concrete strength is improved from 20.8 MPa to 65.3 MPa; the safety factor of the TTM is increased from 1.414 to 1.859 when the shear span–depth ratio is increased from 0.25 to 0.67. Compared to GB 50010-2010, ACI 318-19, and EC 2, the predictions of CSA A23.3-04 for corbels are closer to the test values. The safety level of codes GB 50010-2010, ACI 318-19, and EC 2 is essentially the same; both the SSTM and the Russo STM are accurate in the predictions.
1. Introduction
Reinforced concrete corbels are widely used in the construction of industrial buildings as the convenient hinged supporting member. Corbels are mainly subjected to shear loads, resulting in complex stress distribution [1,2,3]. Since the plane-section assumption is no longer satisfied, corbels are commonly classified as the disturbed region’s member, where the strain distribution is significantly nonlinear [4,5,6]. As the brittle failure generally occurs in corbels, which causes the collapse of the crane beams and roofs, it is important to provide a reliable design method for the corbels.
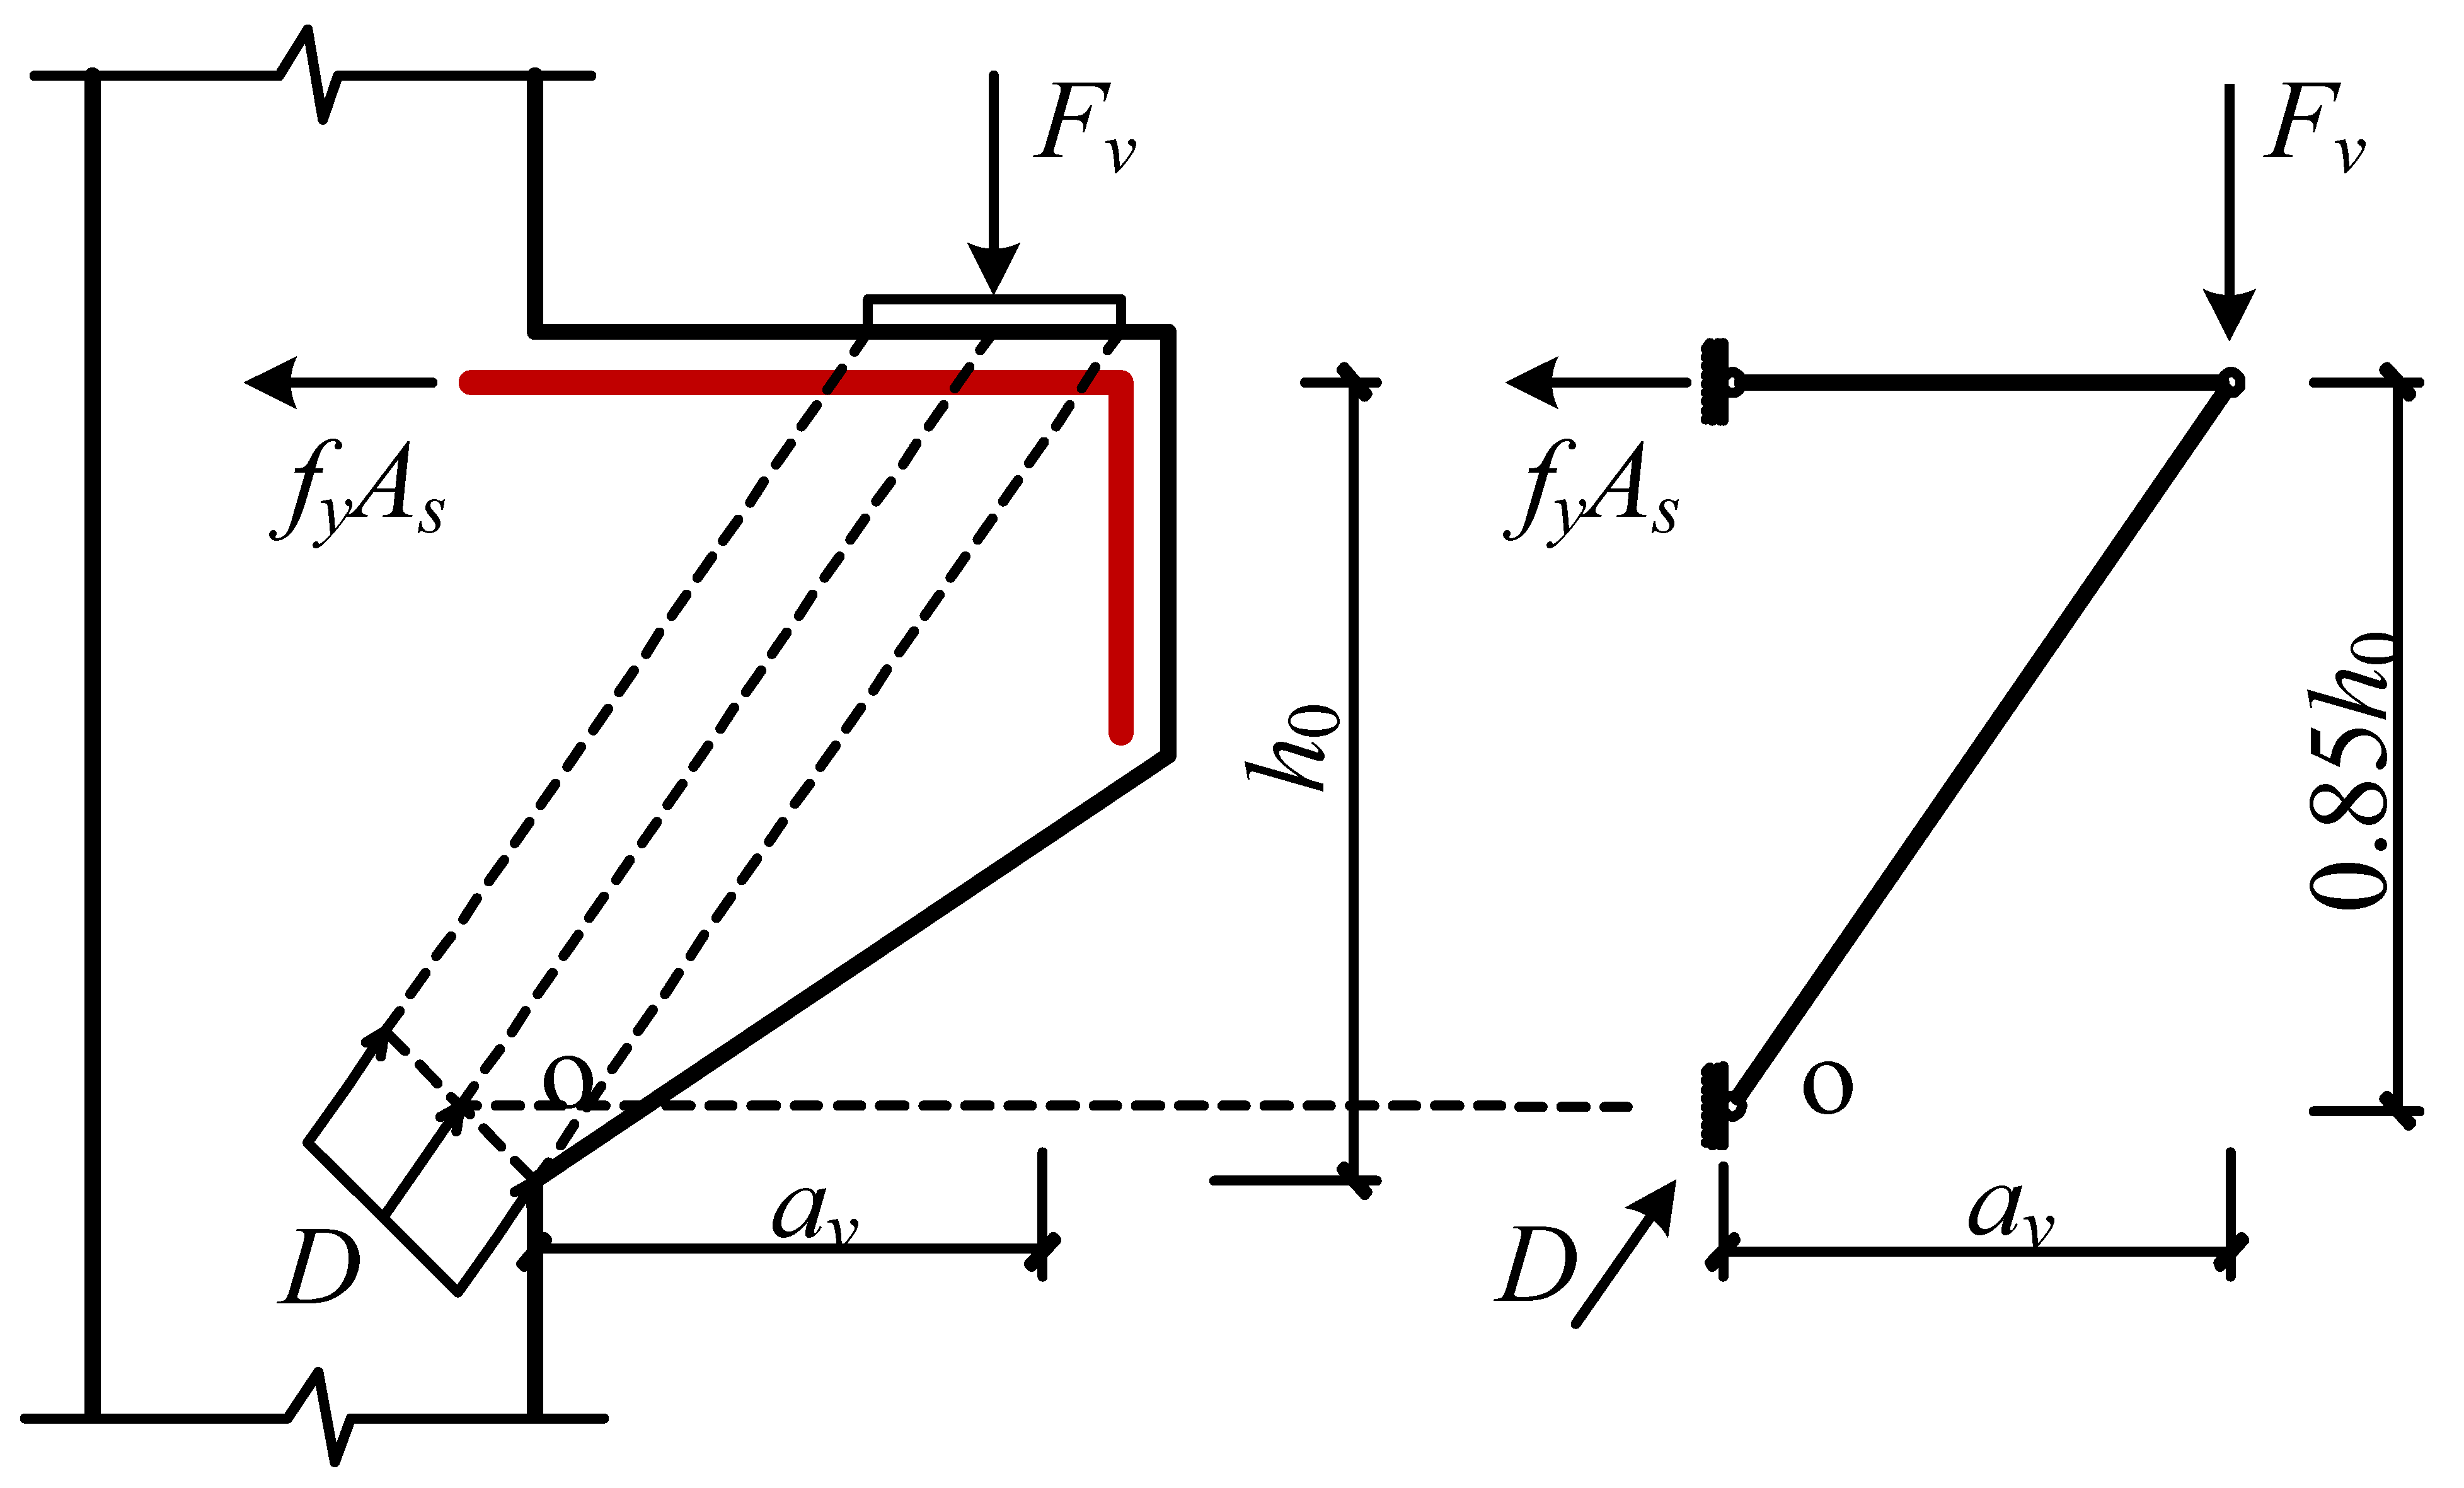
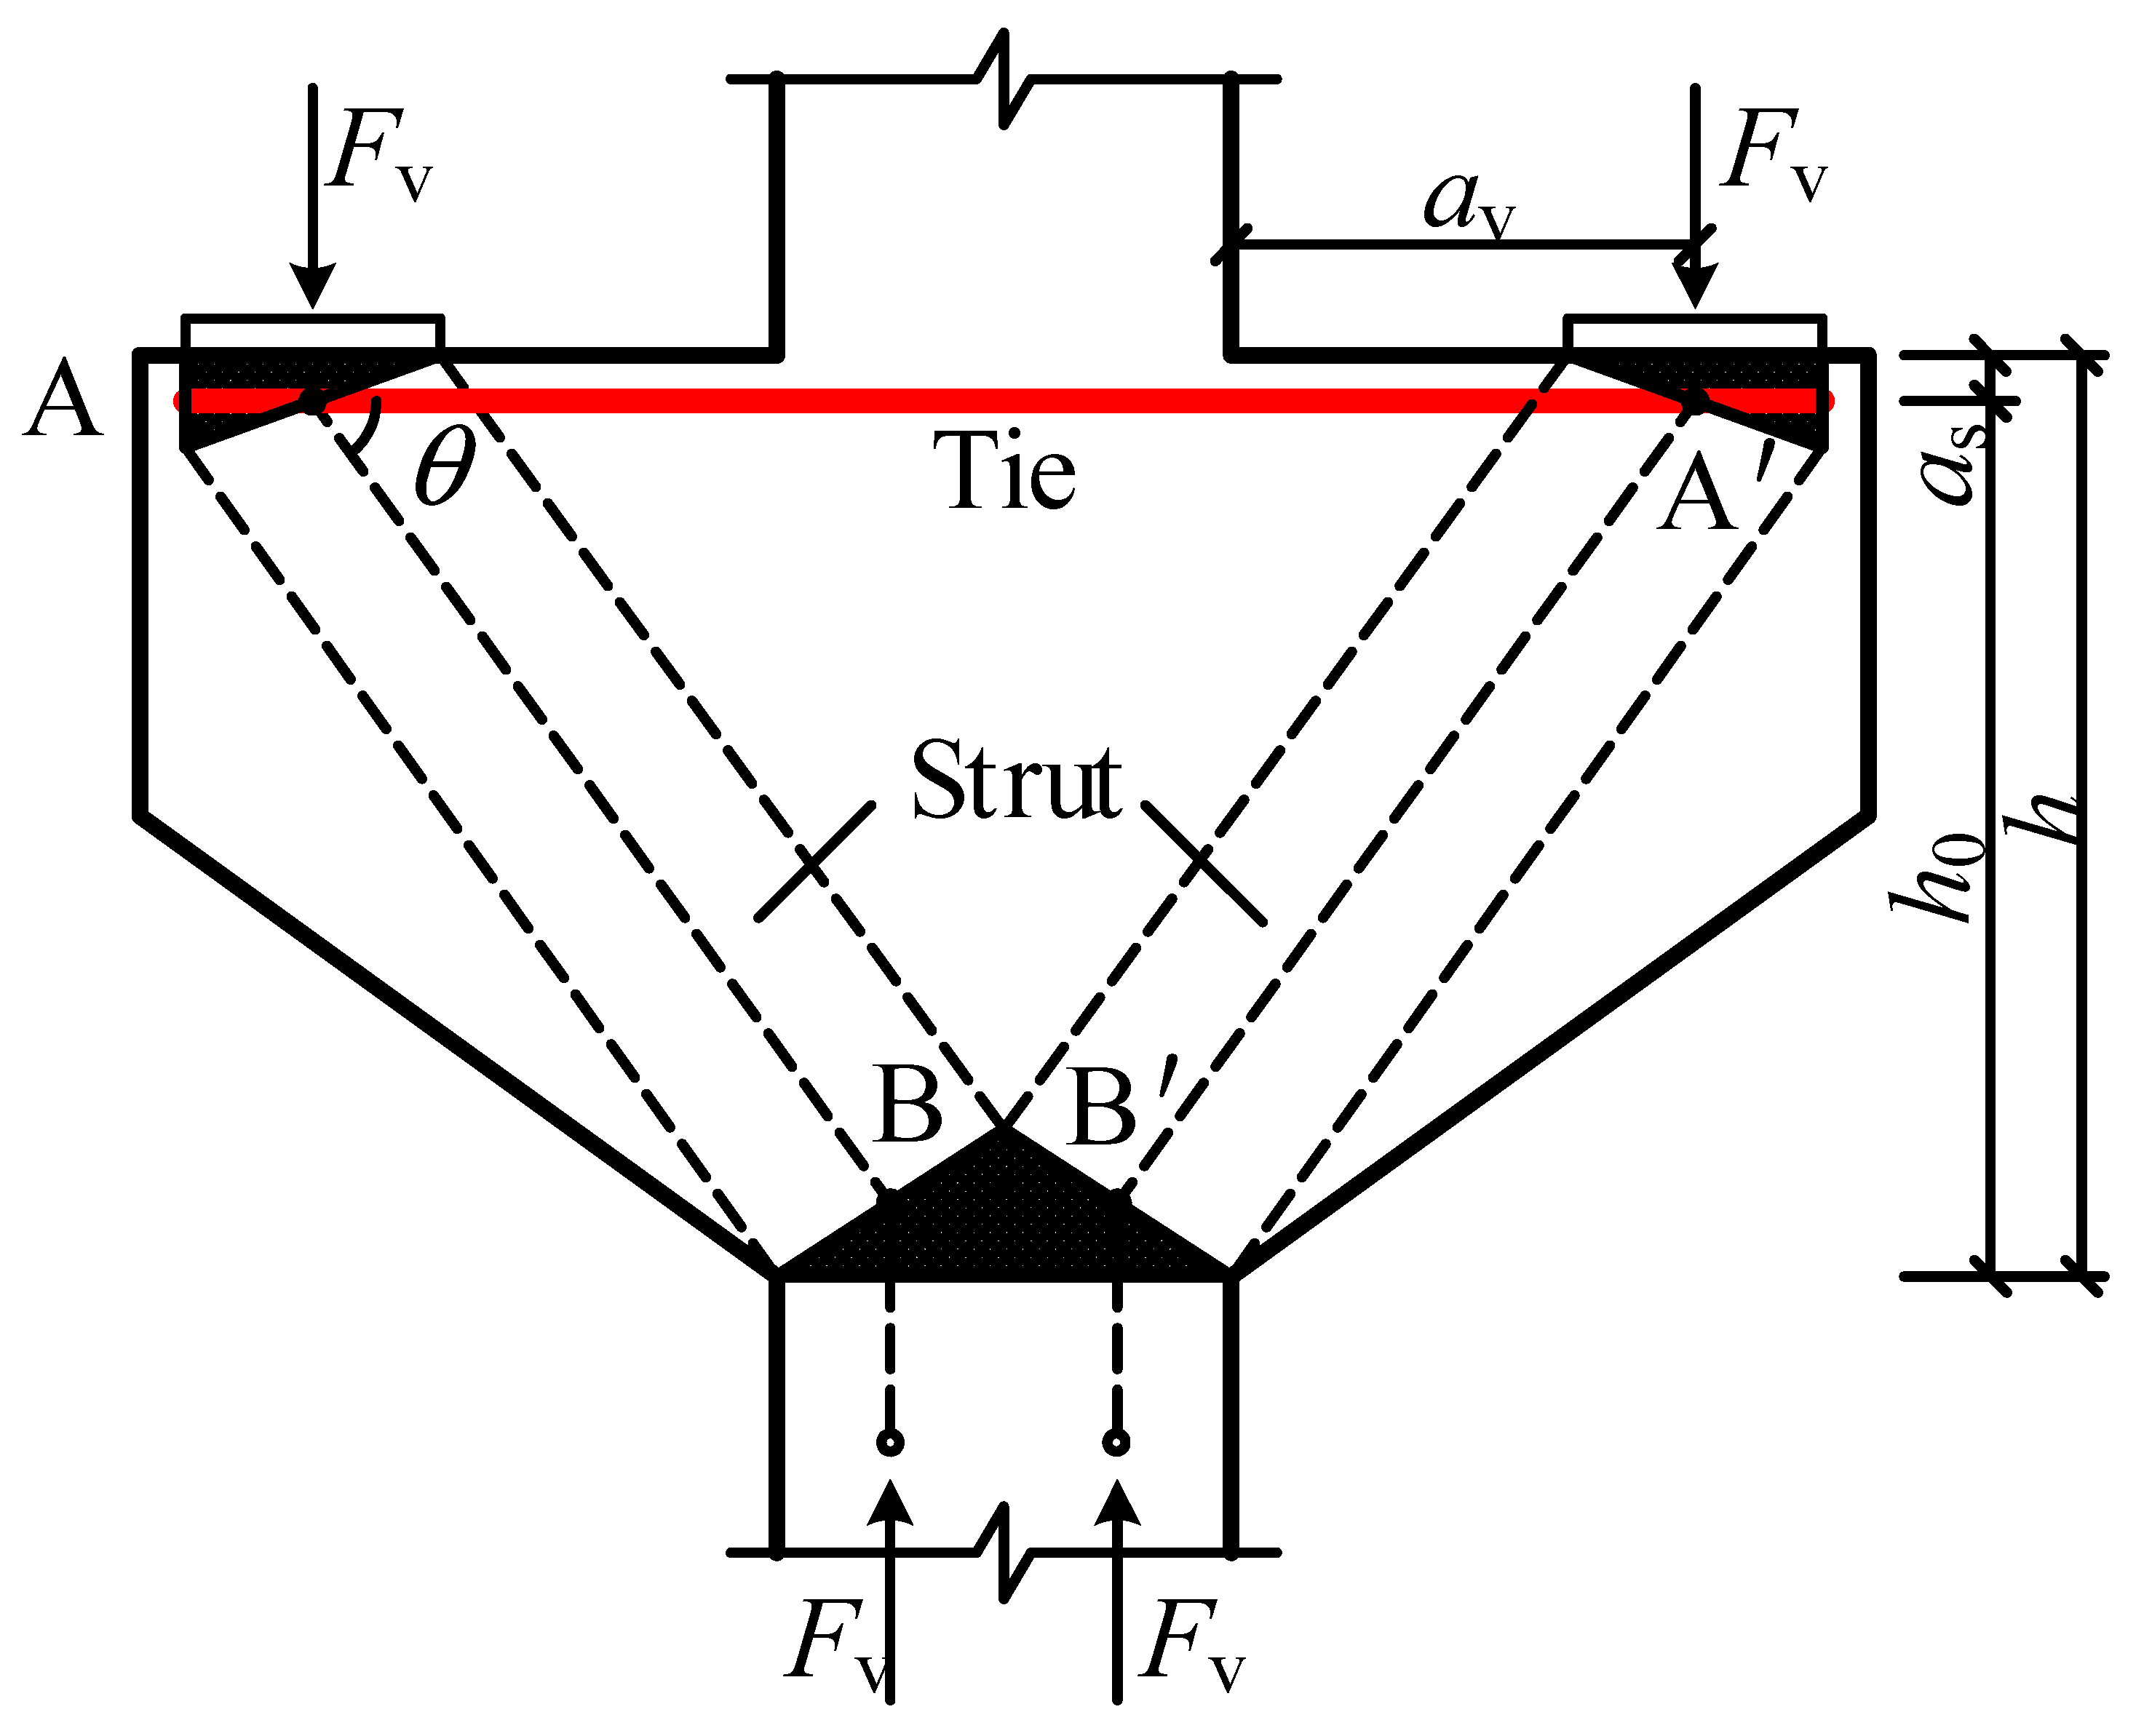
The triangular-truss method (TTM) is widely used and has been adopted by the Chinese code GB 50010-2010 [7]. The schematic diagram of this method is shown in Figure 1. The TTM treats the corbel as a triangular truss, with the longitudinal bars acting as a tension tie and the inclined concrete as a compression strut. The TTM was derived from Ding’s [8] reinforced concrete corbel test. The test results show that the stress in the longitudinal bars is evenly distributed, rather than varying from one end to the other, which is similar to the stress distribution within the tie in a truss; and the shear load is transferred in an almost linear direction from the loading point to the root of the corbel, which makes the inclined concrete act in the same way as a compression strut in a truss. The TTM recommends the yielding of the longitudinal bars as the indication of corbel failure. The load-bearing capacity is calculated by
where, fy is the yield strength of the longitudinal bars; As is the area of the longitudinal bars; h0 is the effective depth of the corbel section; av is the shear span value, which cannot exceed the effective depth value of the corbel section (h0) [7].

Figure 1.
Triangular-truss method.
Meanwhile, to control the crack width under the serviceability limit state, the code GB 50010-2010 stipulates the following provision for corbel cross-sectional dimensions, expressed by
where, Fvk is the load corresponding to the serviceability limit state, taken as 0.67 Fv [7]; ftk is the standard tensile strength of concrete; b is the thickness of the corbel.
Previous studies on corbels have mainly focused on the effect of certain factors. Canha et al. [9] found the corbel’s bearing capacity was strongly correlated with the shear span–depth ratio, longitudinal bars, and the concrete compressive strength. The vertical stirrups were efficient in increasing the corbel′s ductility but made little contribution to the bearing capacity. Yun and Lee [10] proposed a corbel′s bearing capacity formula, including the shear span–depth ratio, aspect ratio, concrete strength, and reinforcement area. Hamoodi′s [11] test results showed that the corbel’s bearing capacity improved by 20.2% when the shear span–depth ratio decreased from 0.50 to 0.35. Huang′s [12] test showed that the corbel’s bearing capacity was enhanced with the increase in concrete strength. Li et al. [13] found the TTM could be used to design both normal-strength and high-strength concrete corbel. Some scholars have also worked on the theoretical calculation for corbels’ bearing capacity. The strut-and-tie method (STM) [14] was proposed to predict corbels’ capacity. The STM treats the corbel as a system consisting of the concrete compression struts, rebar tension ties, and nodes, and assumes that the failure is triggered by any components reaching the ultimate bearing strength. Wilson [15] compared the accuracy between the STM and the empirical design method in ACI 318-14 and demonstrated a higher level of safety for the STM. Hwang et al. [16,17] furthered the STM theory by proposing a softened strut-and-tie method (SSTM), in which the softening coefficient of the compression concrete was taken into account. The softening coefficient was calculated by iteration. Russo et al. [18] provided a simplified calculation formula for the softening coefficient by fitting test data and proposed the simplified strut-and-tie method; that is, Russo STM. The SSTM and Russo STM are two widely used calculation methods for predicting a corbel′s bearing capacity [6,12].
To the authors′ knowledge, there is still a lack of research into the accuracy and rationality of the TTM, particularly for the corbels with the same designed bearing capacity but configured with different concrete compressive strength or shear spans. Previous research used the variable-controlling method to investigate the effects of factors on the bearing capacity of corbels [9,10,11,12,13], for which the designed bearing capacities were not the same. In actual corbel design, the design load is determined first. Then, the designer selects the concrete strength and calculates the dimensions and reinforcement. Different concrete strength or shear spans will lead to different corbel dimensions and reinforcement configurations. Do the designer’s selections, such as concrete strength or shear span, influence the actual bearing capacity of corbels if the design load is the same? This paper aims to be a guide to choosing the design parameters, such as the concrete compressive strength and shear spans, to obtain the maximum capacity of the corbels.
This paper designed five corbel specimens with the same design load but different concrete strengths or shear spans according to the TTM. The focus is to compare the actual bearing capacity, stiffness, and crack development between these specimens. In addition, the accuracy of bearing capacity predictions was compared among the Chinese code GB 50010-2010 [7], American code ACI 318-19 [19], Eurocode EC 2 [20], Canadian code CSA A23.3-04 [21], the SSTM [17], and the Russo STM [18].
2. Experimental Program
2.1. Design of Corbels
Five double-corbel specimens were tested in this study. Regarding the scales of crane beams commonly used in industrial buildings [22,23], 750 kN was taken as the design load value for all the specimens. The variable parameters are the concrete compressive strength and shear span. The design gradients of concrete strength are 30 MPa, 45 MPa, and 60 MPa; the design gradients of shear span are 100 mm, 200 mm, and 300 mm, corresponding to shear span–depth ratios of 0.31, 0.50, and 0.67. When keeping the design load and the shear span constant, the height of the corbel can be determined by Equation (2). If the concrete compressive strength varies from 30 MPa to 60 MPa, the effective height (h0) will vary from 375 mm to 500 mm. The cantilever length is determined by the shear span studied in this paper. The area of longitudinal bars is calculated according to Equation (1) above after determining the concrete strength and shear span. The area of horizontal stirrups within 2/3 of the corbels’ section depth is not less than 1/2 of the longitudinal bars [7]. The design parameters are listed in Table 1 and the reinforcement diagrams are shown in Figure 2. The bending radius of the rebar is two times the diameter of the rebar [7]. The thickness of all specimens is 300 mm. The concrete cover is 20 mm. Densify the stirrups at the bottom of column to avoid local crushing. Strain gauges were installed on the longitudinal bars and horizontal stirrups, and the position was at the interface between the corbels and the center column. The label of specimens consists of two parts: the first represents the designed compressive strength of concrete and the second represents the shear span–depth ratio.

Table 1.
Design parameters of corbels.
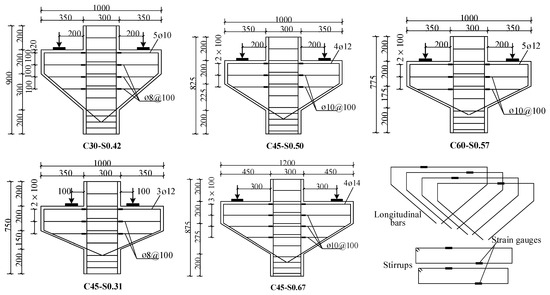
Figure 2.
Layout of reinforcements and position of strain gauges. Note: Configuration of longitudinal bar in columns is 4ø20; Configurations of stirrups in columns are ø8@100 and ø8@50.
2.2. Material Properties
The material proportions and the compressive strength of the concrete are listed in Table 2. The concrete mix properties were designed according to the Specification JGJ 55-2011 [24]. The superplasticizer was used for C45 and C60 to reduce water usage. Both superplasticizer and fly ash were used for C60 to improve construction performance [24].
Table 2.
Mix proportions and property of concrete.
The specimens were configured with HRB400 grade steel bars, where HRB stands for the hot-rolled ribbed bars and 400 stands for the nominal yield strength in MPa. Rebar properties are listed in Table 3.
Table 3.
Reinforcement properties.
At the design phase of the specimens, the designed yield strength of the reinforcement was taken as 480 MPa; and the designed compressive strength of concrete was taken as 30 MPa, 45 MPa, and 60 MPa, respectively. The difference between the tested strength and the designed strength of rebar and concrete leads to a deviation between the actual designed bearing capacity and the original designed capacity, while the deviations are small. The actual designed bearing capacity is used in subsequent calculations such as the factor of safety for load-bearing capacity.
2.3. Testing Setup
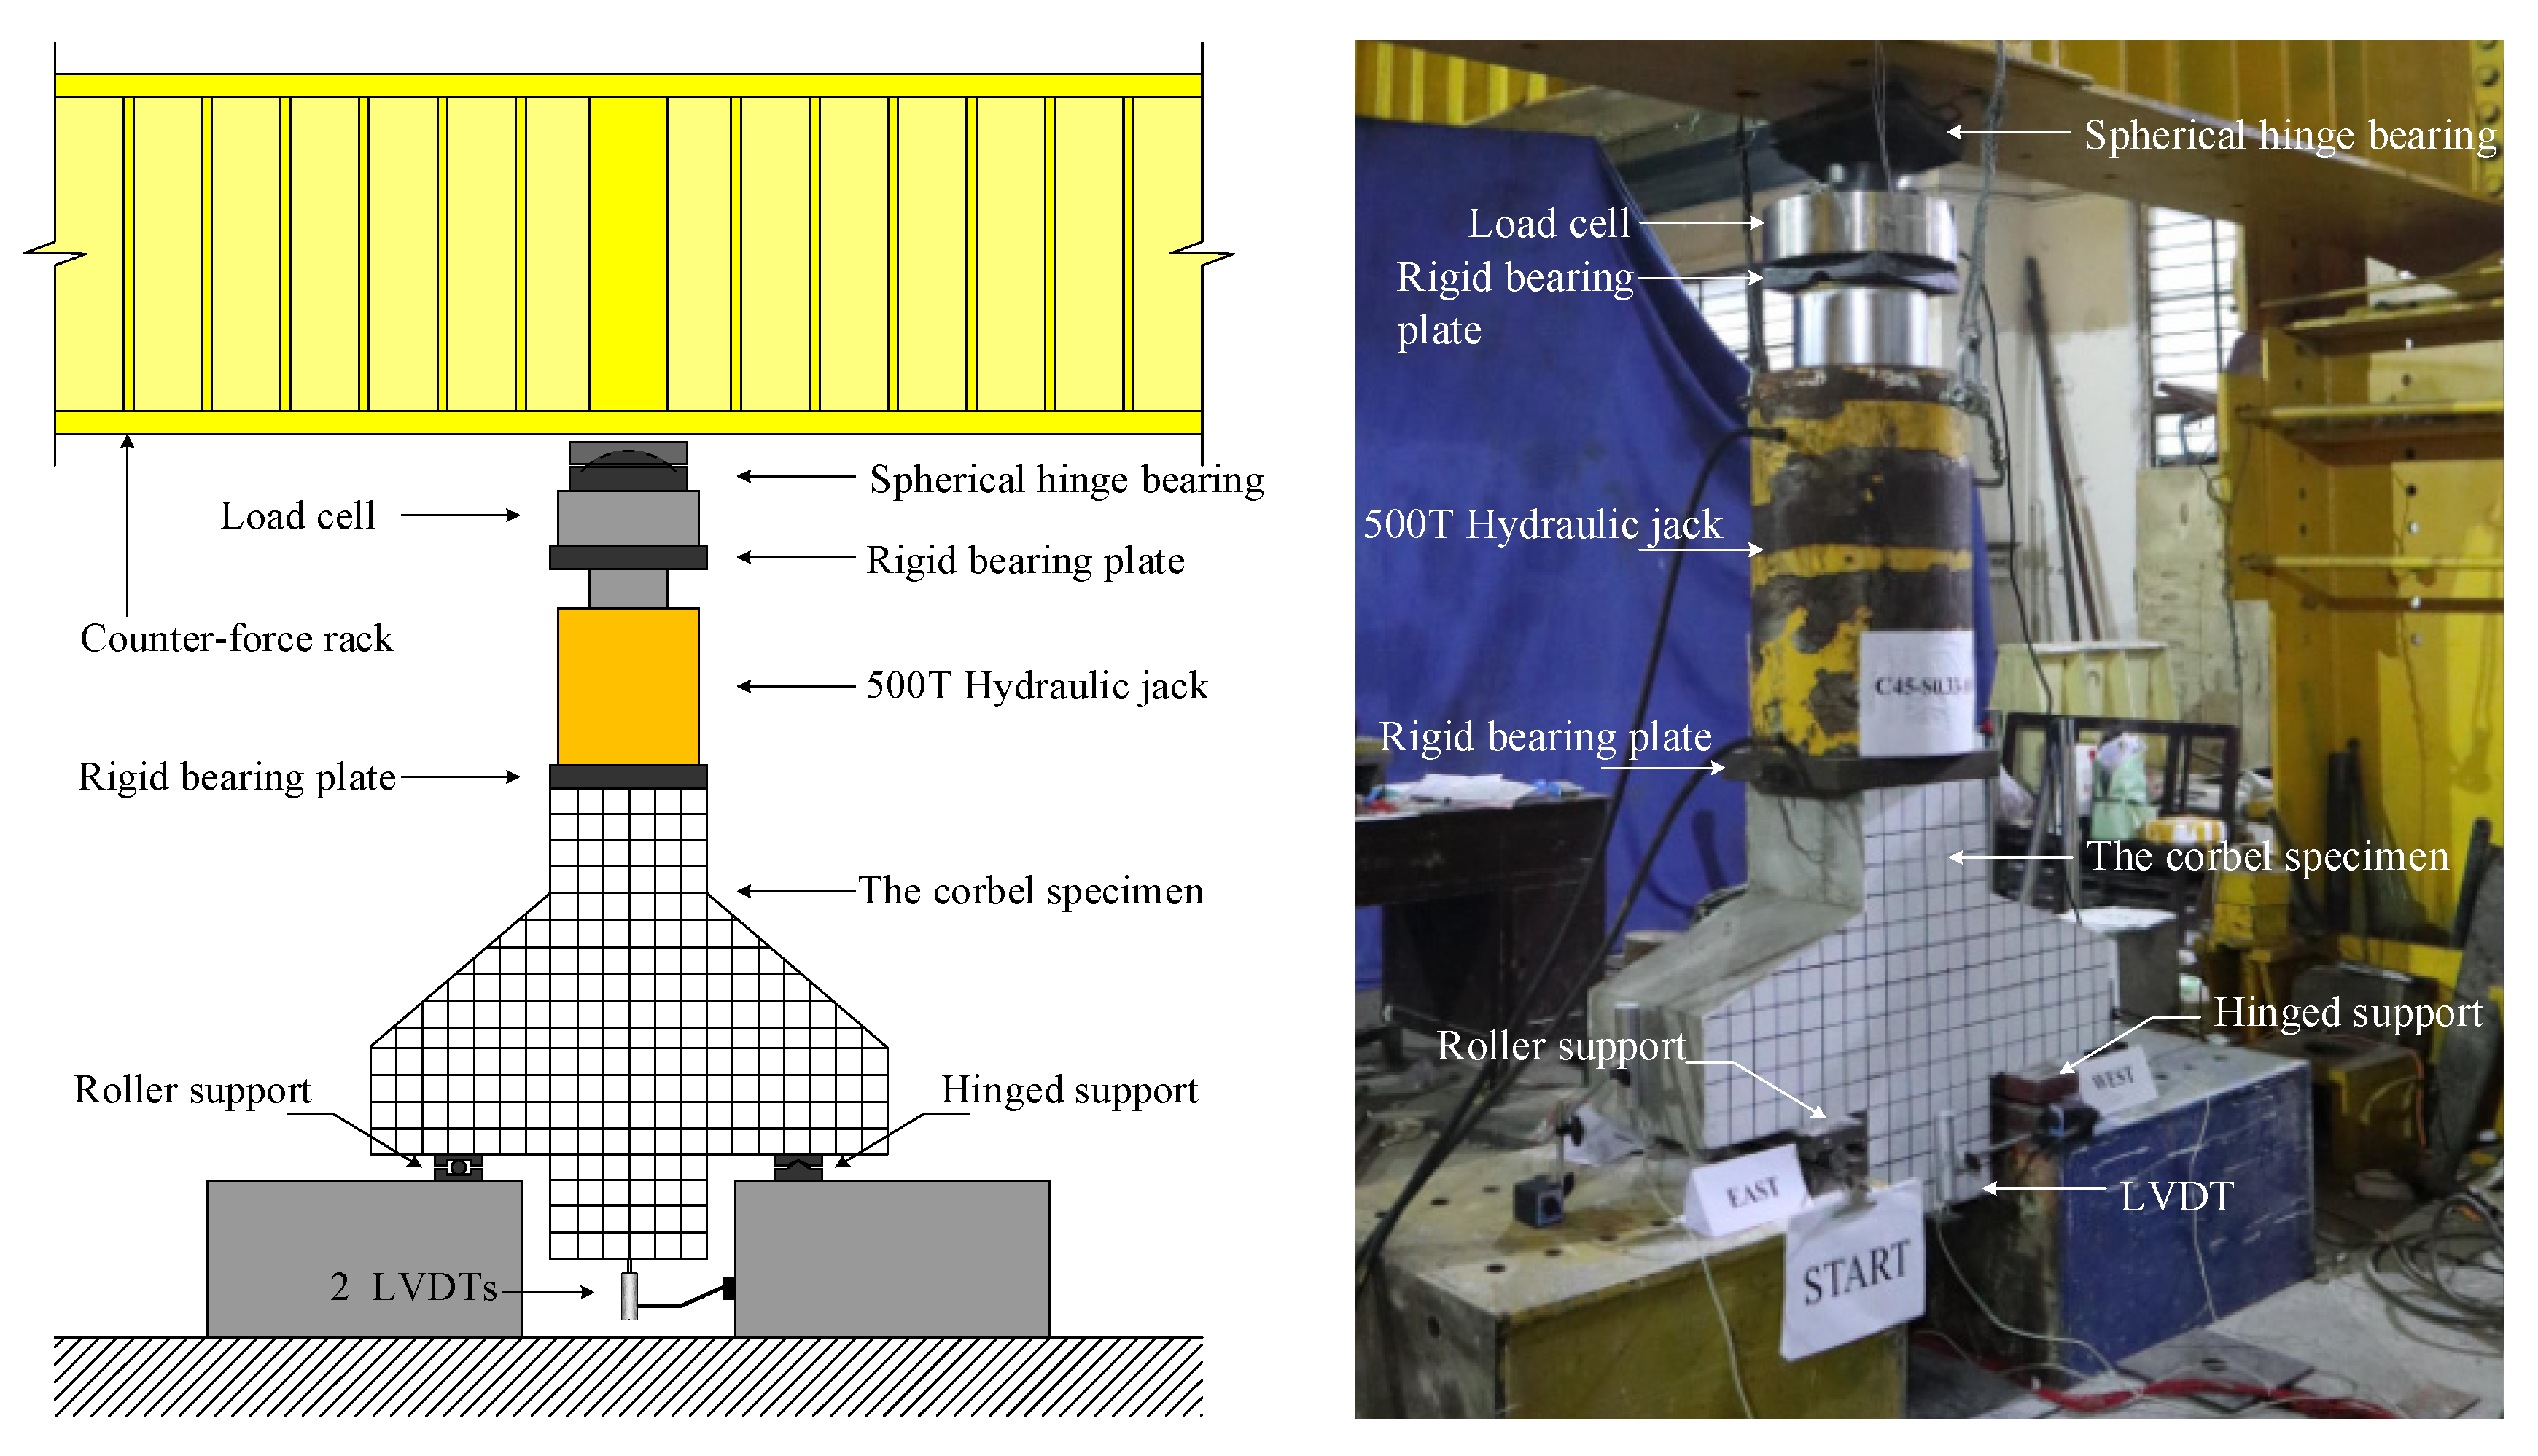
The test setup is shown in Figure 3, which includes a spherical hinge bearing, a load cell, a 5000 kN hydraulic jack, two supports, two displacement transducers (LVDT), and a data acquisition box, etc. Two LVDTs were placed at the bottom of the inverted specimens to measure the vertical displacement. Control the distance from the center of the support to the edge of the column to achieve the designed shear span.
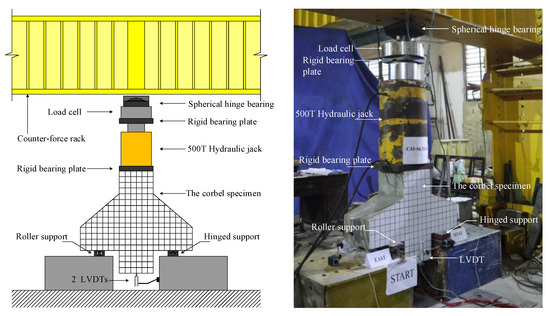
Figure 3.
Test setup.
A pre-loading of 30 kN was applied to eliminate voids between devices and sand bedding layers. A force-control loading method was applied with each step of 50 kN. The force rate was one kN/s. A pause between each step was required to measure the crack width using a crack observation instrument.
3. Test Results and Analysis
3.1. Failure Mode and Process
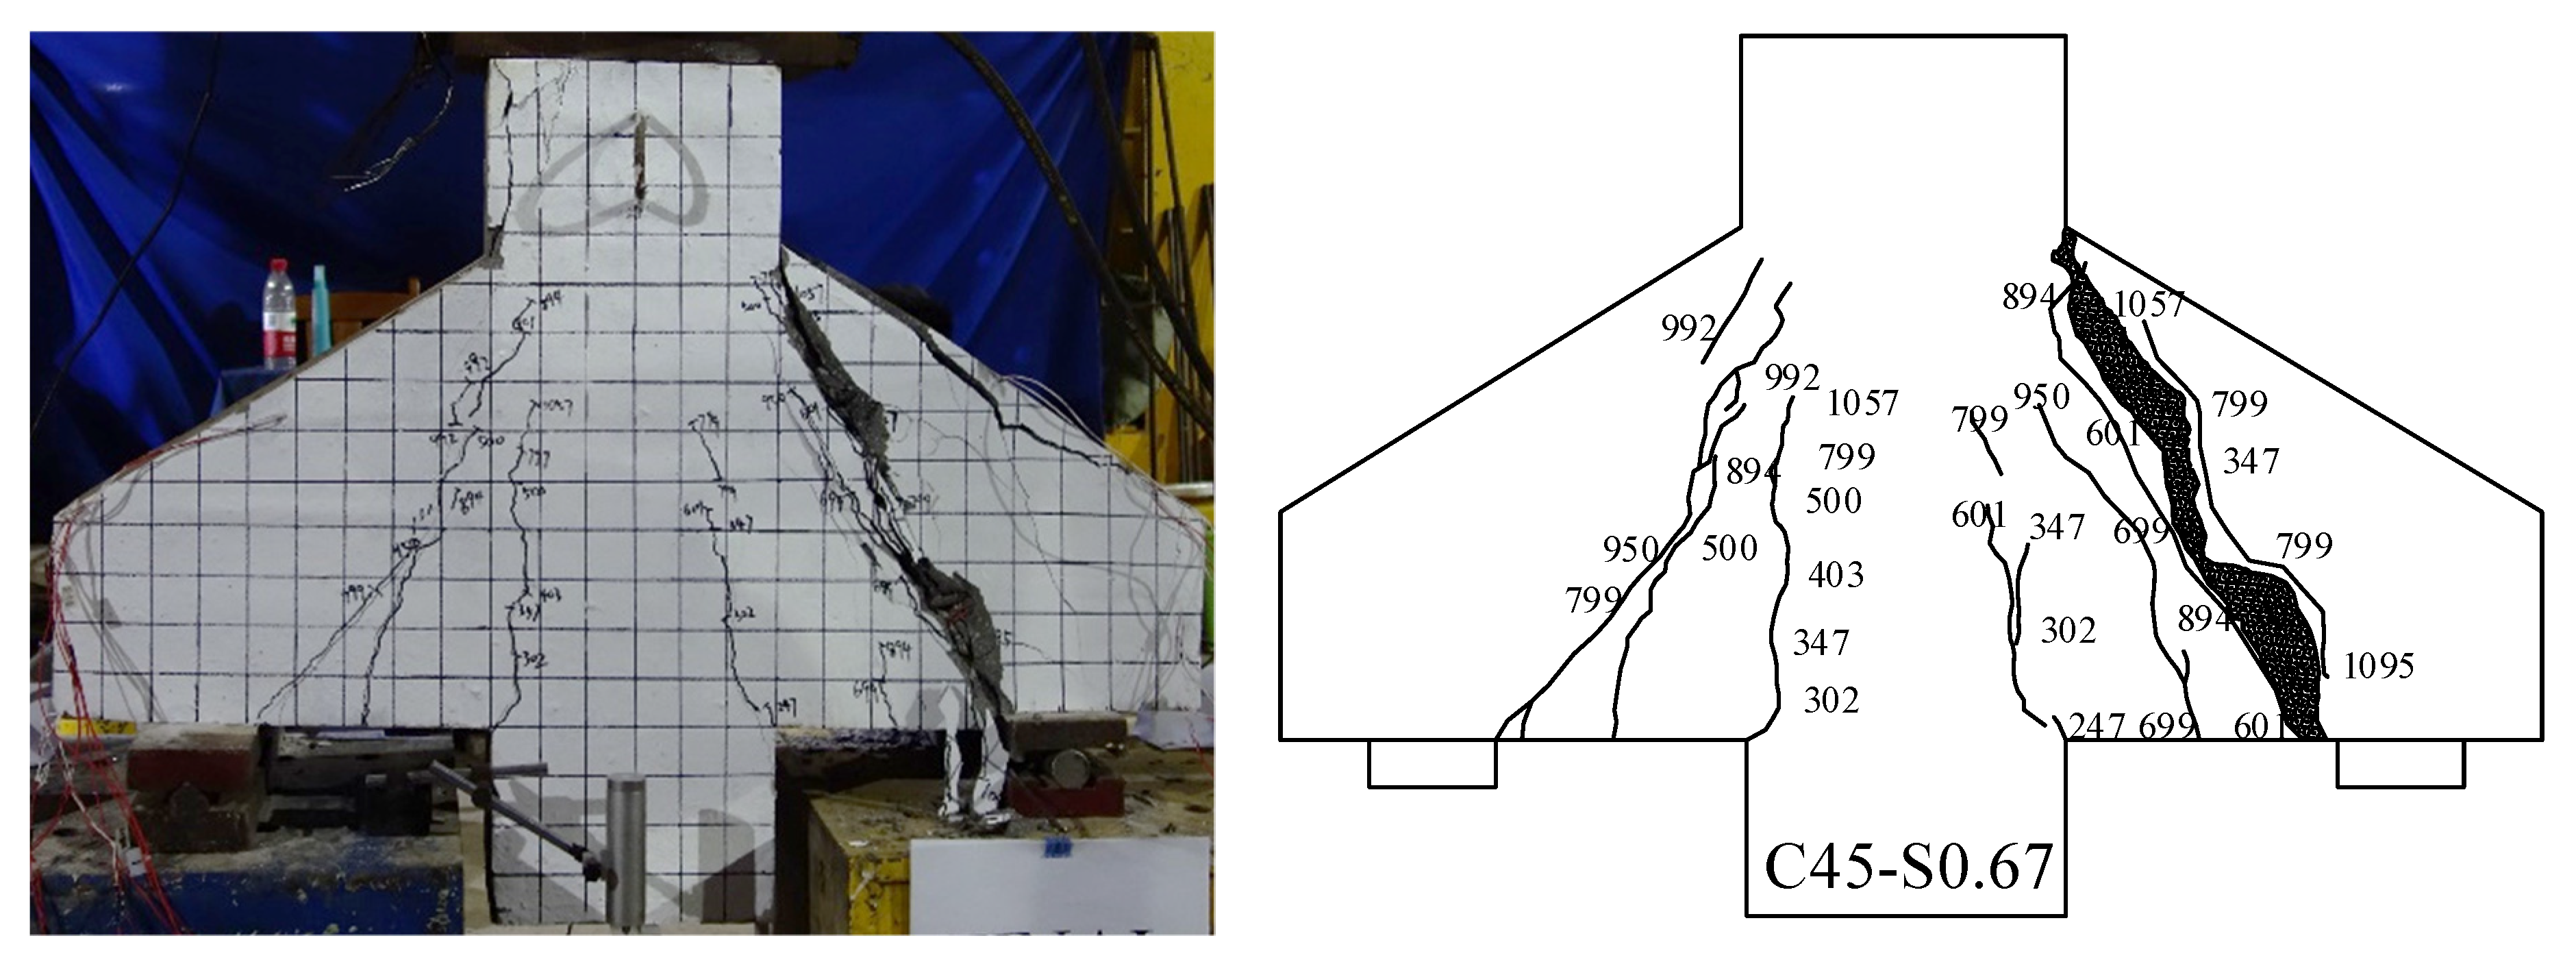
All specimens underwent the expected diagonal compression (DC) failure [7,23]. The DC failure is characterized by the crushing of inclined concrete after the yielding of the longitudinal bars, accompanied by the appearance of large numbers of diagonal cracks. The typical failure mode is shown in Figure 4.
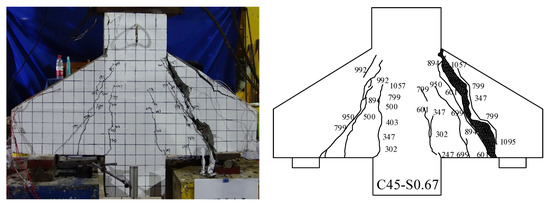
Figure 4.
Typical failure mode and crack distribution (specimen C45-S0.67).
An illustration is given by specimen C45-S0.67. When the load (V) was 247 kN (about 0.18 Vt, where Vt is the ultimate bearing capacity), cracks appeared at the interface between the column and the corbel. Then, the cracks developed upward along the column with the increased load. When V = 601 kN (0.44 Vt), a diagonal crack appeared in the right corbel. As the load increased, multiple diagonal cracks appeared. A similar crack development was observed in the left corbel. When V = 894 kN (0.66 Vt), the earliest diagonal crack had spread into the support and the root in both directions, and the longitudinal bars began to yield. When V = 1132 kN (0.83 Vt), all of the longitudinal bars yielded. Subsequently, the load resistance slowly rose. When V = 1358 kN (1.0 Vt), the inclined concrete was spalled and crumbled out when a huge through diagonal crack appeared. Table 4 lists the first cracking load, first yielding load, and complete yielding load of longitudinal bars, ultimate load, and initial crack width for each single corbel. The initial crack width for each corbel is almost the same.
Table 4.
Test results of corbel specimens.
3.2. Load–Displacement Curves
The load–displacement curves are shown in Figure 5. At the beginning of the load, the curves rose linearly; when the load increased to about 20% of the peak, the corbels were cracked and the slope of the curves slightly decreased. When the load increased to about 70% of the peak, the slope of the curves decreased at a faster pace as the longitudinal bars began to yield. When the load reached about 90% of the peak, at which stage almost all the longitudinal bars had yielded, the slope of the curves was decreased at the fastest rate. The curves dropped abruptly after the load reached the peak.
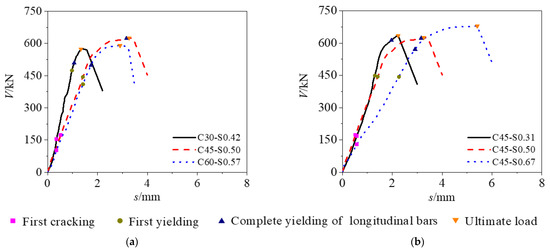
Figure 5.
Load–displacement curves under variables: (a) concrete strength; (b) shear span–depth ratio.
Figure 5a shows that, before all the longitudinal bars have yielded, the overall stiffness is lower of corbels with higher concrete compressive strength. According to the TTM, when keeping the designed bearing capacity constant, if the concrete strength is improved, the section depth of corbels needs to be decreased and the area of the longitudinal bars needs to be increased. The decreased section depth causes a reduction in the corbels’ stiffness.
Figure 5b shows that the larger the shear span–depth ratio, the lower the overall stiffness of the corbel. According to the TTM, when keeping the designed bearing capacity constant, if the shear span is increased, the area of the longitudinal bars needs to be increased. The larger the shear span, the greater the moment applied to the mid-span of specimens, resulting in a larger deflection under the load.
3.3. Crack Propagation
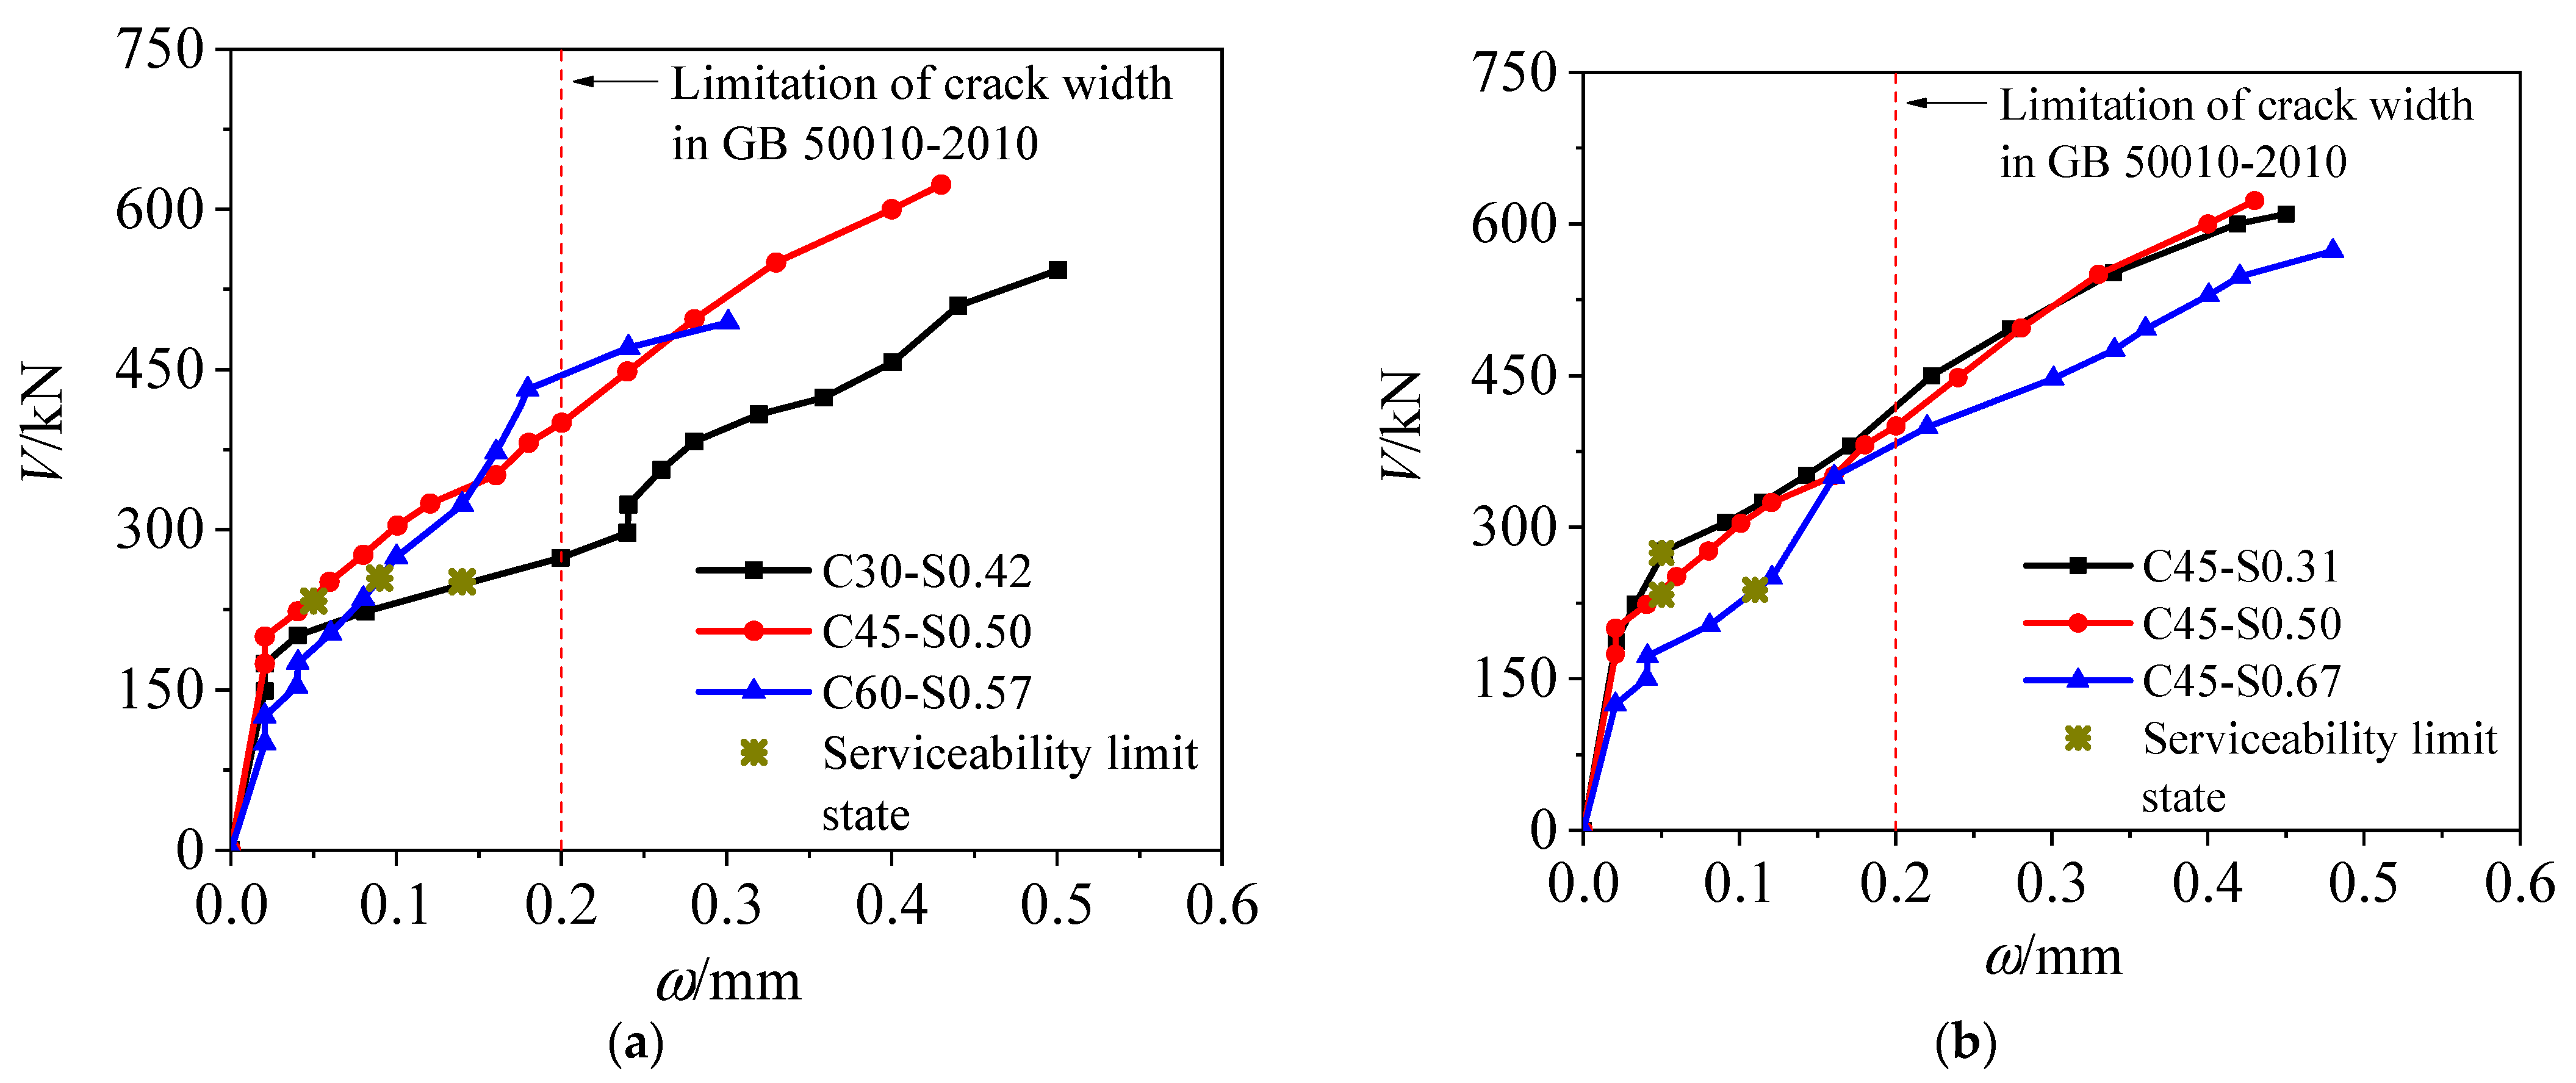
Figure 6a shows that the higher the concrete strength, the smaller the crack width under the load. The widest crack appeared near the intersection between the corbel and column. A corbel with higher concrete strength has a greater reinforcement ratio of longitudinal bars, which leads to thinner cracks under the identical shear span.
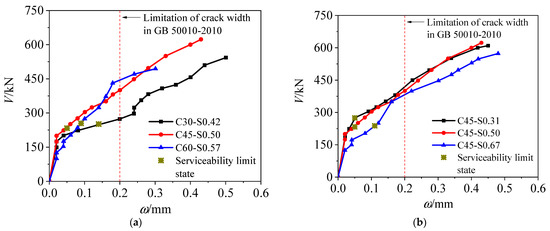
Figure 6.
Load–crack width curves under variables: (a) concrete strength; (b) shear span–depth ratio.
Figure 6b shows that the larger the shear span–depth ratio, the wider the cracks under the load. The crack width of all specimens at a serviceability limit state was less than 0.2 mm, meeting the requirement of GB 50010-2010 [7], as listed in Table 4. When using the TTM to design a corbel under a given carrying load, the crack width under the serviceability limit state can be reduced by improving the concrete strength or reducing the shear span.
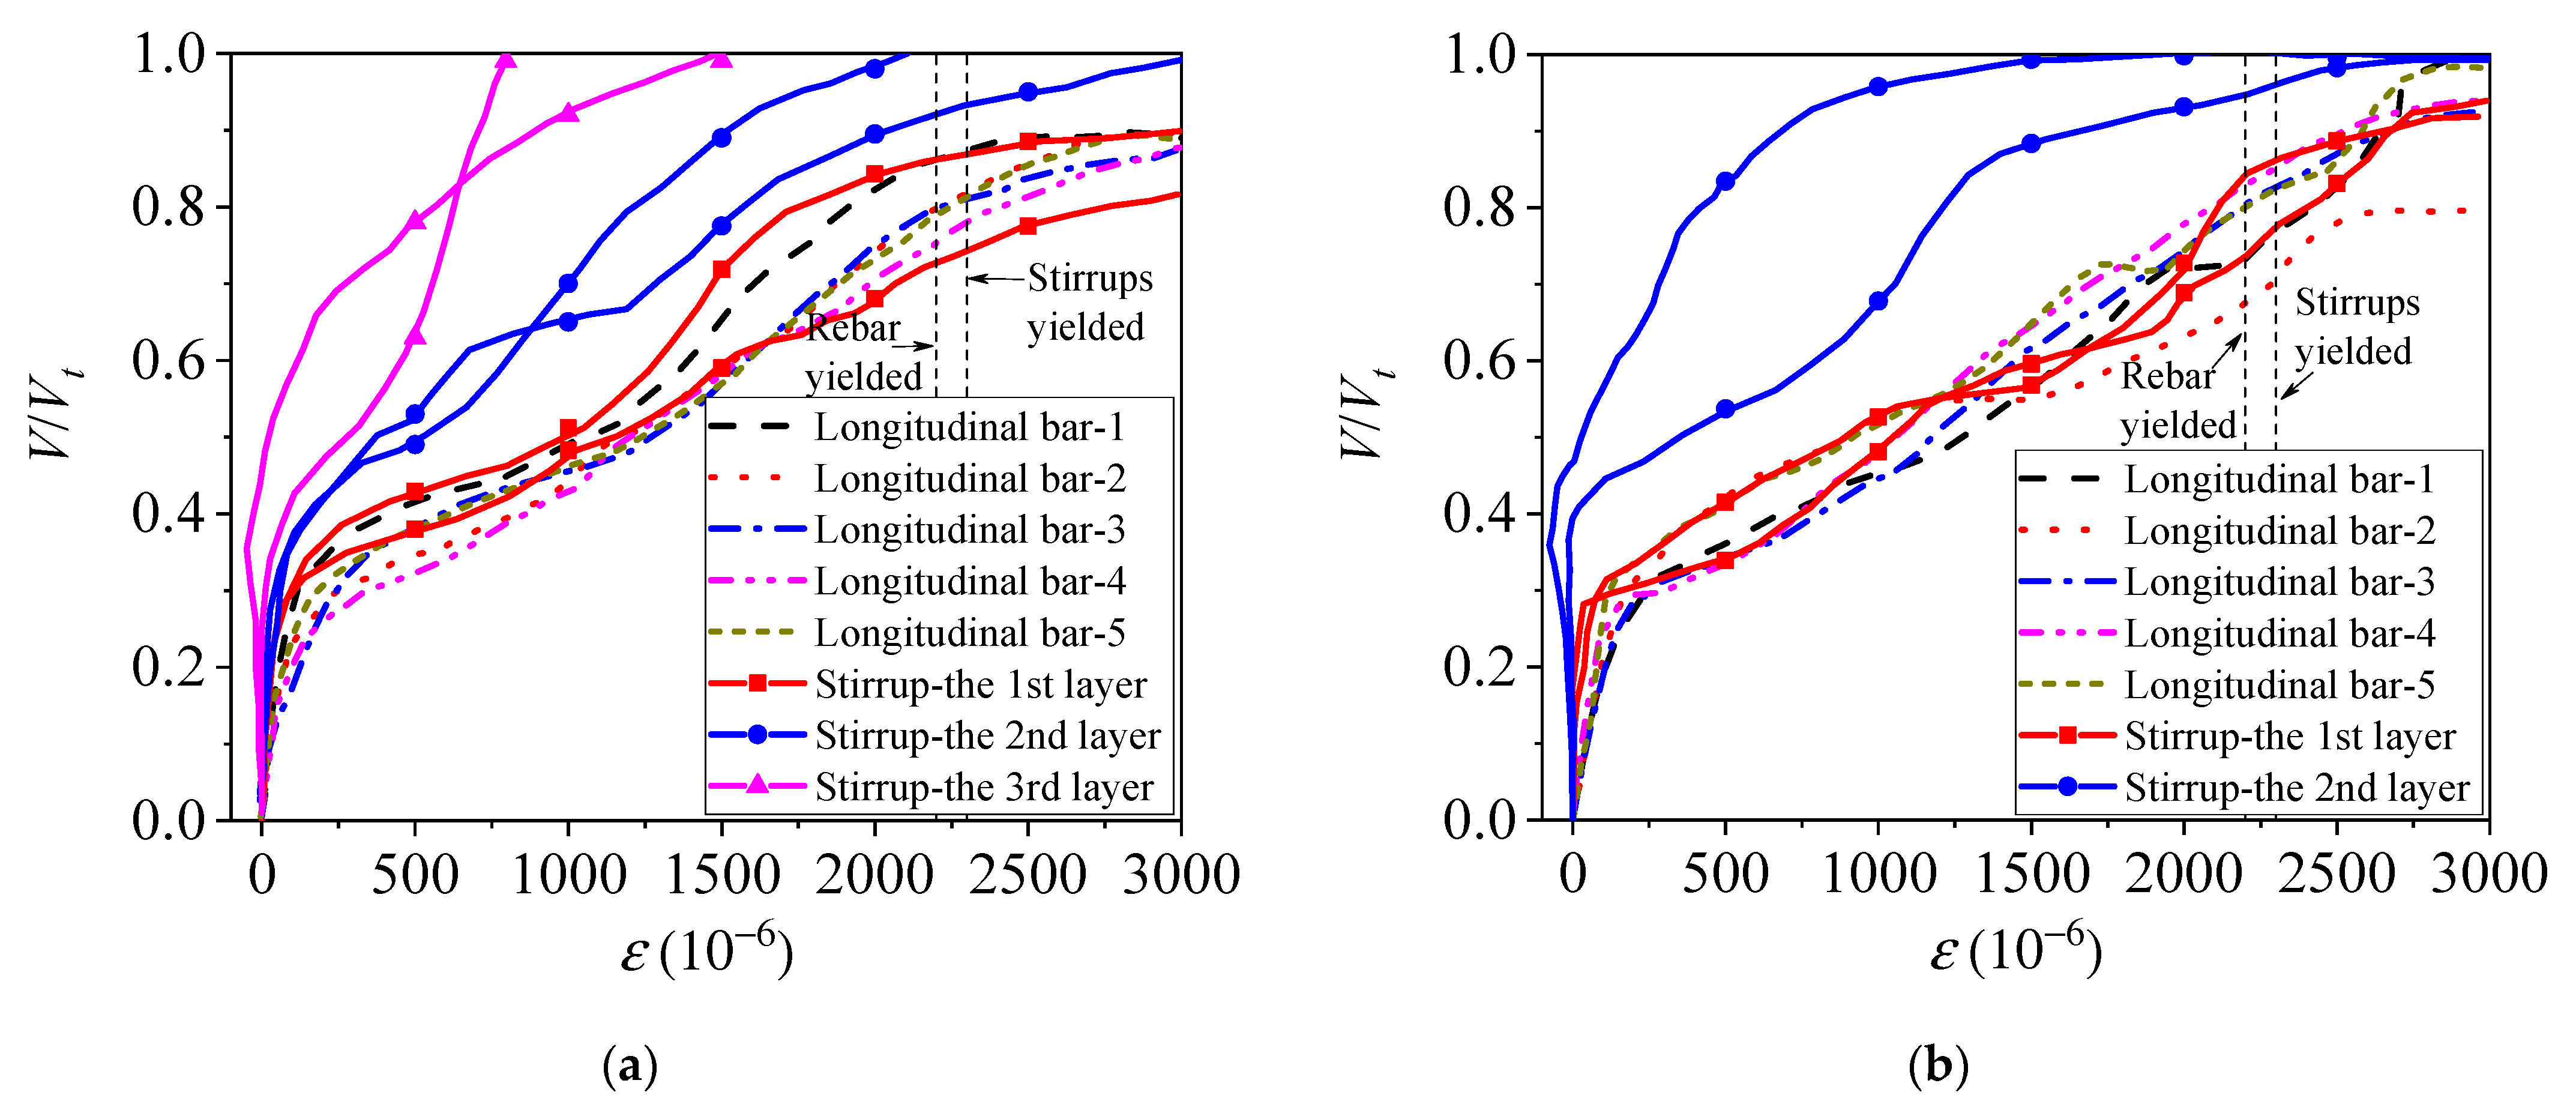
3.4. Strain Development of Reinforcements
Typical strain development of longitudinal bars and stirrups is shown in Figure 7. In the figure, the Y-axis represents the ratio of the load (V) to the bearing capacity (Vt) and the X-axis represents the strain of the reinforcement. Figure 7 shows that when the load ratio is not greater than 0.3, strain develops slowly in the longitudinal bars and the stirrups. After the load ratio exceeds 0.3, the strain on the longitudinal bars and the first layer of stirrups increases rapidly due to the development of cracks [25,26]. In contrast, the strain develops slowly in the second and third layers of stirrups. When the load ratio exceeds 0.7, the longitudinal bars and the first layer of stirrups begin to yield. The complete yielding of the longitudinal bars and the first layer of stirrups occurs when the load ratio exceeds 0.85. After that, strain development in the second and third layers of stirrups tends to be faster. At failure load, the maximum strain in the third layer of stirrups was only half the yield strain.

Figure 7.
Typical strain development of reinforcements: (a) C30-S0.42; (b) C60-S0.57.
4. Evaluation of the Triangular-Truss Method
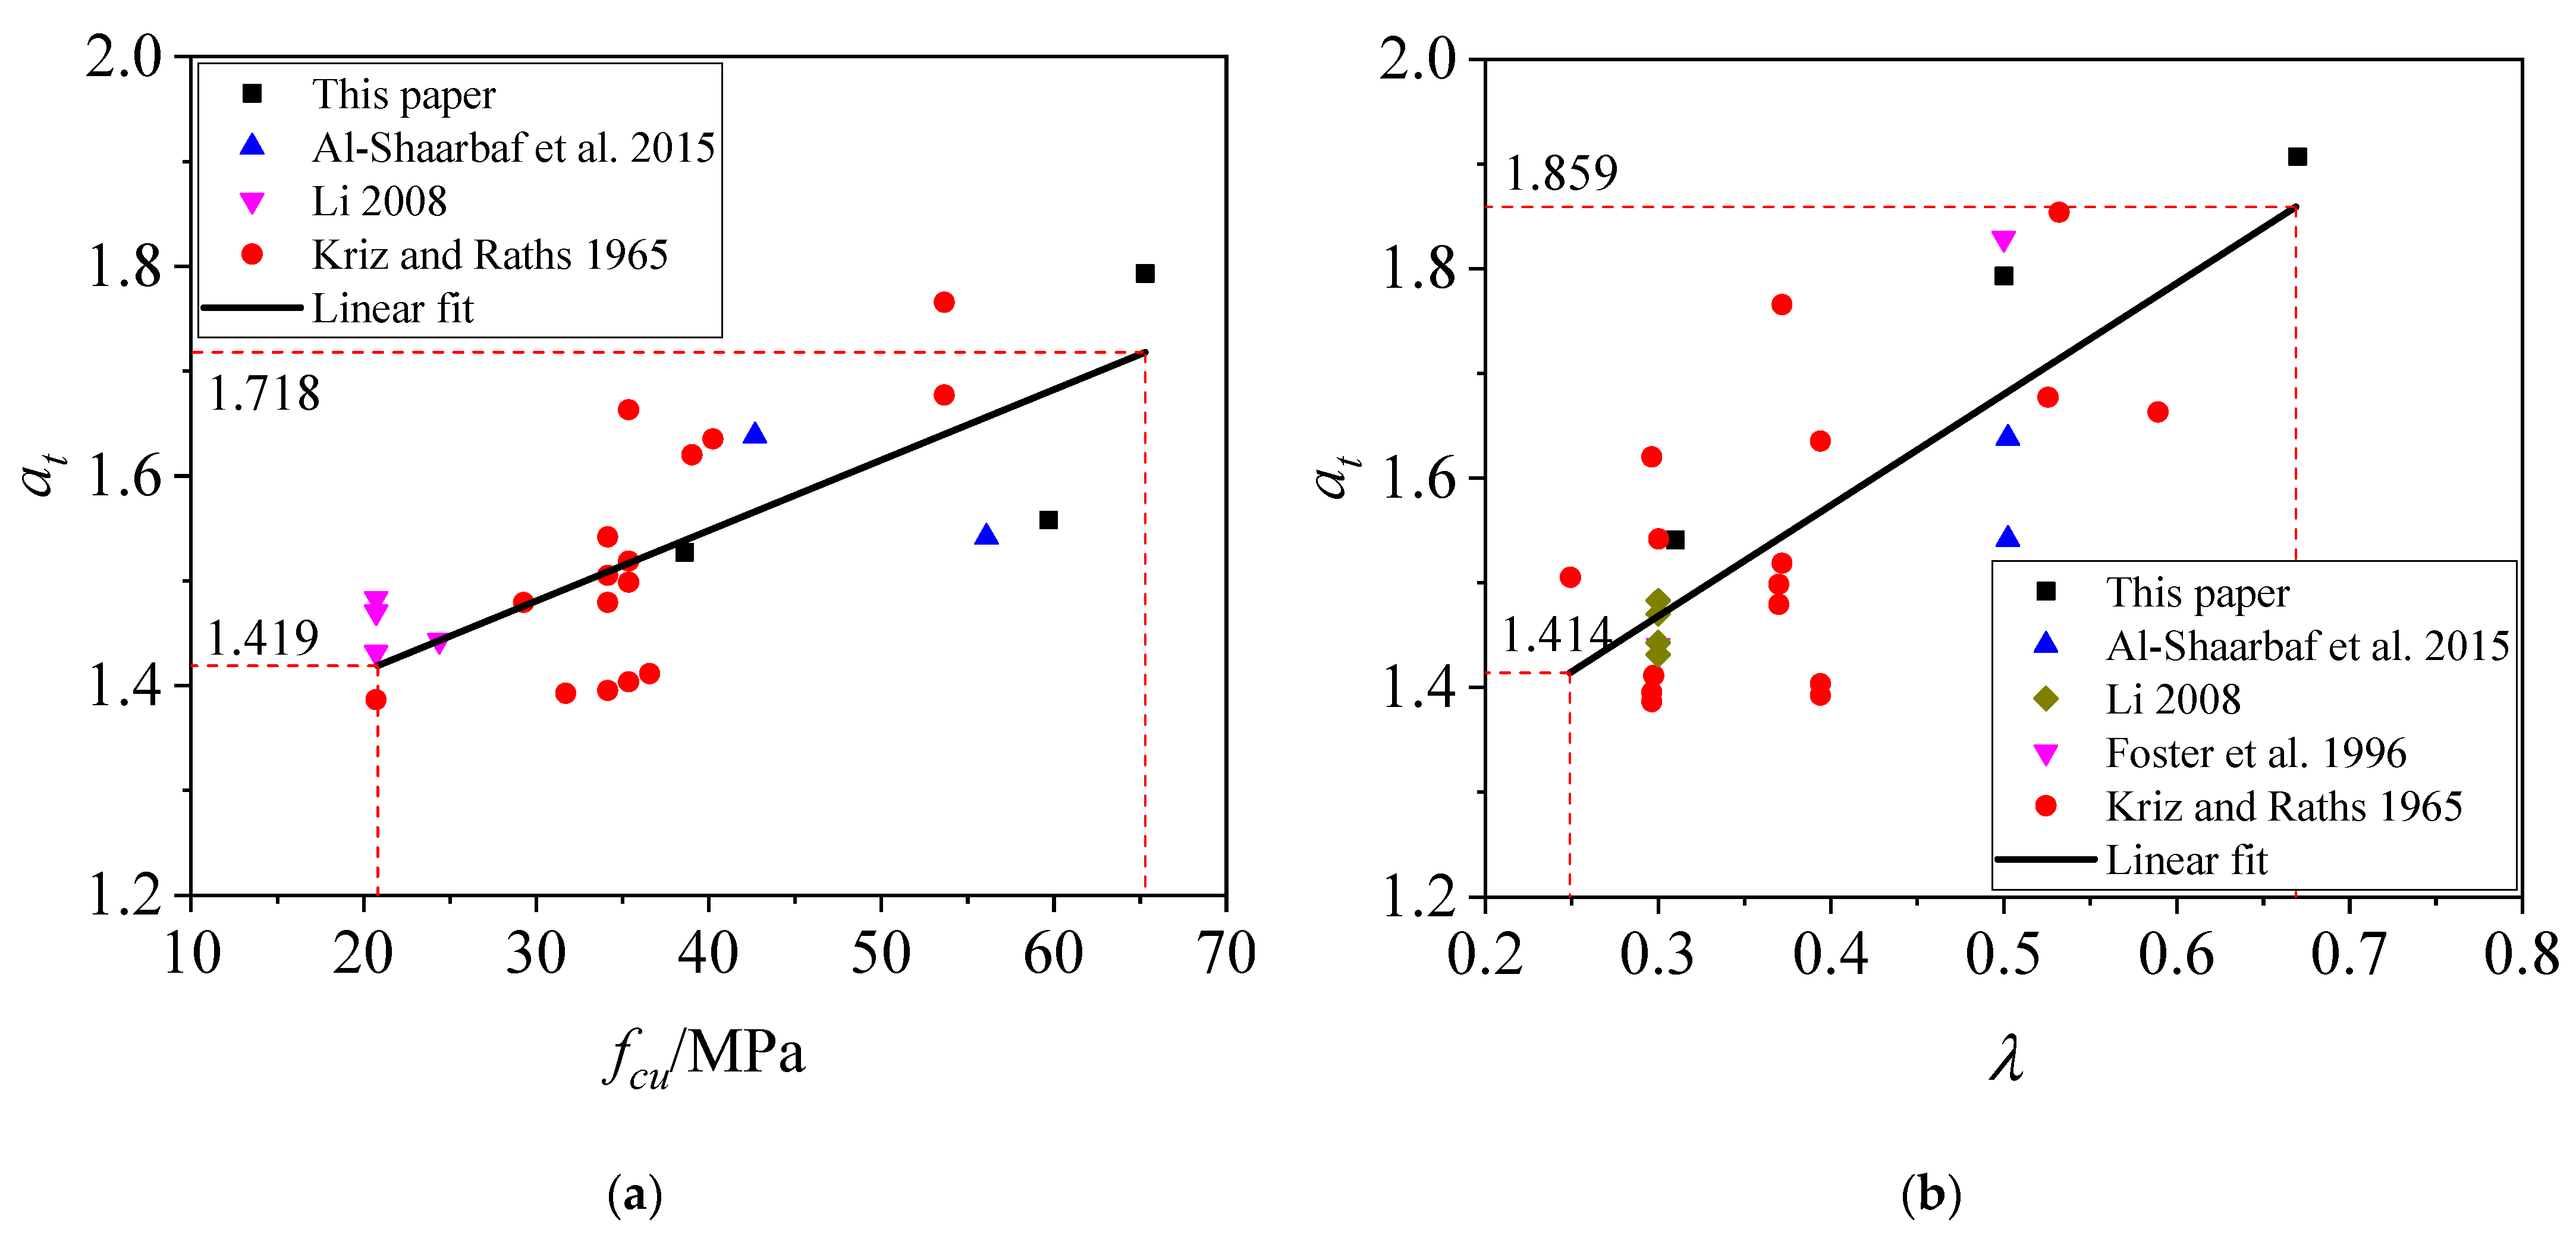
A safety factor (αt) is defined to evaluate the accuracy of the TTM under the variation in concrete compressive strength and shear span–depth ratio; that is, the ratio of the actual bearing capacity (Vt) to the designed bearing capacity (Fde,A) [5,15,27], expressed by
A total of 25 corbel specimens in previous tests [28,29,30,31], whose concrete strength and shear span–depth ratio were similar to the specimens of this test, were adopted to verify the safety factor formula. Table 5 lists the specimens′ details and the calculated safety factor values.
Table 5.
Specimens′ details and the calculated safety factor of corbels.
4.1. Influence of Concrete Strength
As shown in Figure 8a, the safety factor increases from 1.419 to 1.718 as the compressive strength of concrete increases from 20.8 MPa to 65.3 MPa. The results indicate that the safety level of the TTM becomes higher with an improvement in the concrete strength. When keeping the designed bearing capacity constant, if the concrete strength is improved, the section depth of the corbel needs to be decreased and the area of the longitudinal bars needs to be increased. The longitudinal bars play a significant role in the load-bearing capacity [12]. Therefore, the safety factor increases with the compressive strength of concrete.
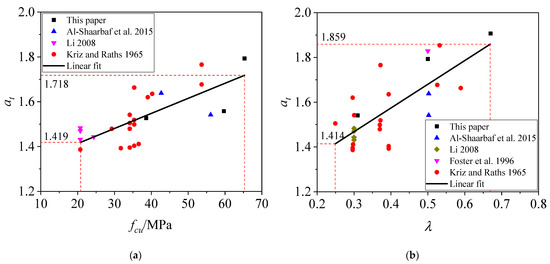
Figure 8.
Influence of variables on safety factor for the TTM: (a) concrete strength; (b) shear span–depth ratio.
4.2. Influence of Shear Span–Depth Ratio
As shown in Figure 8b, the safety factor increases from 1.414 to 1.859 as the shear span–depth ratio increases from 0.25 to 0.67. The results indicate that the safety level of the TTM becomes higher with an increase in the shear span–depth ratio. When keeping the designed bearing capacity constant, if the shear span–depth ratio is increased, the area of the longitudinal bars needs to be increased. The longitudinal bars play a significant role in a corbel′s bearing capacity [12]. Therefore, the safety factor increases with the shear span–depth ratio.
5. Comparison of Calculation Methods
Corbel design methods vary greatly among regions. The Chinese code GB 50010-2010 [7] adopts the TTM, while the American code ACI 318-19 [19], the Eurocode EC 2 [20], and the Canadian code CSA A23.3-04 [21] all use the strut-and-tie method (STM) but with different definitions in design parameters. In addition, scholars have also proposed widely used methods such as the softened strut-and-tie method [17] and Russo strut-and-tie method [18], etc. A brief description of the various design methods and a comparison of their accuracy for the predicted bearing capacity are shown below.
5.1. Multi-Country Strut-and-Tie Method
ACI318-19 [19], EC 2 [20], and CSA A23.3-04 [21] all use the STM to design corbels. The STM treats a corbel as a system consisting of three components: the rebar tension tie, concrete compression strut, and nodes. Damage will occur to the corbel if any component reaches the ultimate strength. The mechanism model is shown in Figure 9. The differences among the three types of STM lie in the definitions for: (1) the limitation of shear span–depth ratio; (2) the limitation of the horizontal inclination of the strut; (3) the effective coefficient of concrete strength for the strut and nodes. These different definitions are listed in Table 6.

Figure 9.
Strut-and-tie method.
Table 6.
Different definitions among multi-country STM.
5.2. Softened Strut-and-Tie Method
Hwang et al. [17] proposed a softened strut-and-tie method (SSTM) by considering the softening coefficient of concrete in compression. The mechanism model of SSTM is shown in Figure 10. The shear resistance of the SSTM is composed of the diagonal mechanism and the horizontal mechanism. The diagonal mechanism is a diagonal concrete strut; the horizontal mechanism consists of two concrete struts and one horizontal stirrups tie. The SSTM defines that the damage occurs when the stress in the nodal zone reaches the ultimate strength. The calculation of bearing capacity requires iteration as the softening coefficient cannot be directly derived.
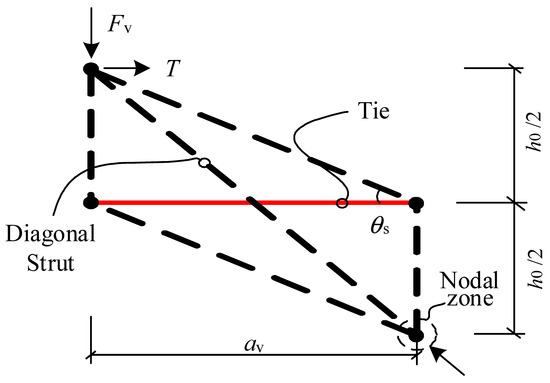
Figure 10.
Softened strut-and-tie method.
5.3. Russo Strut-and-Tie Method
The Russo strut-and-tie method (Russo STM) [18] supposed that the shear load was partially carried by the strut and tie, and partially by the stirrups. The softening coefficient of concrete was also considered and can be directly computed by Equation (5) below, which simplifies the calculation for the corbel’s bearing capacity. The corbel’s shear strength is calculated by
where fc is the concrete compressive strength; θ is the angle between the strut and the horizontal direction; ρh is the reinforcement ratio of stirrups; fyh is the yield strength of stirrups; k is a parameter related to the reinforcement ratio of the longitudinal bars; χ is the softening coefficient, calculated by
5.4. Comparison of Bearing Capacity Calculations
The TTM in GB 50010-2010, STM in ACI 318-19, EC 2 and CSA A23.3-04, SSTM, and Russo STM were used to predict the bearing capacity of the corbels. The ratios of the predictions to the tested values are listed in Table 7. The mean ratios corresponding to GB 50010-2010, ACI 318-19, EC 2, and CSA A23.3-04 are 0.646, 0.687, 0.631, and 0.752, respectively. All the predictions are conservative, and the predictions of CSA A23.3-04 are closer to the test values. The safety level of codes GB 50010-2010, ACI 318-19, and EC 2 is essentially the same. In addition, the mean ratios are 0.924 and 1.055 for the SSTM and the Russo STM, respectively. Both the SSTM and Russo STM are more accurate, and even the Russo method tends to overestimate the result.
Table 7.
Comparison of predictions by each method.
6. Conclusions
This paper explored the accuracy and rationality of the TTM in GB 50010-2010 under different concrete strengths and shear spans. The accuracy of predictions was also compared among the TTM, STM in multi-country codes, SSTM, and Russo STM. Conclusions can be drawn as follows:
- (1)
- The safety level of the TTM becomes higher if the concrete compressive strength is improved. For example, when the concrete strength was improved from 20.8 MPa to 65.3 MPa, the safety factor of TTM was increased from 1.419 to 1.718.
- (2)
- The safety level of the TTM becomes higher if the shear span–depth ratio is increased. For example, when the shear span–depth ratio was increased from 0.25 to 0.67, the safety factor was increased from 1.414 to 1.859.
- (3)
- When using the TTM to design a corbel under a certain designed capacity, increasing the concrete strength or decreasing the shear span–depth ratio are both effective in reducing the crack width at the serviceability limit state.
- (4)
- The horizontal stirrups distributed in the up half of corbel′s section depth can be fully utilized for their yield strength.
- (5)
- Compared to GB 50010-2010, ACI 318-19, and EC 2, the predictions of CSA A23.3-04 for corbels are closer to the test values. The safety level of codes GB 50010-2010, ACI 318-19, and EC 2 is essentially the same. In addition, the SSTM and Russo STM are more accurate, and even the Russo method tends to overestimate the result.
Author Contributions
Conceptualization, Y.H., B.H. and W.Y.; methodology Y.H., B.H. and W.Y.; validation, Y.H.; formal analysis, B.H. and W.Y.; investigation, Y.H., B.H. and W.Y.; resources, Y.H.; data curation, B.H. and W.Y.; writing—original draft preparation, B.H.; writing—review and editing, Y.H.; visualization, B.H.; supervision, Y.H.; project administration, Y.H.; funding acquisition, Y.H. All authors have read and agreed to the published version of the manuscript.
Funding
This research was funded by the National Natural Science Foundation of China (No. 51890901), and the Natural Science Foundation of Hunan Province, China (No. 2020JJ2003, 2020RC5005).
Institutional Review Board Statement
Not applicable.
Informed Consent Statement
Not applicable.
Data Availability Statement
The data presented in this study are available on request from the corresponding author.
Conflicts of Interest
The authors declare no conflict of interest.
References
- Kaloop, M.R.; Roy, B.; Chaurasia, K.; Kim, S.-M.; Jang, H.-M.; Hu, J.-W.; Abdelwahed, B.S. Shear Strength Estimation of Reinforced Concrete Deep Beams Using a Novel Hybrid Metaheuristic Optimized SVR Models. Sustainability 2022, 14, 5238. [Google Scholar] [CrossRef]
- Mansour, M.; El-Ariss, B.; El-Maaddawy, T. Effect of Support Conditions on Performance of Continuous Reinforced Concrete Deep Beams. Buildings 2020, 10, 212. [Google Scholar] [CrossRef]
- Kachouh, N.; El-Maaddawy, T.; El-Hassan, H.; El-Ariss, B. Shear Behavior of Steel-Fiber-Reinforced Recycled Aggregate Concrete Deep Beams. Buildings 2021, 11, 423. [Google Scholar] [CrossRef]
- Hsu, T.T.C. Unified theory of reinforced concrete-A summary. Struct. Eng. Mech. 1994, 2, 1–16. [Google Scholar] [CrossRef]
- Khosravikia, F.; Kim, H.s.; Yi, Y.; Wilson, H.; Yousefpour, Y.H.H.; Hrynyk, T.; Bayrak, O. Experimental and Numerical Assessment of Corbels Designed Based on Strut-and-Tie Provisions. J. Struct. Eng. 2018, 144, 04018138. [Google Scholar] [CrossRef]
- Hwang, S.-J.; Tsa, R.-J.; Lam, W.-K.; Moehle, J.P. Simplification of softened strut-and-tie model for strength prediction of discontinuity regions. ACI Struct. J. 2017, 114, 1569–1579. [Google Scholar] [CrossRef]
- GB 50010-2010; Code for Design of Concrete Structures. China Architecture & Building Press: Beijing, China, 2015.
- Ding, B. Culculation of reinforced concrete corbels. Ind. Constr. 1974, 31–36+51. [Google Scholar]
- Canha, R.M.F.; Kuchma, D.A.; Debs, M.K.E.; Souza, R.A.d. Numerical analysis of reinforced high strength concrete corbels. Eng. Struct. 2014, 74, 130–144. [Google Scholar] [CrossRef]
- Yun, Y.M.; Lee, Y. Strengths of Struts and Nodal Zones for Strut-and-Tie Model Design of Reinforced Concrete Corbels. Civil Eng. J. 2021, 7, 1275–1289. [Google Scholar] [CrossRef]
- Hamoodi, A.Z.; Chkheiwer, A.H.; Kadim, J.A. Shear Strength of Reinforced Recycled Aggregate Concrete Corbels. J. Eng. 2021, 2021, 6652647. [Google Scholar] [CrossRef]
- Yuan, H.; Wenmeng, Y.; Weijian, Y. Study on Design Modification Factor for Shear Capacity of Reinforced Concrete Corbels. J. Hunan Univ. 2021, 48, 61–70. [Google Scholar] [CrossRef]
- Li, S.; Zhang, F.; Zhang, Z.; Huang, F.; Jia, M.; Liu, Z.; Xie, W. Experimental study on shear behavior of high-strength steel fiber reinforced concrete corbel. J. Build. Struct. 2020, 41, 151–159. [Google Scholar] [CrossRef]
- Ritter, W. Die bauweise hennebique (Hennebiques construction method). Schweiz. Bauztg. 1899, 33, 59–61. [Google Scholar]
- Wilson, H.R.; Hossein, Y.; Michael, B.D.; Oguzhan, B. Investigation of corbels designed according to strut-and-tie and empirical methods. ACI Struct. J. 2018, 115, 813–824. [Google Scholar] [CrossRef]
- Hwang, S.-J.; Lu, W.-Y.; Lee, H.-J. Shear strength prediction for reinforced concrete corbels. ACI Struct. J. 2000, 97, 543–552. [Google Scholar] [CrossRef]
- Hwang, S.-J.; Lee, H.-J. Strength prediction for discontinuity regions by softened strut-and-tie model. J. Struct. Eng. 2002, 128, 1519–1526. [Google Scholar] [CrossRef]
- Russo, G.; Venir, R.; Pauletta, M.; Somma, G. Reinforced concrete corbels-shear strength model and design formula. ACI Struct. J. 2006, 103, 3–9. [Google Scholar] [CrossRef]
- ACI 318-19; Building code requirements for structural concrete. American Concrete Institute: Farmington Hills, MI, USA, 2019; pp. 436–449.
- Eurocode 2: Design of concrete structures. In Part 1-1: General Rules and Rules for Buildings: BS EN 1992-1-1; British Standards Institution: London, UK, 2004; pp. 107–109.
- CSA A23.3-04; Design of Concrete Structures. Canadian Standards Association: Toronto, ON, Canada, 2004; pp. 62–66.
- Yao, J.; Gu, H.; Li, Q.; Huang, B. Research on bearing capacity design reliability of RC crane beams. J. Hunan Univ. 2019, 46, 21–30. [Google Scholar] [CrossRef]
- Shen, P. Design of Concrete Structures, 3rd ed.; Higher Education Press: Beijing, China, 2007; pp. 107–136. [Google Scholar]
- JGJ 55-2011; Specification for Mix Proportion Design of Ordinary Concrete. China Architecture & Building Press: Beijing, China, 2011.
- Deifalla, A.; Awad, A.; Seleem, H.; Abdelrahman, A. Experimental and numerical investigation of the behavior of LWFC L-girders under combined torsion. Structures 2020, 26, 362–377. [Google Scholar] [CrossRef]
- Tariq, M.; Khan, A.; Ullah, A.; Shayanfar, J.; Niaz, M. Improved Shear Strength Prediction Model of Steel Fiber Reinforced Concrete Beams by Adopting Gene Expression Programming. Materials 2022, 15, 3758. [Google Scholar] [CrossRef]
- Deifalla, A.; Awad, A.; Seleem, H.; Abdelrahman, A. Investigating the behavior of lightweight foamed concrete T-beams under torsion, shear, and flexure. Eng. Struct. 2020, 219, 110741. [Google Scholar] [CrossRef]
- Kriz, L.B.; Raths, C.H. Connections in precast concrete structures-strength of corbels. PCI J. 1965, 10, 16–61. [Google Scholar] [CrossRef]
- Al-Shaarbaf, I.A.; Al-Azzawi, A.A.; Farahan, R.S. Experimental Investigation on the Behavior of Reinforced Concrete Corbels under Repeated Loadings. J. Eng. Dev. 2015, 19, 126–147. [Google Scholar]
- Foster, S.J.; Powell, R.E.; Selim, H.S. Performance of High-Strength Concrete Corbels. ACI Struct. J. 1996, 93, 555–563. [Google Scholar] [CrossRef]
- Li, G. Experimental Study on Design Method of Reinforced Concrete Corbel with Small Shear Span Ratio. Master Thesis, Hohai University, Jiangsu, China, 2008. [Google Scholar]


Publisher’s Note: MDPI stays neutral with regard to jurisdictional claims in published maps and institutional affiliations. |
© 2022 by the authors. Licensee MDPI, Basel, Switzerland. This article is an open access article distributed under the terms and conditions of the Creative Commons Attribution (CC BY) license (https://creativecommons.org/licenses/by/4.0/).