Article

Experimental Study on Seismic Behavior of Precast Bolt-Connected Steel-Members End-Embedded Concrete (PBSEC) Beam-Column Connections

1
Key Laboratory of Concrete and Prestressed Concrete Structures of the Ministry of Education, Southeast University, Nanjing 211189, China
2
Laboratory of Industrialized Structural and Bridge Engineering of Jiangsu Province, Southeast University, Nanjing 211189, China
*
Author to whom correspondence should be addressed.
Buildings 2022, 12(10), 1652; https://doi.org/10.3390/buildings12101652
Submission received: 20 September 2022 / Revised: 5 October 2022 / Accepted: 7 October 2022 / Published: 11 October 2022
(This article belongs to the Topic Resilient Civil Infrastructure)

Abstract

:
With the rapid development and research of precast concrete frame structures, it is not difficult to find that the structural form and seismic performance of dry-connected precast joints have always been the focus of research. Since this type of structural system is complex, the construction is inconvenient in practical application, and many additional parts need to be installed, this paper develops a kind of precast bolt-connected steel-members end-embedded concrete (PBSEC) beam-column connection to solve the shortcomings of the current dry-connected precast joints. There is no wet work in the assembly process, and all-dry construction and assembly methods are used. There is no need to pour concrete and support formwork, which significantly improves construction efficiency compared to wet and cast-in-situ connections. Low cyclic reversed loading tests were conducted to obtain test data, such as failure mode, hysteresis curve, skeleton curve, stiffness, ductility, and deformation capacity of the precast concrete joint. The failure mode of the PBSEC joints is the buckling failure of the connecting steel plate, leading to a perfect seismic capacity and collapse resistance of the structure. The hysteresis curves of the PBSEC joints are bow-shaped and full in shape, showing high energy dissipation capacity. The bearing capacity of the joints begins to rise rapidly at the initial loading stage and then decreases slowly after reaching the peak, which is an ideal shape. By summarizing the average peak load, strength degradation coefficient, loop energy per cycle, loop energy per level, and cumulative energy damping coefficient, it is found that the joint using 10 mm thick Q235 steel can obtain the most suitable failure mode and obtain the best energy dissipation performance. When the strength of the steel plate material increases, the energy dissipation performance of the joint drops.

1. Introduction

According to the research on the primary performance of dry-connected precast concrete frame structures, it is not difficult to find that the structural form and seismic performance of dry-connected precast joints have always been the focus of research. Due to the various and complex structures of dry connections, the force mechanism still needs many experiments to study, and the engineering application has not been widely promoted.
In view of the prestressed dry connection, Priestley [1] studied the precast beam-column joints with non-bonded prestressed tendons in 1993. The research shows that the beam and column remain preloaded after the joint has experienced a large earthquake, and the self-recovery ability of the joint is firm. Afterward, Priestley and Macrae [2] conducted a low-cycle reversed load test on the post-tensioned unbonded prestressed concrete beam-column joints. The results show that only slight surface damage occurs when the displacement angle is 3%. In the later stage of large deformation, the degradation of bearing capacity and stiffness is small and self-recovery ability is strong.
Although the use of prestress can facilitate connection and promote strength and stiffness, the prestressed beam-column joints also have the problem of poor energy dissipation capacity. Therefore, some scholars suggest [3,4,5,6,7] adding additional steel bars and angle steel as energy dissipation components or setting energy dissipation dampers inside or outside the joints to improve the energy dissipation capacity. Cheok and Stone [8] analyzed the seismic performance of prestressed precast beam-column joints with energy-dissipating steel bars. The research results show that the failure mode can meet the requirements of cast-in-place joints under an earthquake. Morgen [9] proposed a precast joint form using friction dampers for energy dissipation and conducted an experimental study under low-cycle reversed loads. Tests show that this joint form has superior energy dissipation capacity and good self-recovery capacity, and the additional friction damper is convenient for replacement and repair. Huang [10] proposed a web friction self-centering prestressed concrete frame beam-column joint. Experiments verify that the joint has self-centering advantages after the earthquake, the main structure is intact, and the energy dissipation mechanism is clear.
Many scholars have used bolts or welds to assemble the joints in their research [11,12,13], combined with buckling buckling-restrained braces to consume energy on the structure [14]. Ersoy [15] studied the seismic resistance of welded connection joints across frame beam spans. The test results show that the welding joints’ strength, stiffness, and energy consumption are comparable to those of the cast-in-place joints. Ertas [16] proposed a bolted dry joint and compared it with one cast-in-place joint, two post-poured integral joints, and one welding joint with ox legs through low-cycle reversed loading tests. Experimental studies have shown that these precast and cast-in-place concrete joints, except for welding joints, show good seismic performance. In contrast, bolted joints show greater advantages in strength, ductility, and energy consumption. Jeom Han Kim [17] proposed a new joint form connecting hollow precast columns with steel belt beams. The steel belt beam is connected to the precast column in two ways: a steel belt welded connection and a bolted connection.
In addition to experiments on dry connections, many researchers have researched mechanical and numerical models to accurately predict seismic performance and continuous collapse resistance [18,19,20,21,22,23]. The dry connections have been improved through experimental studies and numerical model parameter analysis to obtain superior performance.
The review, as mentioned above, shows that the dry connection structure connects the components by bolting, welding, or prestressing the embedded parts. There is no wet operation on the site, and the construction efficiency can be significantly improved. In addition, the dry connection structure can realize the self-resetting of the joint through additional parts such as angle steel and dampers. After the earthquake, the damaged parts can be directly replaced, which is easier to repair and replace than the wet-connected structure. Therefore, the dry connection structure has better recoverable performance and is more in line with the trend of engineering development.
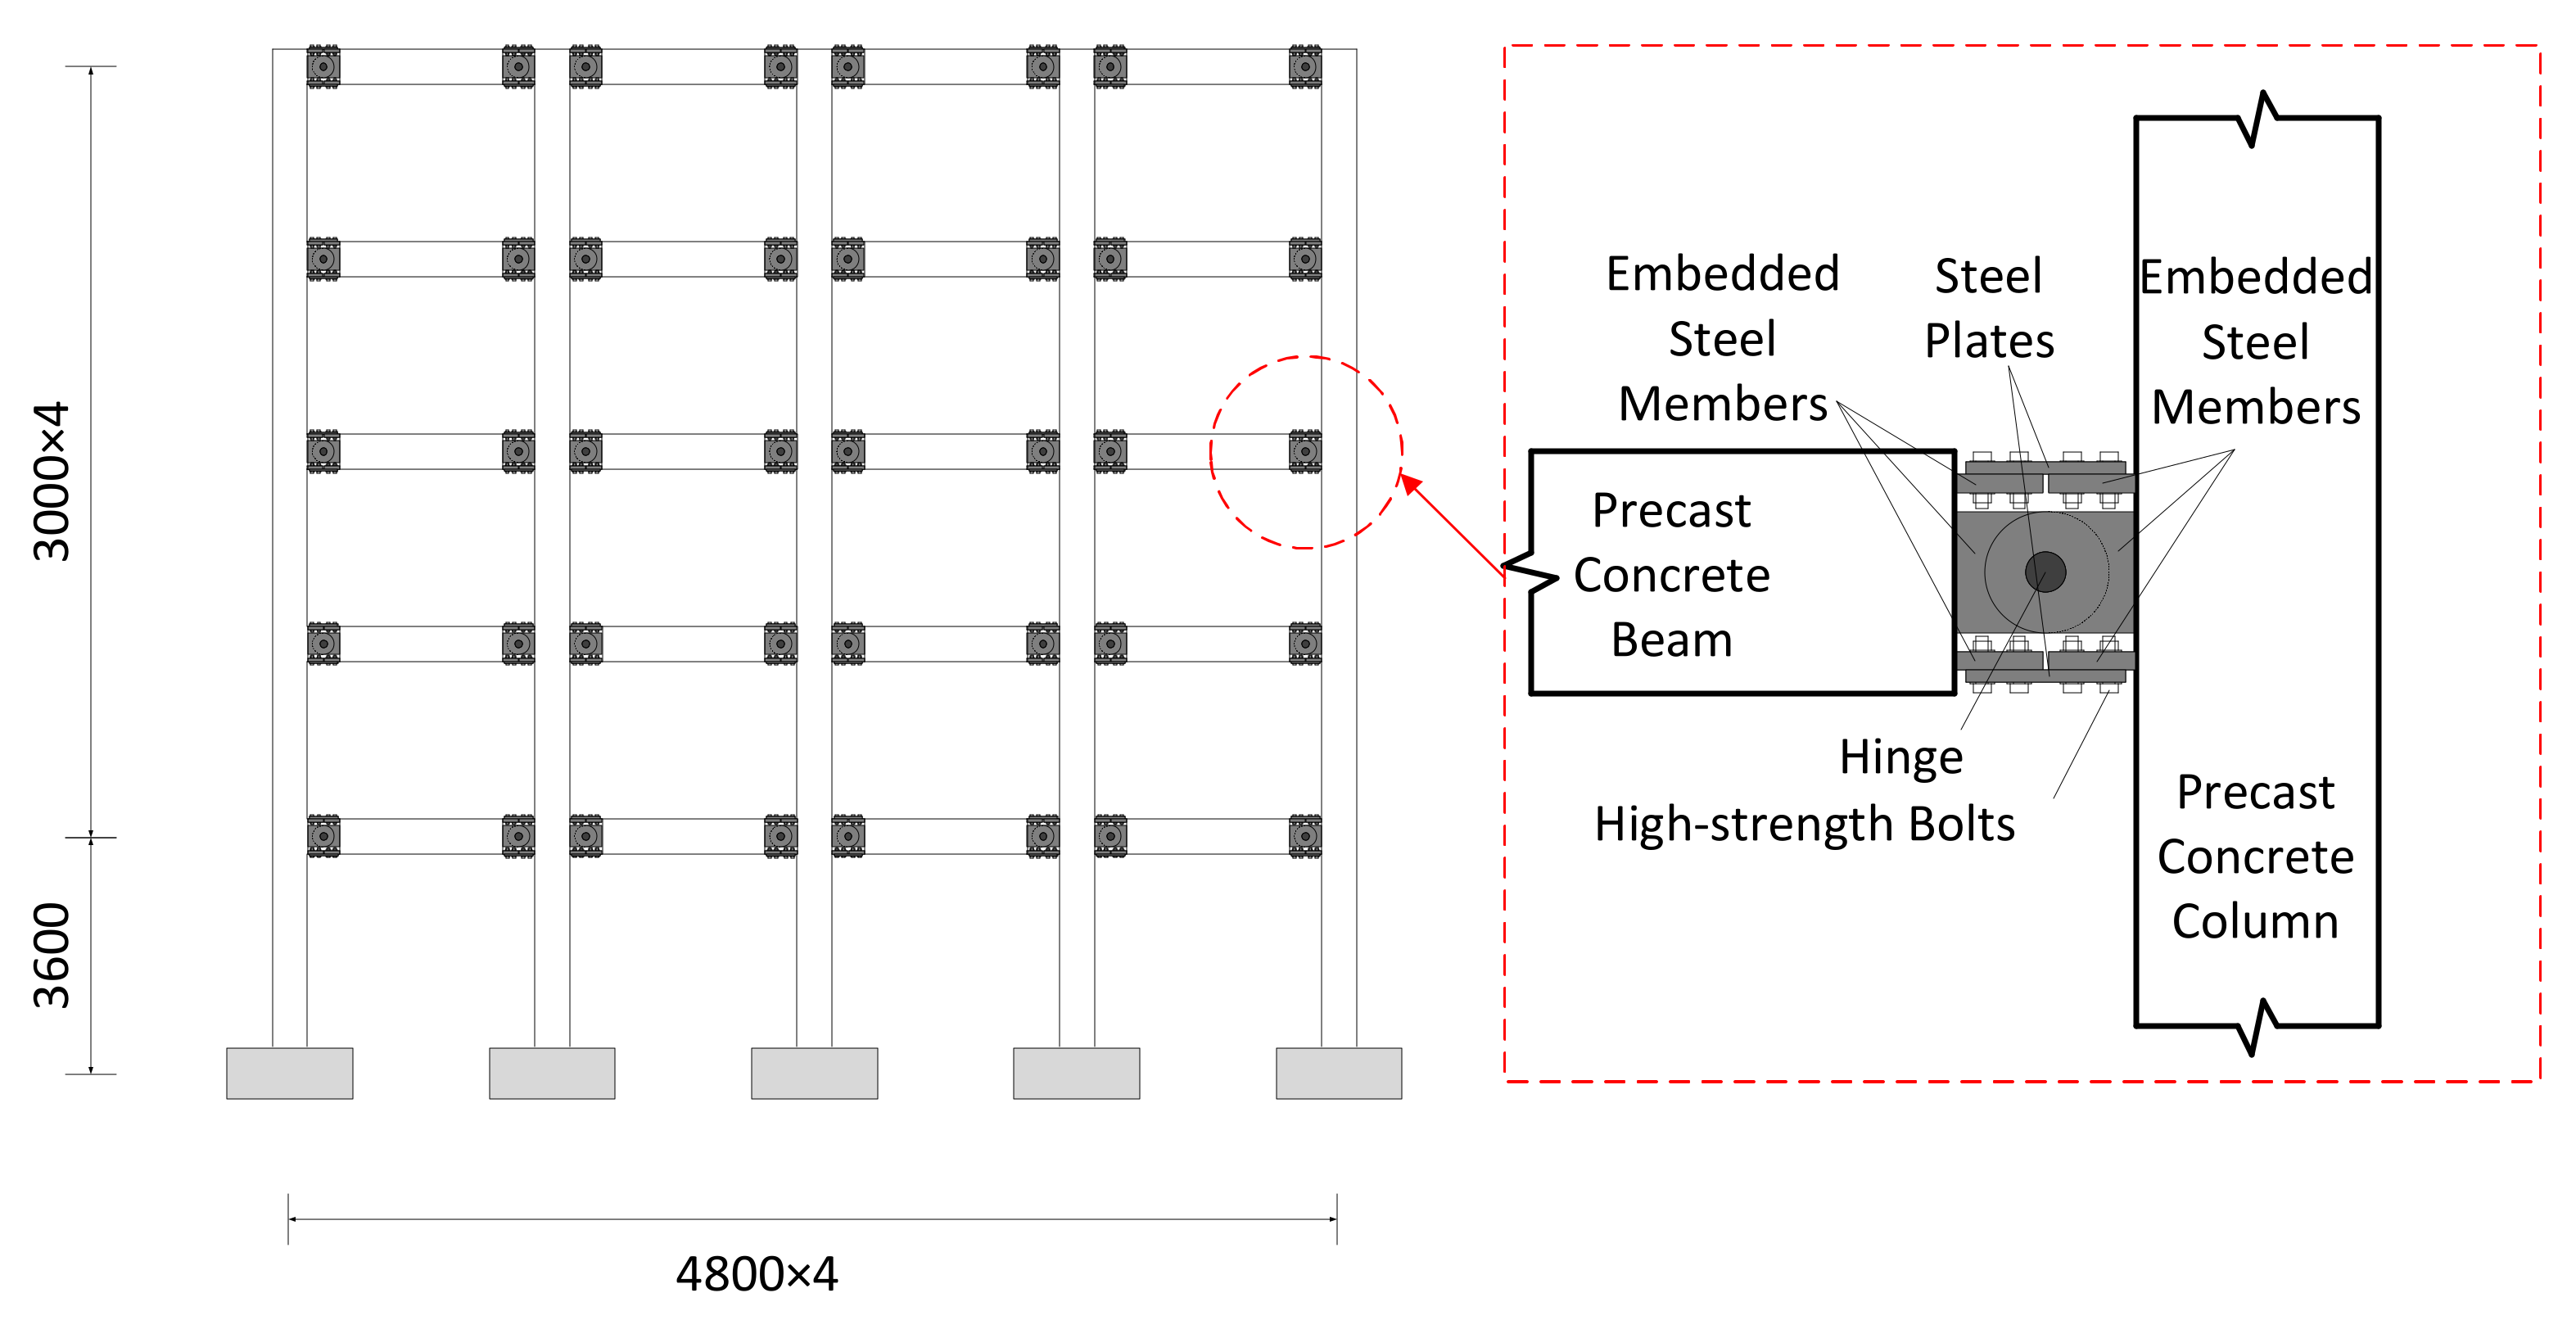
This paper develops a kind of precast bolt-connected steel-members end-embedded concrete (PBSEC) beam-column connection to solve the shortcomings of the current dry-connected precast joints, as shown in Figure 1. The precast beam end and the precast column end of the joint are pre-embedded with profiled steel during prefabrication in the factory, and high-strength bolts connect the top and bottom edges of the joint area. A steel pin connects the joint’s center to bear the beam ends shear force.
Precast concrete frames with such joints have the following advantages:
  • The structure is simple, and the force path is clear. Changing the thickness of the connecting steel plate can realize the controllable stiffness of the joint to optimize the structure’s seismic performance and repair the performance after structural damage by replacing the connecting steel plate;
  • The damage to the structure is controllable. When the structure is subjected to an earthquake, the connecting steel plates of the joints resist the bending moment caused by the earthquake, while the beams and columns are still in an elastic state. When the connecting steel plate yields, the stiffness of the joint changes from semi-rigid characteristics to zero, which can be regarded as a hinge, the structure is in the ideal state of the hinged beam end, and the seismic capacity and collapse resistance of the structure is improved;
  • There is no wet operation in the assembly process, and the all-dry construction method is adopted. The beams and columns are assembled with high-strength bolts during construction. There is no need to pour concrete and support formwork throughout the process, significantly improving construction efficiency.
This paper expects to conduct low cyclic reversed loading tests to obtain test data such as failure mode, hysteresis curve, skeleton curve, stiffness, and ductility of the precast concrete joint to study the seismic performance of the joint further.

2. Design of the Test Specimens

In this paper, the seismic performance of PBSEC joints was studied by low cyclic reversed loading tests. The bearing and deformation capacity of the joints were controlled by changing the strength and thickness of the connecting steel plates. The prototype structure of the tests was taken from a plane frame structure with two spans and three floors. As shown in Figure 2, the design height of the house was 15.6 m, of which each ground floor was 3.6 m high, and the rest were 3 m high. The column spacing was 4.8 m in the plane’s horizontal and vertical directions.
The side span of the third floor was taken as the test joint, the precast column’s length was half the height of the frame’s third floor, and the precast beam’s length was half of the frame span. The test joint was subject to a constant vertical load, and the column was kept at a constant axial compression ratio by applying a vertical load on the top of the column and then applying a vertical reversed load on the beam end to simulate the seismic performance of the precast concrete joint under the horizontal earthquake action. The size and reinforcement of the test joint are shown in Figure 3 and Figure 4. The embedded steel was formed with 40 mm thick Q345 steel plates and should be welded through the groove butt with the longitudinal reinforcement of the beam and column. The bolts were grade 12.9 high-strength with a diameter of 20 mm. The pin shaft was made of Q345 steel with a diameter of 80 mm.
The design and reinforcement ensure that the precast beam and column would not be damaged during the test and would always maintain the elastic deformation state. Therefore, the precast beam and column could be loaded repeatedly and only need to change different connecting steel plates. The design parameters of four test joints are shown in Table 1. Taking J1-235-10 as an example, J1 represents the first joint, 235 represents that the connecting steel plate of the joint is made of steel with strength grade Q235, and 10 represents the thickness of the connecting steel plate is 10 mm.

3. Processing of the Test Specimens

3.1. Manufacturing Process

The precast components of precast concrete joints connected by embedded steel bolts in this test were processed and manufactured in the Laboratory of Industrialized Structural and Bridge Engineering of Jiangsu Province. The manufacturing process is shown in Figure 5. The embedded formed steel should be welded and connected with the longitudinal steel bars in the precast beams and columns. During the processing, it should be noted that the bolt holes at both ends of the connecting steel plate should be consistent with the bolt holes on the steel flange to ensure the installation of the connecting steel plate in the later stage. After the formed steel was embedded, the concrete should be poured at once. After 28 days of standard concrete curing, the precast column was vertically lifted and placed at the designated position by the laboratory traveling crane. The precast column should be slowly dropped from top to bottom by the operating traveling crane until the pinhole of the precast column was aligned with the pinhole of the precast beam. Then, the pin shaft was inserted. The precast column’s verticality and the precast beam’s levelness should be monitored and adjusted by the laser. Then, the connecting steel plate and the flange of the embedded formed steel were fastened with high-strength bolts. In order to prevent the bolt from sliding when bearing the reversed load, it was advisable to apply steel structural adhesive on the interface between the connecting steel plate and the embedded formed steel and fasten the high-strength bolt with double nuts.

3.2. Material Properties

In PBSEC joints, HRB500 reinforcement with a diameter of 28 mm was used for the longitudinal stress reinforcement of precast beams and columns, and HRB500 reinforcement with a diameter of 10 mm was used for stirrups. Three test samples of these two kinds of reinforcement were taken from the same batch of reinforcement produced by members for the tensile material property test. The test method referred to the Chinese code GB/T 228.1-2010 [24]. The test content included the yield strength, ultimate tensile strength, elastic modulus, and elongation of the reinforcement. The average value of each group of test results was taken as the measured value. The measurement results are shown in Table 2. Concrete with grade C50 was used to pour precast beams and columns. According to the Chinese code GB/T 50081-2002 [25], three groups of 150 mm × 150 mm × 150 mm concrete cubes were precast simultaneously when pouring beams and columns. The 150 mm concrete cube compressive strength test block should be cured under the same conditions as the test member. The compressive strength of concrete was tested on the 7th and 28th days, as shown in Table 3. As the connecting steel plates were made of LY160, Q235, Q345, and Q390, three sets of dumbbell-shaped specimens were made for each of the four steel plates. The test results are shown in Table 4.

4. Test Loading and Measurement Scheme

4.1. Test Loading Device

According to the Chinese code JGJ-T101-2015 [26], there are two loading methods for beam-column joints: column-end loading and beam-end loading. Since the main principle of PBSEC Beam-Column Connection is to enhance the rotation ability of the beam end as an artificial plastic hinge, the beam-end loading test scheme was adopted. The low-cycle reversed loading test device of the joint is shown in Figure 6. The column’s two ends should be hinged according to the force mechanism and the beam end loading method. Therefore, the precast column was placed vertically on the hinged support, and the hinged support could be rotated through the pin at the bottom. No bending moment was generated at the end, and the mechanical behavior of the actual frame column at the reverse bending point was simulated when it was subjected to a horizontal load. The distribution beam was placed on the top of the column, and four prestressed threaded steel bars were symmetrically penetrated from the holes at both ends of the distribution beam. The prestressed steel bars were tensioned by the through-core jack and anchored on the bottom hinge support. The steel bars exerted axial pressure on the top of the column to simulate the constant vertical load that the frame column bears in the actual structure. In this test, an axial pressure of 560 kN was applied to the column, and an average tensile force of 140 kN was applied to each steel strand. The axial pressure on the column was monitored in real-time by installing a force sensor on the column. By arranging a 50 t bidirectional actuator at the right end of the beam, and applying a vertical load through the hydraulic servo structure test system, the horizontal distance between the center line of the actuator and the right end of the column was defined as the lever arm, which was 2200 mm in this test. The test’s target displacement at the actuator’s loading point was the beam’s vertical displacement. The interstory displacement angle of the joint was the ratio of the measured vertical displacement of the beam at the load point to the lever arm [27,28].
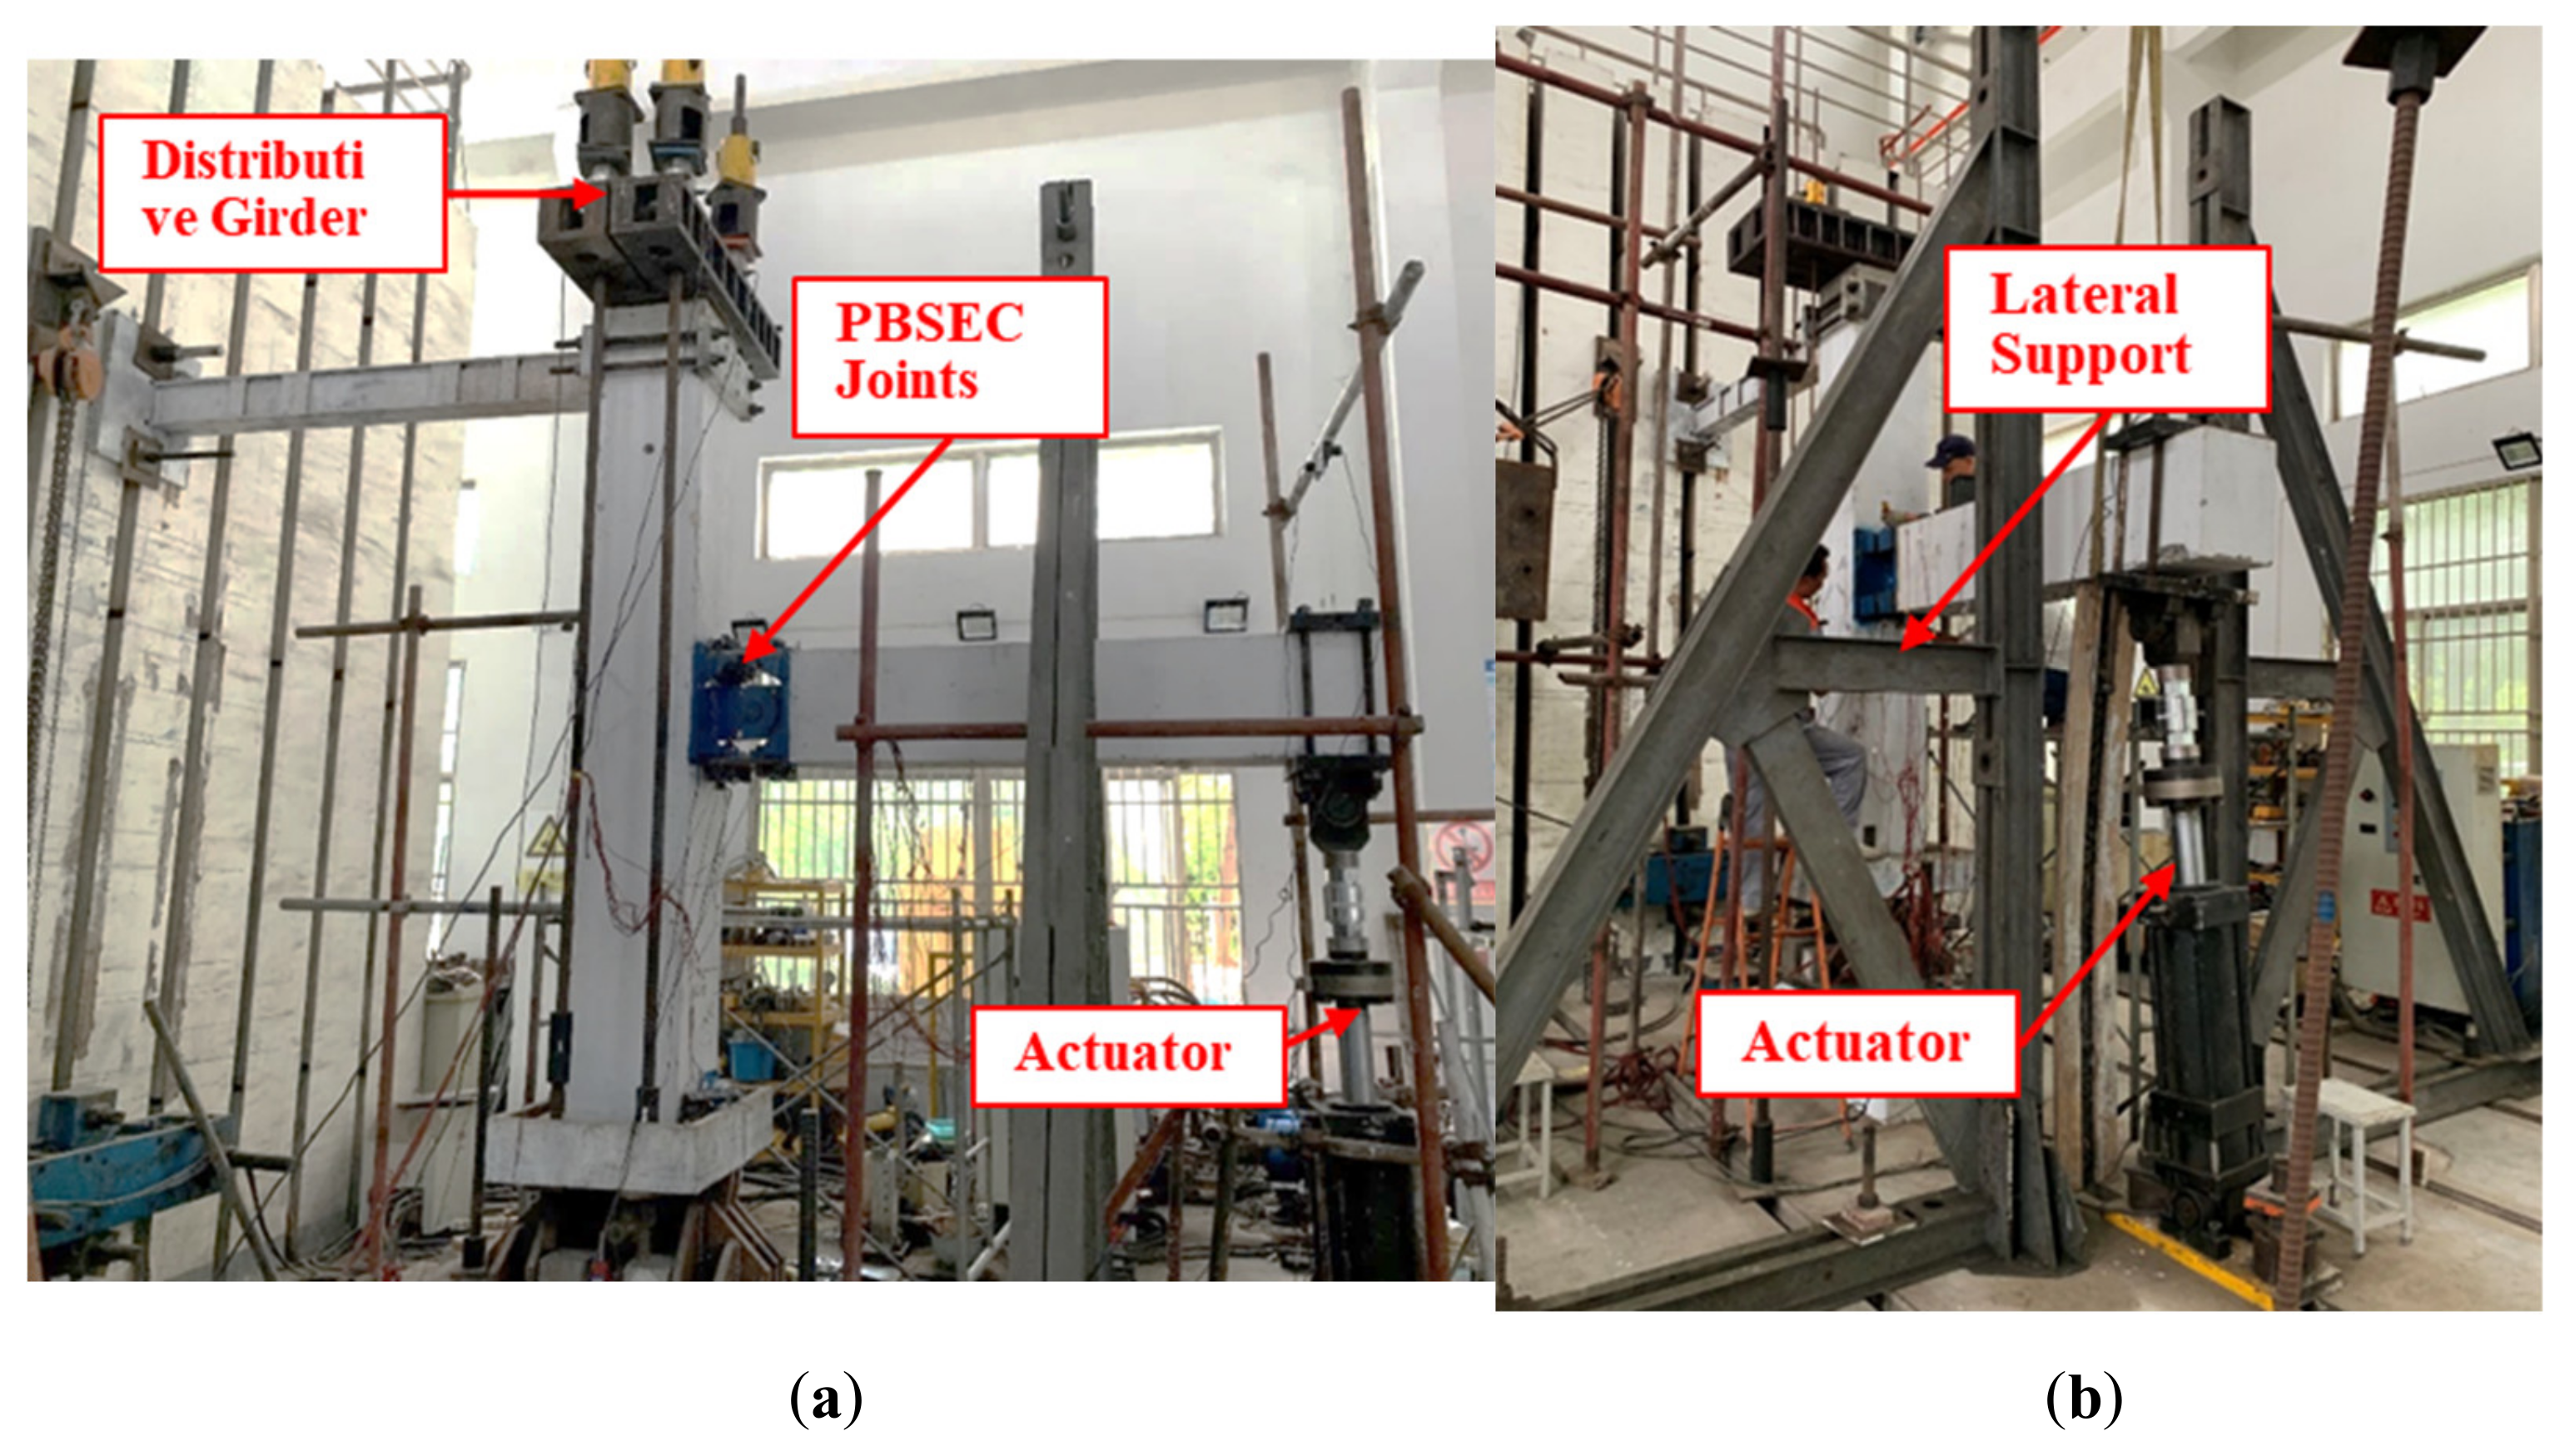
The actuator was vertically arranged at the right beam-end, and the bottom and the top column-ends were hinged. Two lateral triangular supports were arranged on both sides of the beam to prevent the precast beam from moving out of the plane during the loading process. Pulleys were arranged on the beam surfaces to limit the out-of-plane horizontal movement of the precast beam, and the beam could move freely in the vertical direction when loaded. Figure 7 shows the loading device of PBSEC joints.

4.2. Test Procedure and Measurements

A 50 t actuator was arranged at the loading end of the beam to apply a vertical reversed load to the joint (assuming that the upward was positive and the downward was negative) to simulate the seismic action on the joint. Before applying a vertical cycle load to the loading end of the beam, a vertical load of 560 kN was first applied to the top of the column and kept constant during loading.
The loading pattern is shown in Figure 8. Before the joints were formally loaded, a displacement of 2.2 mm (0.1%) was preloaded to check whether the test loading equipment, displacement gauges, strain gauges, force sensors, and data acquisition instruments were working properly. During the formal test, the interstory displacement angle of 0.25%, 0.5%, 0.75%, 1%, 1.25%, 1.5%, 2.0%, 2.5%, 3%, etc. were applied to the loading end of the beam, respectively. The displacement amplitude of each stage was reciprocally loaded three times, and the loading speed was determined according to the displacement amplitude of each stage, which was approximately 2 mm/min. When the loading process of the joint reached the peak bearing capacity, and the bearing capacity was less than 85% of the peak bearing capacity, it could be considered that the joint had reached the limit state, and the test was terminated.
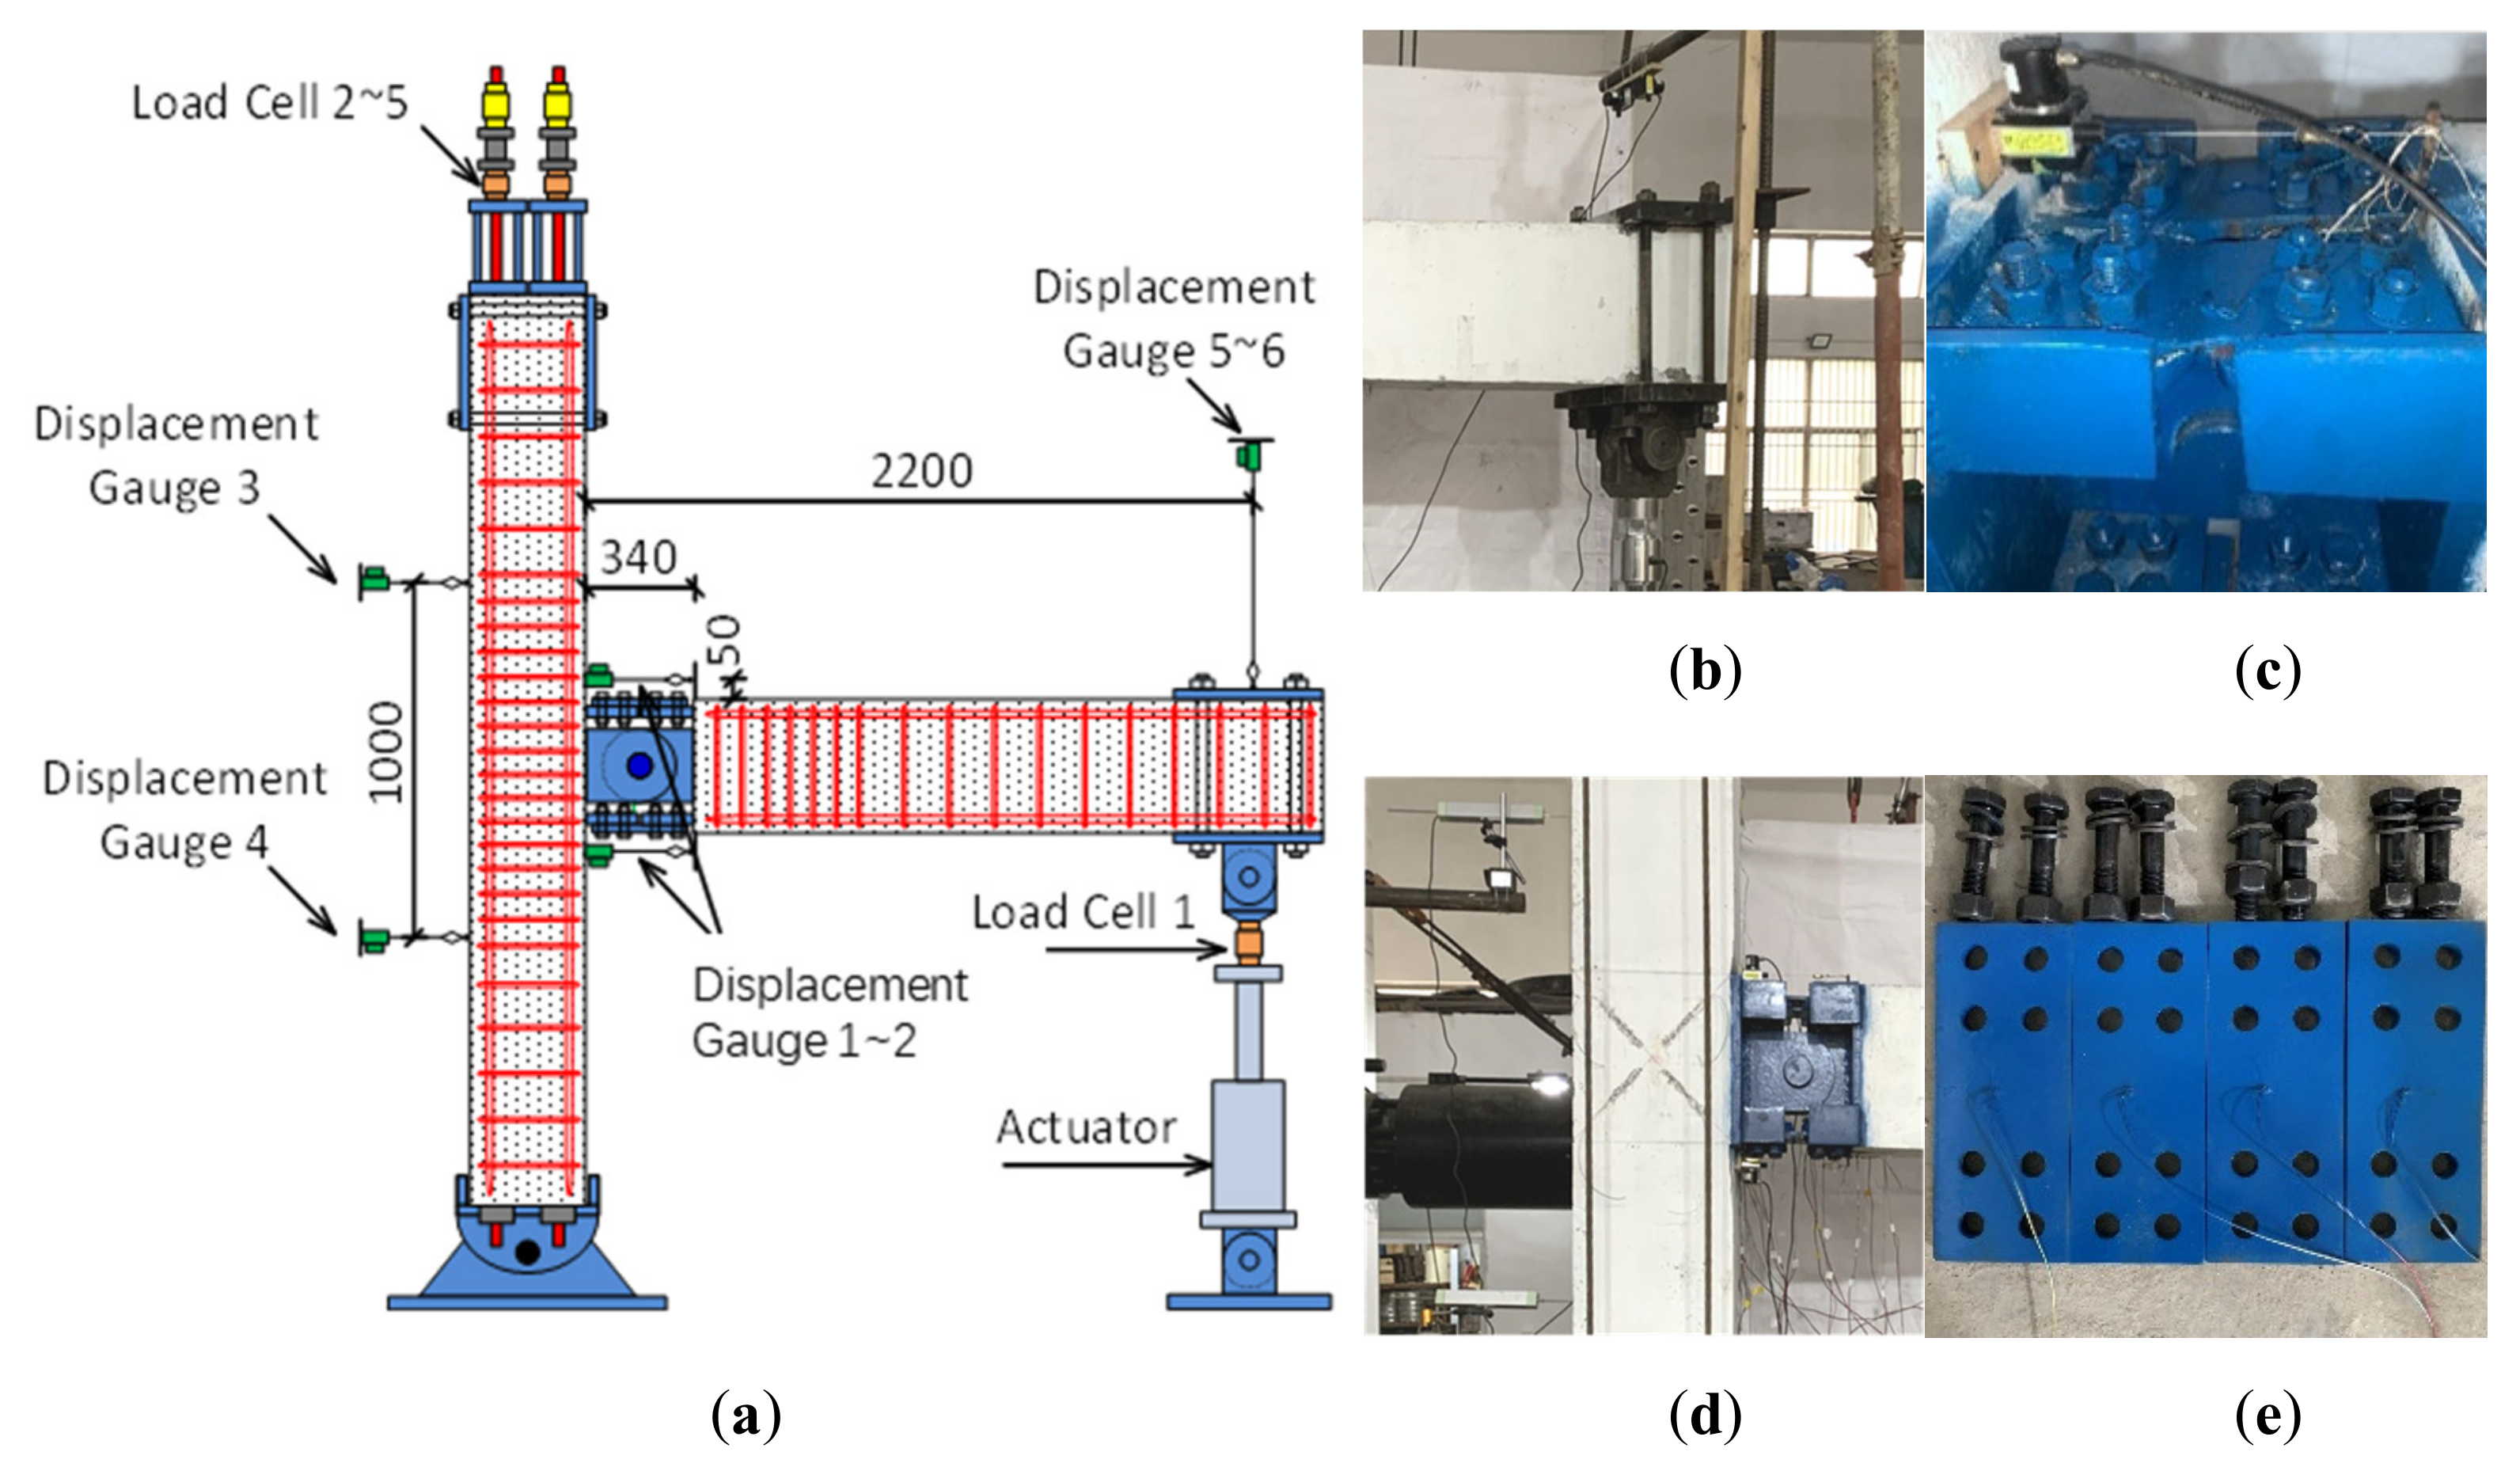
The primary measurement contents of the PBSEC joint included the load–displacement curve of the loading point, the relative angle of the beam-column, the strain of the connecting steel plate, the strain of the longitudinal reinforcement of the beam-column, the development of concrete cracks in the beam-column joint area, etc. Figure 9a shows the locations of the displacement gauges, the force cells, and the strain gauges. The TDS-530 static data acquisition instrument collected the force, strain, and displacement measured in the test.
To measure the displacement of the loading beam-end, displacement gauges 5~6 were erected along the vertical direction at the loading point, as shown in Figure 9b. A 100 t force sensor was fixed on the upper end of the piston rod to measure the load at the beam end.
There were four connecting steel plates and four shaped steel flanges in the PBSEC joints. Therefore, strain gauges GB1~GB4 were attached to each connecting steel plate, as shown in Figure 9e. Strain gauges EB1~EB4 were respectively pasted on the flange. In order to judge the mechanical performance and elastic-plastic state of concrete beams and concrete columns, strain gauges B1~B12 and strain gauge C1 were pasted on the upper and lower longitudinal bars and stirrups of the beam at a distance of 400 mm, 700 mm, 900 mm, and 1200 mm from the column end, respectively. C1~C9 was attached to the column longitudinal bars and stirrups.

5. Analysis of the Test Results

5.1. Observations and Failure Modes

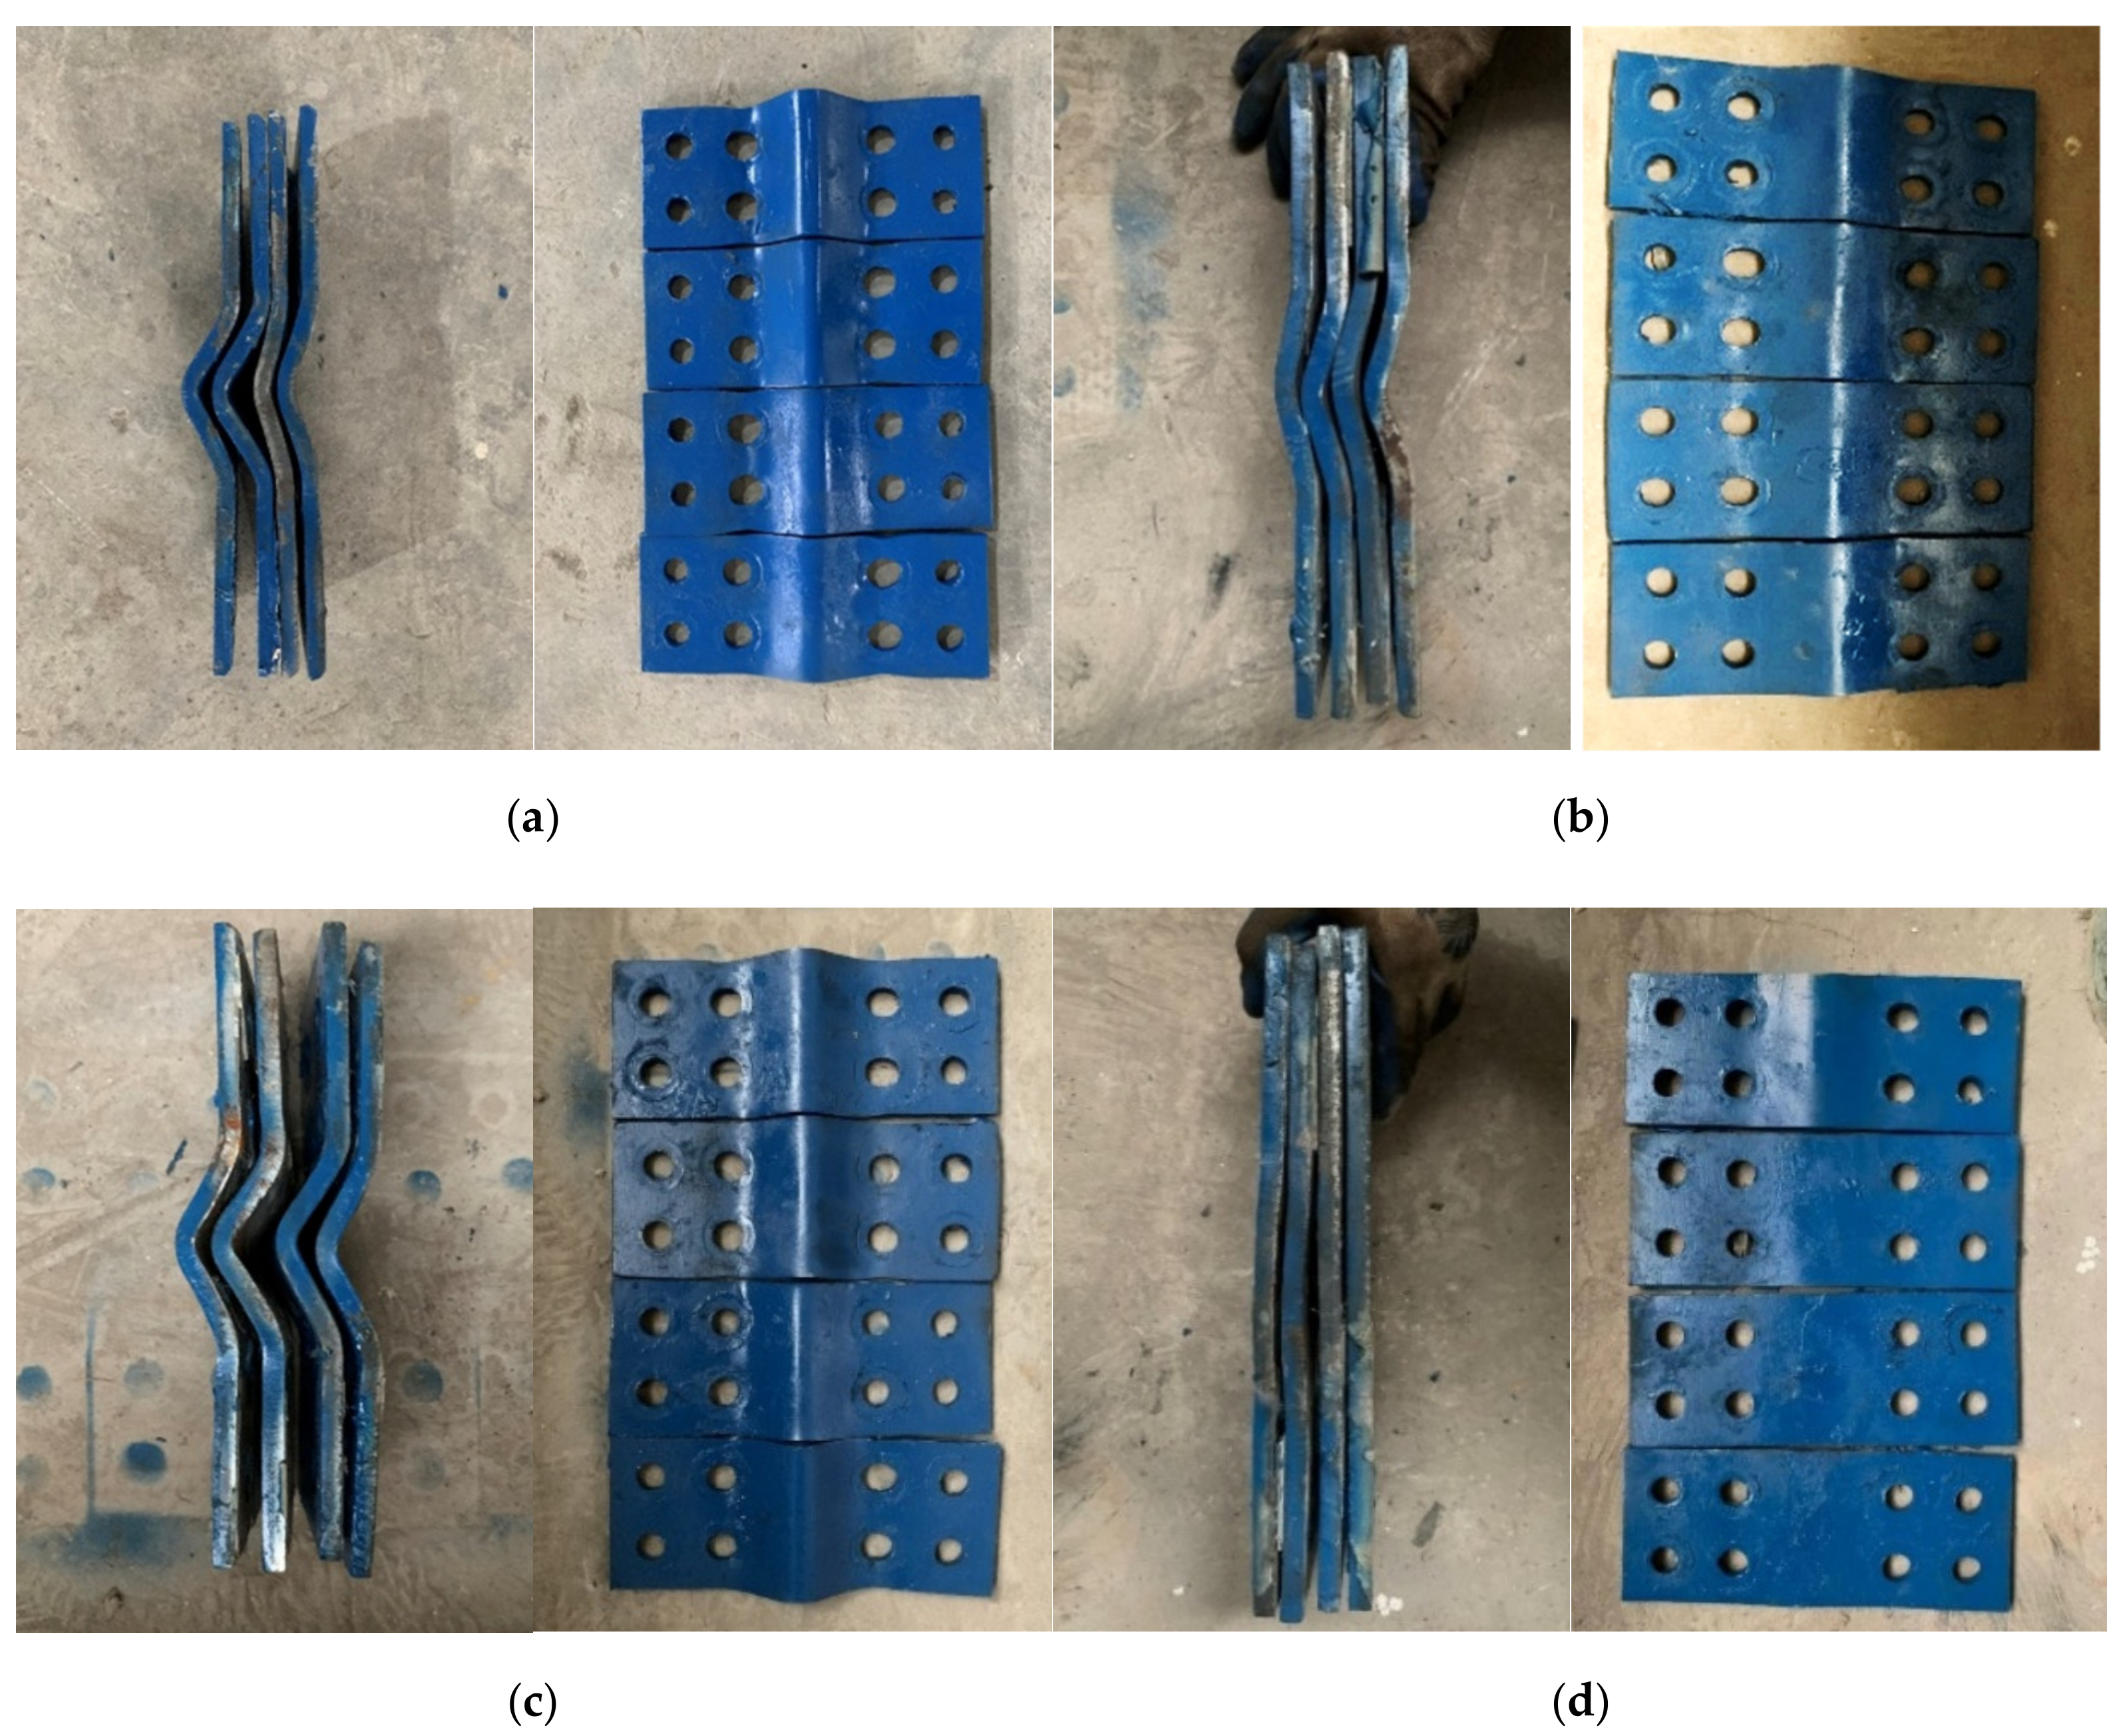
The failure modes of the four PBSEC joints are generally similar, mainly the buckling failure of the connecting steel plates (Figure 10), while the beams and columns are still elastic. Therefore, the following takes specimen J1-235-10 as an example to illustrate the overall failure process of the specimens. For joint J1-235-10, the connecting steel plate was made of 10 mm thick Q235 steel, and anti-slip measures were taken. There was no bolt slip phenomenon during the whole process of test loading, which reflected the reliability of the interface anti-slip measures and the transmission of internal force. When the interstory displacement angle was 0.75%, the connecting steel plates in the joint area were in the elastic stage without significant deformation. The structural adhesive was intact, providing the joints with stable stiffness and bearing capacity. When the interstory displacement angle reached 1%, the connecting steel plate on the compression side began to buckle out of the plane, and the speed of the increase of the joint bearing capacity became slow. When the interstory displacement angle reached 2%, the steel plate began to yield. At this time, the steel plate on the tension side entered the plastic stage. Currently, the joint bearing capacity was 82 kN, the beam end rotated obviously, and the beam concrete had slight vertical transverse cracks, but the column did not crack. When the interstory displacement angle reached 2.5%, the bearing capacity of the joint reached its peak value, the connecting steel plates at the upper and lower ends of the joint area were buckling, the beam ends were fully rotated, and plastic hinges were formed. After that, the nodal bearing capacity began to decrease, and finally, when the interstory displacement angle was 4%, the nodal bearing capacity decreased to 85% of the peak bearing capacity. Finally, the connecting steel plate showed compressive lateral buckling failure, and the precast beam and column concrete did not break.

5.2. Strain–Displacement Curves

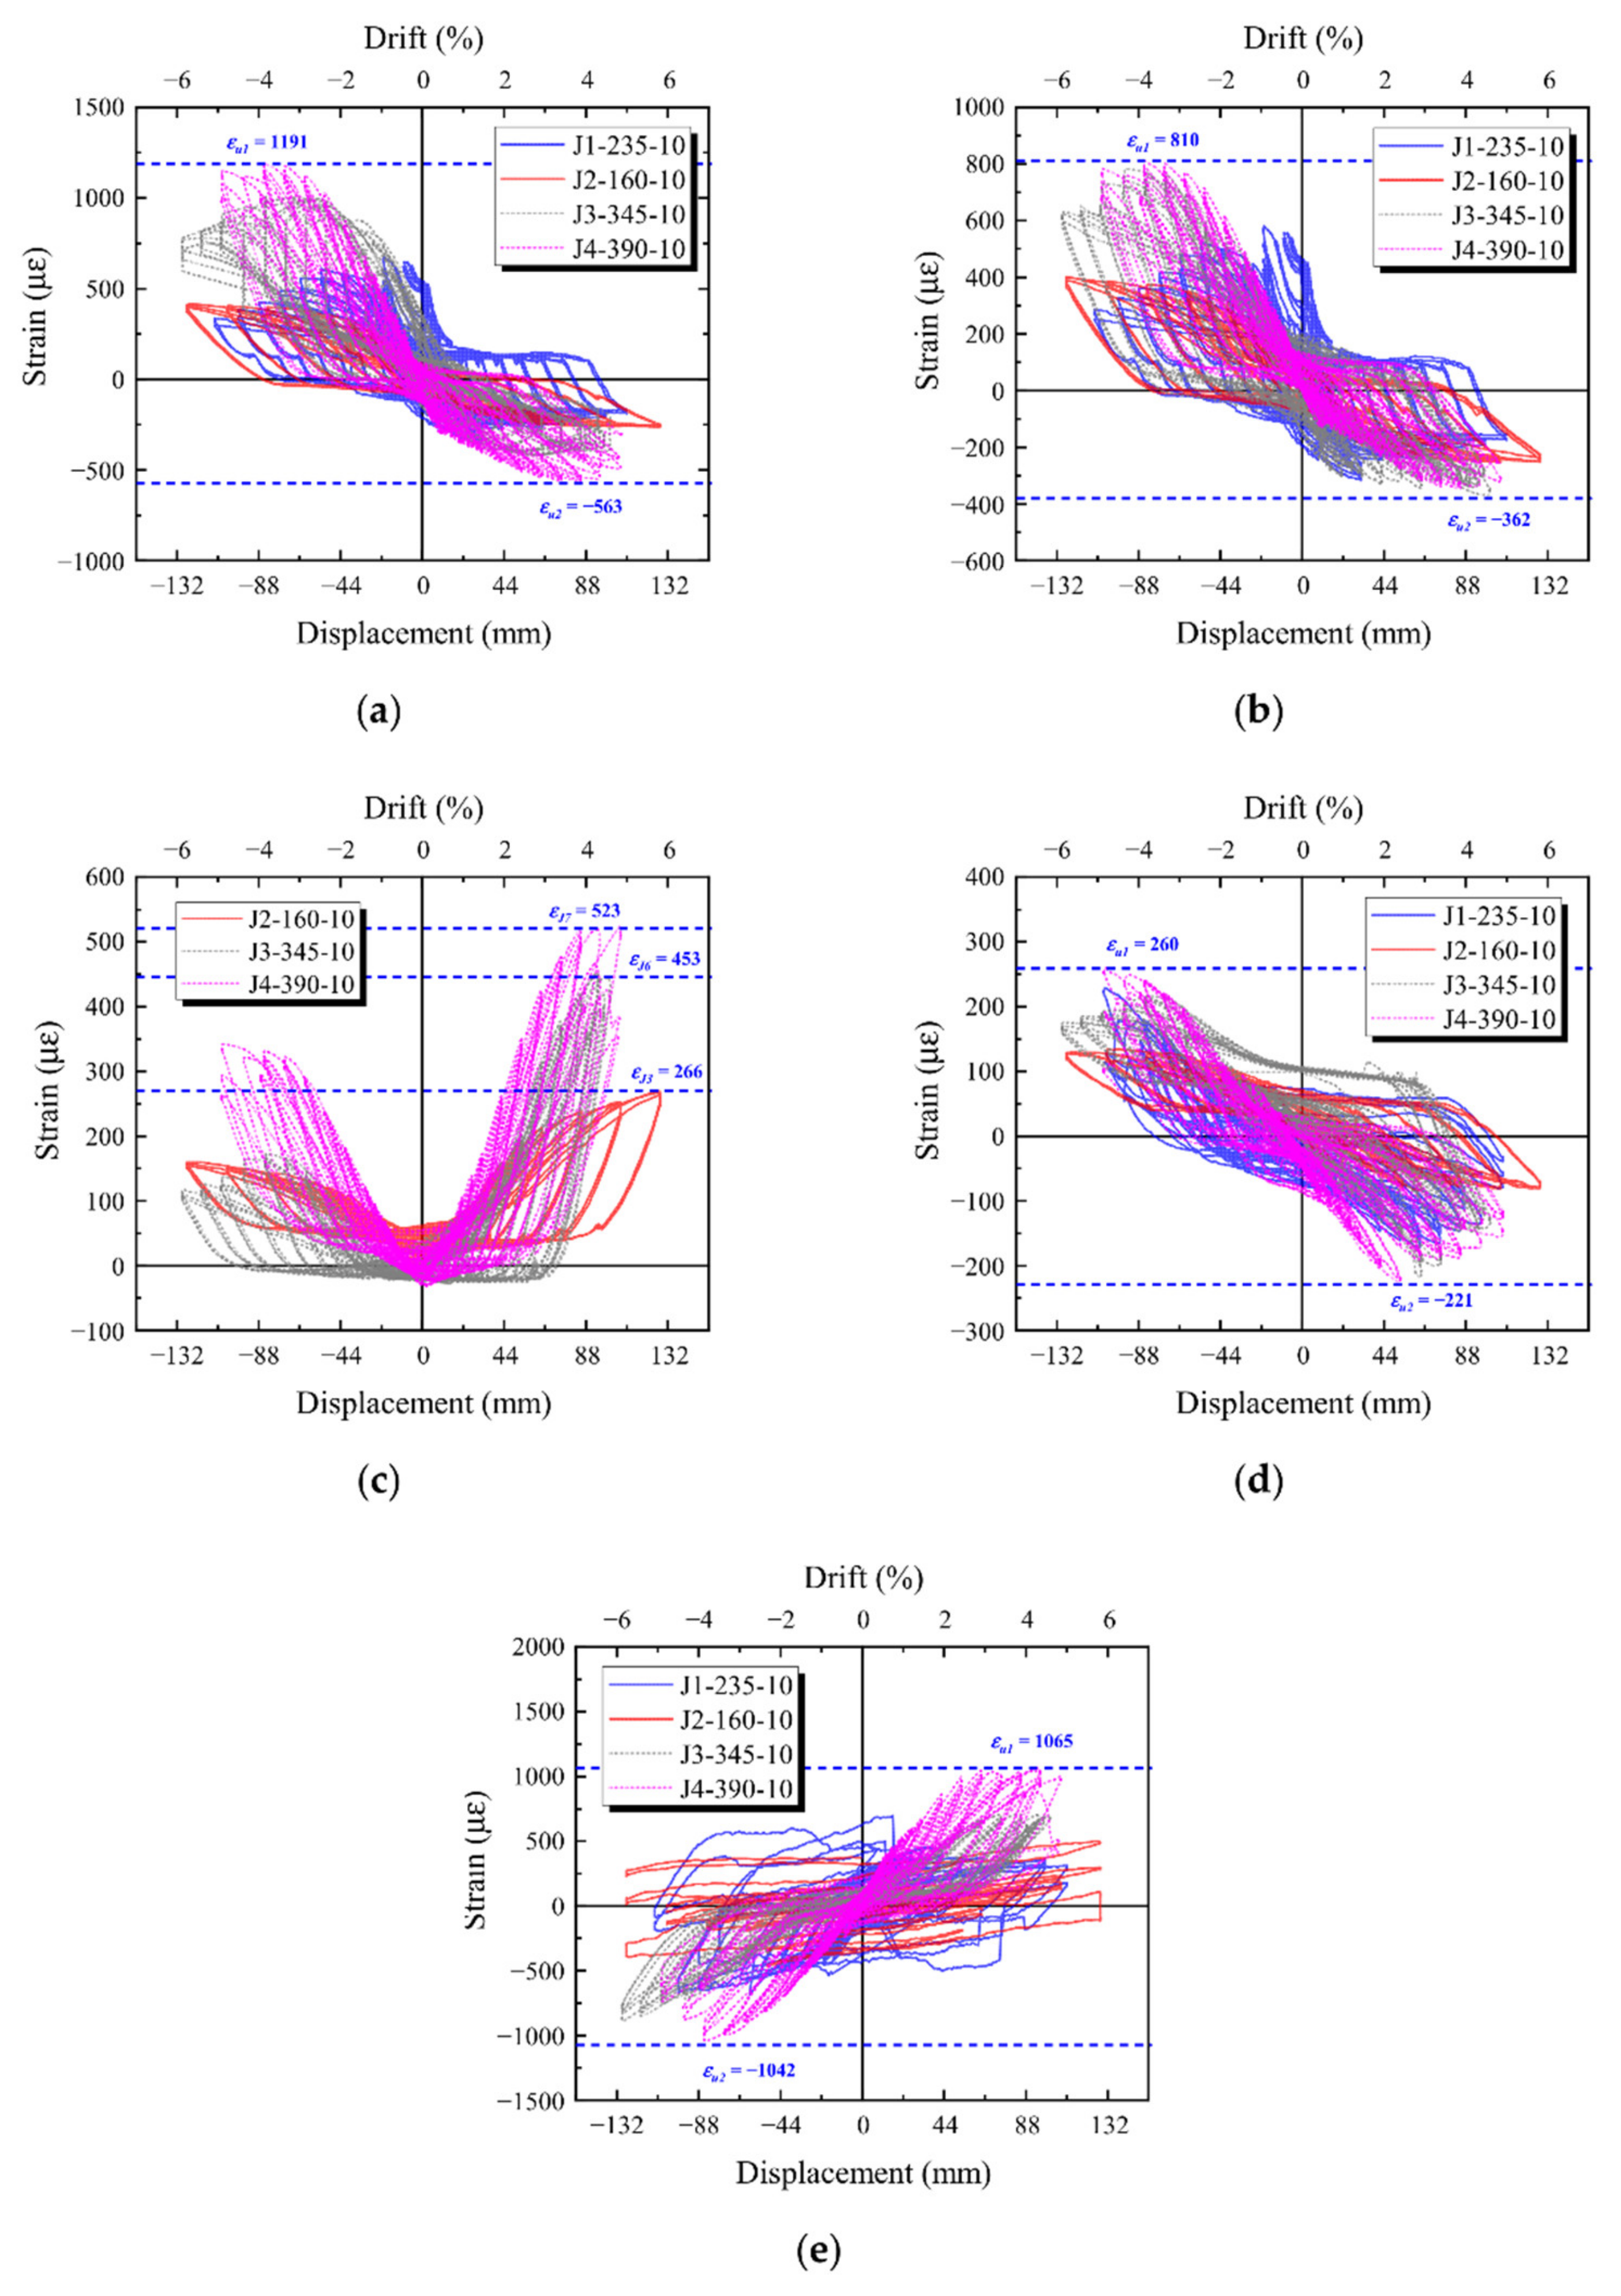
The strain–displacement curves of the main parts of the specimens are shown in Figure 11, including beams, columns, connecting steel plates, formed steel flanges, etc. It can be seen from Figure 11a–c that the beams of the four specimens were all in an elastic state, and the maximum strain of the longitudinal reinforcement bars at the two sections of the beams did not exceed the yield strain of the reinforcement bars. Section 1 is the end of the precast beam near the core area of the joint, where the maximum strain of the longitudinal reinforcement is 1191 με (Figure 11a). The maximum strain of longitudinal reinforcement in section 2 is 810 με (Figure 11b). Since section 2 is located at the mid-span of the precast beam, the strain of longitudinal reinforcement is slightly lower than that of longitudinal reinforcement in section 1. It can be seen from Figure 11c that the strain of the stirrups of the beam changed with the loading process. The stirrup strain of J4-390-10 was the largest, 523 με, while J3-345-10 was lower than that of J4-390-10. The bearing capacity of J2-160-10 was much lower than the above two joints, so the stirrup strain was only 266 με, which is approximately 50% of the maximum strain of J4-390-10. It can be seen from Figure 11d that the columns were all in an elastic state, and the maximum strain of the longitudinal reinforcement was 260 με, which was much smaller than that of the reinforcement in the beam. The connecting steel plates in the core area of the joints can effectively transfer the deformation and damage of the column and bear most of the deformation and damage. From Figure 11a–d, the strain of beams and columns increased with the strength of the connecting steel plate. Figure 11e shows the strain of the formed steel flanges. J4-390-10 had the largest strain, 1065 με and the strain gradually decreased with the strength of the connecting steel plates.

5.3. Hysteresis and Skeleton Curves

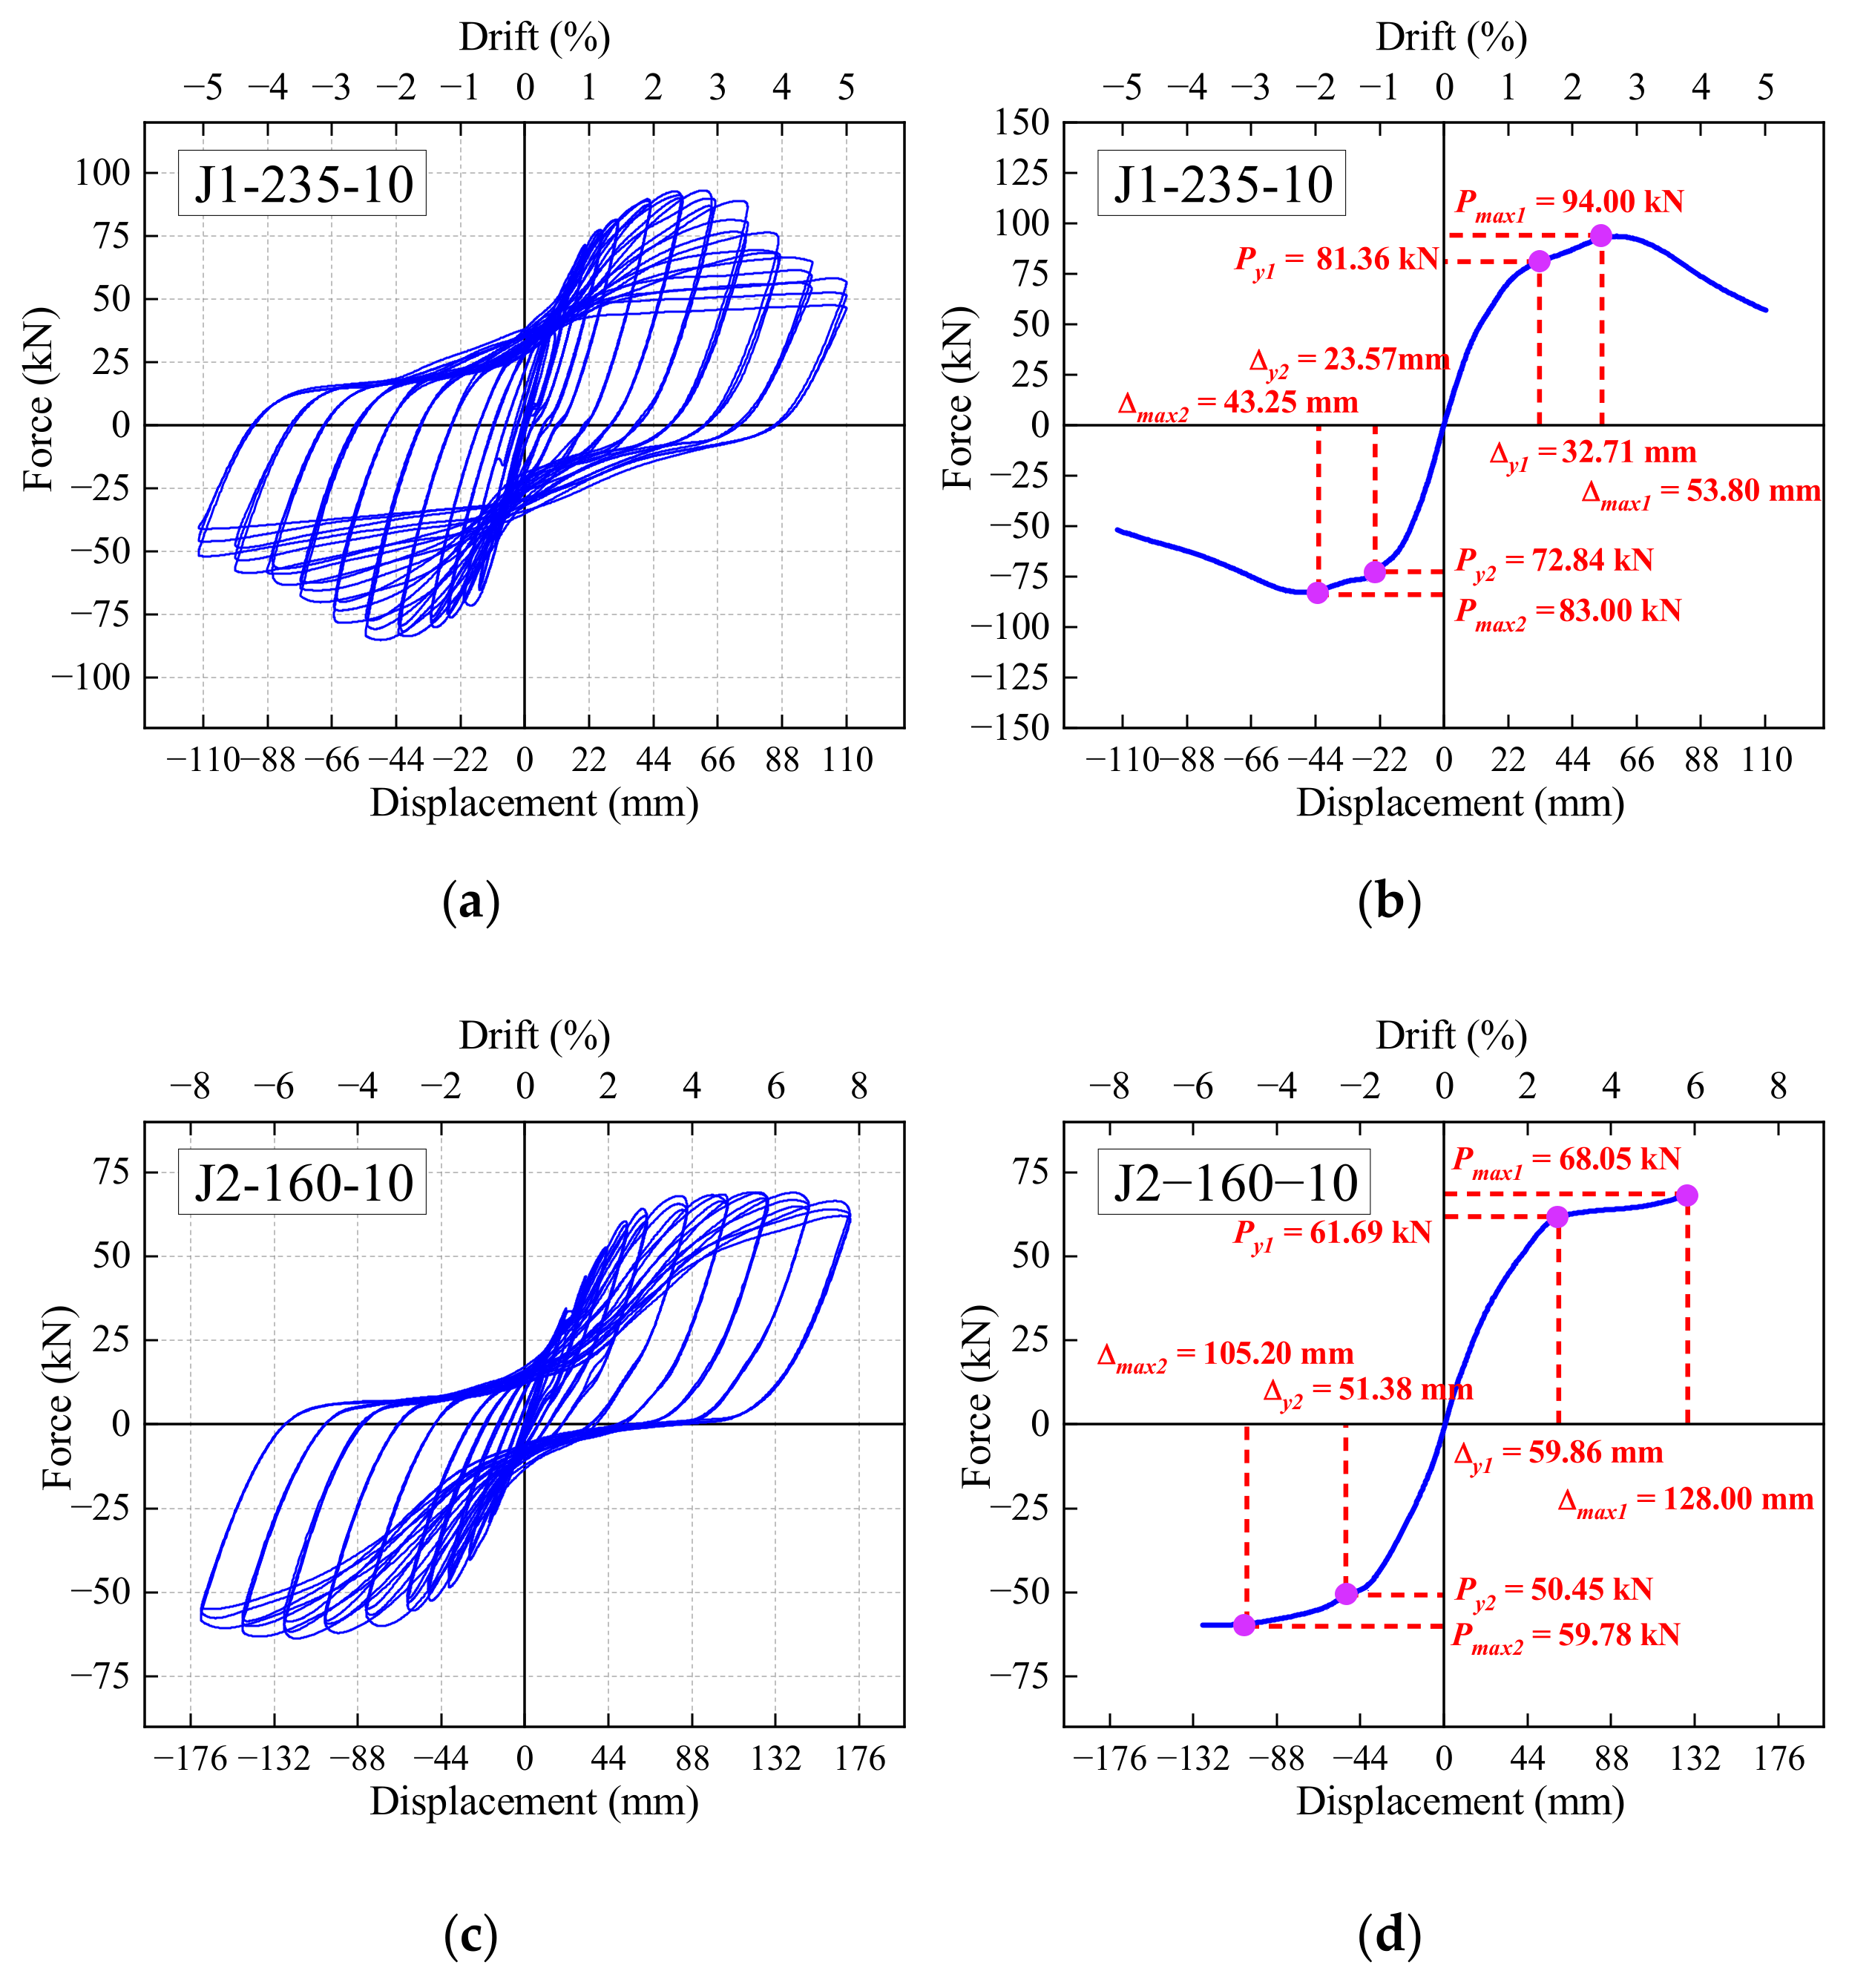
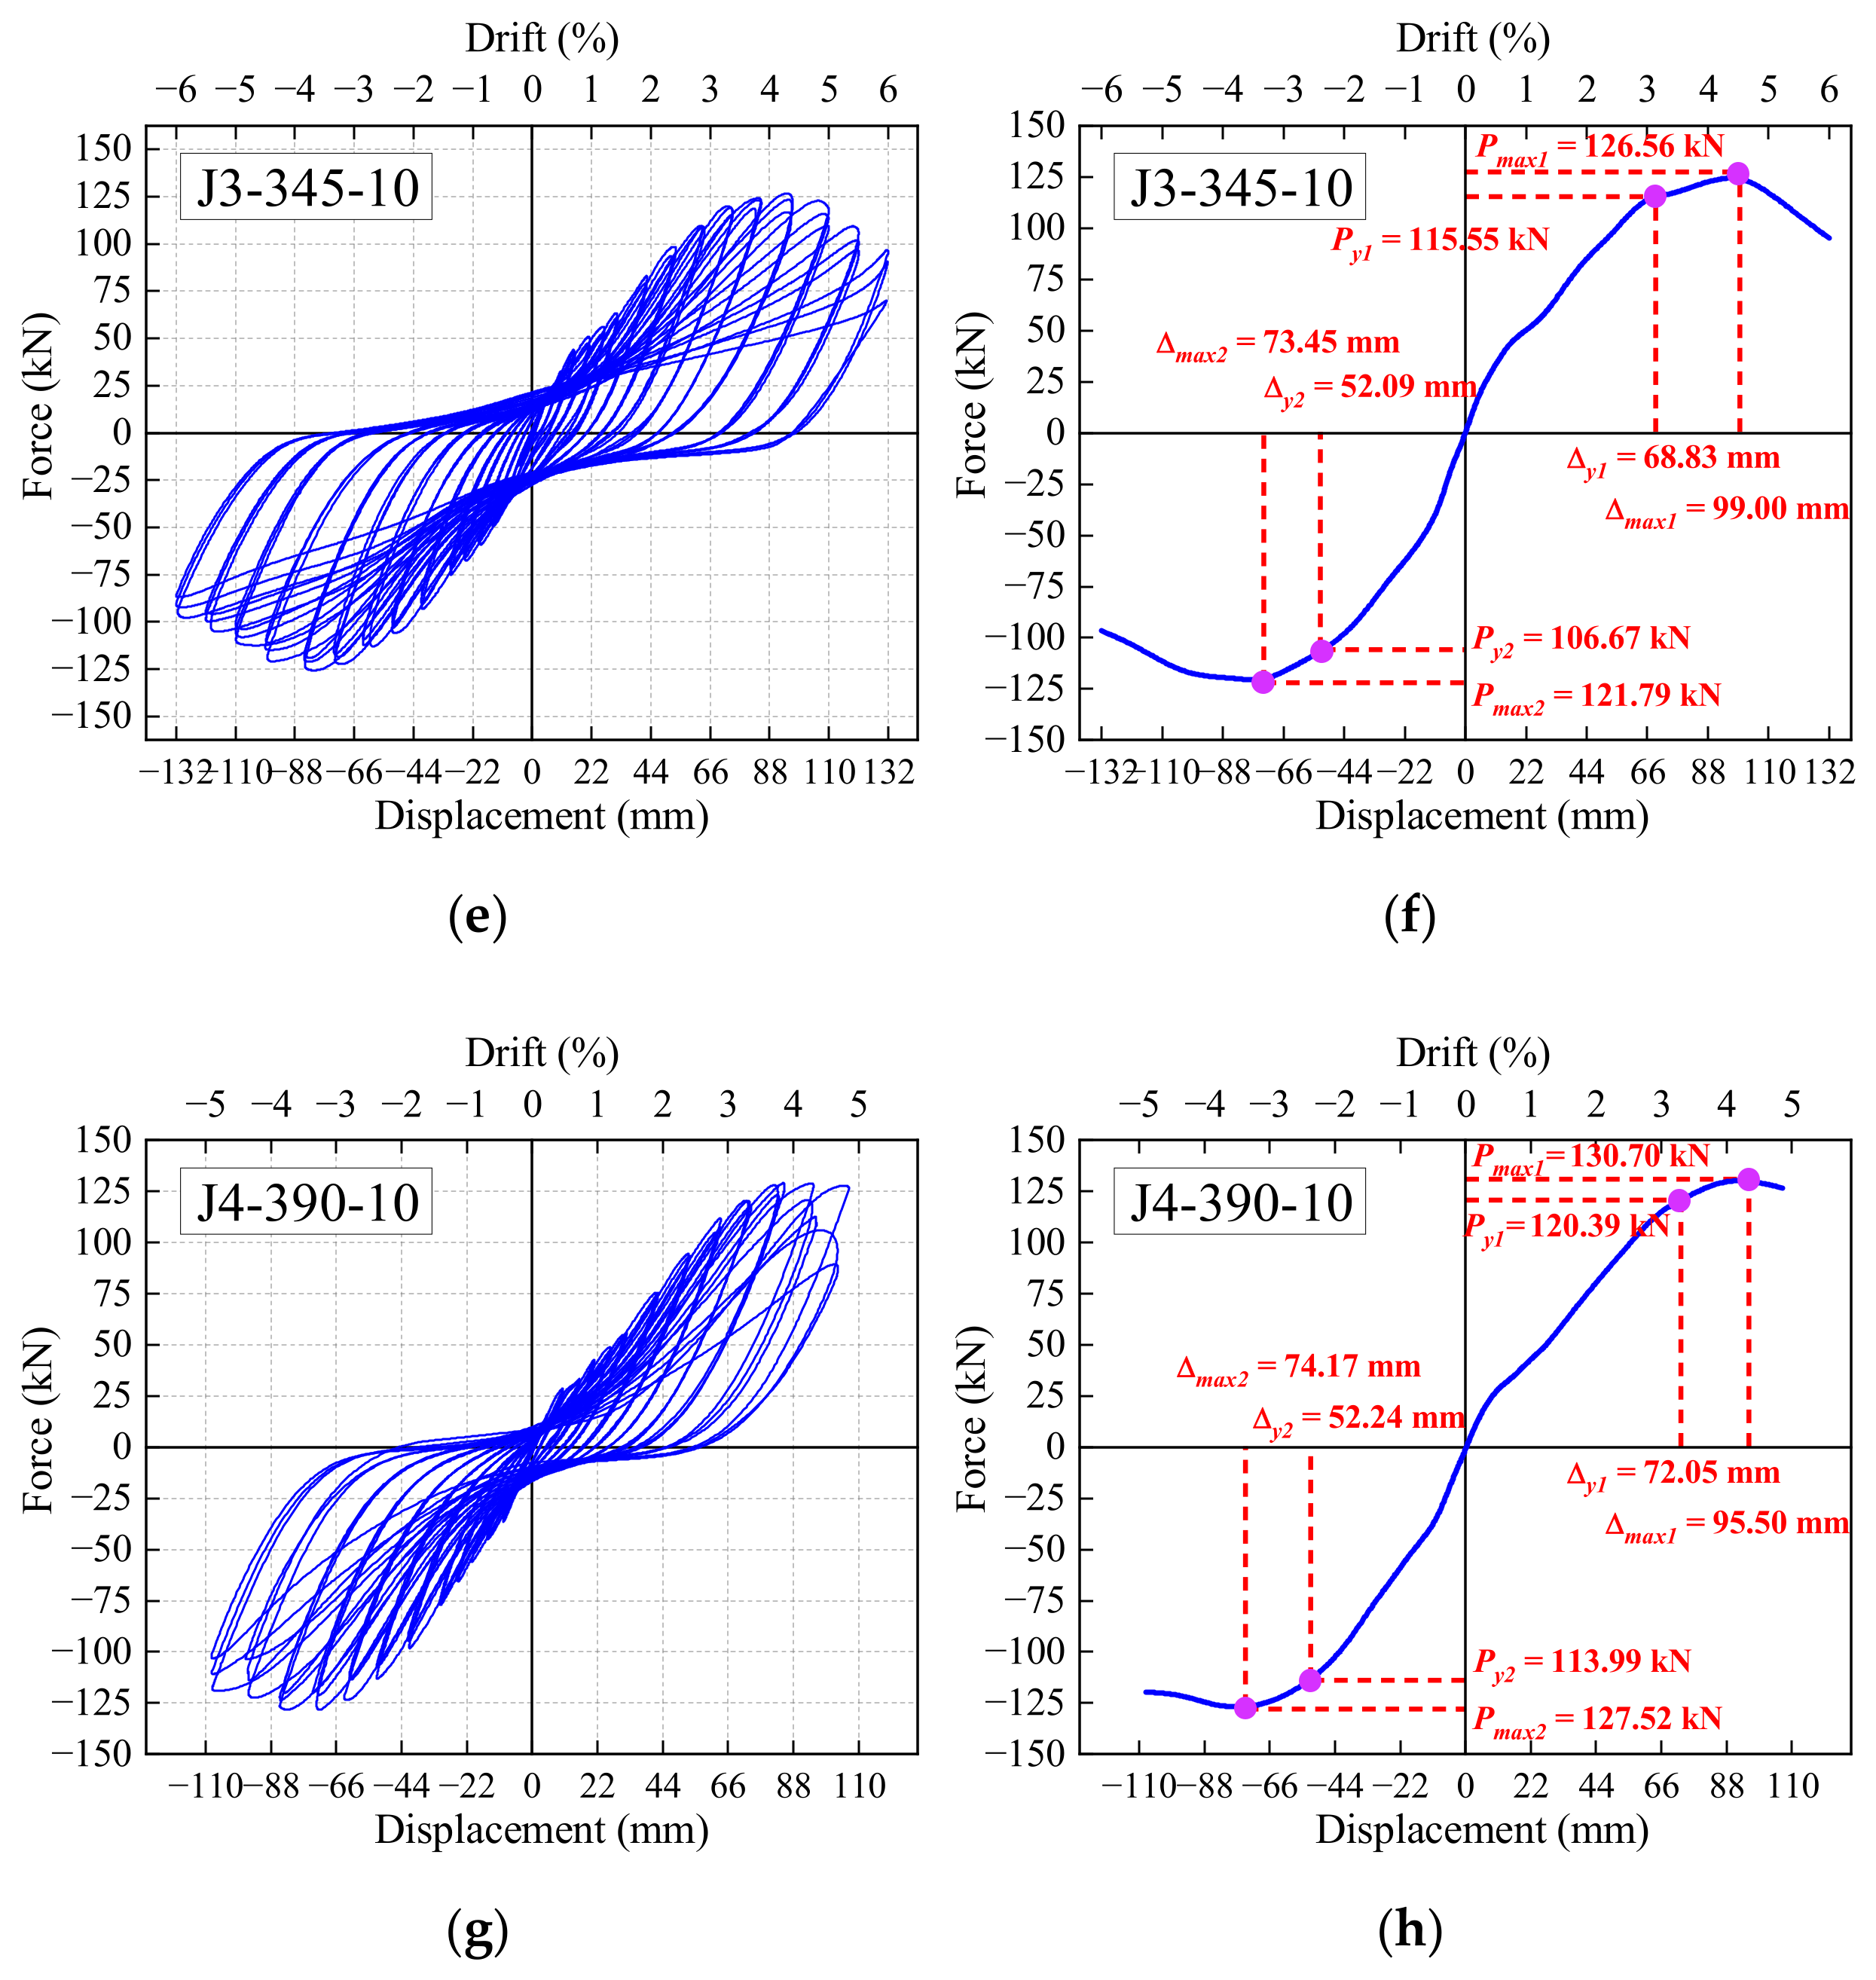
The hysteresis and skeleton curves of PBSEC joints are sorted, as shown in Figure 12. The lower x-axis represents the loading displacement of the test specimens, the upper x-axis represents the interstory displacement angle, and the y-axis is the load at the loading point of the beam. The line connecting the peak points of the first cycle of the hysteresis curve loaded at each stage is the skeleton curve of the joint. The yield load and displacement of the skeleton curve are calculated by the principle of equivalent elastic-plastic energy, and the key points, such as the peak load and the limit displacement, are calculated. The critical points are annotated on the skeleton curves and summarized in Table 5.
Figure 12a shows that the hysteresis curve of the joint J1-235-10 is bow-shaped, with a full shape, showing a high energy dissipation capacity. When the interstory displacement angle reached 1%, the hysteresis loop exhibited linear elastic characteristics. When the loading reached 1.5%, the connecting steel plate began to yield, and the hysteresis loop exhibited the characteristics of a double-fold line. The joints began to enter the plastic deformation stage and dissipate energy. When the load reached 2.5%, the bearing capacity of the joint reached the peak load and then began to decrease. When the displacement angle reached 4%, the bearing capacity of the joint dropped to 85% of the peak load, regarded as joint failure and failure. It can be seen from Figure 12b that the equivalent yield load of joint J1-235-10 was 81.36 kN, and its corresponding positive equivalent yield displacement was 32.71 mm. A peak load of 94.00 kN was achieved, with a corresponding positive peak displacement of 53.80 mm. During the negative loading process, the equivalent yield load of joint J1-235-10 was 72.84 kN, the corresponding negative equivalent yield displacement was 23.57 mm, the peak load was 83.00 kN, and the corresponding negative peak displacement was 43.25 mm. When the positive loading displacement reached 81.94 mm, the bearing capacity of the joint reached 85% of the peak load, and the joint failed.
Figure 12c shows that the hysteresis curve of joint J2-160-10 is also bow-shaped, with a fuller shape. Since joint J2-160-10 adopted the low yield point steel LY160, the hysteresis curve showed good ductility and energy dissipation capacity. When the interstory displacement angle reached 2%, the hysteresis loop exhibited linear elastic characteristics. When the loading reached 3%, the connecting steel plates began to yield, and the hysteresis loop exhibited the characteristics of a double-fold line. The joints began to enter the plastic deformation stage and dissipate energy. The bearing capacity remained stable in the subsequent loading, showing a more extended platform segment. The bearing capacity began to show a slight downward trend until the interstory displacement angle reached 7%. It can be seen from Figure 12d that the equivalent yield load of joint J2-160-10 was 61.69 kN, and its corresponding positive equivalent yield displacement was 59.86 mm. A peak load of 68.05 kN was reached, with a corresponding positive peak displacement of 128.00 mm. During the negative loading process, the equivalent yield load of the joint J2-160-10 was 50.45 kN, and its corresponding negative equivalent yield displacement was 51.38 mm. After the displacement increased, it reached a peak load of 59.78 kN, and the corresponding negative peak displacement was 105.20 mm. There was no failure displacement because the bearing capacity of the joint has no evident decreasing trend during the loading process.
Figure 12e shows that the hysteresis curve of joint J3-345-10 is also bow-shaped, with a fuller shape. Since joint J3-345-10 was made of Q345 steel, the material’s yield point was relatively high, so the hysteresis loop was generally linear elastic. When the interstory displacement angle was loaded to 3%, the bearing capacity of the joint generally increased linearly. When the interstory displacement angle reached 4.5%, the joint reached the peak bearing capacity, and then with the increase of the displacement, the bearing capacity began to decrease. When the interstory displacement angle reached 5.5%, the joint bearing capacity reached 85% of the peak bearing capacity, and the joint was considered damaged and failed at this time. It can be seen from Figure 12f that the equivalent yield load of the joint J3-345-10 was 115.55 kN, and its corresponding positive equivalent yield displacement was 68.83 mm. A peak load of 126.56 kN was reached, with a corresponding positive peak displacement of 99.00 mm. During the negative loading process, the equivalent yield load of the joint J3-345-10 was 106.67 kN, and its corresponding negative equivalent yield displacement was 52.09 mm. After the displacement increased, it reached the peak load of 121.79 kN, and the corresponding negative peak displacement was 73.45 mm. When the positive loading displacement reached 119.69 mm, the joint bearing capacity reached 85% of the peak load, and the joint failed.
Figure 12g shows that the hysteresis curve of joint J4-390-10 is also bow-shaped, with a fuller shape. When the interstory displacement angle was loaded to 4%, the bearing capacity of the joint generally increased linearly. When the interstory displacement angle reached 4.5%, the joint reached the peak bearing capacity and then with the increase of the displacement, the bearing capacity began to decrease. When the interstory displacement angle reached 5%, the bearing capacity of the joint began to drop sharply, and the joint was considered damaged and failed at this time. It can be seen from Figure 12h that the equivalent yield load of joint J4-390-10 was 120.39 kN, and its corresponding positive equivalent yield displacement was 72.05 mm. A peak load of 130.70 kN was reached, with a corresponding positive peak displacement of 95.50 mm. During the negative loading process, the equivalent yield load of the joint J4-390-10 was 113.99 kN, and its corresponding negative equivalent yield displacement was 52.24 mm. After the displacement increased, it reached a peak load of 127.52 kN, and the corresponding negative peak displacement was 74.17 mm. When the positive loading displacement reached 110 mm, the hysteresis loop strength was sharp, the bearing capacity of the degraded joint reached 85% of the peak load, and the joint failed.

5.4. Evaluation of the Performance Indicators

Based on the hysteresis curves, the performance index of the test member can be further calculated for quantitative analysis of the bearing capacity, energy dissipation capacity, and strength degradation capacity of the PBSEC joints, mainly including the average peak load, strength degradation coefficient, single-turn hysteretic energy consumption, hysteretic energy consumption per stage, cumulative hysteretic energy consumption, equivalent viscous damping coefficient and other performance indicators; the detailed comparison can be seen in Figure 13, Figure 14, Figure 15, Figure 16, Figure 17, Figure 18, Figure 19 and Figure 20.

5.4.1. Average Peak Load

The average peak load of the beam-column joint provides a guarantee for the overall structure to bear the external load, so its change trend can be reflected by the average peak load of the hysteresis curve, as shown in Equation (1).
F n = F n + + F n 2
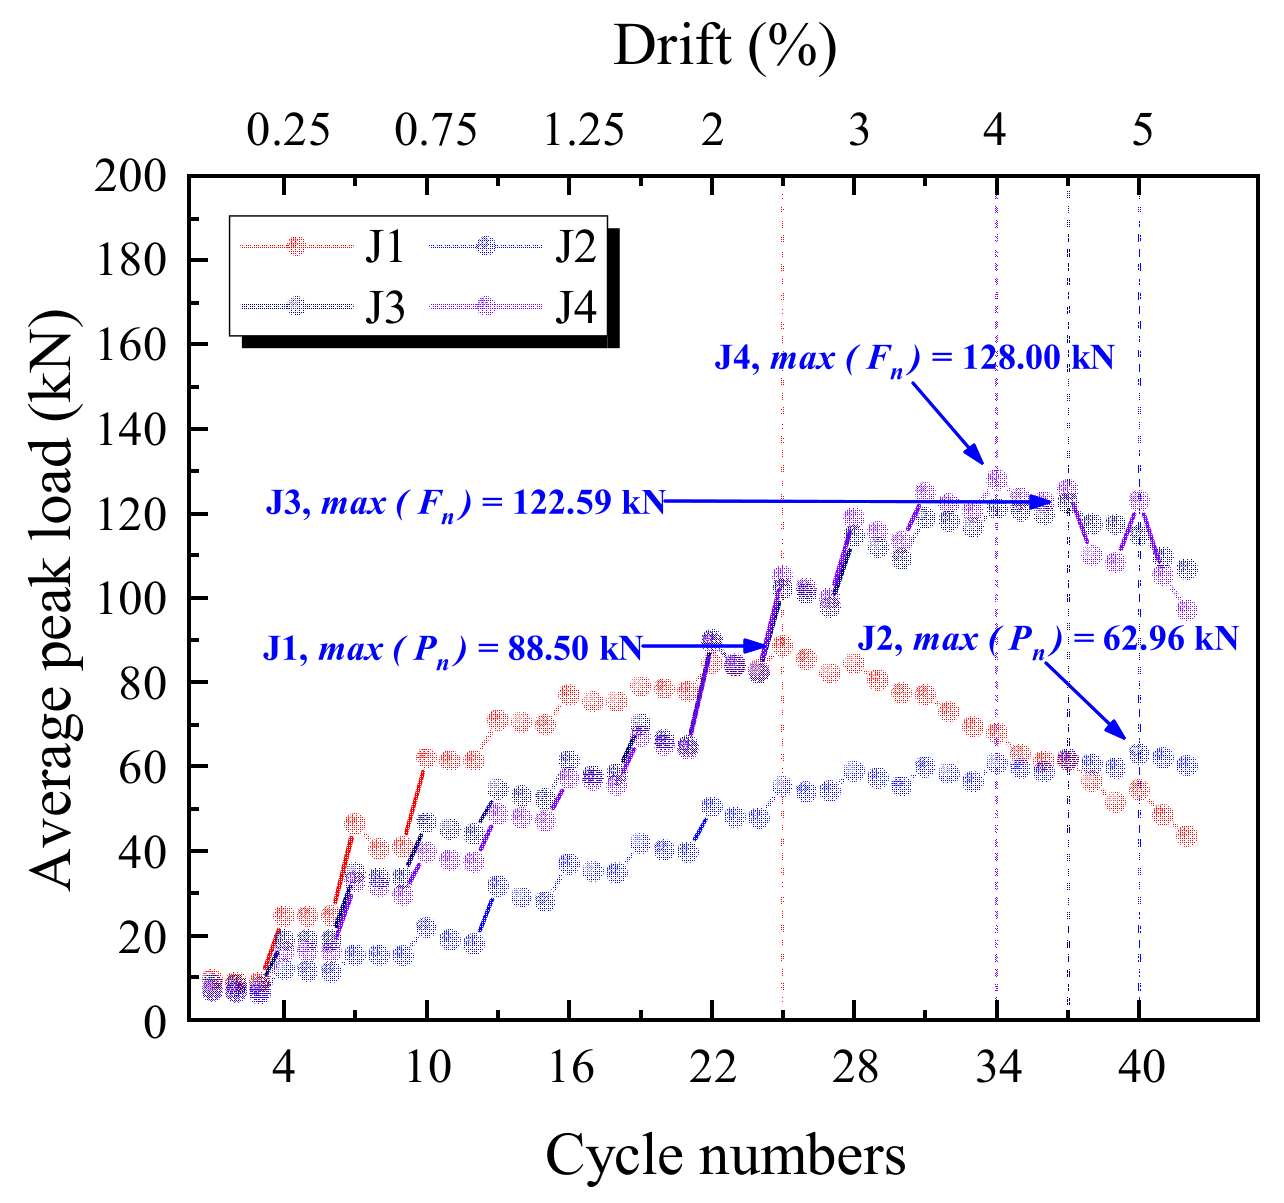
Figure 13 shows the average peak load of the specimens. The maximum average peak load increases with the strength of the connecting steel plates. Among them, the Q390 strength steel used in J4-390-10 has a maximum average load of 128.00 kN, which appears in the 34th cycle of loading. J3-345-10 is made of Q345 steel, with a maximum average load of 122.59 kN, slightly lower than that of J4-390-10, and the two trends are similar. For the Q235 strength steel used in J1-235-10, the joint bearing capacity is significantly reduced to 88.50 kN, and the maximum average peak load appears earlier in the 25th cycle (2.5% interstory displacement angle). J2-160-10 is made of LY160 steel. Although the maximum average peak load is lower than that of J1-235-10, due to better ductility, the average peak load has been slowly rising until the 40th cycle (5% interstory displacement angle) reaches a peak value of 62.96 kN. Overall, the maximum average peak loads at the four specimens are ranked as J4-390-10 > J3-345-10 > J1-235-10 > J2-160-10.
Figure 13. Average peak load.
Buildings 12 01652 g013

5.4.2. Strength Degradation Ratio

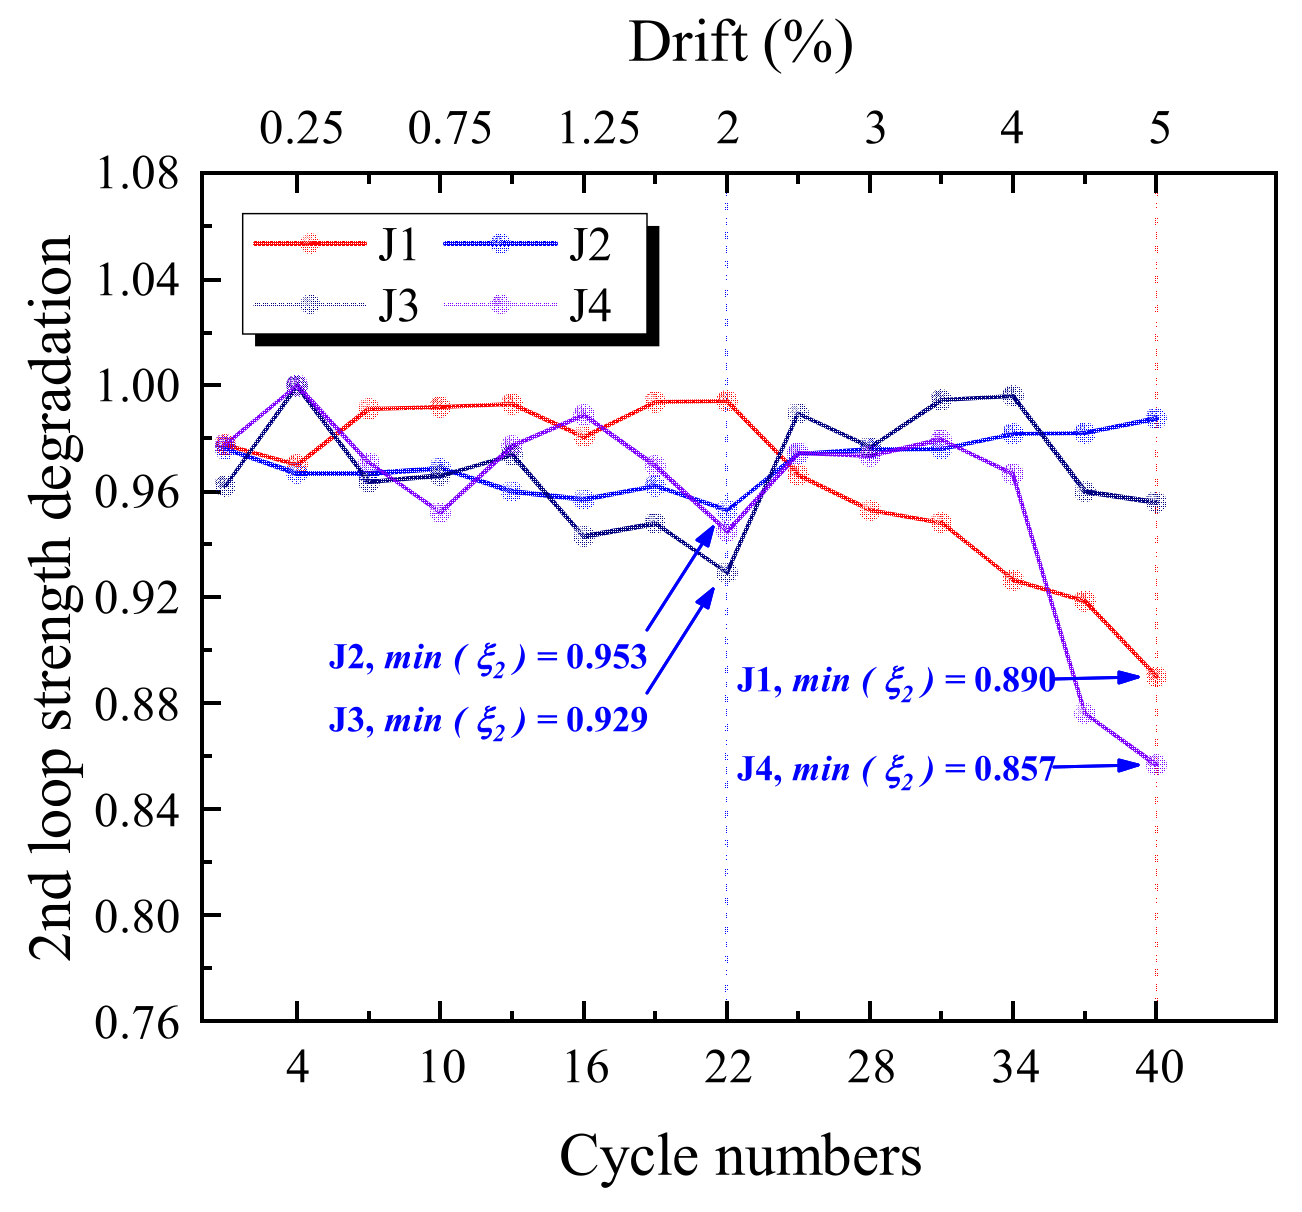
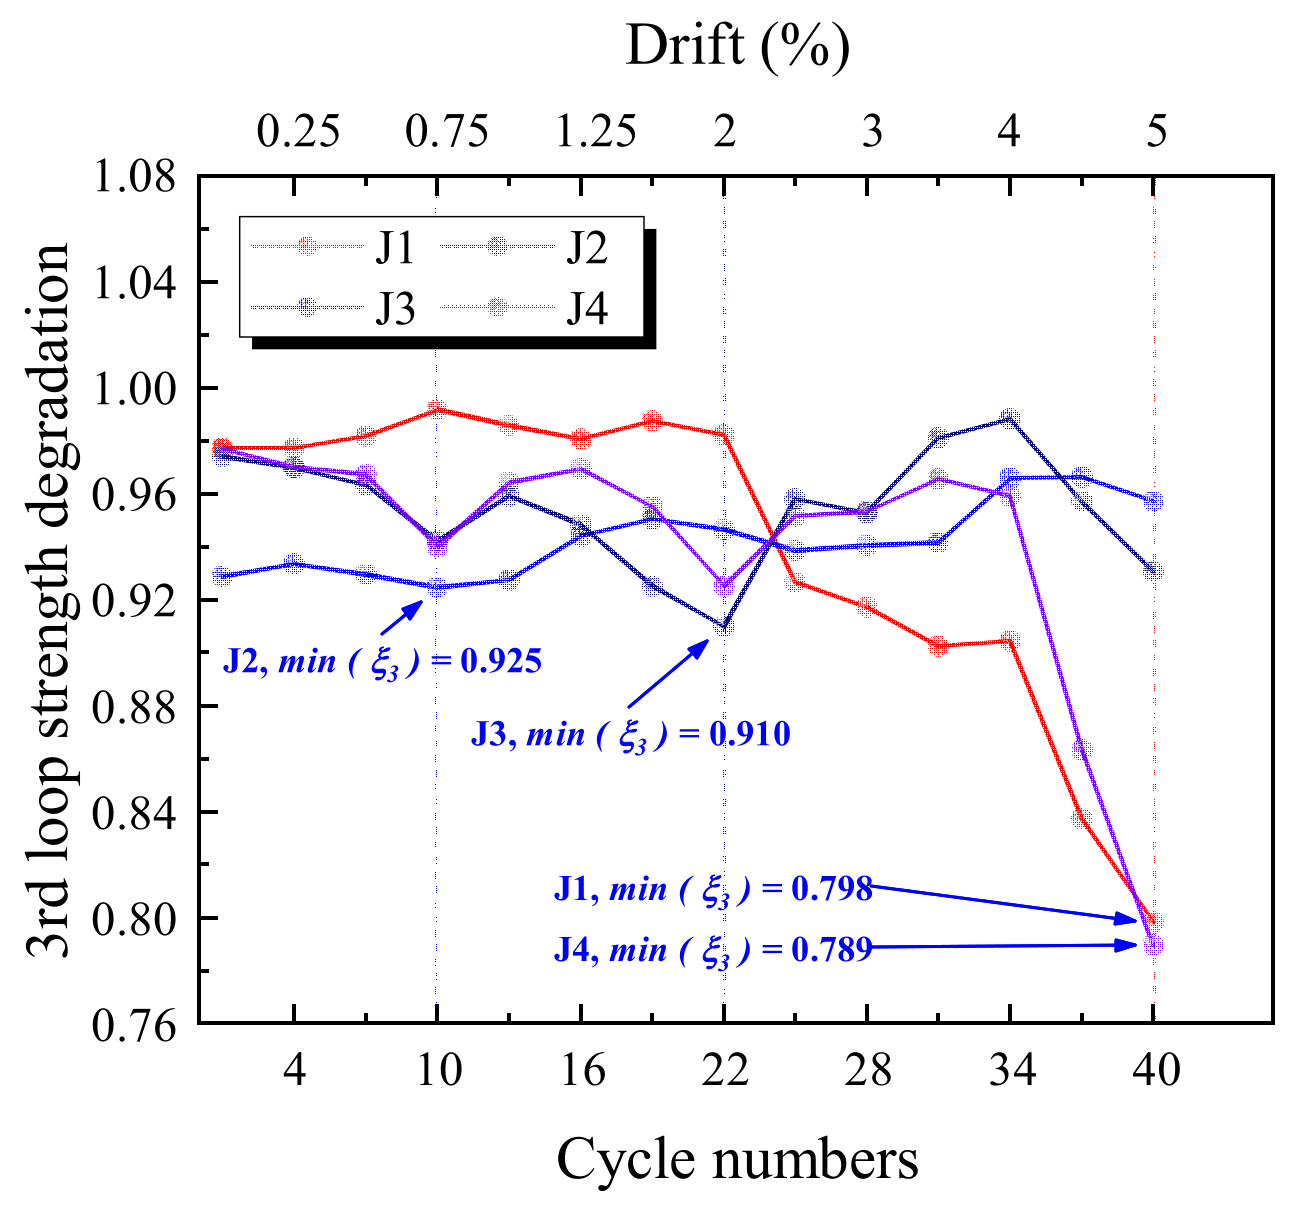
Since the loading pattern of the specimens is three times under each level of displacement, it can be seen from Figure 13 that the average peak loads of the second and third cycles under each displacement are lower than the first cycle. Although the displacement of each loading level is the same, some invisible damage may occur in the test joints, such as the steel plate’s deformation and buckling, the steel bar’s deformation and slip, and the cracking and breaking of the concrete. Under the same displacement level, the bearing capacity of the test specimen is degraded, which can be expressed by the strength degradation coefficient ξ i , which is the ratio of the average peak load of the second or third cycle F j i (i=2,3) and the first cycle F j 1 under each displacement level, as shown in Equation (2), ξ i is the strength degradation coefficient of the specimen in the ith cycle.
ξ i = F j i F j 1 i = 2 , 3
Figure 14 and Figure 15 show the strength degradation coefficients of the second and third loop of the specimens. Overall, the strength degradation coefficient of the third loop is the same as that of the second loop. However, the strength degradation coefficient gradually decreases with the increase in loading cycles and the steel plates yield. The strength degradation coefficients of joints J1-235-10 and J4-390-10 show a sharp drop at 4% of the interstory displacement angle. When the interstory displacement angle is 2%, the joints J2-160-10 and J3-345-10 show a downward trend, which may be due to the buckling of the steel plate at this time, and the bearing capacity of the joints decreases slightly. The order of the second loop strength degradation coefficient is J2-160-10 > J3-345-10> J1-235-10 > J4-390-10, and the order of the third loop strength degradation coefficient is J2-160-10 > J3-345-10 > J1-235-10 > J4-390-10.
Figure 14. 2nd loop strength degradation coefficient.
Buildings 12 01652 g014
Figure 15. 3rd loop strength degradation coefficient.
Buildings 12 01652 g015

5.4.3. Energy Dissipation Indicators
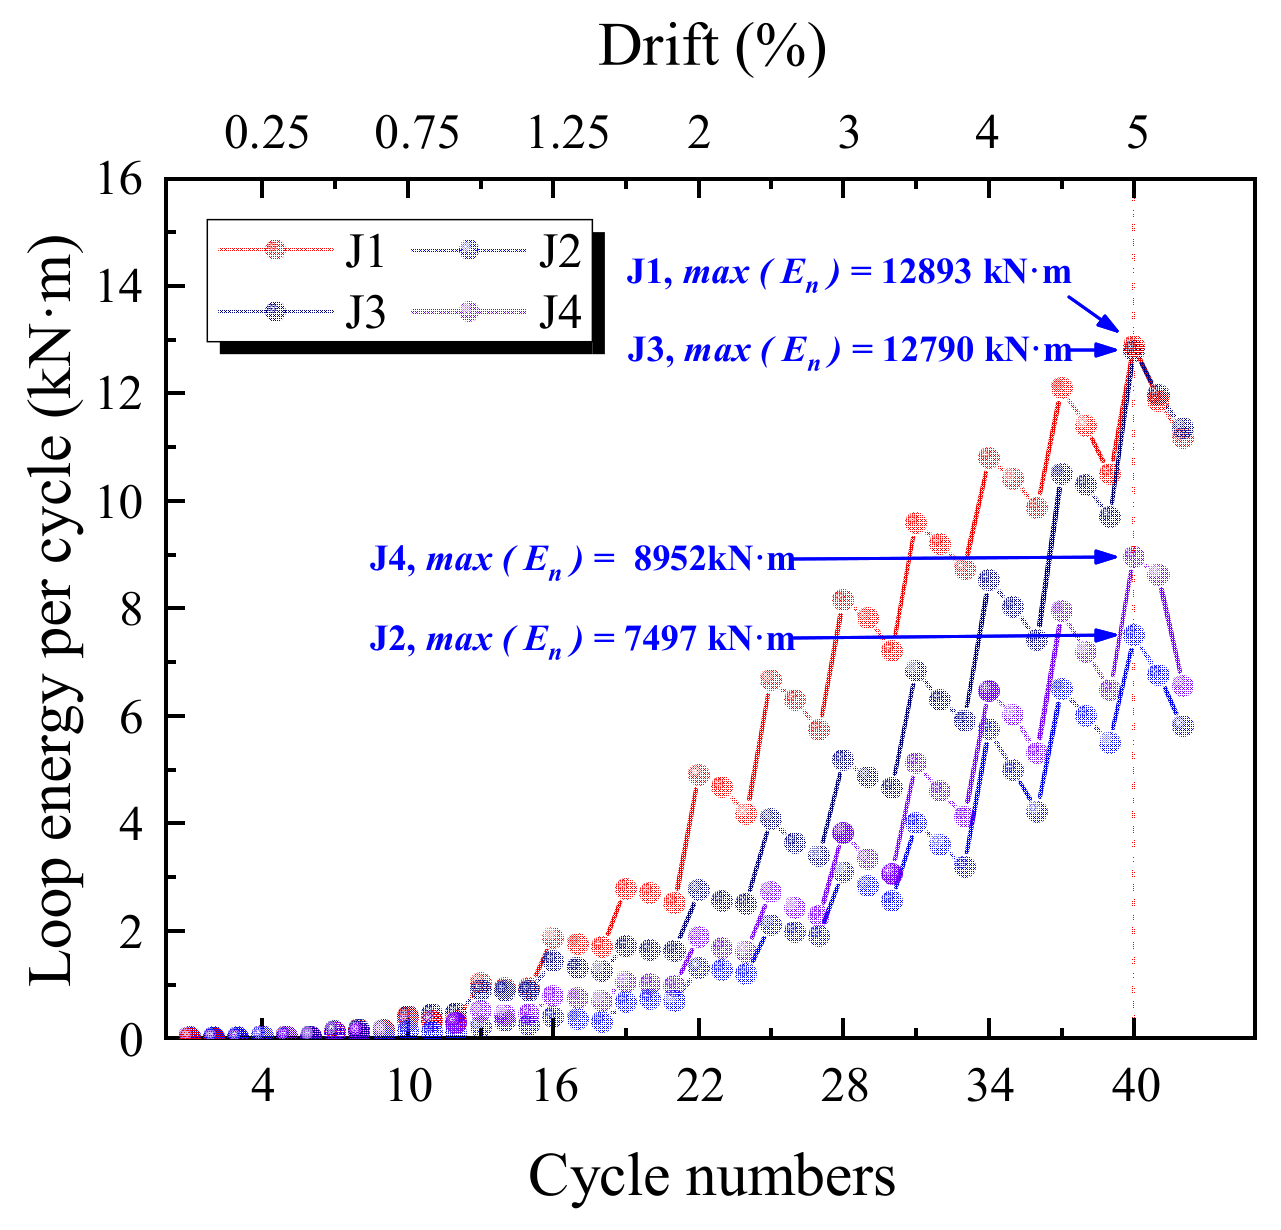
Structural components will be deformed and damaged under the earthquake. In the PBSEC joints, the energy dissipation is mainly through the deformation of the connecting steel plates. Therefore, the energy dissipation capacity of the structure is an essential indicator for evaluating the performance level of the joints. The primary energy dissipation indicators are loop energy per cycle E n , loop energy per level E j , cumulative energy E c , and equivalent viscous damping coefficient E c .
In the hysteresis curve, the area enclosed by the load and the displacement during the nth loading cycle is E n , the area enclosed by the three cycles under each loading displacement level is E j , and the accumulation area of each level is E c , as shown in Equations (3)–(5).
E n = F d Δ
E n = F d Δ
E c = j E j
Figure 16 reflects the loop energy per cycle E n of the specimens. It can be seen that the maximum E n occurs in the last loading level for all the joints. Although the hysteresis curve of J2-160-10 is full, due to the use of low yield point steel, the area of the hysteresis loop is minimal. The order of E n is J1-235-10 > J3-345-10 > J4-390-10 > J2-160-10.
Figure 17 reflects the loop energy per level E j of the specimens. It can be seen that the changing trend of E j is roughly the same as E n . The maximum loop energy per level of joints J1-235-10 and J3-345-10 are relatively close. It is also the best performance among the four joints, while loop energy per level of joint J2-160-10 is the lowest, and joint J4-390-10 is between J2-160-10 and J1-235-10. The order of loop energy per level is J1-235-10 ≈ J3-345-10 > J4-390-10 > J2-160-10.
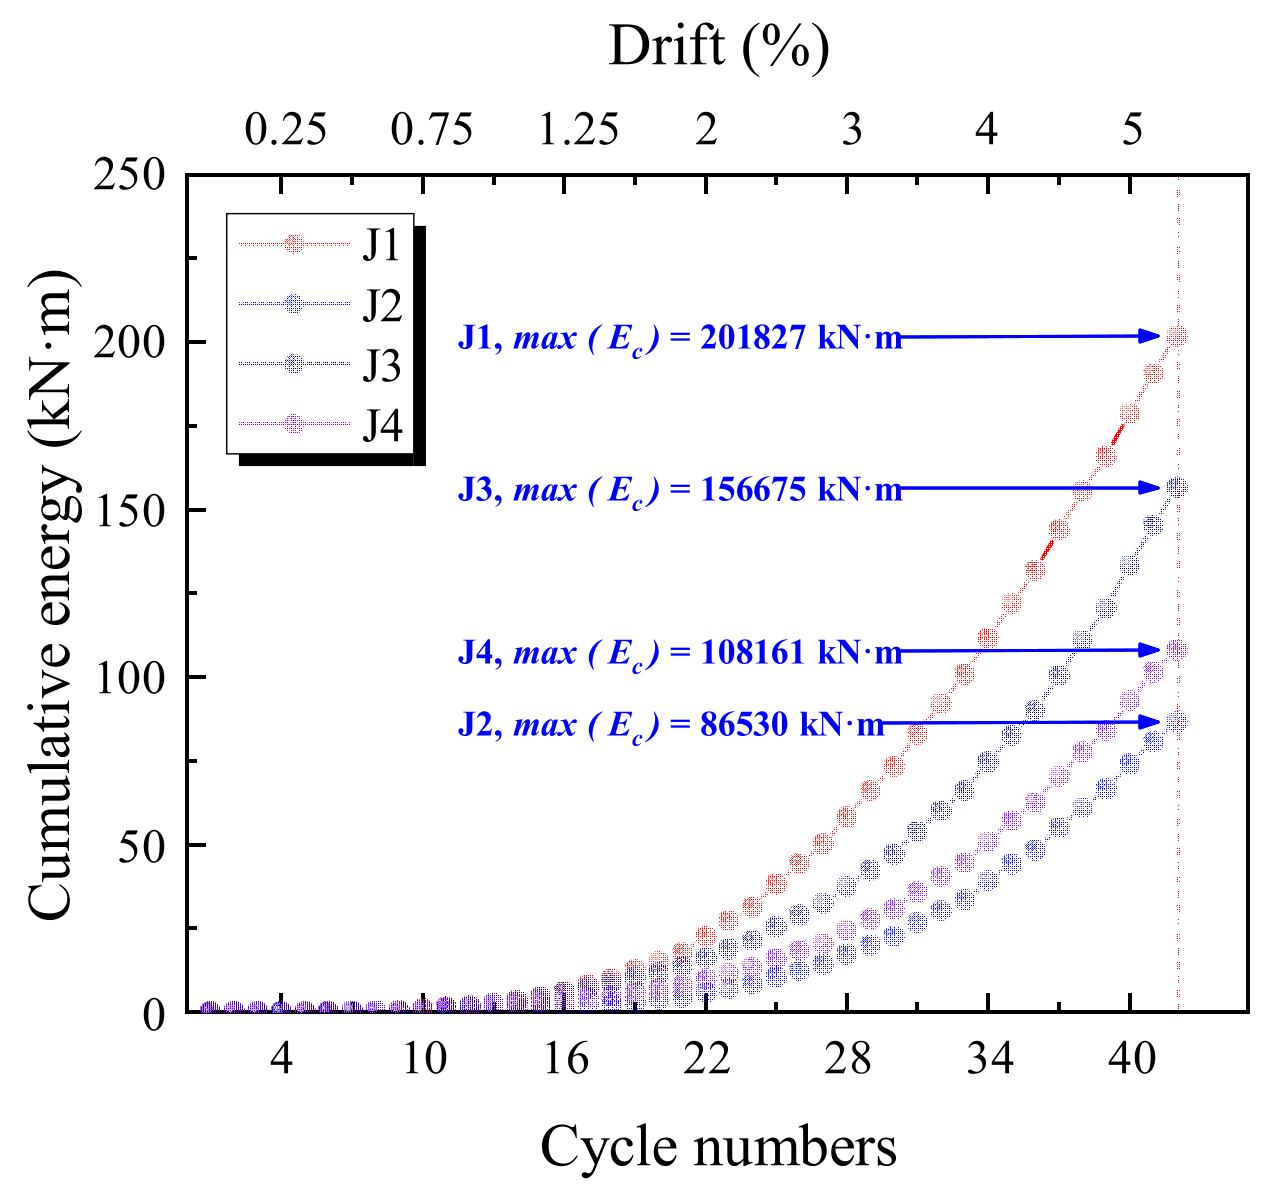
Figure 18 reflects the cumulative energy E c , of the above joints. It can be seen that the E c of joint J1-235-10 is the highest among the specimens, showing excellent energy consumption performance. Although the maximum loop energy per cycle of joint J3-345-10 is relatively close to joint J1-235-10, after comprehensively accumulating the energy consumption of each circle, the maximum cumulative energy of J3-345-10 is approximately 28% lower than that of J1-235-10, while the cumulative energy of J2-160-10 is the lowest, and J4-390-10 is between J2-160-10 and J3-345-10. The order of cumulative energy consumption is J1-235-10 > J3-345-10 > J4-390-10 > J2-160-10.
Figure 16. Loop energy per cycle.
Buildings 12 01652 g016
Figure 17. Loop energy per level.
Buildings 12 01652 g017
Figure 18. Cumulative energy.
Buildings 12 01652 g018
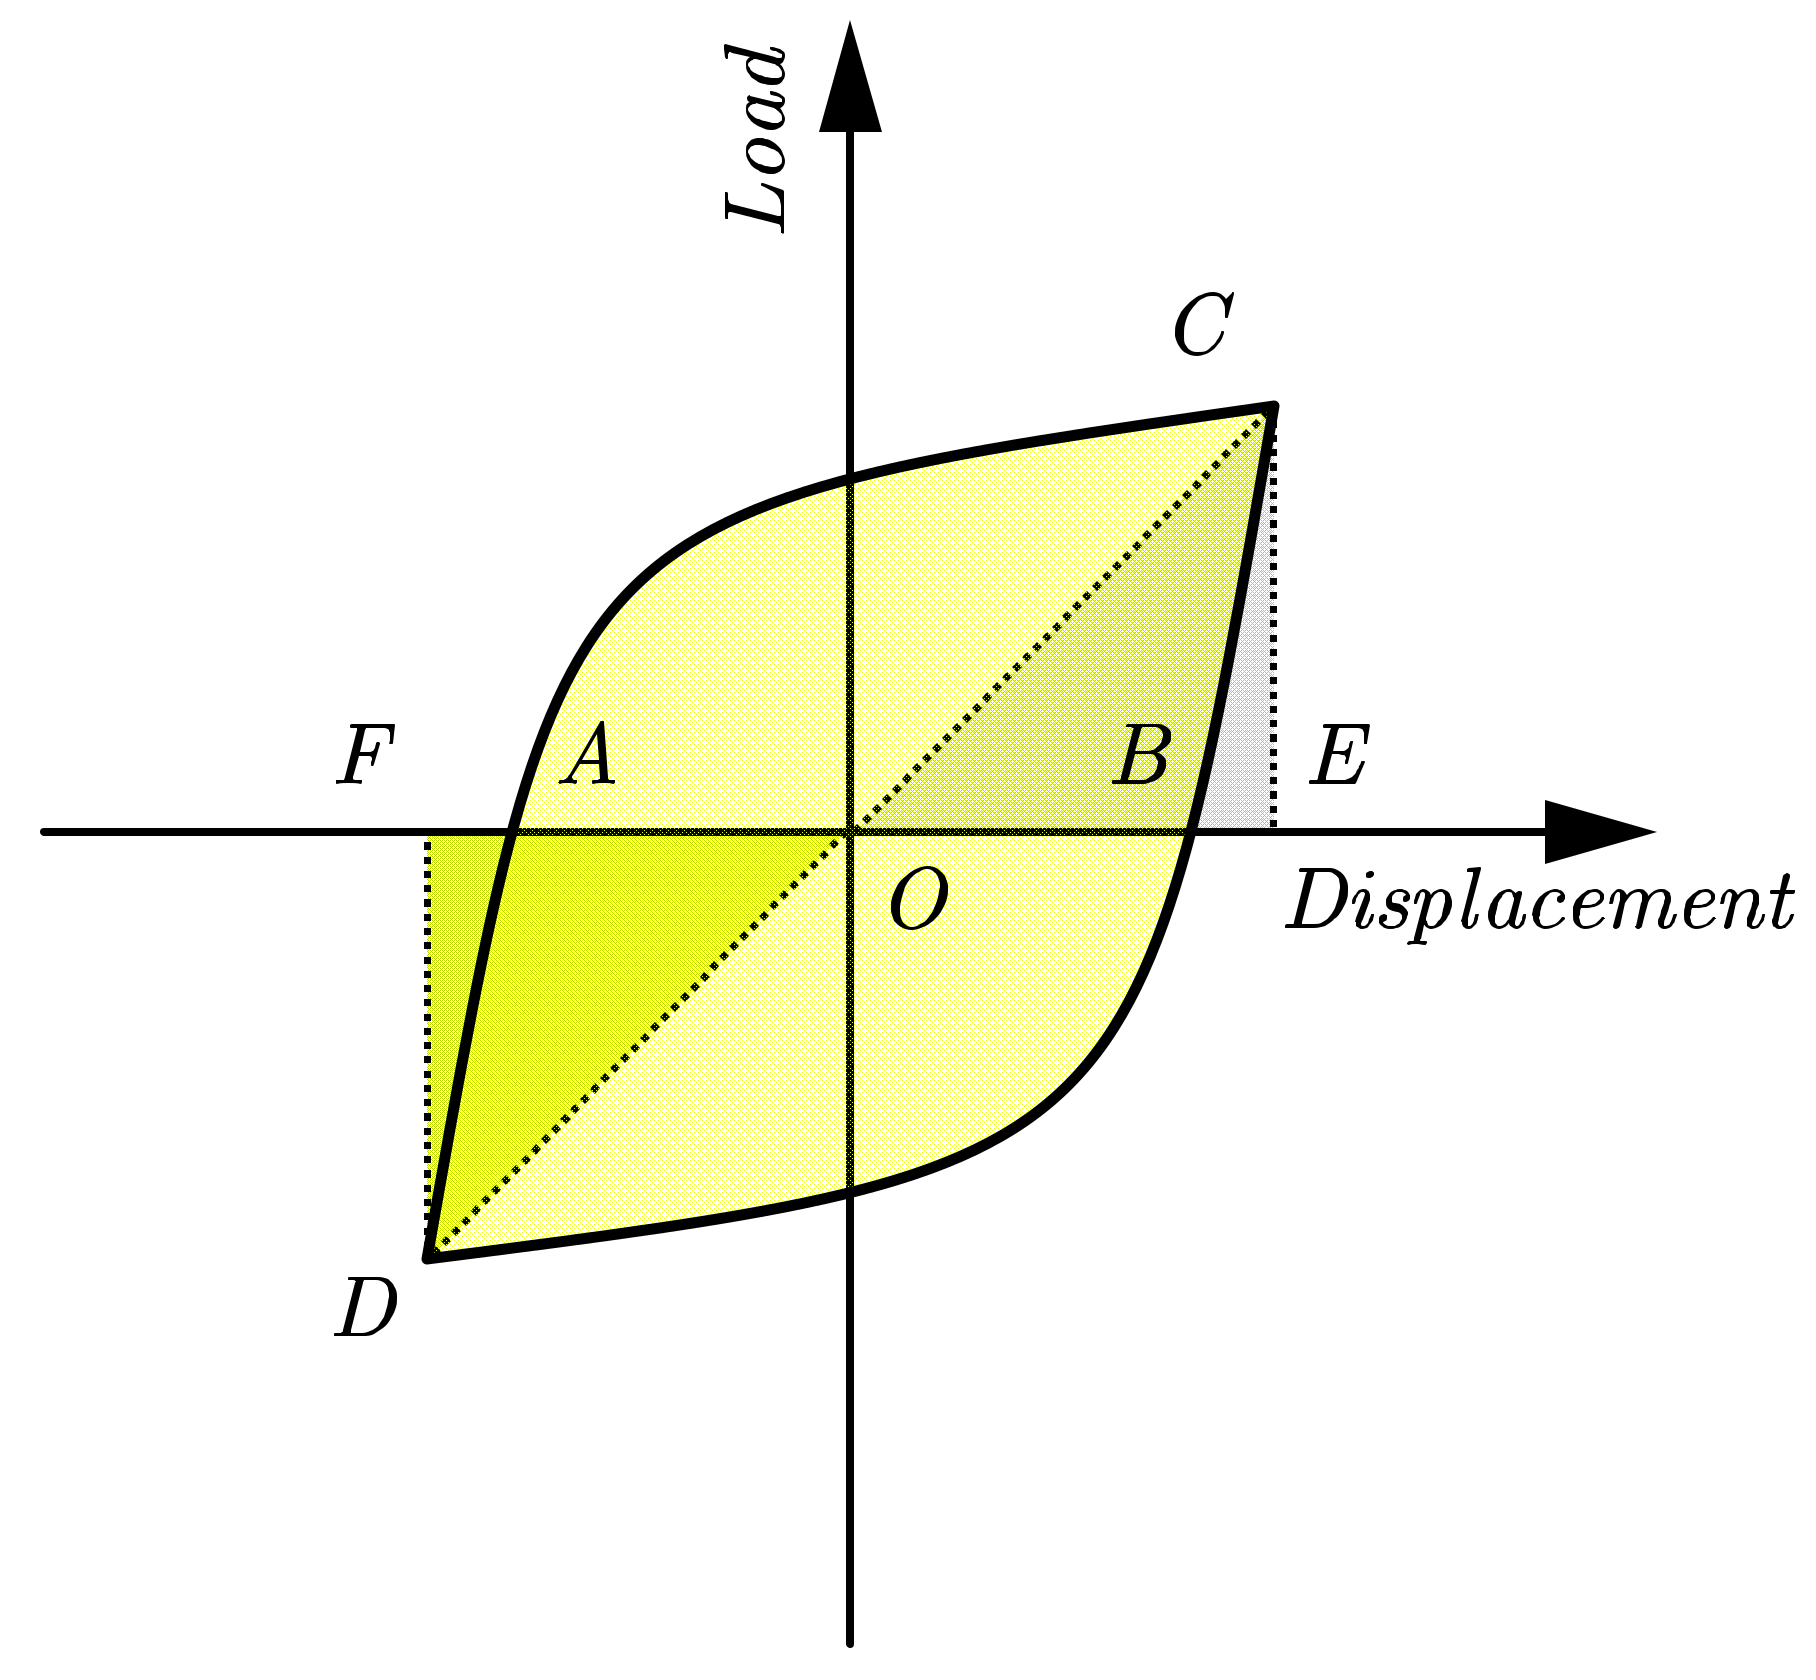
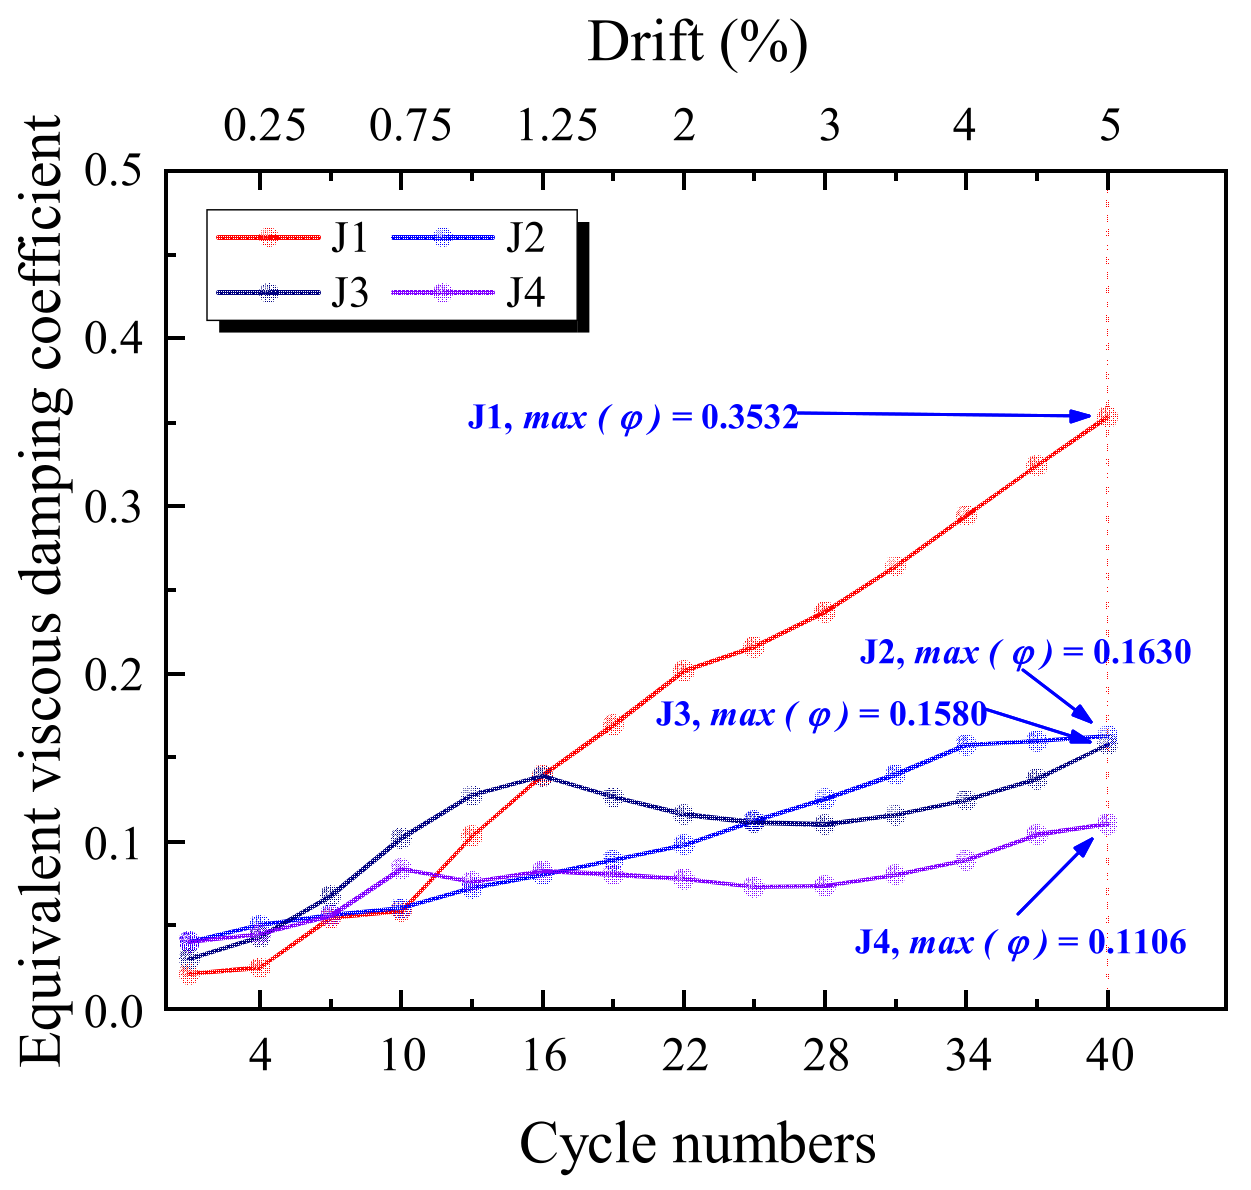
The above three energy consumption indicators can preliminarily evaluate the energy consumption capacity of the joints. However, they can only reflect the area size of the hysteresis loop, that is, the change of the energy consumption value. In contrast, the shape parameters of the hysteresis loop need to be reflected by the equivalent viscous damping coefficient, which reflects the degree of change in the energy dissipation capacity of the test joint due to stiffness degradation during the loading process. The equivalent viscous damping coefficient can be calculated according to Figure 19 and Equation (6). It can be seen from Figure 20 that the equivalent viscous damping coefficients of the specimens all increased gradually with the loading and finally reached the peak at the 40th cycle. Their maximum values were 0.3532, 0.1630, 0.1580, and 0.1106, respectively. The equivalent viscous damping coefficient of J1-235-10 raised the fastest and was also the largest value among the four joints, which means the energy consumption performance of J1-235-10 is the best. However, due to the high yield strength of the connecting steel plates, the equivalent viscous damping coefficient of J4-390-10 was the lowest among the specimens. The order of the equivalent viscous damping coefficient is J1-235-10 > J2-1160-10 >J3-345-10 > J4-390-10.
φ = S A B C + B D A 2 π S Δ O C E + Δ O D F
Figure 19. Typical hysteresis loop diagram.
Buildings 12 01652 g019
Figure 20. Equivalent viscous damping coefficient.
Buildings 12 01652 g020

6. Conclusions

This paper introduces a new dry-connected concrete beam-column joint—precast bolt-connected steel-members end-embedded concrete (PBSEC) beam-column connection. The precast beam and column end of the joint are pre-embedded with formed steel during prefabrication in the factory and connected by high-strength bolts. A steel pin connects the center of the joint to bear the shear force of the beam end. The research in this paper mainly studies this type of joint from the experiment. It mainly shows a series of joint mechanical characteristics and seismic performance from the aspects of joint structure, test scheme, test observations, hysteresis curve analysis, and performance index analysis. Based on four test specimens, low-cycle reversed load tests were carried out to obtain the failure mode, hysteresis curve, skeleton curve, stiffness, ductility, deformation capacity, and other test data, and the following conclusions can be drawn:
(1)
Component construction: This structure has a simple form and a clear force path. The material properties of the connecting steel plates are changed to optimize the seismic performance of the joints, and the performance repair after structural damage can be achieved by replacing the connecting steel plates. There is no wet work in the assembly process, and all-dry construction and assembly methods are used. During construction, only the beams and columns need to be assembled by high-strength bolts. There is no need to pour concrete and support formwork, which significantly improves construction efficiency, reflecting the convenience and efficiency of dry connection construction;
(2)
Failure mode: This paper observes and analyzes the failure mode of the PBSEC joints, the buckling failure of the connecting steel plate, which is the ideal failure mode. When the structure is subjected to earthquake action, the connecting steel plate of the joint resists the bending moment brought by the earthquake action, resulting in damage while the beam and column are still in an elastic state. When the connecting steel plate of the joint yields further and buckles, the stiffness of the joint changes from the semi-rigid feature to zero, which can be regarded as a hinge. The structure is in the ideal state when the beam end is hinged, and the seismic capacity and collapse resistance of the structure is obtained;
(3)
Seismic performance: The hysteresis curves of the PBSEC joints do not have slip characteristics. They are bow-shaped and full in shape, showing high energy dissipation capacity. The bearing capacity of the joints begins to rise rapidly at the initial loading stage and then decreases slowly after reaching the peak, which is an ideal shape. By summarizing the average peak load, strength degradation coefficient, loop energy per cycle, loop energy per level, cumulative energy and equivalent viscous damping coefficient, it is found that the energy dissipation capacity of joint J1-235-10 is better than other joints, reflecting its excellent energy dissipation performance, indicating that the joint using 10 mm thick Q235 steel can obtain the most suitable failure mode and obtain the best energy dissipation performance. When the strength of the steel plate material increases, the energy dissipation performance of the joint drops.

Author Contributions

Conceptualization, Z.W.; methodology, Z.W., D.-C.F. and G.W.; formal analysis, Z.W. and D.-C.F.; investigation, Z.W.; resources, D.-C.F. and G.W.; data curation, Z.W. and D.-C.F.; writing—original draft preparation, Z.W.; writing–review and editing, D.-C.F. and G.W.; supervision, D.-C.F. and G.W.; project administration, D.-C.F. and G.W.; funding acquisition, D.-C.F. and G.W. All authors have read and agreed to the published version of the manuscript.

Funding

This research was funded by the National Natural Science Foundation of China (Grant Nos. 52078119, 51838004) and the Postgraduate Research & Practice Innovation Program of Jiangsu Province (Grant No. KYCX18_0120).

Data Availability Statement

All datasets presented in this study are included in the article.

Conflicts of Interest

The authors declare no conflict of interest.

References

  1. Priestley, M.J.N.; Tao, J.R. Seismic Response of Precast Prestressed Concrete Frames with Partially Debonded Tendons. PCI J. 1993, 38, 58–69. [Google Scholar] [CrossRef]
  2. Priestley, M.J.N.; Macrae, G.A. Seismic Tests of Precast Beam-to-Column Joint Subassemblages With Unbonded Tendons. PCI J. 1996, 41, 64–81. [Google Scholar] [CrossRef] [Green Version]
  3. Englekirk, R.E. Development and Testing of a Ductile Connector for Assembling Precast Concrete Beams and Columns. PCI J. 1995, 40, 36–51. [Google Scholar] [CrossRef]
  4. Guo, T.; Xu, Z.; Song, L.; Wang, L.; Zhang, Z. Seismic resilience upgrade of RC frame building using self-centering concrete walls with distributed friction devices. J. Struct. Eng. 2017, 143, 4017160. [Google Scholar] [CrossRef]
  5. Wang, C.; Liu, Y.; Zheng, X.; Wu, J. Experimental investigation of a precast concrete connection with all-steel bamboo-shaped energy dissipaters. Eng. Struct. 2019, 178, 298–308. [Google Scholar] [CrossRef]
  6. Wang, C.; Liu, Y.; Zhou, L. Experimental and numerical studies on hysteretic behavior of all-steel bamboo-shaped energy dissipaters. Eng. Struct. 2018, 165, 38–49. [Google Scholar] [CrossRef]
  7. Cosgun, T.; Cosgun, C.; Kanishka, A.; Mangir, A.; Sayin, B.; Murat Türk, A. Seismic load tests on exterior beam-column connections of existing RC structures. Građevinar 2019, 71, 1129–1141. [Google Scholar]
  8. Cheok, G.S.; Stone, W.C.; Kunnath, S.K. Seismic Response of Precast Concrete Frames with Hybrid Connections. Aci. Struct. J. 1998, 95, 527–539. [Google Scholar]
  9. Morgen, B.G.; Kurama, Y.C. Seismic Design of Friction-Damped Precast Concrete Frame Structures. J. Struct. Eng. 2007, 133, 1501–1511. [Google Scholar] [CrossRef]
  10. Huang, L.; Zhou, Z.; Zhang, Z.; Huang, X. Seismic Performance and Fragility Analyses of Self-Centering Prestressed Concrete Frames with Infill Walls. J. Earthq. Eng. 2021, 25, 535–565. [Google Scholar] [CrossRef]
  11. Cao, X.; Xiong, C.; Feng, D.; Wu, G. Dynamic and probabilistic seismic performance assessment of precast prestressed reinforced concrete frames incorporating slab influence through three-dimensional spatial model. B. Earthq. Eng. 2022, 20, 6705–6739. [Google Scholar] [CrossRef]
  12. Cao, X.; Feng, D.; Wang, Z.; Wu, G. Parametric investigation of the assembled bolt-connected buckling-restrained brace and performance evaluation of its application into structural retrofit. J. Build. Eng. 2022, 48, 103988. [Google Scholar] [CrossRef]
  13. Cao, X.; Shen, D.; Feng, D.; Wang, C.; Qu, Z.; Wu, G. Seismic retrofitting of existing frame buildings through externally attached sub-structures: State of the art review and future perspectives. J. Build. Eng. 2022, 57, 104904. [Google Scholar] [CrossRef]
  14. Wang, C.; Usami, T.; Funayama, J.; Imase, F. Low-cycle fatigue testing of extruded aluminium alloy buckling-restrained braces. Eng. Struct. 2013, 46, 294–301. [Google Scholar] [CrossRef]
  15. Ersoy, U.; Tankut, T. Precast concrete members with welded plate connections under reversed cyclic loading. PCI J. 1993, 38, 94–100. [Google Scholar] [CrossRef]
  16. Ertas, O.; Ozden, S.; Ozturan, T. Ductile Connections in Precast Concrete Moment Resisting Frames. PCI J. 2006, 51, 66–76. [Google Scholar] [CrossRef]
  17. Kim, J.H.; Cho, Y.S.; Lee, K.H. Structural performance evaluation of circular steel bands for PC column–beam connection. Mag. Concrete Res. 2013, 65, 1377–1384. [Google Scholar] [CrossRef]
  18. Feng, D.; Wang, Z.; Cao, X.; Wu, G. Damage mechanics-based modeling approaches for cyclic analysis of precast concrete structures: A comparative study. Int. J. Damage Mech. 2020, 29, 965–987. [Google Scholar] [CrossRef]
  19. Feng, D.; Wu, G.; Lu, Y. Numerical investigation on the progressive collapse behavior of precast reinforced concrete frame subassemblages. J. Perform. Constr. Fac. 2018, 32, 4018027. [Google Scholar] [CrossRef] [Green Version]
  20. Feng, D.C.; Wang, Z.; Wu, G. Progressive collapse performance analysis of precast reinforced concrete structures. Struct. Des. Tall Spec. Build. 2019, 28, e1588. [Google Scholar] [CrossRef]
  21. Feng, D.; Wu, G.; Lu, Y. Finite element modelling approach for precast reinforced concrete beam-to-column connections under cyclic loading. Eng. Struct. 2018, 174, 49–66. [Google Scholar] [CrossRef] [Green Version]
  22. Feng, D.; Xiong, C.; Brunesi, E.; Parisi, F.; Wu, G. Numerical Simulation and Parametric Analysis of Precast Concrete Beam-Slab Assembly Based on Layered Shell Elements. Buildings 2020, 11, 7. [Google Scholar] [CrossRef]
  23. Brunesi, E.; Nascimbene, R.; Parisi, F.; Augenti, N. Progressive collapse fragility of reinforced concrete framed structures through incremental dynamic analysis. Eng. Struct. 2015, 104, 65–79. [Google Scholar] [CrossRef]
  24. GB/T 228.1-2010; Metallic Materials-Tensile Testing-Part 1: Method of Test at Room Temperature. Standardization Administration of the People’s Republic of China: Beijing, China, 2010.
  25. GB/T 50081-2002; Standard for Test Method of Mechanical Properties on Ordinary Concrete. Ministry of Housing and Urban-Rural Development of the People’s Republic of China: Beijing, China, 2002.
  26. JGJ/T101‐2015; Specification of Testing Methods for Earthquake Resistant Building. Ministry of Housing and Urban-Rural Development of the People’s Republic of China: Beijing, China, 2015.
  27. Cao, X.; Wu, G.; Feng, D.; Zu, X. Experimental and numerical study of outside strengthening with precast bolt-connected steel plate–reinforced concrete frame-brace. J. Perform. Constr. Fac. 2019, 33, 4019077. [Google Scholar] [CrossRef]
  28. Fan, J.; Wu, G.; Feng, D.; Zeng, Y.; Lu, Y. Seismic performance of a novel self-sustaining beam-column connection for precast concrete moment-resisting frames. Eng. Struct. 2020, 222, 111096. [Google Scholar] [CrossRef]
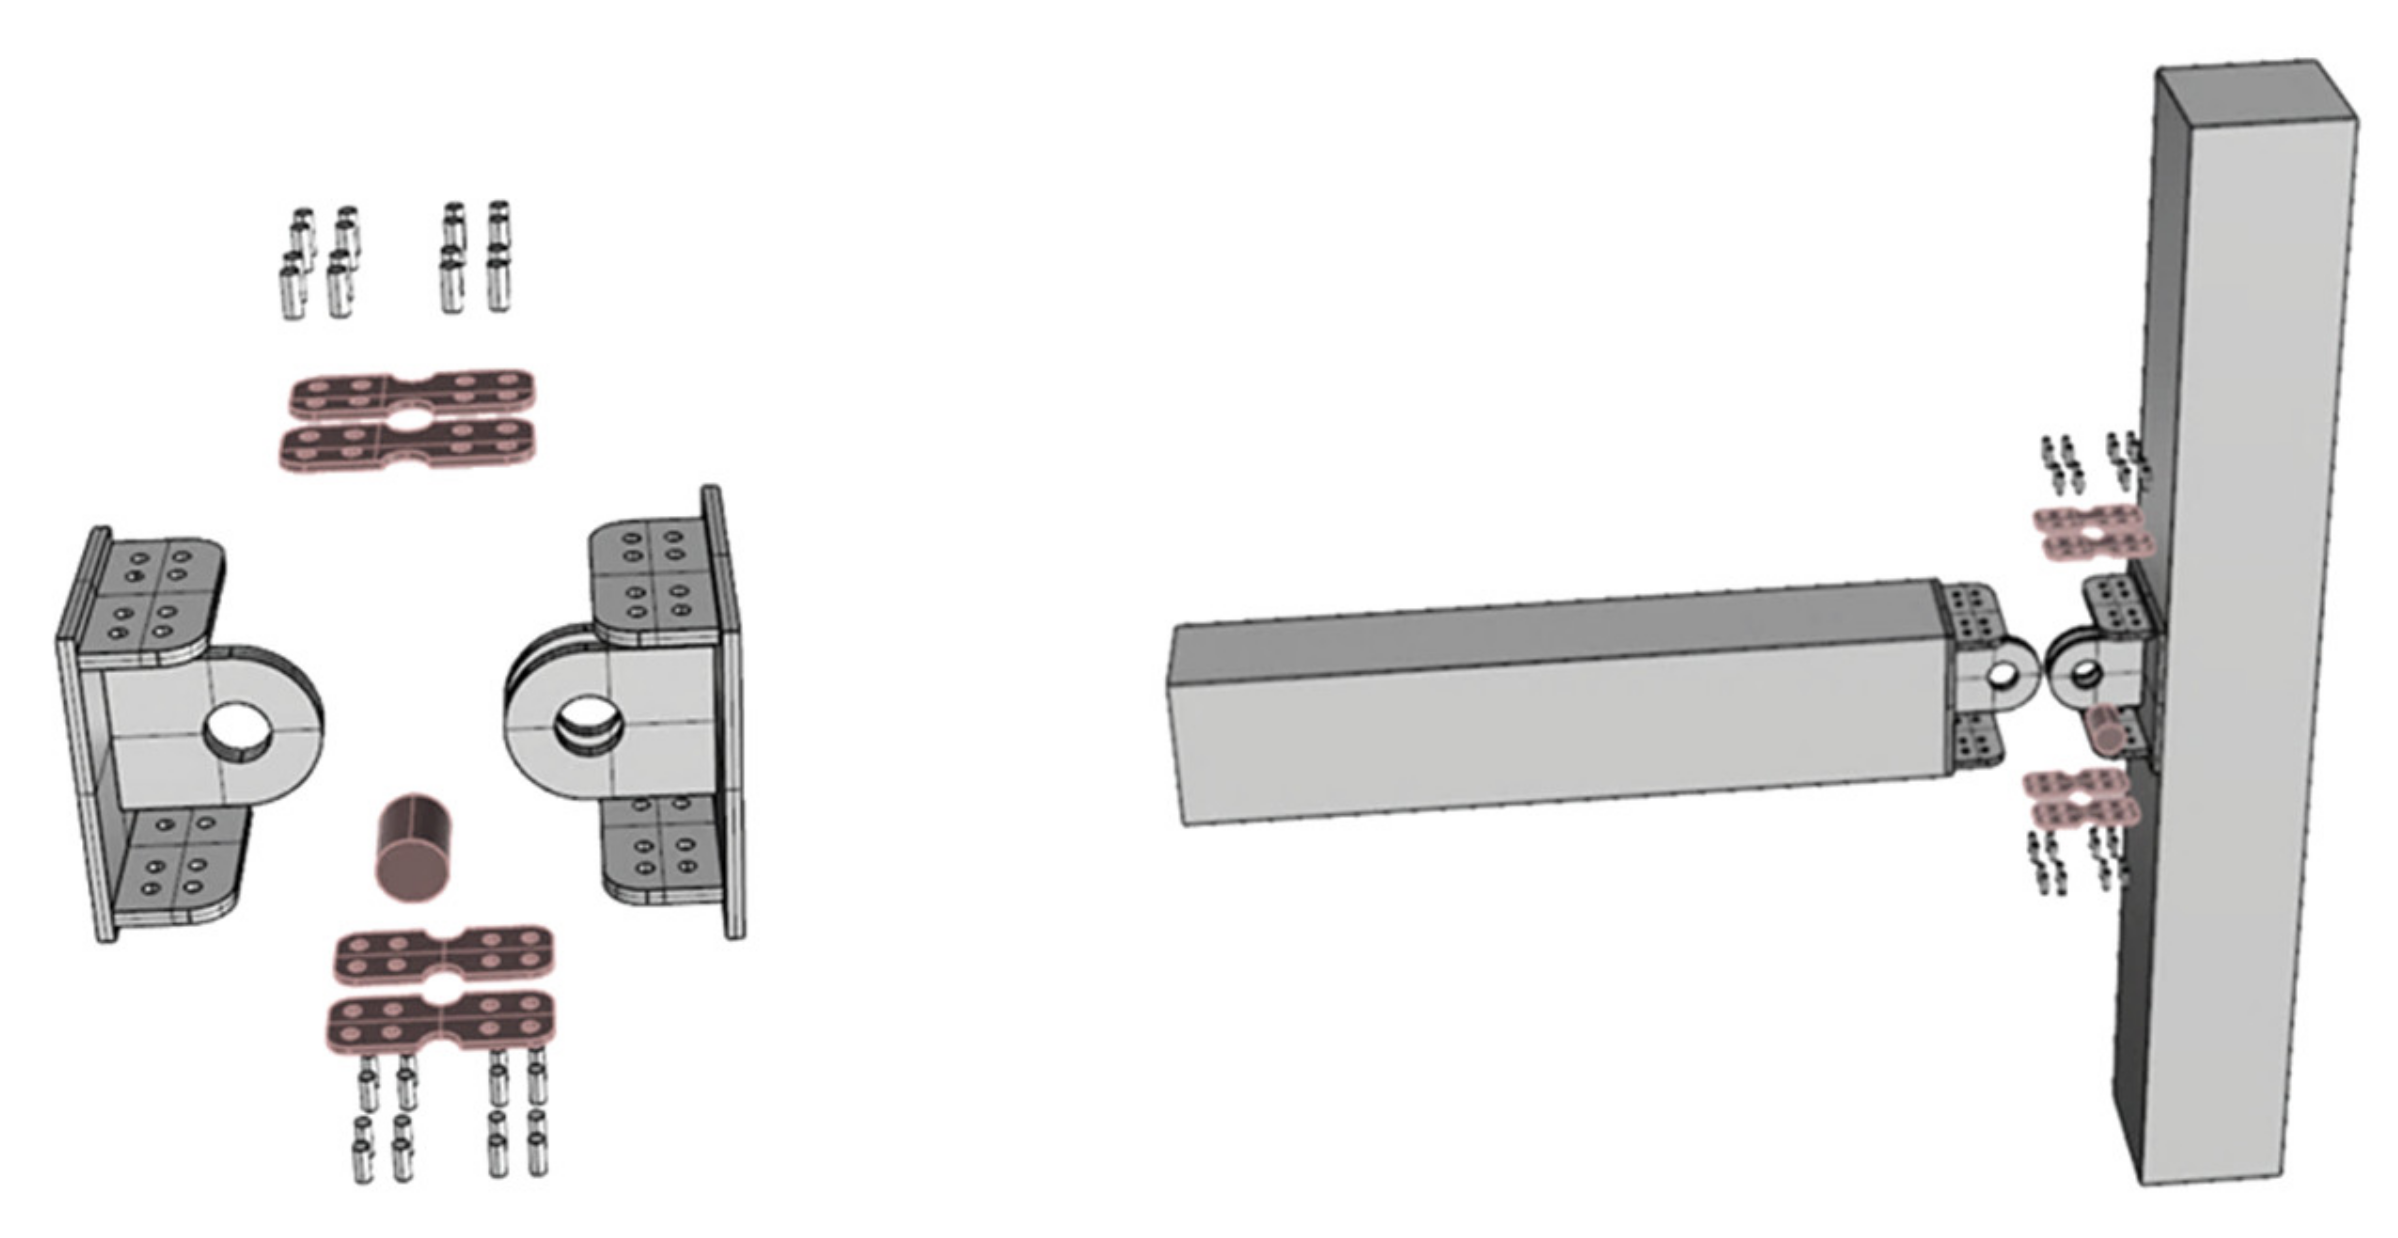
Figure 1. Details of PBSEC connection.
Buildings 12 01652 g001
Figure 2. Position of the beam-column connection in the frame.
Buildings 12 01652 g002
Figure 3. Dimensions of precast beam-column members and embedded formed steel.
Buildings 12 01652 g003
Figure 4. Reinforcement of precast beam and column.
Buildings 12 01652 g004
Figure 5. Flow chart of fabrication and assembly of test specimens.
Buildings 12 01652 g005
Figure 6. Schematic view: (a) Front view; (b) Side view.
Buildings 12 01652 g006
Figure 7. Photograph view: (a) Front view; (b) Side view.
Buildings 12 01652 g007
Figure 8. Cyclic loading pattern.
Buildings 12 01652 g008
Figure 9. Location of gauges: (a) Overview; (b) Displacement Gauge 5~6; (c) Displacement Gauge 1~2; (d) Displacement Gauge 3~4; (e) Strain gauges of the steel plates.
Buildings 12 01652 g009
Figure 10. Deformation of connecting steel plates: (a) J1-235-10; (b) J2-160-10; (c) J3-345-10; (d) J4-390-10.
Buildings 12 01652 g010
Figure 11. Strain–displacement curves of the specimens: (a) Strain of the longitudinal reinforcement in the beam section 1; (b) Strain of the longitudinal reinforcement in the beam section 2; (c) Strain of the stirrups in the beam; (d) Strain of the longitudinal reinforcement in the column; (e) Strain of the formed steel flanges.
Buildings 12 01652 g011
Figure 12. Hysteresis and skeleton curves: (a) Hysteresis curves of J1-235-10; (b) Skeleton curves of J1-235-10; (c) Hysteresis curves of J2-160-10; (d) Skeleton curves of J2-160-10; (e) Hysteresis curves of J3-345-10; (f) Skeleton curves of J3-345-10; (g) Hysteresis curves of J4-390-10; (h) Skeleton curves of J4-390-10.
Buildings 12 01652 g012aBuildings 12 01652 g012b
Table 1. Parameters of specimens.
Specimen No.Steel StrengthSteel Section/mmTest Parameters
J1-235-10Q235280 × 110 × 10Control group
J2-160-10LY160280 × 110 × 10Decrease the strength
J3-345-10Q345280 × 110 × 10Increase the strength
J4-390-10Q390280 × 110 × 10Increase the strength
Table 2. Mechanical properties of reinforcements.
GradeDiameter (mm)fy (MPa)fu (MPa)Es (Gpa)
HRB50010552756201
HRB50028548750208
Table 3. Mechanical properties of concrete.
Gradef7d (MPa)f28d (Mpa)fc (MPa)Ec (Gpa)
C5039.550.737.930.5
Table 4. Mechanical properties of steel plates.
Gradefy (MPa)εyfu (MPa)εu
LY160178.30.01959316.40.26549
Q235311.40.02069408.90.18001
Q345408.00.02173562.30.17039
Q390429.00.02043549.00.16590
Table 5. Critical points of the skeleton curves.
SpecimensDirectionsPy (kN)Δy (mm)Pm (kN)Δm (mm)Δu (mm)
J1-235-10positive81.3632.7194.0053.8081.94
negative−72.84−23.57−83.00−43.25−72.71
J2-160-10positive61.6959.8668.05128.00N/A
negative−50.45−51.38−59.78−105.20N/A
J3-345-10positive115.5568.83126.5699.00119.69
negative−106.67−52.09−121.79−73.45−120.39
J4-390-10positive120.3972.05130.7095.50N/A
negative−113.99−52.24−127.52−74.17N/A
Publisher’s Note: MDPI stays neutral with regard to jurisdictional claims in published maps and institutional affiliations.