Article

Assessment of Thermal Comfort and Air Quality in Office Rooms of a Historic Building: A Case Study in Springtime in Continental Climate

Department of Building Engineering, Energy Systems and Sustainability Science, Faculty of Engineering and Sustainable Development, University of Gävle, 801 76 Gävle, Sweden
*
Author to whom correspondence should be addressed.
Buildings 2023, 13(1), 156; https://doi.org/10.3390/buildings13010156
Submission received: 5 December 2022 / Revised: 29 December 2022 / Accepted: 4 January 2023 / Published: 7 January 2023

Abstract

:
One of the most important aspects of working in an office environment is ensuring that the space has optimal thermal comfort and an indoor environment. The aim of this research is to investigate the thermal comfort and indoor climate in three office rooms located at one of the campus buildings at the University of Gävle, Sweden. The evaluated period is in the month of April during springtime. During this period, parameters such as temperature, relative humidity, CO2, supply air flow rate, and room air velocities are measured on site. The results of the measurement show that the indoor temperature is on average lower in the rooms facing north, at 21–23.5 °C, compared to the rooms facing south, which reach high temperatures during sunny days, up to 26 °C. The results also show that the ventilation air supply rate is lower than the requirement for offices in two of the office rooms. The ACH rate is also low, at ≈ 1 h−1 for all the rooms, compared to the required levels of 2–4 h−1. The CO2 levels are within the recommended values; on average, the highest is in one of the south-facing rooms, with 768 ppm, and the maximum measured value is also in the same room, with 1273 ppm for a short period of time.

1. Introduction

One of the most important aspects of a building that is used for offices is the thermal comfort and indoor air quality in the working space. Humans spend roughly 90 % of their time indoors, and studies have shown that thermal comfort and indoor air quality have an impact on work performance and cognitive function [1,2]. One of the indicators when evaluating thermal comfort is the draught rate [3], which indicates local thermal discomfort based on air velocity and air temperature. In addition, to the thermal comfort, insufficient removals of gaseous contaminants, such as CO2 [4], also affect work performance negatively. Another contributing factor is how sunlight affects the thermal comfort in office rooms, which is also strongly connected to the location of the office room and, more specifically, which direction the office room window is facing [5]. Other factors that can also influence the thermal comfort are the outdoor climate [6] and the utilization of various types of sun protection devices, which can help with the reduction of unwanted and excessive solar radiation [7].
It is therefore important to have a good indoor environment, especially in a working environment such as an office where there are usually specific state or local regulatory requirements concerning ventilation flow rates, air changes per hour (ACH), air temperature, and draught levels [8].
The HVAC system is the primary component of a building that is responsible for the indoor environment, i.e., heating, ventilation, and air conditioning. The predominant mechanical air distribution system in offices is mixing ventilation (MV) [9]. This system is also used as a benchmark when comparing the ventilation effectiveness of other types of ventilation systems, such as displacement ventilation and impinging jet ventilation, which are classified as stratified systems [3,10], as well as stratum ventilation [11].
Karjalainen [12] evaluated the use of thermostats in offices and homes by using an interview survey in Finland based on a large pool of samples. The results of that study showed that people felt more discomfort in the office environment than in their homes, both in summer and winter. The study also concluded that in offices, the opportunities to control the thermal environment were lower than in homes.
Kuchen and Fisch [13] conducted a field study, a survey on thermal comfort in the winter, which covered 345 measurements in 148 workspaces belonging to 25 office buildings. The survey method was based on both on-site measurements and a questionnaire form. In this study, the majority of the participants had access to alternative means to modify the thermal environment. These consisted of accessing the control means for operating solar protection elements, opening or closing windows, adjusting the settings of the thermostats of heaters, and modifying the control panel settings for indoor climate adjustment. This study concluded that occupants could accept a neutral temperature of 21 °C when the imposed, pre-established value of the operative temperature was 21 °C. When the temperature was increased to 23.5 °C, the imposed value increased to 24 °C. However, the occupants made frequent adjustments to the internal thermal conditions in order to decrease the thermal discomfort.
In a literature study conducted by Azuma et al. [14], several sources on how the carbon dioxide content affects human health were investigated and compiled. The study concluded that exposure to a carbon dioxide content above 10,000 ppm can cause physical changes in the body, such as increased respiratory rate and respiratory acidosis. The latter means a condition in which the lungs are unable to get rid of carbon dioxide to the extent needed, which leads to a lower pH value in the blood. The study also points out that a carbon dioxide content above 50,000 ppm can cause negative health symptoms such as dizziness, headaches, and confusion. If the CO2 level exceeds 100,000 ppm, the symptoms will be as bad as vomiting, high blood pressure, and unconsciousness.
Although the CO2 level normally does not reach such extreme levels that it becomes harmful or deadly in an office environment, the Swedish Work Environment Authority [15] has set a CO2 limit of 1000 ppm for office environments [16]. Another useful application of CO2 levels is the possibility of evaluating the ventilation effectiveness of a room [17]. If the outdoor CO2 level is compared to the exhaust level, this can give an indication of the performance of the ventilation system, especially if the evaluated room is small in size. The CO2 level can reach high levels (over 1000 ppm) over longer periods of time if the evaluated space is small and the occupant density is high in combination with a low ACH [18].
The CO2 level outside is usually around 400 ppm, and according to [19], the level of CO2 indoors should not exceed 1000 ppm, which is an indication of good ventilation.
In a literature study done by Kownacki et al. [20], they identified and described how heat waves can occur in urban environments and how they can be coped with. The study examined different building types in urban environments in Scandinavia, such as schools, apartments, and offices. The study found that during extreme weather (a heat wave), the indoor temperature could increase by up to 50% more than the outdoor temperature (OT). The study also mentioned some effective actions that can be taken to reduce the indoor heat, such as the use of shading devices, fans, and ventilation. The results also showed that there is a link between high OT and increased indoor temperatures. However, this increase is dependent on the size of the building, the building material, window location, and shading. In addition, the location of the room in a building also affects the temperature, i.e., a room located at a higher floor level is typically warmer than a room that is directly on ground level. Tamerius et al. [21] examined how metrological factors affected indoor temperature and humidity in New York City. Relative humidity (RH) and temperature were measured in 10-min intervals between March 2008 and June 2011 for 5–14 days per building in 327 different dwellings. Although the relationship between indoor and OT varied for hot and cold seasons, the results showed that the OT had a significant effect on the indoor temperature. When it was colder than 15 °C, the average indoor temperature increased by 0.06 °C for each degree that the OT increased. When it is warmer than 15 °C, the average indoor temperature increases by 0.43 °C for each degree that increases outdoors. The relative humidity was lower indoors, on average, during the measurements. The RH varied over the seasons and was lowest indoors in the winter, during heating season. In summer, the OT increased and approached the same level as the indoor temperature, which led to similar RH for indoor and outdoor.
In 2020, Hamid, Johansson, and Bagge [22] examined the indoor climate in offices located in 12 Swedish heritage buildings. The field measurements were performed to find out the air change rate, temperature, RH, and carbon dioxide content. The staff also had to answer a questionnaire about how they experienced the climate. A total of 43 offices were examined, and these were small cell offices where the occupants varied between one and six people per room. All buildings had high ceilings and thick and heavy exterior walls consisting of stone material, mainly brick. The heating system was waterborne, mainly in the form of radiators, but some buildings also had electric heating. Most of the buildings were ventilated through natural ventilation (only exhaust fans), but a few of the buildings had mechanical ventilation. The air went out through ducts in chimneys, and ventilation took place mainly through windows and infiltration. There were often blinds or curtains on the windows. The measurements were performed both during and outside of working hours, both in the winter and summer. The results showed that the average air turnover for all buildings during working hours was 1.38 h−1 in the winter and 2.46 h−1 in the summer. Outside working hours, air turnover was 0.90 h−1 in the winter and 0.77 h−1 in the summer. The results were compared with the Swedish Work Environment Authority’s guidelines [15]. A total of 67% of the rooms surveyed complied with the directive of not being colder than 20 °C indoors in winter, while 33% of offices reached below that temperature for more than 10% of the working day. Further, 72.5% of the offices complied with the directive of not having temperatures higher than 26 °C in the summer, and 27.5% did not. During the winter and summer, 93% and 92% of the offices, respectively, had a CO2 level of <1000 ppm 90% of the time. The results from the surveys showed that 60% of the staff felt it was too cold in the winter and about 25% felt that it was too hot in the summer.
In terms of thermal comfort in combination with energy retrofits related to historic buildings, Al-Sakkaf et al. [23] evaluated a heritage building in Riyad, Saudi Arabia. In addition, by using numerical simulations, they tested various window configurations with different panes and coatings. Their results showed that the best configuration was double low-E glass with a double wall enclosing thermal insulation. This window reduced the energy usage by 8.3% and yielded a good thermal comfort value in terms of PMV during the entire year compared to the other configurations. A similar study was also conducted by Vallati et al. [24], in which the authors evaluated window replacement for energy retrofitting in a historic public building (Sapienza University) in Italy. Further, by using a double-glazed window with a low emissivity coating, they managed to reduce the annual energy usage by 14%.
Another aspect that needs to be taken into consideration is how the occupants view the prospect of energy-retrofitting old and historical buildings. For example, Murillo Camacho et al. [25] carried out a study that evaluated the decision-making process of residents of heritage buildings in the historic center of Mexico City regarding energy efficiency. The study focused on improving thermal comfort and reducing energy usage while preserving heritage values. The results of the study showed that although the residents perceived the building’s thermal comfort as poor, they preferred passive thermal comfort actions (e.g., wearing more clothes indoors and closing windows) rather than having the buildings retrofitted, which the residents associated with a potential loss in the building’s value and the high cost of changes. In a study by Rohdin et al. [26], an energy audit was carried out in combination with an indoor environment survey for an historic old building used for archiving and office rooms. The results of the survey showed that four physical environmental factors—draught, varying room temperature, room temperature too low, and stuffy “bad” air—were reported significantly in this building even though the flowrates of the ventilation system fulfilled the requirements for the highest category of indoor environment, according to EN 15251.
In 2022, Liu et al. [27] evaluated the effectiveness of passive cooling features (north-south orientation, natural ventilation, window shading, and light-colored painted walls) in historic residential buildings in Zanzibar. The results of the study showed that the occupants did not reach the level of thermal comfort stated in ASHRAE Standard 55. Additionally, the results showed that the average predicted mean votes were 1.23 and 0.85 for the two historical case study buildings, and the average predicted percentages of dissatisfaction were 37.35% and 20.56%, respectively. In order to improve the thermal comfort, the authors suggest the use of lime plaster and wash lime, which have been shown to reduce the indoor temperature in hot climates [28].
In a study, Alwetaishi et al. [29] investigated the impact of thermal mass and orientation on thermal comfort and temperature levels in historic buildings. They found that in hot regions with high altitudes, it was possible to achieve thermal comfort for most of the year, particularly when using a heavy thermal mass construction building type. However, they recommended the use of air conditioning systems for cooling when the outdoor temperature rose above 35 °C. Their research also showed that the orientation of the building had a major influence on the indoor temperature, especially in the south and west, which increased the incoming solar radiation considerably. They concluded that the use of thermal mass had a slight effect on the indoor air temperature and energy usage, but it helped to provide thermal comfort to the users during moderate outdoor temperature levels.
The aim of this study is to investigate the indoor climate and thermal comfort in small offices in an older, temperature-controlled historical stone building. Parameters such as air temperature, air velocity, supply air flow rate, relative humidity, and CO2 were measured or logged. These parameters are compared to different standards and regulations in regard to thermal comfort. Additionally, the offices are evaluated based on the effect of having their windows facing south or north and how this affects the overall thermal comfort level in the room.

2. Methodology

This study was based on quantitative field measurements that were carried out at the University of Gävle in 2022 between 00.00 am on the 5th April until 23.59 pm on the 24th of April. Measurements were performed on air temperature, globe temperature, and relative humidity inside three offices, which were compared with measurements on temperature and relative humidity outdoors. The ventilation flows and carbon dioxide levels were also measured to determine the air quality. The air velocities were measured in the offices at three altitudes to examine whether there was any difference.

2.1. Study Object

The building in which the surveys were carried out is in Gävle, with coordinates of latitude 60.67 and longitude 17.12. The building was used between 1909 and 1992 by the Hälsinge Regiment, and it was later rebuilt to be used as a university. The city of Gävle has a moderately continental climate, with cold winters, during which the average temperature is a few degrees below freezing, and mild summers. The average annual temperature is around 5.6 °C [30].
In total, three offices were used for evaluation and measurements. Two of the offices had their windows facing southeast, and one was facing northwest. All the offices were on the fourth floor, which in this case meant two floors up from the ground floor because the building had a basement floor that was designated as floor one. Figure 1 shows a picture of the building and the office windows from the outside. The offices were designed for one person and had a computer installed in each room. They were equipped with a separate, height-adjustable desk set at 0.8 m. One of the rooms facing south (S), room A, had staff on weekdays while the other, room B, was empty most of the time. The room in the north position (N), room C, usually had staff only until lunchtime. In addition to having a computer in each room, rooms A and C both had two computer monitors, while room B only contained one.
The ceiling height in all rooms was 3.4 m. The two rooms facing south had a floor area of 10.5 m2, and the room facing north had a floor area of 10.7 m2. Information about the different rooms can be found in Table 1. The exterior of the building consisted of 0.6 m of hollow brick with about 0.01 m of plaster on each side. The three offices in which the measurements were performed had interior walls that varied between heavy and thick walls as well as lighter and narrower walls. In addition, in the two rooms facing south, the wall opposite the window consisted of glass with slatted blinds on the inside of the room and a corridor and gathering space on the other side. Further, the doors to all the rooms had a glass part in them. Figure 2 shows the wall in room B facing the corridor. Each room was equipped with a radiator placed 2.5 cm from the wall with a thickness of about 0.095 m, a width of 1.1 m, and a height of 0.45 m, resulting in a front surface area of 0.5 m2. The radiator thermostat had a maximum value of three that could be adjusted by the staff. The heating system was district heating.
The windows in all offices were double-glazed, which were subsequently supplemented with an extra layer of glass panes made by Grundels [31]. The total window area per office, which consisted of four individual windows placed together as one large window, was 3.1 m2 with a total glass area of 1.7 m2. Figure 3 shows the window layout. According to [31], the U-value of the windows was lowered to 1.3 W/m2·K after adding the extra glass pane, which previously was 2.9 W/m2·K. All offices were equipped with thin, almost transparent curtains on each side of the windows that extended all the way from the ceiling down to the floor, thus covering the elements that were placed under the windows. The detailed information about the curtains can be found in Table 2. The south-facing rooms also had blinds inside each of the four individual windows. There was no external shading. There were no trees outside the offices that cast shadows on the windows, and on the south side, there were no other buildings that cast shade. On the north side, room C(n) was shaded by a part of the building in the afternoon (to the left side), which meant that it received almost no direct sunlight; see Figure 1.
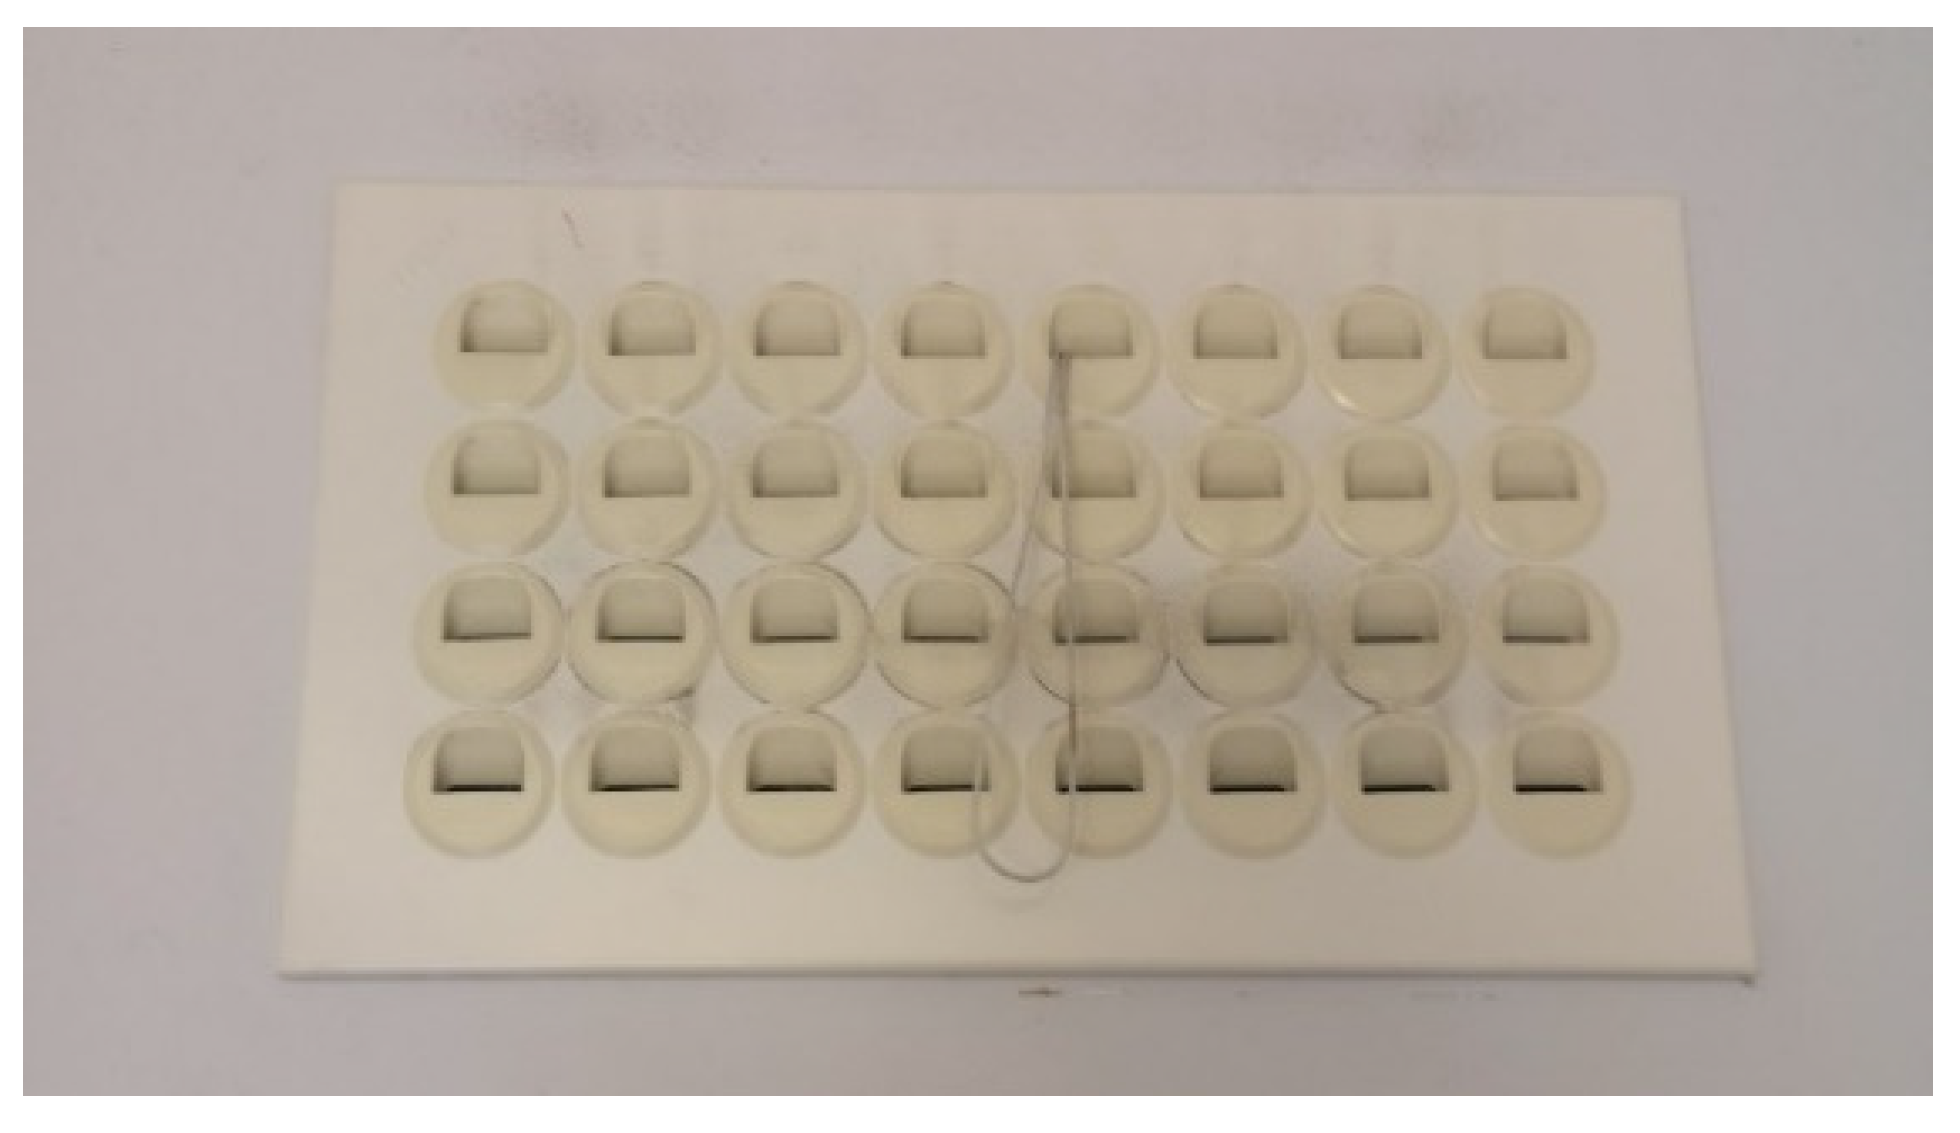
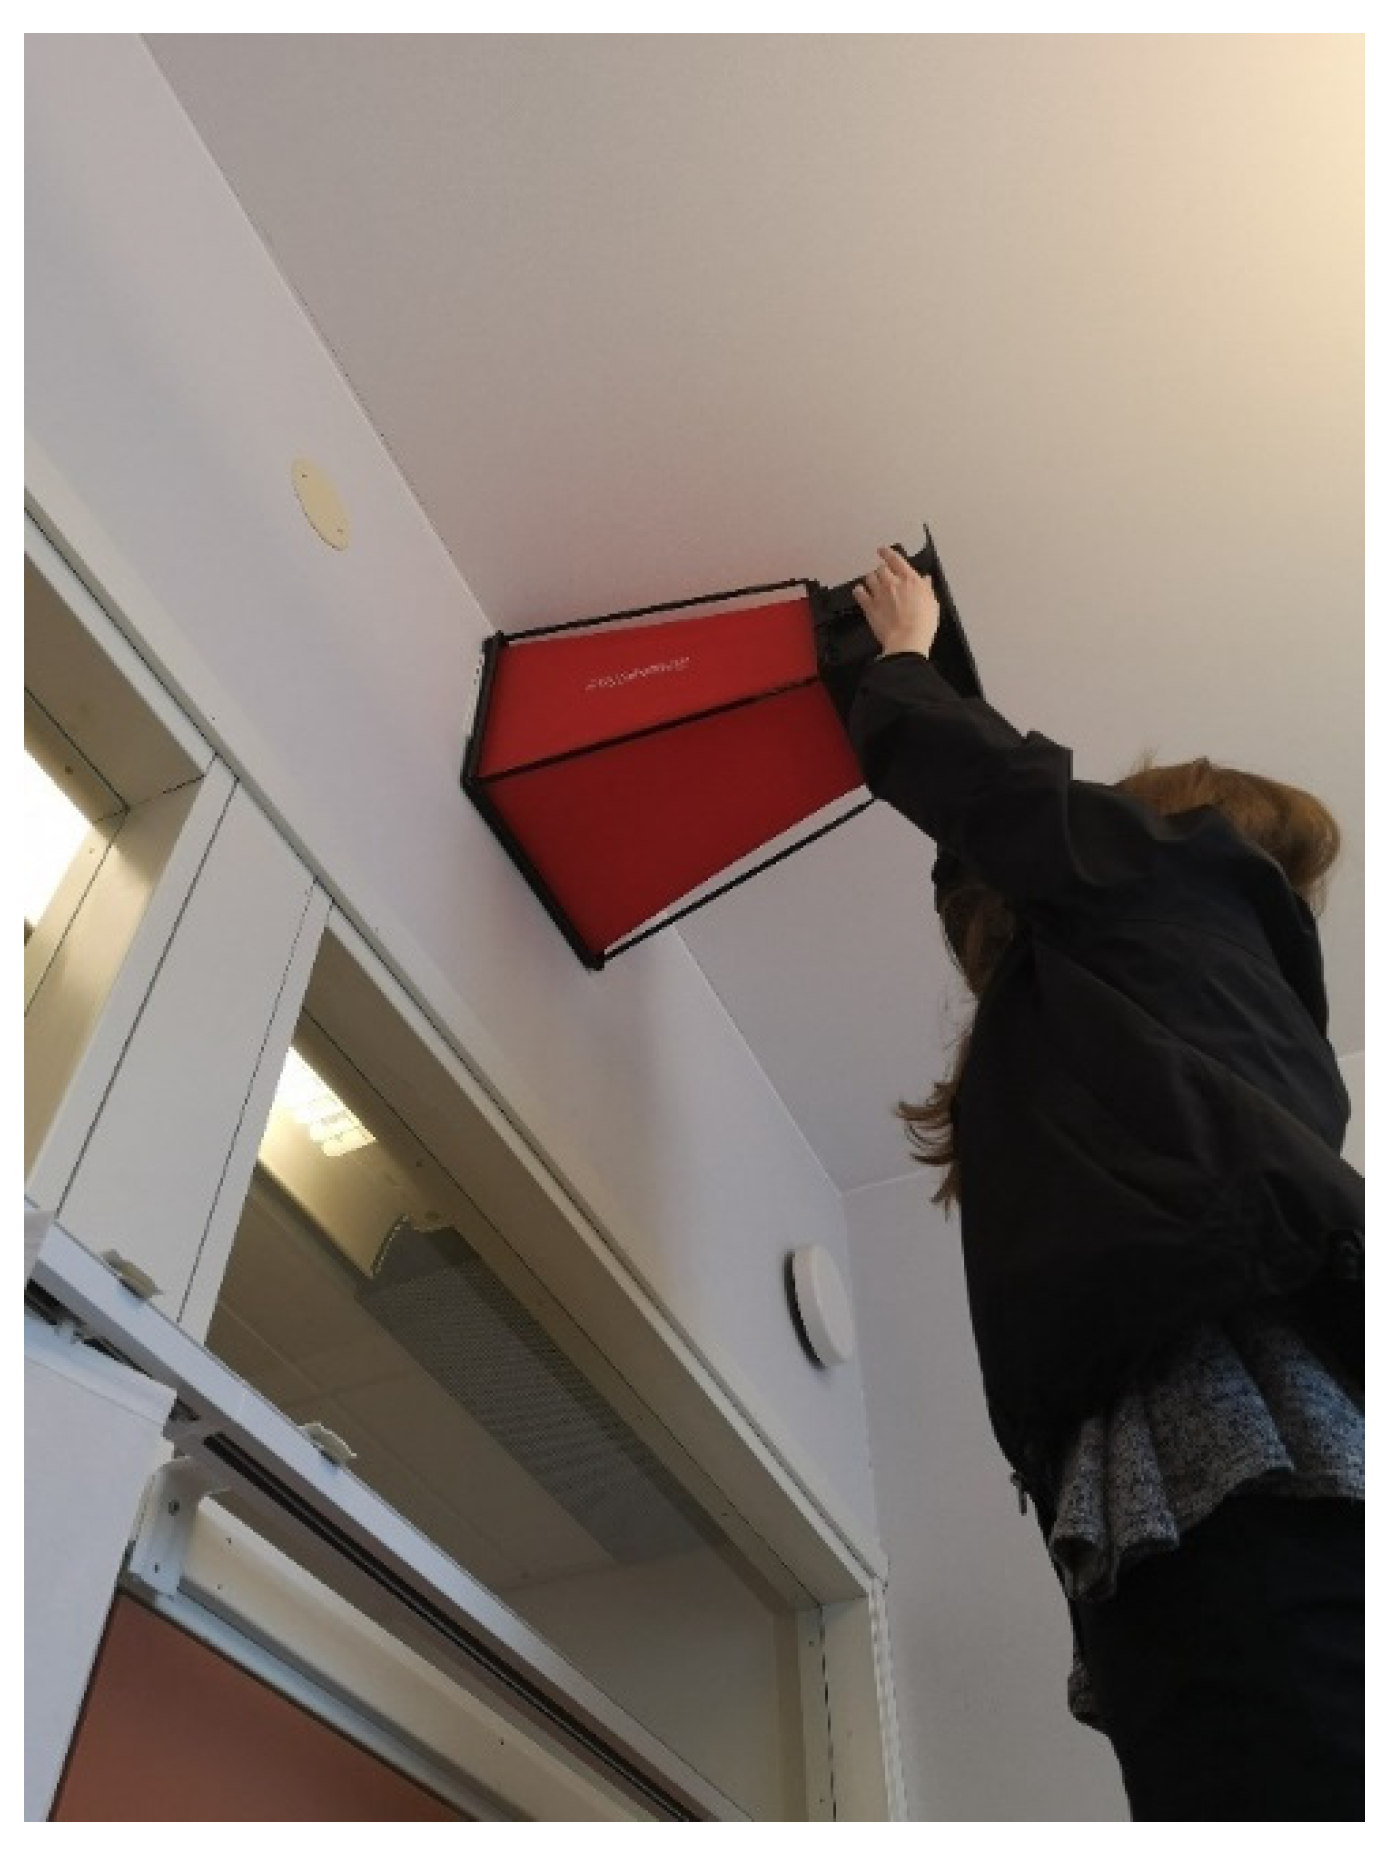
The ventilation was on from Monday to Friday between 05:00 and 18:00 and completely off at other times. The system was fan-controlled supply and exhaust air with heat recovery, i.e., FTX ventilation. The unit had a rotary heat exchanger and a heating and cooling coil. The ventilation was designed to supply 15 L/s to each office room. In the offices, there were exhaust and supply air devices for mixed ventilation, placed high up on the walls near the ceiling, as seen in Figure 2. The supply air nozzles in all rooms were directed upwards, towards the ceiling, as shown in Figure 4. The supply air temperature was configured depending on what the OT was; 20.0 °C when OT < −25.0 °C, 19.0 °C when OT between −25.0 °C–24.9 °C and 18.0 °C when OT ≥ 25.0 °C.
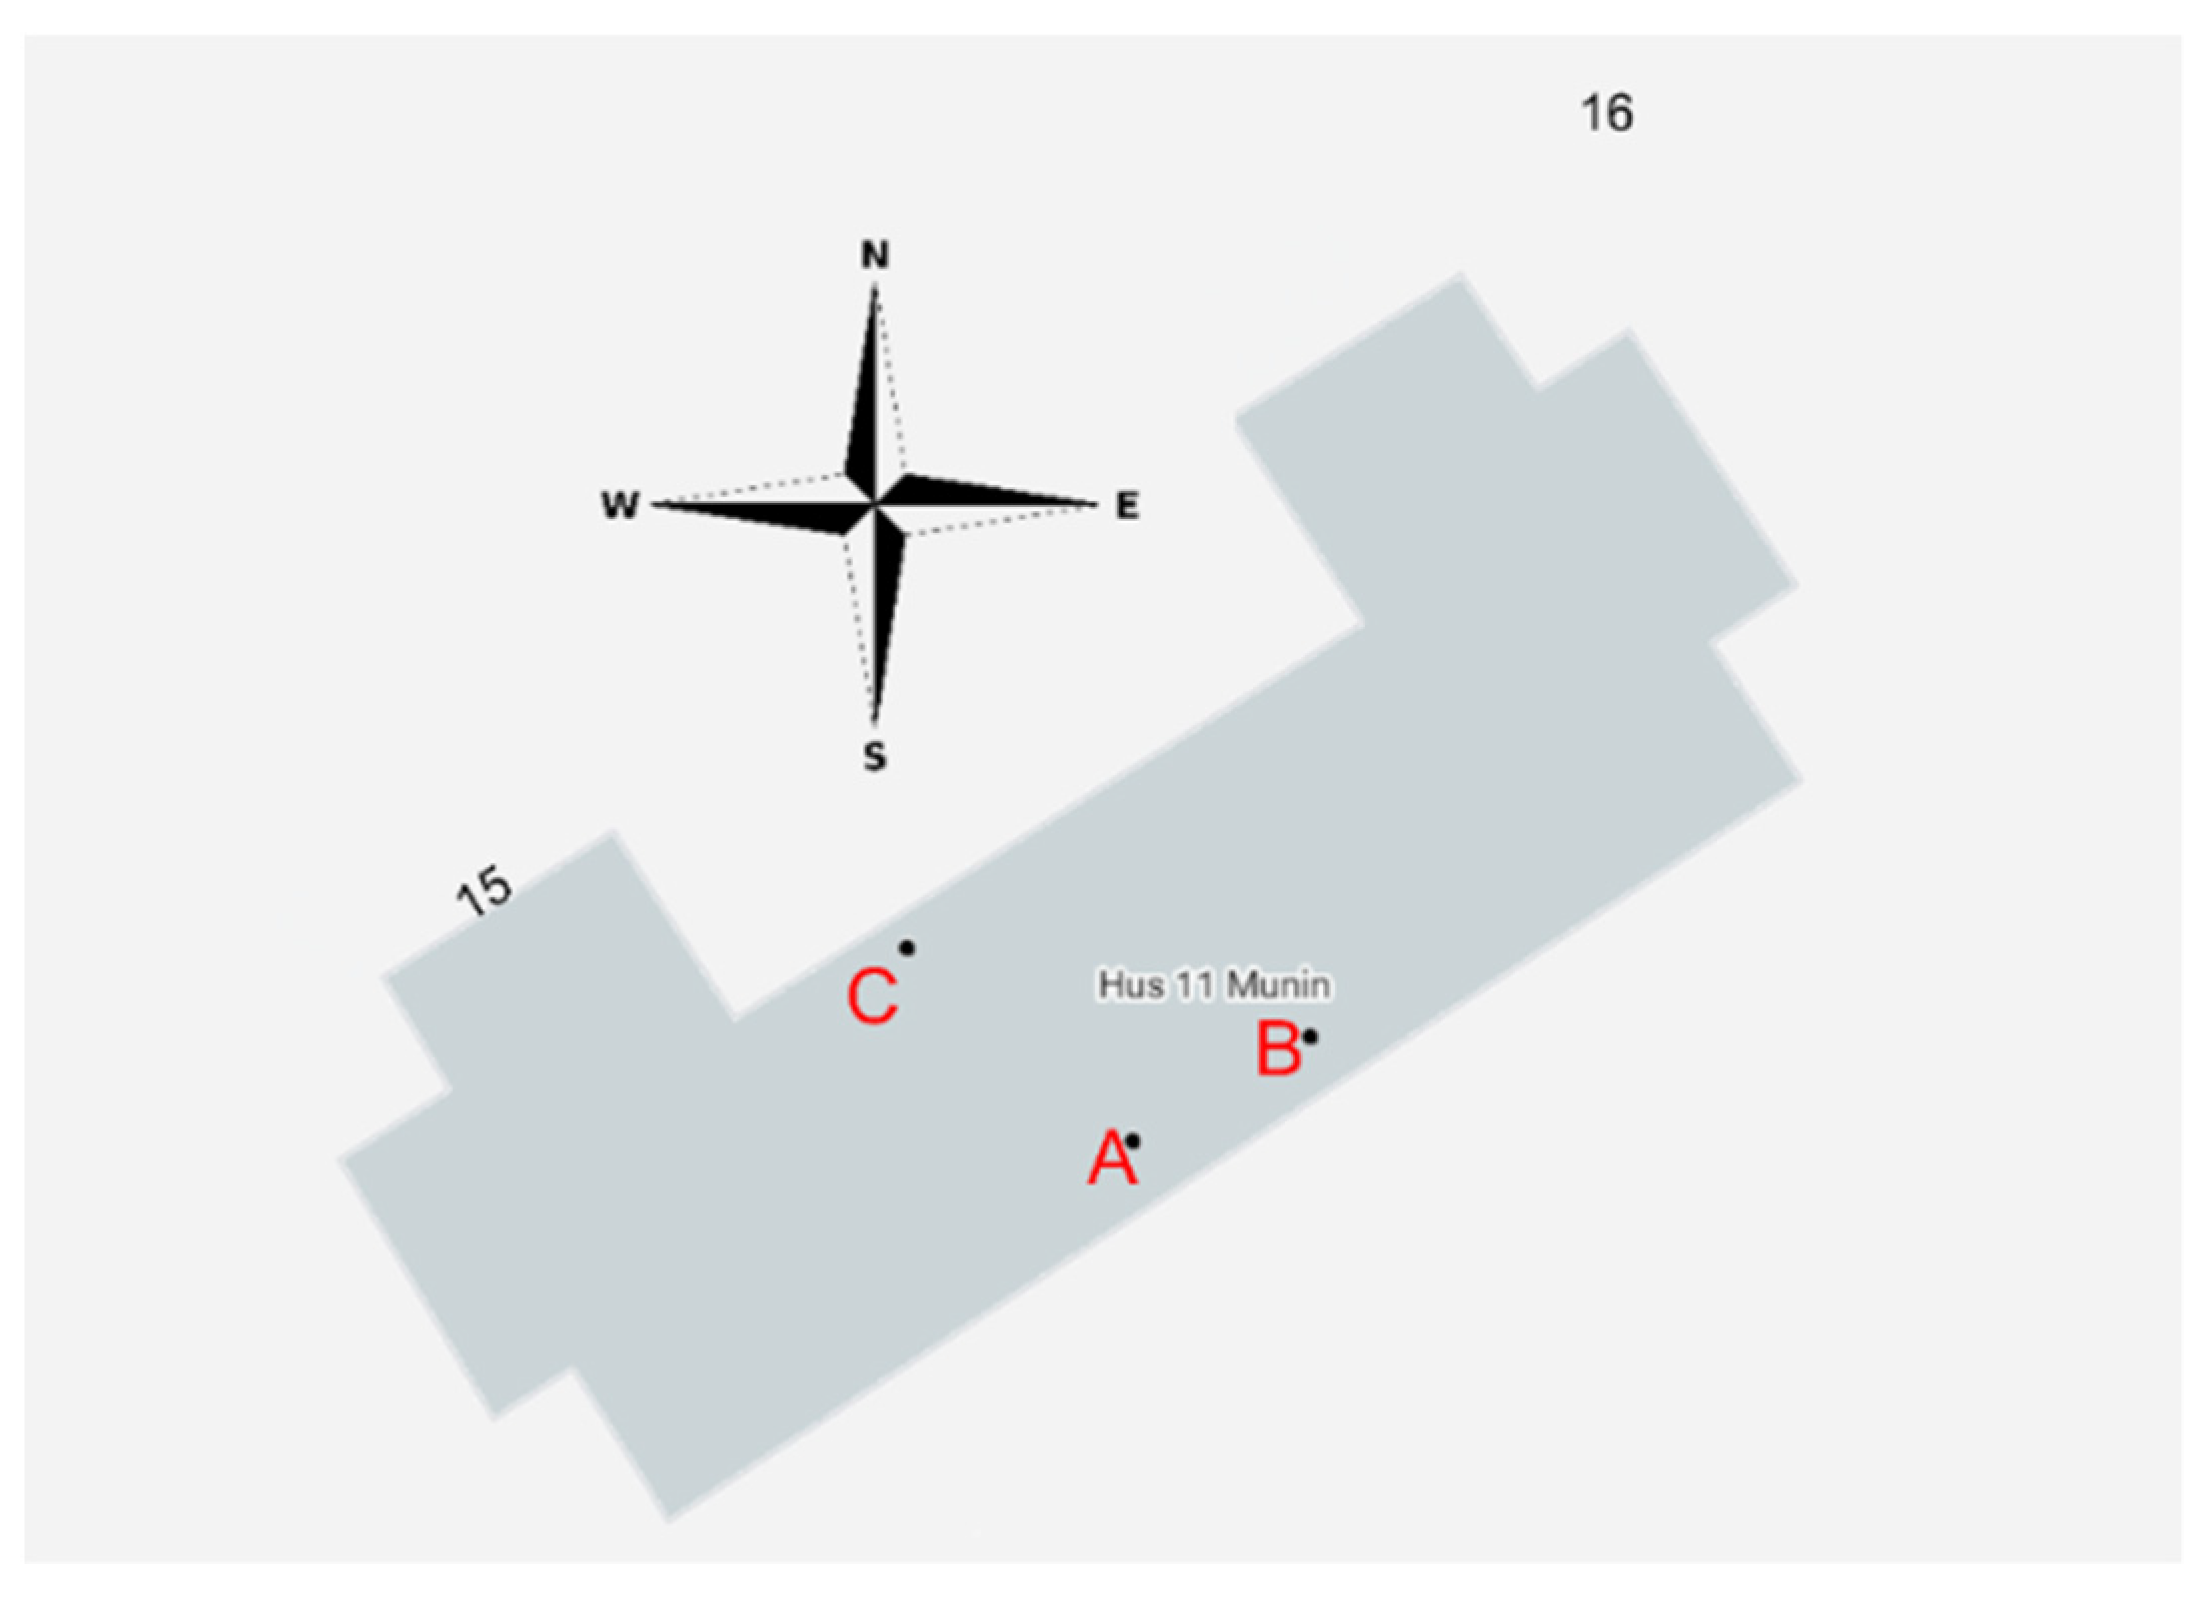
According to AFS 2020:1 [15], the minimum accepted supply ventilation flowrate for each room should be around 10.7 L/s (calculated based on 7 L/s and 0.35 L/s·m2 floor area). This corresponds to an air turnover of ≈1.07 h−1. The measurements were carried out in the month of April. Figure 5 shows the room and building orientation. The figure also shows the two loggers that are marked as 15 and 16 as well, which is where outdoor measurements were taken, and they are listed in Table 3.
The measurements were performed in April. Figure 1, Figure 5, and Figure 6 show the three rooms where the measurements were performed and where these rooms are located in the building, as well as the cardinal directions of each room. The information about the two loggers marked in Figure 5 can be found in Table 3.

2.2. Measurement Procedure and Equipment

The SatelLite20TH from Mitec Instruments AB was used to log the temperature and humidity. The air temperature is measured in the range of −20.0 °C to 50.0 °C with a resolution of 0.1 °C, and the humidity is measured in the range of 10% to 90% with a resolution of 0.1%. The loggers measured at 15 min intervals. In order to measure the operating temperature, two data loggers were each supplemented with a globe thermometer (Mitec Instrument AB), a diameter of 15 cm and a measurement uncertainty of ± 0.2 °C.
Air temperature and humidity were also logged with CL11 data loggers from Rotronic AG, which also logged the carbon dioxide content. The measuring range for the temperature was from −20.0 °C to 60.0 °C, with a measurement uncertainty of 0.3 °C. For the moisture content, the measuring range was from 0.1% to 99.9%, with a measurement uncertainty of 3%. The carbon dioxide content could be measured from 0 ppm to 9999 ppm with a measurement uncertainty of 30 ppm + 5% of the value. The measuring interval for this device was set to five minutes for this study.
The data from both the SatelLite20TH loggers and the CL11 loggers have been analyzed and processed in Excel, and the SatelLite20TH loggers have been calibrated through calibration data at 20.0, 25.0, 30.0, and 35.0 °C. Based on this, the logged temperature values of the loggers were adjusted in relation to the calibration offset data to reduce the uncertainty.
Table 3 shows a description of the location, height, and starting measuring day for the different loggers. These are described in more detail for each room in upcoming sections. Figure 6 shows the location of the loggers in each of the rooms.

2.3. South Facing Room A

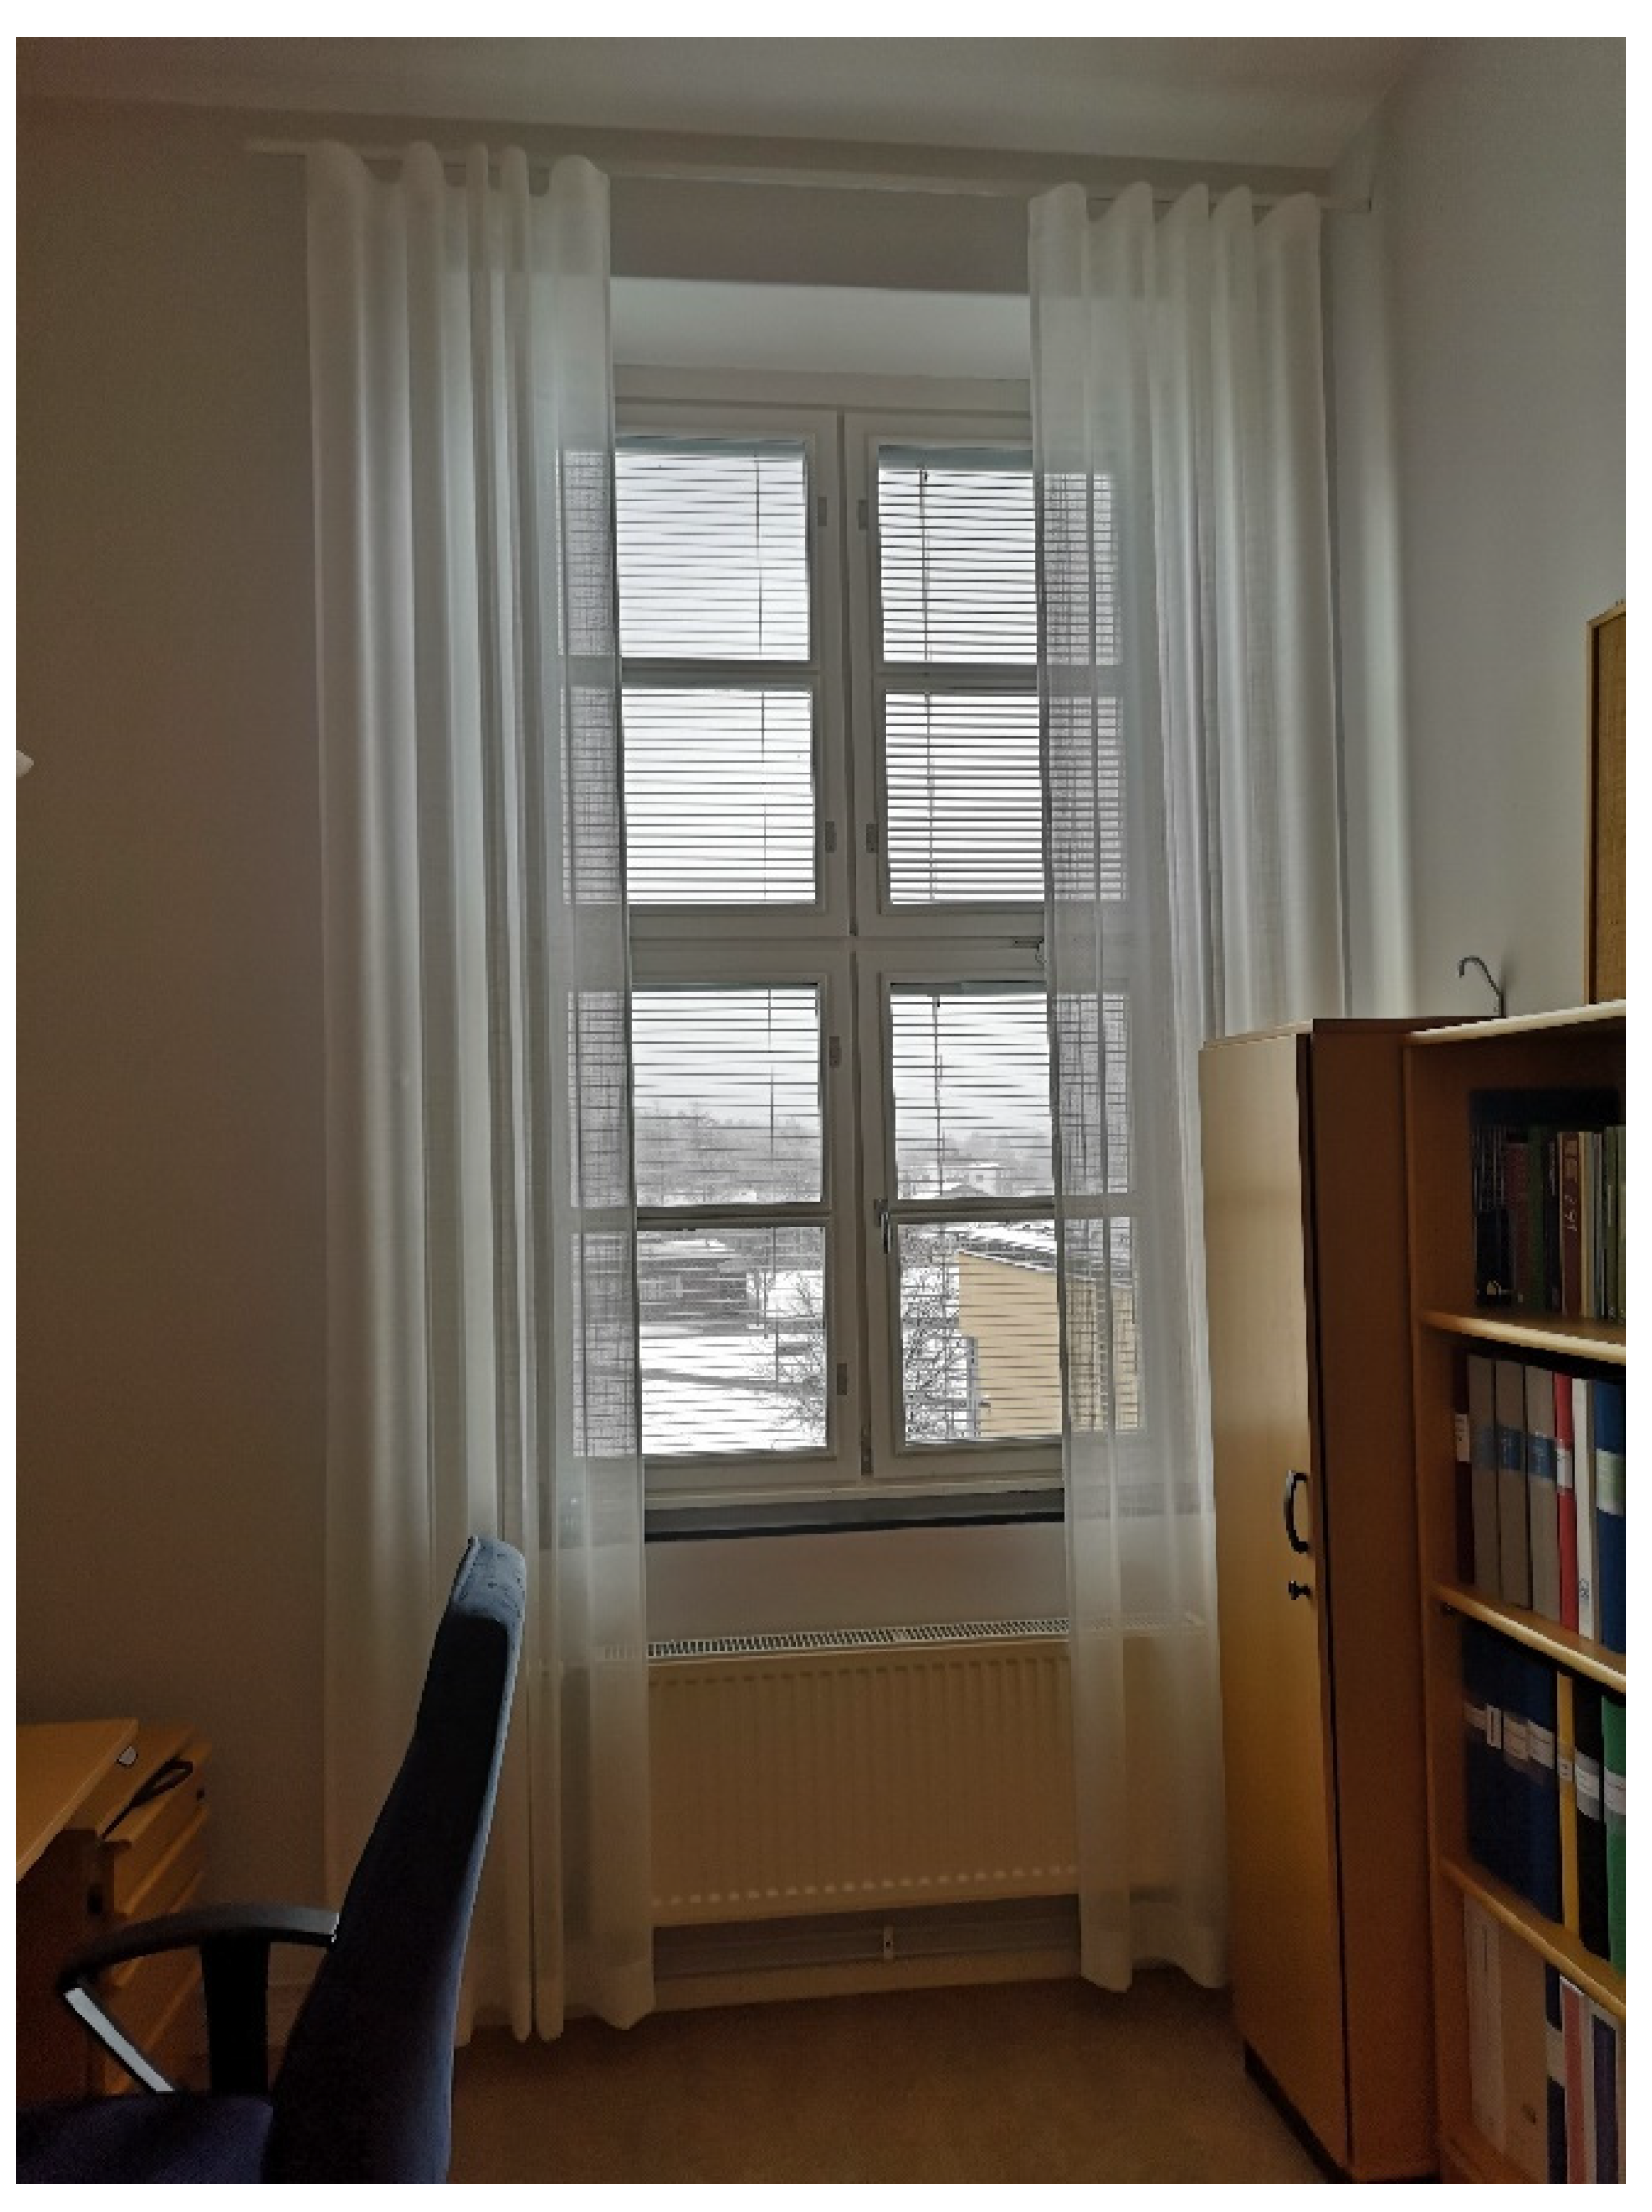
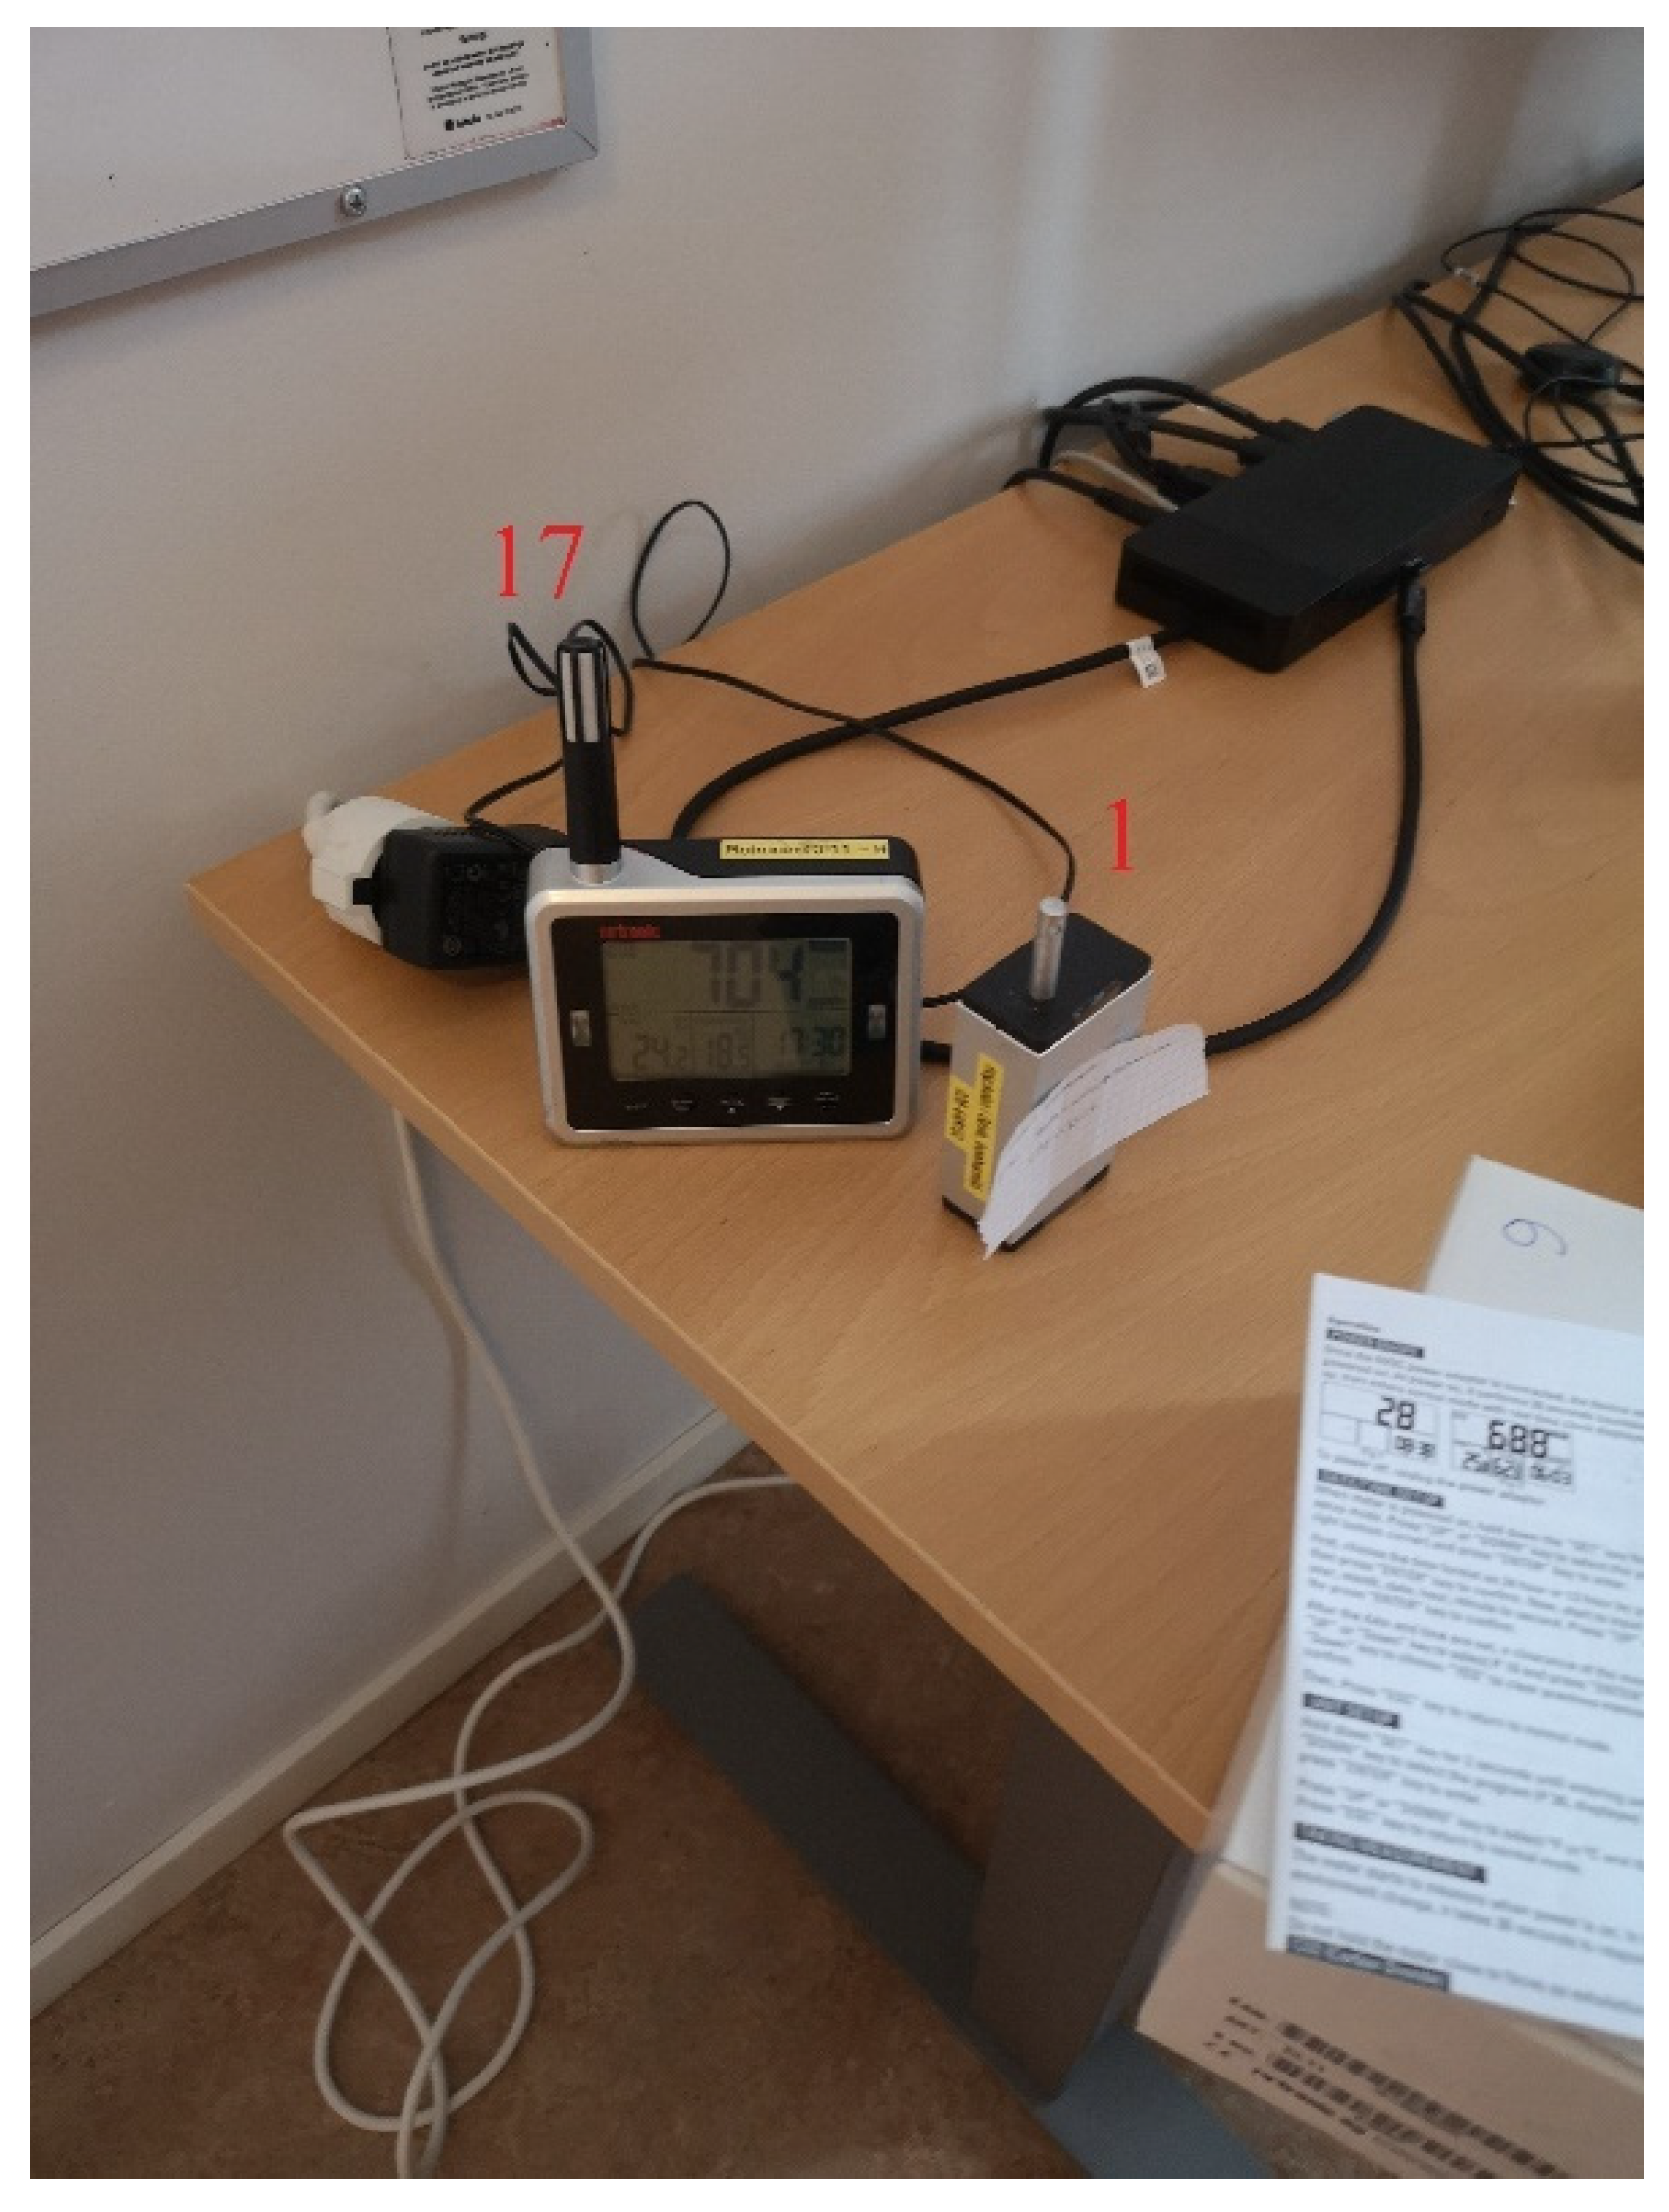
In room A, the person could control the radiator and sunshade freely. Some type of sun protection was always used. The blinds were usually pulled down and angled horizontally, and the curtains were half drawn, as shown in Figure 7. On sunny days, however, the sunshades were used to a greater extent. In the room, logs 1 and 17 were placed on the desk to the left of the two computer screens at a height of 0.8 m (see Figure 8). However, the interval on logger 17 had been forgotten to be specified and it was set to 10 sec previously.

2.4. South Facing Room B

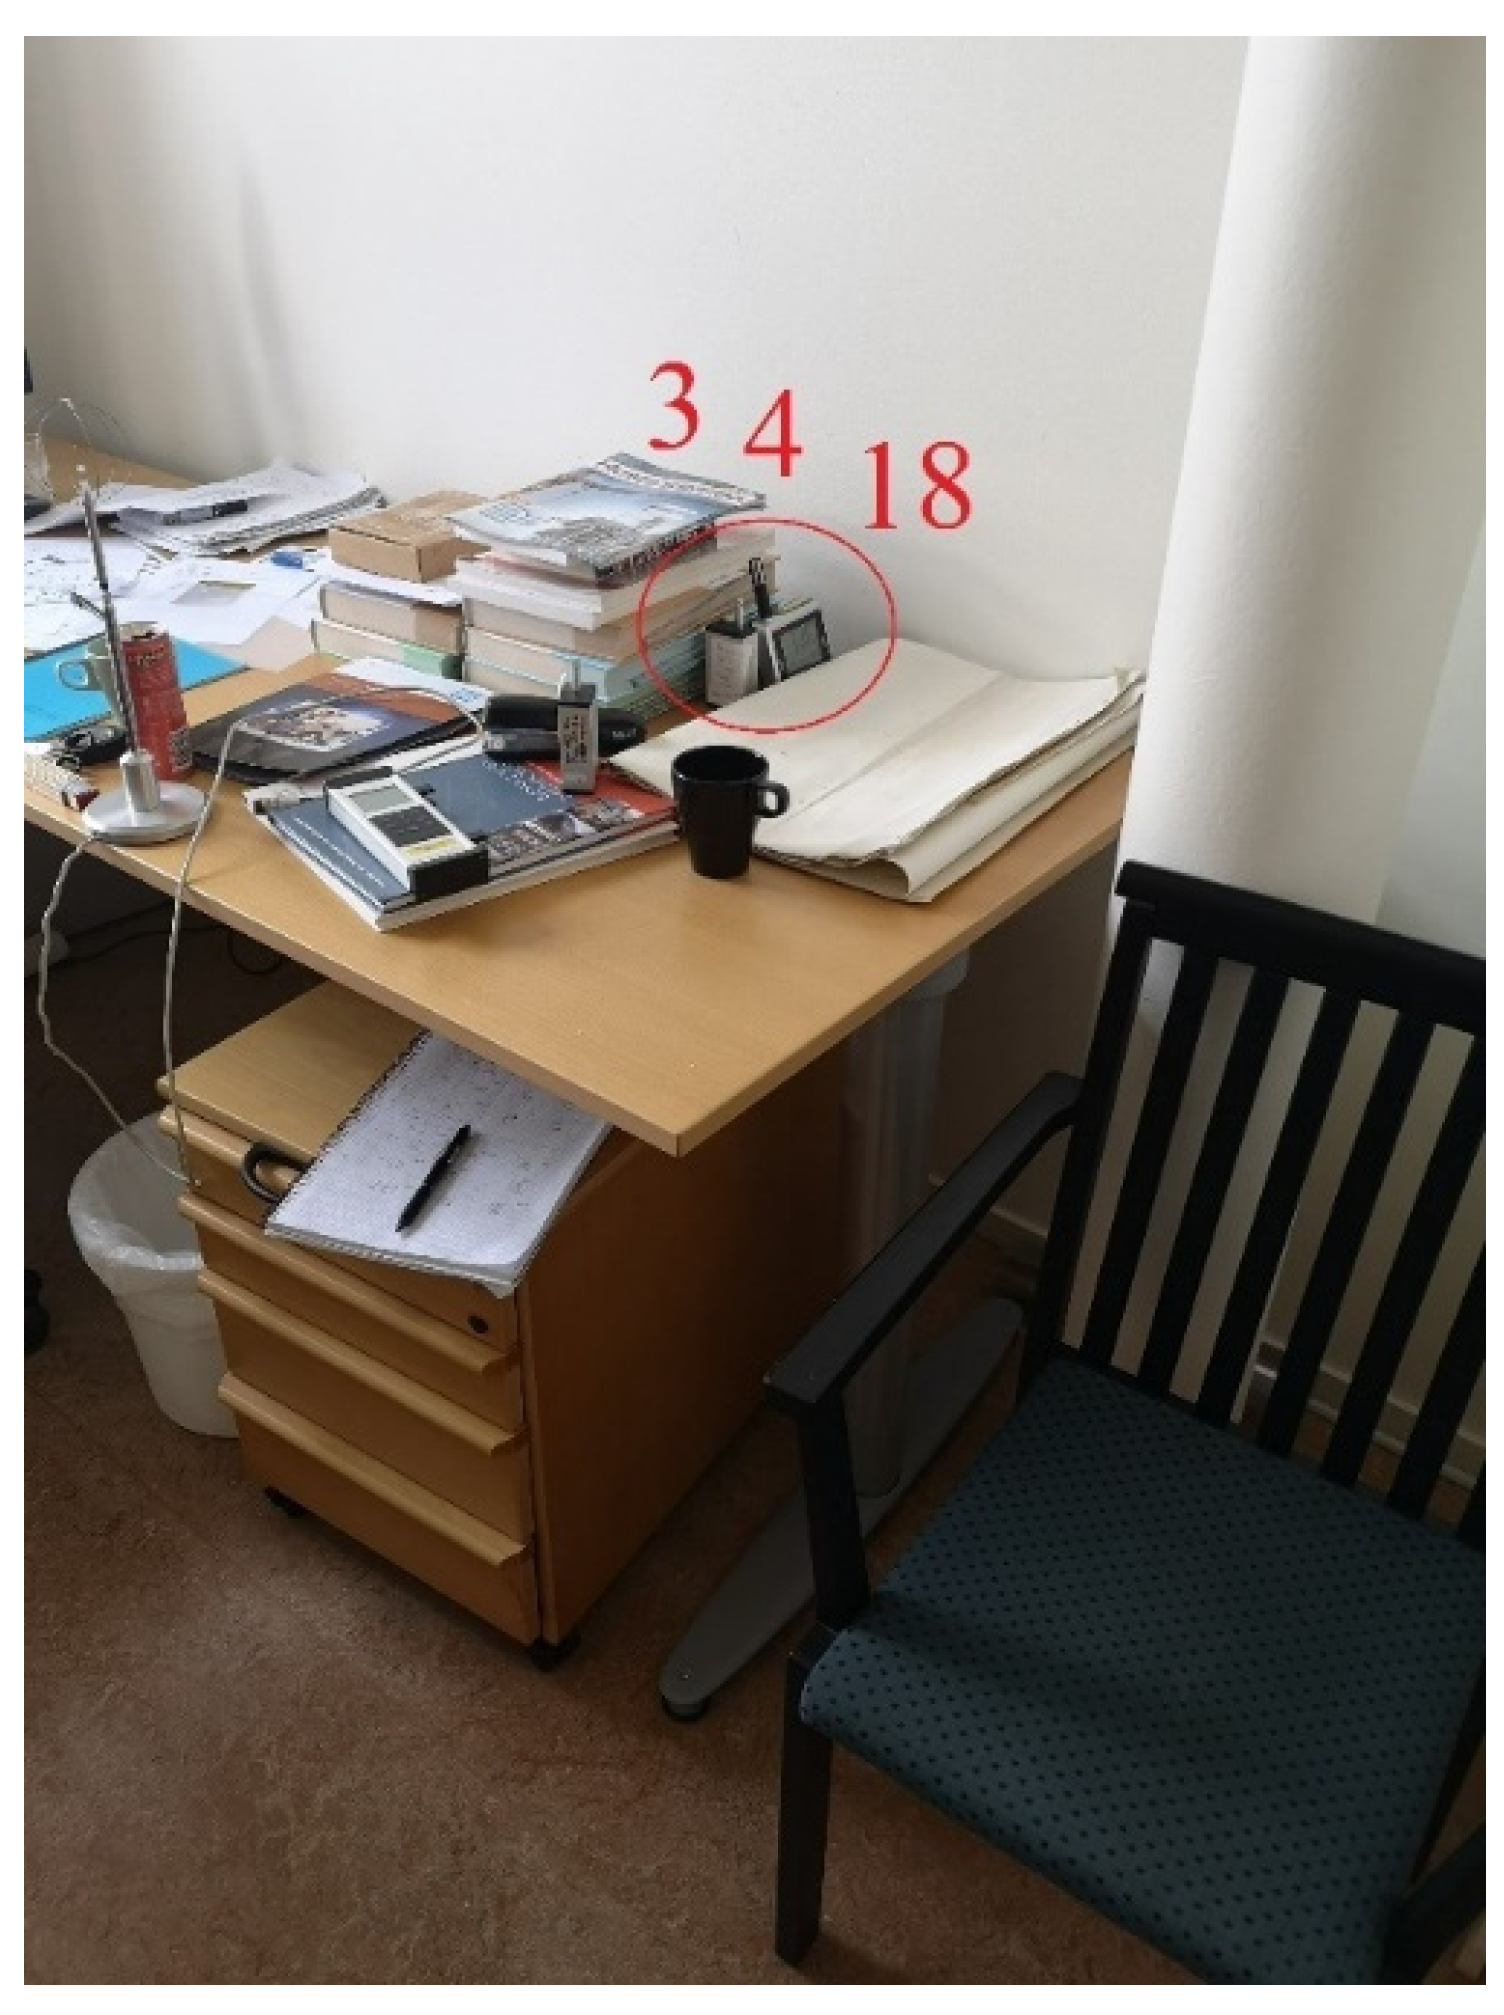
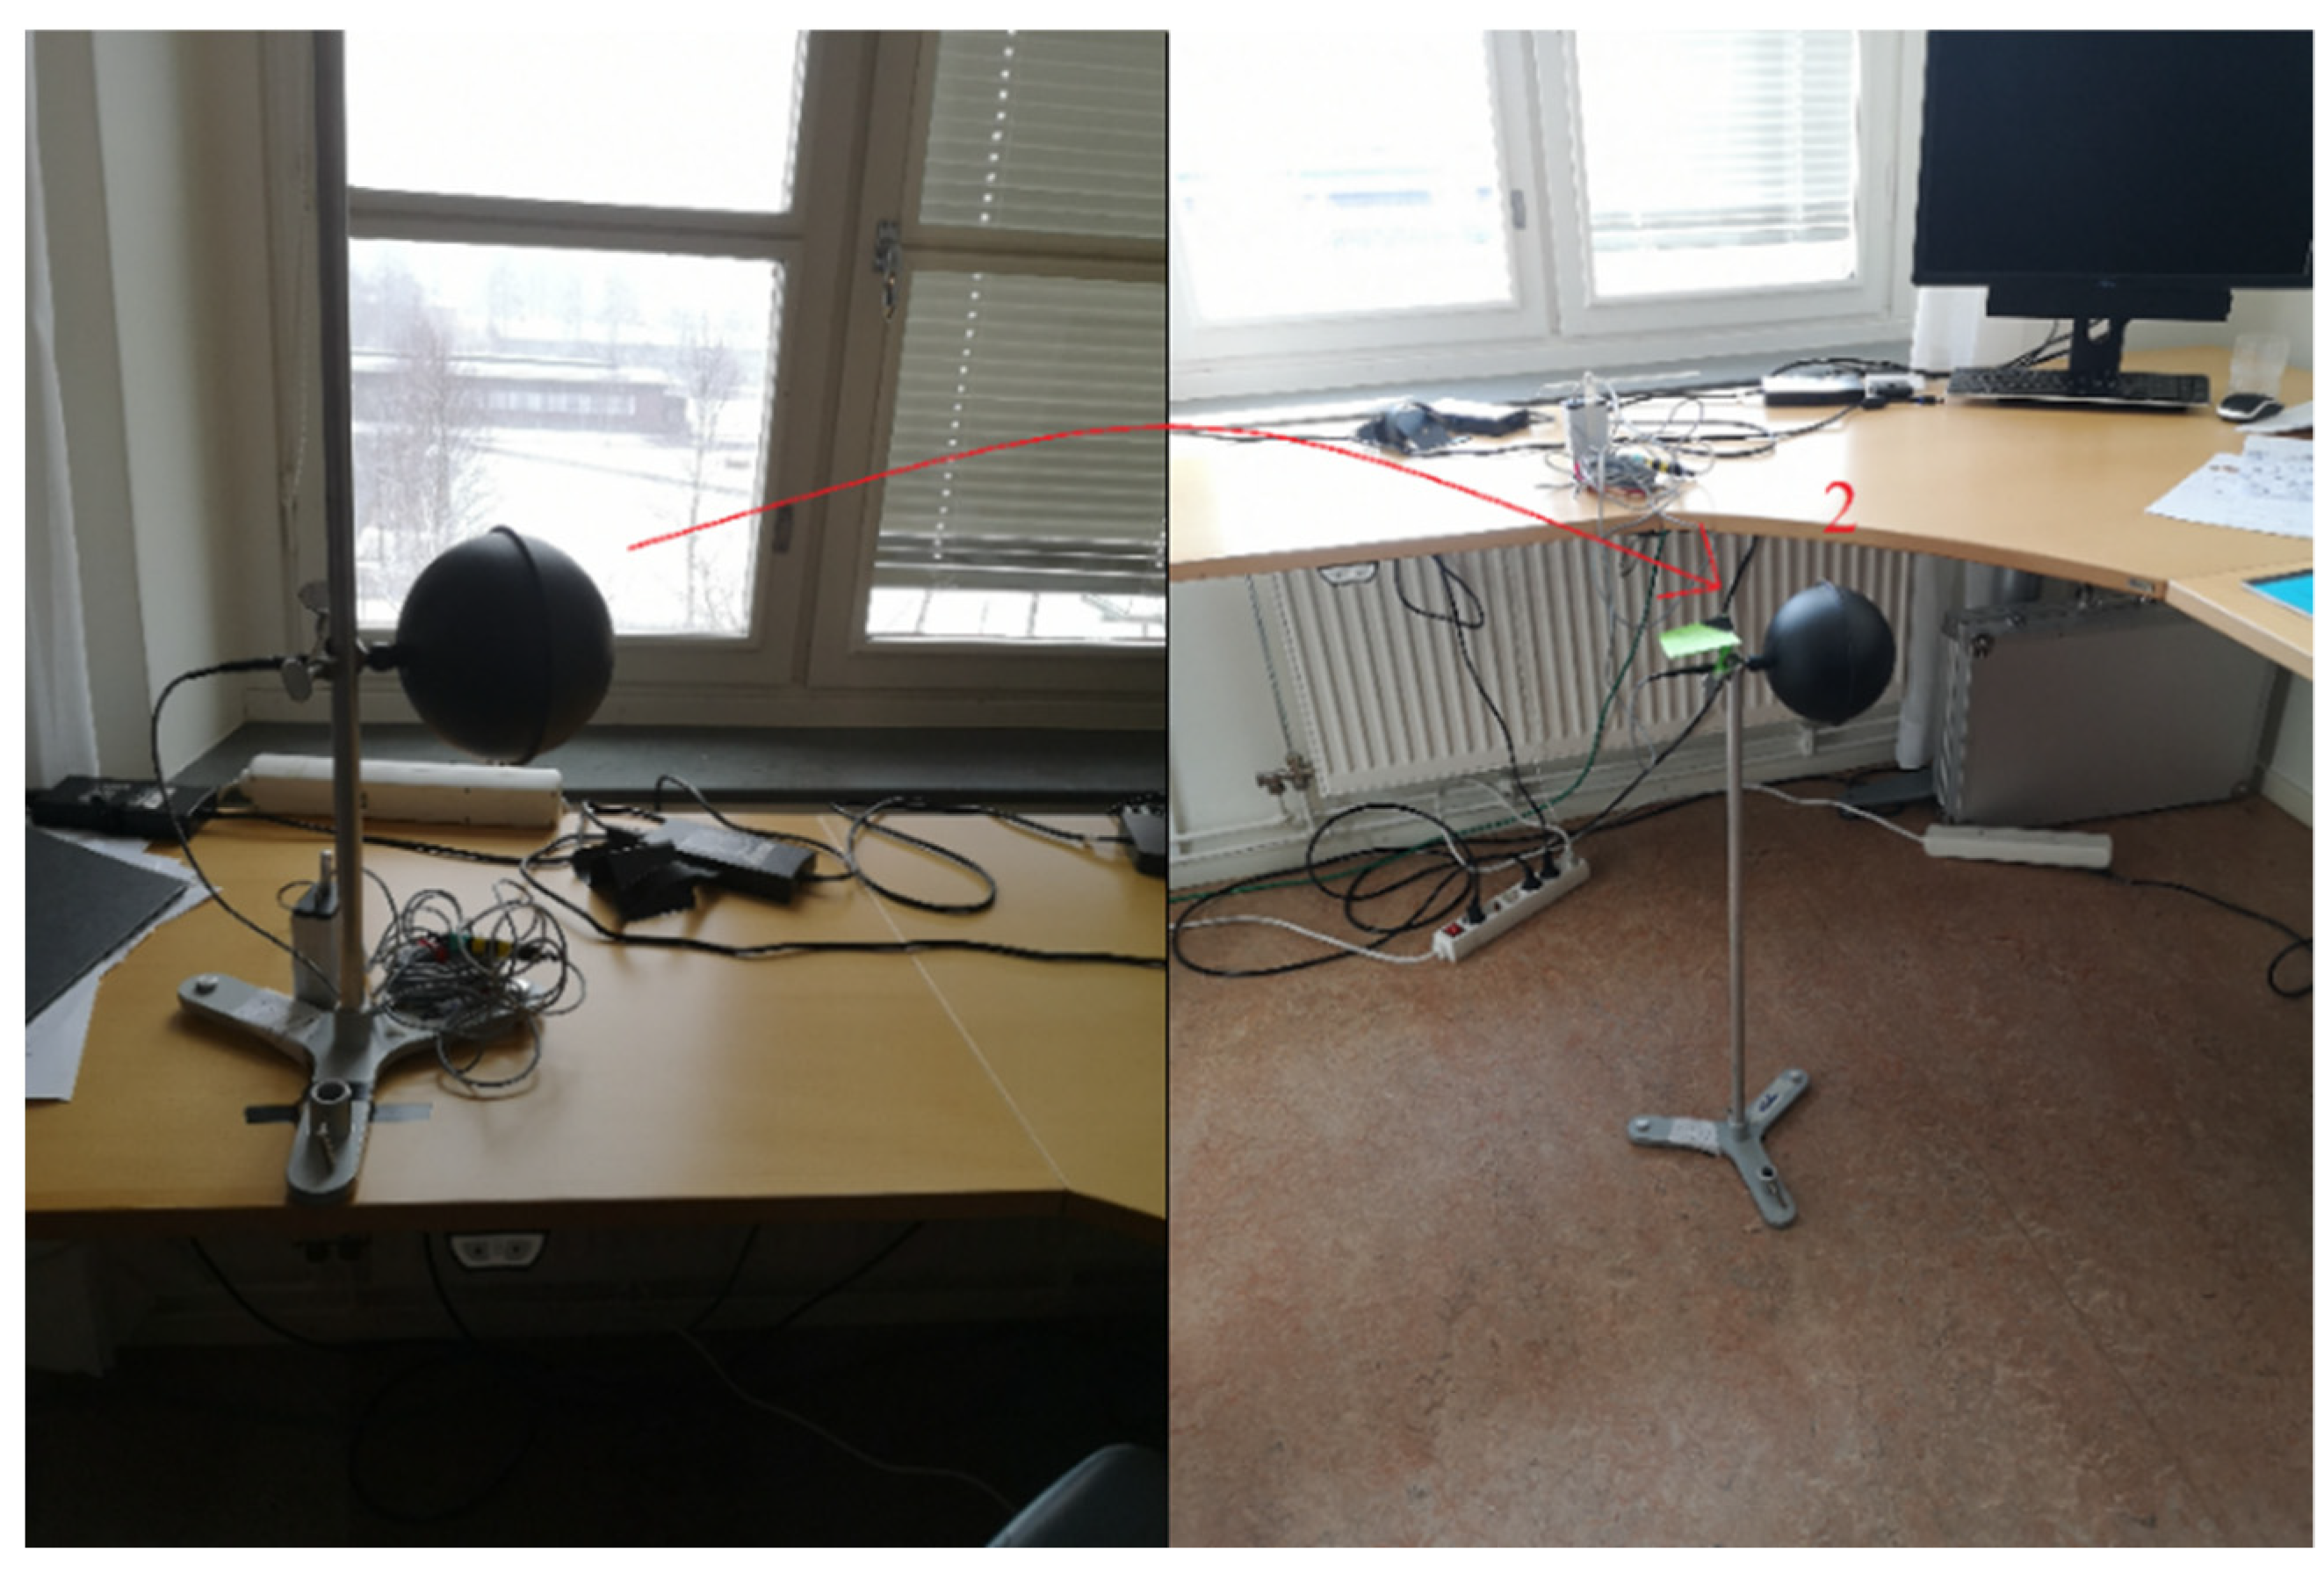
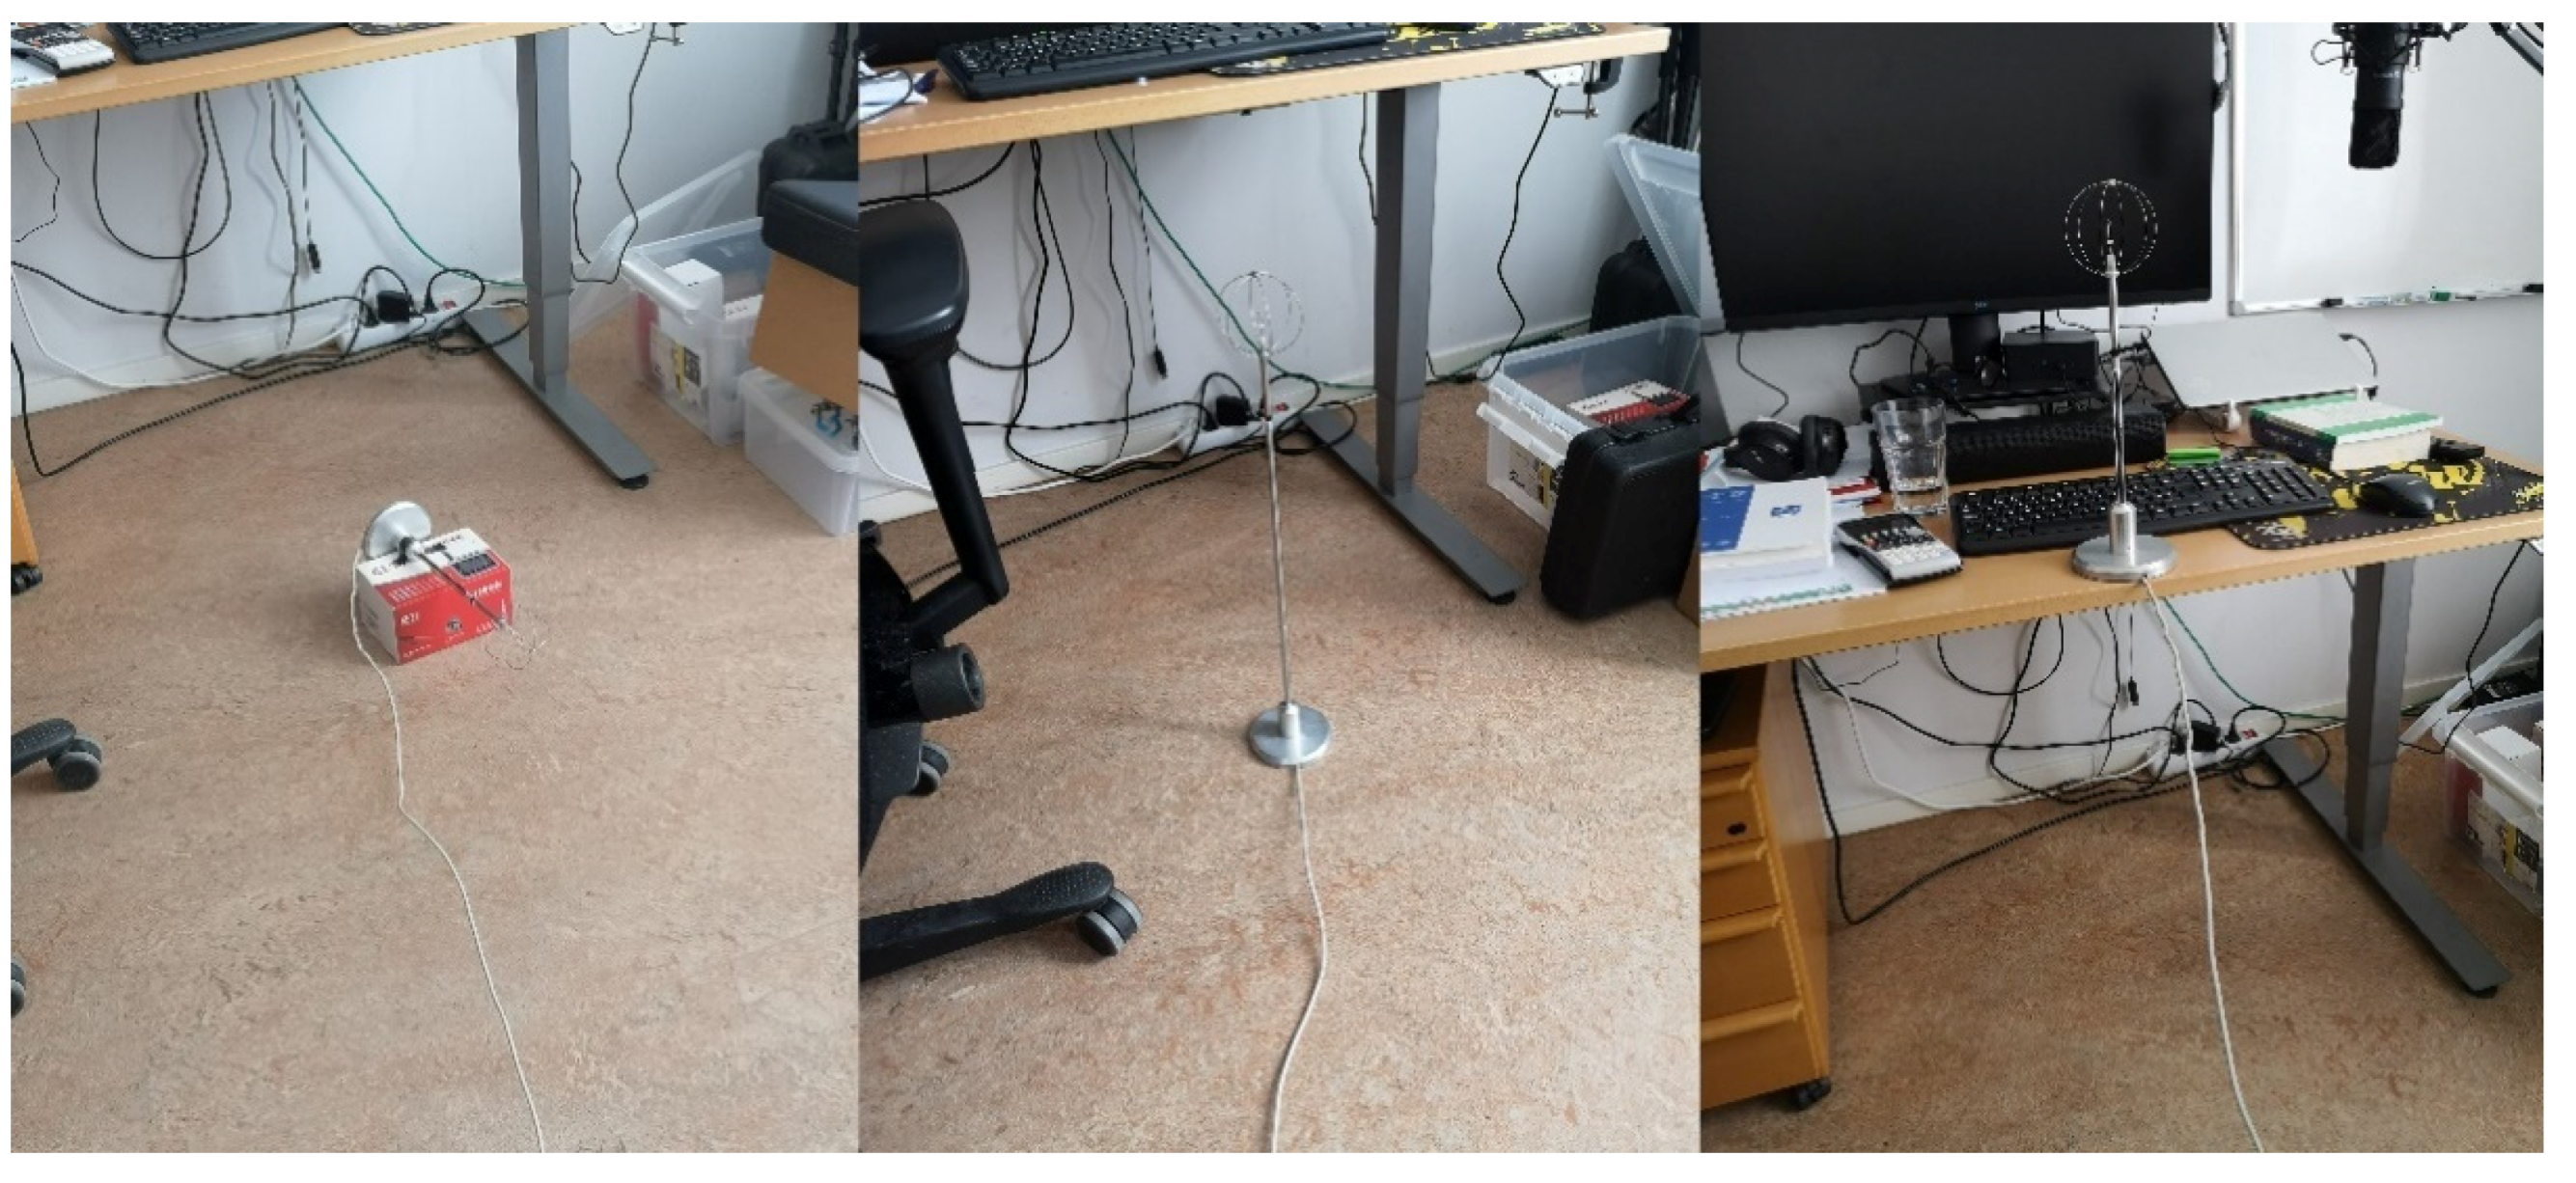
In room B, the radiator thermostat was on the highest setting (max 3), and the staff usually worked from home. In room B, loggers 3 and 18 were set up on the desk at a height of 0.8 m, with the right side of the computer screen against the wall (see Figure 9). The globe thermometer 2 was also set up on the desk in front of the window at a height of 1.08 m with an interval of five minutes. Two identical loggers were used here: 3 and 4. The difference between these was the measuring interval, which was set to 5 and 15 min respectively. In order to compare the globe thermometer in room B with the one in room C, globe thermometer 2 in this room was moved to the floor a few days after it was on the desk. It was placed at a height of between 0.7 m and 0.9 m from the window wall in front of the desk. See Figure 10 for the location of the globe thermometer before and after it was moved. The next day, the desk was lowered to 0.7 m, so that half of the globe thermometer ended up above the desk and therefore became more sunny. This meant that the log on the desktop was also lowered.

2.5. North Facing Room C

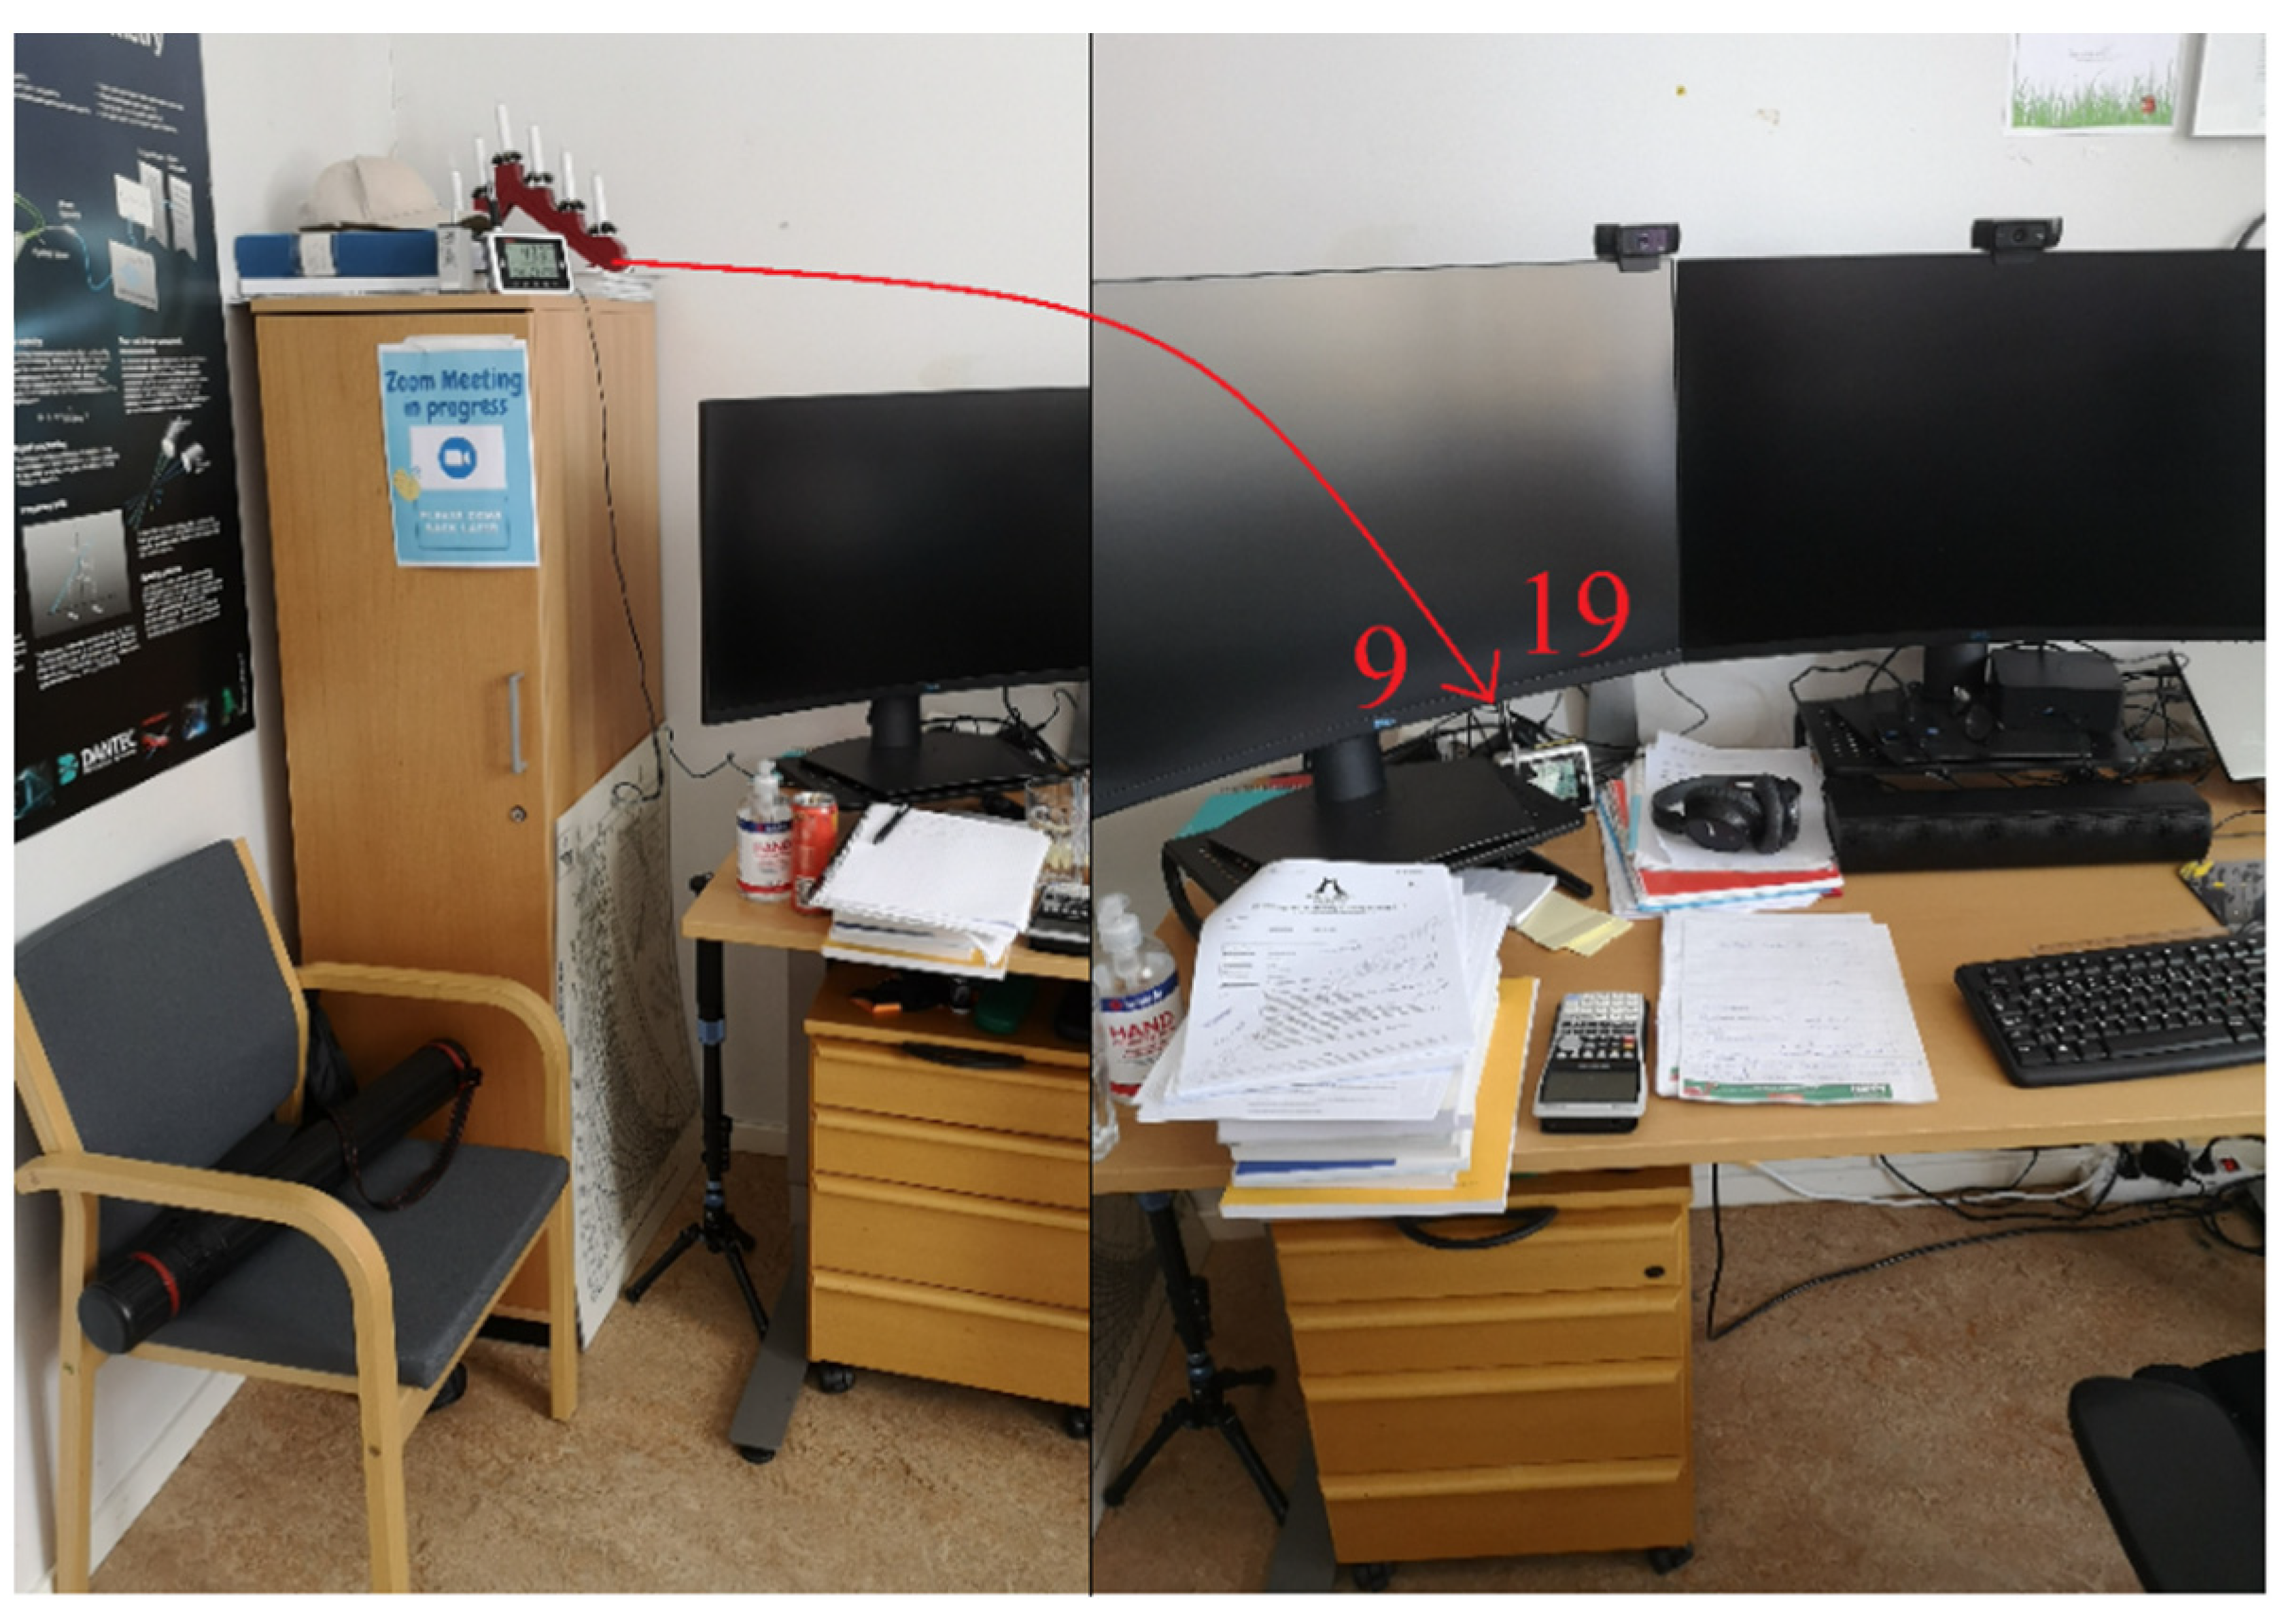
In room C, which was the only north-facing office investigated, the staff were usually in place until lunch time. Similarly, the thermostat was set to maximum. The loggers 9 and 19 were placed to the left of the desk on a piece of furniture that was 1.6 m high at first and later moved to the desk behind the computer monitor at a height of 0.8 m to resemble the placement in the other rooms. See Figure 11 for the location of the loggers before and after they were moved. On day 5, logger 14 was placed in the supply air; see Figure 12. The globe thermometer 5 was placed on a stand directly in front of the window at a height of 0.7 m, 0.75 m in front of the radiator, which meant 0.9 m from the wall.

2.6. Outdoor Measurements

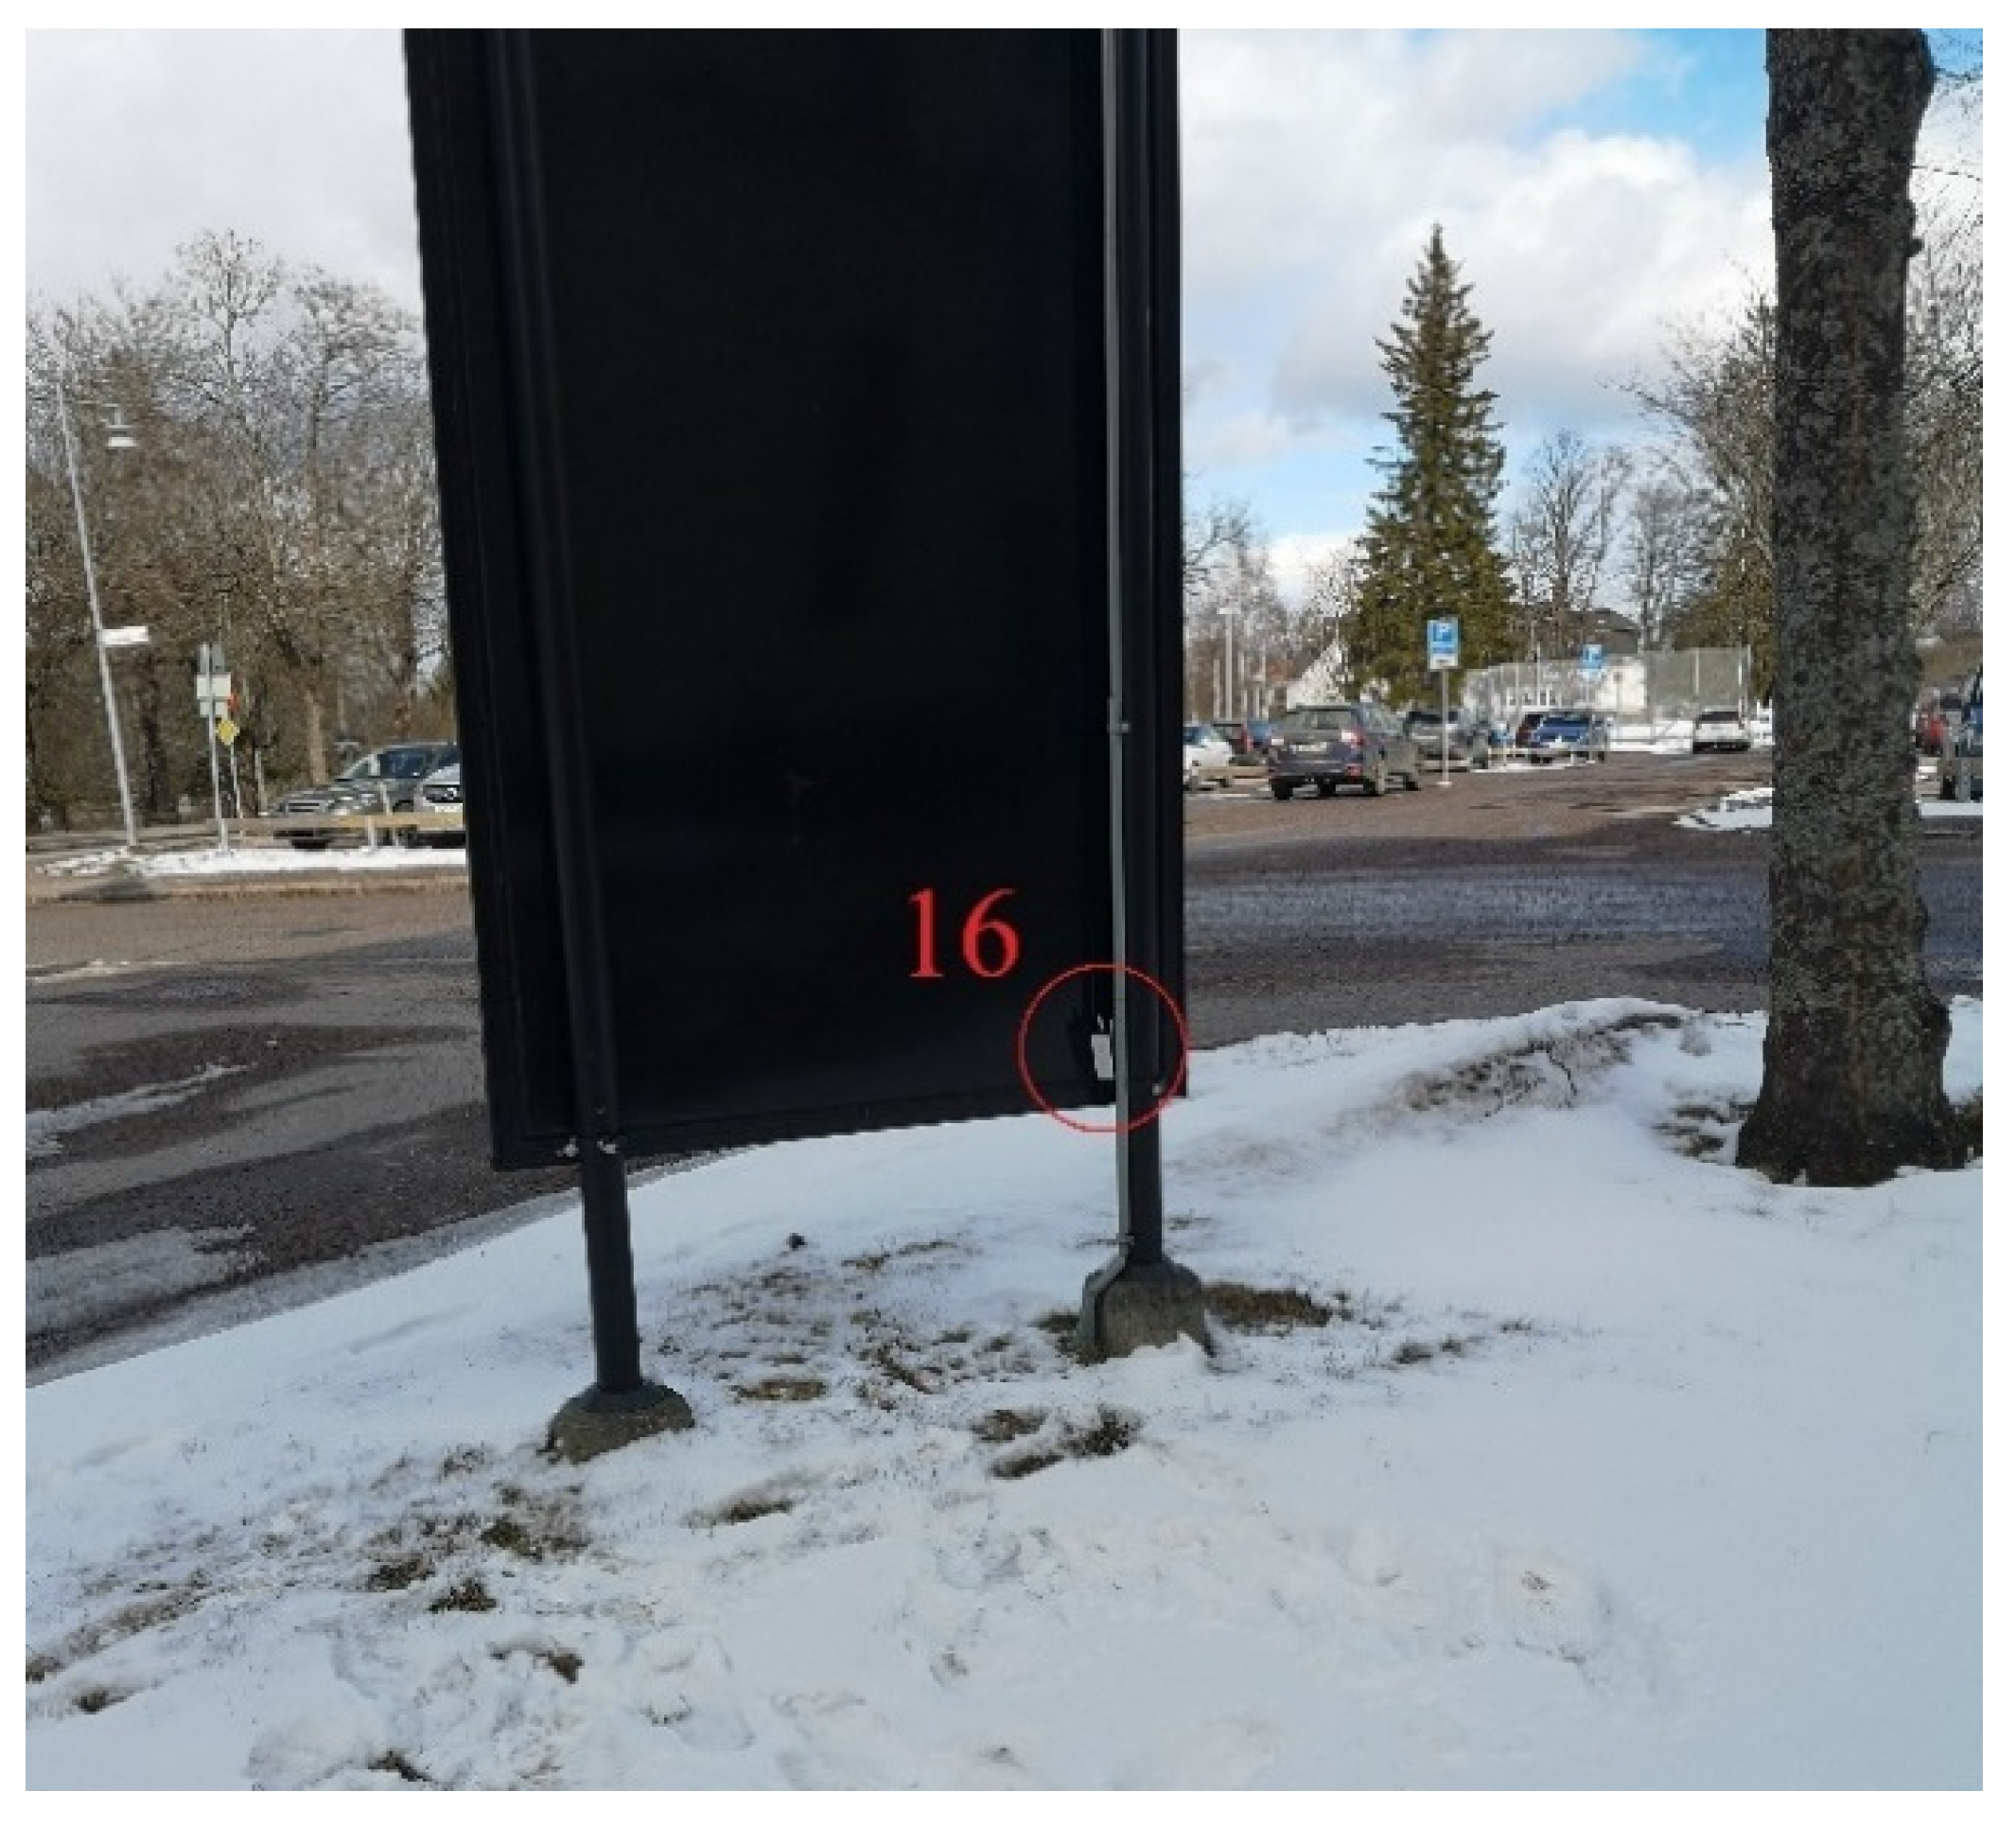
The loggers 15 and 16 were placed outdoors. The logger 15 was placed on a windowsill facing northwest on the 3rd floor, that is, the floor below the rooms where the measurements were performed. The logger was shaded all day except in the evenings. In addition, the logger 16 was placed on the back of a sign that was located north of the building (see Figure 13). The logger’s location was exposed to sunlight for approximately four hours in the morning and two hours in the afternoon.
At the University of Gävle, there was a measuring station where values for air temperature and relative humidity outside were collected.

2.7. Supply Inlet Measurements

A SwemaFlow airflow probe from Swema AB was used to measure the ventilation flows. This device can measure air flows between 1.5 and 125 L/s with a measurement uncertainty of 3% ± 0.5 L/s. The measurements were carried out on one occasion in all three rooms on the supply air devices. Figure 14 shows the measurement of the supply air flow. The plug was placed over the device, and a reading of the flow was taken. During the measurements, the doors were closed.

2.8. Airspeed Measurements

A SwemaAir 300 direction-independent comfort sensor from Swema AB was used to measure air speed in the rooms, which in addition to speed could also measure the temperature. The SwemaAir 300 has a working temperature range of 0.0 °C to 50.0 °C. The comfort sensor measured velocities in the range of 0 m/s to 1.0 m/s with an accuracy of 0.03 m/s within 10.0 °C to 35.0 °C. The measurements were carried out in two of the rooms, room B in south orientation and room C in north orientation. The same measurement was carried out on two different occasions during the day when the ventilation was running. Further, no occupants were present during the air velocity measurements.
The air velocity measurements were done according to ISO 7726 at three different heights: 0.1 m, 0.6 m, and 1.1 m. Three measurements were made at each height in each room, and the measurement interval was set to 1 s. Each measurement period lasted for 30 s. Figure 15 shows the position of the air velocity measurements. The air measurements were taken for Room B(s) and Room C(n).

3. Results and Discussion

3.1. Indoor and Outdoor Climate

The temperatures indoors and outdoors follow each other to some degree; that is, there was an increase in the indoor temperature when it got warmer outside, as can be seen in Figure 16. The temperature in room A was very high on April 5–6, but the reason for this was that the thermostat was set to maximum, and then it was lowered on April 7. Room C, in the north direction, had the lowest temperature for almost the entire period and usually stayed below 23 °C. In addition, room B had the highest temperature during the peaks. Both rooms A and B reached higher temperatures than 24 °C during the measurement period—24.2% and 20.6% of the measurement period, respectively. The temperature in room B also reached above 26 °C on certain occasions, which amounted to 1.6% of the total measurement period. The weather notes shown in Figure 16 have been recorded from 09:00 to approximately 16:00 during the day. The result for the air temperature in the study shows that it does not completely stay within the existing guidelines. None of the rooms gets below 20 °C, which is good, but on the other hand, both south-facing rooms (A and B) get temperatures above 24 °C about 20% of the time, which is the highest value during the winter according to ANSI/ASHRAE Standard 55-2017 [32]. Since there is no cooling equipment installed in these rooms, the overheating of the rooms in the south direction will only get worse when the outdoor climate gets warmer, i.e., during summertime.
The air temperatures in the north-facing room (C) remained fairly even at around 21–23 °C. In a south-facing position, the air temperature varied between 22–27 °C in room B, where sun protection was not used, and between 22–25 °C in room A, where sun protection was used to a certain extent. This matches relatively well with the results from other studies, which have shown an indoor temperature of 20.5–23 °C at 5 °C outdoors in heavy buildings in Sweden [22]. The difference between room A and room B is also consistent with the results of other studies that have shown that using sun protection (curtains or blinds) can lead to an approximately 1–2 °C lower indoor temperature [33].
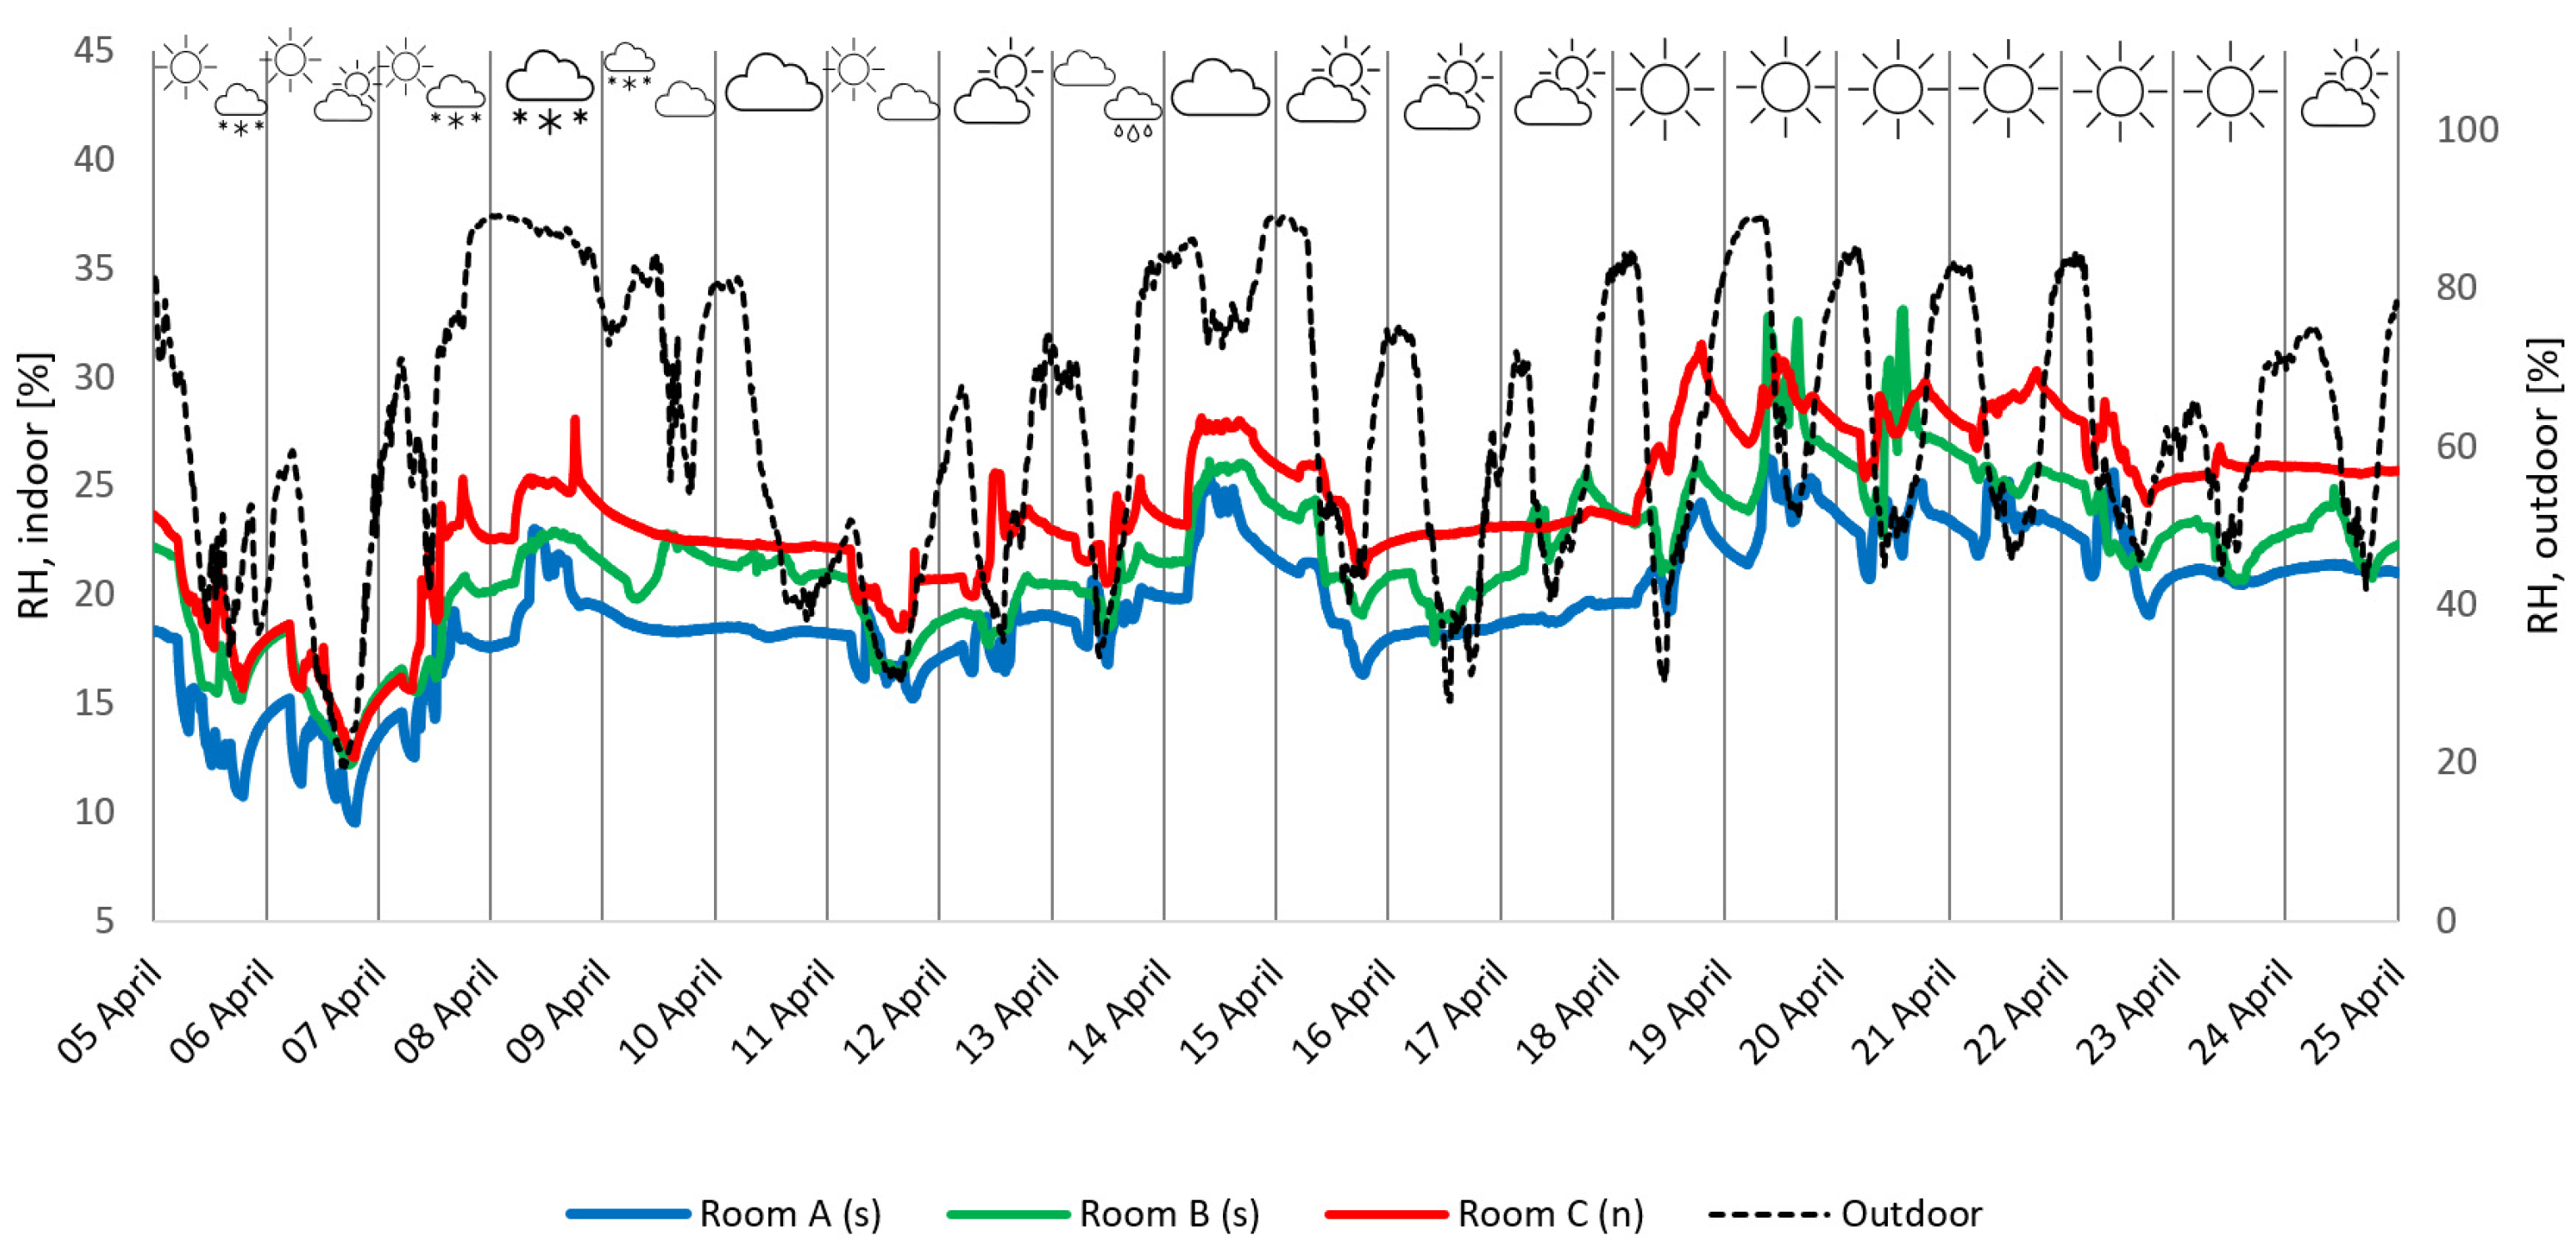
The relative humidity indoors follows that outside to some extent, as can be seen in Figure 17. The RH increase and decrease at roughly the same times in many instances. This can for example be observed at time periods between 6–8 April and between 14–15 April. Room C, facing north, usually has the highest relative humidity, and room A usually has the lowest. On most days, outdoor RH peaks in the early morning and is lowest in the afternoon after 12:00. On April 8, the moisture content did not decrease outdoors because of the snow. During the weekends, i.e., the dates 9–10, 16–17, and 23–24, the ventilation is switched off, and therefore the RH indoors shows little variation.
The relative humidity indoors was very low and stayed mostly between 10–30%. The guidelines [19] say it should be 40–60% indoors, which was never reached during this study. The guidelines also state that a relative indoor humidity below 20% is not good for health, and in the rooms, as mentioned, the humidity was often below that value. The RH results from this study show similarity to the results that Hamid, Johansson, and Bagge [22] reached, which showed a RH of 12–27% indoors at 5 °C outdoors in heavy buildings in Sweden. The relative humidity was almost always highest in room C, which was the room that always had the lowest temperature. As previously mentioned, this is because colder air can carry a smaller amount of moisture, and the relative moisture content then becomes higher for the same amount of moisture. On the other hand, there were occasions where room B had a higher relative humidity than room C and at the same time the highest temperature, which should mean that the amount of moisture, i.e., the absolute moisture content, was higher in room B. This can also be explained by the presence of people inside the room.
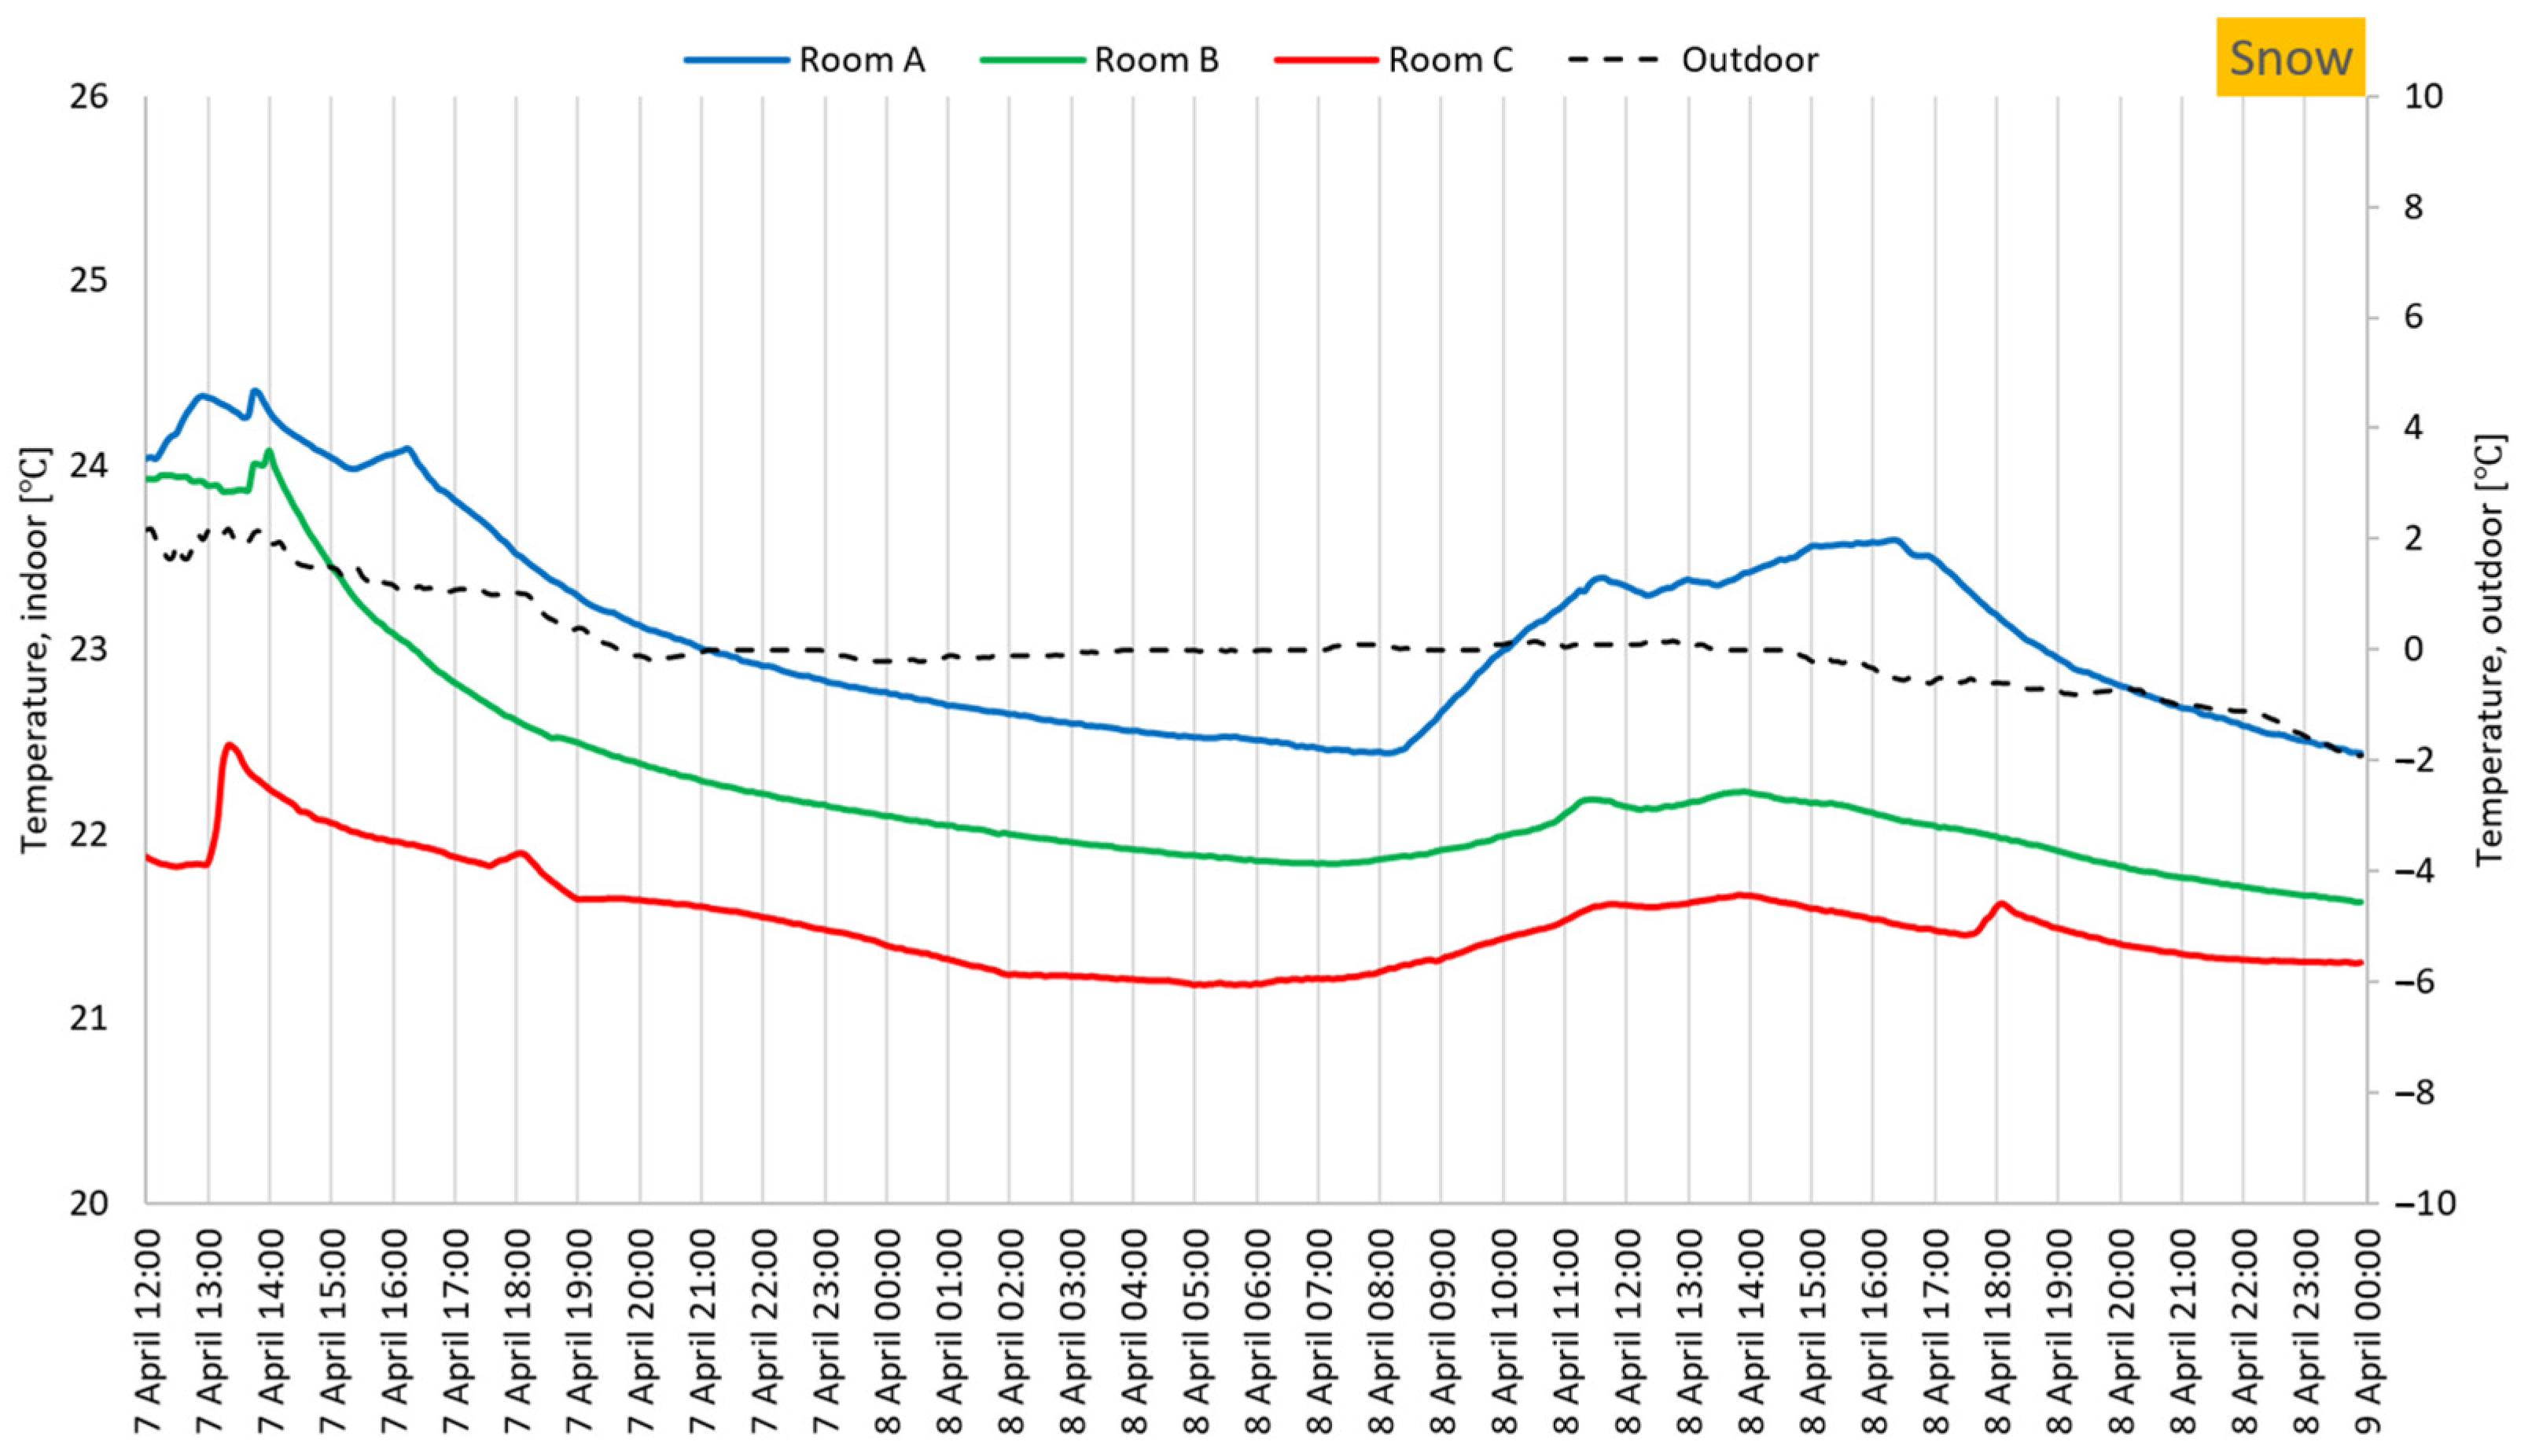
Figure 18, Figure 19, Figure 20, Figure 21, Figure 22 and Figure 23 show temperature and humidity indoors and outdoors on selected days when it was snowing, cloudy, and sunny. Figure 18 and Figure 19 show 1.5 days when it was snowing outside. During this period, there were staff in room A until 16:15 on the first day and staff from 8:10–16:20 on the second day. There were no staff or curtains in room B, but one blind was down. In room C, there were no curtains until 17:40 on the first day, and then short curtains were drawn, and there was no staff presence except from 13:00–13:30 on the first day and a short period at 18:00 on both days. The outdoor temperature was around 2 °C at the beginning of the period and gradually dropped to approximately 1 °C. Indoor temperatures dropped during the night but then increased again in the morning, especially in room A when the staff arrived. Additionally, the relative humidity outside increased at 18:00 on the first day when it started snowing heavily. At the same time, the relative humidity indoors begins to drop, which may be due to the ventilation being turned off. The relative humidity indoors then increases at 05:00, and that is because ventilation is started at that time.
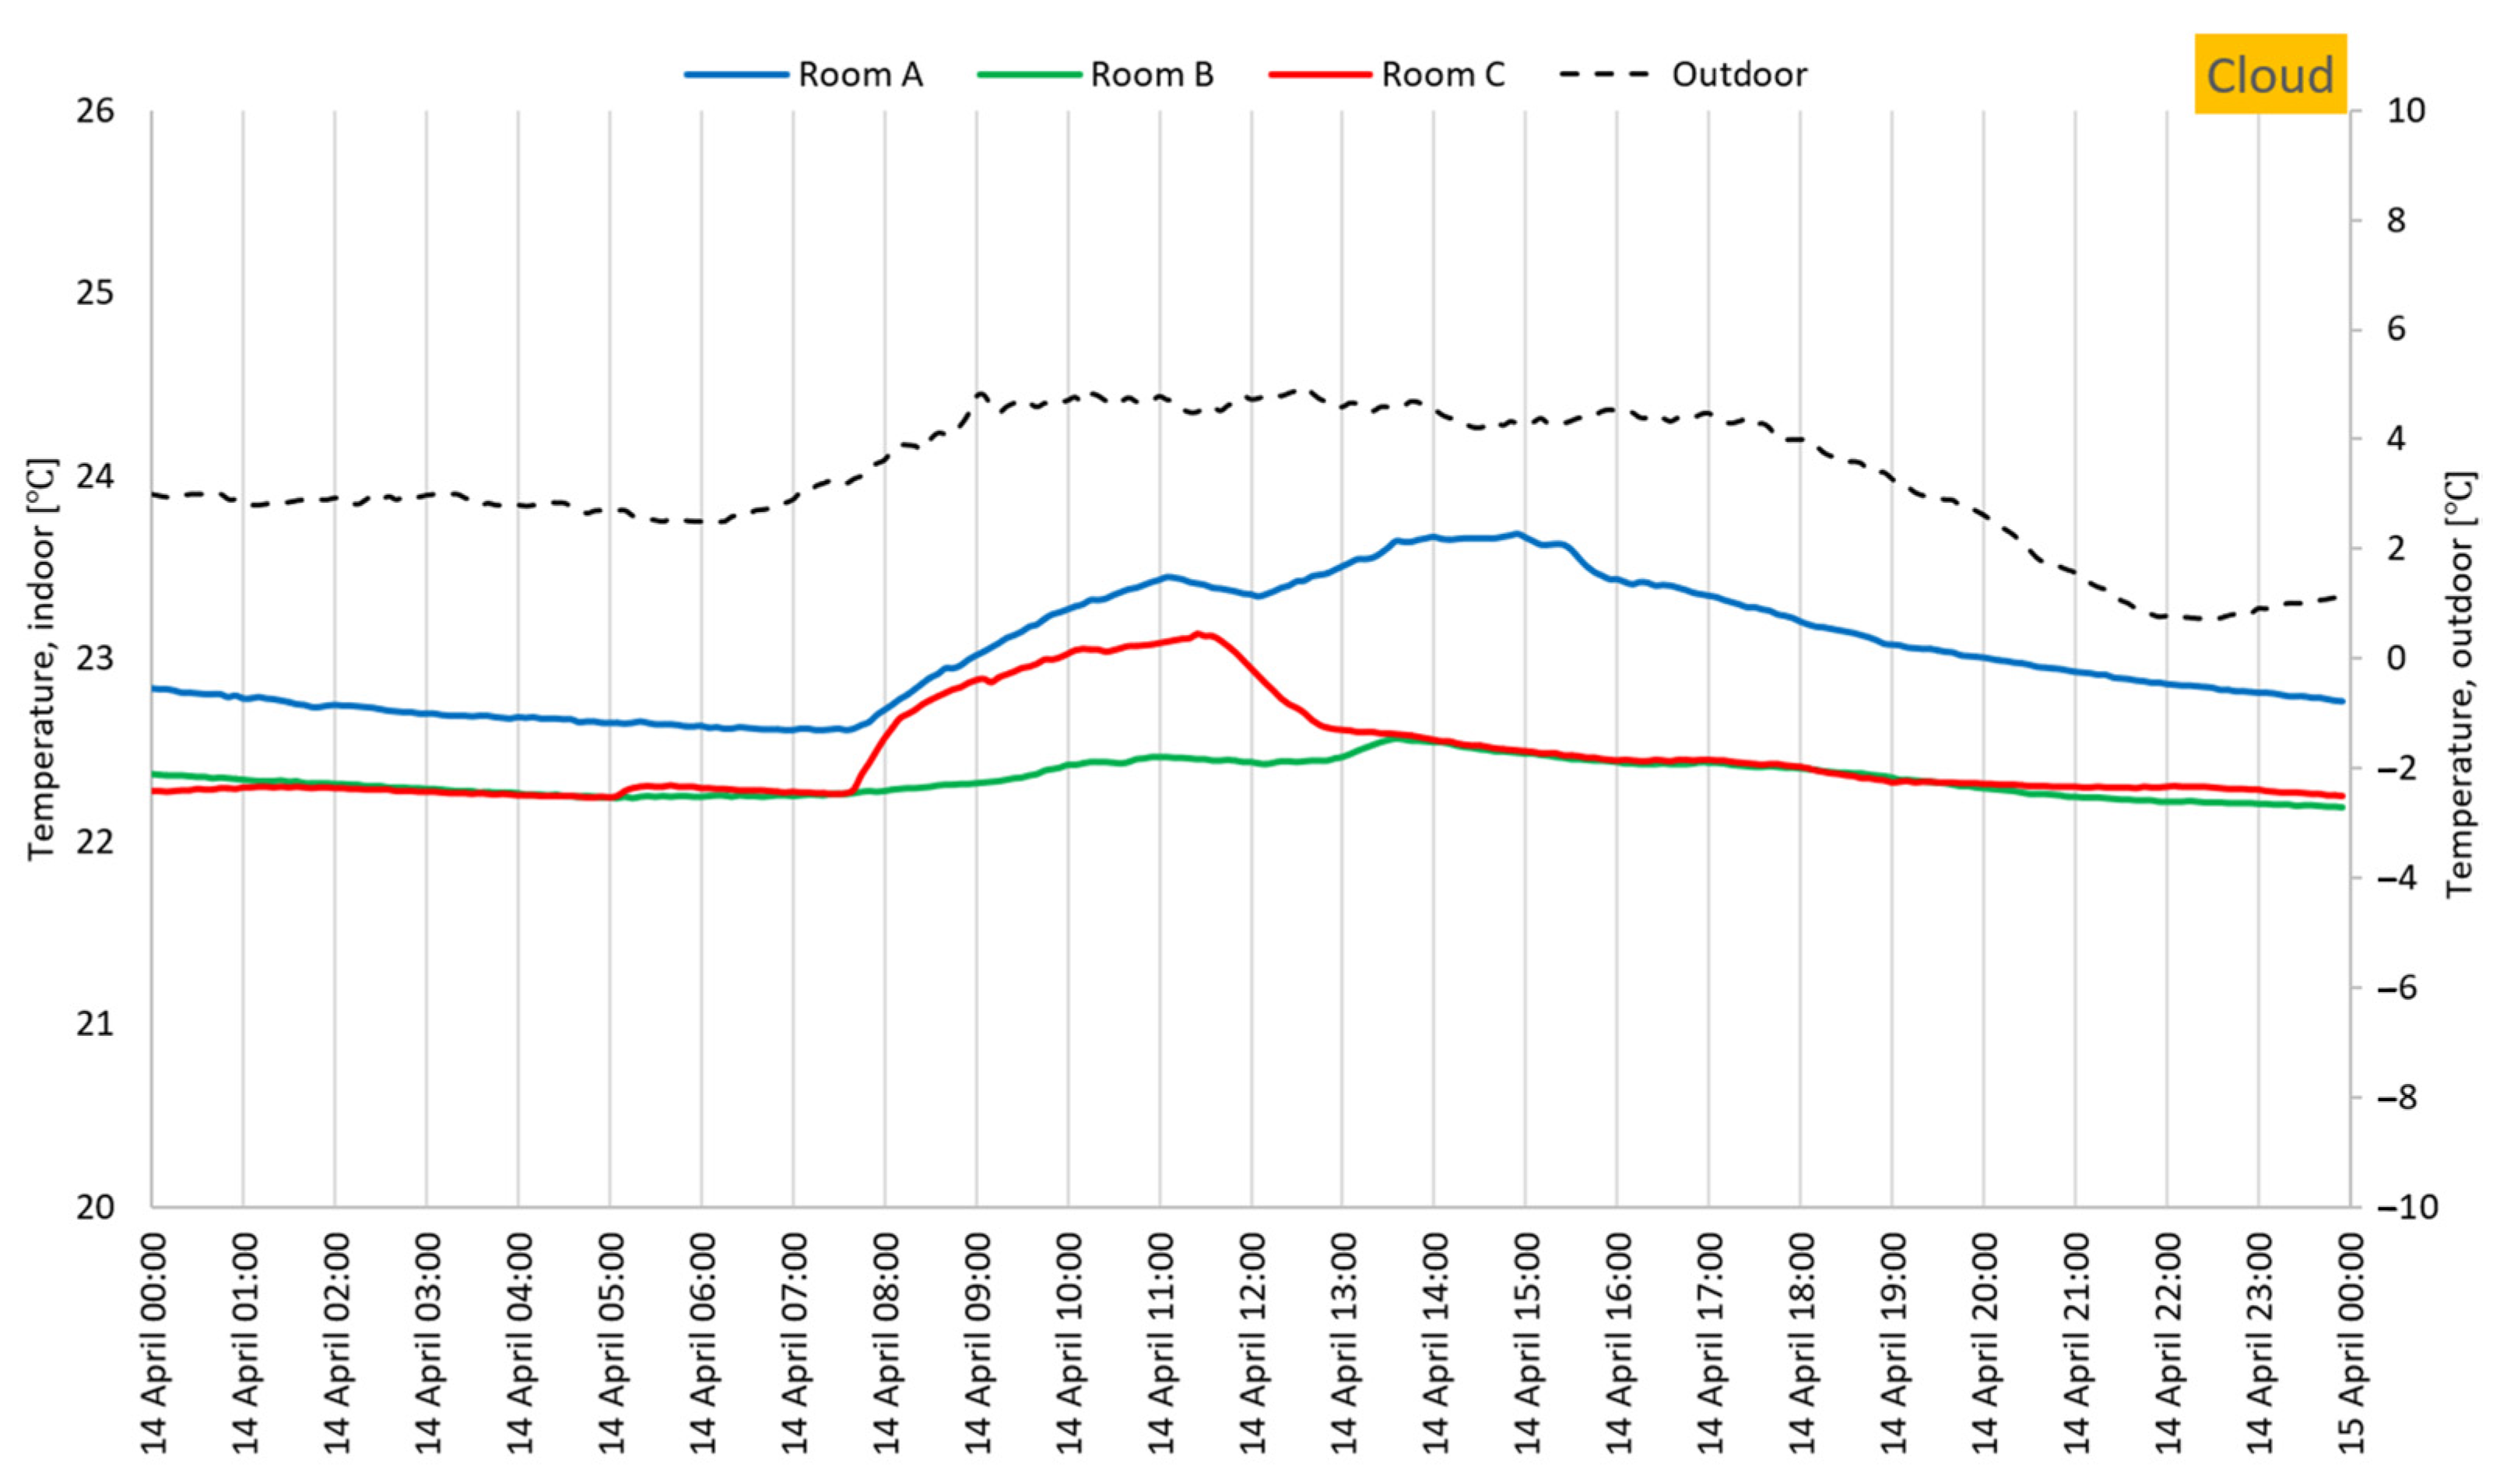
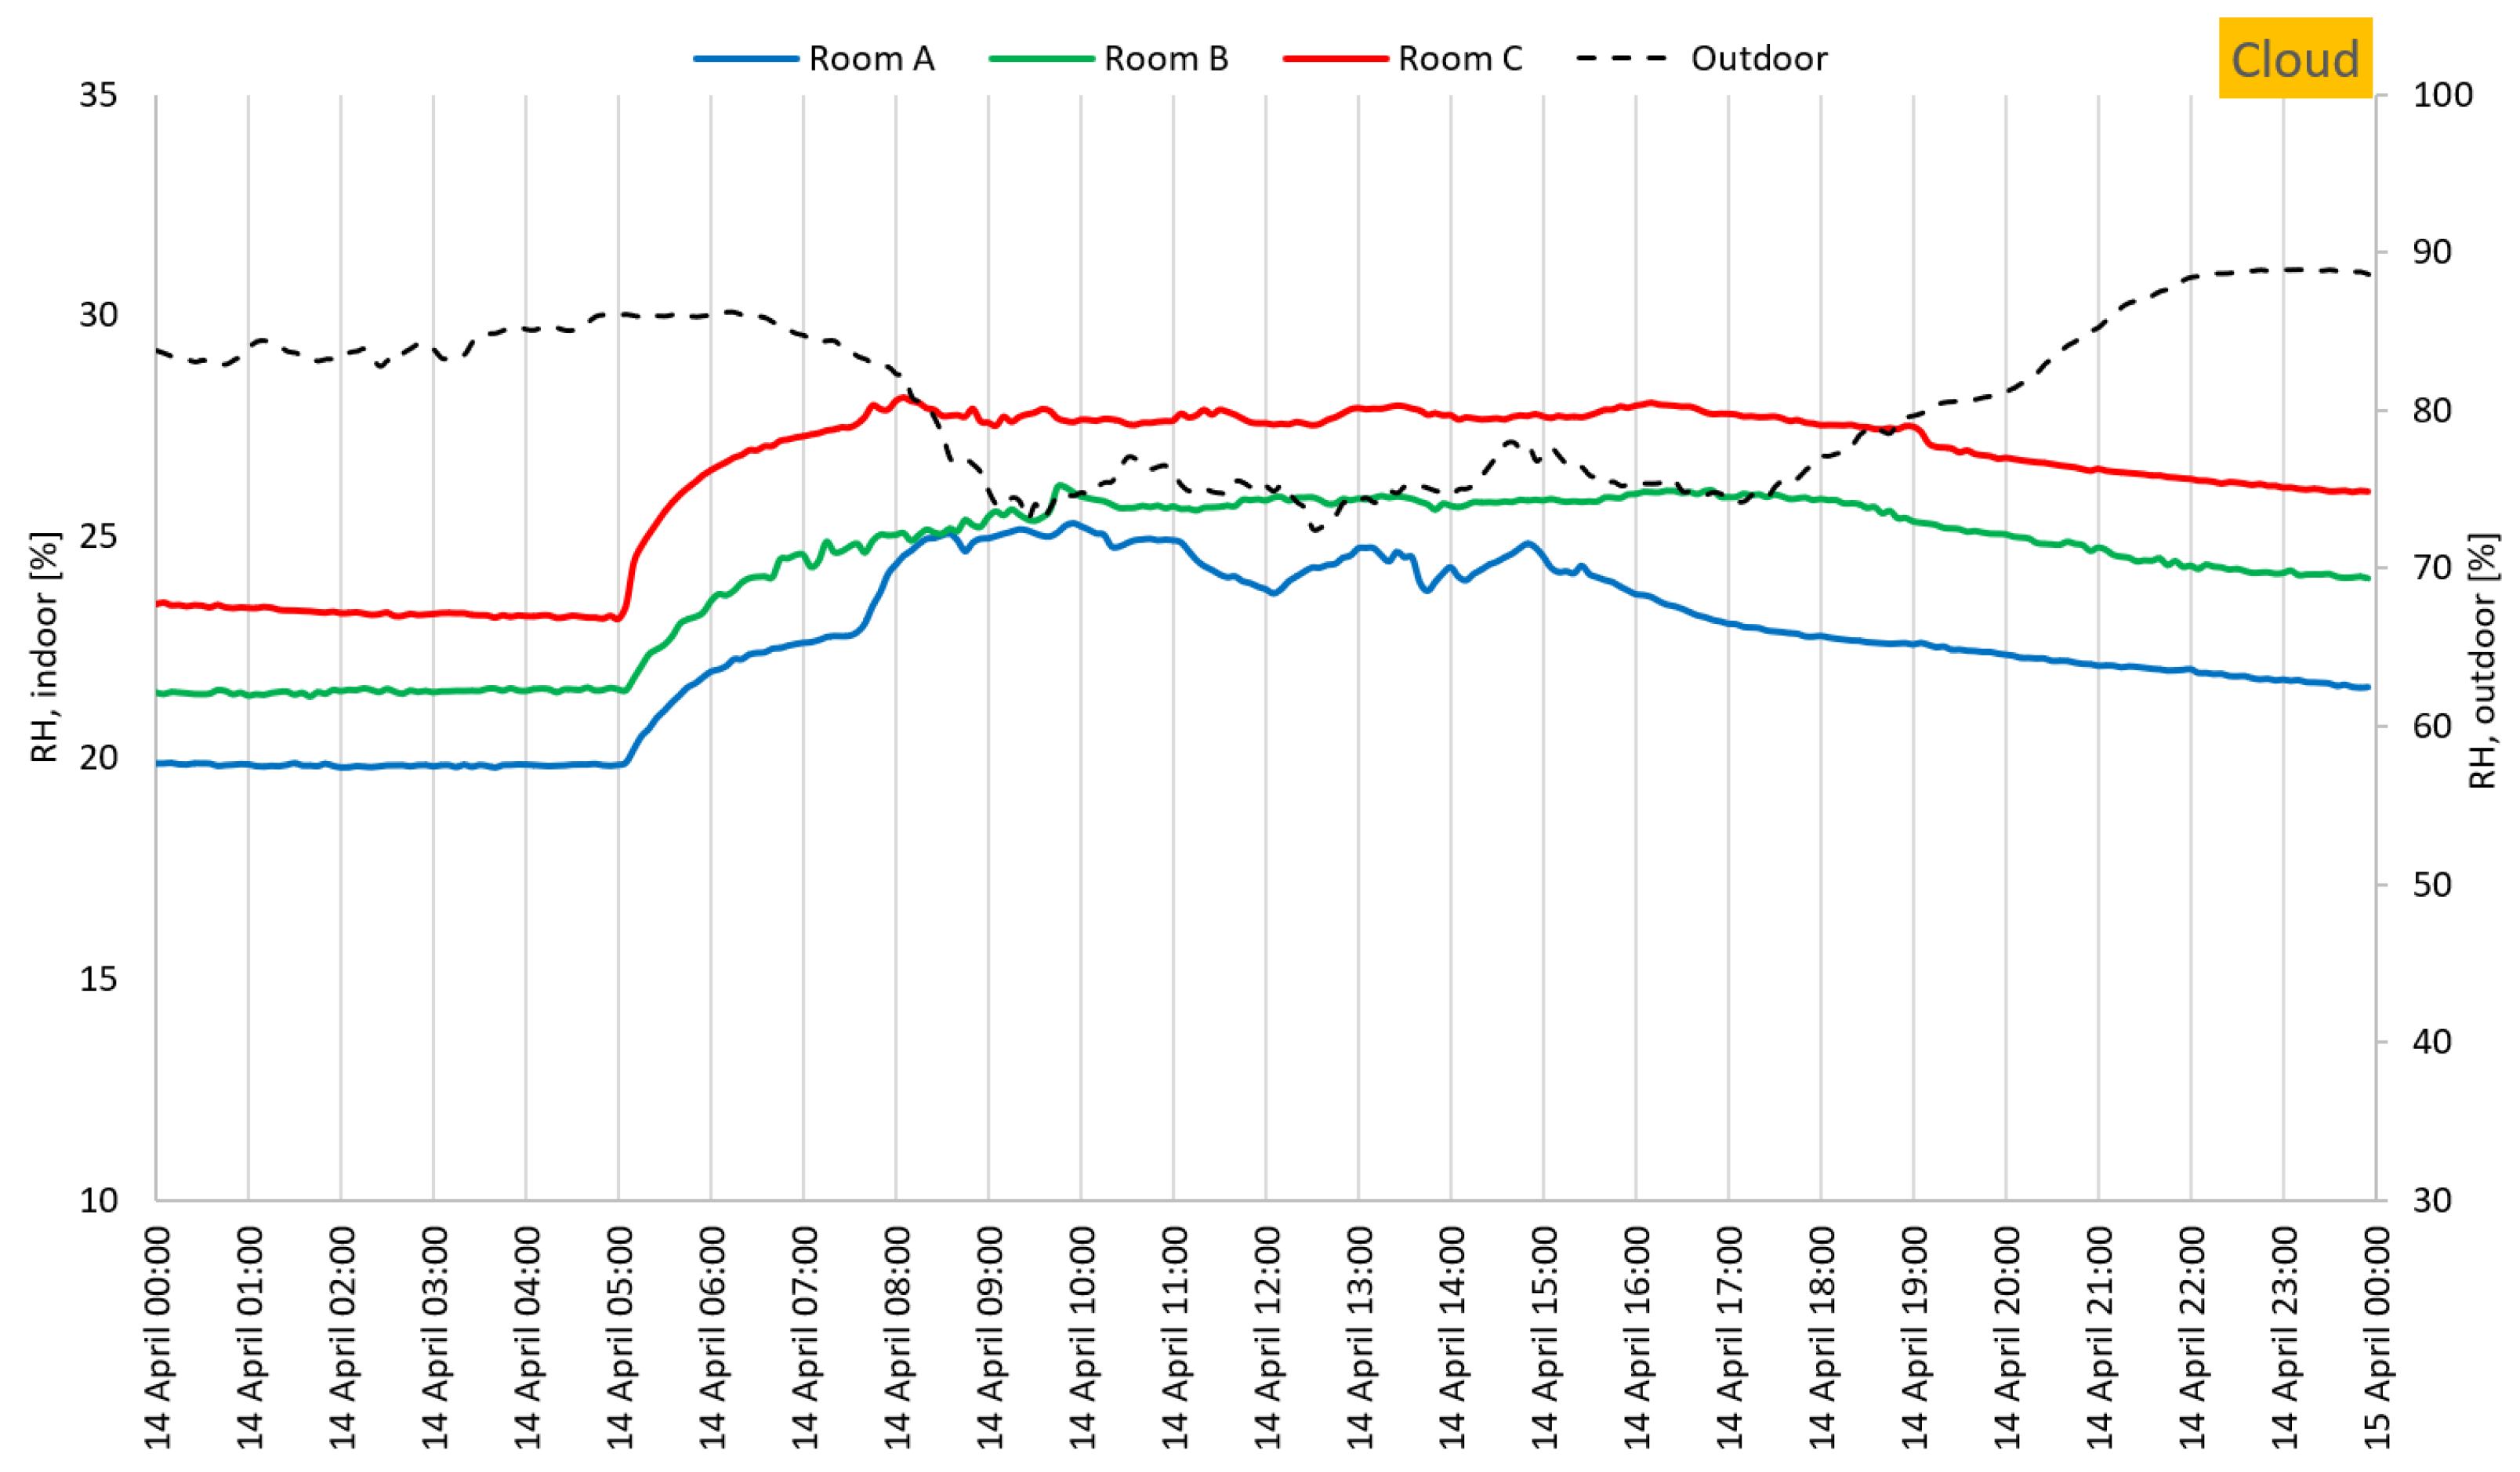
Figure 20 and Figure 21 show a day when it was cloudy outside. During this time, room A was staffed from 7:30 a.m. to 3:20 p.m. In room B, there were no curtains or blinds and no staff. In room C, there were drawn curtains and staff from 7:30 to 11:30. The outdoor temperature during this day was around 3 °C at night and 5 °C during the day. The indoor temperatures for rooms B and C follow each other throughout the day, except during the period when people are present in room C. Room A is slightly warmer at the night and stays warmer during the day when people are there. The outdoor relative humidity is between 85–90% at night and drops to approximately 75% between 9:00 and 17:00. The indoor humidity increased at 05:00 when the ventilation was started. The highest value was obtained in Room C(n) at around 27 %. The rooms B and C (on the south side) had lower RH values, Room B around 25 % between 09.00–18.00 and Room C a little lower than Room B.
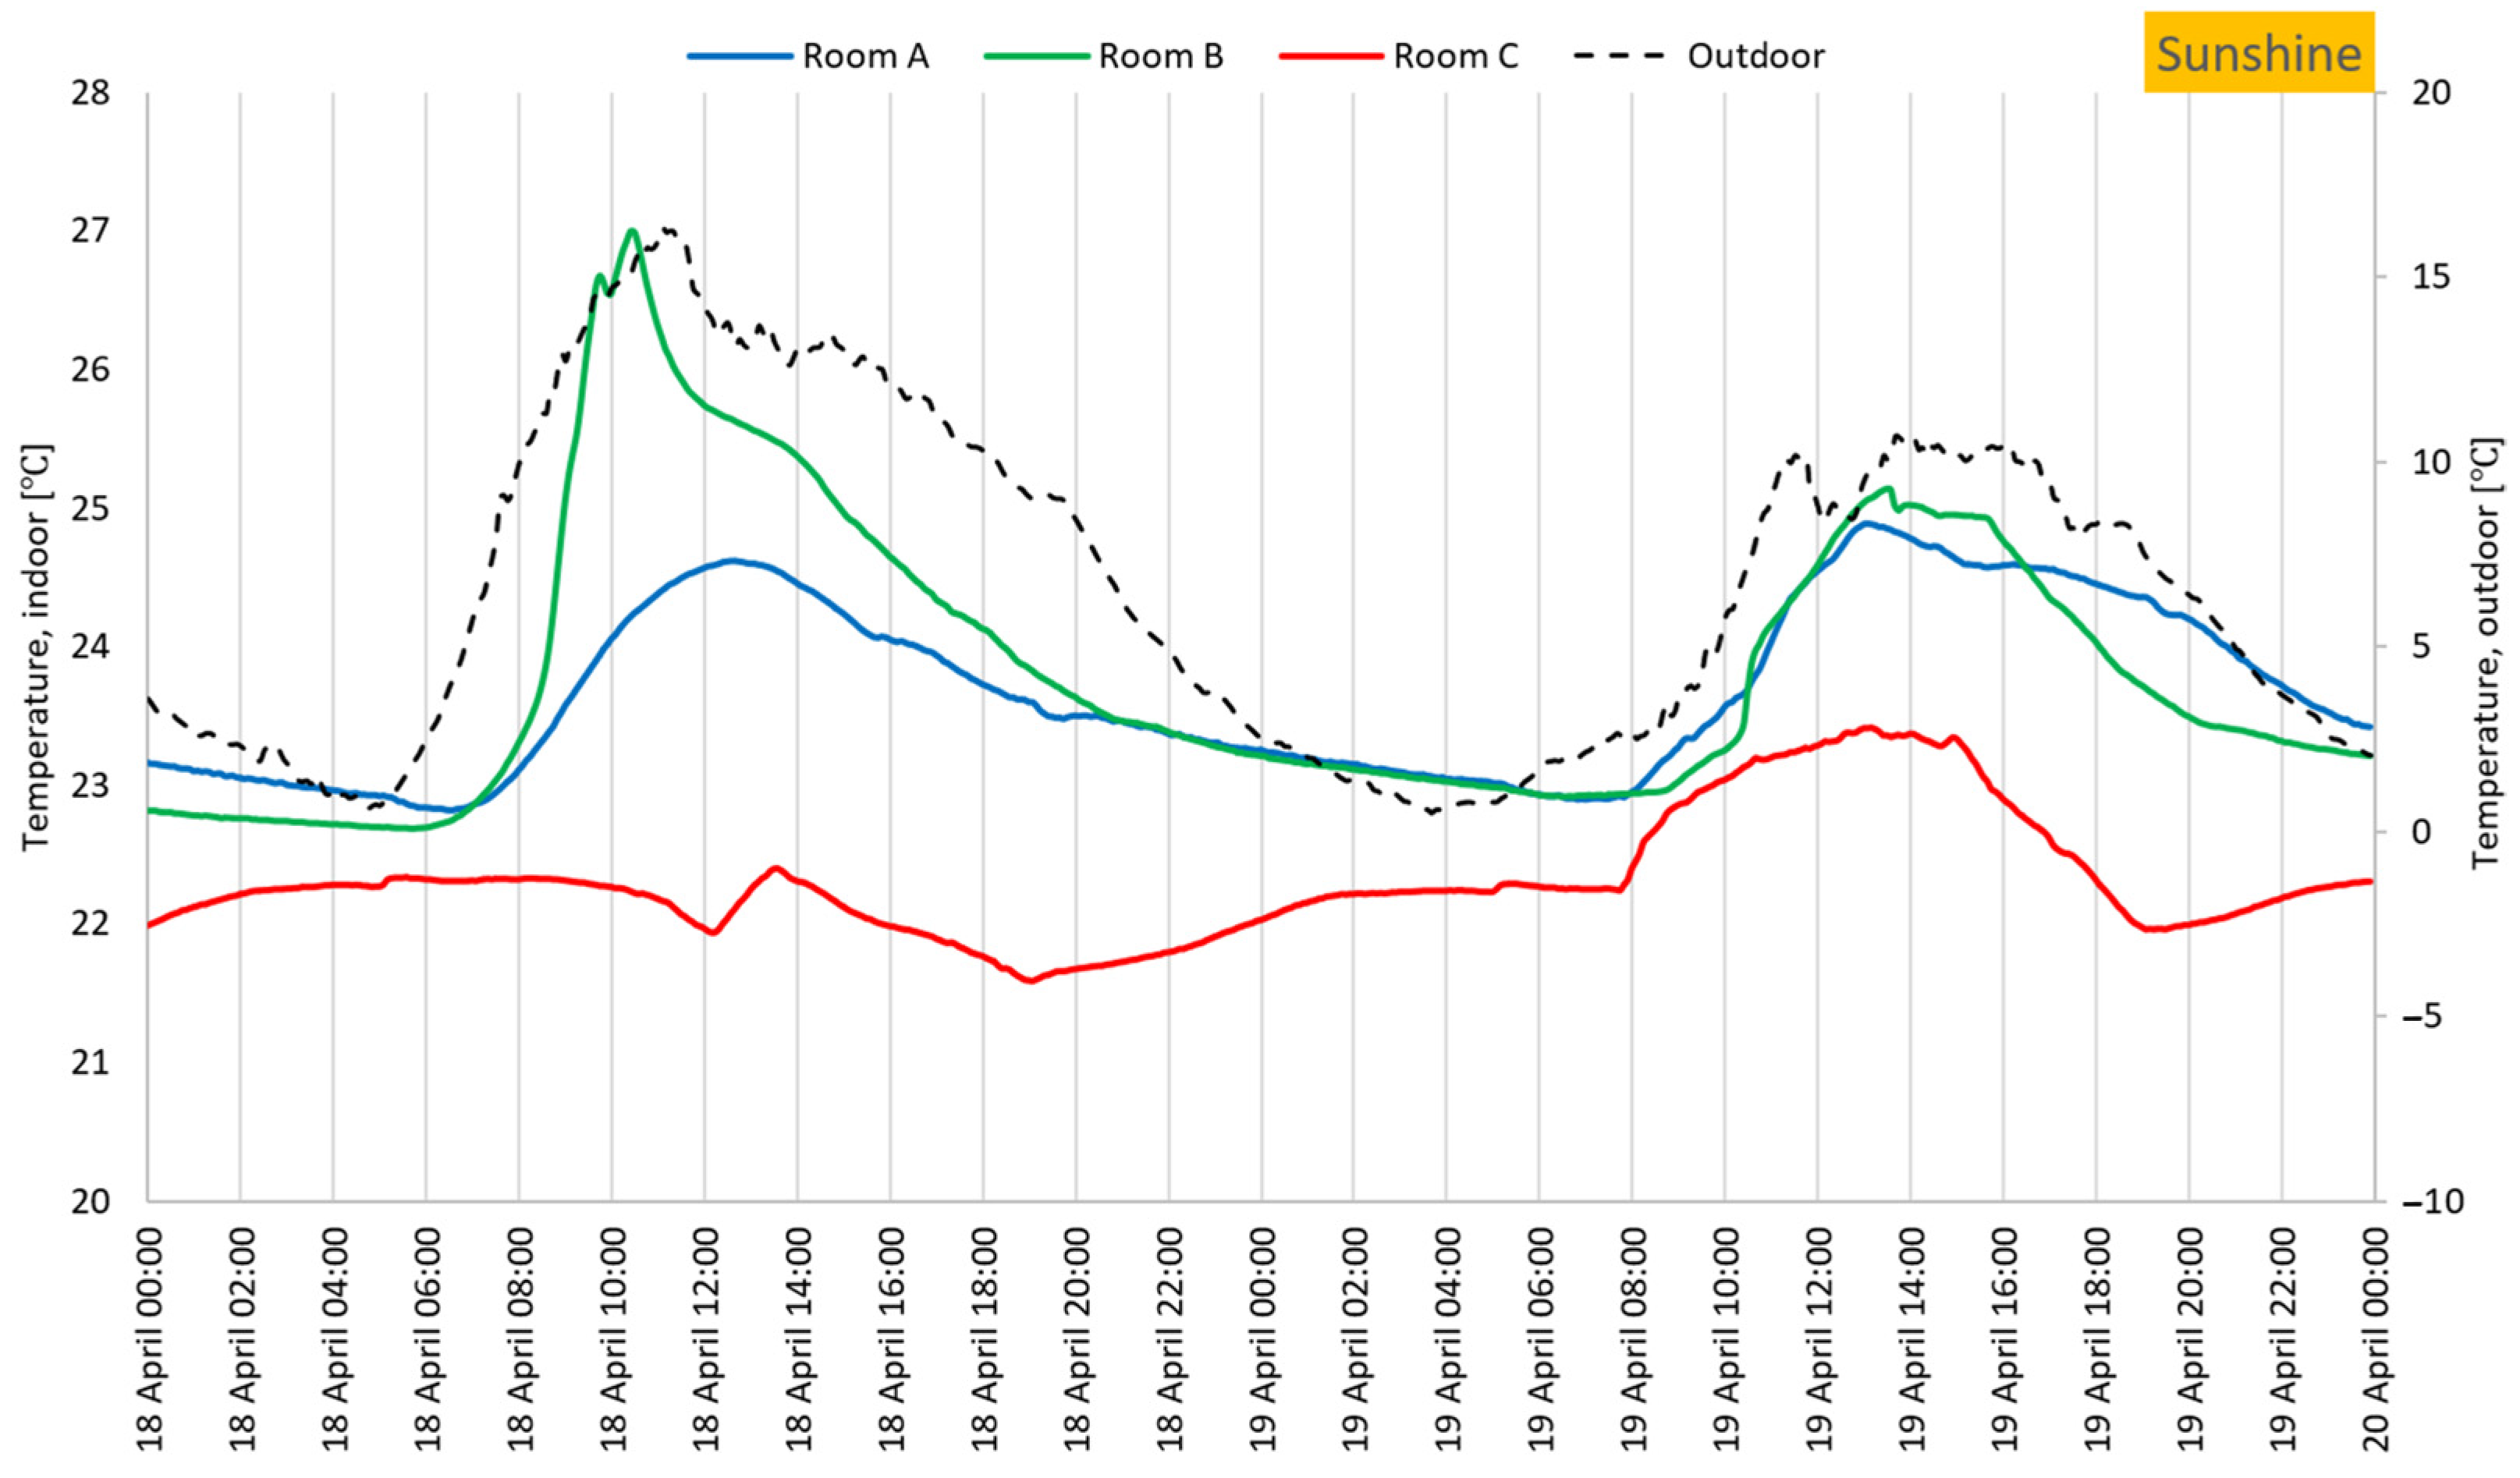
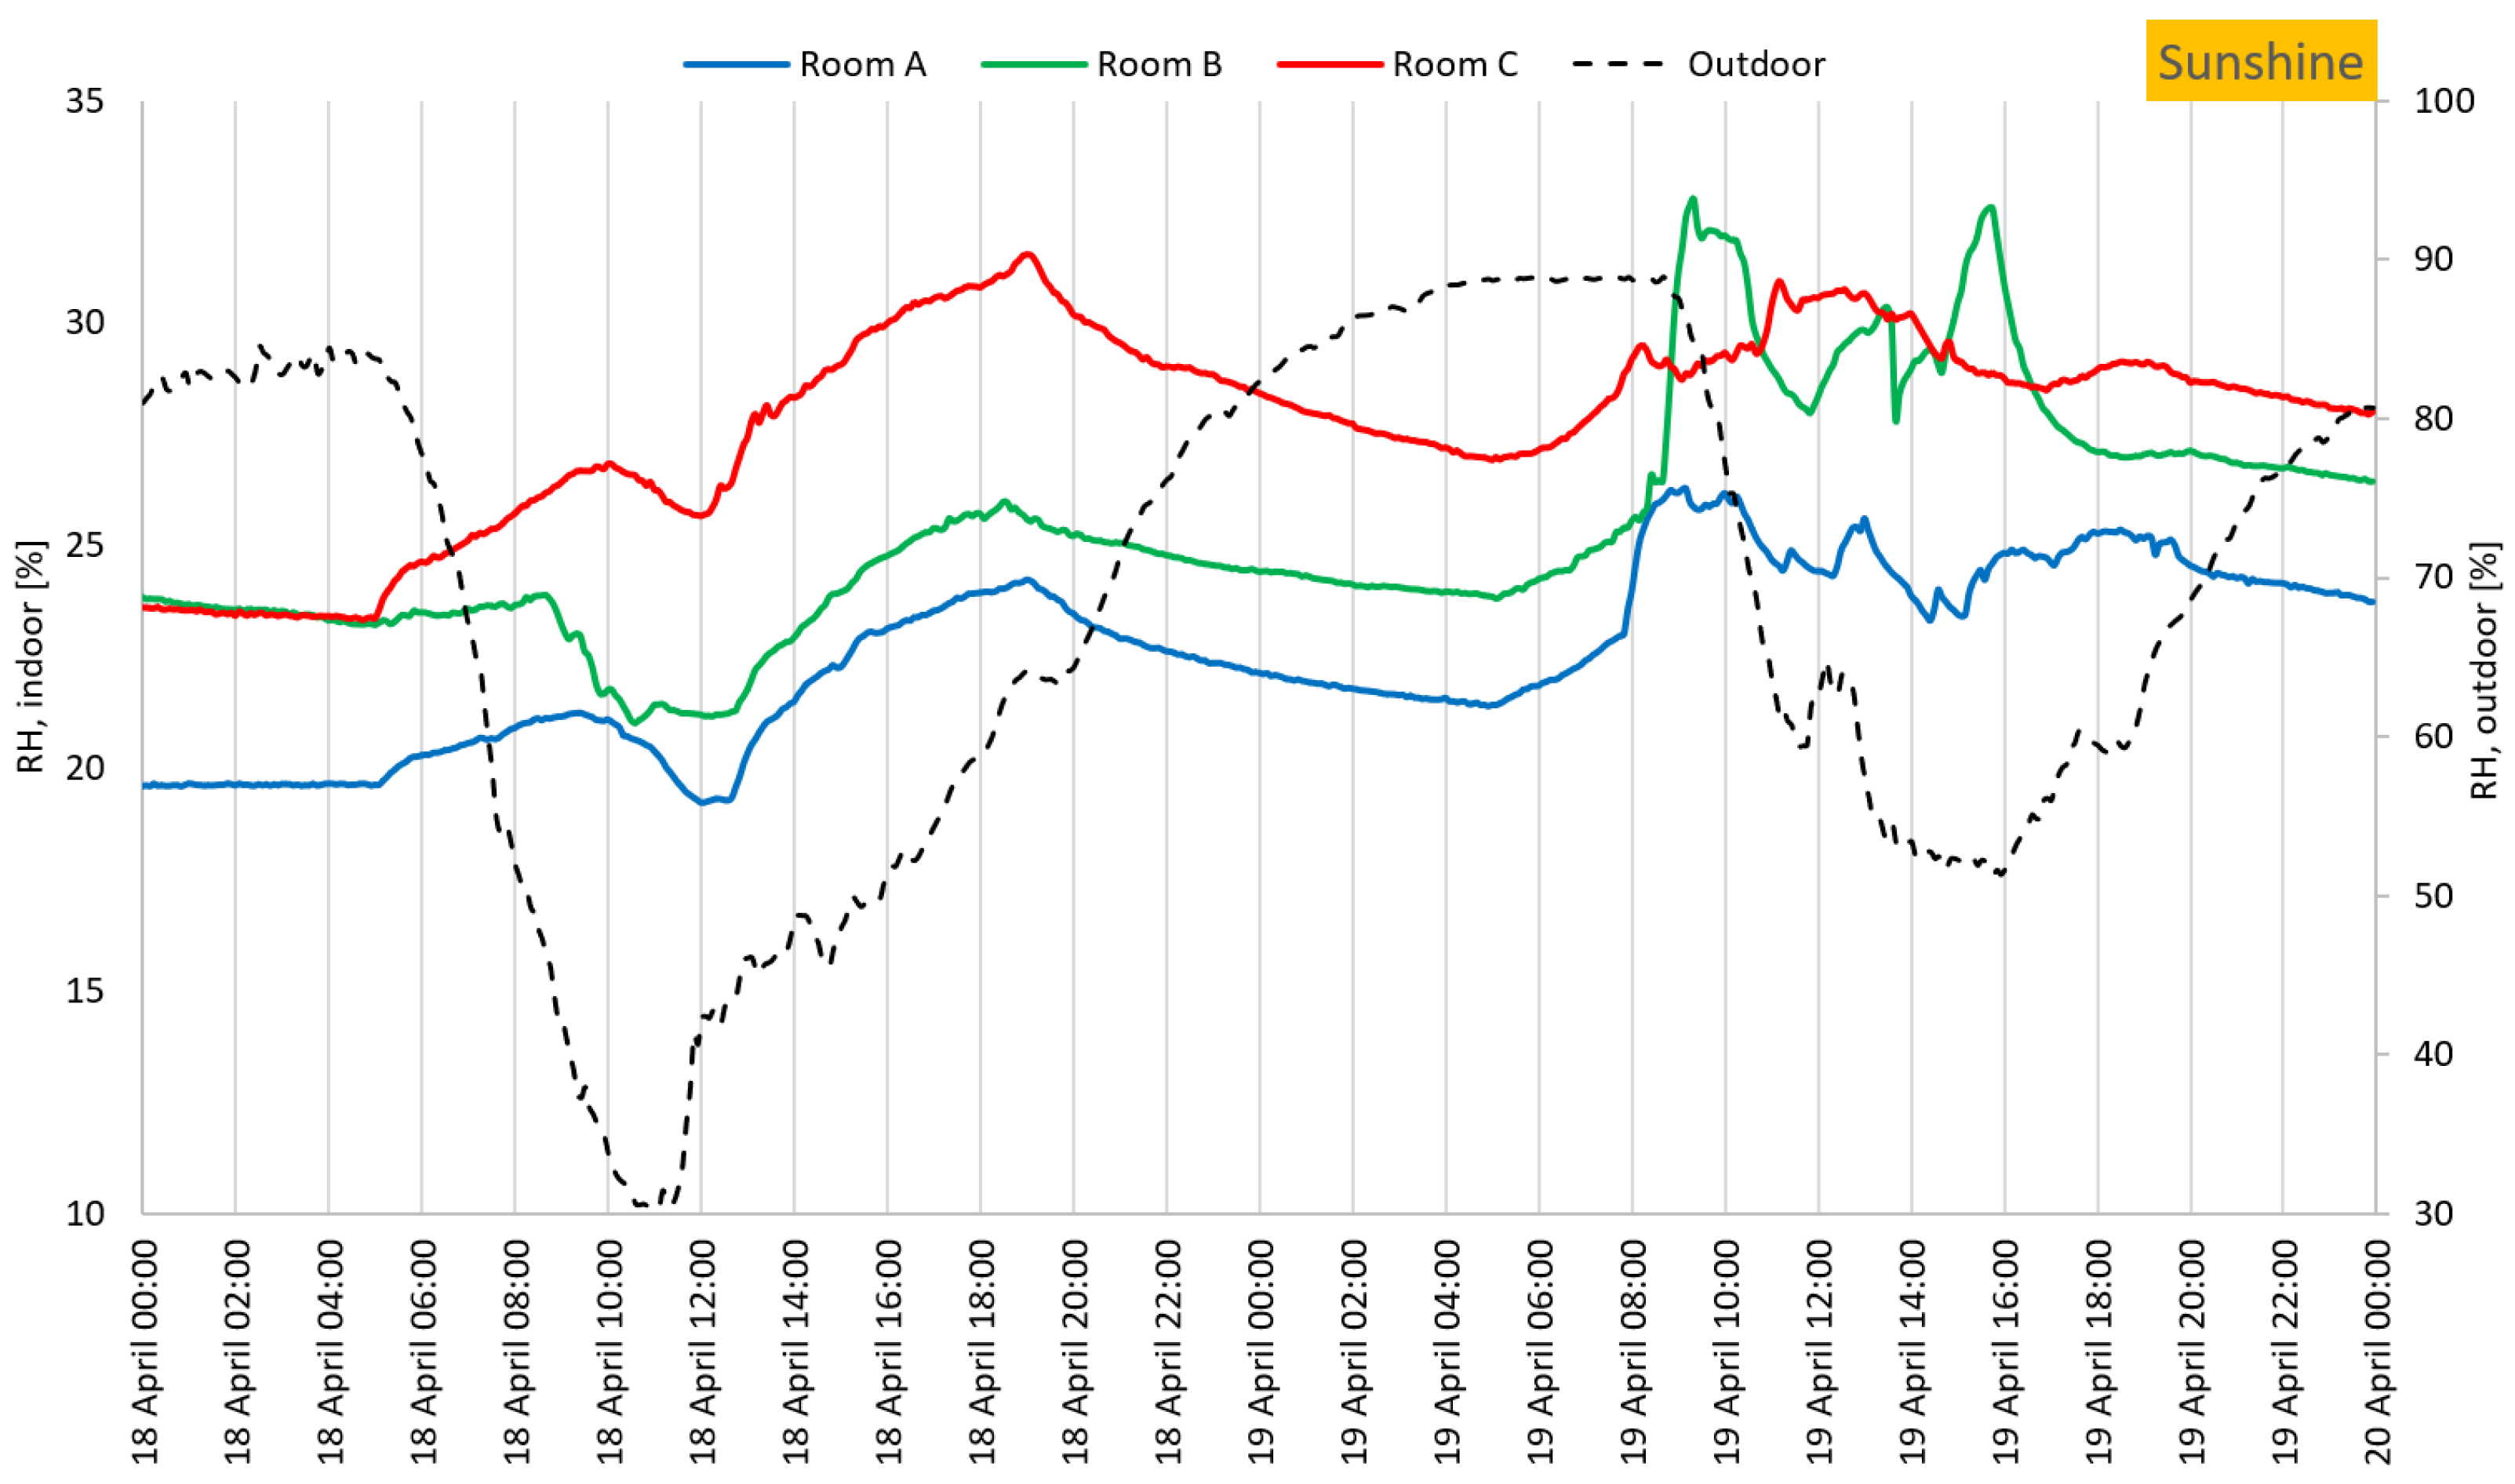
Figure 22 and Figure 23 show measurements for two days when it was sunny outside. There was no staff in all the rooms for the first 24 h. On the second day, there was staff in room A between 7:50 and 19:00. In room B, there was staff presence between 8:20 and 15:50, and no curtains or blinds were used. In room C, the curtains were drawn the entire period until day two at 14:40, and after that time they were not used. The staff’s presence was between 7:40 and 13:00. The outdoor temperature during the first day was around 16 °C and around 11 °C during the second day. The indoor temperature for the first day in Room B reached 27 °C, while Room A stayed between 23–25 °C, which was probably due to the curtains and blinds being drawn. The room C in the north had a temperature of around 22 °C. During the second day, both rooms in the south orientation stayed relatively even at around a maximum of 25 °C, while in the north orientation the temperature reached just over 23 °C. The relative humidity outside was around 80–90% during the nights. The first day it drops to 30% around 10:00, and the second day it goes down to 50%. Indoors, the relative humidity increased in all rooms when the ventilation was turned on. All rooms have a slight dip in RH at around 12:00 and reach their peak at 19:00 on the first day. Room C has the highest relative humidity this day and room A has the lowest, even though room B has a higher temperature than room A. On the second day, room A has the lowest relative humidity. Room B has the highest rate between 09:00 and 11:00 and 15:00 and 16:30 when it rises above 32%; otherwise, room C has the highest rate.
In comparing Figure 18, Figure 20, and Figure 22, which show the temperatures in the three different weather conditions, it can be seen that in sunny weather the indoor temperature is most affected by the outdoor temperature. On a cloudy day and a day when it snows, the indoor temperatures are relatively similar. The factor that seems to affect the indoor temperature the most during these days is the presence of people, more than the outdoor temperature. When comparing, Figure 21, and Figure 23, which show the relative humidity in the three different weather conditions. It is difficult to establish a direct correlation between the outdoor and indoor humidity levels. The authors believe that the ventilation supply inlet has the greatest impact on the RH indoors, followed by the presence of people.
The results of this study show that the indoor temperature and the outdoor temperature had a relatively good correlation, which is in agreement with some previous studies that found that higher outdoor temperatures lead to higher indoor temperatures [34,35]. The indoor relative humidity sometimes followed the outdoor relative humidity by increasing and decreasing at the same time, but the majority of the time it decreased as the outdoor relative humidity increased and vice versa. This is also supported by other studies that have reached the same conclusion, namely, that it’s difficult to see a direct correlation between the relative humidity indoors and outdoors when evaluating the indoor climate during the heating season [35]. The study by Tamerius et al. [21] showed that when the temperature was above 15 °C outside, the indoor temperature increased more per degree than when it was below 15 °C outside. In this study, the results concluded that sunny weather, which usually means a higher temperature, affected both temperature and relative humidity the most compared to when it was cloudy or snowing. However, the results showed that the presence of people and equipment, such as lighting and computers, as well as the ventilation, affected the temperature and relative humidity indoors more than the outdoor climate. Due to the fact that the building is made of heavy stone with thick walls, probably no direct heat from the sun enters through the walls; rather, most of the heat from solar radiation is entering through the windows. A heavy stone building has greater thermal inertia [36,37,38], which means that heat is stored in the building and therefore leads to a less variable interior temperature as this will act as a buffer against rapid changes in the outdoor temperature. The result of the comparison of the south and north-facing rooms clearly showed that it was warmer in the office with windows facing south than in the north-facing room, which has been shown in other studies [39,40]. This study also showed that the northern location had the highest relative humidity almost throughout the measurement period.

3.2. Indoor Climate When People Are Present

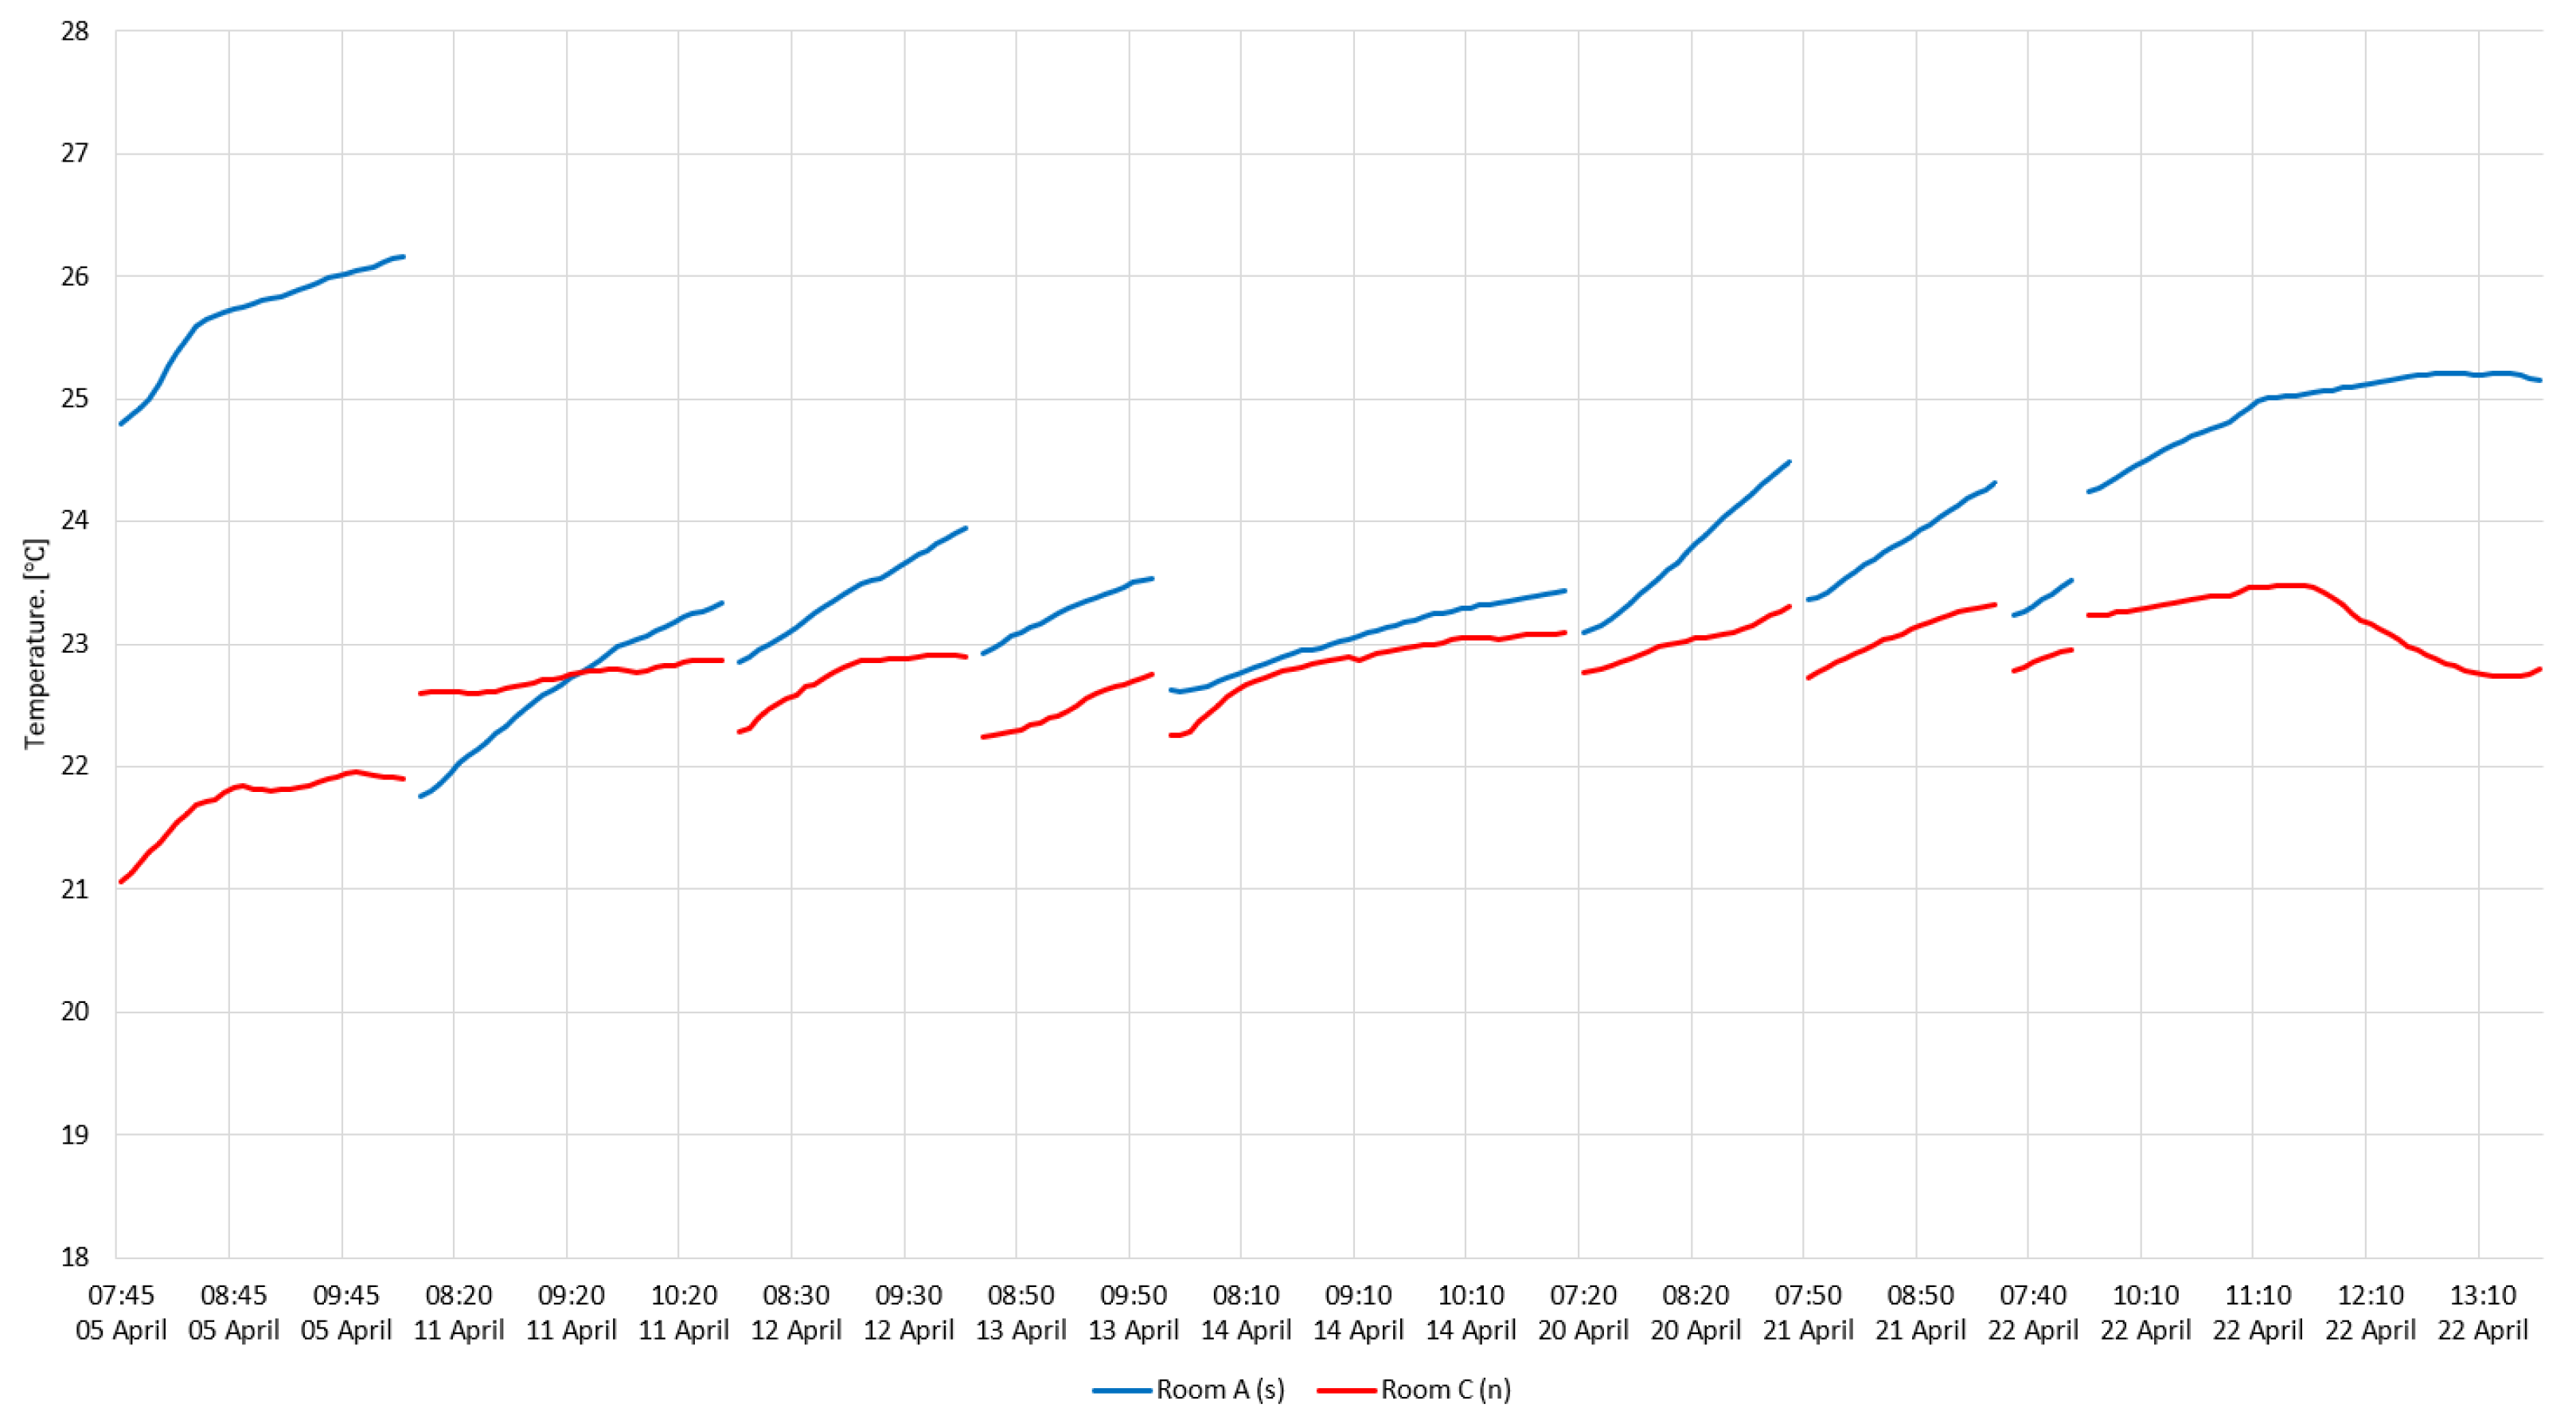
Figure 24 shows the air temperature for room A in the south orientation and room C in the north orientation during the times when there is a presence of people in both rooms. The result shows that the room in the south orientation has a higher air temperature most of the time than the one in the north orientation. The reason why room A had such a high temperature during the first period, i.e., April 5, was because the thermostat was set to maximum that day. When comparing days between cloudy and sunny days, the results show that on cloudy days (April 14), the temperature gap is small between the room and on sunny days (April 22), this gap is increased. The increase in temperature and its impact on the overall thermal comfort, depending on which direction the room is facing, was also shown by Bakhtiari et al. [41], who studied similar office rooms in an old building in the city of Gävle, Sweden.
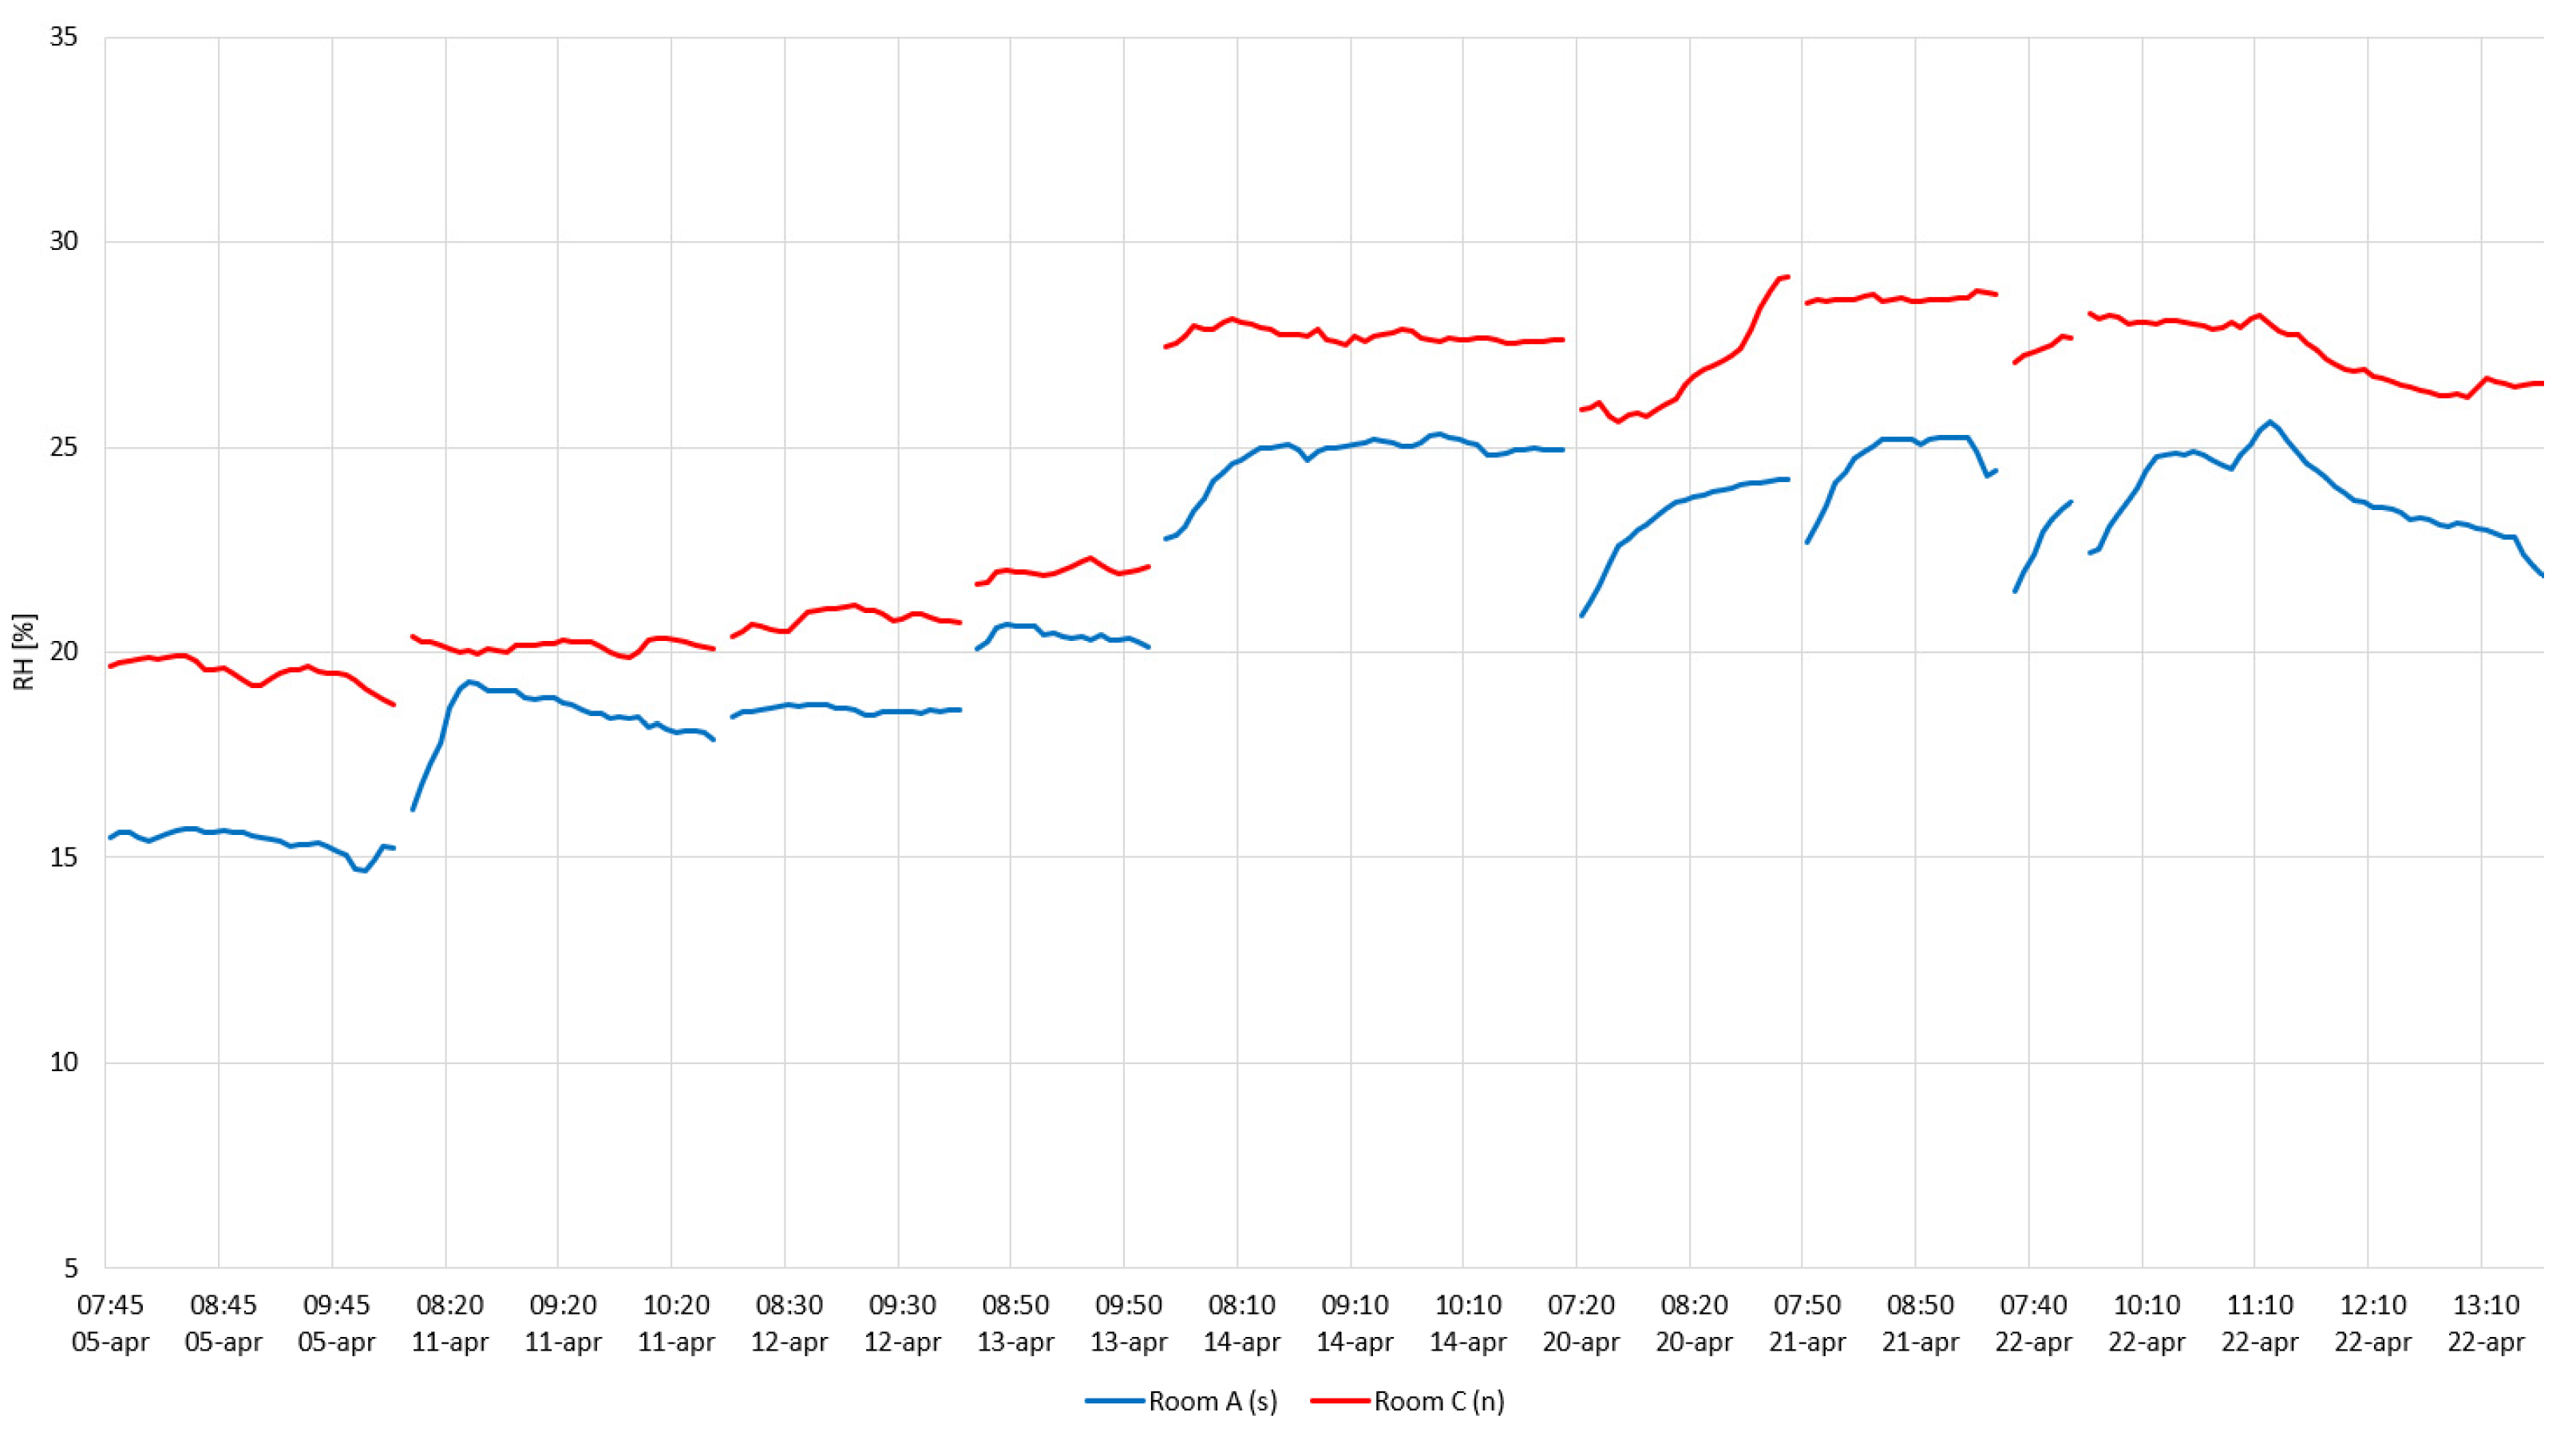
Figure 25 shows the relative humidity during the same period, and it can be seen that in the room facing north (Room C), it is always higher than in the room facing south, between 2–4% higher.
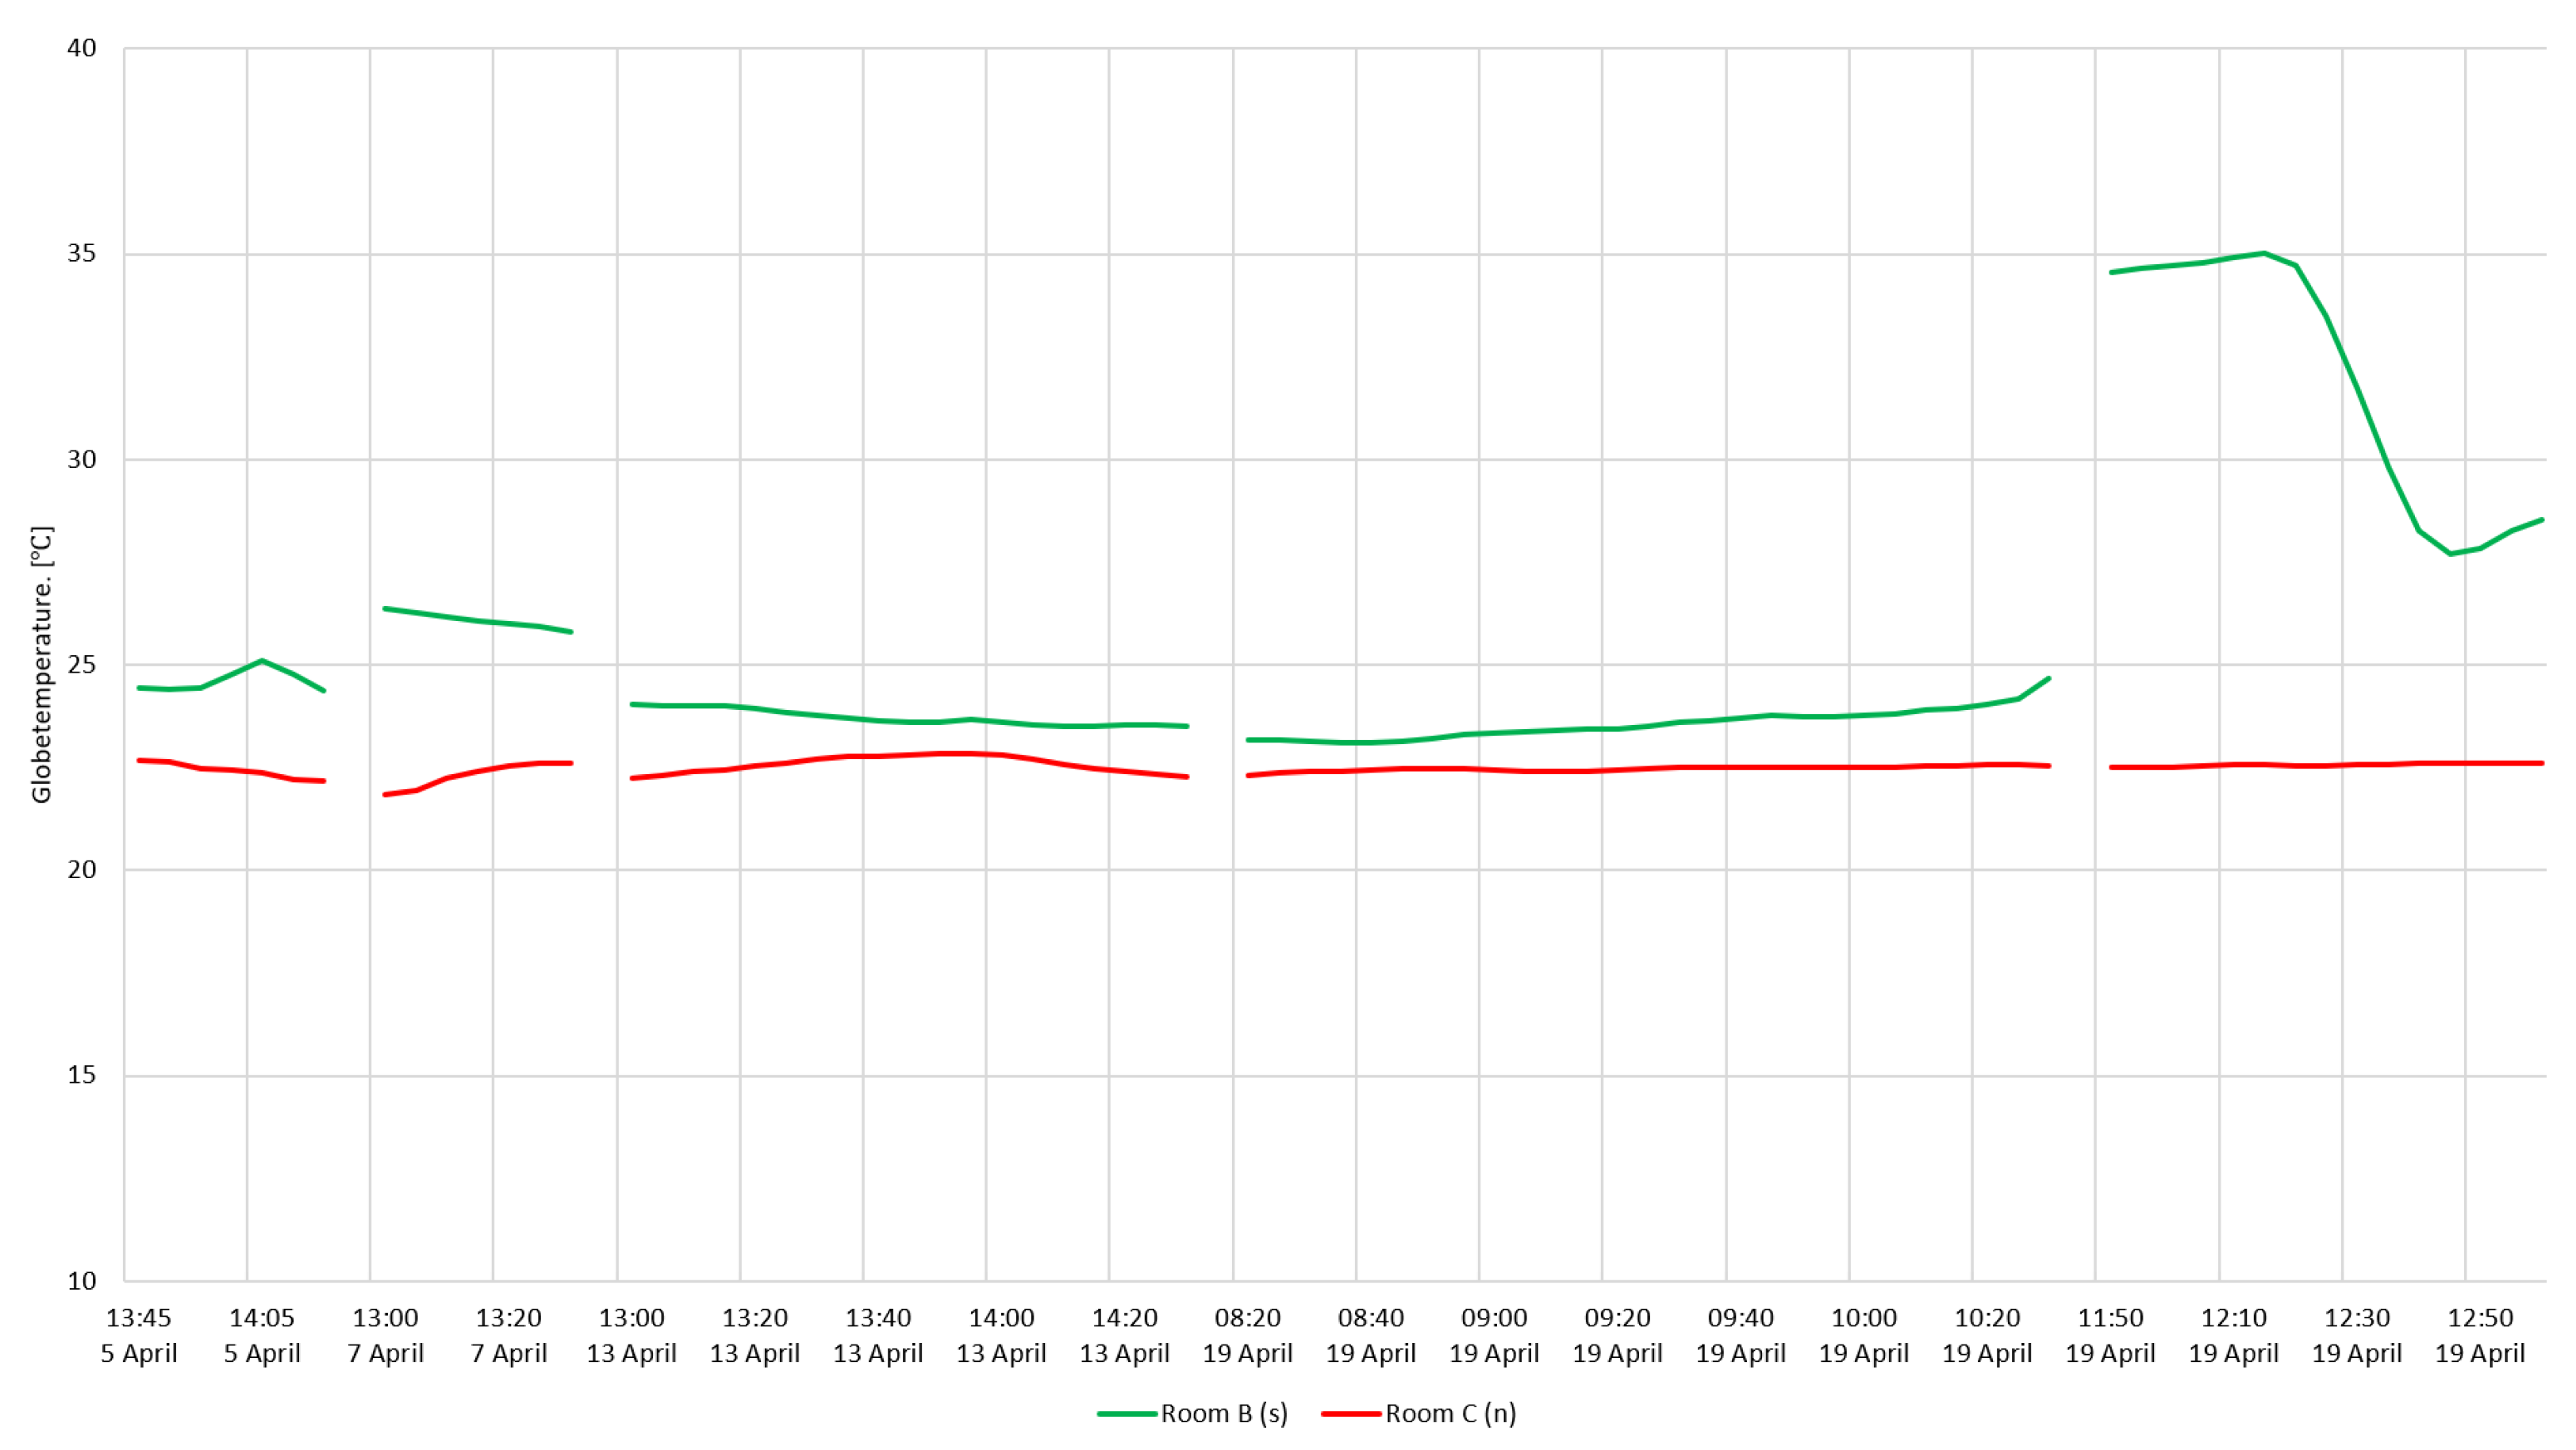
Figure 26 shows the globe temperature for rooms B and C when there are people present in both rooms. The globe’s temperature was always higher in the south-facing room. During the period on April 19 after 11:50, the temperature was much higher in the south-facing room compared to the north-facing room due to the sunny weather. The increase in globe temperature, due to solar radiation, reached as high as 13 °C.

3.3. Ventilation Flowrates

The results from the air supply flow measurements are shown in Table 4. The results show that the supply air flow rate is too low in two out of three rooms. In room A, the required air flow rate is fulfilled; however, when evaluating the ACH, according to ASHRAE 62.1 [19], the office room should have a value between 2–3 h−1. According to Boverket’s building regulations—mandatory provisions and general recommendations, BBR [8] and AFS 2020:1 [15] state that an office room’s height should be 2.4 m. In addition to the normal ACH (which is based on the height of 3.4 m for this study), ACHn is also included in the table, which assumed a normalized room height of 2.4 m. However, by evaluating ACHn, the results show that the ventilation does not fulfill the requirements set by the ASHRAE 62.1 standard for office environments.

3.4. Vertical Air and Temperature Measurements

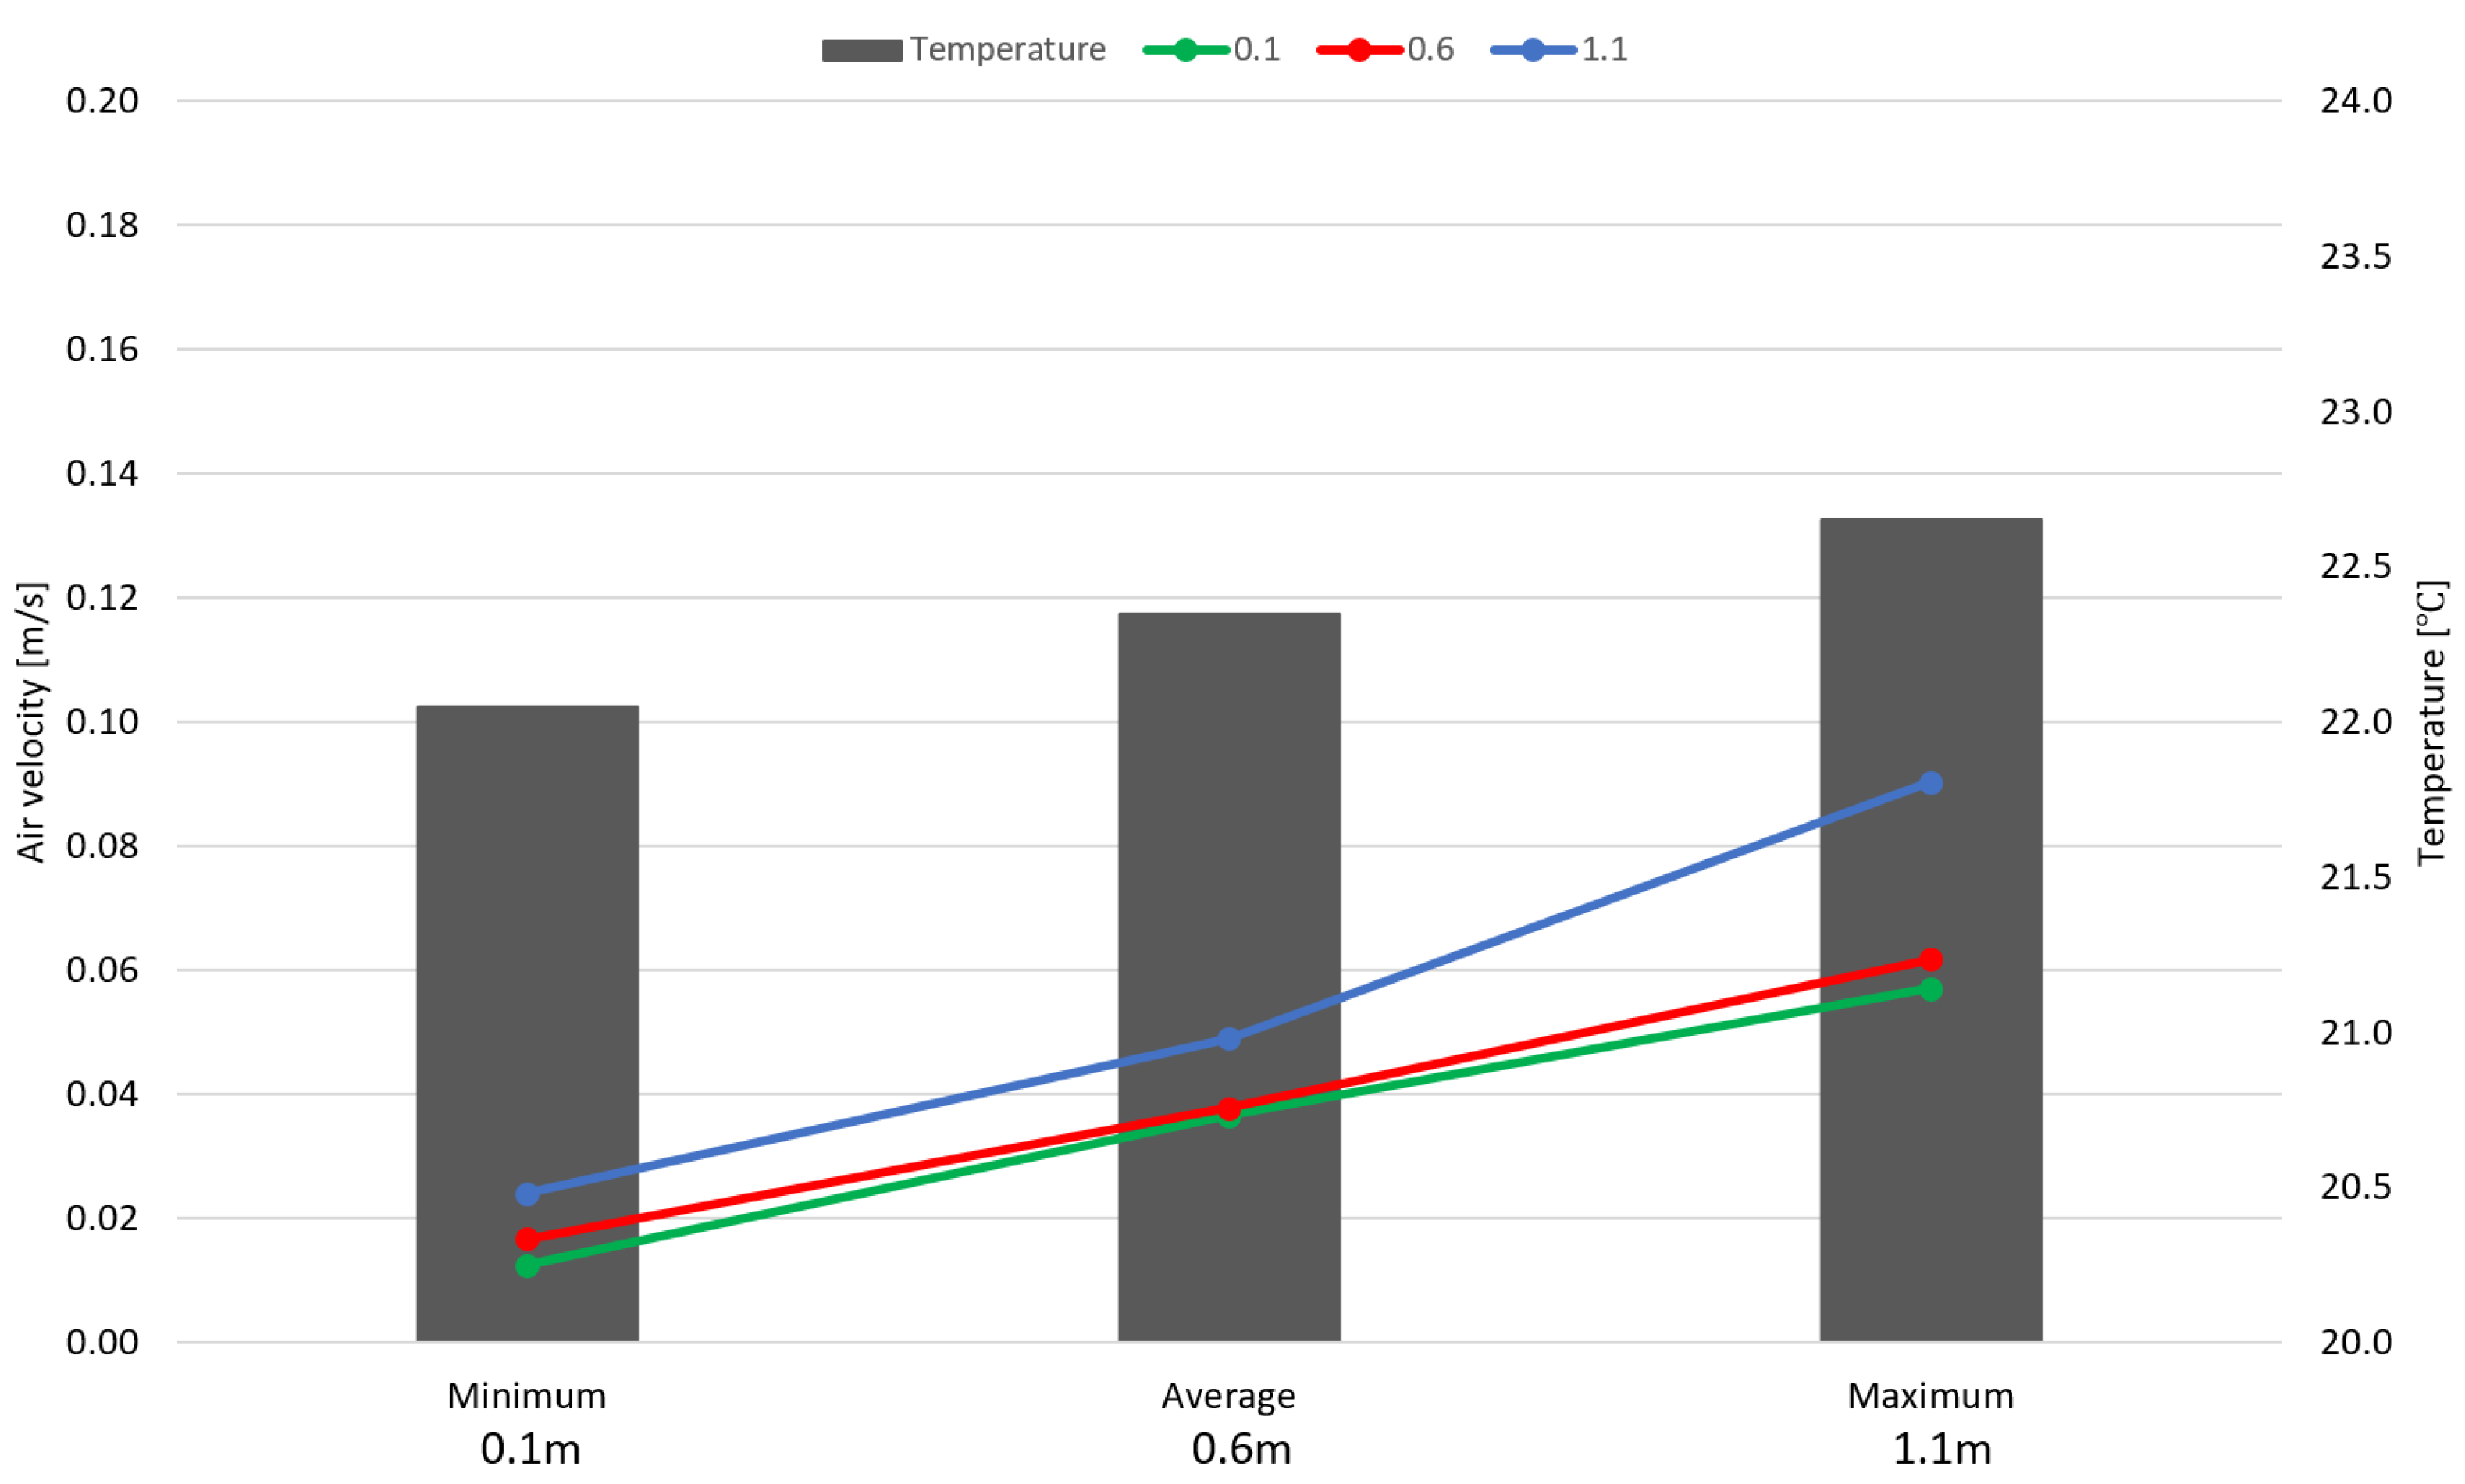
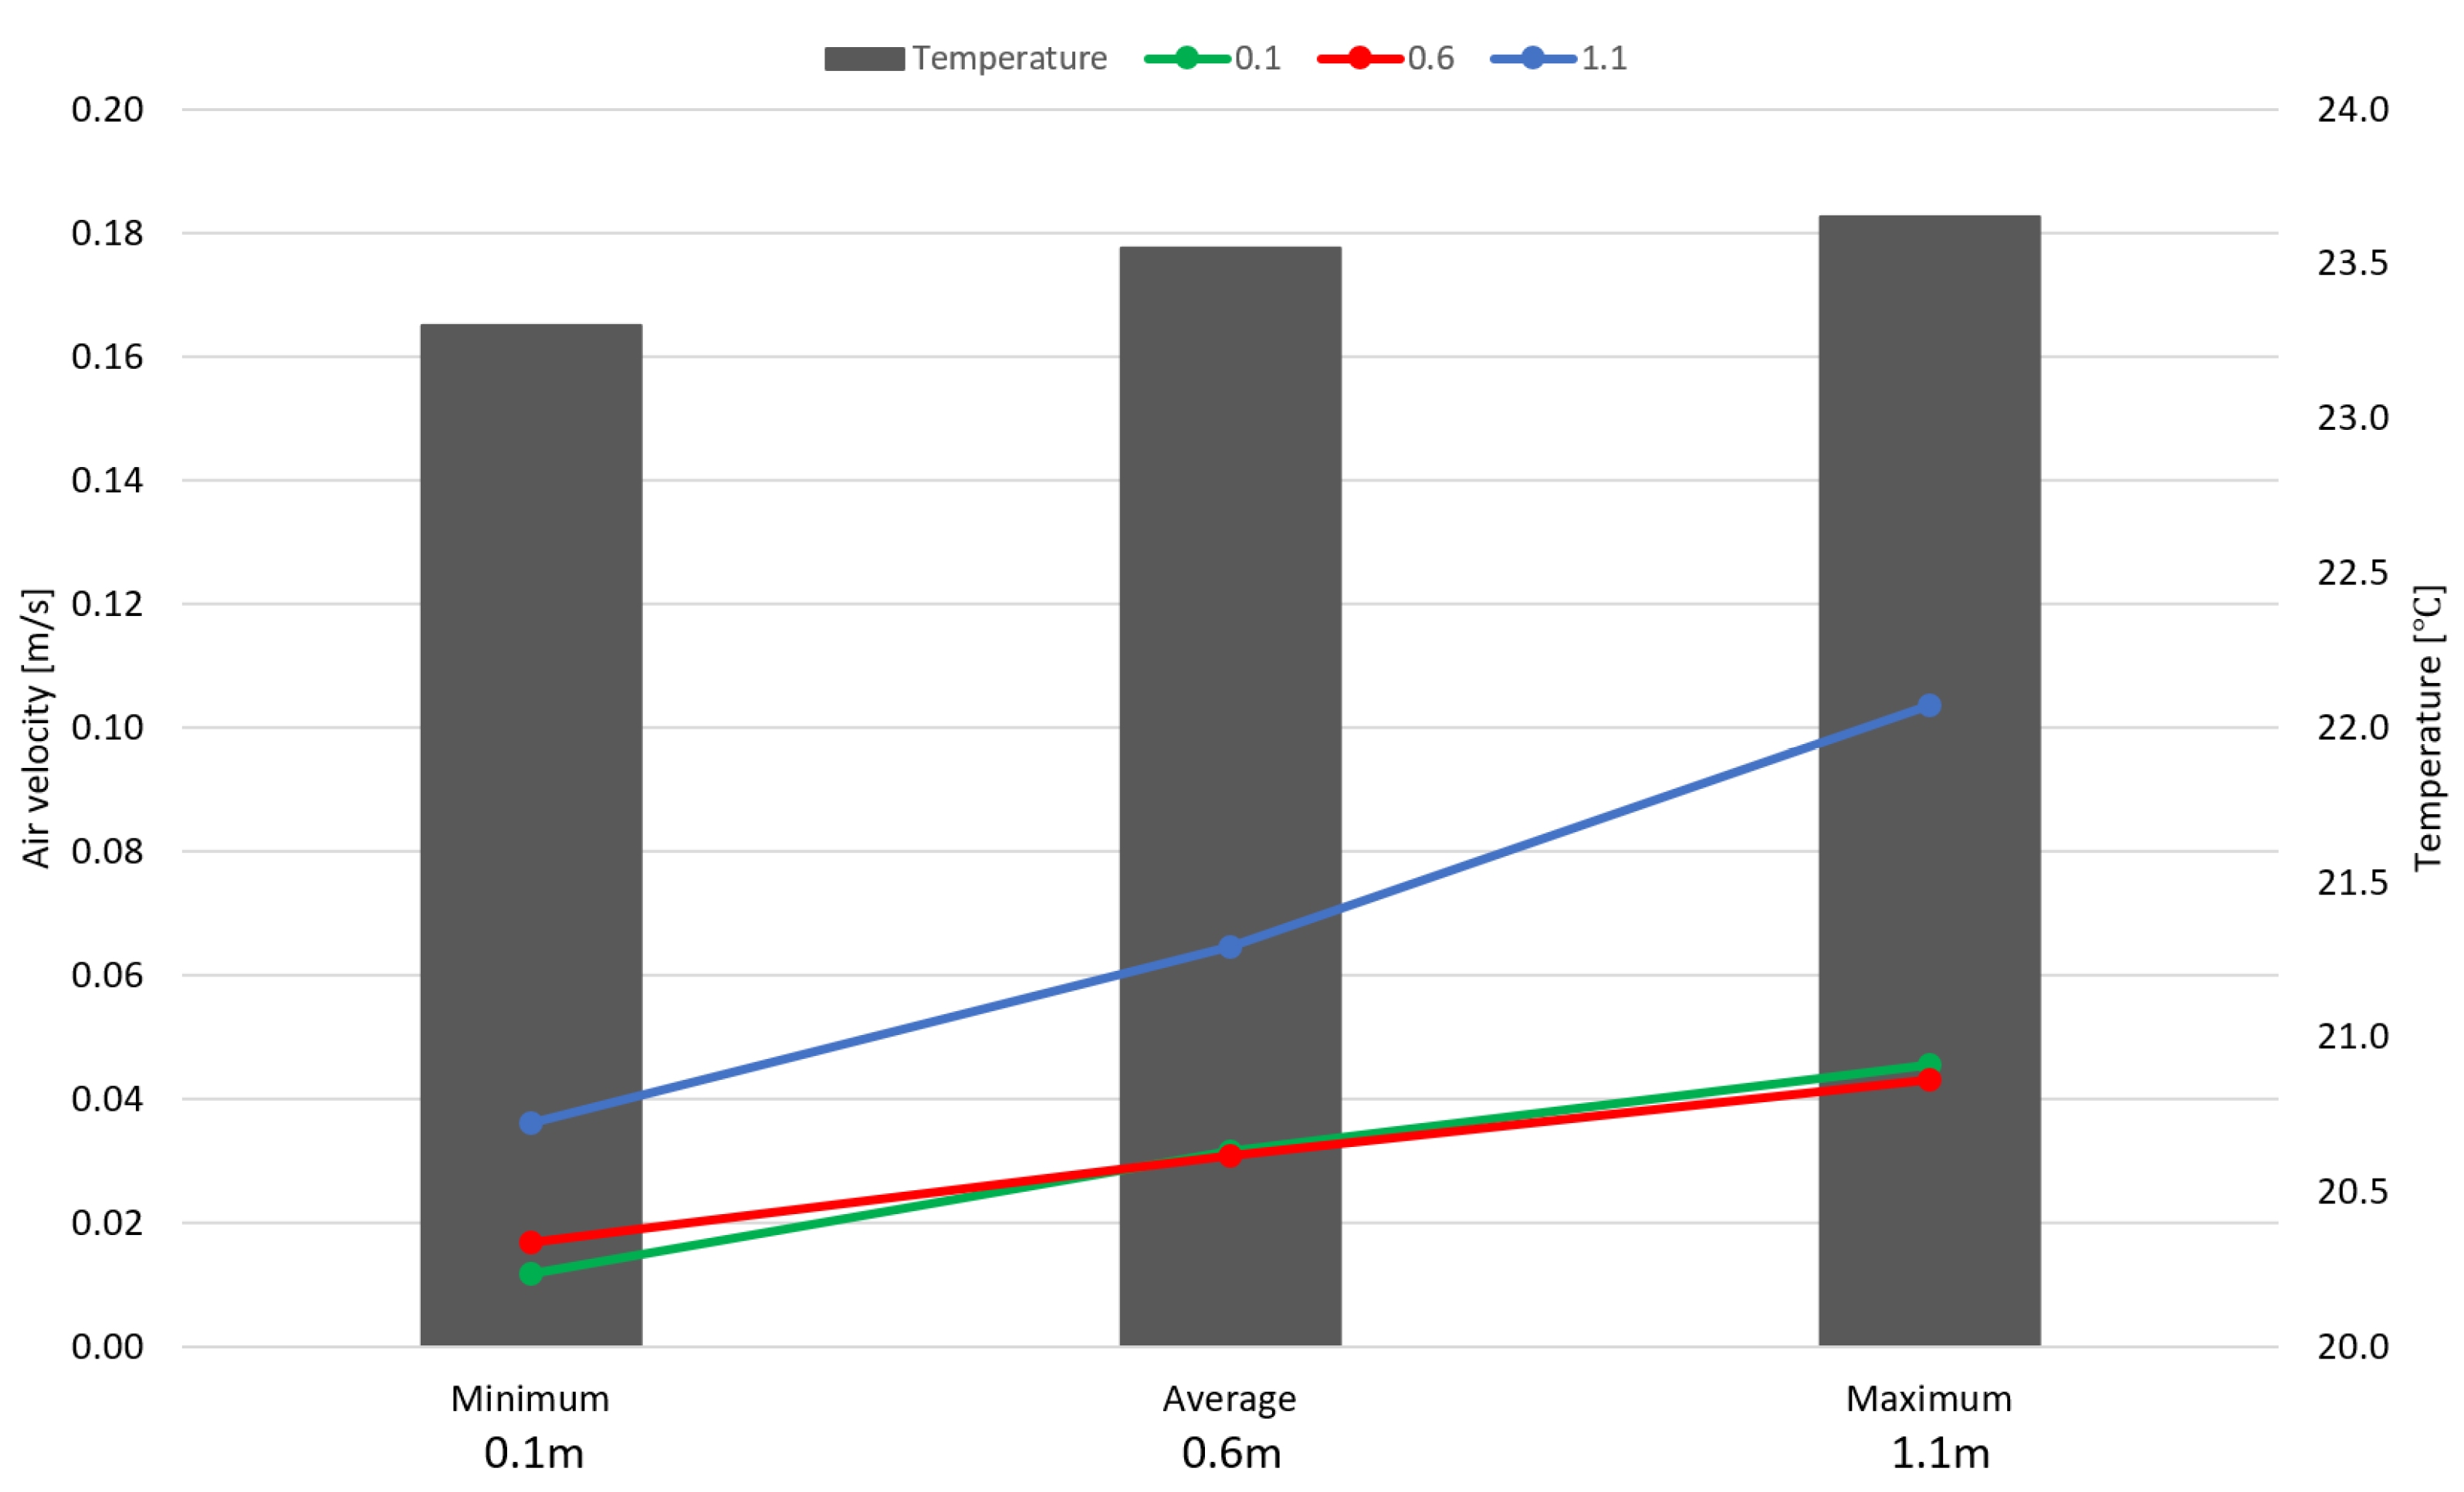
The air velocity measurements are shown in Figure 27 for room C(n) and Figure 28 for room B(s). The air velocity for the three heights is relatively similar in the room B(s) and C(n). The measurements at 0.1 m and 0.6 m were very similar to each other for both rooms. The highest velocities measured were at 1.1 m and the lowest at 0.1 m in both rooms. The average values for 0.1 m and 0.6 m both in north and south orientation were 0.03–0.04 m/s. For 1.1 m, it was 0.05–0.06 m/s. The maximum value for room B(s) was 0.1 m/s, and for room C(n) it was 0.09 m/s, both at 1.1 m height. The temperature was lower at lower heights and increased slightly at higher elevations. The temperature ranged between 22.1–22.7 °C for room C(n) and 23.3–23.7 °C for room B(s).
According to the guidelines in Boverket’s building regulations in Sweden (BBR) [8], the air velocity in the occupied zone should not exceed 0.15 m/s during the heating season and 0.25 m/s during other times, including the cooling season, at a height of 0.1 m. The results show that the air velocities are well below these levels.

3.5. CO2 Results

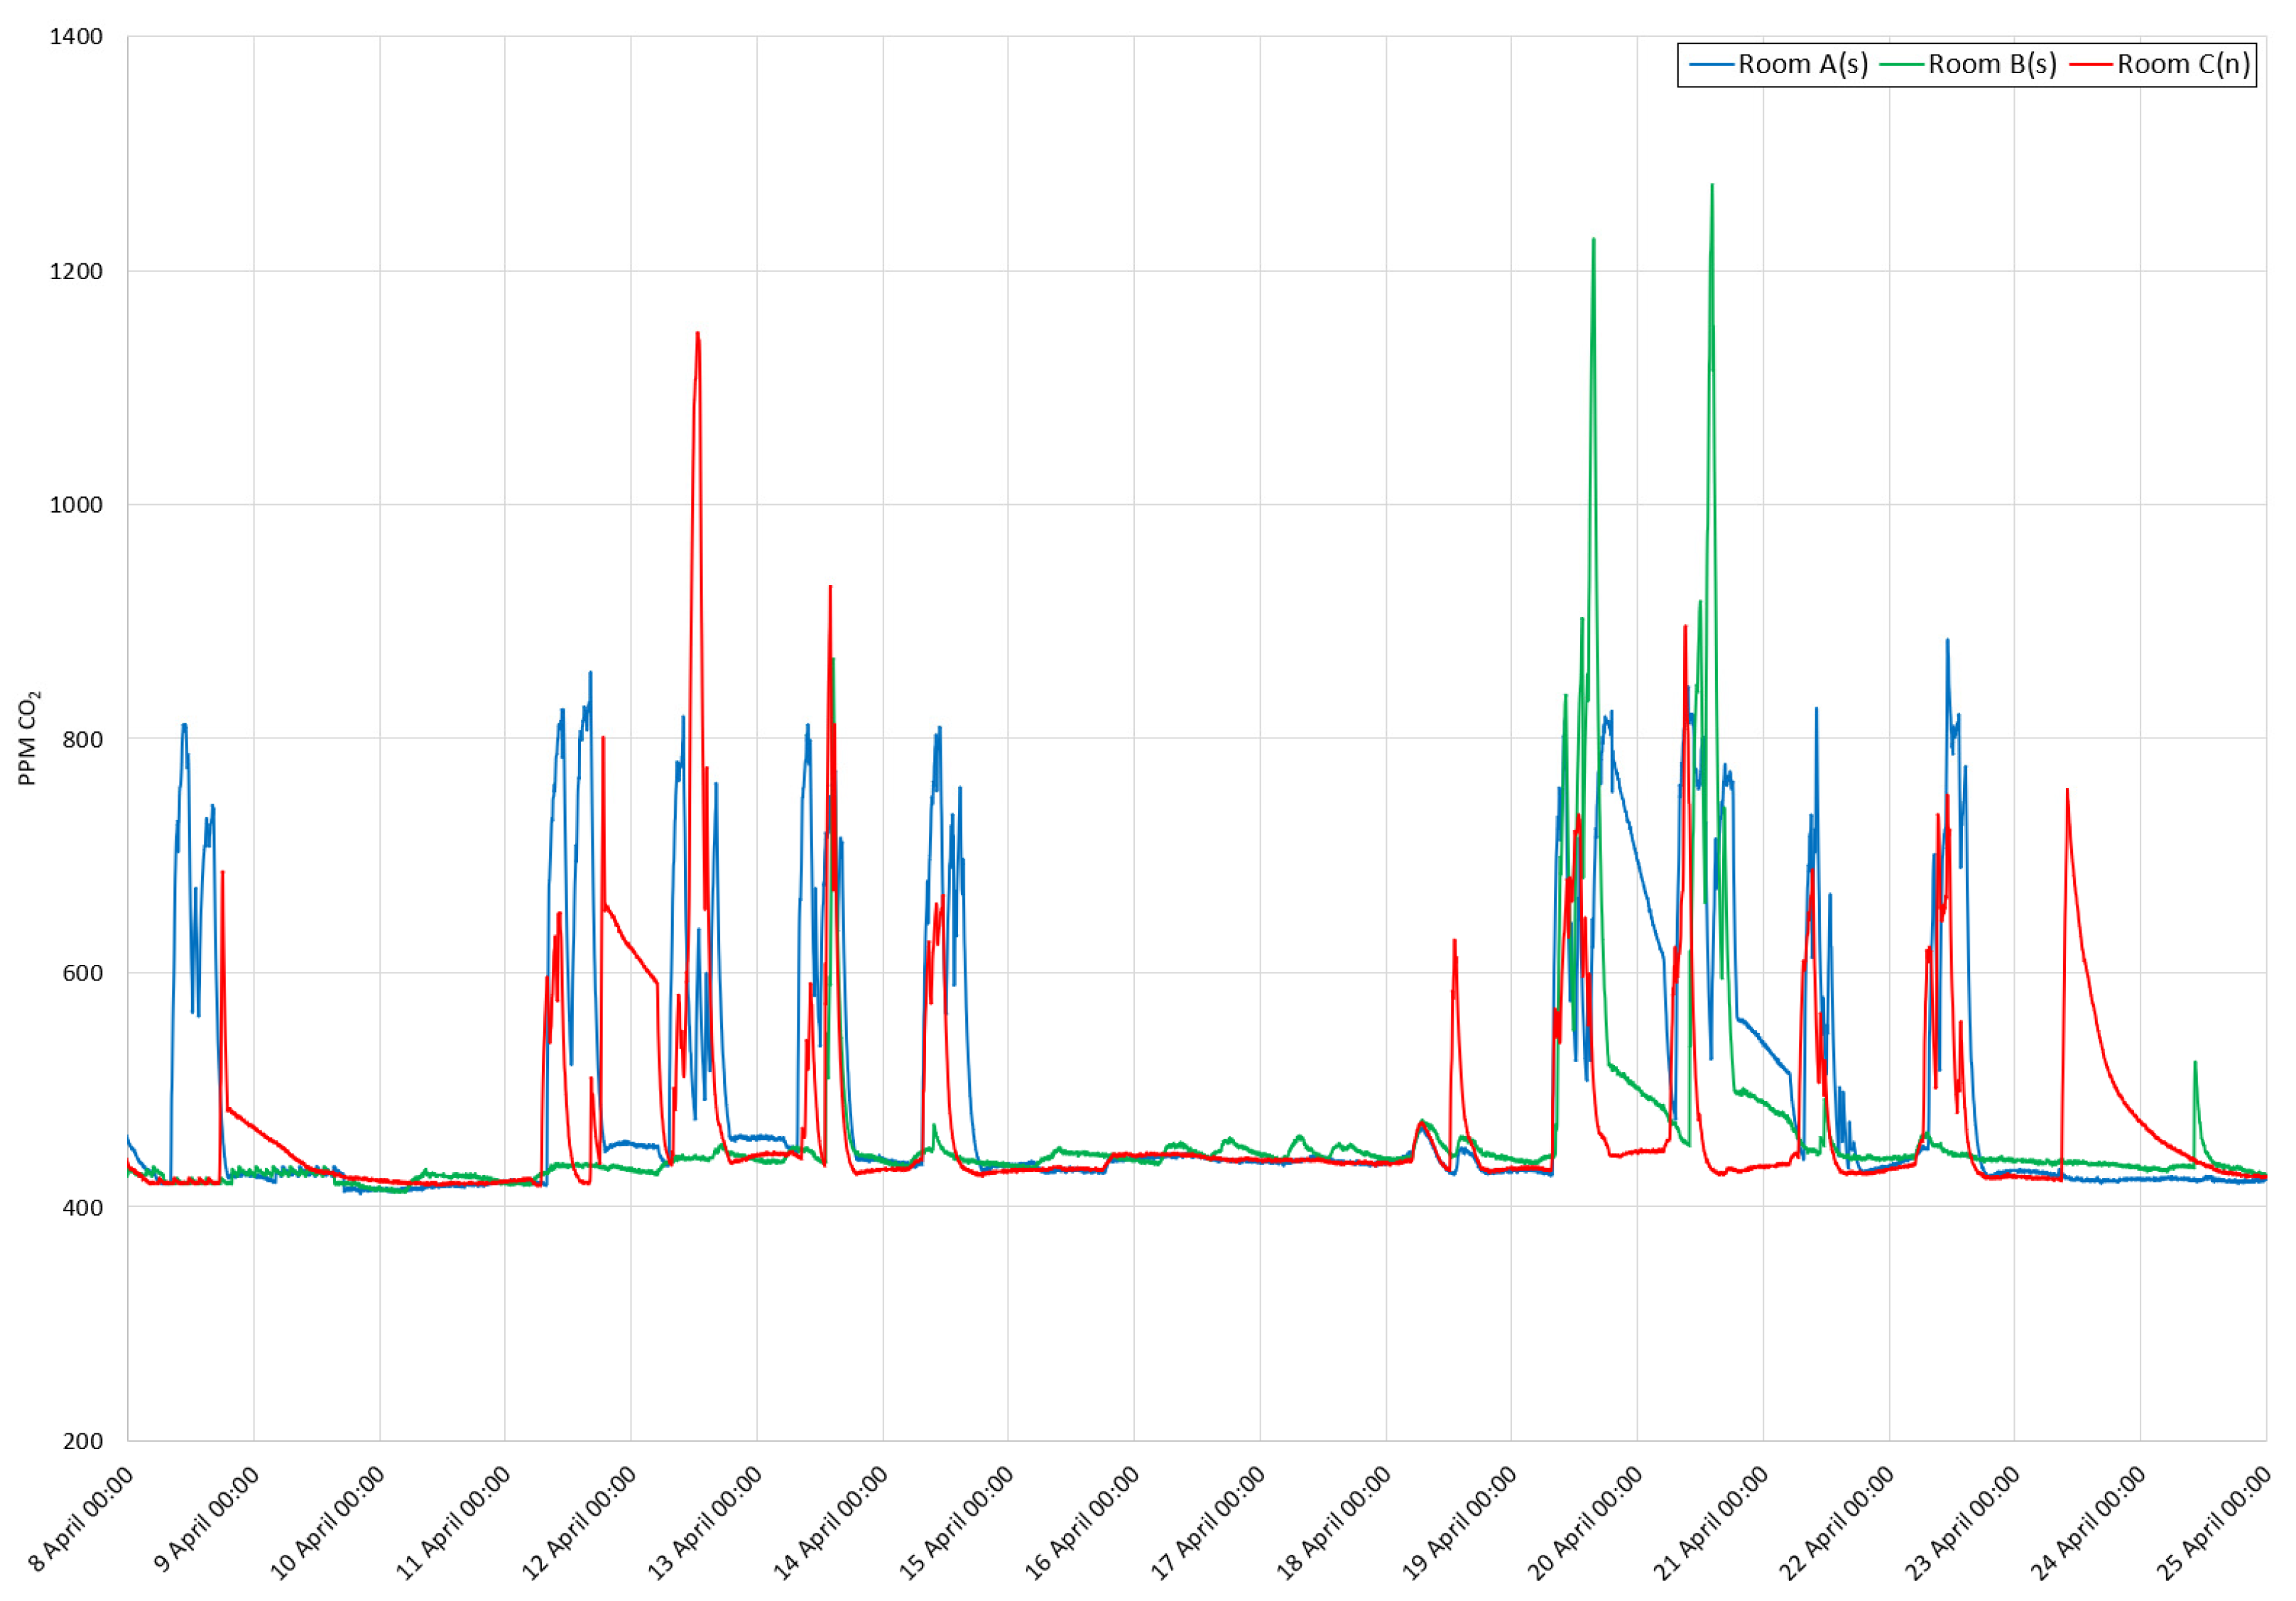
The result of the measured carbon dioxide levels for the three different rooms can be seen in Table 5 as well as Figure 29. The results show that the average value for the CO2 level when people are present is below 800 ppm for all the rooms. When looking at the highest value of CO2, rooms B(s) and C(n) both reach above 1000 ppm, at 1273 and 1147 ppm, respectively. However, the timeframe for these high levels is very short, as can be seen in Figure 29, i.e., for room B, there are two maximum levels on April 19 at 15:40 (1226 ppm) and April 20 at 14:15 (1273 ppm). The results also show that less than 1% of the time, the CO2 level was maintained above the 1000 ppm level. There was no occasion during the measurement period where the level exceeded 5000 ppm, which is the maximum limit allowed for CO2 exposure according to [15,19]. The results of the CO2 measurements are in line with what other studies have shown for office environments [4,42].

4. Conclusions

This study concluded that, as expected, a small office with windows mainly facing south will be slightly warmer than a similar office with windows facing north due to extensive solar radiation during some periods. The indoor temperature is affected by the temperature outside, but it is also affected by the presence of people and accompanying equipment use. The relative humidity indoors is significantly more affected by the presence of people and the switching on and off of the ventilation than by the relative humidity outdoors. The air supply flow rate was not adequate for two of the rooms (B & C), and none of the rooms had an adequate level of ACH according to ASHRAE standards. This was partly due to the unusual room height of 3.4 m.
The velocities in all rooms were lower than the maximum allowed according to standards, which means that there was no risk for draught in the offices. The CO2 levels were within the recommended limits set by standards >99% of the time when occupants were present.
In order to expand on this research, the effect of curtains and blinds should be examined in future work, especially for the rooms that are facing south. Another area that is worth looking into is testing out different air distribution systems in order to optimize the thermal comfort in conjunction with lowering the energy usage, which can be done by using simulation software. It would also be interesting to evaluate and monitor these rooms for an entire year rather than the limited time that was in this study.

Author Contributions

A.A.: Writing—Original Draft, Software, Conceptualization, Methodology, Visualization; M.M.: Supervision, Validation, Review and Editing, Resources; H.B.: Writing—Original Draft, Software, Conceptualization, Methodology, Visualization; H.L.: Writing—Original Draft, Software, Conceptualization, Methodology, Visualization. All authors have read and agreed to the published version of the manuscript.

Funding

This research received no external funding.

Institutional Review Board Statement

Not applicable.

Informed Consent Statement

Not applicable.

Data Availability Statement

The data presented in this study are shown in the paper.

Acknowledgments

University of Gävles laboratory and technical staff for providing assistance with measuring equipment.

Conflicts of Interest

The authors declare no conflict of interest.

References

  1. Vimalanathan, K.; Babu, T.R. The Effect of Indoor Office Environment on the Work Performance, Health and Well-Being of Office Workers. J. Environ. Health Sci. Eng. 2014, 12, 113. [Google Scholar] [CrossRef] [Green Version]
  2. Allen, J.G.; MacNaughton, P.; Satish, U.; Santanam, S.; Vallarino, J.; Spengler, J.D. Associations of Cognitive Function Scores with Carbon Dioxide, Ventilation, and Volatile Organic Compound Exposures in Office Workers: A Controlled Exposure Study of Green and Conventional Office Environments. Environ. Health Perspect. 2016, 124, 805–812. [Google Scholar] [CrossRef] [Green Version]
  3. Ameen, A.; Cehlin, M.; Larsson, U.; Karimipanah, T. Experimental Investigation of the Ventilation Performance of Different Air Distribution Systems in an Office Environment-Cooling Mode. Energies 2019, 12, 1354. [Google Scholar] [CrossRef] [Green Version]
  4. Vehviläinen, T.; Lindholm, H.; Rintamäki, H.; Pääkkönen, R.; Hirvonen, A.; Niemi, O.; Vinha, J. High Indoor CO2 Concentrations in an Office Environment Increases the Transcutaneous CO2 Level and Sleepiness during Cognitive Work. J. Occup. Environ. Hyg. 2016, 13, 19–29. [Google Scholar] [CrossRef]
  5. Song, B.; Bai, L.; Yang, L. Analysis of the Long-Term Effects of Solar Radiation on the Indoor Thermal Comfort in Office Buildings. Energy 2022, 247, 123499. [Google Scholar] [CrossRef]
  6. Yan, H.; Yang, L.; Zheng, W.; Li, D. Influence of Outdoor Temperature on the Indoor Environment and Thermal Adaptation in Chinese Residential Buildings during the Heating Season. Energy Build. 2016, 116, 133–140. [Google Scholar] [CrossRef]
  7. de Loyola Ramos Garcia, D.; Ruttkay Pereira, F.O. Method Application and Analyses of Visual and Thermal-Energy Performance Prediction in Offices Buildings with Internal Shading Devices. Build Environ. 2021, 198, 107912. [Google Scholar] [CrossRef]
  8. Boverket’s Building Regulations—Mandatory Provisions and General Recommendations, BFS 2011:6 with Amendments up to BFS 2020:4; Boverket BBR: Karlskrona, Swedish, 2011.
  9. Szekeres, S.; Kostyák, A.; Szodrai, F.; Csáky, I. Investigation of Ventilation Systems to Improve Air Quality in the Occupied Zone in Office Buildings. Buildings 2022, 12, 493. [Google Scholar] [CrossRef]
  10. Ameen, A.; Cehlin, M.; Larsson, U.; Karimipanah, T. Experimental Investigation of Ventilation Performance of Different Air Distribution Systems in an Office Environment-Heating Mode. Energies 2019, 12, 1835. [Google Scholar] [CrossRef] [Green Version]
  11. Ameen, A.; Choonya, G.; Cehlin, M. Experimental Evaluation of the Ventilation Effectiveness of Corner Stratum Ventilation in an Office Environment. Buildings 2019, 9, 169. [Google Scholar] [CrossRef]
  12. Karjalainen, S. Thermal Comfort and Use of Thermostats in Finnish Homes and Offices. Build. Environ. 2009, 44, 1237–1245. [Google Scholar] [CrossRef]
  13. Kuchen, E.; Fisch, M.N. Spot Monitoring: Thermal Comfort Evaluation in 25 Office Buildings in Winter. Build. Environ. 2009, 44, 839–847. [Google Scholar] [CrossRef]
  14. Azuma, K.; Kagi, N.; Yanagi, U.; Osawa, H. Effects of Low-Level Inhalation Exposure to Carbon Dioxide in Indoor Environments: A Short Review on Human Health and Psychomotor Performance. Environ. Int. 2018, 121, 51–56. [Google Scholar] [CrossRef]
  15. The Swedish Work Environment Authority. The Swedish Work Environment Authority’s Statute Book—AFS 2020:1; SWEA: Stockholm, Swedish, 2020. [Google Scholar]
  16. Lowther, S.D.; Dimitroulopoulou, S.; Foxall, K.; Shrubsole, C.; Cheek, E.; Gadeberg, B.; Sepai, O. Low Level Carbon Dioxide Indoors—A Pollution Indicator or a Pollutant? A Health-Based Perspective. Environments 2021, 8, 125. [Google Scholar] [CrossRef]
  17. Huang, Q.; Marzouk, T.; Cirligeanu, R.; Malmstrom, H.; Eliav, E.; Ren, Y.-F. Ventilation Assessment by Carbon Dioxide Levels in Dental Treatment Rooms. J. Dent. Res. 2021, 100, 810–816. [Google Scholar] [CrossRef]
  18. Szczepanik-Ścisło, N.; Flaga-Maryańczyk, A. Indoor Air Quality Modelling and Measurements of a Studio Apartment with a Mechanical Exhaust System. In E3S Web Conferences, Proceedings of the 10th Conference on Interdisciplinary Problems in Environmental Protection and Engineering EKO-DOK 2018, Polanica-Zdrój, Poland, 16–18 April 2018; EDP Sciences: Ulis, France; Volume 44, p. 00171.
  19. ANSI/ASHRAE Standard 62.1-2019; Ventilation for Acceptable Indoor Air Quality. ASHRAE: Peachtree Corners, GA, USA, 2019.
  20. Kownacki, K.L.; Gao, C.; Kuklane, K.; Wierzbicka, A. Heat Stress in Indoor Environments of Scandinavian Urban Areas: A Literature Review. Int. J. Environ. Res. Public Health 2019, 16, 560. [Google Scholar] [CrossRef] [Green Version]
  21. Tamerius, J.D.; Perzanowski, M.S.; Acosta, L.M.; Jacobson, J.S.; Goldstein, I.F.; Quinn, J.W.; Rundle, A.G.; Shaman, J. Socioeconomic and Outdoor Meteorological Determinants of Indoor Temperature and Humidity in New York City Dwellings. Weather Clim. Soc. 2013, 5, 168–179. [Google Scholar] [CrossRef] [Green Version]
  22. Hamid, A.A.; Johansson, D.; Bagge, H. Ventilation Measures for Heritage Office Buildings in Temperate Climate for Improvement of Energy Performance and IEQ. Energy Build. 2020, 211, 109822. [Google Scholar] [CrossRef]
  23. Al-Sakkaf, A.; Abdelkader, E.M.; Mahmoud, S.; Bagchi, A. Studying Energy Performance and Thermal Comfort Conditions in Heritage Buildings: A Case Study of Murabba Palace. Sustainability 2021, 13, 12250. [Google Scholar] [CrossRef]
  24. Vallati, A.; di Matteo, M.; Fiorini, C.V. Retrofit Proposals for Energy Efficiency and Thermal Comfort in Historic Public Buildings: The Case of the Engineering Faculty’s Seat of Sapienza University. Energies 2023, 16, 151. [Google Scholar] [CrossRef]
  25. Murillo Camacho, K.S.; Fouseki, K.; Altamirano-Medina, H. Decision-Making Processes of Residents in Preservation, Thermal Comfort, and Energy Efficiency in Heritage Buildings: A Pilot Study in Mexico City. Appl. Sci. 2022, 12, 1486. [Google Scholar] [CrossRef]
  26. Rohdin, P.; Dalewski, M.; Moshfegh, B. Indoor Environment and Energy Use in Historic Buildings—Comparing Survey Results with Measurements and Simulations. Int. J. Vent. 2012, 10, 371–382. [Google Scholar] [CrossRef]
  27. Liu, C.; Xie, H.; Ali, H.M.; Liu, J. Evaluation of Passive Cooling and Thermal Comfort in Historical Residential Buildings in Zanzibar. Buildings 2022, 12, 2149. [Google Scholar] [CrossRef]
  28. Damle, R.M.; Khatri, N.; Rawal, R. Experimental Investigation on Hygrothermal Behaviour of Cement and Lime Plaster. Build. Environ. 2022, 217, 109098. [Google Scholar] [CrossRef]
  29. Alwetaishi, M.; Balabel, A.; Abdelhafiz, A.; Issa, U.; Sharaky, I.; Shamseldin, A.; Al-Surf, M.; Al-Harthi, M.; Gadi, M. User Thermal Comfort in Historic Buildings: Evaluation of the Potential of Thermal Mass, Orientation, Evaporative Cooling and Ventilation. Sustainability 2020, 12, 9672. [Google Scholar] [CrossRef]
  30. ASHRAE. 2021 ASHRAE Handbook; ASHRAE: Peachtree Corners, GA, USA, 2021; ISBN 978-1-947192-90-4. [Google Scholar]
  31. Grundels Grundels Fönstersystem. Available online: https://www.grundels.se/ (accessed on 22 November 2022).
  32. ANSI/ASHRAE Standard 55-2017; Thermal Environmental Conditions for Human Occupancy. American Society of Heating and Refrigerating and Air-Conditioning Engineers (ASHRAE): Peachtree Corners, GA, USA, 2017.
  33. Cao, D.V.; Kic, P. An Analysis of Influences of Blinds and Solar Radiation on Microclimate in Office Rooms during Summer Days: A Pilot Study. Agron. Res. 2019, 17, 945–956. [Google Scholar]
  34. Nguyen, J.L.; Schwartz, J.; Dockery, D.W. The Relationship between Indoor and Outdoor Temperature, Apparent Temperature, Relative Humidity, and Absolute Humidity. Indoor Air 2014, 24, 103–112. [Google Scholar] [CrossRef] [Green Version]
  35. Lee, K.; Lee, D. The Relationship between Indoor and Outdoor Temperature in Two Types of Residence. Energy Procedia 2015, 78, 2851–2856. [Google Scholar] [CrossRef] [Green Version]
  36. Martín, S.; Mazarrón, F.R.; Cañas, I. Study of Thermal Environment inside Rural Houses of Navapalos (Spain): The Advantages of Reuse Buildings of High Thermal Inertia. Constr. Build. Mater. 2010, 24, 666–676. [Google Scholar] [CrossRef]
  37. Medjelekh, D.; Ulmet, L.; Abdou, S.; Dubois, F. A Field Study of Thermal and Hygric Inertia and Its Effects on Indoor Thermal Comfort: Characterization of Travertine Stone Envelope. Build. Environ. 2016, 106, 57–77. [Google Scholar] [CrossRef]
  38. Orosa, J.A.; Oliveira, A.C. A Field Study on Building Inertia and Its Effects on Indoor Thermal Environment. Renew. Energy 2012, 37, 89–96. [Google Scholar] [CrossRef]
  39. Tong, S.; Wong, N.H.; Tan, E.; Jusuf, S.K. Experimental Study on the Impact of Facade Design on Indoor Thermal Environment in Tropical Residential Buildings. Build. Environ. 2019, 166, 106418. [Google Scholar] [CrossRef]
  40. Karlsson, J.; Roos, A.; Karlsson, B. Building and Climate Influence on the Balance Temperature of Buildings. Build. Environ. 2003, 38, 75–81. [Google Scholar] [CrossRef]
  41. Bakhtiari, H.; Akander, J.; Cehlin, M. Evaluation of Thermal Comfort in a Historic Building Refurbished to an Office Building with Modernized HVAC Systems. Adv. Build. Energy Res. 2020, 14, 218–237. [Google Scholar] [CrossRef]
  42. Park, J.; Loftness, V.; Aziz, A.; Wang, T.H. Critical Factors and Thresholds for User Satisfaction on Air Quality in Office Environments. Build. Environ. 2019, 164, 106310. [Google Scholar] [CrossRef]
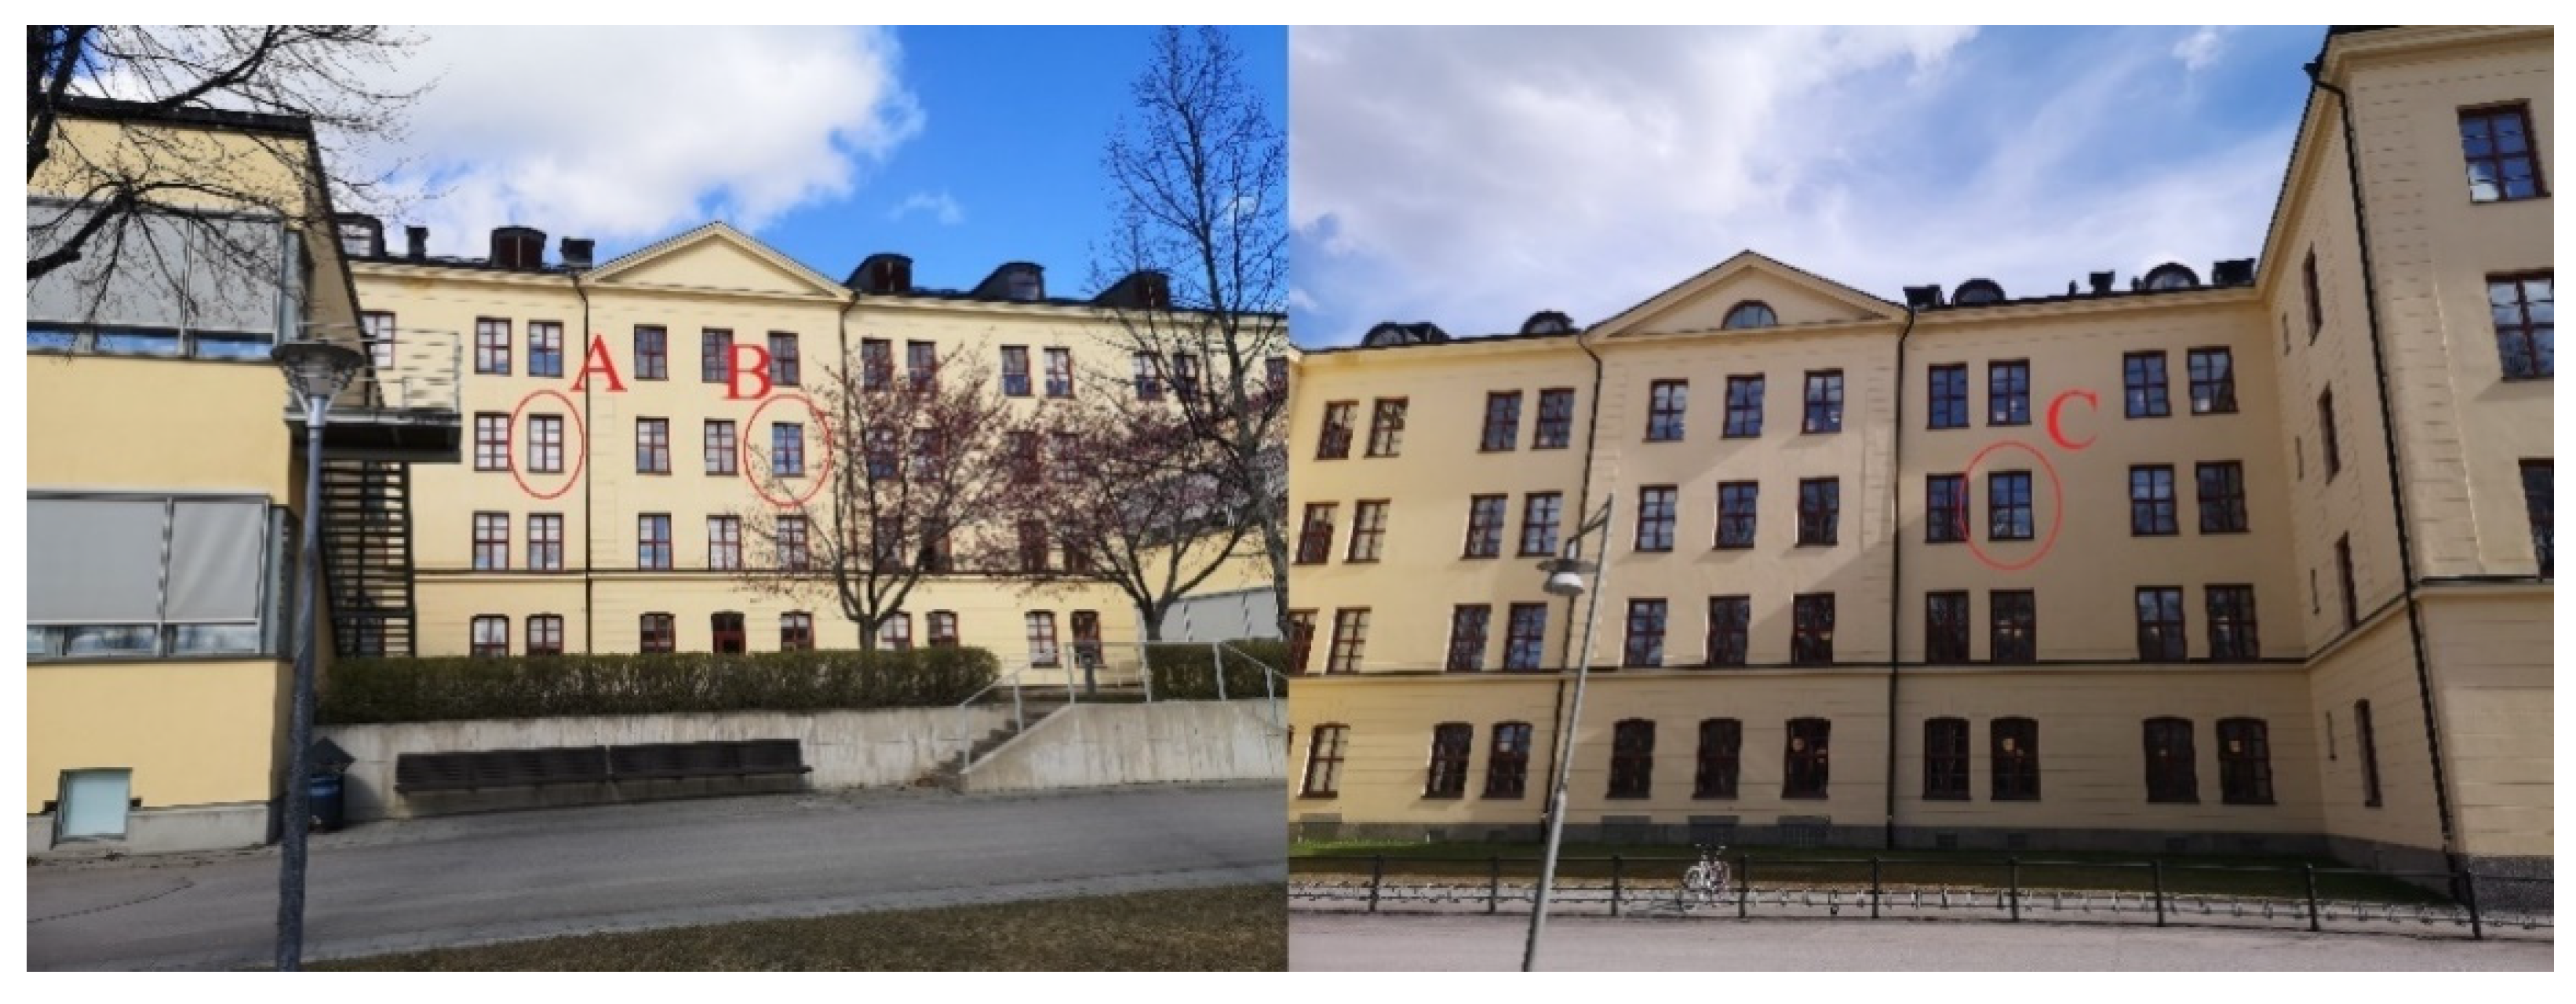
Figure 1. The windows to Rooms A and B face south, and the window to Room C faces north.
Buildings 13 00156 g001
Figure 2. Picture taken from inside room B(s) on the wall facing the corridor. The red marking shows the supply air diffuser, and the blue marking shows the exhaust air diffuser.
Buildings 13 00156 g002
Figure 3. Room B(s) window.
Buildings 13 00156 g003
Figure 4. An air supply device with nozzles directed upwards towards the ceiling.
Buildings 13 00156 g004
Figure 5. Overview of the building and room location and orientation. 15 and 16 indicate the location of the outdoor sensors.
Buildings 13 00156 g005
Figure 6. Drawing of the rooms that shows windows, doors, and desks as well as placement of the loggers. Parentheses indicates the first placement before a change in location.
Buildings 13 00156 g006
Figure 7. The window configuration in Room A.
Buildings 13 00156 g007
Figure 8. Placement of Loggers 1 and 17 in Room A.
Buildings 13 00156 g008
Figure 9. Placement of loggers 3, 4, and 18 in Room B.
Buildings 13 00156 g009
Figure 10. Placement of the globe thermometer in its first and second placements in Room B.
Buildings 13 00156 g010
Figure 11. First and second placement of loggers 9 and 19 in Room C.
Buildings 13 00156 g011
Figure 12. Placement of logger 14 (at the supply inlet) in Room C.
Buildings 13 00156 g012
Figure 13. Placement of logger 16 behind a sign outside the university.
Buildings 13 00156 g013
Figure 14. Show the airflow probe being used for measuring the ventilation flow rate of the supply device in room A.
Buildings 13 00156 g014
Figure 15. Air velocity measurements at 0.1, 0.6, and 1.1 m in Room C.
Buildings 13 00156 g015
Figure 16. Comparison of indoor and outdoor temperatures and symbols of weather, with the indoor temperature of the three rooms shown on the left axis and the outdoor temperature on the right axis.
Buildings 13 00156 g016
Figure 17. Comparison of indoor and outdoor RH and symbols of weather, with the indoor RH of the three rooms shown on the left axis and the outdoor RH on the right axis.
Buildings 13 00156 g017
Figure 18. Comparison of temperature outdoors and indoors in all three rooms for 1.5 days when it was snowing outside. The indoor temperature of the three rooms is shown on the left axis, and the outdoor temperature is shown on the right axis.
Buildings 13 00156 g018
Figure 19. Comparison of RH outdoors and indoors in all three rooms for 1.5 days when it was snowing outside. The indoor RH of the three rooms is shown on the left axis, and the outdoor RH is shown on the right axis.
Buildings 13 00156 g019
Figure 20. Comparison of temperature outdoors and indoors in all three rooms for 1 day when it was cloudy outside. The indoor temperature of the three rooms is shown on the left axis, and the outdoor temperature is shown on the right axis.
Buildings 13 00156 g020
Figure 21. Comparison of RH outdoors and indoors in all three rooms for 1 day when it was cloudy outside. The indoor RH of the three rooms is shown on the left axis, and the outdoor RH is shown on the right axis.
Buildings 13 00156 g021
Figure 22. Comparison of temperature outdoors and indoors in all three rooms for 2 days when it was sunny outside. The indoor temperature of the three rooms is shown on the left axis, and the outdoor temperature is shown on the right axis.
Buildings 13 00156 g022
Figure 23. Comparison of RH outdoors and indoors in all three rooms for 2 days when it was sunny outside. The indoor RH of the three rooms is shown on the left axis, and the outdoor RH is shown on the right axis.
Buildings 13 00156 g023
Figure 24. Shows air temperature on occasions when people are present in rooms A and C for comparing south- and north-facing rooms.
Buildings 13 00156 g024
Figure 25. Shows RH on occasions when people are present in room A and room C for comparing south- and north-facing rooms.
Buildings 13 00156 g025
Figure 26. Shows the globe temperature on occasions when people are present in rooms B and C.
Buildings 13 00156 g026
Figure 27. Results for room C facing north, showing the minimum, average, and maximum value for the air velocity measurements at three different heights and the mean temperature on the right axis for the different measuring heights.
Buildings 13 00156 g027
Figure 28. Results for room B facing south, showing the minimum, average, and maximum value for the air velocity measurements at three different heights, and the mean temperature on the right axis for the different measuring heights.
Buildings 13 00156 g028
Figure 29. Results for CO2 measurements during April 8 –24 for Rooms A(s), B(s), and C(n).
Buildings 13 00156 g029
Table 1. Room data and general information.
RoomA(s)B(s)C(n)
FacingSouthSouthNorth
Area10.5 m210.5 m210.7 m2
OccupancyMon–Friday 7–16NoneMon–Friday until 11
Sun protectionBlinds and curtainsBlinds and curtainsCurtains
Computer screen2 × 60 W1 × 60 W2 × 60 W
Computer45 W45 W45 W
Table 2. Curtain information and dimension.
MaterialFlameproof polyester, Trevira
BrandTrevira CS Day, Primetex
Width2 parts, each 1.4 m
Length3.2 m
Weight108 g/m2
Table 3. Designation, location, height, and starting day and duration of the logger used. Arrows represent a change of location and/or altitude, and the “Starting day” column indicates after the arrow which day the change took place.
LoggerModelRoomPlacementHeight (m)Starting Day
1SatelLite20THADesk0.82
2Globe thermometerBDesk → Floor1.08 → 0.72 → 5
3SatelLite20THBDesk0.8 → 0.72 → 6
4SatelLite20THBDesk0.8 → 0.75 → 6
5Globe thermometerCFloor0.71
6SatelLite20THCFloor0.71
7SatelLite20THCRadiator surface0.571
8SatelLite20THCTermostat0.641
9SatelLite20THCFurniture → Desk1.6 → 0.82 → 5
10SatelLite20THCFloor2.53
11SatelLite20THCFloor0.13
12SatelLite20THCWindow1.73
13SatelLite20THCRadiator pipe0.424
14SatelLite20THCSupply inlet3.15
15SatelLite20THOutdoorWindowsill3rd floor3
16SatelLite20THOutdoorBehind sign0.63
17Rotronic CL11ADesk0.82
18Rotronic CL11BDesk0.8 → 0.72 → 6
19Rotronic CL11CFurniture → Desk1.6 → 0.82 → 5
Table 4. Shows the supply flow rate, required flow rate, ACH, and ACHn for all the rooms.
RoomSupply FlowrateRequired FlowrateACHACHn
A (s)10.7 L/s10.7 L/s1.081.53
B (s)9.3 L/s10.7 L/s0.941.33
C (n)10.0 L/s10.7 L/s0.991.40
Table 5. CO2 level for the three rooms when people are present.
RoomCO2 Average
When People Are Present
CO2 Maximum
When People Are
Present
Proportion of Time CO2 > 1000 ppm When People Are Present
Room A (s)695 ppm884 ppm0.0%
Room B (s)768 ppm1273 ppm0.9%
Room C (n)661 ppm1147 ppm0.6%
Disclaimer/Publisher’s Note: The statements, opinions and data contained in all publications are solely those of the individual author(s) and contributor(s) and not of MDPI and/or the editor(s). MDPI and/or the editor(s) disclaim responsibility for any injury to people or property resulting from any ideas, methods, instructions or products referred to in the content.