Article

Development of a New Response Spectrum Analysis Approach for Determining Elastic Shear Demands on Shear-Dominated Steel Building Frames

1
State Key Laboratory of Disaster Reduction in Civil Engineering, Tongji University, Shanghai 200092, China
2
Department of Structural Engineering, Tongji University, Shanghai 200092, China
*
Author to whom correspondence should be addressed.
Buildings 2023, 13(1), 258; https://doi.org/10.3390/buildings13010258
Submission received: 22 September 2022 / Revised: 9 January 2023 / Accepted: 11 January 2023 / Published: 16 January 2023
(This article belongs to the Special Issue Recent Advances in Constructional Steel Research)

Abstract

:
This research is focused on improving the conventional response spectrum analysis (CRSA) method for the elastic shear demands estimation of shear-dominated steel building frames. An alternative approach named the improved response spectrum analysis (IRSA) method is proposed and validated in this paper. A simplified procedure to capture the dynamic features of a continuous shear beam (CSB) with stepped stiffness is first presented, and then validated. The CSB is employed in IRSA to replace the original eigenvalue analysis in CRSA to provide the modal parameter estimation for the considered system. A modified SRSS (MSRSS) mode superposition based on a genetic algorithm is then proposed and employed in IRSA. Based on the analyses conducted in this research, it is found that using first three modes in MSRSS to execute mode superposition could provide a great estimation of the elastic shear demands distribution. The amplification of weighting coefficients for the second and third mode contribution indicates the underestimation of the high mode effect in CSRSS. Further, response history analyses (RHA) are performed on two demonstration building frames to evaluate the improvement of the IRSA. The results indicate that IRSA provides a more precise estimation on the elastic shear force demand distribution in shear-dominated steel building frames under seismic effects compared with that which was achieved by CRSA.

1. Introduction

Response spectrum analysis (RSA) is a linear analysis method that is used to estimate the structural response under dynamic excitations [1]. In this method, the peak response of a considered multiple-degrees-of-freedom system (MDOF) is combined from those of the single-degrees-of-freedom systems (SDOFs), each of which has a vibration period that is equal to that associated with a certain vibration mode of the MDOF system. The modal contributions from those SDOFs are then combined using a certain criterion. Considering the nonlinearity of a structure during major earthquakes, the elastic demand derived from the modal composition needs to be further deducted. The RSA has been widely accepted by structural engineers in the design process due to its practicability. Many prevailing codes for seismic designs, such as ASCE/SEI 7-16 [2], treat it as an effective way to estimate the story shear demands for a considered system during design-basis earthquakes.
Many mode superposition methods have been proposed and studied since the RSA was proposed. Among these mode superposition methods, the square root of the sum of the squares (SRSS) method is widely used in mode superposition by structural engineers. This method is actually a statistical method based on the hypothesis that an earthquake is a stationary Gaussian process, and the cross-correlation between the modal responses is negligible [3]. The SRSS method proposes that the peak response of the considered system can be estimated as the square root of the sum of the squares of the peak response from each mode of vibration. To date, this method is recommended in numerous codes for seismic design [2,4]. From the structural point of view, using SRSS mode superposition in the RSA provides an alternative approach to include the contribution from the high-mode effect. Nevertheless, some research has pointed out the detrimental defects of the SRSS method, i.e., the cross-correlation between the modal responses is neglected. Hence, the CQC method was developed to include the effect of cross-correlation between the modal responses [5]. Chopra summarized the application scope of each method and proposed that adopting modal combination rules in the RSA to conduct an elastic analysis may generally lead to the inadequate results, especially in upper story of the system [1]. The maximum deviation of the considered research was up to 25%. Moreover, the researcher also indicated that using the mode superposition to estimate the response of the structure under a single ground motion record may lead to much more deviations. This is caused by the assumptions of the random vibration theory behind the derivations for each method. The similar defect of RSA also exists while performing a nonlinear analysis. To more accurately capture the nonlinear demands during major earthquakes, some modified RSA were proposed to adjust the contribution of the higher mode effect. Khy and Chintanapakdee et al. proposed a modified response spectrum analysis to capture the shear force demand for tall RC shear wall buildings [6]. Sullivan, Priestley et al. proposed a substitute structure method to include the higher mode effect for ductile structures [7]. Pennucci, Sullivan et al. proposed that the higher mode effect should be considered based on the ductile state [8]. Moreover, some spine systems were developed to eliminated the higher mode effect under nonlinear deformation [9,10].
In this research, the authors intend to propose an improved response spectrum analysis (IRSA) method in two dimensions to estimate the elastic base shear demands in the preliminary design stage on steel building frames, whose earthquake-induced lateral displacements are dominated by shear and which are denoted as shear buildings hereafter. Note that this preliminary study is focused on normal two-dimensional steel building frames with well-separated natural frequencies. The cross-correlation between the modal responses is minor and neglected. Thus, the SRSS method, instead of CQC method, is adopted in this study. A simplified model was first proposed to obtain the modal properties of the considered shear building frames, which are needed in the IRSA. Specifically, in the model, a considered shear building can be represented by a shear-dominated cantilever with varied shear stiffness. As will be described in detail in the following sections, the simplified model eliminates the needs for the eigenvalue analysis of the original shear building in finite element software. As such, the simplified model is particularly attractive in the preliminary design stage when many design parameters may be varied. Aside from the simplified model for gleaning the modal properties, this paper establishes a new rule to combine the shear demands of the story associated with different vibration modes, which is denoted as the modified SRSS method (MSRSS). The advantage of the MSRSS method over the other existing approaches and design code recommendations are demonstrated through the parametric analyses of representative shear building examples. Finally, the authors summarize the application scope and limitation of the study and point out the direction of further research.

2. A Simplified Model for Shear Building

While the earthquake-induced lateral displacement of a building structure combines the contributions of the shear and flexural demands, according to past investigations [2,11], a cantilever member can be used to approximate the modal property of the building.
Generally speaking, finite element (FE) model analysis could provide a precise prediction about the modal parameters for the RSA. However, the modeling process will cost great deal of time in the preliminary design stage. Additionally, adjusting the design parameters will incur a large workload to revise the FE model. Thus, in this study, an algorithm based on a cantilever member is adopted, which can also be involved in parametric analyses. When a building frame is categorized as a “shear building”, it can be represented by a cantilever member with proper shear stiffness and mass distributions. This section introduces how to build a continuous shear beam model with stepped stiffness based on the uniform shear beam model.

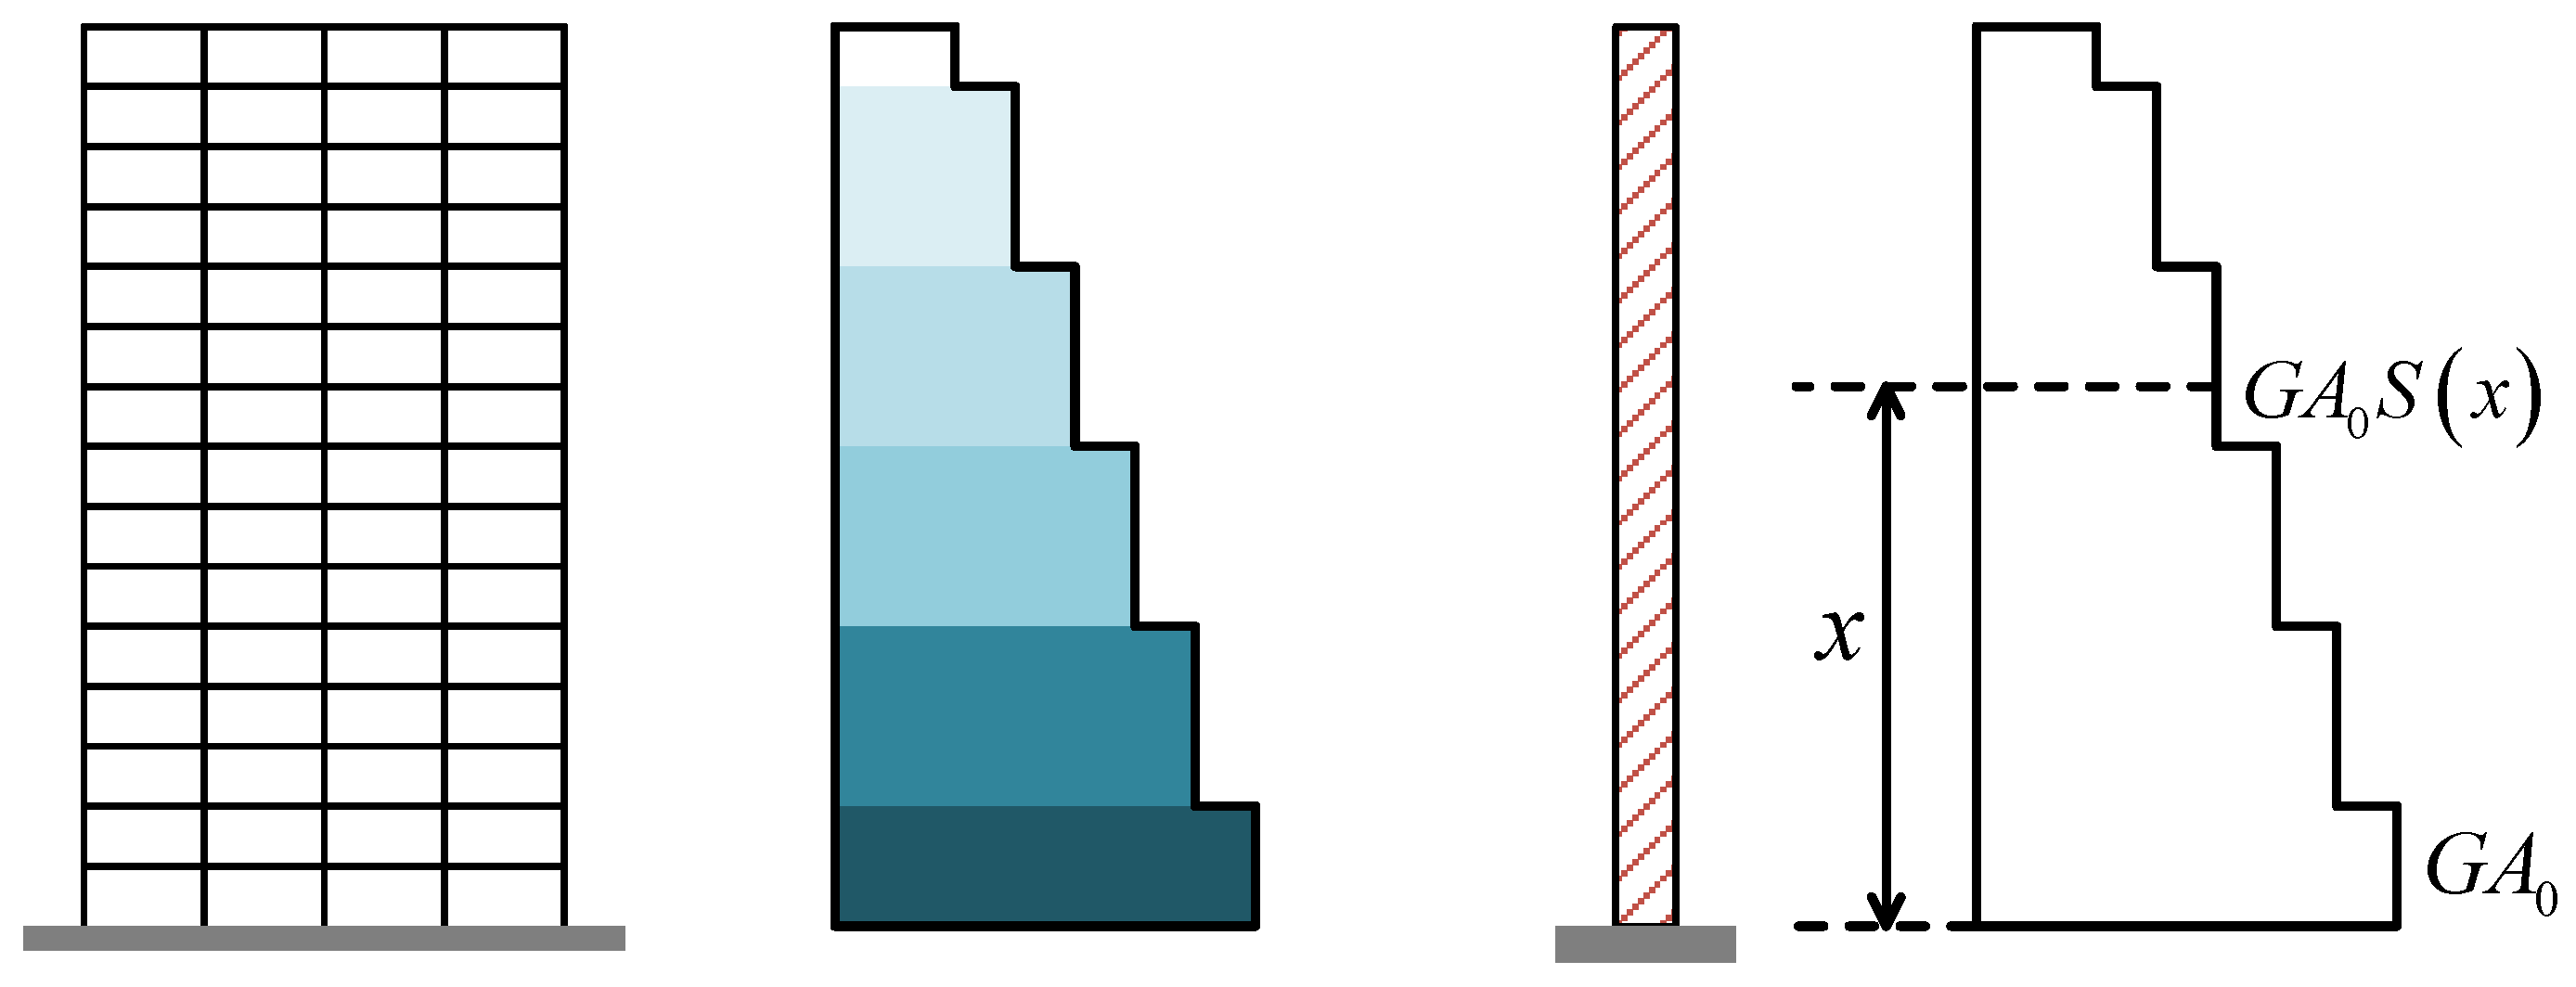
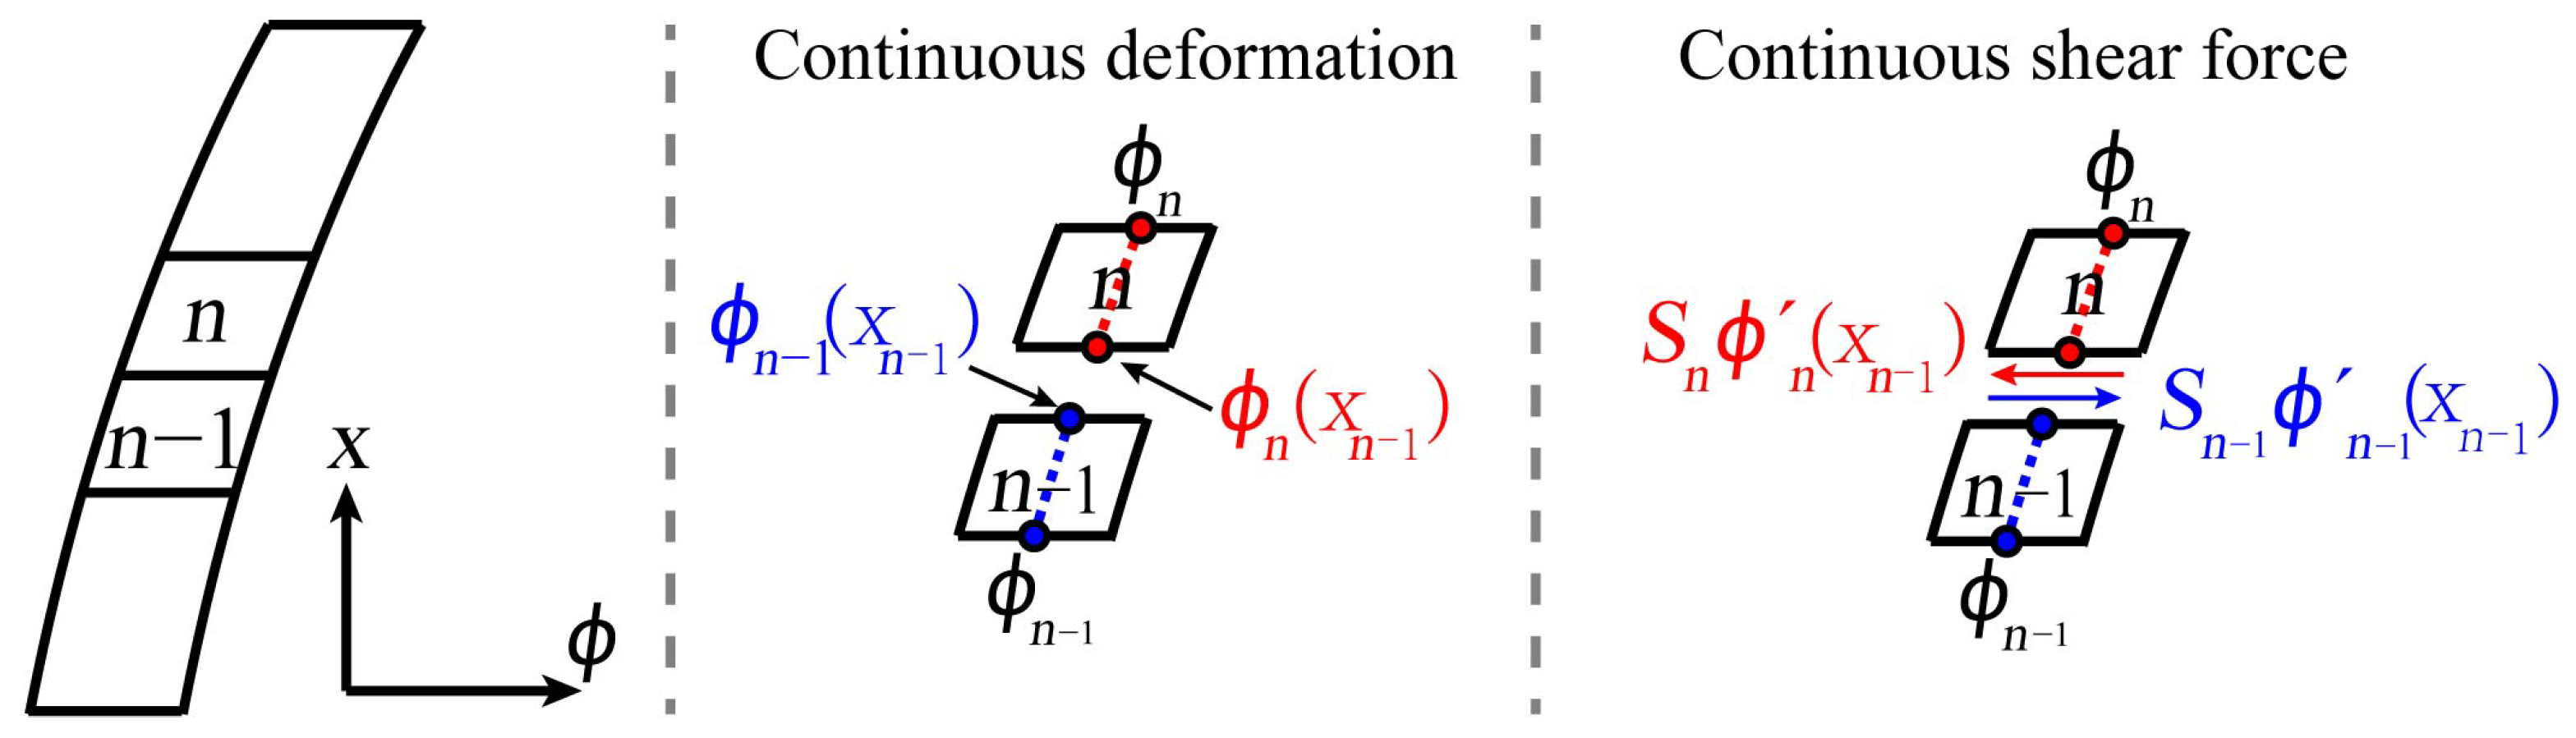
2.1. Continuous Shear Beam with Stepped Stiffness

Referring to prior research [12], the differential equation of a shear beam along its height is shown as Equation (1).
ρ 2 u ( z , t ) t 2 z [ G A ( z ) u ( z , t ) z ] = 0
where u is displacement, t is time, z is height from the ground, and GA is the shear stiffness. The mass distribution ρ is assumed to be uniform along the height in this model. When we substitute x = z/H and GA(x) = GA0S(x) into Equation (1), Equation (2) can be obtained. x is the normalized height, S(x) is the shear stiffness ratio of the section of x height to that of base, H is the height of the structure, and GA0 is the shear stiffness at the base of the shear beam.
ρ 2 u ( x , t ) t 2 G A 0 H 2 u ( x , t ) x d [ S ( x ) ] d x G A 0 H 2 S ( x ) 2 u ( x , t ) x 2 = 0
When we decompose the variables, u(x, t) can be expressed as Equation (3), where ϕ(x) is the mode shape which determines the relative distribution of displacements along the height, and the function q(t) defines the way it varies over time.
u ( x , t ) = ϕ ( x ) q ( t )
By substituting Equation (3) into Equation (2), Equation (2) can be decomposed into Equations (4) and (5). Equation (4) defines the free vibration of an undamped SDOF system with circular vibration frequency ω.
d 2 q ( t ) d t 2 + ω 2 q ( t ) = 0
S ( x ) d 2 [ ϕ ( x ) ] d x 2 + d [ S ( x ) ] d x d [ ϕ ( x ) ] d x + ρ H 2 G A 0 ω 2 ϕ ( x ) = 0
It is Equation (5) which precisely governs the vibration mode shape and the corresponding circular vibration frequency ω. This equation also indicates that the dynamic features of the shear beam system can only be affected by the stiffness distribution function S(x) with the given parameters ρ, H, and GA0.
For most building structures, the inter-story stiffness is not uniform along the building’s height. Generally speaking, the inter-story stiffness of a lower story is higher than that of an upper story. For a multi-story building structure, adjacent stories often possess the same beams and columns. Thus, the stiffness distribution of a multi-story building is usually stepped, and it decreases progressively from the base to the roof of the building, as shown in Figure 1. The stiffness distribution function S(x) for this distribution type is correspondingly stepped as shown. This distribution makes S(x) remain as a constant in a specific length of a shear member. Thus, for the nth segment of the shear-dominated cantilever member, Equation (5) can be transformed into Equation (6), where Sn is the stiffness distribution coefficient of nth segment of the member. Note that Equation (6) is also remain valid for the member with uniform properties.
S n d 2 [ ϕ ( x ) ] d x 2 + ρ H 2 G A 0 ω 2 ϕ ( x ) = 0
The general solution of Equation (6) can be easily obtained as Equation (7).
ϕ n ( x ) = A 1 , n sin ( β n x ) + A 2 , n cos ( β n x )
where A1,n and A2,n are constants of the nth segment of the member, which depend on the boundary conditions. βn is a constant associated with the stiffness and mass of the nth segment of the member. βn in Equation (8) can be expressed as below.
β n 2 = ρ H 2 S n G A 0 ω 2 = S 1 β 1 2 S n
The boundary conditions of each segment of the shear-dominated cantilever member should be considered. As presented in Equation (9), the displacement of the lower end of the nth segment should be consistent with that of the upper end of the (n−1)th segment (the displacement of the base should be zero, ϕ1(0) = 0), as illustrated in Figure 2.
Moreover, the shear between the two contacted faces in the adjacent segments should be consistent, as Equation (10) (the shear force at the top should be zero, Snϕn(1) = 0).
ϕ n 1 ( x n 1 ) = ϕ n ( x n 1 )
S n 1 ϕ n 1 ( x n 1 ) = S n ϕ n ( x n 1 )
By substituting Equation (8) into Equations (9) and (10), for each segment, the equation matrix for boundary conditions can be established as Equation (11).
P ( β 1 ) [ A 1 , 1 A 2 , 1 A 1 , 2 A 2 , 2 A 1 , n A 2 , n ] = 0
where P(β1) is the coefficient matrix. To derive a nontrivial solution for A1,n and A2,n, the determinant of P(β1) should be zero as Equation (12). Additionally, β1,i for the ith mode can be solved using it. Note that the solution for Equation (12) is not unique. The minimum solution β1,1 is for the first mode, while the greater β1,i is the solution for the higher ith mode.
det ( P ( β 1 ) ) = 0
Given the β1,i for the ith mode, the circular frequency ωi and βn,i can be obtained from Equation (8). Finally, the mode shape φn,i for the ith mode can be obtained.

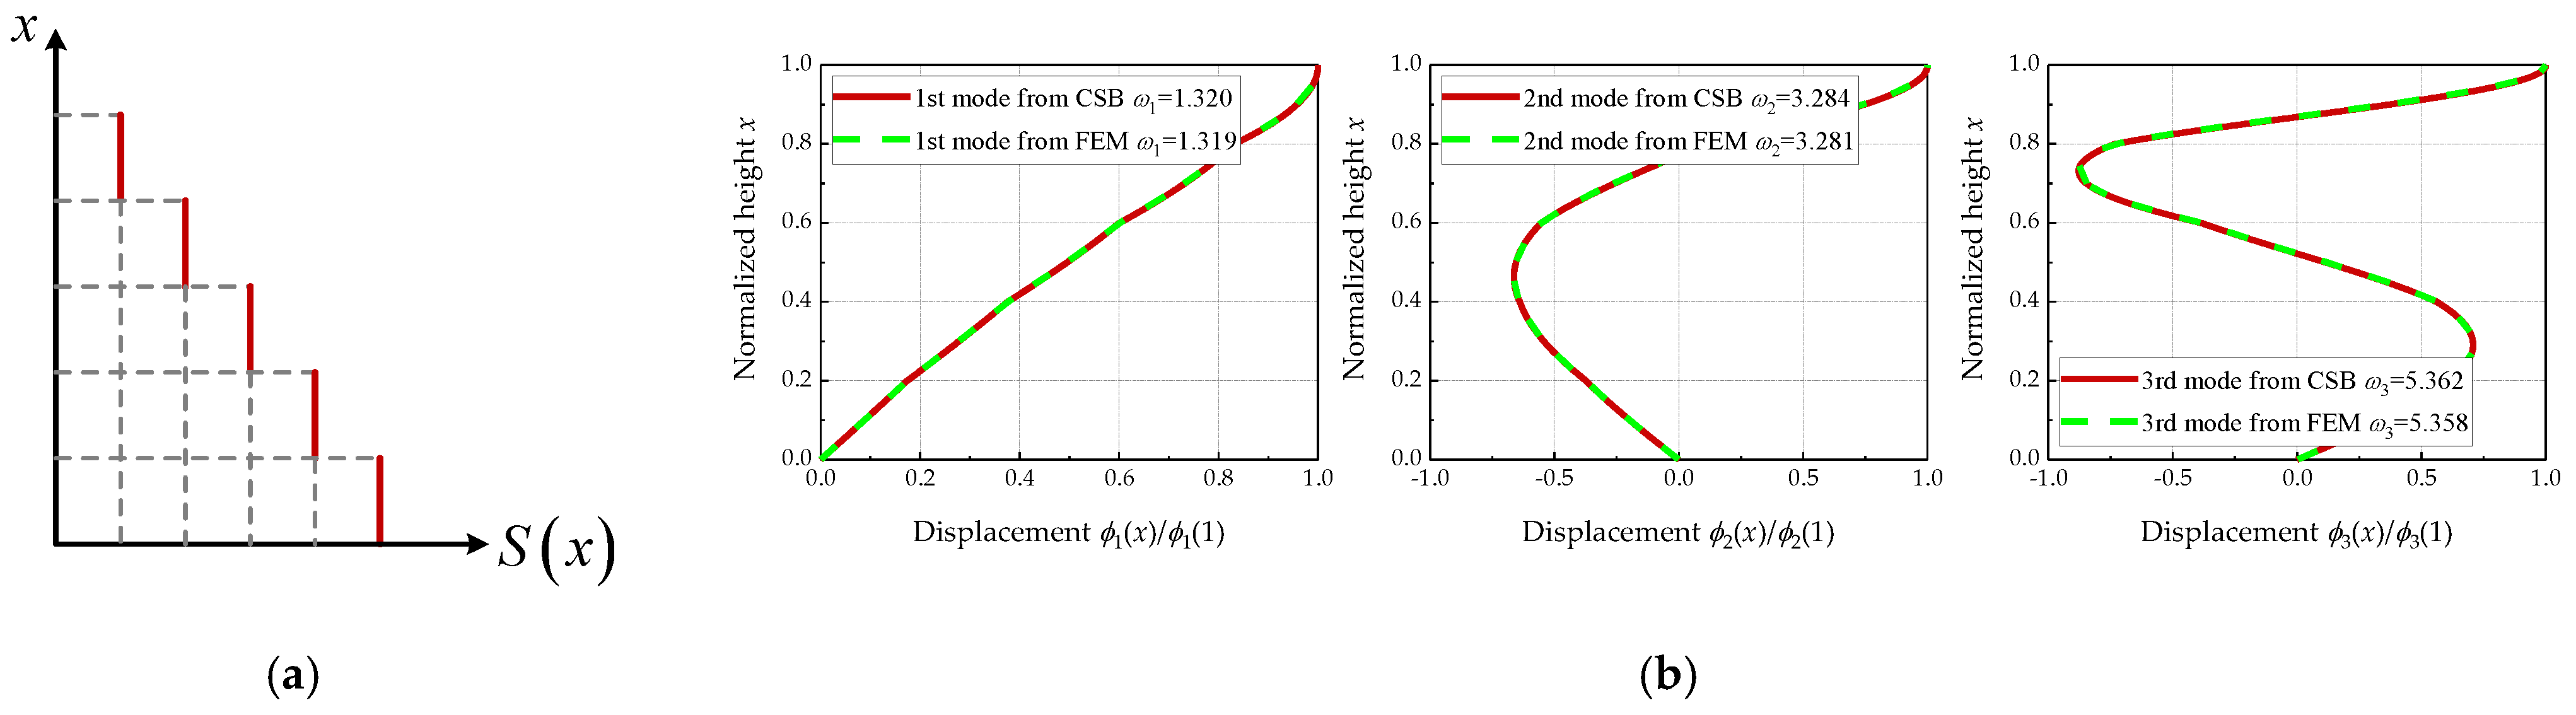
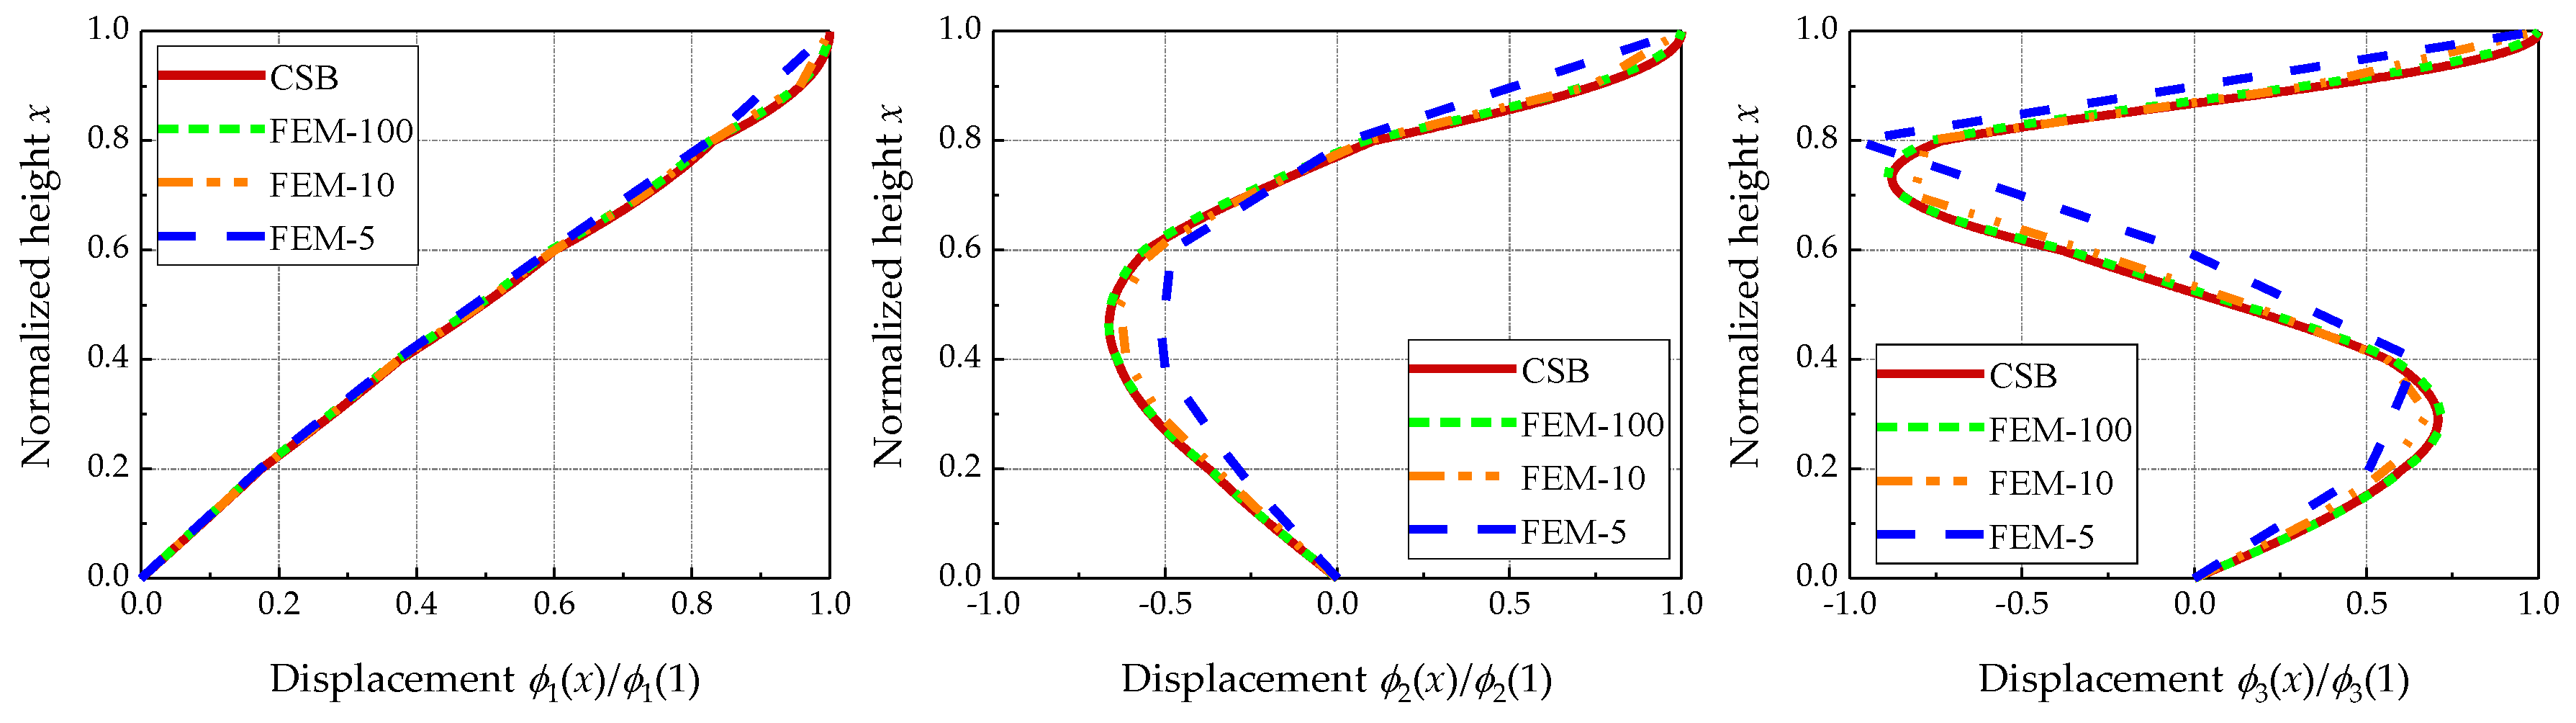
2.2. Validation of the Approach

To validate the equations derived in Section 2.1 for the periods and the mode shapes, a demonstration shear beam (DSB) in FEM software is established. The DSB is discretized into 1000 elements which only possess shear stiffness. The mass is evenly assigned at two end nodes of each element. The distribution of the shear stiffness of the DSB and the continuous shear beam (CSB) are illustrated in Figure 3a. The lateral stiffness of upper part is 20% base shear stiffness less than that of lower part. Additionally, the mass is evenly distributed along the height of the system. Figure 3b presents the comparisons for the first three modal shapes for the two systems. Note that the three modal shapes are all normalized, and the maximum displacement for each modal shape of each system is 1.0. It could be clearly noticed that the results from CSB match these from DSB, validating the accuracy of the derived equations.
Though, the consistency between CSB and FEM is significant in Figure 3b, and the discrepancy between CSB and the discretized model still exists, especially when there are not that many degrees of freedom. Note that the building frames are actually discretized systems. Thus, to validate the applicability of CSB, the FEM analyses with different numbers of element were performed. Figure 4 presents the comparison of modal parameters between CSB and FEM. Three FEMs possessing five, ten, one hundred numerical elements are analyzed. It should be noted that the discrepancy does increase with the decrease in degrees of freedom. However, Figure 4 presents satisfactory discrepancies in the modal parameters between CSB and FEM, and even the degree of freedom is five.

3. Modified SRSS Method for Improved Response Spectrum Analysis

As mentioned before, prior research has reported that adopting the conventional SRSS (CSRSS) method in the RSA may lead to inadequate results [1]. Additionally, as recommended in ASCE/SEI 7–16 [2], the RSA should include a minimum number of modes to obtain a combined modal mass participation of at least 90% of the actual mass. Not all of the modes have to be considered, which will also lead to the reduction of the shear demands. To mitigate the limitation of the CSRSS, the MSRSS method was developed for use in the RSA in this research. The following first briefly presents the RSA procedure with CSRSS. Then, MSRSS is proposed based on adjusting the weighting factors for each modal contribution.

3.1. Response Spectrum Analysis with CSRSS

For an elastic building frame, the displacement can be expressed as Equation (13) in the RSA, where N is the number of considered modes; Γn is the participation factors of the nth mode given by Equation (14); ι can be calculated according to Equation (15); Dn(t) is the displacement response history of the SDOF system, representing the nth mode.
u ( t ) = n = 1 N Γ n ϕ n D n ( t )
Γ n = ϕ n T m ι ϕ n T m ϕ n
ι = n = 1 N Γ n ϕ n
The maximum effective seismic force on each floor can be given as follows:
f n = Γ n m ϕ n A n
where An is the design spectrum acceleration associated with the nth mode. The design shear force demand associated with the ith story and nth mode Fi,n can be then obtained by accumulating the effective seismic force along the building height. The design shear force for the ith story Fi can be obtained by combining Fi,n using the SRSS method as Equation (17).
F i = ( n = 1 N F i , n 2 ) 0.5

3.2. The MSRSS Method

Since the CSRSS method was proposed and applied in structural engineering [3], it has been widely accepted by engineers. From the structural point of view, the CSRSS method indicates that each modal vibration of the system is a stationary stochastic process, and it provides an alternative approach to include the high mode effect of the considered system. Nevertheless, some researchers pointed out that using the CSRSS method may lead to inadequate results, especially in upper story of a multi-story system, as described above [2].
To quantitatively address the limitation of the CSRSS method, a 20-story steel moment-resisting frame (benchmark structure) designed for the Los Angeles, California region, which has been considered in past investigations for different research purposes [13], is revisited in this research. Figure 5 shows the floor plan of the benchmark building and the elevation of the selected lateral force resisting frame. As shown, the structural system is 30.50 m (5 bays) by 36.60 m (6 bays) in plan. Each bay is 6.10 m in length in both of the directions. The lateral force resisting frames are arranged as exterior bays, while the interior bays are steel frames with simple connections. The floor-to-floor height for a typical story is 3.96 m, and for the ground level and basement levels, they are 5.49 and 3.65 m, respectively. More detailed information can be found in prior research [13]. The selected frame is numerically modelled as a frame model in Opensees [14] to perform the eigenvalue analysis and the RHA. Note that this research focuses on the mode superposition of the elastic modes, and the nonlinearity of the material is not considered in this research. Thus, the columns and beams are modelled using elastic Timoshenko beam elements. The lumped mass at each floor for the considered frame is 276 ton. Additionally, the rigid diaphragm assumption is adopted in this FE model. This model is established to obtain the modal properties and quantify the shear demands using the RHA under each earthquake ground motion. This is followed by obtaining shear demands using the equivalent lateral force (ELF) procedure and the RSA [2].
The first three mode shapes of the considered system from FE model are presented in Figure 6, and the corresponding mode periods are also presented in the figure.
As recommended in ASCE/SEI 7–16 [2], the RSA should include a minimum number of modes to obtain a combined modal mass participation of at least 90% of the actual mass. Therefore, the first three modes of the benchmark frame are used in the CSRSS mode superposition. Twenty typical earthquake ground motions, named LA01-LA20, in Los Angeles from the SAC steel project [15] are employed for the comparison. The shear force demands of the considered frame from the varied calculation methods under the 20 ground motions (LA1-20) are summarized in Figure 7. Note that the CSRSS curve in each subfigure represents the shear demands from the RSA with the CSRSS superposition. The MSRSS mode superposition will be discussed in depth later.
The results comparison in Figure 7 indicates that the RSA method with the CSRSS superposition generally underestimates the shear demands compared with that of the RHA. Moreover, the shear demands of the upper stories are underestimated in many cases when the CSRSS method is used in the RSA, suggesting that the high-mode effect may not be precisely captured by the CSRSS mode superposition, which may lead to inadequate design parameters. These observations indicate the need of an improved method for combining the modal shear demands. As for the ELF procedure, the deviation between the ELF and RHA is much more significant along the building’s height, which also indicated the limitation of the lateral force distribution used in the ELF.
As mentioned before, the CSRSS method combines the responses of different modes in an equal manner, as Equation (17) suggests. However, the results discussed above indicate that the CSRSS method fails to adequately capture the contributions of the high modes. Thus, the MSRSS method that equips the shear demand from the ith mode with a weighting coefficient An is proposed below:
F i = ( n = 1 N ( A n F i , n ) 2 ) 0.5
To clarify the improvement of the MSRSS method and choose the applicable weighting coefficients, an Error indicator is defined as Equation (19) to represent the deviation between the story shear demands from the RHA and the RSA with MSRSS. It can be noticed that Error can also represent the deviation between the shear demands from the RHA and the RSA with CSRSS by setting An to be equal to 1.0.
E r r o r = [ 1 m GM m = 1 m GM ( 1 i FL i = 1 i FL | F i , m , RHA ( n = 1 N ( A n F i , m , n , RSA ) 2 ) 0.5 F i , m , RHA | ) 2 ] 0.5
Fi,m,RHA is the calculated shear demand of the ith story of the considered frame under the mth ground motion from the RHA of the frame model; Fi,m,n,RSA is the corresponding shear force demand of nth mode under the mth ground motion from the RSA of the simplified model of the benchmark building (i.e., the cantilever member model); N is the number of modes considered in the RSA method; iFL is the total story number of the frame; mGM is the number of ground motion records in this research. Note that the factor Error is the average deviation in terms of the different ground motions and stories. Thus, Error could reflect the shear demand discrepancy between the RSA method and the RHA method.
To clarify the participation of the high-mode effect on the inter-story shear force demands in the representative benchmark frame, the weighting coefficients An in Equation (19) are adjusted to achieve the minimum Error. Note that searching for a group of An values to achieve the minimum Error is a project with many iterations. Therefore, a genetic algorithm (GA) is adopted in this study to find the minimum Error and the corresponding weighting coefficients. The genetic algorithm (GA) is a search-based optimization technique based on the principles of genetics and natural selection. This method has been widely in optimization design to decrease the number of iterations. Note that Fi,m,RHA in Equation (19) is obtained by OpenSees using the RHA method, Fi,m,n,RSA is obtained using the RSA as mentioned before. The undecided variables in Equation (19) are only weighting coefficients An.
Figure 7 shows the results from the RSA method with the MSRSS and RHA methods, respectively. The figure clearly indicates that modifying the weight factor for the higher modes significantly increases the adequacy of the shear force demand estimation in the RSA. Compared with the results associated with the CSRSS method, the results from the MSRSS agree more with the results from the RHA.
Note that three modes are used to conduct the optimal process of the weight coefficients in the RSA-MSRSS. The number of modes in this optimal process is also deemed as a variable. The authors also present the resulting Error of the CSRSS and MSRSS with different considered mode numbers in Figure 8. The figure indicates that the Error of MSRSS is lower than that of CSRSS by considering the weighting coefficients for each mode. Additionally, it can be clearly noticed that the Error would decrease when we increased the number of considered modes N, which is in accordance with our cognition. Nevertheless, the indicator will not decrease remarkably with the increase in N when N is higher than three. Moreover, the first three modes in the RSA for the benchmark building achieved a combined modal mass participation of more than 90% of the system reactive mass, which is required in ASCE/SEI 7–16 [2].
The weighting coefficients An for the first three modes are given in Table 1. The group of coefficients exhibit some meaningful laws. The coefficient for the first mode is 1.000, and for the second and third modes, they are 1.276 and 1.663, respectively.

4. Validation of the IRSA Method

The improved response spectrum analysis with the modified SRSS mode superposition includes the contents described in Section 2 and Section 3. The method is used to obtain the elastic story shear demand for the design of shear-dominated building frames.

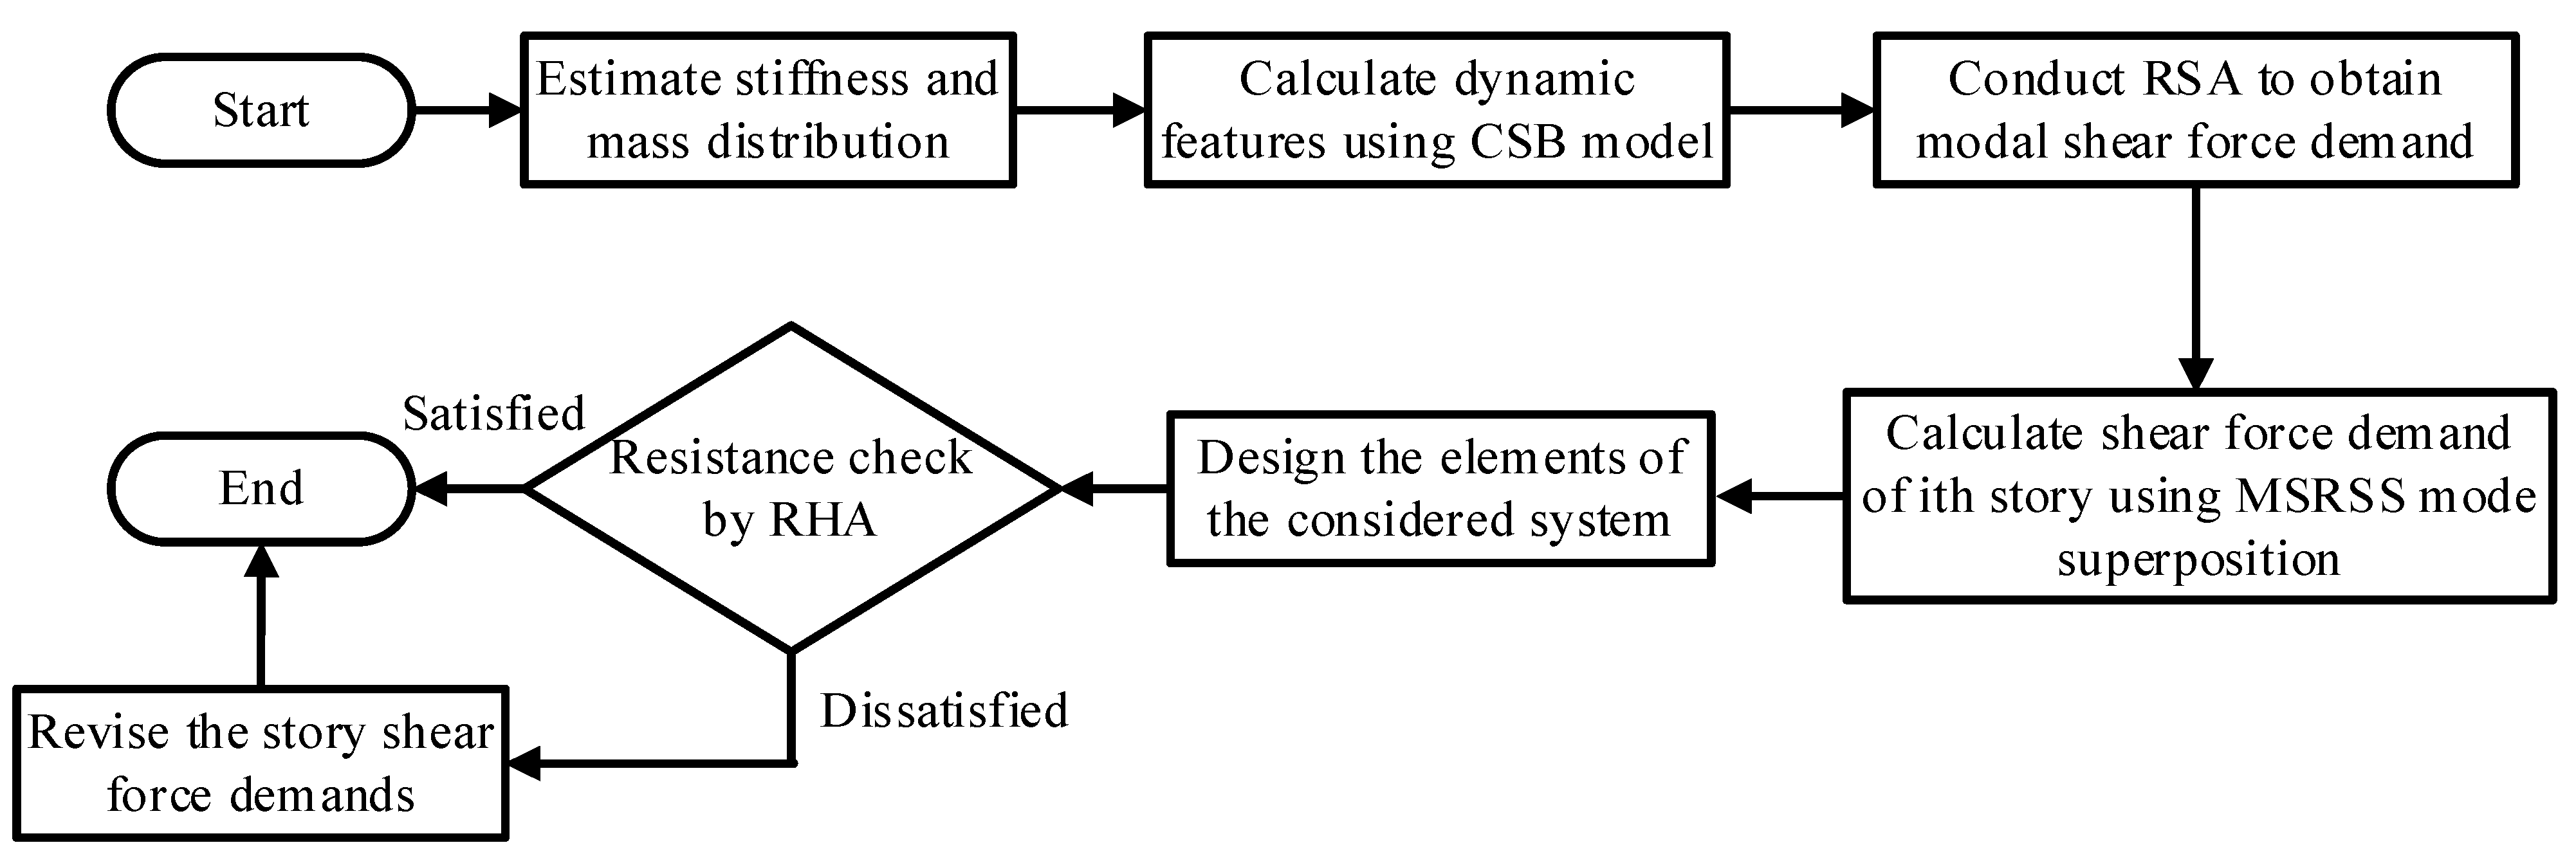
4.1. Design Procedure of IRSA

Compared with the conventional RSA method, the IRSA uses a continuous shear beam mode to provide dynamic parameters without conducting an eigenvalue analysis using numerical software. Moreover, adopting the MSRSS mode superposition in IRSA may achieve more adequate shear demand distributions along the building’s height. The step-by-step design procedure is presented in Figure 9.
Firstly, the engineers are supposed to make a rough estimation on the stiffness and mass distribution. Then, the method proposes that they use the continuous shear beam with stepped stiffness to provide the dynamic features of the considered system. The dynamic parameters will be then used for conducting the RSA to obtain the shear force demands along the building’s height for each mode. This is followed by the mode superposition by MSRSS to obtain the final shear force demand for each story. Note that the method is proposed for linearly elastic structures with shear deformation, and so the systems exhibiting nonlinear behavior and flexural-type deformation are not included in this research.
Two demonstration building frames are revisited to assess the improvement of the IRSA method that is presented above. The two frames possess different story numbers and elevations. The ELF procedure, the RSA method with different mode superpositions, and the RHA method are performed, respectively, using multiple ground motions to conduct the validations. The following section presents the basic information of the demonstration buildings, a detailed procedure based on the proposed approach, and the comparison results.

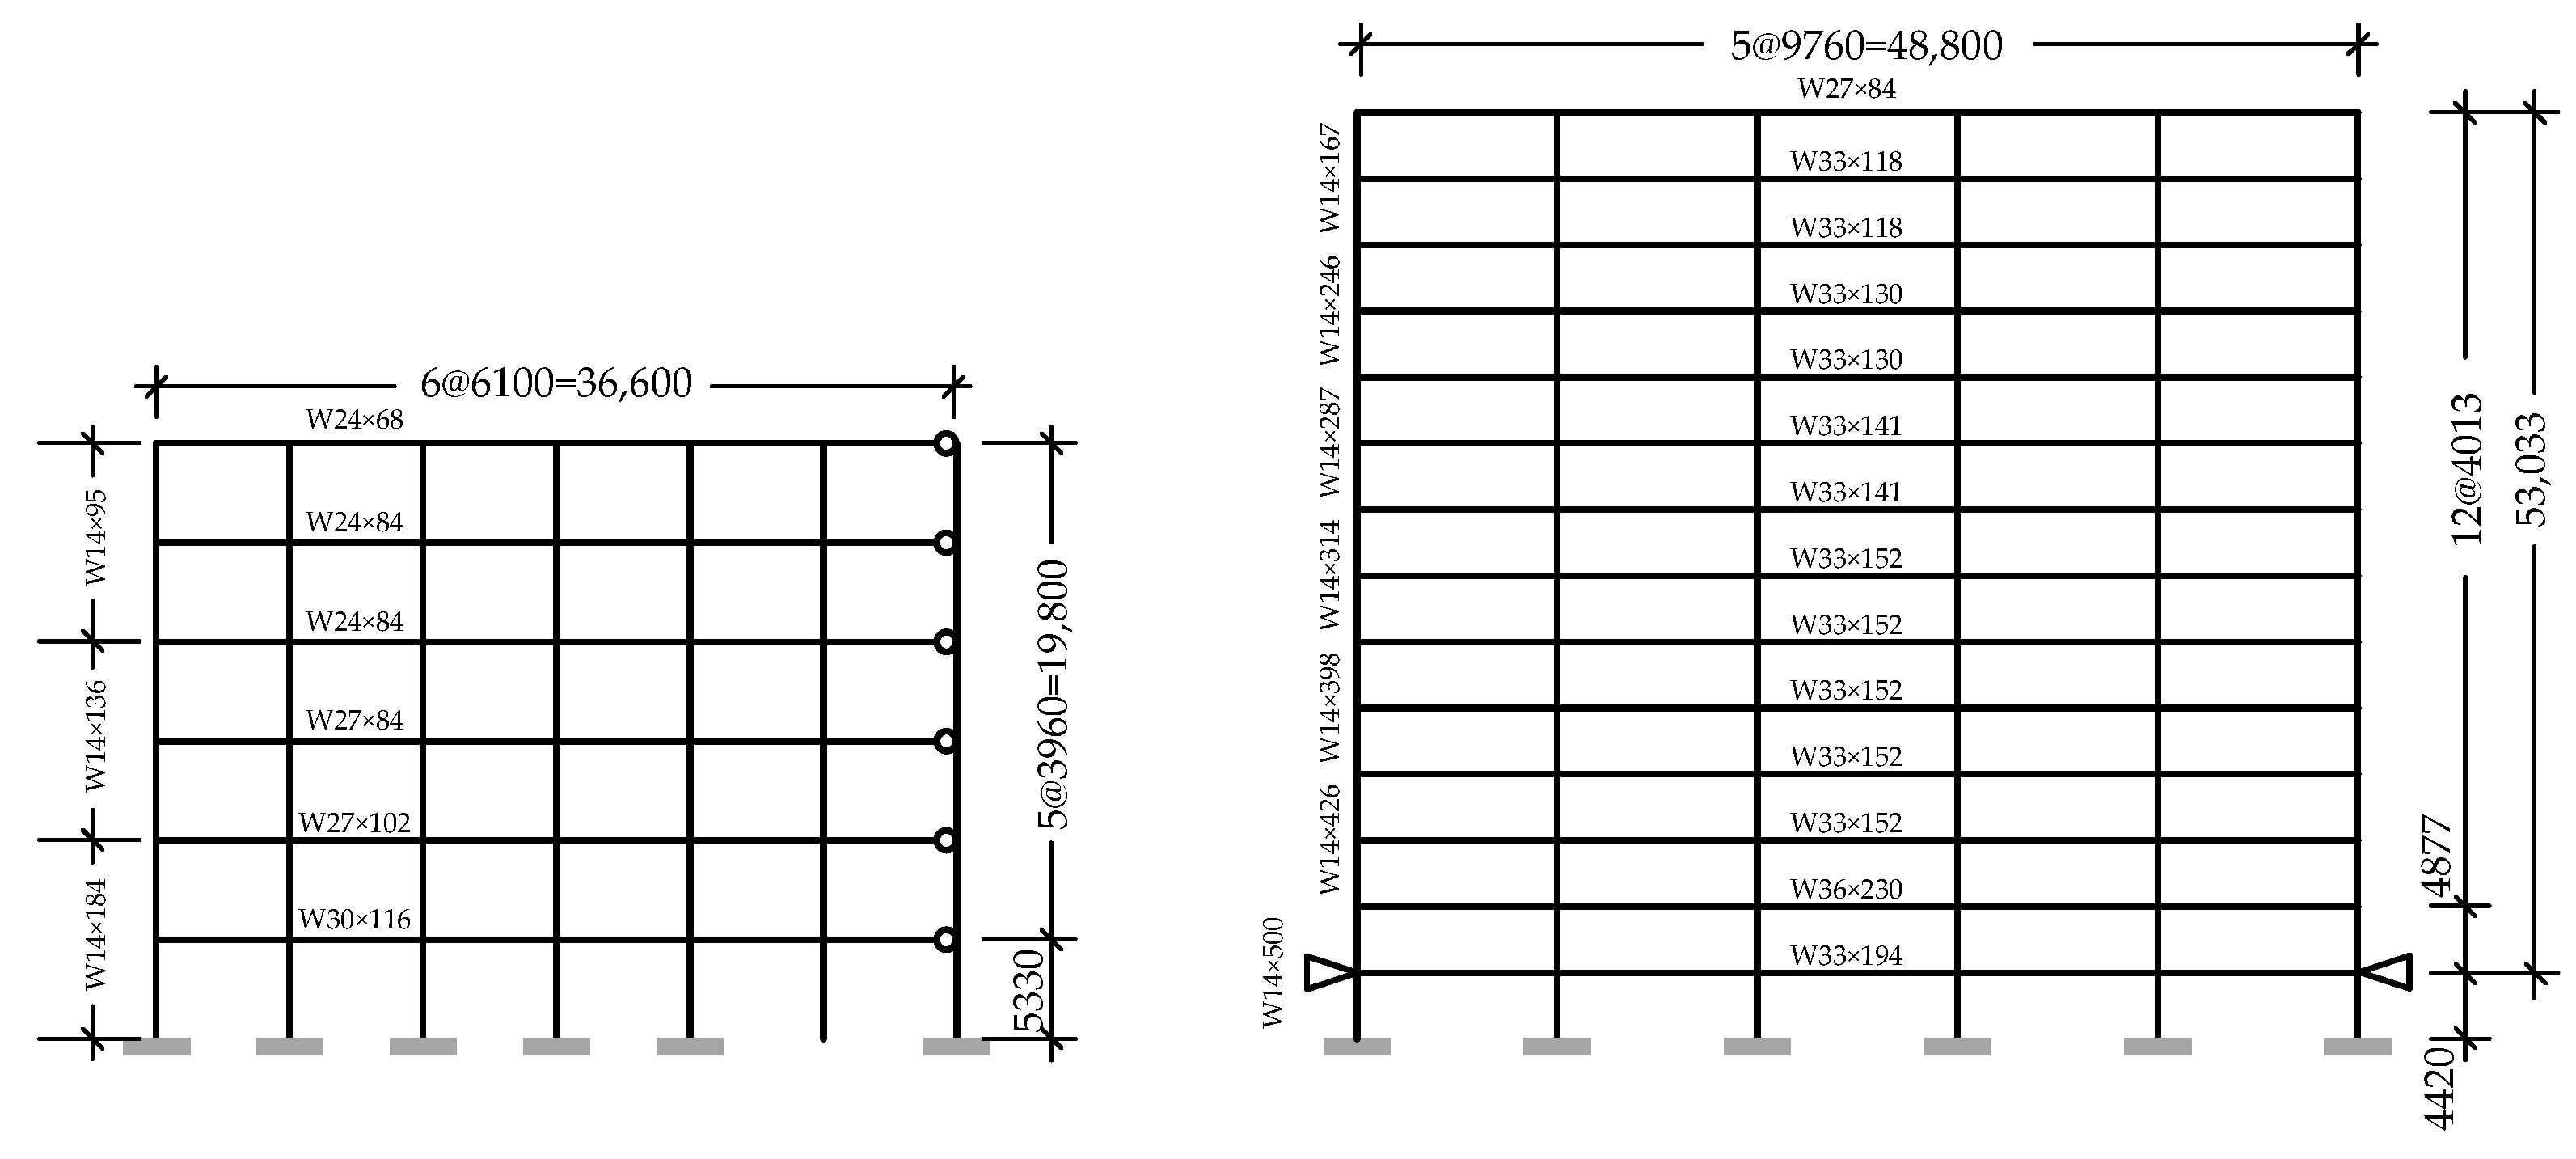
4.2. Demonstration Buildings

The two demonstration steel moment-resisting frames initially produced in the California Strong Motion Instrumentation Program (CSMIP) are reconsidered in this research. One frame is a six-story frame (denoted as 6F) that was designed in 1976 based on the 1973 UBC requirements [16]. The other frame is a 13-story frame (denoted as 13F) that was built in 1975, which was also designed in accordance with the 1973 UBC requirements. Figure 10 shows the floor plans of the demonstration buildings. The six-story frame is 36.60 m by 36.60 m in plan. The selected frame possesses six bays (6 m × 6.10 m) in one direction. The thirteen-story frame is 48.80 m by 48.80 m in plan. The selected frame possesses five bays (5 m × 9.76 m) in one direction. As shown, two exterior lateral moment resisting frames are symmetrically arranged along each horizontal direction. The interior frames were designed as gravity frames, which consist of simple shear connections only. The elevations of the demonstration buildings are presented in Figure 11. The height of each story and the sectional information of each column and beam are presented in the figure. The tributary seismic reactive masses of each floor for 6F and 13F are 235.6 ton and 270.3 ton, respectively. More detailed information about the demonstration buildings can be found in prior research [17]. Note that the two building frames are revisited to demonstrate that the RSA which adopts the MSRSS method could provide relatively adequate results for the shear demands of the building stories.

4.3. Computer Modeling and Seismic Excitations

The systems shown in Figure 11 are numerically modelled in OpenSees to conduct the RHA [14]. Further, in order to validate the application scope of the method, one special case based on 13F is established as 13F-W, in which the bending stiffness of the beams and columns below the eighth floor are reduced by 50%. This case is supplemented to validate the application of the method in the structures with an irregular stiffness distribution along the building’s height.
All of the frame members are modelled using the displacement-based beam-column elements. The sectional parameters are consistent with those of prior research to achieve the same dynamic features. Since the method is proposed for linearly elastic shear structures, the material nonlinearity of the systems is not considered in the OpenSees model. Thus, all of the elements are modelled with an elastic material. It should be noted that the elastic modulus of steel in the 6F model is increased by 18% to achieve the same periods, as recommended in prior research [17]. As proposed in prior research, the Raleigh damping model of 3% is used for the two models. A leaning column pinned to the ground is included in the model to capture the P-Δ effect of the system. The leaning columns are modeled using the truss element with tremendous axial stiffness. The tributary gravity loads are applied to the leaning column on the floor levels. Additionally, a rigid diaphragm is adopted in this model.
The computer model of each frame is analyzed using 100 earthquake records, as recommended in the ATC 63 project [18]. One hundred ground motions contain multifarious spectral contents. Forty-four far-field and fifty-six near-fault ground motions are included. Note that the selected records may not closely match the design spectrum. Abundant spectral contents in these ground motions are especially adopted to eliminate the influence of the earthquake records.

4.4. Discussions of Analysis Results

The IRSA is conducted following the procedure that is described above. Firstly, the continuous shear beams are established to make an estimation on the dynamic features of the three building frames. The mode frequencies and mode shapes of first three modes from the CSB method and the eigenvalue analysis in OpenSees are presented in Figure 12. It can be clearly indicated that the CSB method can provide a satisfactory estimation of the modal parameters. The theoretical analysis results agree strongly with the results from the eigenvalue analysis of the refined numerical model, especially for the first mode. It seems that the results of 6F for higher modes are not very precise. The difference mainly derived from the assumption in the CSB method that the considered system could be simplified into a continuous shear member. The discreteness of a building structure will certainly lead to deviation between the results from two methods, as mentioned before. Additionally, the normalization of the mode shape makes it much more remarkable in the figure. However, the higher the system is, the more precise estimation on modal features could be achieved.
Then, the dynamic parameters of the three demonstration building frames are adopted to conduct the spectral analysis. The story shear demand of each mode of the considered systems under each ground motion can be easily obtained. The MSRSS methods is then performed to estimate the shear demands of the building stories along the height of the building. It should be noted that the weighting coefficients An in the MSRSS method are the same as those described in Section 3.2. For comparison purposes, the RSA that consider the CSRSS method are also conducted to obtain the shear demands of the building stories. Note that the modal parameters used in the CSRSS are in accordance with the parameters used in the MSRSS. The shear force demands of the three demonstration buildings under typical ground motion are presented in Figure 13. It can be clear noted that the MSRSS provides a relatively more adequate prediction of the shear force demands.
Additionally, the results from the two methods are substituted into Equation (19), and thus, the deviation of the results from the two RSA methods and the RHA method can be obtained, as presented in Table 2. The results clearly indicate that, the MSRSS mode superposition could achieve an improved estimation of the shear force demands on the steel building frames compared with that of the CSRSS mode superposition. The Error values from the MSRSS for 6F, 13F, and 13F-W are 8.38%, 11.49%, and 11.93%, which from the CSRSS are 9.68%, 13.86%, and 15.05%, respectively.
To make the improvement of the IRSA clear, the factor logarithmic Error ratio (LER) is defined as Equation (20). This factor represents the accuracy of using a certain method to estimate the elastic shear demands compared using IRSA with an MSRSS superposition. As defined, the LER value of 0 suggests that the Error from a certain method is equal to the Error from the IRSA with MSRSS superposition. A higher LER value corresponds to a larger Error compared with that from the MSRSS superposition.
L E R = log ( E r r o r E r r o r MSRSS )
Figure 14 presents the LER of the ELF and CSRSS for 6F, 13F, and 13F-W under each earthquake ground motion. The results reveal that the Errors of the MSRSS are smaller than those of the ELF and CSRSS in most of the cases.
Based on the data shown in Figure 14, a normal distribution is considered to be appropriate for LER (H0). The parameters and the K-S test results for the normal distribution of all four datasets are presented in Table 3. The goodness-of-fit tests are conducted at different significance levels (shown in Figure 15). If DDlimit, the null hypothesis (H0) is accepted. As presented in Table 3 and Figure 15, the distributions pass the K-S goodness-of-fit tests in all of the cases. The mean values for the four cases presented in Table 3 clearly indicate that the Errors from the MSRSS are much smaller than those from the ELF and CSRSS.

5. Concluding Remarks

This paper proposes that the conventional response spectrum analysis method may lead to inadequately designed shear forces for steel building frames, and it develops an alternative response spectrum analysis method for the elastic shear force demand estimation of shear-dominated steel building frames in the preliminary design stage. Following the proposed procedure, the shear force demands along the building’s height can be captured more precisely. RHA are performed for comparing the improvements of the proposed design approaches. Based on the analyses conducted in this research, the following major conclusions can be made:
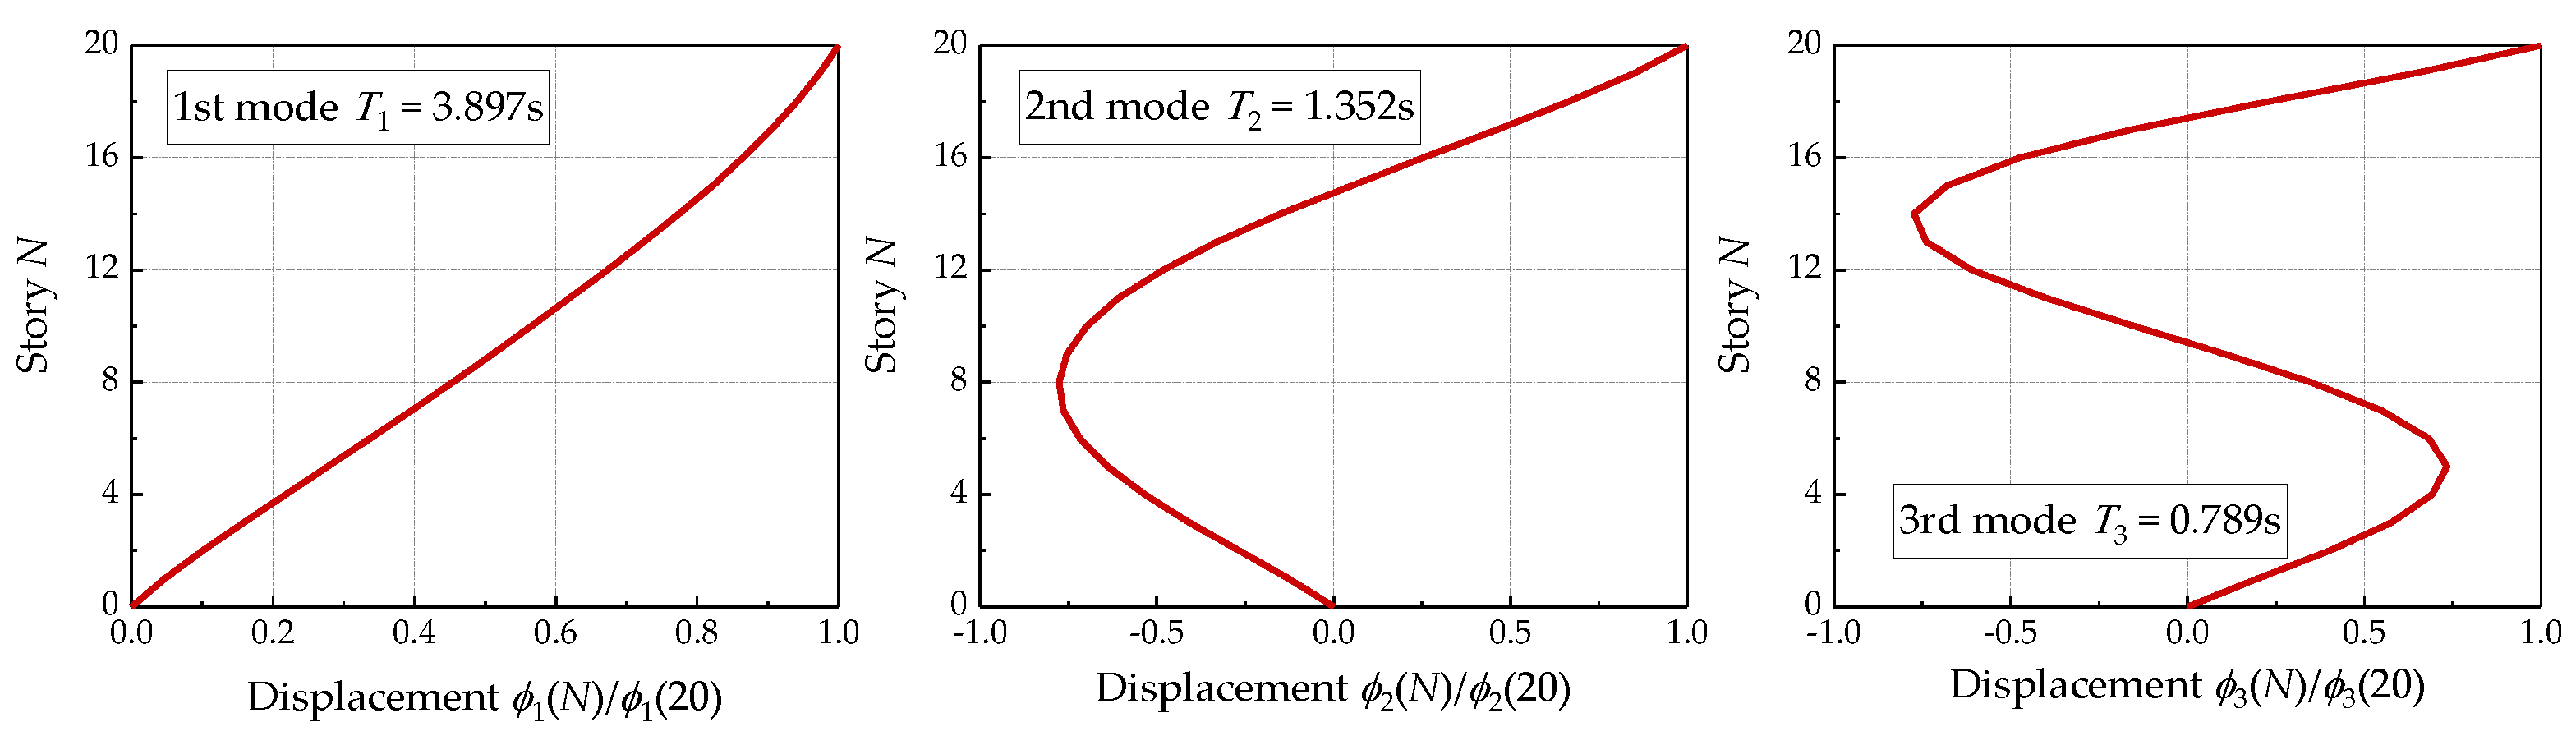
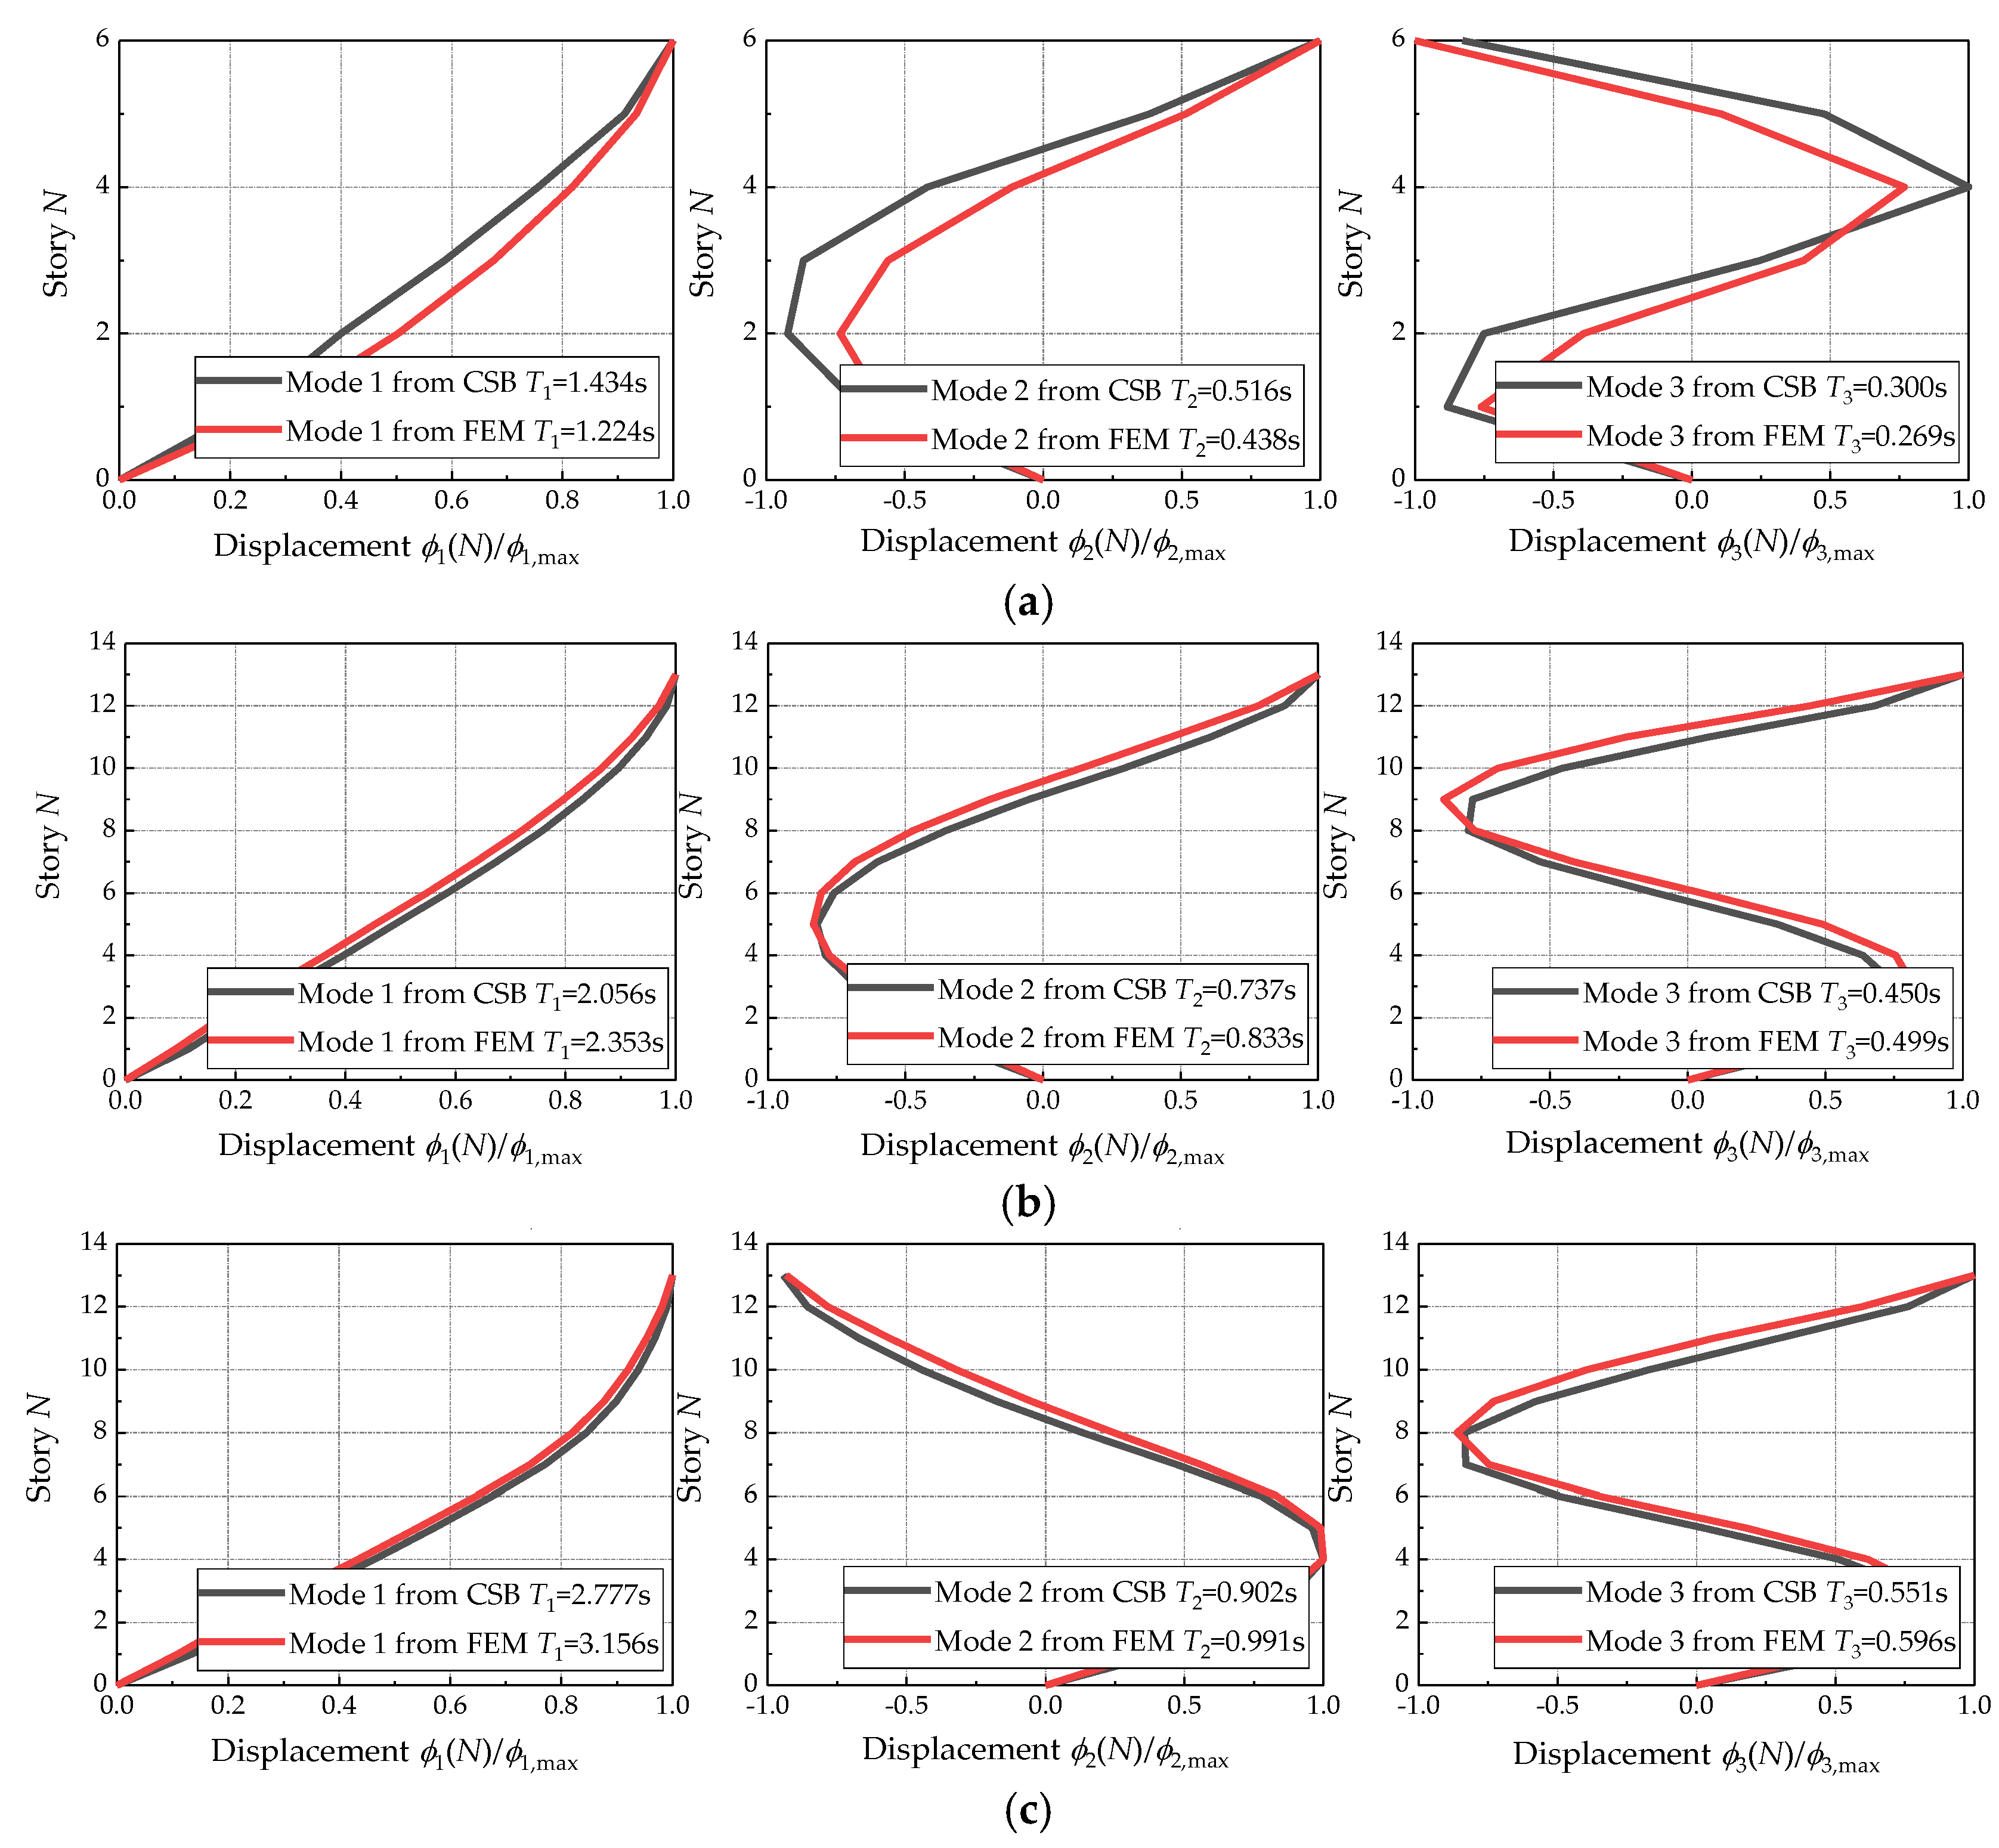
  • The continuous shear beam model with a stepped stiffness could achieve a precise estimation of the dynamic parameters. Following the proposed procedure, the modal periods and modal shapes can be easily and accurately captured without conducting an eigenvalue analysis using numerical software.
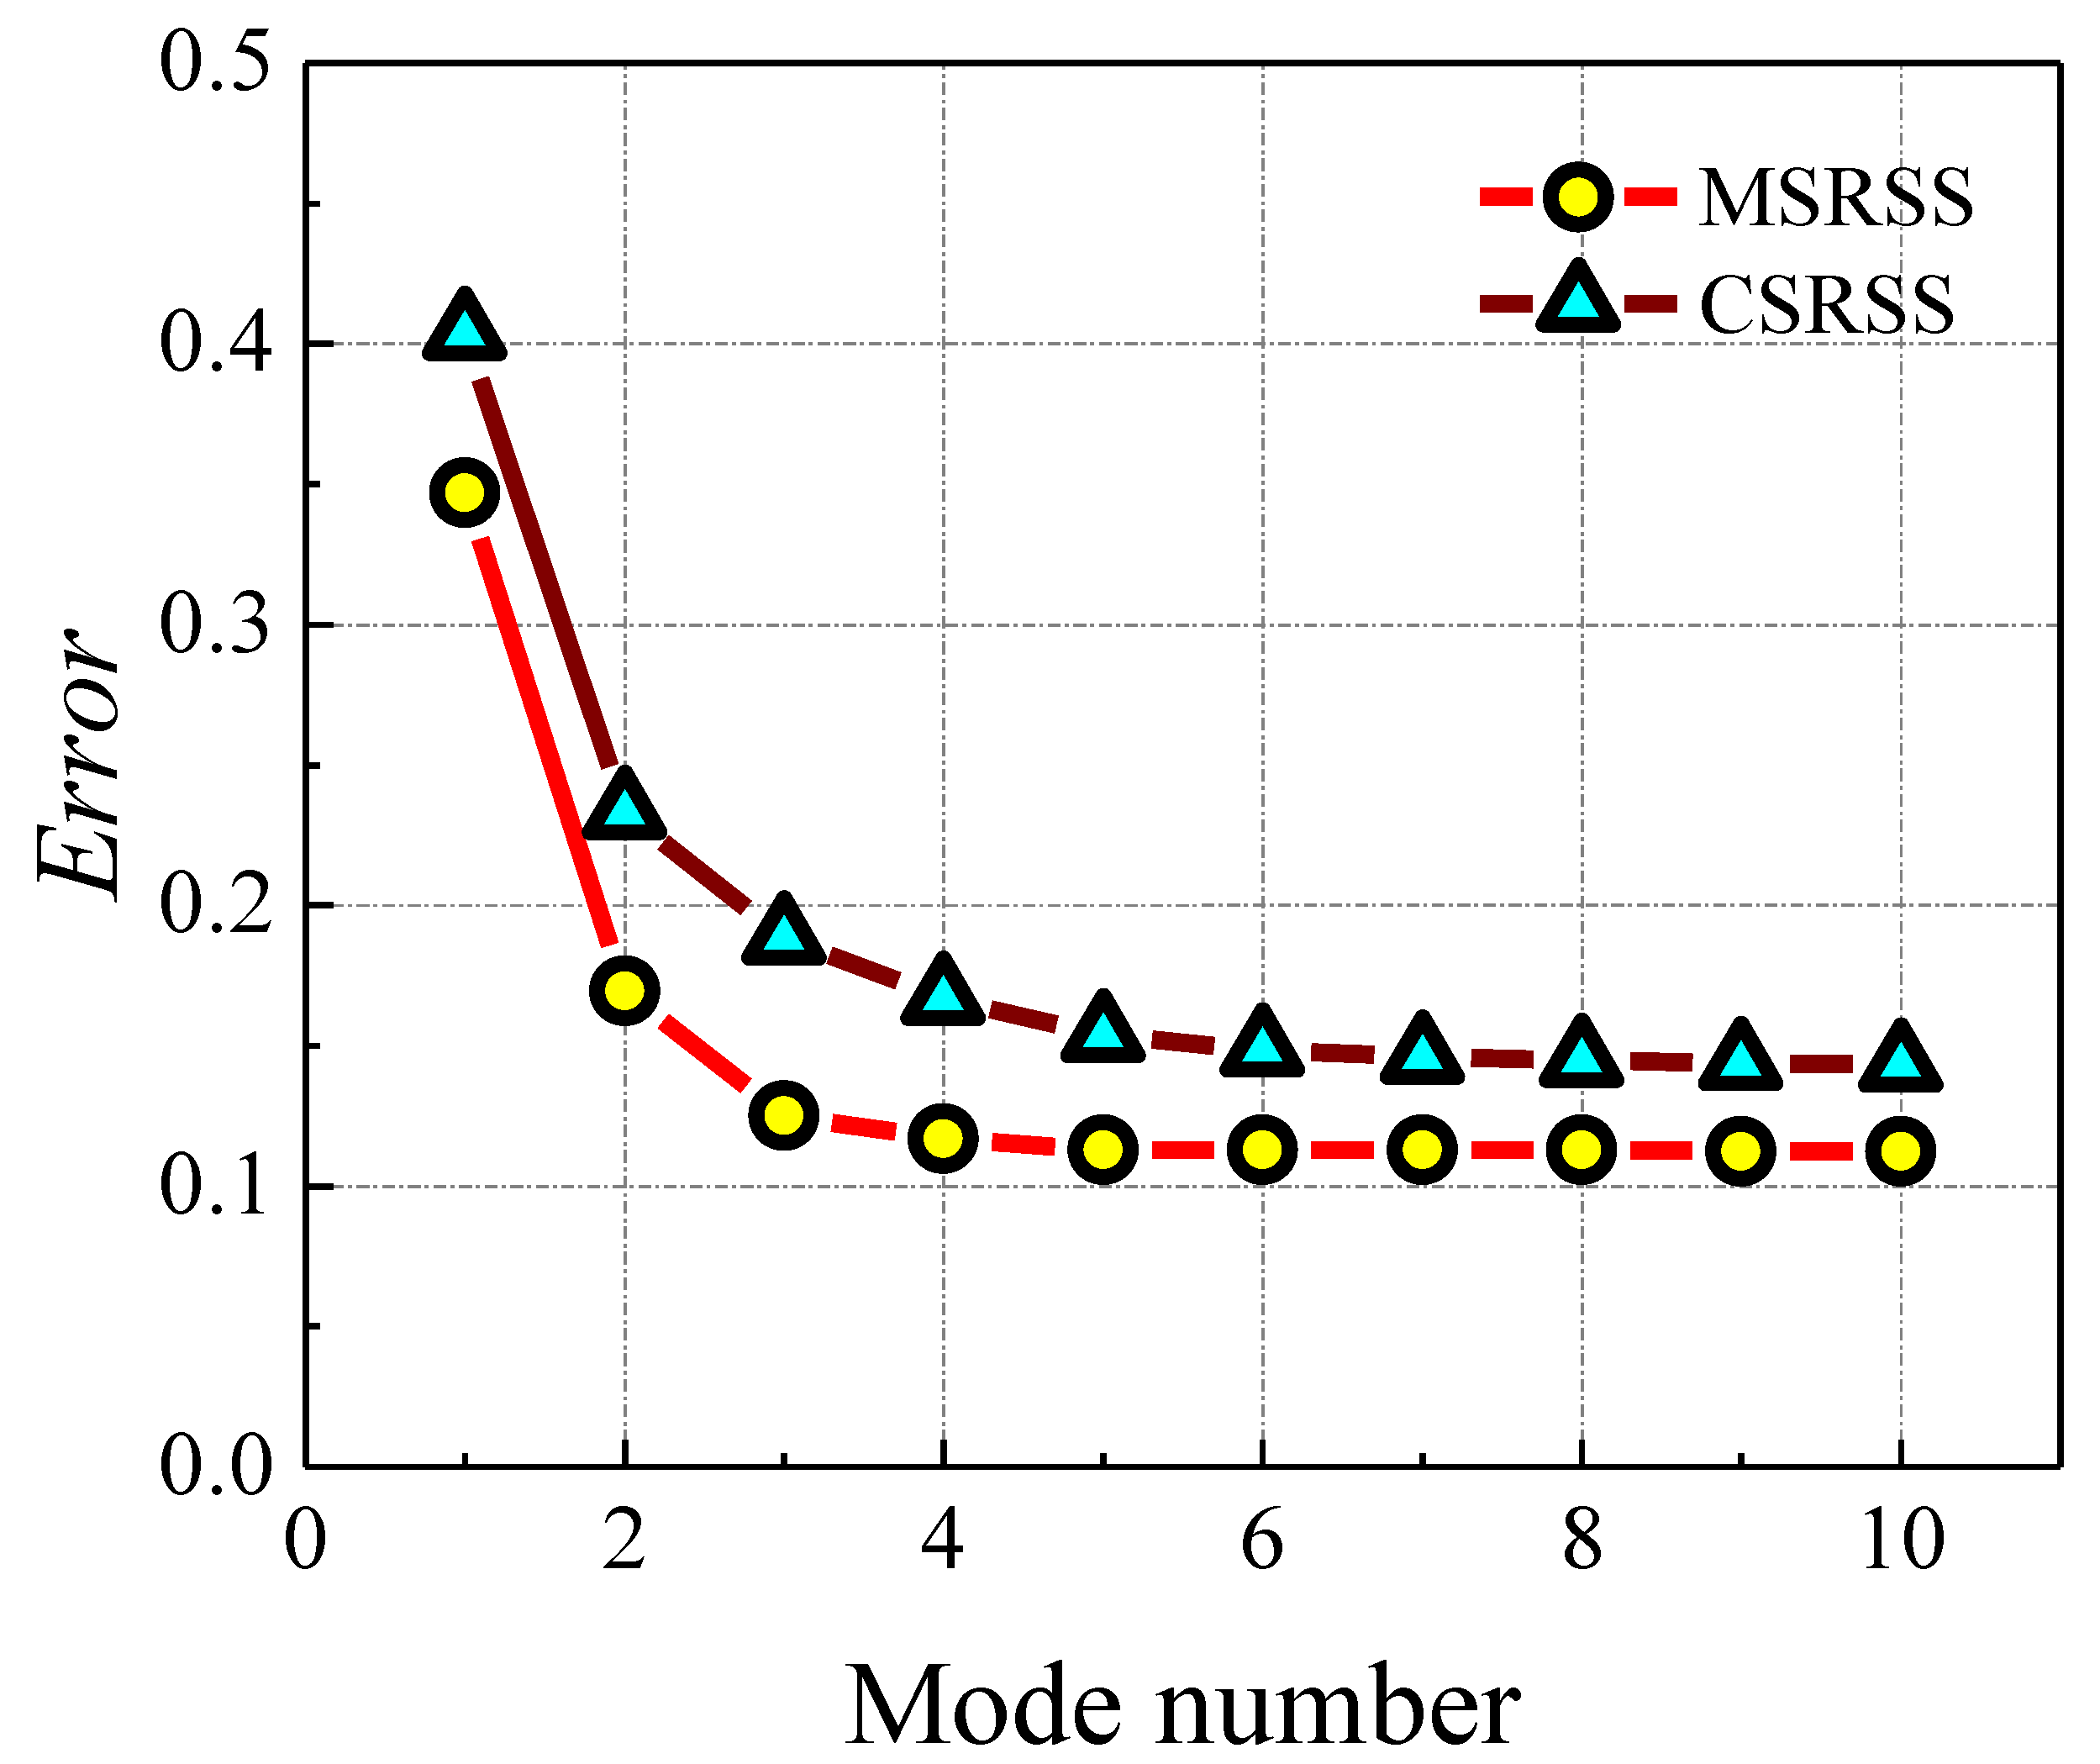
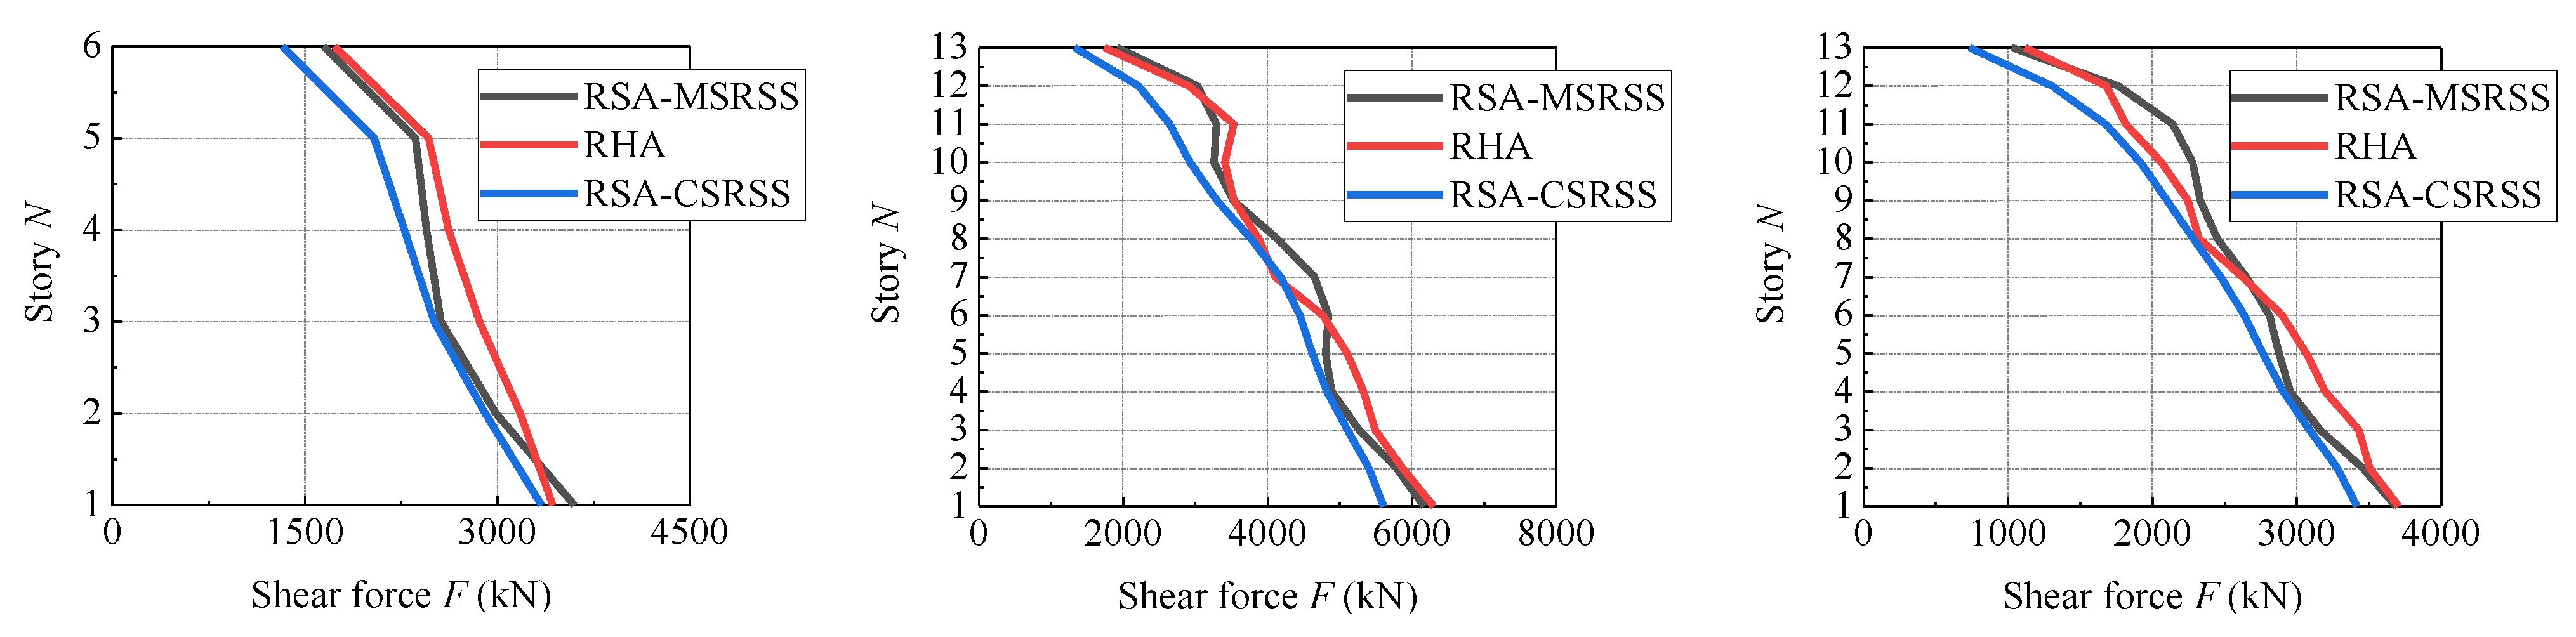
  • The conventional response spectrum analysis method, which uses limited modes in the SRSS method will underestimate the shear demands of a steel building frame. Moreover, the underestimation of the shear demands on the top of the considered system is more significant.
  • It was found that adjusting the weighting coefficient for each modal shear demand could improve the adequacy of the RSA method in determining the elastic shear force in the steel building frames. The optimal weighting coefficient set derived from the genetic algorithm validates the fact that adding a weighting coefficient that is greater than 1.0 to high modal shear items could result in the better estimation of shear force demands. Moreover, using the first three modal shear demands to conduct mode superposition can achieve a satisfactory estimation, and so, more modes are not necessary.
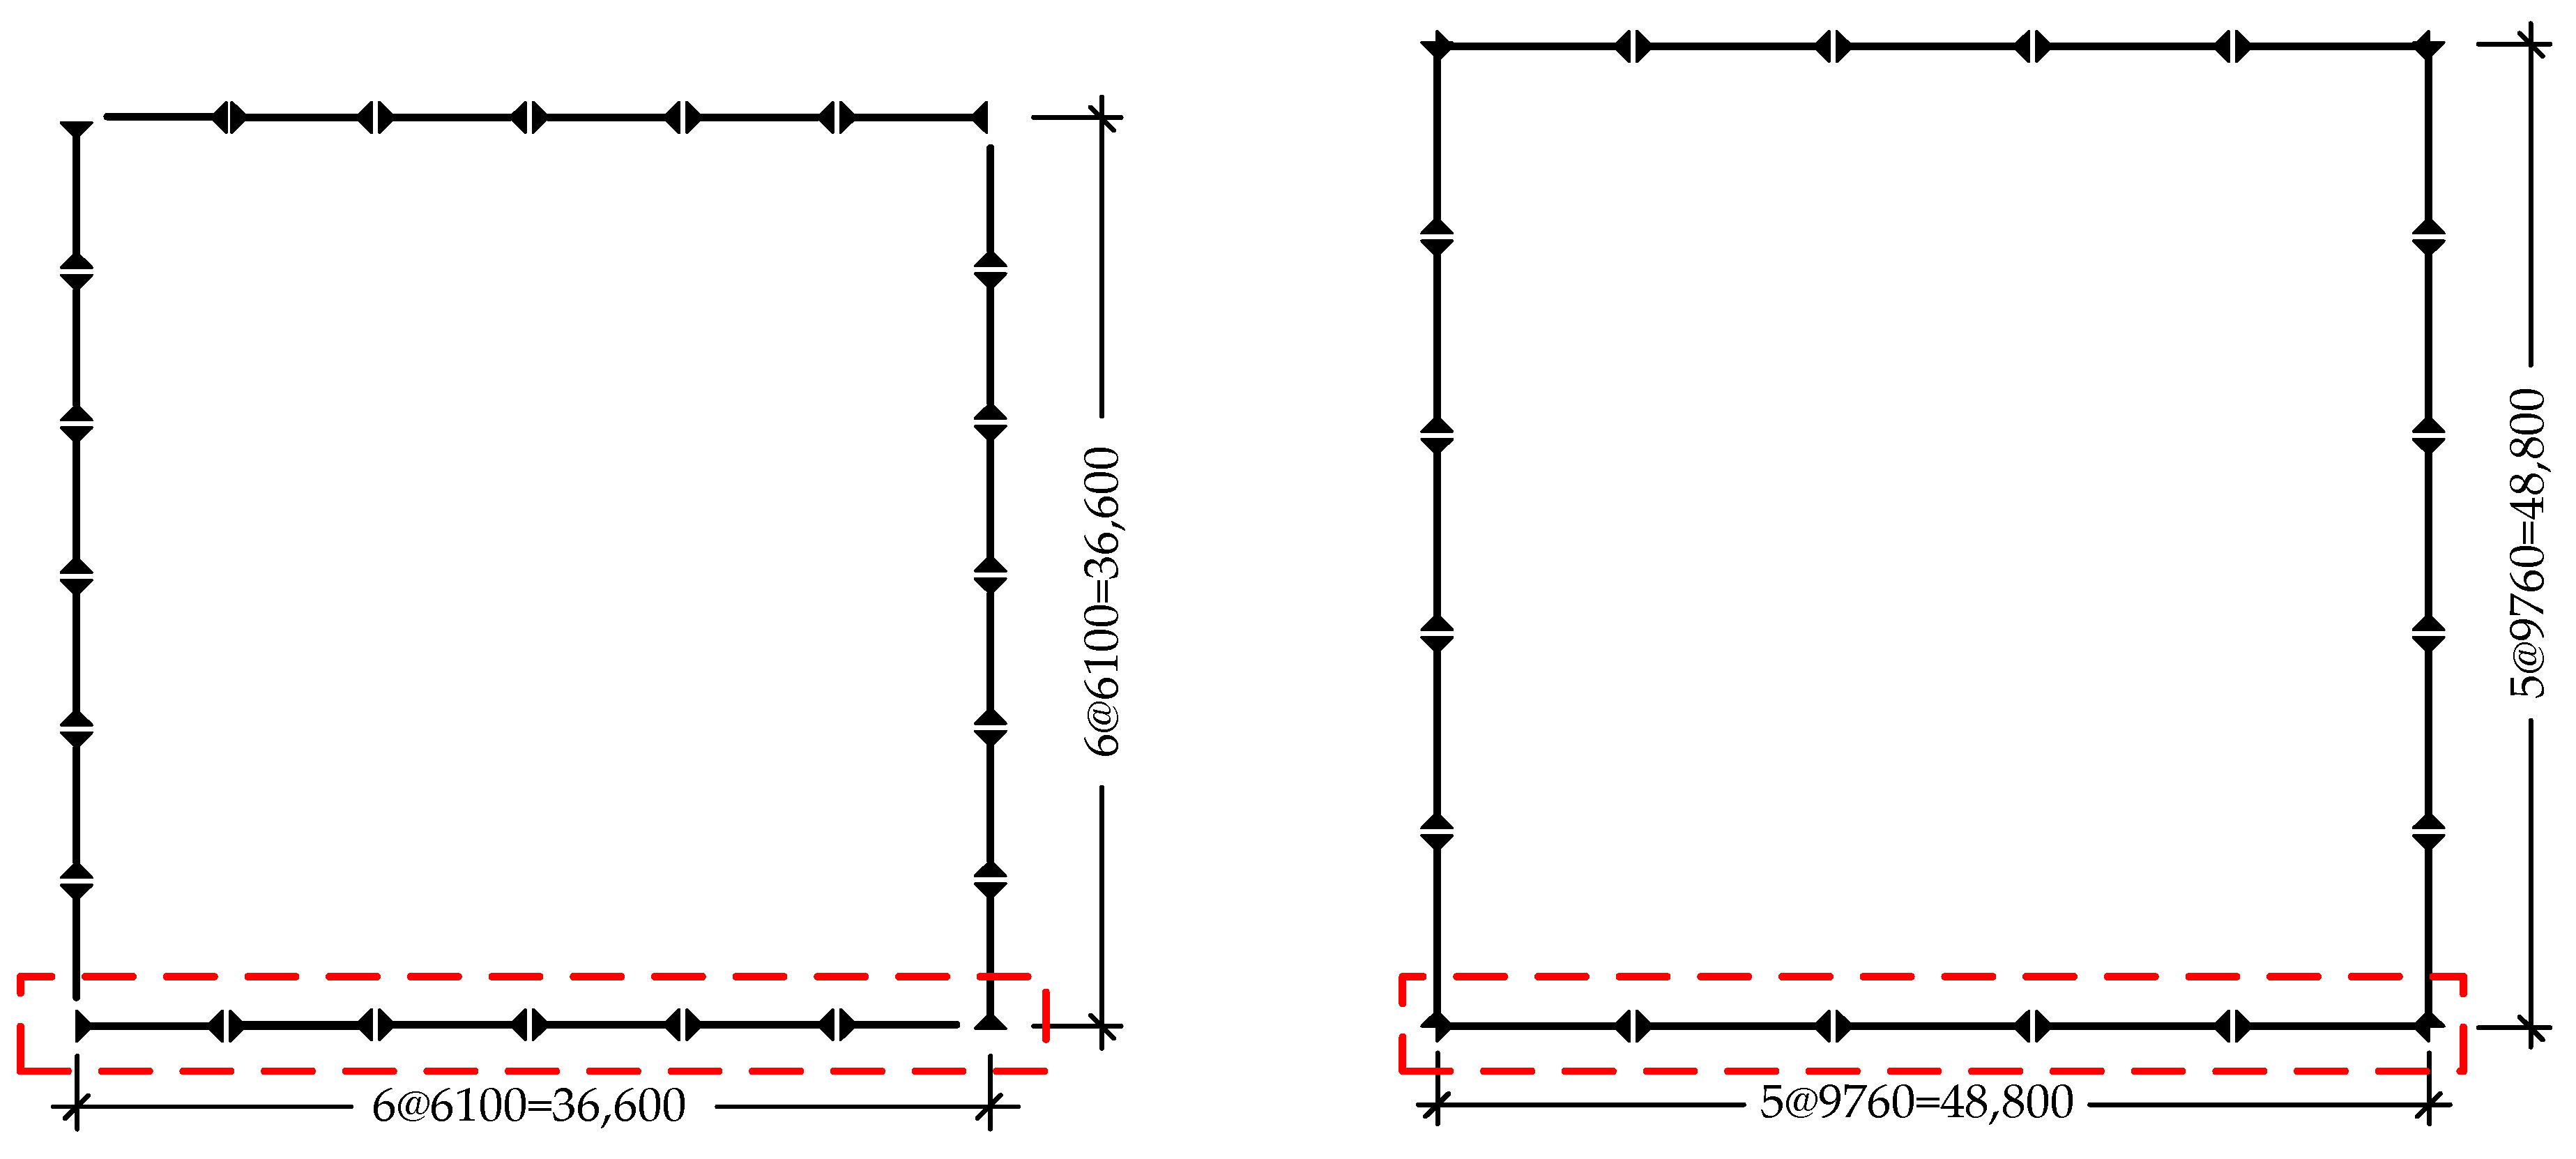
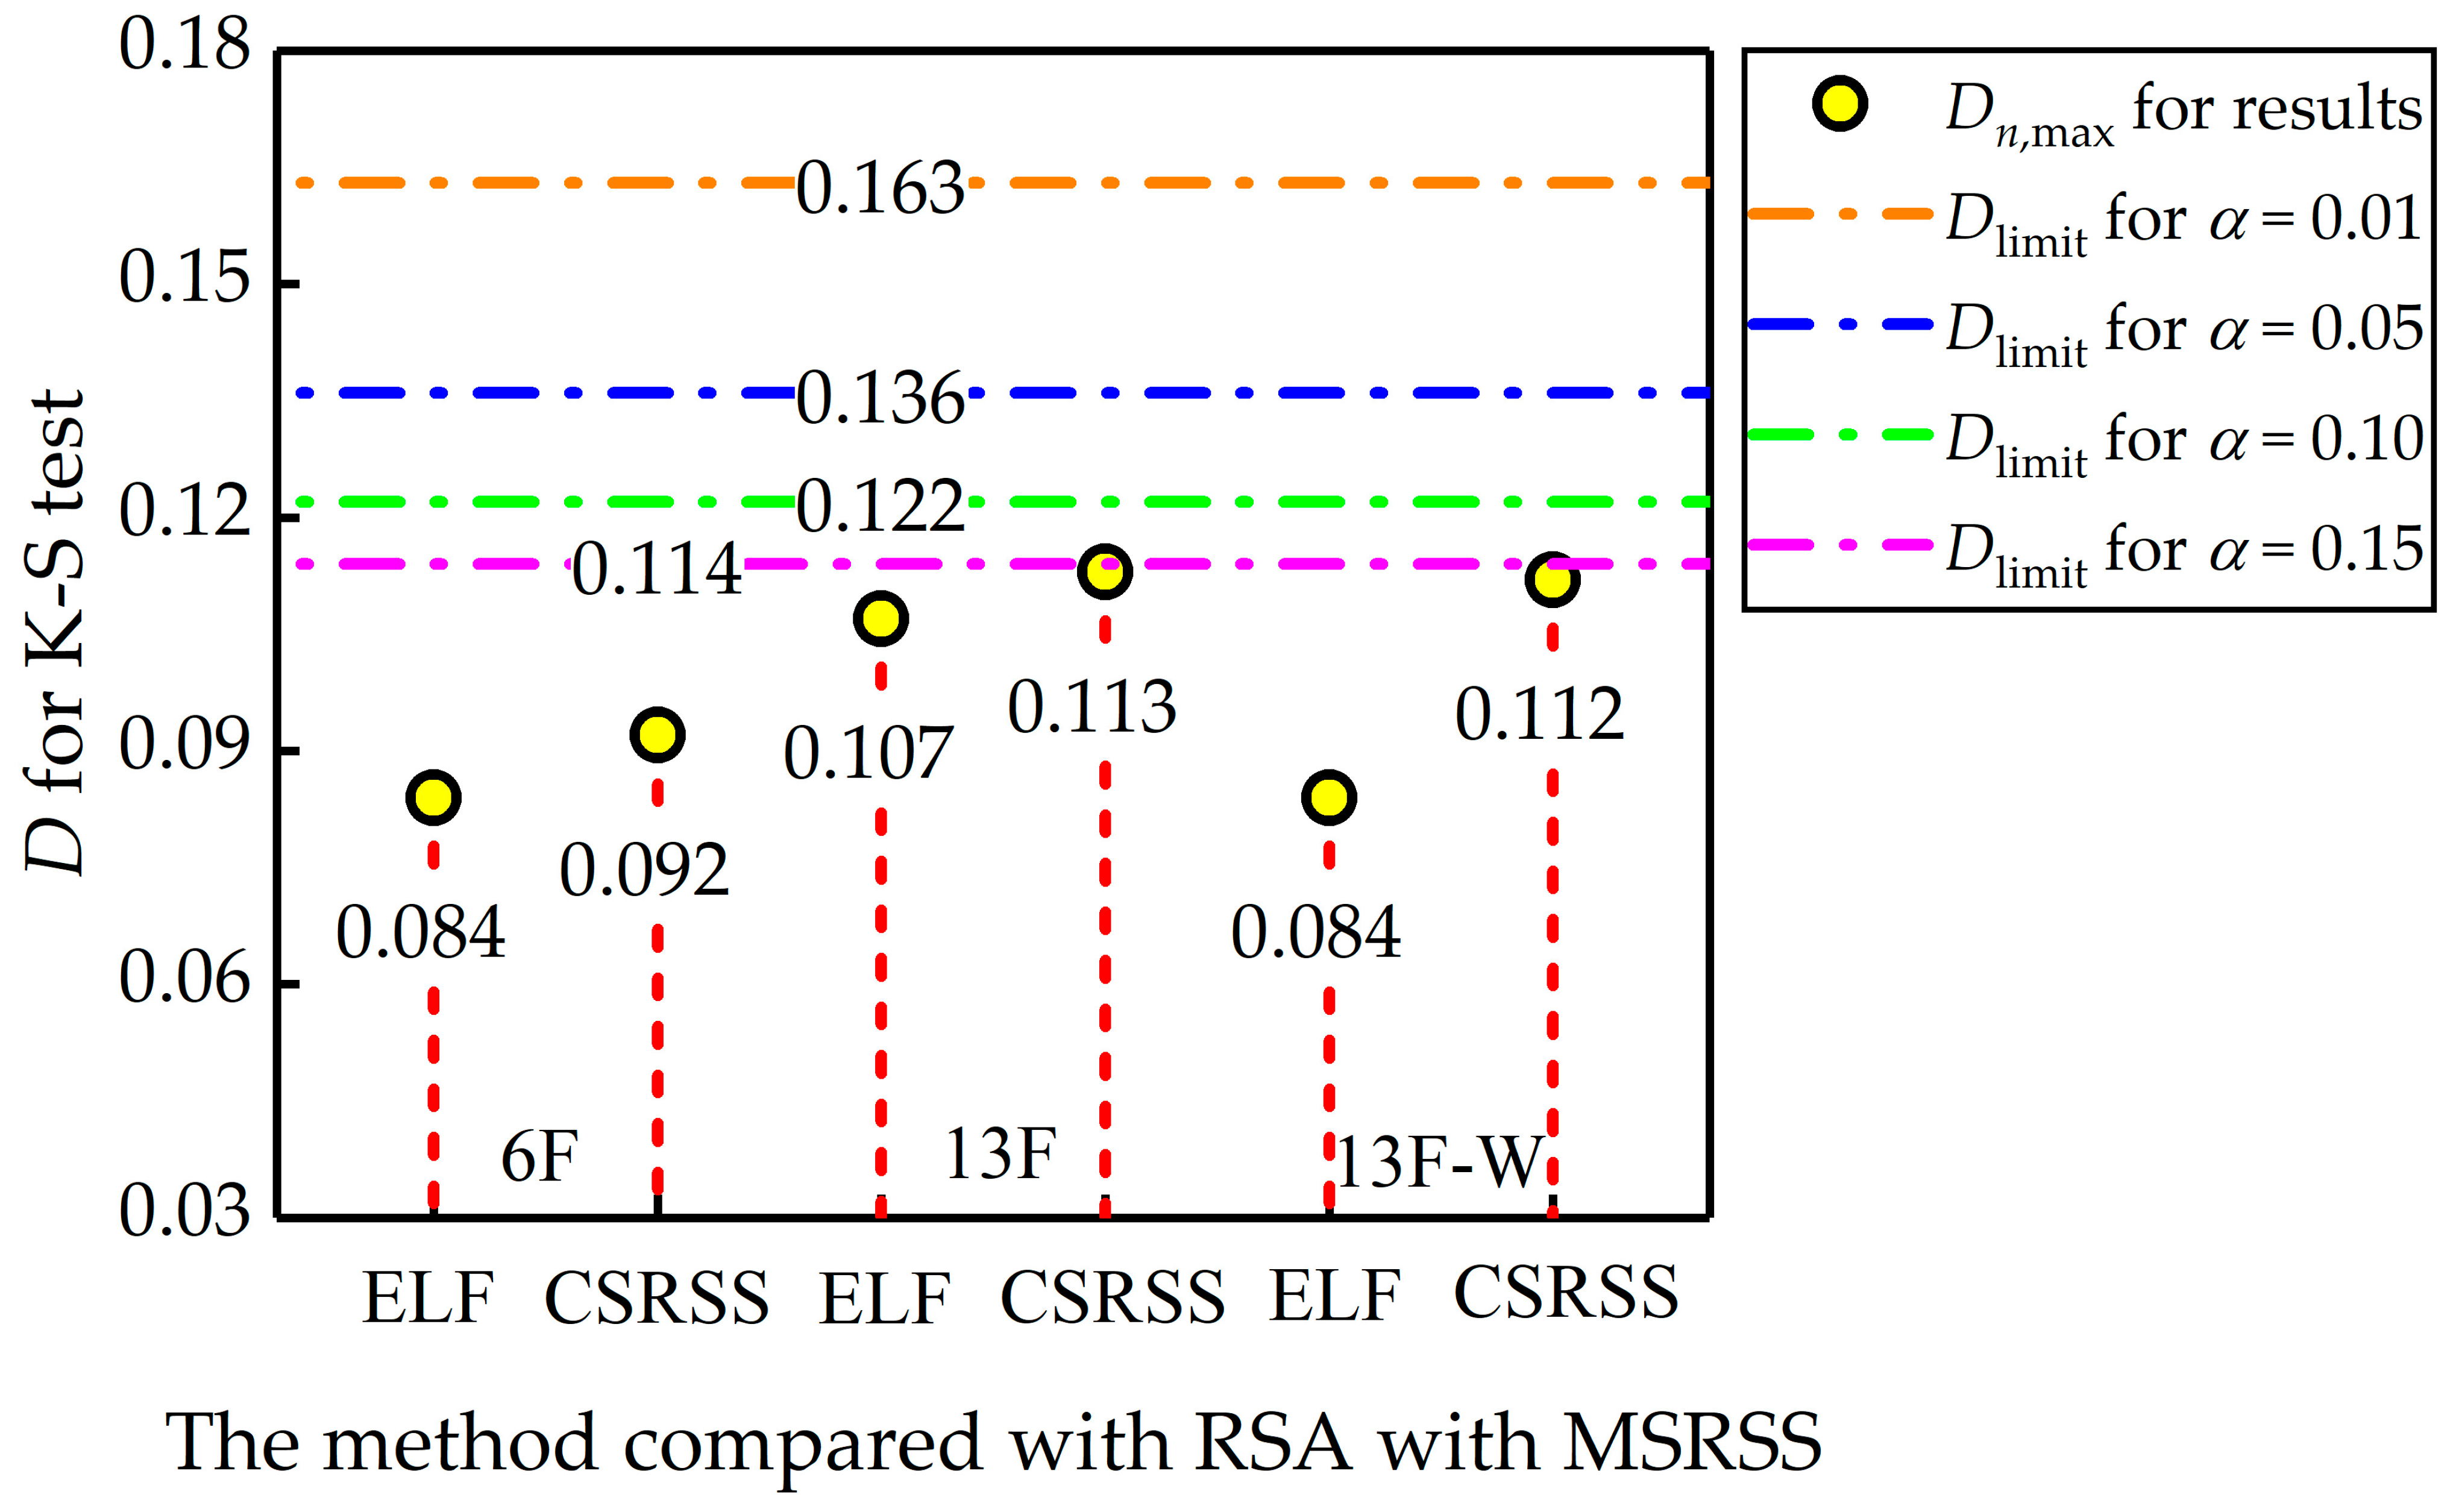
  • The proposed IRSA are performed on two demonstration building frames. Results validate the superiority of the proposed method and the adequacy of the proposed weighting coefficients.
  • This study is conducted mainly on a regular building frame model in two dimensions. The cross-correlation between the modal responses is minor and negligible in this study. Thus, the application scope is limited. Much more irregular scenarios should be included to explore the method to improve the adequacy of conventional RSA. Moreover, since the cross-correlation between the modal responses of a structure in three dimensions is significant, the relevant research based on CQC is also promising.

Author Contributions

Conceptualization, J.L. and W.W.; methodology, J.L. and W.W.; software, J.L.; validation, J.L.; formal analysis, J.L.; investigation, J.L.; resources, W.W.; data curation, J.L.; writing—original draft preparation, J.L.; writing—review and editing, W.W.; visualization, J.L.; supervision, W.W.; project administration, W.W.; funding acquisition, W.W. All authors have read and agreed to the published version of the manuscript.

Funding

The financial supports from the National Natural Science Foundation of China (NSFC) with Grant Nos. 52078366, 51820105013 and National Key Research and Development Program of 14th Five-Year Plan of China with Grant No. 2022YFC3801904 are gratefully acknowledged. This study is also supported by the Top Discipline Plan of Shanghai Universities-Class I with Grant No. 2022-3-YB-18.

Data Availability Statement

Not applicable.

Conflicts of Interest

The authors declare no conflict of interest.

References

  1. Chopra, A.K. Dynamics of Structures: Theory and Applications to Earthquake Engineering, 4th ed.; Prentice Hall: Upper Saddle River, NJ, USA, 2012; pp. 562–595. [Google Scholar]
  2. ASCE. Minimum Design Loads for Buildings and Other Structures; American Society of Civil Engineers: Reston, VA, USA; Structural Engineering Institute: Weston, FL, USA, 2016. [Google Scholar]
  3. Rosenblueth, E. A Basis for Aseismic Design. Ph.D. Thesis, University of Illinois, Urbana, IL, USA, 1951. [Google Scholar]
  4. GB 50011-2010; Code for Seismic Design of Buildings. Ministry of Housing and Urban-Rural Development of the People’s Republic of China (MHURD-PRC): Beijing, China, 2010. (In Chinese)
  5. Newmark, N.M.; Rosenblueth, E. Fundamentals of Earthquake Engineering, 1st ed.; Prentice Hall: Englewood Cliffs, NJ, USA, 1971. [Google Scholar]
  6. Khy, K.; Chintanapakdee, C.; Warnitchai, P.; Wijeyewickrema, A.C. Modified Response Spectrum Analysis to Compute Shear Force in Tall RC Shear Wall Buildings. Eng. Struct. 2019, 180, 295–309. [Google Scholar] [CrossRef]
  7. Sullivan, T.J.; Priestley, M.J.N.; Calvi, G.M. Estimating the Higher-Mode Response of Ductile Structures. J. Earthq. Eng. 2008, 12, 456–472. [Google Scholar] [CrossRef]
  8. Pennucci, D.; Sullivan, T.J.; Calvi, G.M. Inelastic Higher-Mode Response in Reinforced Concrete Wall Structures. Earthq. Spec. 2015, 31, 1493–1514. [Google Scholar] [CrossRef]
  9. Hu, S.; Wang, W. Self-Centering Energy-Absorbing Rocking Core System with Friction Spring Damper: Experiments, Modeling and Design. Eng. Struct. 2020, 225, 111338. [Google Scholar] [CrossRef]
  10. Ke, K.; Chen, Y.; Zhou, X.; Yam, M.C.H. Experimental and Numerical Study of a Brace-Type Hybrid Damper with Steel Slit Plates Enhanced by Friction Mechanism. Thin Wall Struct. 2023, 182, 110249. [Google Scholar] [CrossRef]
  11. Timoshenko, S.P. On the correction for shear of the differential equation for transverse vibrations of prismatic bars. Philos. Mag. 1921, 41, 744–746. [Google Scholar] [CrossRef] [Green Version]
  12. Andrés, A.R.; Miranda, E. Assessment of Effects of Reductions of Lateral Stiffness along Height on Buildings Modeled as Elastic Cantilever Shear Beams. J. Earth. Eng. 2016, 22, 553–568. [Google Scholar]
  13. Ohtori, Y.; Christenson, R.E.; Spencer, B.F. Benchmark Control Problems for Seismically Excited Nonlinear Buildings. J. Struct. Eng. 2005, 130, 366–385. [Google Scholar] [CrossRef] [Green Version]
  14. Mazzoni, S.; McKenna, F.; Scott, M.H.; Fenves, G.L. OpenSees Command Language Manual. Pac. Earthq. Eng. Res. (PEER) Cent. 2006, 264, 137–158. [Google Scholar]
  15. Somerville, P.; Smith, N.; Punyamurthula, S.; Sun, J. Development of Ground Motion Time Histories for Phase 2 of the FEMA/SAC Steel Project; SAC Background Document; Report submitted to the Report SAC/DB-97/04; SAC Joint Venture: Sacramento, CA, USA, 1997. [Google Scholar]
  16. ICBO. Uniform Building Code; International Conference of Building Official: Wittie, CA, USA, 1973. [Google Scholar]
  17. Kunnath, S.K.; Nghiem, Q.; El-Tawil, S. Modeling and Response Prediction in Performance-Based Seismic Evaluation: Case Studies of Instrumented Steel Moment-Frame Buildings. Earthq. Spec. 2004, 20, 883–915. [Google Scholar] [CrossRef]
  18. FEMA-695; Quantification of Building Seismic Performance Factors. Federal Emergency Management Agency: Washington, DC, USA, 2009.
Figure 1. Illustration of the stiffness distribution along building height.
Buildings 13 00258 g001
Figure 2. Illustration of the boundary conditions.
Buildings 13 00258 g002
Figure 3. Validation of CSB model. (a) Stiffness distribution. (b) Comparisons for the first three modal shapes.
Buildings 13 00258 g003
Figure 4. The influence of the number of degrees of freedom.
Buildings 13 00258 g004
Figure 5. Floor and elevation of the demonstration frame.
Buildings 13 00258 g005
Figure 6. The modal information of the considered benchmark frame.
Buildings 13 00258 g006
Figure 7. Shear force demands of the considered benchmark frame from the ELF, RSA, and RHA.
Buildings 13 00258 g007
Figure 8. Resulting Error of optimal process using a different number of modes.
Buildings 13 00258 g008
Figure 9. Design procedure of IRSA.
Buildings 13 00258 g009
Figure 10. Floor plan of the 6F and 13F buildings.
Buildings 13 00258 g010
Figure 11. Elevation of the 6F and 13F buildings.
Buildings 13 00258 g011
Figure 12. Comparison of dynamic features. (a) Comparison of dynamic features for 6F. (b) Comparison of dynamic features for 13F. (c) Comparison of dynamic features for 13F-W.
Buildings 13 00258 g012
Figure 13. Shear force demands of the two demonstration buildings under typical ground motion.
Buildings 13 00258 g013
Figure 14. Error comparison between RSA-MSRSS with ELF and RSA-CSRSS.
Buildings 13 00258 g014
Figure 15. Results for K-S test for logarithmic Error ratio between RSA-MSRSS and other methods.
Buildings 13 00258 g015
Table 1. Weighting coefficients An for the first three modes.
Weighting CoefficientsValue
A11.000
A21.276
A31.663
Table 2. Deviation of the results between RSA and RHA.
Mode SuperpositionError (%)
6F13F13F-W
MSRSS8.3811.4911.93
CSRSS9.6813.8615.05
Rate of improvement13.417.120.7
Table 3. Distribution parameters and K-S test results for normal distribution.
6F13F13F-W
ELFCSRSSELFCSRSSELFCSRSS
Mean0.4640.0660.4470.0830.4030.094
SD0.3000.2000.3070.2430.2920.254
Dlimit-0.010.163
Dlimit-0.150.114
D0.0840.0920.1070.1130.0840.112
H0AAAAAA
Disclaimer/Publisher’s Note: The statements, opinions and data contained in all publications are solely those of the individual author(s) and contributor(s) and not of MDPI and/or the editor(s). MDPI and/or the editor(s) disclaim responsibility for any injury to people or property resulting from any ideas, methods, instructions or products referred to in the content.

