Abstract
Leadership in Energy and Environmental Design for New Construction and Renovation (LEED-NC), version 3 (v3)-certified projects include at least 13 different space types. However, the impact of space types on LEED certification strategies is not yet fully understood. This study assessed the impact of different building types on achieving LEED-NC v3 categories and credits in gold-certified projects in Poland. The exact Wilcoxon–Mann–Whitney test and Fisher’s exact 2 × 2 with Lancaster’s correction test were used to estimate the difference between four space types (i.e., through pairwise comparison) with small sample sizes (n): industrial manufacturing space (IMS) (n = 9), office space (OS) (n = 7), multi-family residential space (MRS) (n = 6), and lodging space (LS) (n = 8). With these sample sizes, meaningful conclusions could be drawn with these tests. Design structure: IMS and OS refer to two subgroups nested in the production group, while MRS and LS refer to two other subgroups nested in the live group. This design structure was used to perform the logical analysis. The results showed that the number of significant differences (p ≤ 0.05) (i) between two subgroups (IMS vs. OS) within the production group was 1 out of 46, and (ii) between two subgroups (MRS vs. LS) within the living group was 6 out of 46, while (iii) the difference between the production and living groups was 45 out of 184. When comparing the production and living groups, LEED indoor environmental quality credit achievements showed the largest contribution (37%) to the number of significant differences. The practical implication of the study is to offer recommendations on LEED certification strategies for production and living spaces.
1. Introduction
In 1987, Brundtland [1], in his report “Our Common Future”, defined the concept of sustainable development as “…the ability to make development sustainable to ensure that it meets the needs of the present without compromising the ability of future generations to meet their own needs”. However, current global challenges related to population growth, rapid urbanization, climate change, and resource depletion pose a clear threat to future generations. It is predicted that the global population could increase to 8.5 billion in 2030, 9.7 billion in 2050, and 10.4 billion in 2100 [2]. In 2007, more than half the population lived in cities, and this number will continue to grow, being predicted to reach 60% by 2030 [3]. As a result of population growth and increasing urbanization, the use of mineral resources and fossil fuels will continue to increase [4]. Given the depletion of natural resources needed for our economic development and the burning of fossil fuels for our energy production needs, environmental degradation and global warming are common concerns. It is predicted that the average global temperature could rise by 2.2 °C by 2050. [5].
The construction sector is one of the main consumers of natural resources, producing waste and harmful emissions in large quantities [6]. The building sector consumes more than 30% of the world’s energy production, half of which is used to heat and cool buildings [7]. Construction-related energy consumption accounts for 50% of global greenhouse gas emissions [8]. Therefore, the construction sector has a responsibility to preserve the environment as much as possible for future generations. One of the practical ways to implement the “concept of sustainable development” in the construction sector is the active development of Green Building Rating Systems (GBRSs).
2. Literature Review
2.1. Green Building Rating Systems: A Brief History
The first GBRS, BREEAM (Building Research Establishment Environmental Assessment Method), was launched in the United Kingdom in 1990. In 1998, the GBRS LEED (Leadership in Energy and Environmental Design) system was launched in the USA. Because each country has a specific climate, natural resource availability, environmental problems, construction technologies, construction market requirements, and demographic and cultural characteristics, by 2019 there were as many as 49 green building systems in the world [9]. However, the LEED system is one of the most widely used [10,11]. In the present literature review, the author focused on analyzing the structure of the LEED system and its certification strategy.
2.2. LEED Structure
The LEED system has more than 30 subsystems designed to certify various types of buildings, for example, commercial interiors (LEED-CI), core and shell (LEED-CS), existing buildings: operations and maintenance (LEED-EB), neighborhood development (LEED-ND), and new construction and major renovations (LEED-NC). Among all the available subsystems, LEED-NC is one of the most popular [12]. The LEED system has been constantly improved from version to version: LEED-NC v2.0 (2000), LEED-NC v2.1 (2002), LEED-NC v2.2 (2005), LEED-NC v3 (2009), and LEED-NC v4 (2013) [13]. Specifically, LEED-NC v3 (the focus of this study) evaluates seven categories: sustainable sites (SS), water efficiency (WE), energy and atmosphere (EA), materials and resources (MR), indoor environmental quality (EQ), innovation in design (ID), and regional priority (RP). Each category includes the number of appropriate credits. Credits have requirements and corresponding accrued points. The total number of LEED points is 110. Depending on the total number of LEED points earned, projects can be certified as certified (40–49 points), silver (50–59 points), gold (60–79 points), or platinum (80+ points). In addition, Wu et al. [11] showed that the LEED-NC v3 2009 subsystem contains at least 13 space types, e.g., office, industrial manufacturing, multi-family residential, lodging, and so on.
2.3. LEED Certification Strategy
The LEED certification strategy was studied under the following conditions: LEED-certified projects were selected based on the same country/city/borough, the same rating subsystem (e.g., LEED-NC), the same rating version (e.g., v3), the same certification level (e.g., gold), and the same project space type (e.g., office). In addition, it was also possible to compare different space types (e.g., industrial manufacturing space and office space) keeping the above conditions constant.
2.3.1. LEED Certification Strategies
To achieve a certain level of LEED certification, each project team must choose the appropriate certification strategy, taking into account all the characteristics of their country. Therefore, an analysis of LEED certification in different countries/states reveals different strategies.
For example, a comparative analysis of two pairs (Finland vs. Sweden and Turkey vs. Spain) of European countries showed significant differences in green certification strategies in LEED-NC v3 gold-certified projects. In particular, Sweden outperformed Finland in WEc1, water-efficient landscaping, while Finland outperformed Sweden in WEc3, reducing water use. In parallel, Spain outperformed Turkey in both WEc1 and WEc3 [14].
Studies [15,16] have shown that there are at least two different LEED certification strategies in different states of the United States. California outperformed Virginia in the EA category, and Virginia outperformed California in the MR category in an analysis of LEED-NC v3 gold-certified projects [15]. California outperformed Pennsylvania in the EA category, and Pennsylvania outperformed California in the MR category in an analysis of LEED-CI v3 gold-certified projects [16].
Ma and Cheng [17] noted that the choice of LEED certification strategy may depend on a combination of several factors, namely, the level of certification, local environmental policies, budgets and schedules, building owners, and the size and type of building. Therefore, standardizing the research design to examine LEED certification strategies is imperative.
Three recent studies examined the LEED certification strategies of one country, Germany [18]; one megacity, Shanghai, China [19]; and one borough, Manhattan, New York City, USA [20]. These studies [18,19,20] showed that there were at least two different LEED certification strategies in the same country. These strategies included a combination of high/low achievement in the EA category and low/high achievement in one of the other categories (SS, WE, MR, or EQ). However, the reason why different certification strategies are used in the same location has not been stated [18,19,20].
2.3.2. LEED-NC Certification Strategy for Different Space Type Buildings
To date, there are only two studies that have compared differences between space types in LEED-certified projects using significance tests [11,21]. These two studies found that there were significant differences in LEED category/credit achievements between different space types in LEED-NC-certified projects. Thus, the space type factor may influence the choice of certification strategy. This may result in different certification strategies existing in the same location. However, these studies used different methodological approaches [11,21].
2.4. LEED-NC Database for Different Space Type Buildings
A joint analysis of the U.S. Green Building Council (USGBC) [22] database and the Green Building Information Gateway (GBIG) [23] database showed that different countries have different preferences for space types in LEED-NC-certified projects. For example, in the USA, LEED-NC v3 gold-certified projects were preferred in office buildings, while in Bangladesh, LEED-NC v3 gold-certified projects were preferred in industrial manufacturing buildings [22,23].
Table 1 shows that a study of the USGBC and GBIG databases revealed that Poland contains a unique set of four different space types in LEED-NC v3 gold-certified projects.

Table 1.
LEED-NC v3/v4 project distribution among space types in Poland (accessed on 12 June 2023).
The uniqueness of the situation lies in the fact that all four types of buildings are located in one country (Poland). As a result, the design of this research will involve examining the impact of space types on LEED certification strategies while minimizing the impact of uncontrolled conditions [24]. LEED-NC v3 gold-certified projects in Poland include industrial manufacturing space (n = 9), office space (n = 8), multi-family residential space (n = 6), and lodging space (n = 7).
2.5. The Local Green Building Solutions System in Poland
Currently, along with LEED certification, Polish buildings are certified according to the Green Building Solutions (GBS) system, created in 2016 by the National Association for the Promotion of Sustainable Building (Poland) [25]. The system certifies existing and designed types of office, retail, and industrial buildings. However, GBS has a very limited number of certified buildings (http://greenbuildingstandard.eu/en/, accessed on 6 September 2023).
2.6. The Research Gap between the Literature and the Purpose of this Study
When Wu et al. [11] studied the differences between the two types of spaces, they presented the results only at the category level. When Pushkar [21] examined the differences between the two types of spaces, the author compared only one LEED credit. As a result, the impact of building space type on LEED-NC certification strategies at the credit level has not yet been studied. Consequently, the purpose of this study was to examine the impact of different types of spaces on the LEED-NC certification strategy in Poland. Therefore, the research gap between the literature analysis and the purpose of this study indicates that this study is relevant.
3. Materials and Methods
3.1. LEED Data Collection
The U.S. USGBC database contains scorecards for each country, address, rating system, rating version, and certification level, as well as certification data, but it does not include space type information for LEED-certified projects. However, the GBIG database contains space type information for LEED-certified projects. Therefore, both the USGBC and GBIG databases [22,23] were used to identify certified, silver, gold, and platinum LEED-NC v3/v4 projects in Poland. The following building variables were not relevant to this study: size range, age, and LEED certification data.
3.2. Measurement Scales
According to Stevens [26], there are four measurement scales: nominal, ordinal, interval, and ratio. LEED data are on three types of scale: dichotomous, ordinal, and discrete (interval). The dichotomous scale (i.e., the presence/absence of a LEED credit achievement) is a type of nominal scale. The ordinal scale (i.e., LEED credits with three achievement levels of 0, 1, 2) differs from the interval scale and ratio scale by not having category widths that represent equal increments of the underlying attribute [26]. The LEED discrete data showed a relatively small number of variables and tied data (i.e., “if you have 1, 2, 3, 3, 4 as the dataset then the two 3’s are tied data” [27]) in each LEED category/credit. Unlike the ordinal scale, the discrete scale always takes numerical values, where the distance between two points on the scale is standardized and equal [26].
3.3. Design of the Study
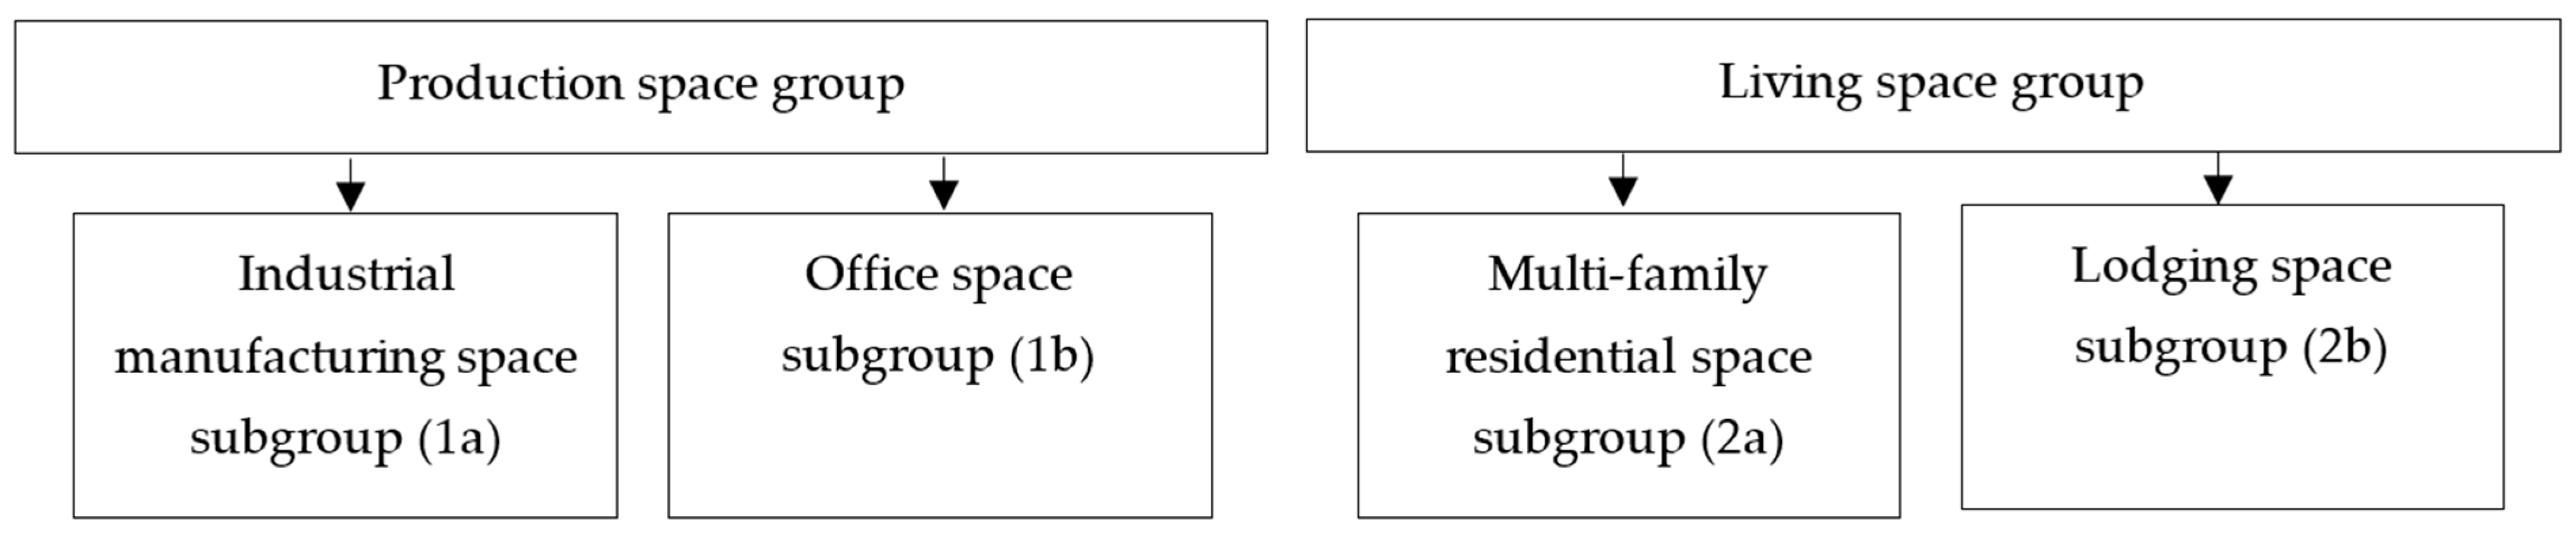
Figure 1 shows the four space types—industrial manufacturing space, office space, multi-family residential space, and lodging space—as four subgroups. These four subgroups can be nested into two groups: production space (industrial manufacturing space and office space) and living space (multi-family residential space and lodging space). This study design was chosen because of its ability to compare (i) buildings with different types of spaces and different building functions, and (ii) buildings with different types of spaces and similar building functions.
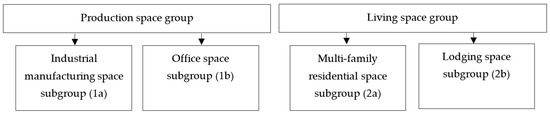
Figure 1.
Study design flowchart.
Industrial manufacturing and office buildings (i.e., the production space group) are designed as places where large numbers of workers/employees come to produce products/goods. These spaces must provide good air quality and thermal, lighting, and acoustic comfort. Therefore, these production space buildings may have similar certification strategies, focusing on the EQ category, for example.
Multi-family residential and lodging buildings (i.e., the living space group) are buildings where people live and can exist for 24 hours a day. These spaces should provide residents with thermal comfort at any time of the day. Thus, these living space buildings may have a similar certification strategy, focusing on the EA category, for example.
Given the above explanations, it was expected that comparisons between the production space group and the living space group would show more statistical differences than comparisons within each group (between the subgroups of industrial manufacturing and office spaces and between the subgroups of multi-family residential and lodging spaces).
3.4. Statistical Analysis
3.4.1. Single-Unit Design Structure
The term “single-unit design structure” was introduced by Hurlbert in 2013 [28]. In the context of the present study, a single-unit design structure, in which LEED-certified projects were defined at only one scale, was used to evaluate the difference between two unpaired groups.
3.4.2. Statistical Approach
LEED data are not normally distributed because non-parametric statistics are used instead of parametric statistics. Therefore, for descriptive statistics, instead of the mean, the median is used. For inferential statistics, instead of parametric significance tests, non-parametric significance tests are used.
3.4.3. The Percentage of Average Scores Analysis
The percentage of average scores (PAS)—the ratio of points obtained to the total points expressed as a percentage—was used to assess the absolute LEED-NC credit achievement [29].
Based on [29], PAS and the following formula were used to evaluate the performance of both categories and credits in LEED-NC v3 gold-certified projects in Poland:
PAS ≥ 50 was defined as high achievement in the LEED category/credit, while PAS < 50 was defined as low achievement in the LEED category/credit. PAS was used to describe high and low LEED certification strategies. However, this information is not enough for a full conclusion.
3.4.4. Inferential Statistics
For ordinal or discrete LEED data, the author used the exact non-parametric Wilcoxon–Mann–Whitney (WMW) test instead of Student’s t-test to compare two unpaired groups. For LEED dichotomous data, the author used Fisher’s exact test for a 2 × 2 contingency table instead of Pearson’s chi-square test when sample sizes were small. It is well-known that Fisher’s exact test for a 2 × 2 contingency table is very conservative [30]. However, the additional use of Lancaster’s correction dramatically reduces conservatism in Fisher’s exact test [30].
3.5. Sample Size Limitation
To obtain significant differences between two groups (p < 0.05), the minimum sample size (n) for two unpaired groups (n1 and n2) when the exact WMW test is used is n1 = n2 = 4 [31], and n1 = n2 = 3 when Fisher’s exact 2 × 2 test with a two-tailed Lancaster’s mid-p-value is used [30]. Based on studies by Mundry and Fisher [32] and Routledge [30], the author suggests that the sample size should be n1 > 5 and n2 > 5 to obtain a reliable p-value.
3.6. p-Value Interpretation
In the current study, the author used neo-Fisherian significance assessments (NFSAs) instead of the paleo-Fisherian and Neyman–Pearson paradigms [33]. Hurlbert and Lombardi [33] showed that fixing α, i.e., the level of significance (e.g., α = 0.05), and dichotomizing the scale of p-values, i.e., p ≤ α or p > α, are superfluous. Hurlbert and Lombardi [33] cited Fischer’s philosophical proposal that “no scientific worker has a fixed level of significance at which from year to year, and in all circumstances, he rejects (null) hypotheses; he rather gives his mind to each particular case in light of his evidence and ideas” [34]. In addition, Hurlbert and Lombardi [33] cited Altman [35], who noted that “It is ridiculous to interpret the results of a study differently according to whether the p-value obtained was, say, 0.055 or 0.045. These p-values should lead to very similar conclusions, not diametrically opposed ones”. Beninger et al. [36] also noted that the logic of Occam’s mechanical razor should not be used for the universal interpretation of a p-value. Additionally, Hurlbert and Lombardi [33] cited the recommendation of Gotelli and Ellison [37], noting that “in many cases, it may be more important to report the exact p-value and let the readers decide for themselves how important the results are”. Therefore, NFSAs include calculations of the extracted p-value, but there is no need to specify α.
Following Hurlbert and Lombardi [33], the p-values were evaluated according to three-valued logic; that is, either it seems to be positive (i.e., there is seemingly a difference between groups 1 and 2), it seems to be negative (i.e., there does not seem to be a difference between groups 1 and 2), or judgment is suspended (regarding the difference between groups 1 and 2). With small sample sizes (n = 6–9), low p-values (e.g., p < 0.05) are typically associated with large effect sizes (i.e., large substantive significance). Therefore, effect sizes were not assessed in the present study given the known expected outcome. The practical significance of statistical differences between groups is presented in Section 4. In the tables in the Section 4, the bold type indicates that the difference between the two groups seems to be positive: while the regular type indicates that the difference between the two groups seems to be negative.
4. Results and Discussion
Given the large volume of data and the results of the statistical analysis, a tabular presentation is preferable to a graphical one. Table A1 (Appendix A) shows the abbreviations and full names of the categories, credits, and space types for the LEED-NC v3 green rating system.
4.1. Production and Living Space Groups: Certification Strategies at the Category Level
Table 2 shows the medians, PASs, and p-values of six pairwise comparisons between four types of space for LEED-NC v3 categories.
Table 2.
Category achievements in LEED-NC v3 gold-certified projects in Poland.
Within the production space group (1a and 1b), SS, WE, EQ, ID, and RP showed the highest achievements (63 ≤ PAS ≤ 100), while EA and MR showed the lowest achievements (32 ≤ PAS ≤ 43). As a result, the difference between 1a and 1b seems to be negative (p ≥ 0.151). Thus, both industrial manufacturing and office space projects used the same certification strategy.
Within the living space group (2a and 2b), SS, WE, EA, ID, and RP showed high achievements (50 ≤ PAS ≤ 100), while MR and EQ showed low achievements (29 ≤ PAS ≤ 45). In almost all comparisons, the difference between 2a and 2b across the LEED categories seemed to be negative (p ≥ 0.081); the exception was the MR category, in which 2a outperformed 2b (seemingly positive: p = 0.0007). Therefore, both multi-family residential and lodging projects used a similar certification strategy.
Thus, both the production space and living space groups showed high achievement in the SS, WE, and ID categories and low achievement in the MR category. These results are similar to those reported by Ma and Cheng [17]. Those authors analyzed LEED-NC v3 in the USA and concluded that the highest performance was revealed in the SS, EQ, and ID categories, and the lowest performance was revealed in the MR category. According to Wu et al. [11], SS, WE, EQ, and ID are the most easily accessible categories and do not require large investments, while MR is difficult to achieve given the difficulty of replacing virgin materials with recycled building materials.
However, the difference between 1a vs. 2a, 1a vs. 2b, 1b vs. 2a, and 1b vs. 2b in achieving WE and EQ seems to be positive, as shown in Table 2. The production space group outperformed the living space group in both the WE and EQ categories (seemingly positive: p ≤ 0.036). In addition, in cases of 1a vs. 2a and 1a vs. 2b, the industrial manufacturing subgroup had lower achievements than the two subgroups of the living space group (seemingly positive: p = 0.010 and p = 0.023, respectively) in the EA category. Lastly, in the case of 1a vs. 2a, the industrial manufacturing space group outperformed the multi-family residential space group in the MR category (seemingly positive: p = 0.003).
Despite the differences in the certification strategies used by the two space groups, the overall medians were about the same, at 65 and 63 for the industrial manufacturing and office subgroups, respectively (i.e., production space group), and 63 and 65 for the multi-family residential and lodging subgroups, respectively (i.e., living space group) (seemingly negative: p ≥ 0.058). These medians for the overall gold-certified LEED project achievements are consistent with the results reported by Wu et al. [11]. The authors [11] analyzed LEED-NC v3-certified projects around the world and noted that LEED-NC v3-certified projects typically received total points only slightly above the lower thresholds of each certification level. This means that the level of certification matters more than the actual sustainability of LEED-certified projects [38].
To understand the specific differences between the certification strategies of the production space and living space groups, further analysis of the SS, WE, EA, MR, and EQ credits is presented in Section 4.2.
4.2. Production and Living Space Groups: Certification Strategies at the Credit Level
4.2.1. Sustainable Sites
Table 3 shows the medians, PASs, and p-values of six pairwise comparisons between four types of space for SS credits.
Table 3.
SS credit achievements in LEED-NC v3 gold-certified projects in Poland.
Within the production space group (1a and 1b), SSc1, SSc2, SS4.1, SSc4.2, SSc4.3, SSc4.4, SSc5.1, SSc5.2, SSc7.1, and SSc7.2 showed the highest achievements (56 ≤ PAS ≤ 100), while SSc3, SSc7.1, and SSc7.2 showed the lowest achievements (0 ≤ PAS ≤ 22). The difference between 1a and 1b in any of the SS credits seems to be negative (p ≥ 0.07). This means that both industrial manufacturing and office space projects used the same certification strategy for the achievement of SS credits.
Within the living space group (2a and 2b), SSc1, SSc2, SSc4.1, SSc4.3, SSc4.4, SSc5.2, and SSc7.1 showed the highest achievements (63 ≤ PAS ≤ 100), while SSc3, SSc5.1, SSc6.1, SSc7.2, and SSc8 showed the lowest achievements (0 ≤ PAS ≤ 38). In almost all comparisons, the difference between 2a and 2b seems to be negative (p ≥ 0.132); the exceptions were SSc4.2, in which 2a had a lower achievement than 2b (seemingly positive: p = 0.001), and SSc6.2, in which 2a outperformed 2b (seemingly positive: p = 0.001). In this space group, both multi-family residential and lodging projects used a similar certification strategy to achieve SS credits.
A comparison between the certification strategies of the production and living space groups demonstrated statistical differences between these two certification strategies in achieving 5 out of 14 SS credits. In particular, each of the two subgroups (1a and 1b) from the production space group outperformed each of the two subgroups (2a and 2b) from the living space group in both the SSc5.1 and SSc7.2 credits (seemingly positive: p ≤ 0.045). In addition, in cases of 1a vs. 2a and 1b vs. 2a, the two subgroups from the production space group outperformed the multi-family residential subgroup (2a) from the living space group in SSc5.1 (seemingly positive: p = 0.0002 and p = 0.003, respectively). However, the two subgroups (1a and 1b) from the production space group had lower achievements than the multi-family residential subgroup in SSc7.2 (seemingly positive: p = 0.004 and p = 0.003, respectively). Finally, in the cases of 1b vs. 2a and 1b vs. 2b, the office space subgroup outperformed the two subgroups from the living space group in SSc8 (seemingly positive: p = 0.045 and p = 0.013, respectively).
Thus, the two space groups production and living used the same certification strategy, including for the high-achievement urban-infrastructure-related SS credits, such as SSc1 (site selection); SSc2 (development density and community connectivity); SSc4.1, SSc4.3, and SSc4.4 (alternative transportation—public transportation access, low-emitting and fuel-efficient vehicles, and parking capacity, respectively); SSc5.2 (site development—maximize open space); and SSc7.1 (heat island effect—nonroof). This finding was reasonable because the analyzed LEED projects were located in cities (Kalisz, Poznań, Rzeszow, Swinoujscie, Warsaw, Wroclaw, etc.) that have developed infrastructure, including basic services such as schools, supermarkets, banks, etc., and a variety of public transport options, such as buses, metropolitan areas, and railway services.
Ma and Cheng [17] noted that in LEED-NC v3-certified projects in the USA, SSc1 (site selection) and SSc4.3 (alternative transportation—low-emitting and fuel-efficient vehicles) had high PASs (85% and 81%, respectively). In LEED-NC v3-certified projects in Vietnam, SSc1 and SSc4.3 had high achievements: PAS = 92 and 100, respectively. In addition, SSc5.2 (site development—maximize open space) and SSc7.1 (heat island effect—nonroof) achieved high PASs (69 and 86, respectively) [39]. This means that these SS credits are relevant in different countries since they relate to issues that are relevant in any modern city with developed infrastructure.
4.2.2. Water Efficiency
Table 4 shows the medians, PASs, and p-values of six pairwise comparisons between four types of spaces for WE credits.
Table 4.
WE credit achievements in LEED-NC v3 gold-certified projects in Poland.
Within the production space group (1a and 1b), WEc1, WEc2, and WEc3 showed high achievements (86 ≤ PAS ≤ 100). As a result, the difference between 1a and 1b seems to be negative (p ≥ 0.738). Thus, both industrial manufacturing and office space projects used the same certification strategy to achieve WE credits.
Within the living space group (2a and 2b), WEc1, WEc2, and WEc3 showed the highest achievements (50 ≤ PAS ≤ 100). As a result, the difference between 2a and 2b seems to be negative (p ≥ 0.132). Therefore, it can be concluded that the multi-family residential and lodging subgroups used the same strategy to obtain WE credits.
However, in the cases of 1a vs. 2a and 1b vs. 2a, each of the two subgroups (industrial manufacturing and office space) from the production group outperformed the multi-family residential subgroup in WEc1 and WEc3 (seemingly positive: p ≤ 0.008).
Despite this statistical difference in the achievement of WEc1 and WEc3, water conservation was considered a high priority in the certification strategies for both the production space and living space groups. This is because Poland’s water resources are dependent on the Vistula and Odra Basins, and the country is in the low water availability category (1566 m3/person) [40].
In other countries with high water consumption, such as Vietnam, all water credits (WEc1–WEc3) were achieved at a high level (88 ≤ PAS ≤ 94) [39]. Thus, regardless of the type of building, WE credits depend only on the availability of water in a given country. In addition, the installation of irrigation systems (WEc1) and water-saving devices such as toilets, urinals, toilet faucets, showers, and kitchen sink faucets (WEc2 and WEc3) can be easily implemented without requiring large investments.
4.2.3. Energy and Atmosphere
Table 5 shows the medians, PASs, and p-values of six pairwise comparisons between four types of space for EA credits.
Table 5.
EA credit achievements in LEED-NC v3 gold-certified projects in Poland.
Within the production space group (1a and 1b), EAc4 and EAc5 showed the highest achievements (86 ≤ PAS ≤ 100). In contrast, EAc1, EAc2, EAc3, and EAc6 showed the lowest achievements (0 ≤ PAS ≤ 44). As a result, the difference between 1a and 1b seems to be negative (p ≥ 0.219). Both the industrial manufacturing and office subgroups prioritized/ignored the same EA credits.
Within the living space group (2a and 2b), EAc1, EAc4, and EAc5 showed the highest achievements (61 ≤ PAS ≤ 100). In contrast, EAc2, EAc3, and EAc6 showed the lowest achievements (0 ≤ PAS ≤ 23). The multi-family residential and lodging subgroups chose the same certification strategy to achieve EA credits.
Only in the cases of 1a vs. 2a and 1a vs. 2b did the industrial manufacturing space subgroup show a lower achievement compared with the multi-family residential space and lodging space subgroups in EAc1 (seemingly positive: p = 0.011 and 0.014, respectively).
Thus, both the production space and living space groups prioritized Eac4 (enhanced refrigerant management) and EAc5 (measurement and verification credits), and largely ignored EAc2 (on-site renewable energy), EAc3 (enhanced commissioning), and EAc6 (green power). Poland produces energy mainly from fossil fuels (hard coal, 46%; lignite, 24%; and natural gas, 10%), with the remaining 20% from renewable sources (wind, 10%; biomass/biogas, 5%; water, 2%; and other, 3%) [41]. This small share of renewable energy explains why both the production space and living space groups showed low achievements in the renewable energy credits (EAc2 and EAc6).
Regarding EAc1, the production space group achieved 5 and 6 points (for the industrial manufacturing and office subgroups, respectively), whereas the living space group achieved 12.5 and 10.5 points (for the multi-family residential and lodging subgroups, respectively). This means that—compared with the building’s baseline performance according to ASHRAE 90.1-2007—the production space group saved 20–22% in operating energy for heating, cooling, and lighting, and the living space group saved 31–35% [42].
Compared with residential buildings, office buildings consume more operating energy. This is due to the large windows intended for daylight and views and the high internal heat load (large number of workers and computers, high demand for artificial lighting, year-round air conditioning, and use of elevators) inherent to office-type buildings [25]. This makes it difficult to save operating energy in office buildings compared with residential buildings. The results of this study confirmed that the living space group saved more operational energy than the production space group.
Wu et al. [11] noted that low achievement in EAc1 could also be a result of development costs for efficient energy projects caused by simulating ASHRAE 90.1-2007 reference buildings and comparison project buildings. The authors [11] explained that EAc1 energy consumption modeling requires USD 0.15 to 0.30 per gross square foot.
However, this difference in operational energy savings can lead to a significant difference in environmental damage associated with the EAc1 certification strategy in the production space and living space groups. This is because Poland produces 1 kWh of electricity using 80% fossil fuels and 20% renewables, which releases 724 g of CO2 (three times the European average) [41]. Taking into account the 210 kWh/m2·year of operational energy required by buildings located in Poland [43], the EAc1 certification strategy in the production space group can lead to 5,926,050–6,081,600 g CO2/m2·50 years, whereas the strategy applied by the living space group can lead to 4,941,300–5,245,350 g CO2/m2·50 years. Thus, in countries with a high proportion of fossil fuels, such as Poland, high achievements in EAc1 have a strong effect on reducing global warming potential.
4.2.4. Materials and Resources
Table 6 shows the medians, PASs, and p-values of six pairwise comparisons between four types of space for MR credits.
Table 6.
MR credit achievements in LEED-NC v3 gold-certified projects in Poland.
Within the production space group (1a and 1b), MRc2, MRc4, and MRc5 showed the highest achievements (50 ≤ PAS ≤ 100). In contrast, MRc1.1, MRc1.2, MRc3, MRc6, and MRc7 showed the lowest achievements (0 ≤ PAS ≤ 14). As a result, the difference between 1a and 1b seems to be negative (p ≥ 0.219). Thus, the same certification strategy for MR credits was used by both the industrial manufacturing and office subgroups.
The same strategy for MR credits was used by the living space group (2a and 2b): MRc2, MRc4, and MRc5 showed the highest achievements (50 ≤ PAS ≤ 100), and MRc1.1, MRc1.2, MRc3, MRc6, and MRc7 showed the lowest achievements (0 ≤ PAS ≤ 13). The only difference was in the case of 2a vs. 2b, in which the multi-family residential subgroup showed lower achievement compared with the lodging subgroup in MRc5 (seemingly positive: p = 0.005).
The comparison between each subgroup from the production space group with each subgroup from the living space group demonstrated only three differently achieved MR credits. In the cases of 1a vs. 2a and 1b vs. 2a, the industrial manufacturing and office subgroups outperformed the multi-family residential subgroup in MRc5 (seemingly positive: p = 0.0004 and 0.008, respectively). Additionally, in the case of 1a vs. 2a, the industrial manufacturing subgroup outperformed the multi-family residential subgroup in MRc4 (seemingly positive: p = 0.011).
Thus, both the production space and living space groups showed lower achievement in the MRc1.1 and 1.2 (building reuse—maintain existing walls, floors, and roof and maintain interior nonstructural elements), MRc3 (materials reuse), MRc6 (rapidly renewable materials), and MRc7 (certified wood) credits. The LEED gold-certified projects studied here were all new buildings. MRc1 and MRc2 are highly dependent on complex design and demolition efficiency and require additional time and costs to implement [44]. MRc3 requires salvaged, refurbished, or reused materials [42]. Reused material is not attractive to potential tenants/owners because of concerns about its quality [44]. MRc6 requires rapidly renewable materials such as bamboo, wool, or cotton insulation, thereby reducing the use of finite raw materials [42]. MRc7 is committed to using timber building components such as structural framing, floors, doors, and trims that are certified according to Forest Stewardship Council principles and criteria [42]. These materials may be considered unsuitable for concrete construction technologies in Poland [45].
Other studies have also indicated poor performance for these MR credits. For example, MRc1, MRc1.2, MRc6, and MRc7 had low PAS scores (10, 3, 0, and 0, respectively) in LEED-NC v3-certified projects in Vietnam [39]. MRc1.1, MRc1.2, and MRc6 also had low PASs in LEED-NC v3 projects certified in the USA (20, 0, and 2, respectively) and China (3, 0, and 1, respectively) [44].
In contrast, both the production space and living space groups showed high achievements in the MRc2 construction waste management and MRc4 recycled content credits. For waste management in Poland, the National Waste Management Plan was elaborated in 2014. This document includes both strategies to prevent the generation of certain types of waste and strategies to reduce the disposal of biodegradable waste [46]. Thus, since the practice of waste management exists at the national level, it supports high scores in MRc2 and MRc4.
4.2.5. Indoor Environmental Quality
Table 7 shows the medians, PASs, and p-values of six pairwise comparisons between four types of space for EQ credits.
Table 7.
EQ credit achievements in LEED-NC v3 gold-certified projects in Poland.
There was a significant difference between each of the subgroups from the production space group and each of the subgroups from the living space group. Specifically, 1a outperformed 2a in EQc1, EQc2, EQc3.2, EQc4.3, EQc5, EQc7.1, and EQc7.2 (seemingly positive: 0.0001 ≤ p ≤ 0.023); 2a outperformed 1a in EQc6.2 and EQc8.2 (seemingly positive: p = 0.0007 and 0.023, respectively); 1a outperformed 2b in EQc3.1, EQc3.2, EQc4.3, and EQc7.2 (seemingly positive: p = 0.041, 0.029, 0.009, and 0.029, respectively); 1b outperformed 2a in EQc1, EQc2, EQc3.2, EQc4.3, EQc5, EQc7.1, and EQc7.2 (seemingly positive: 0.0003 ≤ p ≤ 0.046); and 2a outperformed 1b in EQc4.1 and EQc6.2 (seemingly positive: p = 0.046 and 0.003, respectively).
However, similar EQ strategies were identified between two subgroups within the production space group and between two subgroups within the living space group. Within the production space group (1a and 1b subgroups), EQc1, EQc2, EQc3.1, EQc3.2, EQc4.1, EQc4.2, EQc4.3, EQc5, EQc7.1, and EQc7.2 showed the highest achievements (50 ≤ PAS ≤ 100). In contrast, EQc4.4, EQc6.1, EQc6.2, and EQc8.1 showed the lowest achievements (0 ≤ PAS ≤ 44). Only EQc4.1 had a better achievement score in 1a than in 1b (PAS = 100 and 43, respectively); 1a outperformed 1b (seemingly positive: p = 0.010). Thus, except for EQc4.1, the industrial manufacturing and office subgroups used the same EQ-credit-related certification strategy.
Within the living space group (2a and 2b subgroups), EQc3.1, EQc4.1, and EQc8.2 showed the highest achievements (50 ≤ PAS ≤ 100). In contrast, EQc1, EQc3.2, EQc4.3, EQc4.4, EQc5, EQc6.1, EQc7.2, and EQc8.1 showed the lowest achievements (0 ≤ PAS ≤ 38). The credits for EQc2, EQc6.2, and EQc7.1 had different degrees of achievement: in the multi-family residential subgroup, PAS = 0, 100, and 0, respectively, while in the lodging subgroup, PAS = 88, 25, and 75, respectively. The lodging subgroup outperformed the multi-family residential subgroup in EQc2 and EQc7.1 (seemingly positive: p = 0.001 and 0.005, respectively), whereas the multi-family residential subgroup outperformed the lodging subgroup in EQc6.2 (seemingly positive: p = 0.005). Thus, within the living space group, only 3 out of 15 EQ credits were achieved differently, and 12 out of 15 EQ credits had the same certification strategy.
Wu et al. [11] found the highest performance in the EQ credit group, which closely matches the high-achieving credits in the production space group. The authors noted that LEED-NC v3 gold projects received high scores in the following criteria: EQc1, EQc2, EQc3.1, EQ4.1-4.4, EQc5, EQc6.1, EQc6.2, EQc7.1, EQc7.2, EQc8.1, and EQc8.2 (50 ≤ PAS ≤ 100). Wu et al. [11] assessed office, retail, industrial manufacturing/laboratory, higher education/educational facility, healthcare, warehouse and distribution, service, residential, public order and safety, lodging, and public assembly spaces. In this overall data pool, residential and lodging (“living space”) were represented by only 8% of buildings, while office and industrial/laboratory (“production space”) were represented by 40% of buildings. This is why the high-achieving EQ credits proposed by Wu et al. [11] are much closer to the high-achieving credits identified in the production space group in this study. Moreover, the EQ certification strategy proposed by Wu et al. [11] can be considered “average” for all analyzed space-type buildings.
However, the present study revealed two different strategies: the production space group scored highly in 10 out of 15 EQ credits, while the living space group performed highly in only 3 out of 15 EQ credits. The EQ credits concern human well-being and health, such as quality of air, addressed via the installation of carbon dioxide sensors, increased ventilation, and low-emitting materials (EQc1, EQc2, EQc3.1, EQc3.2, EQc4.1-EQc4.4) and thermal (EQc7.1 and EQc7.2) and lighting (EQc8.1) comfort. These issues are very important in industrial manufacturing and office environments, as these spaces employ a large number of workers/employees. Moreover, offices are usually divided into several air-conditioning zones equipped with intelligent ventilation systems with individual controls [47]. Therefore, it is understandable that the EQ credits were prioritized for the production space group more so than for the living space group.
4.2.6. Summarized Number of Significant Differences
Table 8 shows the summarized number of seemingly positive differences (p ≤ 0.05) in pairwise LEED credit comparisons between groups (production space versus living space) and between subgroups within each group (industrial manufacturing subgroup versus office subgroup and multi-family residential subgroup versus lodging subgroup). The evaluation is summarized in terms of p-values and presented in Table 3, Table 4, Table 5, Table 6 and Table 7.
Table 8.
Number of seemingly positive differences (p ≤ 0.05) in pairwise LEED credit comparisons between groups and between subgroups within each group (frequency of seemingly positive differences from the total number of comparisons (%)).
There were a limited number of seemingly positive differences (p ≤ 0.05) in pairwise LEED credit comparisons between the industrial manufacturing subgroup and the office subgroup and between the multi-family residential subgroup and the lodging subgroup (1 out of 46 and 6 out of 46, respectively). This confirmed the results at the category level, showing that certification strategies for the industrial manufacturing subgroup and the office subgroup (production space group) were very similar. The same was true for the multi-family residential subgroup and lodging subgroup (living space group), their certification strategies were also very similar.
However, in pairwise comparisons of LEED credits between the production space and living space groups, there were a significant number of seemingly positive differences (p ≤ 0.05) (45 of 184). Thus, the production and living space groups used different certification strategies based on the characteristics of their space types.
4.2.7. Practical Applications
Table 9 provides the recommended certification strategies for production spaces (such as offices, retail stores, manufacturing, and warehouses) and living spaces (such as residential buildings, hotels, and dormitories). These strategies are recommended for buildings located in Poland and other similar regions.
Table 9.
The recommended certification strategies for production and living spaces.
4.3. Future Directions
This study shows significant differences in LEED certification strategies for different building types. However, this was only shown in one country and with a small sample. In future studies, this fact will be examined using examples from other countries. This will allow professionals to develop a more flexible certification system, for example, by taking into account local green building policies [48]. In addition, future studies should increase the sample size to increase the robustness of the statistical inferences.
5. Conclusions
This study analyzed and compared the certification strategies used by industrial manufacturing, office, multi-family residential, and lodging spaces within LEED-NC v3 gold projects in Poland. The following conclusions were drawn:
- Uniform certification strategies: Certification strategies for industrial manufacturing and office spaces in Poland are uniform and classified under the “production space”.
- Consistent strategies for living spaces: Multi-family residential and lodging spaces follow similar certification strategies and fall under the “living space” category.
- Energy source influence: The composition of Poland’s energy sources influences credit achievement, impacting both the production and living space groups.
- Building type dependency: Operational energy-saving credits vary between living and production spaces, indicating building type dependency.
- Crucial EQ credits for production spaces: The EQ category, vital for human well-being in production spaces, demonstrates differences between the production and living space groups.
Funding
This research received no external funding.
Data Availability Statement
Publicly available data sets were analyzed in this study. The data can be found here: https://www.usgbc.org/projects (USGBC Projects Site) (accessed on 2 August 2023) and http://www.gbig.org (GBIG Green Building Data) (accessed on 2 August 2023).
Acknowledgments
The author is grateful to two anonymous reviewers for helpful comments.
Conflicts of Interest
The author declares no conflict of interest.
Appendix A
Table A1.
The LEED-NC v3: categories, credits, and building space types.
Table A1.
The LEED-NC v3: categories, credits, and building space types.
| Abbreviation | LEED Category/Credit/Space-Type | LEED |
|---|---|---|
| SS | Sustainable sites | LEED category |
| WE | Water efficiency | LEED category |
| EA | Energy and atmosphere | LEED category |
| MR | Materials and resources | LEED category |
| EQ | Indoor environmental quality | LEED category |
| ID | Innovation in design | LEED category |
| RP | Regional priority | LEED category |
| SSc1 | Site selection | SS credit |
| SSc2 | Development density and community connectivity | SS credit |
| SSc3 | Brownfield redevelopment | SS credit |
| SSc4.1 | Alternative transportation—public transportation access | SS credit |
| SSc4.2 | Alternative transportation—bicycle storage and changing rooms | SS credit |
| SSc4.3 | Alternative transportation—low-emitting and fuel-efficient vehicles | SS credit |
| SSc4.4 | Alternative transportation—parking capacity | SS credit |
| SSc5.1 | Site development—protect or restore habitat | SS credit |
| SSc5.2 | Site development—maximize open space | SS credit |
| SSc6.1 | Stormwater design—quantity control | SS credit |
| SSc6.2 | Stormwater design—quality control | SS credit |
| SSc7.1 | Heat island effect—nonroof | SS credit |
| SSc7.2 | Heat island effect—roof | SS credit |
| SSc8 | Light pollution reduction | SS credit |
| WEc1 | Water-efficient landscaping | WE credit |
| Wec2 | Innovative wastewater technologies | WE credit |
| WEc3 | Water-use reduction | WE credit |
| EAc1 | Optimize energy performance | EA credit |
| EAc2 | On-site renewable energy | EA credit |
| EAc3 | Enhanced commissioning | EA credit |
| EAc4 | Enhanced refrigerant management | EA credit |
| EAc5 | Measurement and verification | EA credit |
| EAc6 | Green power | EA credit |
| MRc1.1 | Building reuse—maintain existing walls, floors, and roof | MR credit |
| MRc1.2 | Building reuse—maintain interior nonstructural elements | MR credit |
| MRc2 | Construction waste management | MR credit |
| MRc3 | Materials reuse | MR credit |
| MRc4 | Recycled content | MR credit |
| MRc5 | Regional materials | MR credit |
| MRc6 | Rapidly renewable materials | MR credit |
| MRc7 | Certified wood | MR credit |
| EQc1 | Outdoor air delivery monitoring | EQ credit |
| EQc2 | Increased ventilation | EQ credit |
| EQc3.1 | Construction IAQ management plan—during construction | EQ credit |
| EQc3.2 | Construction IAQ management plan—before occupancy | EQ credit |
| EQc4.1 | Low-emitting materials—adhesives and sealants | EQ credit |
| EQc4.2 | Low-emitting materials—paints and coatings | EQ credit |
| EQc4.3 | Low-emitting materials—flooring systems | EQ credit |
| EQc4.4 | Low-emitting materials—composite wood and agrifiber products | EQ credit |
| EQc5 | Indoor chemical and pollutant source control | EQ credit |
| EQc6.1 | Controllability of systems—lighting | EQ credit |
| EQc6.2 | Controllability of systems—thermal comfort | EQ credit |
| EQc7.1 | Thermal comfort—design | EQ credit |
| EQc7.2 | Thermal comfort—verification | EQ credit |
| EQc8.1 | Daylight and views—daylight | EQ credit |
| EQc8.2 | Daylight and views—views | EQ credit |
| 1a | Industrial manufacturing space subgroup | Space type |
| 1b | Office space subgroup | Space type |
| 2a | Multi-family residential space subgroup | Space type |
| 2b | Lodging space subgroup | Space type |
| 1a and 1b | Production space group | Space type |
| 2a and 2b | Living space group | Space type |
References
- Brundtland, G.H. Our Common Future, Report of the World Commission on Environment and Development, Our Common Future (Brundtland Report); Oxford University Press: New York, NY, USA, 1987. [Google Scholar]
- World Population Prospects: World Population Prospects 2022: Summary of Results. 2020. Available online: https://www.un.org/development/desa/pd/sites/www.un.org.development.desa.pd/files/wpp2022_summary_of_results.pdf (accessed on 20 September 2023).
- Zarco-Soto, I.M.; Zarco-Perinan, P.J.; Sanchez-Duran, R. Influence of cities population size on their energy consumption and CO2 emissions: The case of Spain. Environ. Sci. Pollut. Res. 2021, 28, 28146–28167. [Google Scholar] [CrossRef] [PubMed]
- Xiong, Y.; Guo, X.; Nor, M.N.; Song, A.; Dai, L. Mineral resources depletion, environmental degradation, and exploitation of natural resources: COVID-19 aftereffects. Resour. Pol. 2023, 85, 103907. [Google Scholar] [CrossRef]
- Bao, Z.; Lu, W.; Chi, B.; Hao, J. Construction waste management performance in green building: Contextualizing LEED in China. Detritus 2020, 12, 125–134. [Google Scholar] [CrossRef]
- Ceglia, F.; Marrasso, E.; Roselli, C.; Sasso, M.; Tzscheutschler, P. Exergetic and exergoeconomic analysis of an experimental ground source heat pump system coupled with a thermal storage based on Hardware in Loop. Appl. Therm. 2022, 212, 118559. [Google Scholar] [CrossRef]
- Santos, R.; Costa, A.A.; Silvestre, J.D.; Pyl, L. Integration of LCA and LCC analysis within a BIM-based environment. Autom. Constr. 2019, 103, 127–149. [Google Scholar] [CrossRef]
- Summerbell, D.L.; Barlow, C.Y.; Cullen, J.M. Potential reduction of carbon emissions by performance improvement: A cement industry case study. J. Clean. Prod. 2016, 135, 1327–1339. [Google Scholar] [CrossRef]
- Zhang, Y.; Wang, H.; Gao, W.; Wang, F.; Zhou, N.; Kammen, D.M.; Ying, X. A Survey of the Status and Challenges of Green Building Development in Various Countries. Sustainability 2019, 11, 5385. [Google Scholar] [CrossRef]
- Wu, P.; Mao, C.; Wang, J.; Song, Y.; Wang, X. A decade review of the credits obtained by LEED v2.2 certified green building projects. Build. Environ. 2016, 102, 167–178. [Google Scholar] [CrossRef]
- Wu, P.; Song, Y.; Shou, W.; Chi, H.; Chong, H.Y.; Sutrisna, M. A comprehensive analysis of the credits obtained by LEED 2009 certified green buildings. Renew. Sustain. Energy Rev. 2017, 68 Pt 1, 370–379. [Google Scholar] [CrossRef]
- Cheng, J.C.P.; Ma, L.J. A non-linear case-based reasoning approach for retrieval of similar cases and selection of target credits in LEED projects. Build. Environ. 2015, 93, 349–361. [Google Scholar] [CrossRef]
- Ade, R.; Rehm, M. The unwritten history of green building rating tools: A personal view from some of the ‘founding fathers’. Build. Res. Inf. 2020, 48, 1–17. [Google Scholar] [CrossRef]
- Pushkar, S. A Comparative Analysis of Gold Leadership in Energy and Environmental Design for New Construction 2009 Certified Projects in Finland, Sweden, Turkey, and Spain. Appl. Sci. 2018, 8, 1496. [Google Scholar] [CrossRef]
- Pushkar, S.; Verbitsky, O. LEED-NC 2009 silver to gold certified projects in the US in 2012–2017: An appropriate statistical analysis. J. Green Build. 2019, 14, 83–107. [Google Scholar] [CrossRef]
- Pushkar, S.; Verbitsky, O. Silver and gold LEED commercial Interiors: Certified projects. J. Green Build. 2019, 14, 95–113. [Google Scholar] [CrossRef]
- Ma, J.; Cheng, J.C.P. Data-driven study on the achievement of LEED credits using percentage of average score and association rule analysis. Build. Environ. 2016, 98, 121–132. [Google Scholar] [CrossRef]
- Pushkar, S. Strategies for LEED-NC-Certified Projects in Germany and Results of Their Life Cycle Assessment. Buildings 2023, 13, 1970. [Google Scholar] [CrossRef]
- Pushkar, S. Life-Cycle Assessment of LEED-CI v4 Projects in Shanghai, China: A Case Study. Sustainability 2023, 15, 5722. [Google Scholar] [CrossRef]
- Pushkar, S. LEED-CI v4 Projects in Terms of Life Cycle Assessment in Manhattan, New York City: A Case Study. Sustainability 2023, 15, 2360. [Google Scholar] [CrossRef]
- Pushkar, S. Relationship between Project Space Types, Optimize Energy Performance Credit, and Project Size in LEED-NC Version 4 (v4) Projects: A Case Study. Buildings 2022, 12, 862. [Google Scholar] [CrossRef]
- USGBC Projects Site. Available online: https://www.usgbc.org/projects (accessed on 1 October 2023).
- GBIG Green Building Data. Available online: http://www.gbig.org (accessed on 1 October 2023).
- Hurlbert, S.H. Pseudoreplication and the Design of Ecological Field Experiments. Ecol. Monogr. 1984, 54, 187–211. Available online: https://www.uvm.edu/~ngotelli/Bio%20264/Hurlbert.pdf (accessed on 1 October 2023). [CrossRef]
- Grzegorzewska, M.; Kirschke, P. The Impact of Certification Systems for Architectural Solutions in Green Office Buildings in the Perspective of Occupant Well-Being. Buildings. 2021, 11, 659. [Google Scholar] [CrossRef]
- Stevens, S.S. On the theory of scales of measurement. Science 1946, 103, 677–680. [Google Scholar] [CrossRef]
- Bergmann, R.; Ludbrook, J.; Spooren, W.P.J.M. Different outcomes of the Wilcoxon-Mann-Whitney test from different statistics packages. Am. Stat. 2000, 54, 72–77. [Google Scholar]
- Hurlbert, S.H. Pseudofactorialism, response structures and collective responsibility. Austral Ecol. 2013, 38, 646–663. [Google Scholar] [CrossRef]
- Pham, D.H.; Kim, B.; Lee, J.; Ahn, Y. An Investigation of the Selection of LEED Version 4 Credits for Sustainable Building Projects. Appl. Sci. 2020, 10, 7081. [Google Scholar] [CrossRef]
- Routledge, R.D. Resolving the conflict over Fisher’s exact test. Can. J. Stat. 1992, 20, 201–209. Available online: https://www.jstor.org/stable/3315468 (accessed on 1 October 2023). [CrossRef]
- Fay, M.P.; Proschan, M.A. Wilcoxon-Mann-Whitney or t-test? On assumptions for hypothesis tests and multiple interpretations of decision rules. Stat. Surv. 2010, 4, 1–39. [Google Scholar] [CrossRef]
- Mundry, R.; Fischer, J. Use of statistical programs for nonparametric tests of small samples often leads to incorrect p values: Examples from animal behaviour. Anim. Behav. 1998, 56, 256–259. [Google Scholar] [CrossRef]
- Hurlbert, S.H.; Lombardi, C.M. Final collapse of the Neyman-Pearson decision theoretic framework and rise of the neoFisherian. Ann. Zool. Fenn. 2009, 46, 311–349. Available online: https://www.jstor.org/stable/23736900 (accessed on 1 October 2023).
- Fisher, R.A. Statistical Methods and Scientific Inference; Oliver & Boyd: Edinburgh, UK, 1956. [Google Scholar]
- Altman, D.G. Practical Statistics for Medical Research; Chapman and Hall: London, UK, 1991. [Google Scholar]
- Beninger, P.G.; Boldina, I.; Katsanevakis, S. Strengthening statistical usage in marine ecology. J. Exp. Mar. Biol. Ecol. 2012, 426–427, 97–108. [Google Scholar] [CrossRef]
- Gotelli, N.J.; Ellinson, A.M. A Primer of Ecological Statistics, 2nd ed.; Sinauer Associates: Sunderland, MA, USA, 2013; ISBN 9781605350646. [Google Scholar]
- Fuerst, F. Building momentum: An analysis of investment trends in LEED and Energy Star-certified properties. J. Retail Leis. Prop. 2009, 8, 285–297. [Google Scholar] [CrossRef]
- Pham, D.H.; Kim, B.; Lee, J.; Ahn, A.C.; Ahn, Y. A Comprehensive Analysis: Sustainable Trends and Awarded LEED 2009 Credits in Vietnam. Sustainability 2020, 12, 852. [Google Scholar] [CrossRef]
- Kubiak-Wójcicka, K.; Machula, S. Influence of Climate Changes on the State of Water Resources in Poland and Their Usage. Geosciences 2020, 10, 312. [Google Scholar] [CrossRef]
- Borowski, P. Adaptation strategy on regulated markets of power companies in Poland. Energy Environ. 2019, 30, 3–26. [Google Scholar] [CrossRef]
- LEED 2009 for New Construction and Major Renovations. 2014. Available online: https://energy.nv.gov/uploadedFiles/energynvgov/content/2009_NewConstruction.pdf (accessed on 1 October 2023).
- Bazazzadeh, H.; Pilechiha, P.; Nadolny, A.; Mahdavinejad, M.; Hashemi Safaei, S.S. The Impact Assessment of Climate Change on Building Energy Consumption in Poland. Energies 2021, 14, 4084. [Google Scholar] [CrossRef]
- Chi, B.; Lu, W.; Ye, M.; Bao, Z.; Zhang, X. Construction waste minimization in green building: A comparative analysis of LEED-NC 2009 certified projects in the US and China. J. Clean. Prod. 2020, 256, 120749. [Google Scholar] [CrossRef]
- Kirschke, P.; Sietko, D. The Function and Potential of Innovative Reinforced Concrete Prefabrication Technologies in Achieving Residential Construction Goals in Germany and Poland. Buildings 2021, 11, 533. [Google Scholar] [CrossRef]
- Wysokińska, Z. Implementing the Main Circular Economy Principles within the Concept of Sustainable Development in the Global and European economy, with Particular Emphasis on Central and Eastern Europe—The Case of Poland and the Region of Lodz. Comp. Econ. Res. Cent. East. Eur. 2018, 21, 75–93. [Google Scholar] [CrossRef]
- Taczalska-Ryniak, A. Healthy Office by WELL Building Standard: Polish Examples. In Human Systems Engineering and Design II. IHSED 2019; Ahram, T., Karwowski, W., Pickl, S., Taiar, R., Eds.; Advances in Intelligent Systems and Computing; Springer: Cham, Switzerland, 2020; Volume 1026. [Google Scholar] [CrossRef]
- Hu, Q.; Xue, J.; Liu, R.; Shen, G.Q.; Xiong, F. Green building policies in China: A policy review and analysis. Energy Build. 2023, 278, 112641. [Google Scholar] [CrossRef]
Disclaimer/Publisher’s Note: The statements, opinions and data contained in all publications are solely those of the individual author(s) and contributor(s) and not of MDPI and/or the editor(s). MDPI and/or the editor(s) disclaim responsibility for any injury to people or property resulting from any ideas, methods, instructions or products referred to in the content. |
© 2023 by the author. Licensee MDPI, Basel, Switzerland. This article is an open access article distributed under the terms and conditions of the Creative Commons Attribution (CC BY) license (https://creativecommons.org/licenses/by/4.0/).