Abstract
Regarding environmental sustainability and market pricing, the energy class is an increasingly more decisive characteristic in the real estate sector. For this reason, a great deal of attention is now devoted to exploring new technologies, energy consumption forecasting tools, intelligent platforms, site management devices, optimised procedures, software, and guidelines. New investments and smart possibilities are currently the object of different research in energy efficiency in building stocks to reach widespread ZEB standards as soon as possible. In this light, this work focuses on analysing 13 cities in Northern Italy to understand the impact of energy class on market values. An extensive data-mining process collects information about 13,093 properties in Lombardia, Piemonte, Emilia Romagna, Friuli Venezia-Giulia, Veneto, and Trentino alto Adige. Then, a feature importance analysis and a machine learning forecasting tool help understand the influence of energy class on market prices today.
1. Introduction and Background
The framework of this Special Issue entitled “New Technologies and Designs in Reducing Building Energy Consumption While Improving the Market Value” is dedicated to exploring investments and possibilities in the field of energy efficiency of building stocks, including the use of new technologies, smart platforms, consumption forecasting models [1], on-site management tools, life-cycle and economic projections [2,3,4,5], measurement devices, optimised procedures [6], and software and guidelines for design and management [7]. The present contribution aims to open the debate on the link between the energy efficiency level of buildings and their market values.
As such, this research is dedicated to investigating the explanatory power of the energy performance of a building [8,9,10,11] in forecasting its market value.
In particular, this study focuses on a comprehensive case study of 13 cities in Northern Italy. Through a massive data-mining process, information about 13,093 properties is downloaded, and the impact of energy classes on their prices is analysed using a feature importance analysis and constructing a multi-parametric predictive model based on the use of Artificial Neural Networks [12,13]. As a multi-parametric assessment technique, the ANN allows us to experience how changing energy classes [14], ceteris paribus, can heavily influence market prices.
1.1. Pricing a Feature
In order to understand the impact that energy classes have on the market values of properties, it is necessary to isolate the marginal contribution of this characteristic on prices. The market value of a property reflects how much the market appreciates all its characteristics, given that many factors contribute to determining the selling price of a building [15,16]. These factors may be specific to the building or external factors. The former includes the building’s construction features, such as its size, state of repair, and quality of the finishes. External factors refer to all those characteristics linked to the location of the building [17], the fixed effects that are related to the urban quality of the surroundings, the proximity to services or points of interest [18], as well as the accessibility [19]. Among these factors, some are more appreciated by the demand, while others may be less impactful in price formation based on the marginal utility associated with each characteristic [20]. Indeed, new laws and regulations may decisively change the willingness to remunerate specific characteristics of the buildings. Energy performance is a factor that is becoming increasingly more important and more appreciated in property valuation [21]. A high energy performance is not only an opportunity to save money on future energy consumption from a life-cycle perspective but also an essential contribution to reducing the impact of pollutant emissions. The environmental emergency is so pressing that new proposals and directives strongly link the higher energy class to higher property values, as in the case of the new “Green Homes” European Directive.
1.2. The Green Homes Directive
On 14 March 2023, the European Parliament approved the revision of the EPBD (Energy Performance of Buildings Directive), a package of regulations proposed by the European Union to promote the renovation of existing high-energy-demanding buildings [22].
This revision of the EPBD is known as the “Green Homes” Directive, a set of regulations aimed at drastically reducing energy consumption in the building sector and speeding up the renovation rate. How? The text stipulates that all new buildings must be zero-emission by 2028 while existing buildings must achieve energy class E by 1 January 2030 and class D by 1 January 2033. The targets for public buildings are even more restrictive since such deadlines are set, respectively, for 2027 and 2030.
Although this is a provisional decision, based on which negotiations will begin with EU governments to agree on the final terms of the legislation, the Green Homes Directive is set to revolutionise European building stocks in terms of energy efficiency and property values.
Suppose a building does not reach the pre-established energy performance level within the time limits. In that case, its market value will be inevitably affected, and the decrease in the value, at least, would logically be equal to the refurbishment costs required to reach the threshold levels. Not achieving the energy benchmark may also stop the property’s sale and rent.
In Italy, currently, around 60% of buildings are in class F or G, with obvious risks for the assets of their owners, both in the case of private individuals and corporate assets (for example, banking and insurance institutions).
1.3. Research Scope, Novelty, and Findings
The Green Homes Directive has yet to enter into force, and there will be further discussions between the Parliament, the Commission, and the Council. It will be decided if and in what terms this directive will be made operational, according to the specificities of each EU Member State.
In this panorama, it may be crucial to understand the starting point: how many properties do not meet the requirements set by the directive? At what point is this target attained? Again, how much does energy class already influence sales prices? How might this influence change in the future, especially given the Green Homes Directive program? Otherwise, might new and smart technologies be strategically integrated into the real estate market? How could this help reach ZEB standards and correspondingly change market values?
It is undoubtedly challenging to answer such extensive research questions, and this Special Issue invites authors, academics, and researchers to work on these several open questions.
As far as the present contribution is concerned, the aim is twofold:
- Depict the “starting point” of these challenges by understanding the functional link between the energy class of a building and its market value.
- Develop a highly flexible and reliable multi-parametric forecasting tool that can assess the market value of a property as a function of different property features, including, of course, its energy class.
The integrated use of data mining, machine learning, and computer programming inside the real estate valuation theoretical framework represents the present work’s primary strength and the novelty of the contribution. This combined approach allows the collection of precise information about 13,093 properties in Northern Italy. For each estate, the asking price is known, in tandem with 23 other descriptive parameters (such as the latitude and longitude, the floor area, the maintenance conditions, the number of rooms and bathrooms, and, not least, the energy performance level). This vast information availability represents quite an appropriate database to develop a very precise Artificial Neural Network aimed at forecasting building market values as a function of the 23 descriptive parameters.
The developed predictive tool can be used to understand the marginal contribution that energy classes have on market values, also at a city scale, and it could be employed to produce scenario analyses and projections if the Green Home Directives enter into force.
2. Materials and Methods
The methodological approach designed for this research is meant to identify the impact of a premise’s energy performance level by estimating its market value. As such, the proposed method is articulated into consequential phases aimed at the development of an integrated and exportable approach. The proposed tool could become a reference in the field of real estate demand–supply mechanisms, as well as a starting point analysing the ordinary behaviour of market operators during buying and selling transactions, with the focus maintained on the energy class of the buildings.
In order to develop the research introduced in the paragraph above, the authors drew and followed the steps illustrated below:
- Definition of a representative case study;
- Extensive data-mining process to produce a database of complete and significant information;
- Feature importance analysis on the database;
- Definition of the market value’s forecasting model;
- Test and validation of the predictive model;
- Understanding of the influence of energy classes on market values.
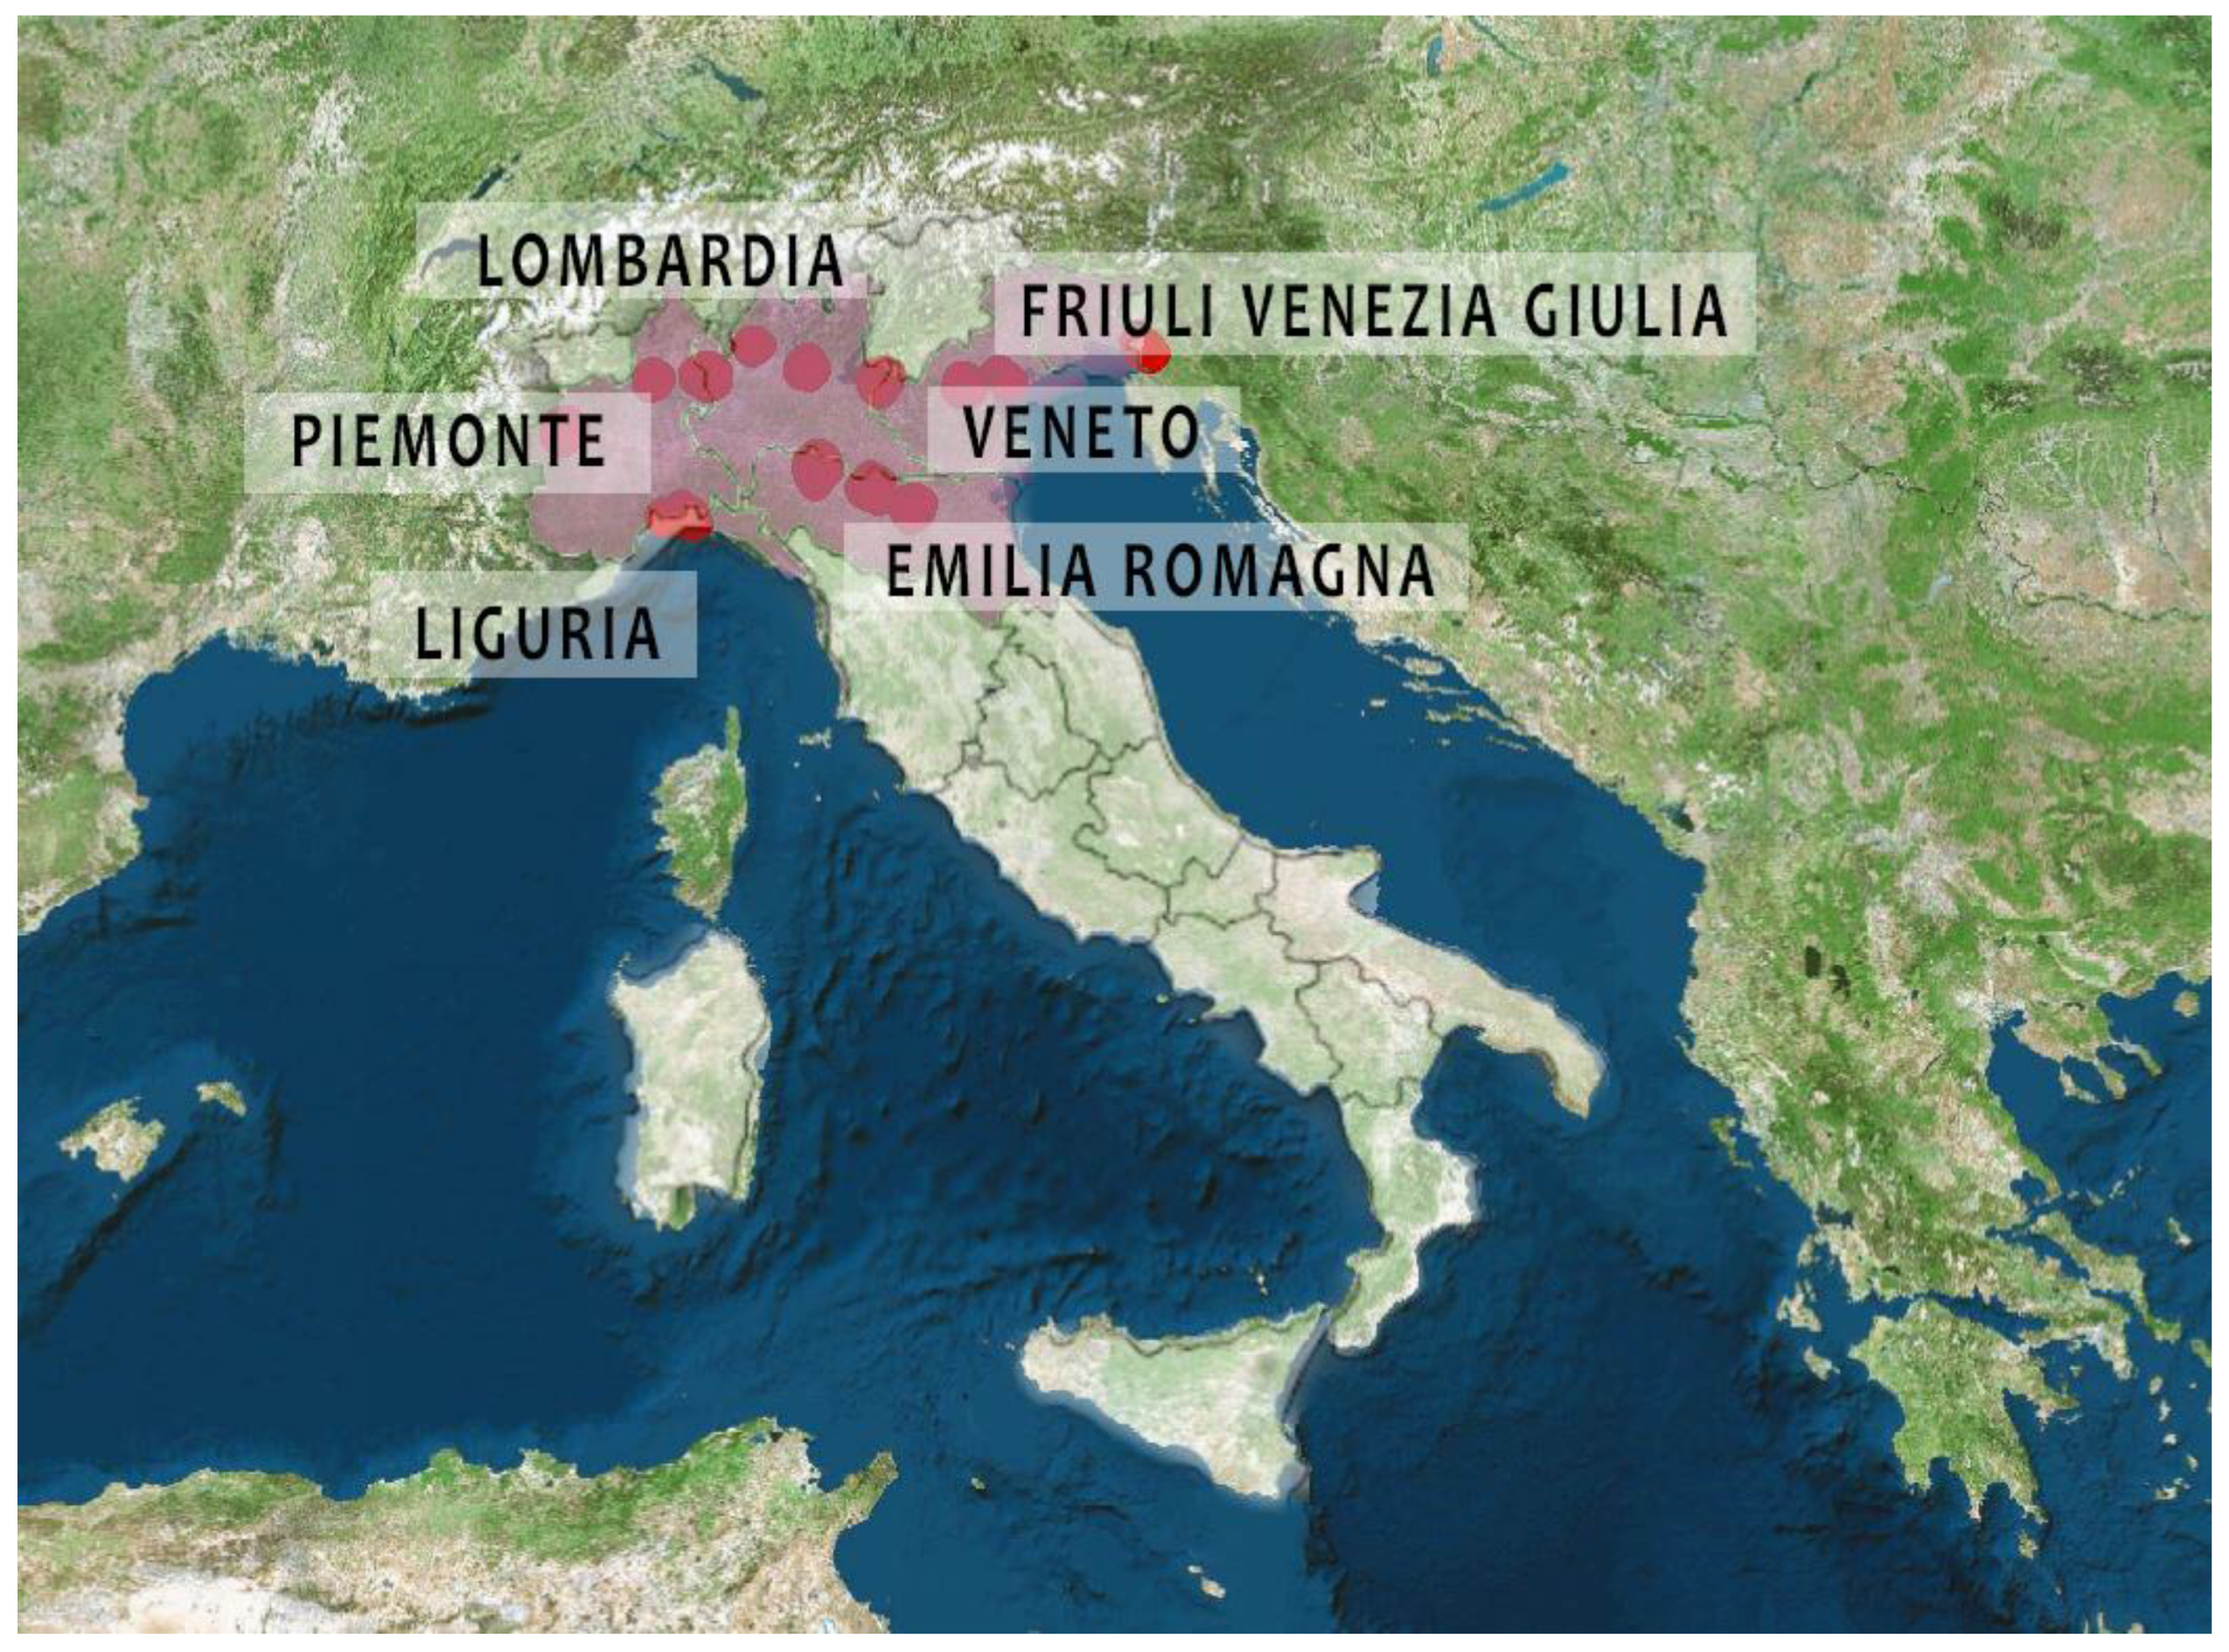
Therefore, the first phase of this work is dedicated to selecting a significant case study. Thirteen cities in Northern Italy were selected in the regions of Lombardia, Piemonte, Emilia Romagna, Friuli Venezia Giulia, Veneto, and Trentino alto Adige, as shown in Figure 1.
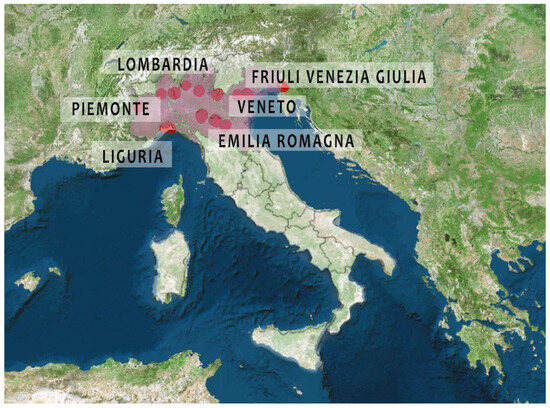
Figure 1.
Selected regions in Northern Italy (downloaded observations in red).
The second phase of this research focuses on collecting the information necessary to develop the forecasting tool. A tailored procedure is developed in the Python® computer language (software version 3.10) to automatically parse real estate selling web pages and coherently extract the necessary data with a pre-defined search domain. The tool then identifies the sample of properties that are heterogeneously distributed in the 13 cities under examination. Per each building parsed and downloaded, called Ba, with a ∈ ℕ and 1 ≤ a ≤ A, where A is the total number of observations downloaded, the geographical coordinates of latitude and longitude are recorded, named lata and longa, as well as their asking prices (EUR/sqm), defined as Vma, and a bundle of descriptive characteristics of the buildings named Xia, where i is the i-th feature of the a-th building, i ∈ ℕ, and 1 ≤ i ≤ I, and I is the total number characteristics considered.
In the third phase, a feature importance analysis is conducted on the downloaded observations in order to assign coefficients of importance to the variables involved in the analysis. Specifically, the random forest (RF) regressor is used to conduct the feature importance process, and a coefficient of importance, named C(RF), is assigned to every ith building feature, therefore called C(RF)i. Also, the Pearson correlation coefficients, named C(P)i, are assessed to investigate the importance of input variables over market prices.
In the fourth phase of this research, an Artificial Neural Network (ANN) is developed through Python coding. An ANN, as is further explained, is a computational system that can link a set of input variables to one output with high precision. The inputs here are the building’s features, among which there is the energy class, and the output is the corresponding market value. With the help of a genetic optimisation algorithm, the ANN with the lowest error on the forecast is produced, allowing the link of the energy class with the assessment market value in a forecasting tool.
Finally, verifying the empirical consistency of the developed ANN model is discussed, and identifying the relationship between the dependent variable and the independent variables is defined to quantify the marginal contribution of the energy class over market values.
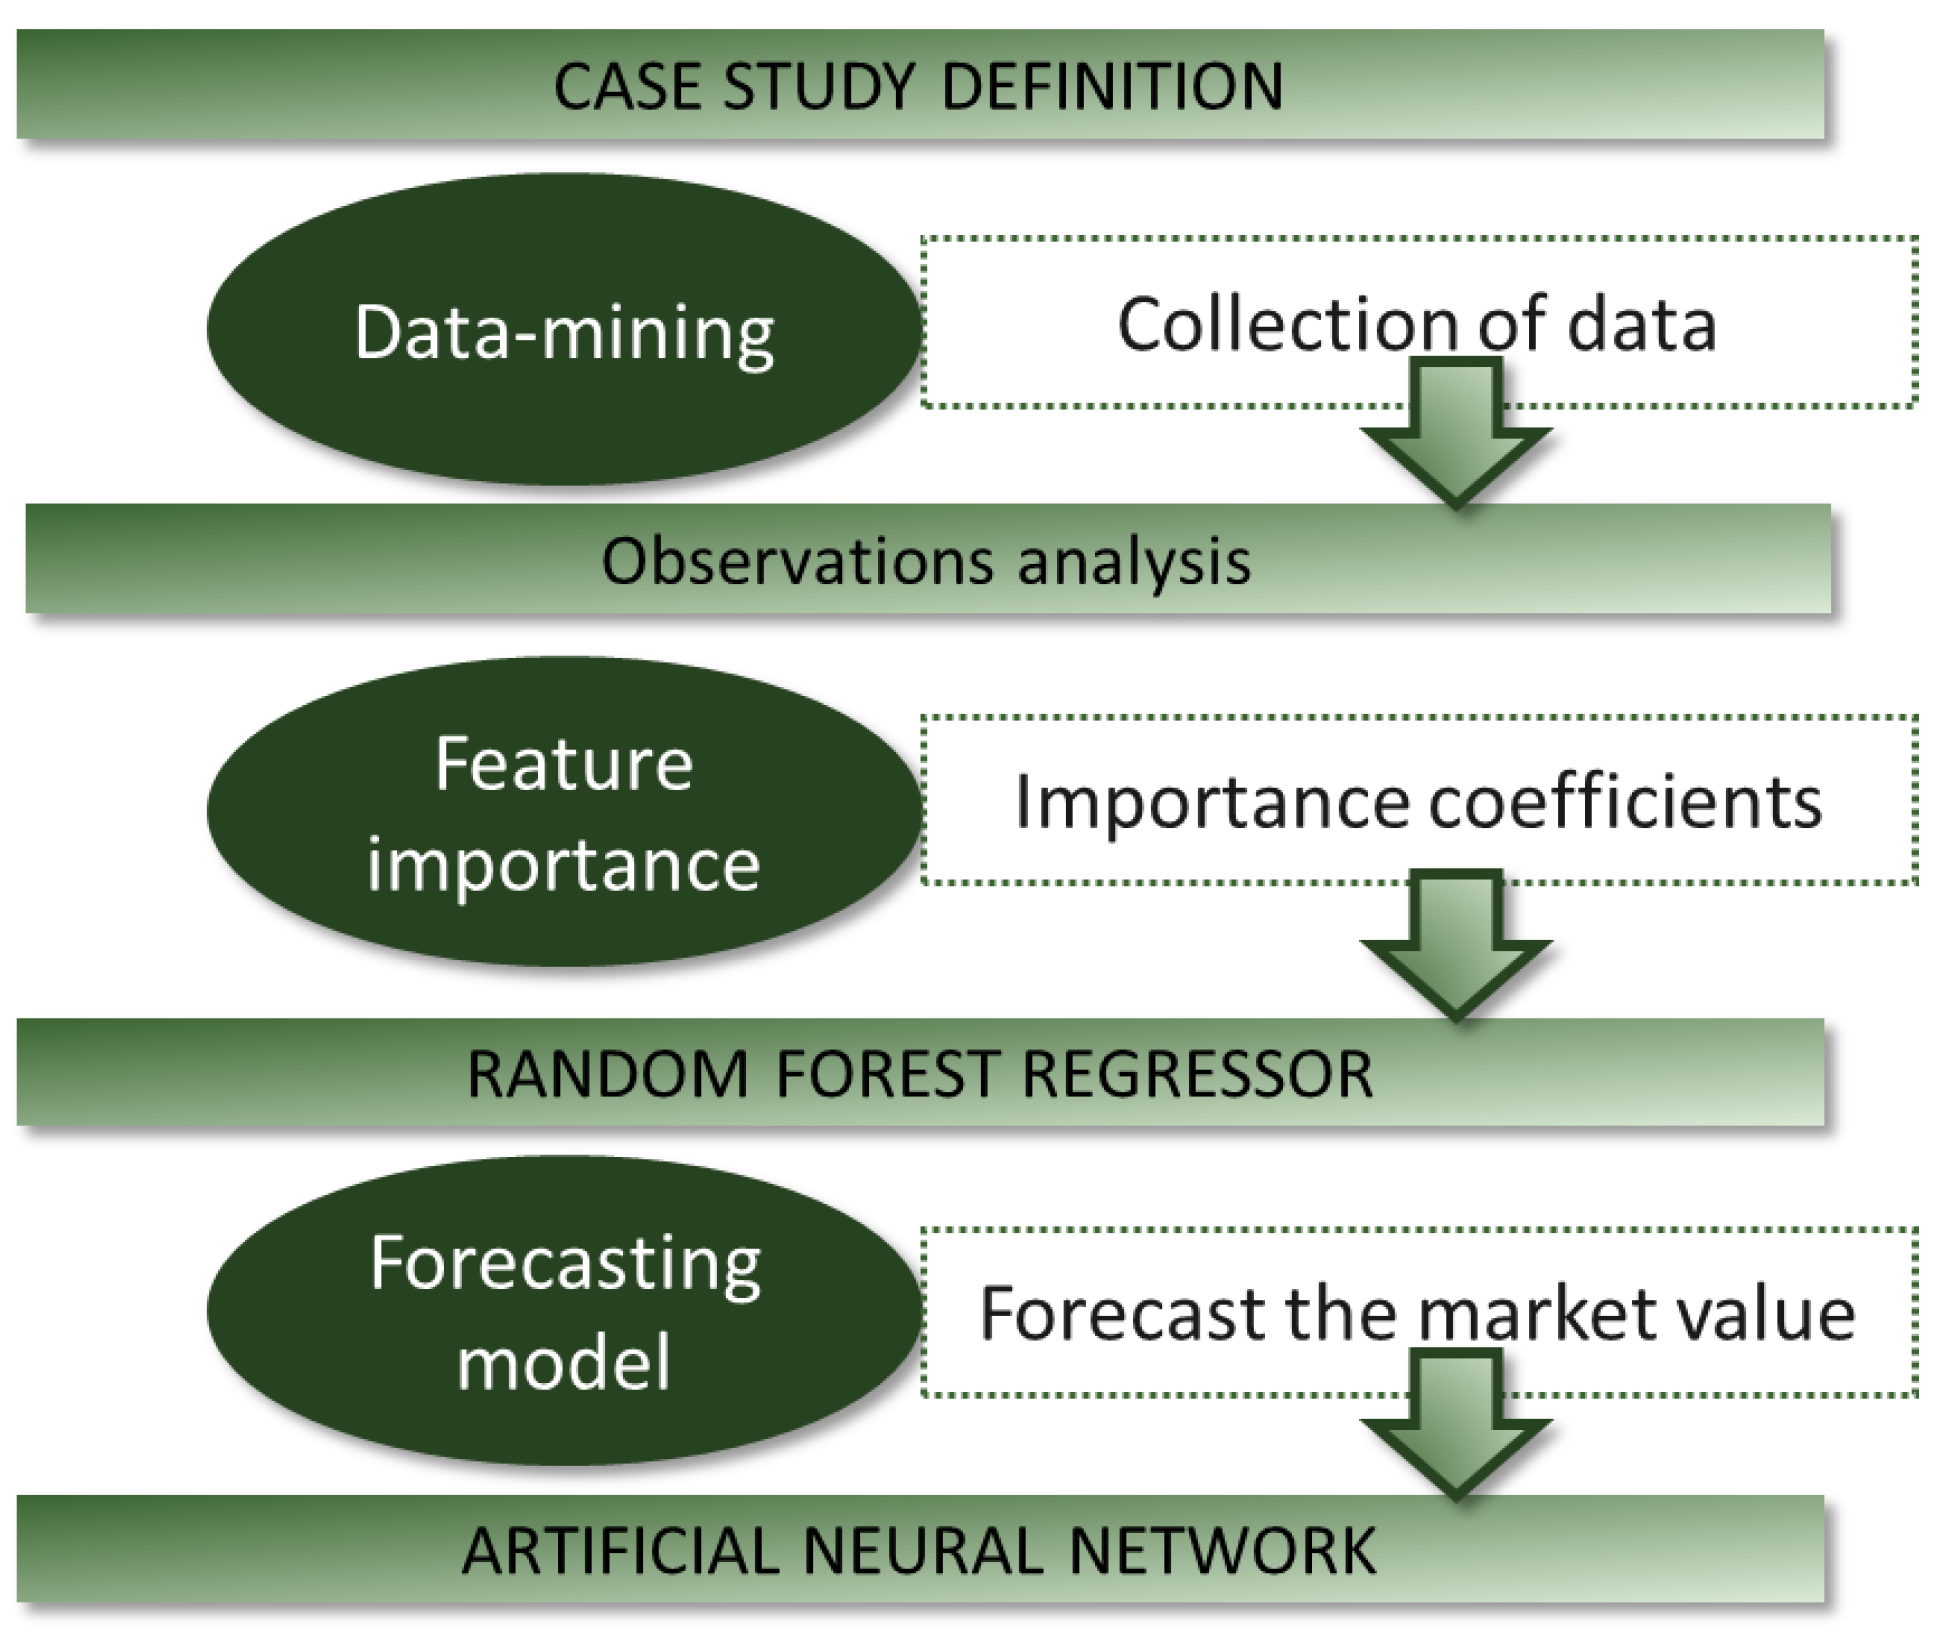
The proposed methodological approach is presented in Figure 2.
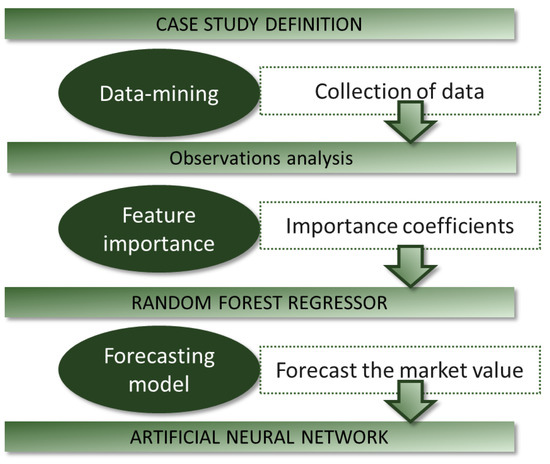
Figure 2.
Proposed research flow.
3. Case Study
3.1. Introducing the 13 Cities in Northern Italy
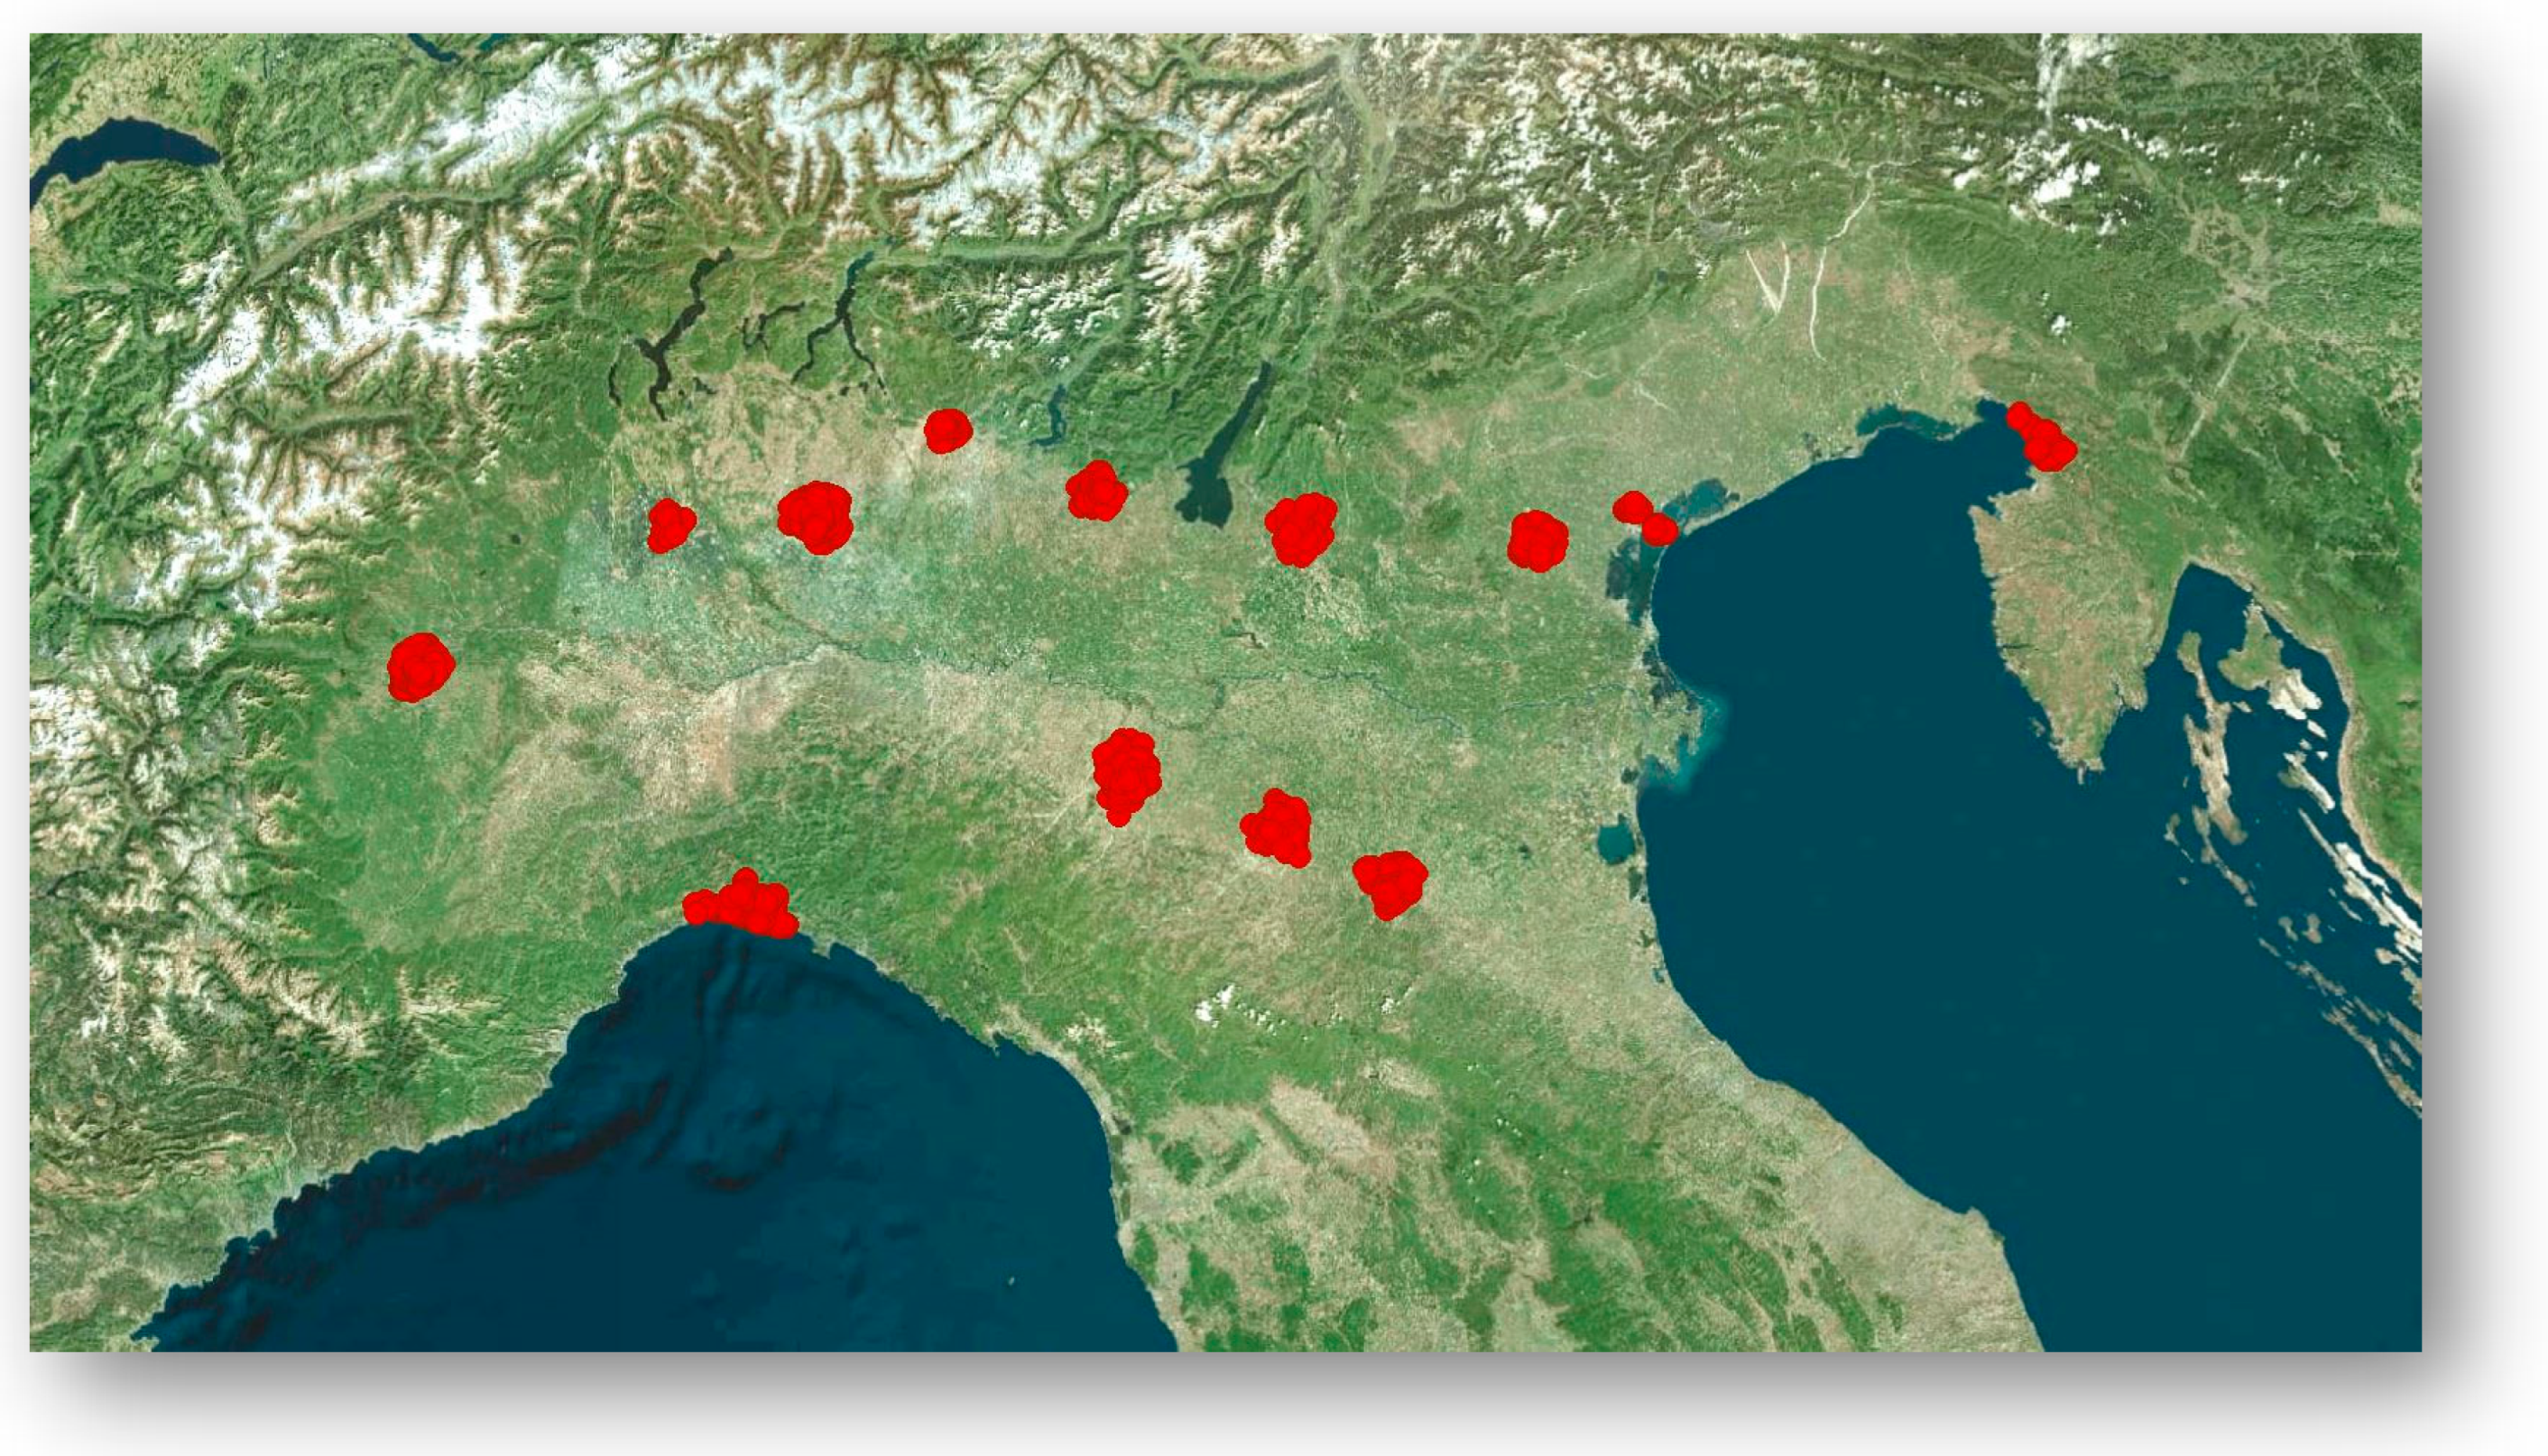
The 13 cities considered in this research paper are listed in Table 1, grouped by region, and the downloaded observations are graphically illustrated in Figure 3. The authors chose these cities as a representative case study because:

Table 1.
Demographic and climatic information about the 13 cities in North Italy.
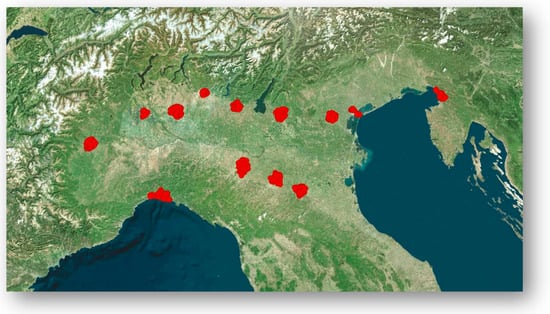
Figure 3.
Geographic localisation of the 13 cities in Northern Italy (downloaded observations in red).
- These cities are within the author’s operational territory so that they could better check the consistency of the data collected and the reliability of the results obtained.
- The authors have been following a broader research stream in the real estate field based on the constant monitoring of several markets in Northern Italy, recording data throughout the years, and discussing information availability and transparency [23,24]. Therefore, the opacity of these markets is deeply known and understood and consequently considered in this analysis.
- Within the considered regions, these 13 cities are the ones listed in the Nomisma Reports of large and medium cities in Italy, where Nomisma is an acknowledged consultancy firm operating in the field of applied economics, which is well known, in Italy, for its extensive research on the real estate market.
Table 1 reports some essential descriptive data of the 13 considered cities about demographics and climate. Such information is taken from the so-called “Atlante Statistico dei Comuni” (Statistical Atlas of Municipalities, ISTAT—Istituto Nazionale di Statistica [25] and from National Decree dPR 412/93 [26]. In addition, the following notes are added to better specify the data listed in Table 1:
- The data of columns “Population”, “Population density”, and “Number of residential buildings” refer to the latest census of the year 2011.
- The column “Pro-capita income” data are based on the latest data available for 2020.
- The column “Heating degree-days” data refer to a base temperature of 20 °C.
- The data for Venice-Mestre refer to Venice as a whole, here including both Venice-Mestre and the historical Centre of Venice, since only aggregate data are available from the sources. Venice-Mestre alone (i.e., the modern part of Venice) was considered in this study since it is more similar to the other cities. In contrast, the real estate market of the historical centre of Venice is considered very peculiar and affected by significant speculation effects.
As can be seen from Table 1, climate conditions are very similar for all cities but Genova, which has a slightly milder climate. Based on the EU Directive 2018/844 [27] (amending Directive 2010/31/EU on the energy performance of buildings [28] and Directive 2012/27/EU on energy efficiency [29]), however, the assessment of the energy class level depends on the climate. Hence, milder climates may reach good performance with lighter thermal insulation levels.
As far as income levels are concerned, other differences are present in the level of income, with Milan having a pro-capita income about 50% higher than Genova and Venice.
It should be noted that these demographic and climatic differences depending on the location of the cities are fully considered and accounted for by the developed ANN, which is a forecasting tool able to adequately modify its coefficients to follow all the site-specific conditions, producing tailored and reliable forecasts.
3.2. Defining of the Real Estate Market Segment
As introduced above, the case study involves the cities of Bologna, Modena, Parma, Trieste, Genova; Bergamo, Brescia, Milano, Novara, Torino, Padova, Venice-Mestre, and Verona. The domain of interest for this study is limited to residential buildings whose asking prices are known and available. The properties’ status ranges from new construction to poor maintenance conditions. Such real estate markets represent the major cities in Northern Italy, and even if every market clearly shows its peculiarities, certain patterns can be identified and discussed with the aid of the ANN model produced. A set of construction characteristics is considered for each property (observation), and the asking price is recorded.
Although this synchronic analysis of market values in different cities is based on comparing and discussing the characteristics of the buildings inside a forecasting model, a general diachronic introduction on market values must be addressed, brief though it may be.
This is a moment in history when the interaction between microeconomic and macroeconomic events is extremely strong because of the globally impactful events in the recent years of the COVID-19 pandemic [30] and the Ukraine war outbreak [31]. Several consequences have involved the financial [32,33,34] and energetic [35,36,37] sectors, with evident repercussions on the real estate sector, such as higher offer rigidity, changes in demand preferences, and increases in the costs of construction, therefore ultimately affecting property prices [38].
Generally, market quotations show that medium asking prices had slightly increased after the pandemic’s beginning, and this increment seems to be remaining constant from 2019 to 2023. Since this work is performed on the asking prices, the bargaining of negotiation is applied to the collected data, according to Table 2.

Table 2.
Bargaining of negotiation applied on asking prices (Nomisma archives).
4. Research Development and Results
4.1. Extensive Data Mining to Download Information
In order to develop an ANN capable of estimating the market value of a property according to the changes in its characteristics, such as, first and foremost, the energy class, it is necessary to have a sufficiently complete database of observations available to perform the training of the ANN model.
To accomplish this task, an automated web-parsing and data-downloading procedure is created in Python computer language. According to a search domain, the web crawler is sought to find out and analyse specific selling websites of real estate properties and download a predefined bundle of information per building. In particular, the Python libraries “urllib”, “Beautiful Soup”, and “Pandas” are integrated to parse HTML pages, identify the required data, and organise them into a structured database. The main actions performed by the web crawler are described here:
- A series of webpage addresses are composed, according to the grammar from various sites for announcement retrieval. This address-composition is made to avoid limitations on data retrieval due to typical restrictions in the number of search results provided by websites.
- Using the library “urllib”, each address is contacted, and the relevant research results are downloaded as a webpage with links to multiple results pages.
- For each page of research results, the contained announcements are downloaded.
- Using the library “BeautifulSoup”, each webpage with links is read, and each linked page of results is downloaded.
- The data read at each results page are organised within a database of search results pages using the library “Pandas”.
- Employing the library “BeautifulSoup”, each announcement is read, and the relevant data are retrieved and, using library “Pandas”, organised within a database, resuming all the significant information for all the announcements.
- Duplicates are removed through the definition of tolerances in the following parameters: “Latitude” (±0.0005°), “Longitude” (±0.0005°), “Price” (±7%), and “Floor area” (±10%).
As such, the data-mining process produces an output table where each row represents one observation (Ba), while the columns are the corresponding building’s features (Xia), namely “Latitude”, “Longitude”, “Type” (“Apartment”, “Single family villa”, “Penthouse”, “Terraced house”, “Two-family villa”, and “Multi-family villa”), “Floor Area”, ”N. Rooms”, “N. Bathrooms”, “Floor”, “Energy Class”, “Maintenance status”, “Lift”, “Private Garden”, “Shared Garden”, “Private Garage”, “Parking Space”, “Cellar”, “Terrace”, “Building Automation”, and “Central Heating”. Even though the focus of this paper is to show the correlation between the market value and the energy class, it is necessary to start by considering all the parameters that could take part in the definition of the property’s market value. If some parameters were not considered in the analysis, this could have contributed to fictitiously increasing the correlation between market values and energy classes.
According to the steps presented above, the data-mining process is applied to the 13 cities introduced in Section 3, leading to the collection of 15,345 observations. After the downloading, the first action on the data available consists of cleaning the information: outliers are removed, as well as observations with missing data.
Data cleaning is performed as follows:
- Removing records with “Floor Area” < 28 m2 or “Floor Area” > 600 m2.
- Removing records with “Unitary price” < 500 EUR/m2 or “Unitary Price” > 10,000 EUR/m2.
- Removing records with “Floor” < 0 or “Floor” > 20.
- Removing records with “N. Rooms” = 0 or “N. Rooms” > 20.
- Removing records with “N. Bathrooms” = 0 or “N. Bathrooms” > 6.
- Removing records with unavailable datum in any of the parameters.
After the cleaning procedure, 13,093 observations remain in the database; therefore, a/a, ∀ Ba, a ∈ ℕ, 1 ≤ a ≤ A ⋀ A = 13,093; i/i ∀ Xia, I ∈ ℕ, 1 ≤ I ≤ I ⋀ B = 23.
4.2. Feature Importance
At this stage, the feature importance analysis is performed on the remaining 13,093 observations to understand each feature’s impact on the output.
The feature importance analysis is carried out through the random forest (RF) procedure, a methodology that belongs to embedded approaches [39]. An RF is an ensemble classifier made up of multiple simple classifiers, i.e., the decision trees [40]. A random forest algorithm is implemented to calculate feature importance [41] to measure each input’s impact on the target variable (i.e., the unitary prices). An essential hyperparameter estimation is performed for the number of estimators (i.e., the number of trees constituting the random forest, as follows):
- The dataset is separated into X DataFrame (predictor variables) and Y DataFrame (target variable) using mere DataFrame slicing in “Pandas”.
- The rows of DataFrames X and Y are shuffled and split into Train DataFrames (i.e., X-Train and Y-Train) and Test DataFrames (i.e., X-Test and Y-Test), consisting of 80% and 20% (which are in the range of usual default values) of the dataset, respectively, by means of function “train_test_split” from “sklearn” library (module “model_selection”).
- Start values are set for the number of estimators (starting value: 100; maximum number: 2000), the sum of squares of feature importance (which could be named SSFI, with starting value: 1), and the RMSE (Root-Mean-Squared Error) on normalised Y (which could be named RMSE_ND, with starting value: 1000).
- The “while” cycle is started, which, at each iteration, adds 10 trees and starts the following calculation procedure:
- The random forest is set up by means of the function “RandomForestRegressor” from “sklearn” library (module “ensemble”) by setting the current number of estimators;
- The calculation of the feature importance is performed after fitting the dataset by means of function “fit”, within the regressor itself;
- The current SSFI is calculated;
- The current RMSE_ND is calculated on DataFrames Test-X- and Test-Y;
- The absolute value of the difference between the current value of SSFI and the previous one is calculated (SSFI_Diff);
- The value of the difference between the current value of RMSE_ND and the previous one is calculated (RMSE_ND_Diff).
- If SSFI_Diff < 0.01 and RMSE_ND_Diff < 0, the iteration stops.
Table 3 displays the RF importance coefficients per set of building characteristics: ∀ Xi → C(RF)i. Clearly, the greater the C(RF)i, the greater the impact of the characteristics on the output, and vice versa. In Table 3, the construction characteristics are the number of rooms and bathrooms, the floor level, and the presence/absence of a lift. Also, gardens, parking spaces, basements, terraces, or balconies are considered. Installations and plants refer instead to the presence or absence of building automation, heating systems, photovoltaic or solar panels, mechanical ventilation, or heat pumps.

Table 3.
RF coefficients.
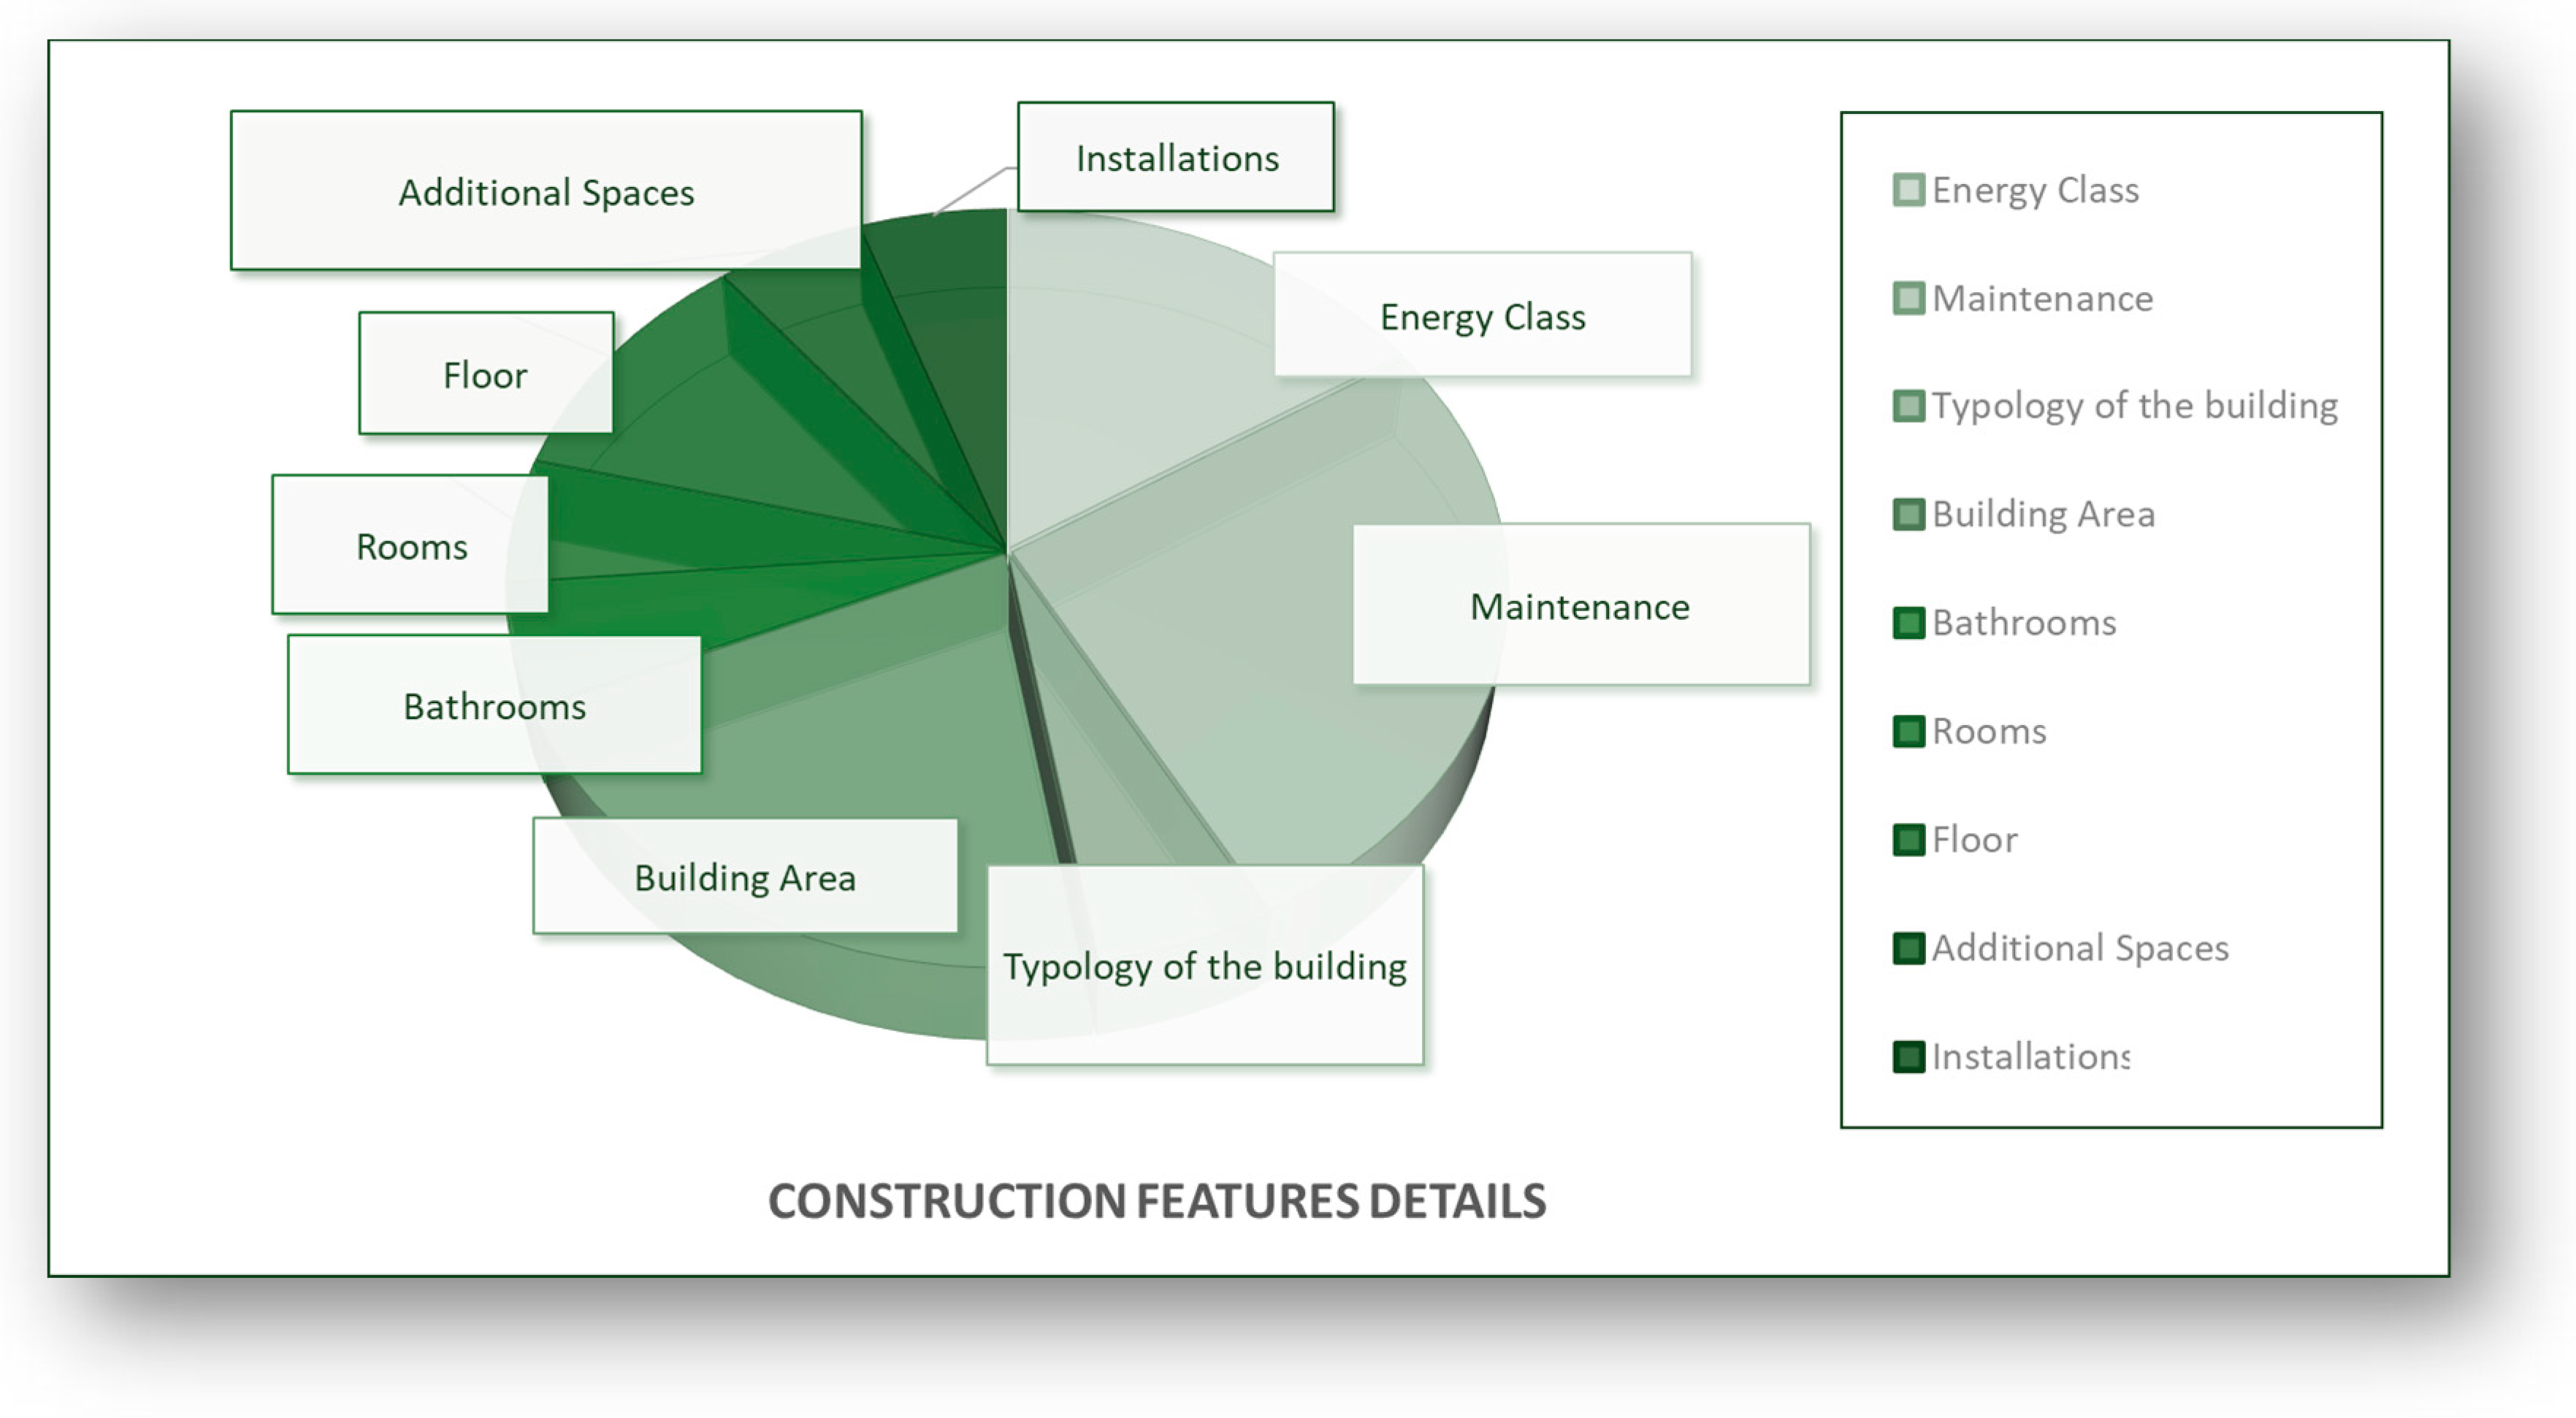
The results of the RF analysis show that the energy class significantly impacts market values. Since we are considering 13 different cities, the location of the buildings drives the pricing formation. Nevertheless, the energy performance (which includes the class and the maintenance level) strongly influences the feature importance analysis. The diagram in Figure 4 explores how the influence of the macro-categories of buildings’ construction/typology/energy/installation characteristics is divided. Here, the energy class, the maintenance level, and the floor area show a significant impact, leading to the choice of demand and consumer behaviour.
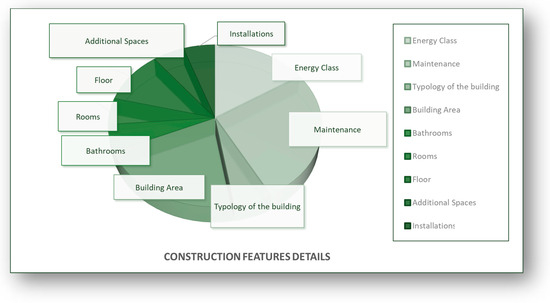
Figure 4.
Details of construction characteristics’ impact over market prices.
Also, illustrated by the C(P)i in Table 4, a Pearson coefficient analysis can integrate information about the input–output relationship. Specifically, the Pearson coefficients are analysed between the building’s characteristics and the unitary price (EUR/sqm). Positive values of the Pearson coefficient depict characteristics with a positive marginal impact on prices, whereas negative coefficients underline a negative marginal influence on unitary prices. Again, both energy class and maintenance level show a positive relationship with the market price.

Table 4.
Pearson correlation coefficients.
4.3. Neural Networks
The key output of this research is the development of an ANN that can forecast the market value of a property depending on the 23 characteristics considered, among which the most important are location and energy class. It is fundamental to specify that ANNs are architectures able to “learn” input–output relationships and transform them into “knowledge”, i.e., a forecasting model [42]. An ANN is a bio-inspired computational system constituted of computational units (the artificial neurons) and connections (artificial synapses). The first layer of neurons is called the input layer and is constituted by the input neurons. The output layer is the last layer of the ANN’s architecture, and it is made of the output neurons. For this research, the input neurons are the building’s features, among which there is the energy class, and the output neuron is the market value.
Given the selected input variables, an ANN is trained to assess the market value of a building based on positional and construction characteristics [43,44,45,46]. To train the ANN, 60% of the samples constitutes the training set (i.e., to compute the coefficients for the single ANN), 20% of the samples constitutes the testing set (i.e., to test the computed coefficients for the single ANN), and the remaining 20% of the samples acts as the selection set (i.e., to select the best ANN architecture) [47]. Developing the best ANN’s architecture is supported and optimised using a genetic optimisation algorithm (package “pymoo”).
The genetic optimisation algorithm guides towards the identification of the best configuration of hyperparameters, which consist of (with available values):
- Number of hidden layers (from 1 to 7);
- Number of nodes per hidden layer (from 8 to 200).
For each configuration of the hyperparameters, various seeds and batch sizes are used, resulting in corresponding ANNs (using package “keras”), and the best among them is selected. Meanwhile, the genetic optimisation algorithm guides the search for the best hyperparameter configuration by validating each ANN based on the selection dataset.
The following activation functions were used:
- In hidden layers: ReLU (Rectified Linear Unit);
- Output layer: Linear Activation Function.
A maximum number of 250 epochs was set.
As a result, the network’s input layer presents 23 input neurons. There are two levels of hidden layers, each displaying 150 neurons. Finally, there is one output layer with one output neuron, where the output neuron is the forecast of the property market value, measured in EUR/sqm. The activation functions used are logistics. The input neurons with the proper unit of measure are reported in Table 5. The average error produced on the outputs, assessed on the testing set using a cost function, is 0.09, ensuring the ANN’s high predictive capacity. The ANN created for this research enables us to experiment, test, and try out what impacts would bring different combinations of massive changes in energy classes at a stock level to market prices.

Table 5.
List of the ANN’s input neurons.
5. Discussion and Conclusions
In this research, the authors intended to analyse the relationship that links the energy performance of a building (in terms of energy class) and its market value. An integrated approach has been developed according to the following phases to reach this target.
- A significant case study has been selected in Northern Italy to conduct and test the research project. The case study involved 13 cities in Lombardia, Piemonte, Emilia-Romagna, Friuli-Venezia Giulia, Veneto, and Trentino alto Adige.
- An extensive data-mining procedure has been developed in Python computer language to parse real estate selling websites and download information. A database of 13,093 observations was therefore collected. Specifically, each observation provided data about the building’s position (latitude and longitude), construction features (such as floor area, energy class, typology, and others), and the property’s asking price (EUR/sqm).
- After the asking prices were adjusted with the barging of negotiations, a feature importance analysis was then applied to the database using a random forest regressor and the Pearson correlation coefficients.
- After that, an Artificial Neural Network was trained on the downloaded database to produce a forecasting model of properties’ market values as a function of the buildings’ position and construction characteristics. Particular attention was given to understanding the energy classes’ impact on market prices.
The energy class positively impacts the market value, with a C(RF) of 8% if all the inputs are considered or 42,1% if the RF calculation excludes the location.
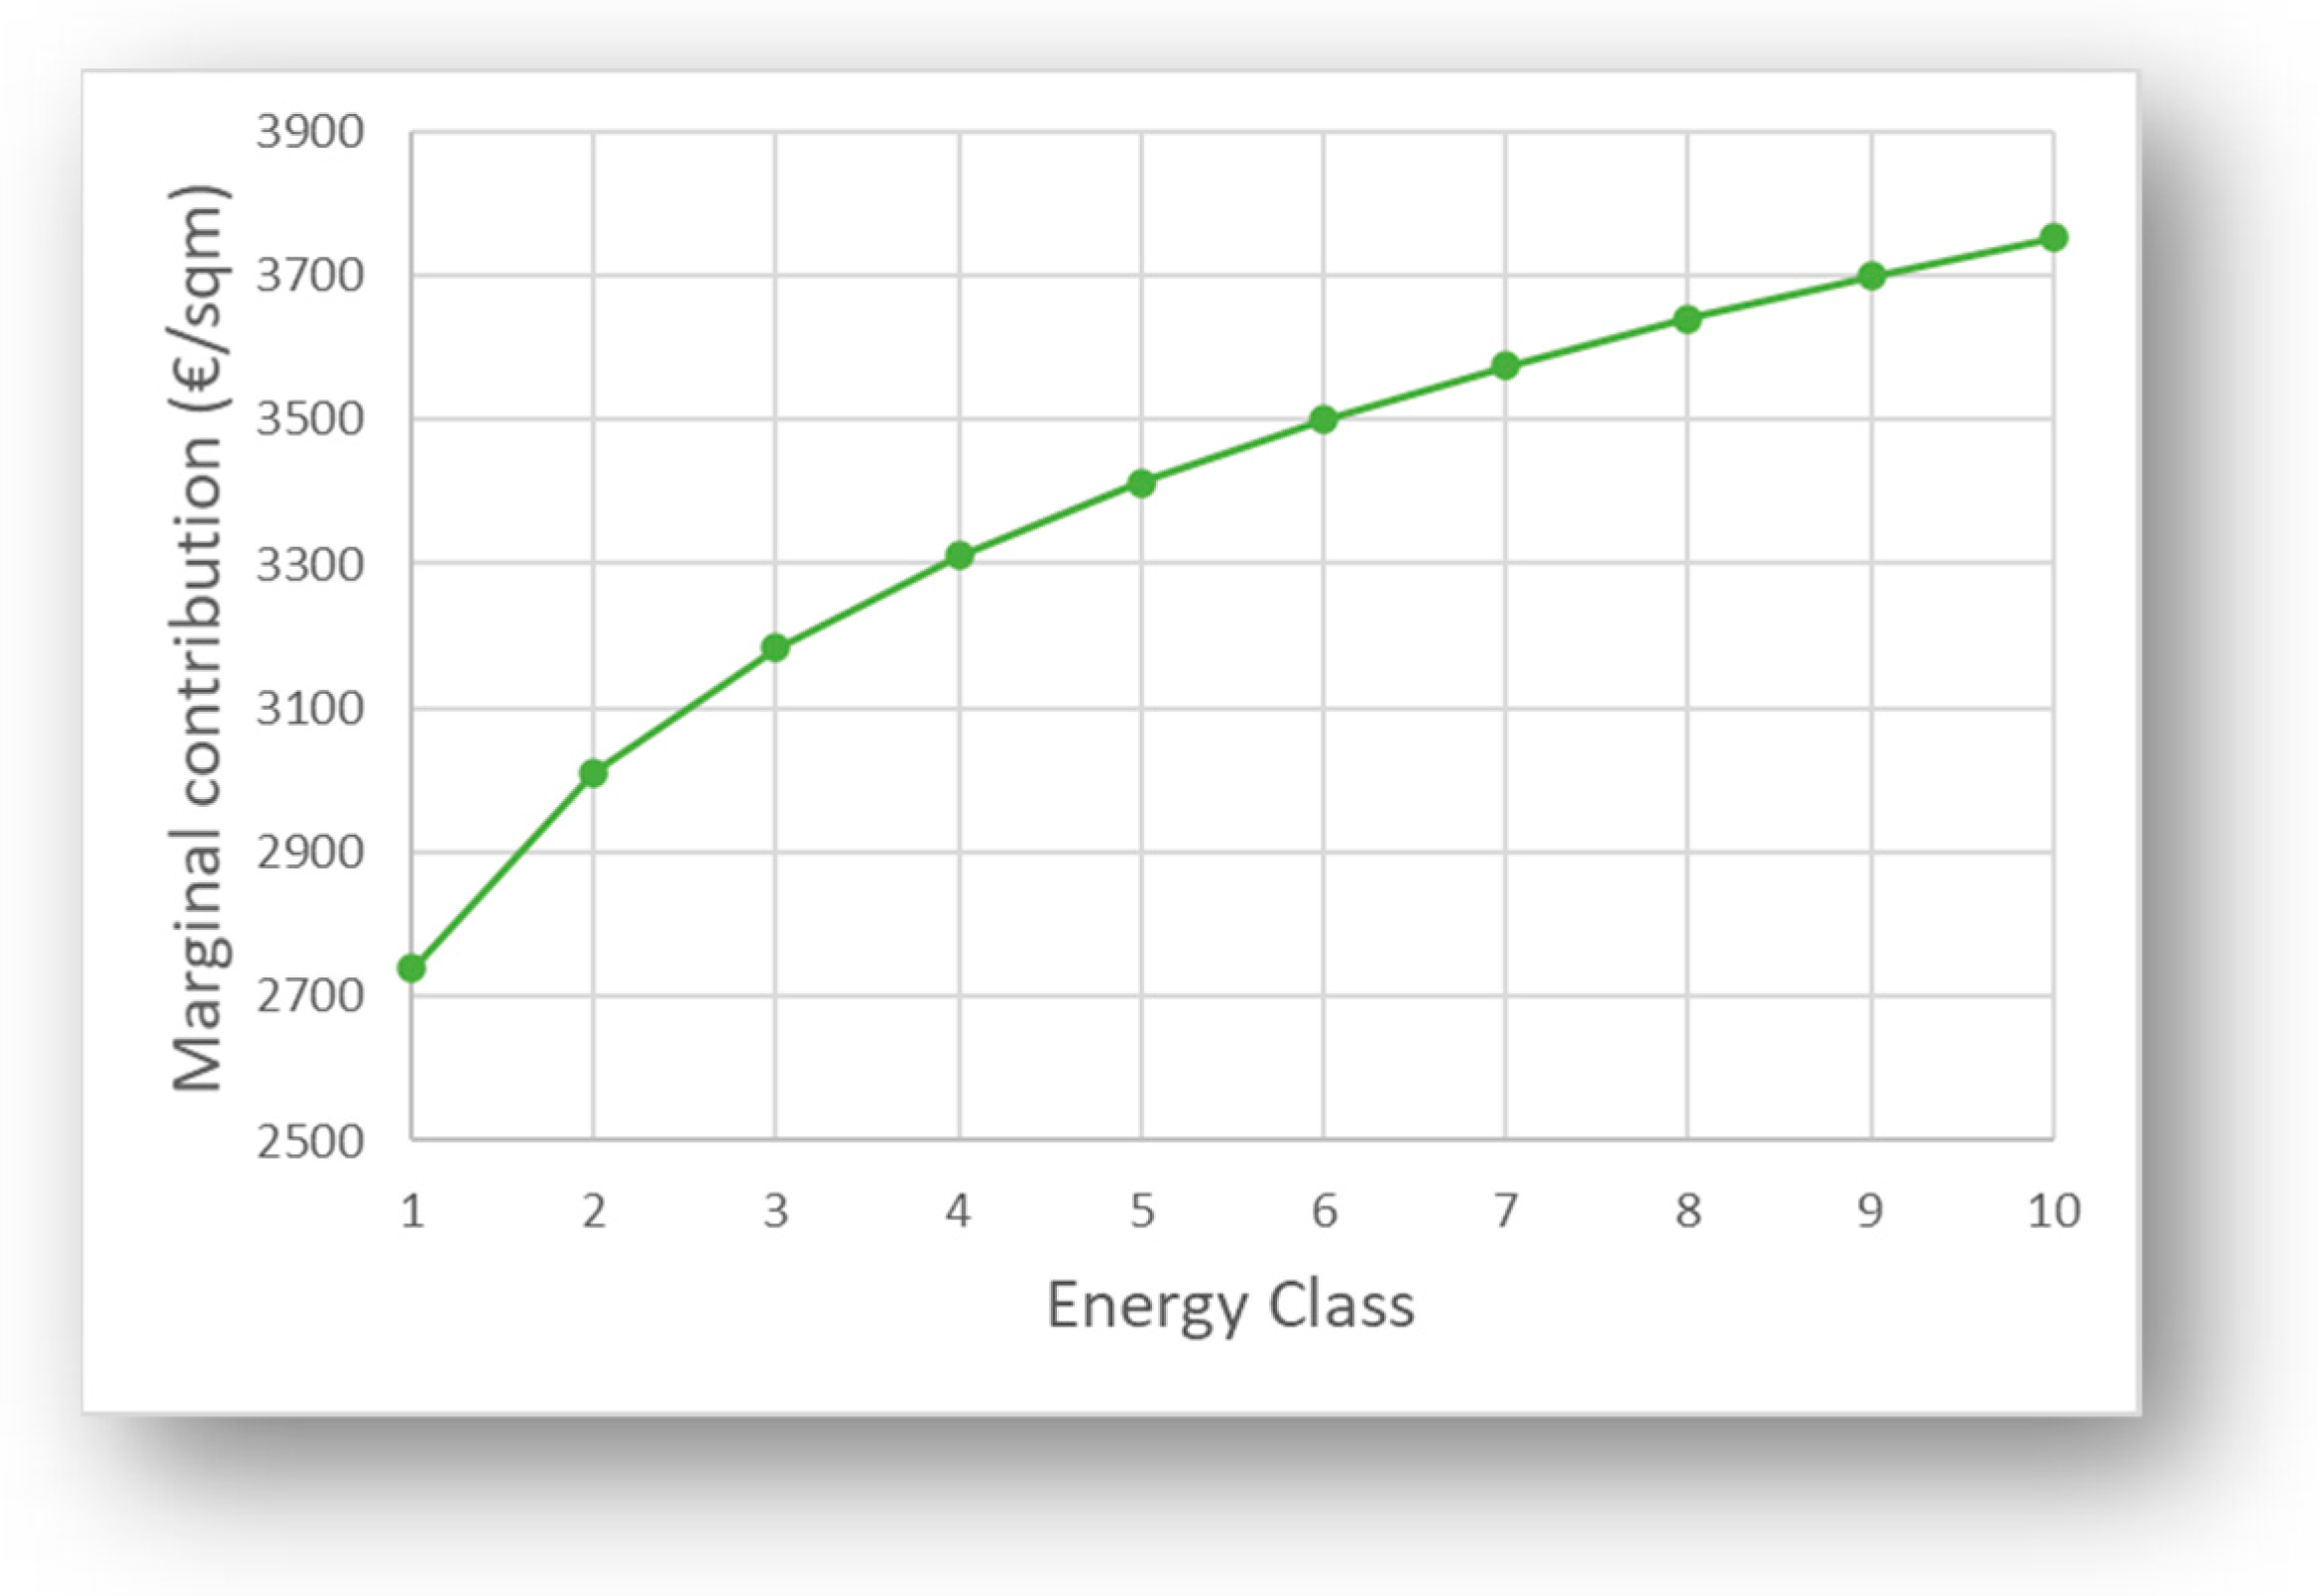
The C(P) is instead 8.54%. Figure 5 represents the functional link related to the marginal increase in market values as the energy class increases from 1 to 10 (i.e., from G to A4).
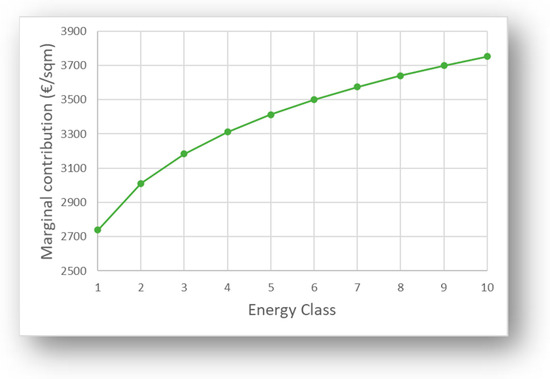
Figure 5.
Functional relationship between market value and energy class.
As can be seen, a general increase in the energy class of a building corresponds to an increase in its unitary price. This marginal increase is higher when the jump from one class to the following regards the lowest classes (G, F, E), while the marginal increase is slighter when the most performing energy classes are involved (A4, A3, A2, A1, B). Indeed, improving the energy efficiency of building stocks is becoming increasingly crucial to ensure investments’ environmental and economic sustainability.
Already today, the analyses carried out in this study identify a substantial impact on the price of a building due to its energy performance level. Nevertheless, it is easy to imagine that this impact will grow exponentially if specific laws are applied, like the previously discussed Green Homes Directive.
In conclusion, this research was intended to open the debate on the importance of energy classes in estimating the market values of buildings. The result of this research should be intended as a starting point for the joint analysis of the valuation discipline inside energy retrofit programs of broad real estate assets. The tool developed could help experiment with different scenarios depending on the implementation of various laws, regulations, and energy efficiency projects.
In fact, among the most important strengths of this research project, there are:
- The development of a highly flexible forecasting tool for the market value of a property depending on a multiplicity of features of the buildings.
- The direct link between the marginal increase in the market value and the respective enhancement in the energy class.
- The inclusion of different markets located in Northern Italy and the development of an ANN based on a considerable number of observations were possible due to the extensive data mining process.
On the other hand, the research limitations should also be made explicit in this context to outline future possible research development and enhancement areas. One limitation of this research is linked to the geographical limits of the data-collecting procedure. The authors intend to extend the data mining to the Italian territory to expand the analysis to different markets and other climatic areas. Another limitation of the present study can be identified in the lack of a practical application on a given stock of buildings in order to assess the whole increase in the stock value as a consequence of a specific retrofit project. Therefore, in further developing this research line, the authors intend to use the tools developed to test energy retrofit programs at the city scale in terms of overall market value changes. Another limitation can regard the forecasting tool development: even though the errors in the forecasts are minor, other calculation processes may be experimented with to see whether the inferential properties can still be improved. In the next steps of this research, recurrent feature selection and cross-validation will be integrated into the calculation procedure for random forest and ANN hyperparameter assessment.
Author Contributions
Conceptualization: A.G.R.; methodology: A.G.R., L.G., M.S. and G.M.; software: A.G.R. and M.S.; validation: A.G.R., L.G., M.S. and G.M.; formal analysis: A.G.R., L.G., M.S. and G.M.; investigation: A.G.R., L.G. and M.S.; resources: A.G.R., L.G. and M.S.; data curation: A.G.R., L.G. and M.S.; writing—original draft preparation: A.G.R.; writing—review and editing: A.G.R., L.G., M.S. and G.M.; visualization: A.G.R.; supervision: L.G., M.S. and G.M. All authors have read and agreed to the published version of the manuscript.
Funding
This research received no external funding.
Data Availability Statement
Data not available for public use due to privacy restrictions.
Conflicts of Interest
The authors declare no conflict of interest.
References
- Li, W.; Zhou, Y.; Cetin, K.; Eom, J.; Wang, Y.; Chen, G.; Zhang, X. Modeling urban building energy use: A review of modeling approaches and procedures. Energy 2017, 141, 2445–2457. [Google Scholar] [CrossRef]
- Sartori, I.; Hestnes, A.G. Energy use in the life cycle of conventional and low-energy buildings: A review article. Energy Build. 2007, 39, 249–257. [Google Scholar] [CrossRef]
- Ingrao, C.; Messineo, A.; Beltramo, R.; Yigitcanlar, T.; Ioppolo, G. How can life cycle thinking support sustainability of buildings? Investigating life cycle assessment applications for energy efficiency and environmental performance. J. Clean. Prod. 2018, 201, 556–569. [Google Scholar] [CrossRef]
- Mangan, S.D.; Oral, G.K. A Study on Life Cycle Assessment of Energy Retrofit Strategies for Residential Buildings in Turkey. In Proceedings of the 6th International Building Physics Conference, IBPC 2015, Torino, Italy, 14–17 June 2015; Volume 78, pp. 842–847. [Google Scholar]
- Barthelmes, V.M.; Becchio, C.; Bottero, M.; Corgnati, S.P. Cost-optimal analysis for the definition of energy design strategies: The case of a Nearly-Zero Energy Building. Valori E Valutazioni 2016, 16, 57–70. [Google Scholar]
- Gabrielli, L.; Ruggeri, A.G. Optimal design in energy retrofit interventions on building stocks: A decision support system. Green Energy Technol. 2021, 231–248. [Google Scholar] [CrossRef]
- Carbonara, G. Energy efficiency as a protection tool. Energy Build. 2015, 95, 9–12. [Google Scholar] [CrossRef]
- De Souza, L.C.L.; Yamaguti, M.L. Orientation, Building Height and Sky View Factor as Energy Efficiency Design Parameters. In Proceedings of the 24th International conference on Passive and Low Energy Architecture (PLEA 2007), Singapore, 22–24 November 2007; pp. 296–301. [Google Scholar]
- Ha, P.T.H. Energy Efficiency Façade Design in High-Rise Apartment Buildings using the Calculation of Solar Heat Transfer through Windows with Shading Devices. In Proceedings of the 2nd International Conference on Sustainable Development in Civil, Urban and Transportation Engineering CUTE 2018 OP Conference Series: Earth and Environmental Science, Ho Chi Minh City, Vietnam, 17–19 April 2018; Volume 143. [Google Scholar]
- Far, C.; Far, H. Improving energy efficiency of existing residential buildings using effective thermal retrofit of building envelope. Indoor Built Environ. 2018, 28, 744–760. [Google Scholar] [CrossRef]
- Seifhashem, M.; Capra, B.R.; Milller, W.; Bell, J. The potential for cool roofs to improve the energy efficiency of single storey warehouse-type retail buildings in Australia: A simulation case study. Energy Build. 2018, 158, 1393–1403. [Google Scholar] [CrossRef]
- Ahmad, T.; Chen, H.; Guo, Y.; Wang, J. A comprehensive overview on the data driven and large scale based approaches for forecasting of building energy demand: A review. Energy Build. 2018, 165, 301–320. [Google Scholar] [CrossRef]
- Swan, L.G.; Ugursal, V.I. Modeling of end-use energy consumption in the residential sector: A review of modeling techniques. Renew. Sustain. Energy Rev. 2009, 13, 1819–1835. [Google Scholar] [CrossRef]
- Bienvenido-Huertas, D.; Sánchez-García, D.; Marín-García, D.; Rubio-Bellido, C. Analysing energy poverty in warm climate zones in Spain through artificial intelligence. J. Build. Eng. 2023, 68, 106116. [Google Scholar] [CrossRef]
- Wang, A.; Xu, Y. Multiple Linear Regression Analysis of Real Estate Price. In Proceedings of the International Conference on Robots and Intelligent System, ICRIS 2018, Changsha, China, 21–23 February 2018; pp. 564–568. [Google Scholar]
- Feng, J.; Zhu, J. Nonlinear regression model and option analysis of real estate price. Dalian Ligong Daxue Xuebao/J. Dalian Univ. Technol. 2017, 57, 545–550. [Google Scholar] [CrossRef]
- Kiel, K.; Zabel, J. Location, location, location: The 3L Approach to house price determination. J. Hous. Econ. 2008, 17, 175–190. [Google Scholar] [CrossRef]
- Heyman, A.V.; Sommervoll, D.E. House prices and relative location. Cities 2019, 95, 102373. [Google Scholar] [CrossRef]
- Brueckner, J.K.; Thisse, J.F.; Zenou, Y. Why is central Paris rich and downtown Detroit poor? An amenity-based theory. Eur. Econ. Rev. 1999, 43, 91–107. [Google Scholar] [CrossRef]
- Simonotti, M. Metodi di Stima Immobiliare; Flaccovio: Palermo, Italy, 2006. [Google Scholar]
- Tajani, F.; Morano, P.; Di Liddo, F.; Doko, E. A Model for the Assessment of the Economic Benefits Associated with Energy Retrofit Interventions: An Application to Existing Buildings in the Italian Territory. Appl. Sci. 2022, 12, 3385. [Google Scholar] [CrossRef]
- European Commission. La Direttiva Europea 2018/844 che modifica l’ EPBD; European Commission: Brussels, Belgium, 2018; pp. 1–20. [Google Scholar]
- Gabrielli, L.; Ruggeri, A.G.; Scarpa, M. How COVID-19 Pandemic Has Affected the Market Value According to Multi-parametric Methods. Lect. Notes Netw. Syst. 2022, 482, 1018–1027. [Google Scholar]
- Gabrielli, L.; Ruggeri, A.G.; Scarpa, M. Using Artificial Neural Networks to Uncover Real Estate Market Transparency: The Market Value. In Lecture Notes in Computer Science, Proceedings of the International Conference on Computational Science and Its Applications, Cagliari, Italy, 13–16 September 2021; Gervasi, O., Murgante, B., Misra, S., Garau, C., Blečić, I., Taniar, D., Apduhan, B.O., Rocha, A.M.A.C., Tarantino, E., Torre, C.M., Eds.; Springer International Publishing: Cham, Switzerland, 2021; Volume 12954, pp. 183–192. [Google Scholar]
- Istituto Nazionale di Statistica. Available online: https://asc.istat.it/ASC/ (accessed on 10 November 2023).
- D.P.R. 26-8-1993 n. 412 Regolamento recante norme per la progettazione, l’installazione, l’esercizio e la manutenzione degli impianti termici degli edifici ai fini del contenimento dei consumi di energia, in attuazione dell’art. 4, comma 4, della L. 9 gen.
- EU. European Parliament Directive (EU) 2018/844 of the European Parliament and of the council of 30th May 2018 amending Directive 2010/31/EU on the energy performance of buildings and Directive 2012/27/EU on energy efficiency. Off. J. Eur. Union 2018, 2018, 75–91. [Google Scholar]
- EU. European Parliament Directive 2010/31/EU of the European Parliament and of the Council of 19 May 2010 on the Energy Performance of Buildings. Off. J. Eur. Union 2010, 53, 13–35. [Google Scholar] [CrossRef]
- EU. European Parliament Directive 2012/27/EU of the European Parliament and of the Council of 25 October 2012 on Energy Efficiency, amending Directives 2009/125/EC and 2010/30/EU and repealing Directives 2004/8/EC and 2006/32/EC. Off. J. Eur. Union 2012, 55, 1–56. [Google Scholar] [CrossRef]
- World Health Organization. Available online: https://www.who.int/ (accessed on 15 October 2021).
- ANSA Ucraina: La Cronaca, Dall’attacco Alla Chiamata Alle Armi. Alle 4:13 la Notizia di Esplosioni a Kiev, Poi in Rapida Sequenza in Altre Città. Available online: https://www.ansa.it/sito/notizie/mondo/2022/02/24/ucraina-la-cronaca-dallattacco-alla-grande-fuga_3bba3244-a42c-4210-8d41-83c584236fa8.html (accessed on 30 August 2023).
- Markus, S. Long-term business implications of Russia’s war in Ukraine. Asian Bus. Manag. 2022, 21, 483–487. [Google Scholar] [CrossRef]
- Zahra, S.A. Institutional Change and International Entrepreneurship after the War in Ukraine. Br. J. Manag. 2022, 33, 1689–1693. [Google Scholar] [CrossRef]
- Wang, Y.; Bouri, E.; Fareed, Z.; Dai, Y. Geopolitical risk and the systemic risk in the commodity markets under the war in Ukraine. Financ. Res. Lett. 2022, 49, 103066. [Google Scholar] [CrossRef]
- Steffen, B.; Patt, A. A historical turning point? Early evidence on how the Russia-Ukraine war changes public support for clean energy policies. Energy Res. Soc. Sci. 2022, 91, 102758. [Google Scholar] [CrossRef]
- Rawtani, D.; Gupta, G.; Khatri, N.; Rao, P.K.; Hussain, C.M. Environmental damages due to war in Ukraine: A perspective. Sci. Total Environ. 2022, 850, 157932. [Google Scholar] [CrossRef]
- Zhou, X.-Y.; Lu, G.; Xu, Z.; Yan, X.; Khu, S.-T.; Yang, J.; Zhao, J. Influence of Russia-Ukraine War on the Global Energy and Food Security. Resour. Conserv. Recycl. 2023, 188, 106657. [Google Scholar] [CrossRef]
- Khrais, L.T.; Shidwan, O.S. The role of neural network for estimating real estate prices value in post COVID-19: A case of the middle east market. Int. J. Electr. Comput. Eng. 2023, 13, 4516–4525. [Google Scholar] [CrossRef]
- Tatwani, S.; Kumar, E. Parametric comparison of various feature selection techniques. J. Adv. Res. Dyn. Control Syst. 2019, 11, 1180–1190. [Google Scholar] [CrossRef]
- Ugolini, M. Metodologie di Apprendimento Automatico Applicate alla Generazione di dati 3d. 2014, pp. 1–49. Available online: https://amslaurea.unibo.it/10415/1/Metodologie_di_apprendime.pdf (accessed on 30 August 2023).
- Siham, A.; Sara, S.; Abdellah, A. Feature Selection Based on Machine Learning for Credit Scoring: An Evaluation of Filter and Embedded Methods. In Proceedings of the 2021 International Conference on INnovations in Intelligent SysTems and Applications, INISTA 2021—Proceedings, Kocaeli, Turkey, 25–27 August 2021; Hassan II University of Casablanca, Networks, Telecoms and Multimedia LIM@II-FSTM: Mohammedia, Morocco, 2021. [Google Scholar]
- Ćetković, J.; Lakić, S.; Lazarevska, M.; Žarković, M.; Vujošević, S.; Cvijović, J.; Gogić, M. Assessment of the Real Estate Market Value in the European Market by Artificial Neural Networks Application. Complexity 2018, 2018, 1472957. [Google Scholar] [CrossRef]
- Nikolov, V. A Neural Network Based Approach for Estimation of Real Estate Prices. In Lecture Notes in Networks and Systems, Proceedings of the Future of Information and Communication Conference, Athens, Greece, 28–29 September 2023; Springer: Cham, Switzerland, 2023; Volume 652, pp. 474–481. [Google Scholar]
- Maselli, G. Evaluating the Impact of Urban Renewal on the Residential Real Estate Market: Artificial Neural Networks versus Multiple Regression Analysis. In Lecture Notes in Networks and Systems, Proceedings of the International Symposium: New Metropolitan Perspectives, Reggio Calabria, Italy, 24–26 May 2022; Springer: Cham, Switzerland, 2022; Volume 482, pp. 702–712. [Google Scholar]
- Du, B.; Wang, Y. Real Estate Price Evaluation System Based on BP Neural Network Algorithm. In Lecture Notes in Electrical Engineering, Proceedings of the International Conference on Frontier Computing; Springer: Singapore, 2023; Volume 1031, pp. 553–561. [Google Scholar]
- Mostofi, F.; Toǧan, V.; Başaǧa, H.B. Real-estate price prediction with deep neural network and principal component analysis. Organ. Technol. Manag. Constr. 2022, 14, 2741–2759. [Google Scholar] [CrossRef]
- Valier, A. Who performs better? AVMs vs. hedonic models. J. Prop. Invest Financ. 2020, 38, 213–225. [Google Scholar] [CrossRef]
Disclaimer/Publisher’s Note: The statements, opinions and data contained in all publications are solely those of the individual author(s) and contributor(s) and not of MDPI and/or the editor(s). MDPI and/or the editor(s) disclaim responsibility for any injury to people or property resulting from any ideas, methods, instructions or products referred to in the content. |
© 2023 by the authors. Licensee MDPI, Basel, Switzerland. This article is an open access article distributed under the terms and conditions of the Creative Commons Attribution (CC BY) license (https://creativecommons.org/licenses/by/4.0/).

