Abstract
A new finite element (FE) model was constructed with ABAQUS, and the applicability of the model was verified by the coincidence with typical damage modes and load-compression curves in the tests, and the axial compression performance of the precast circular semi-continuous concrete-filled steel tube (PCSCFST) columns was investigated. The effects of diameter-thickness ratio, slenderness ratio, yield strength, etc. on the axial compression performance of the PCSCFST columns were investigated by parametric analysis. The changes in slenderness ratio, yield strength and diameter-thickness ratio of the upper and lower steel tubes have obvious effects on the bearing capacity of the specimen, while the changes in bolt diameter and diameter-thickness ratio of the outer steel tube have little effects on the bearing capacity. In particular, the diameter ratio of bolt to steel tube (d/D) increases to 1/10, the bearing capacity increases slightly, the ratio (d/D) continues to increase until the bearing capacity decreases slightly, and the bearing capacity appears to increase significantly after the ratio (d/D) reaches 1/7; the yield strength ratio of bolt to upper and lower steel tube (fyb/fy1) increases from 1 to 2, the bearing capacity decreases slightly, and the bearing capacity increases significantly when the ratio (fyb/fy1) reaches about 2. After that, the change is minimal. In addition, a theoretical model was developed to predict the ultimate bearing capacity of the PCSCFST columns, and a close correlation was found between the FE simulation results and the theoretical model. The mean ratio of the FE ultimate load Nu,FE to the predicted ultimate load Nu,pre was 1.006 with a standard deviation of 0.0389.
1. Introduction
It is well-known that due to the good combination of core concrete and steel tube, the core concrete in such an object is in a triaxial compression state, which makes the concrete-filled steel tube (CFST) have advantages in ductility and strength. In addition, the phenomenon that the lateral restraint provided by the lateral reinforcement for the brittleness behavior of ultra-high strength concrete (UHSC) will be weakened due to the excessive strength of concrete can also be optimized by CSFT columns [1,2]. In order to make the concrete in the CFST column better laterally confined by the steel tube and further improve the member performance, the structural performance of many forms of CFST column has been studied. The performance of square, oval and other shaped steel tubes and concrete have been gradually investigated [3,4,5,6,7,8,9]. The compression performance and bond strength of concrete-filled double skin steel tubes (CFDST) under the influence of various parameters are explored [10,11,12].
For further improving the mechanical properties of CFST, some means of enhancing the steel tube confinement effect have been explored. Li et al. [13] revealed that adding steel fiber can enhance the ultimate load of CFST column with self-stress, and slightly improve its post-peak performance and ductility. Liu et al. [14] conducted experimental study and finite element analysis (FAE) on the bending and eccentric compression performance of PBL stiffened concrete-filled square steel tubular (CFSST) beams-columns. The conclusion that stiffener can significantly improve the mechanical properties of CFST specimens was presented. Considering the nonlinearity of concrete and aluminum materials and the interaction between them, a finite element model to study the axial compression performance of circular concrete-filled aluminum tubular (CFAT) stub columns was developed by Wang et al. [15]. In addition, a cyclic load test study of 2 full-scale stirrup cage restrained circular steel tube concrete columns and 3 full-scale stirrup cages confined CFST columns under high axial pressure low-cycle fatigue horizontal loads by Ding et al. [16]. Uniaxial compression tests were carried out on 62 CFST columns with different sizes to verify that confinement in the form of rings, which was proposed by Lai et al., can restrict the elastic lateral dilation of concrete [17]. It demonstrated that the rings can not only effectively limit the lateral deformation of concrete and steel tubes, but also improve the axial bearing capacity and stiffness, and reduce the rate of strength degradation, and that the optimal analysis model proposed by Lai et al. is highly valid. By designing and testing, Zhang et al. found that adding bolts in rectangular CFST columns can effectively improve the deformation of local buckling on the wide side of the steel tube [18].
FEA is often considered an excellent method for academic investigations to verify experimental results [19,20], refine parametric analysis [21,22], analyze stress–strain relationships [23] and so on. In recent years, ABAQUS is often used to explore the structural behaviors of CFST of different materials due to its superior material properties [24,25,26]. Even the computer program, as a means of checking, has been introduced into some finite element studies of CFST [27]. In addition, a lot of research attention has been focused on the derivation of program theory, which is particularly important in the research process. Lai et al. [28,29] compared the results predicted by the proposed theoretical stress–strain model for predicting the uniaxial performance of CFST columns with the experimental database assembled to verify the accuracy of the model. The concrete constitutive relationship based on the separation model proposed by Yin et al. [30] is reasonable, indicating that the model can be used to assist multi-cell concrete-filled steel tube (MCFST) design. Many theoretical models for enhancing structural performance by increasing the confinement effect have also been explored [31,32,33,34,35].
The PCSCFST column was created to further improve the mechanical properties of the structure and to incorporate the concept of assembly that contributes to environmental protection. The assembly combination of the components of the specimen demonstrates the assembly concept, with the bushings and bolts serving to further enhance the mechanical properties of the structure. In this study, the behavior of the PCSCFST columns subjected to the axial load was investigated numerically using a finite element model validated by ABAQUS [36], the upper steel tube and the lower steel tube were assembled after the core concrete was poured by using the outer steel tube and bolts, which had been reported meticulously [37]. The experimental data previously presented by Cao [37] were used to evaluate the FE model proposed in this study. The FE model is then used to conduct a parametric study to investigate the parameters that have a significant effect on the behavior of the PCSCFST columns. At the same time, to improve the test due to production errors, accidental errors and other factors that lead to incomplete analysis of parameters and further analysis of structural mechanical properties.
2. Description of Previous Test
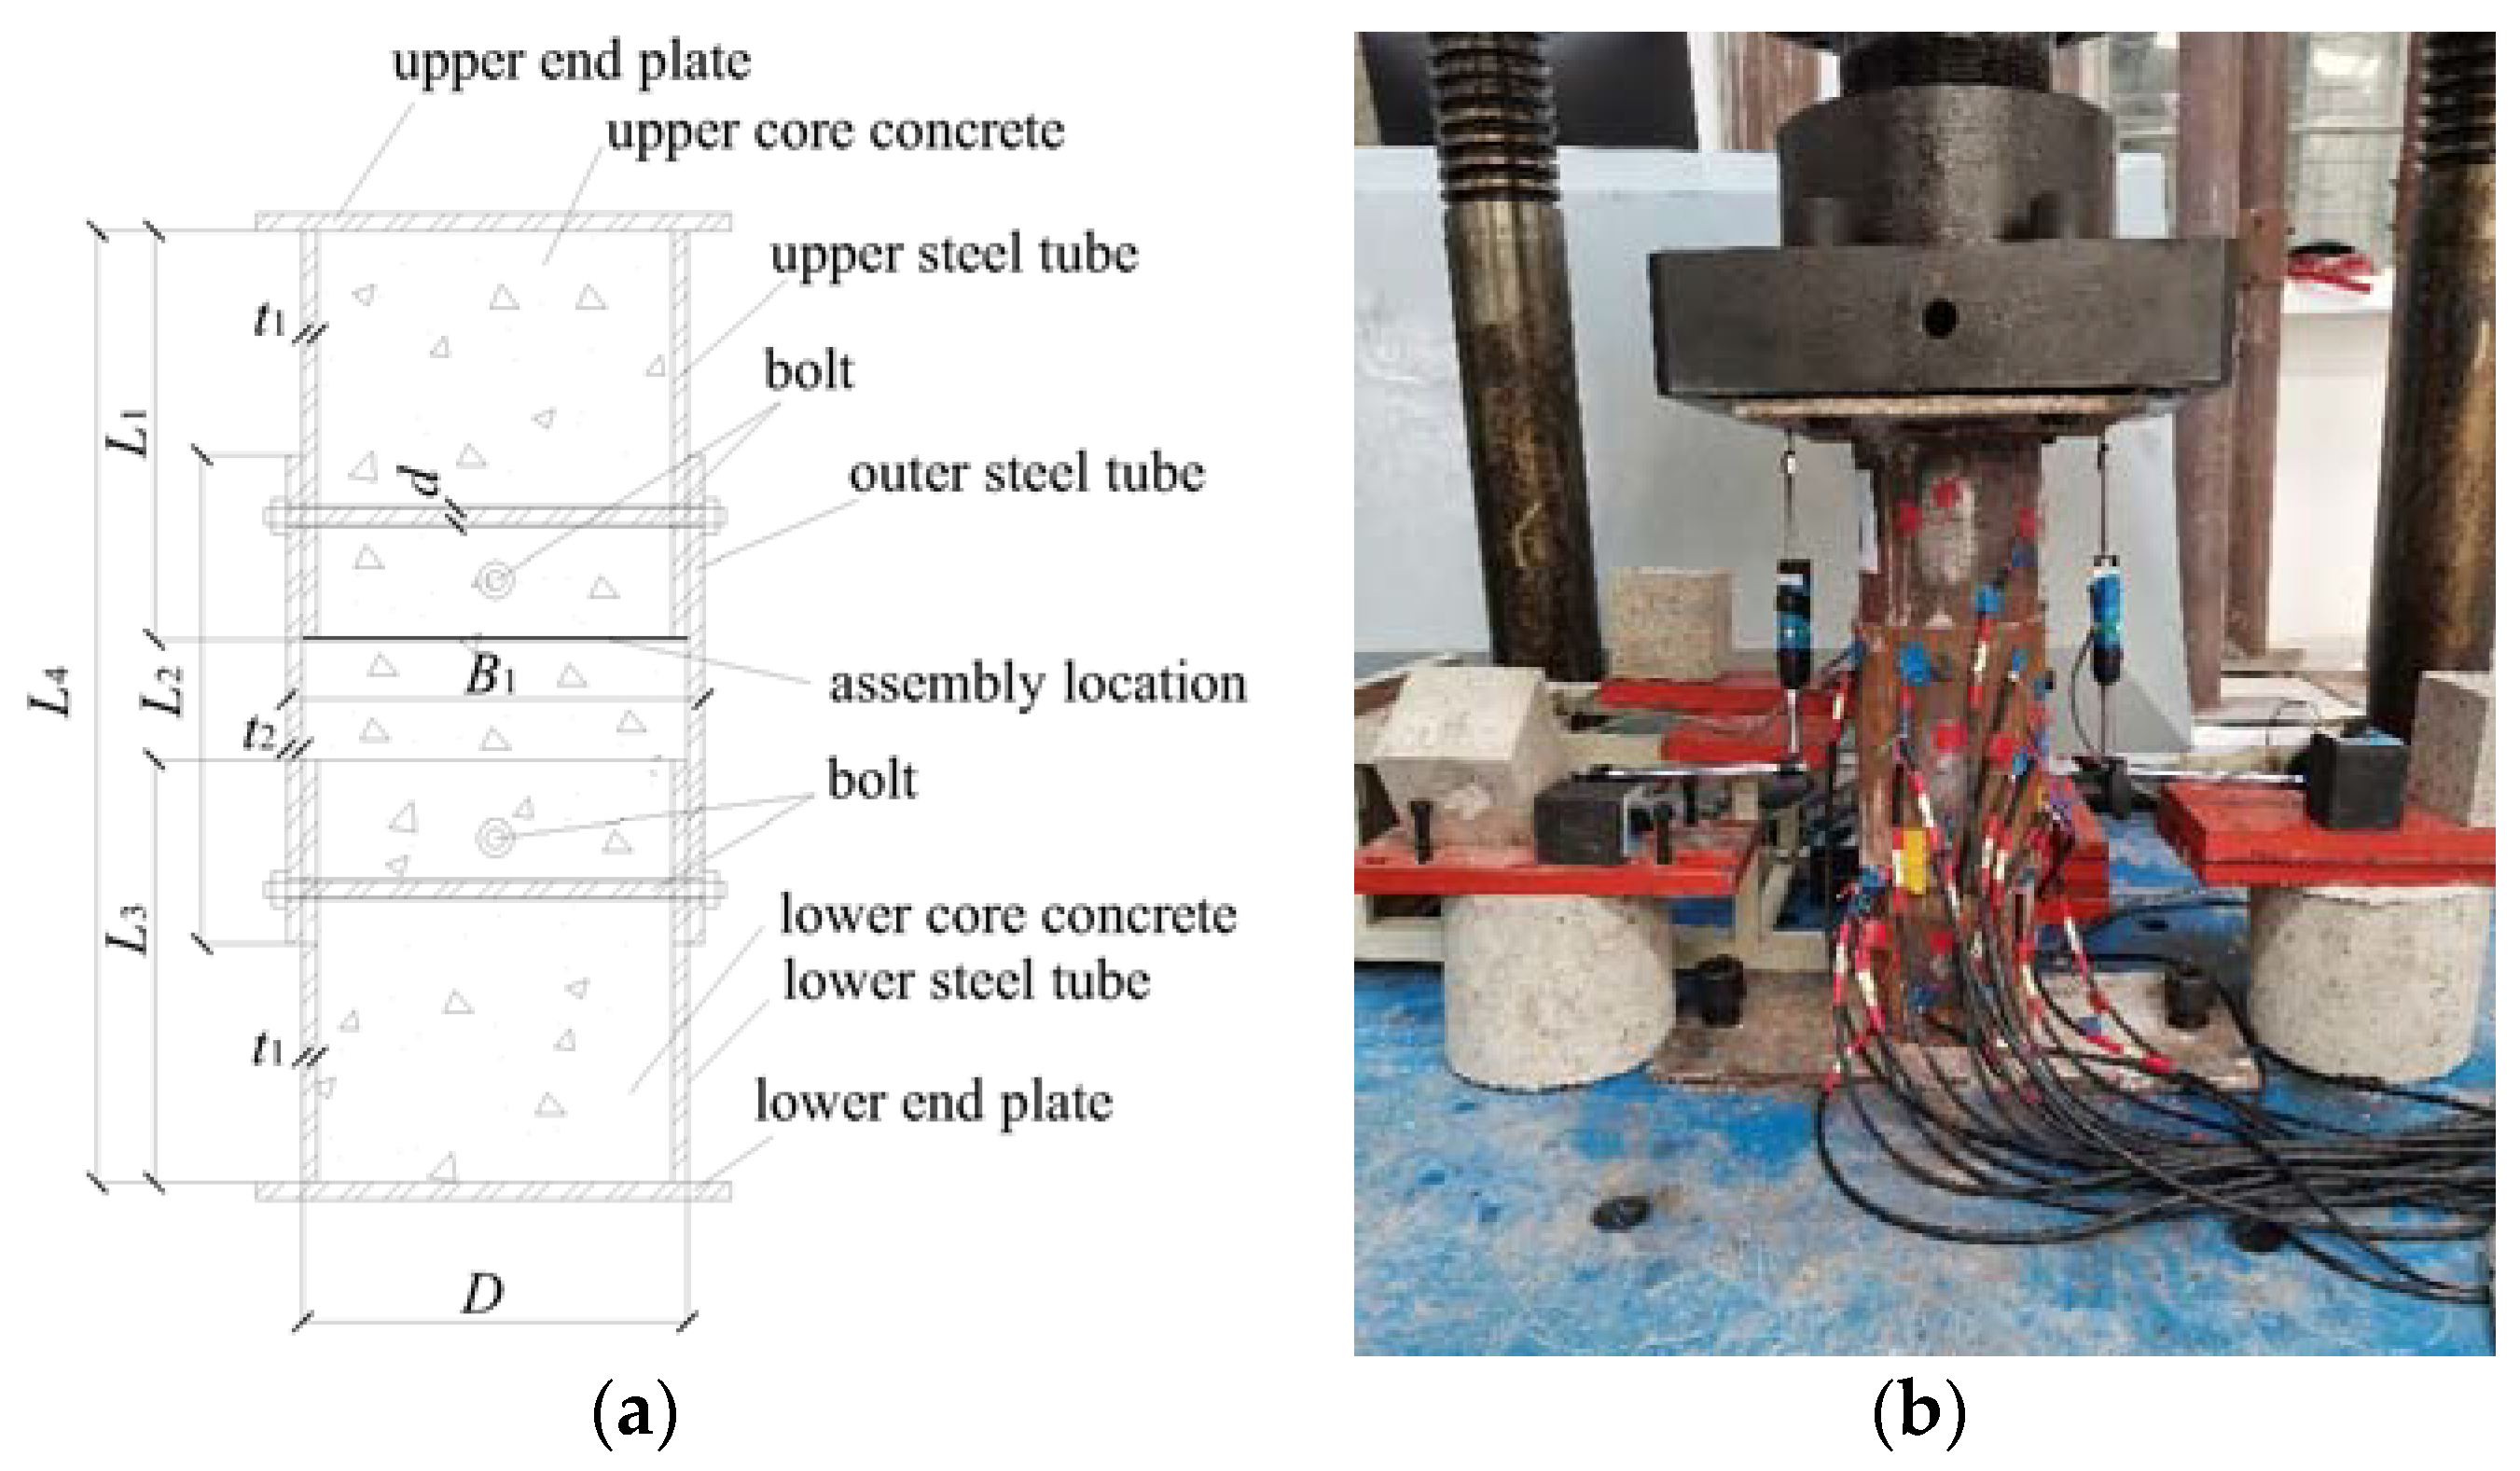
Tests containing 13 PCSCFST columns and 4 CFST columns have been reported [37]. The strength grade of concrete is C30, C40 and C50, the corresponding compressive strength fcu of concrete is 31.1, 45.3 and 51.4 MPa, respectively. The thickness of steel tube is 4.75, 5, 6 and 8 mm, the corresponding yield strength of steel tube is 372.6, 367.2, 357.8 and 351.8 MPa respectively. The diameter d of bolt is 12 and 18 mm, the corresponding yield strength of bolt is 811.5 MPa and 803.6 MPa, respectively. The specimen is placed under the 500-ton electro-hydraulic servo loading device. Taking into account the good symmetry of the circular section, the strain gauges for measuring the transverse and longitudinal strains were arranged along the x-axis and y-axis of the section in the middle of the upper and lower steel tubes, the outer tube and the bolts, respectively. Displacement and strain gauges were arranged in the middle of the uncovered area of the steel tubes, as described in the literature [37], the schematic diagram of specimen and the picture of the specimen before loading are shown in Figure 1. In addition, the specific dimensions about the specimens in the test are shown in Table 1.
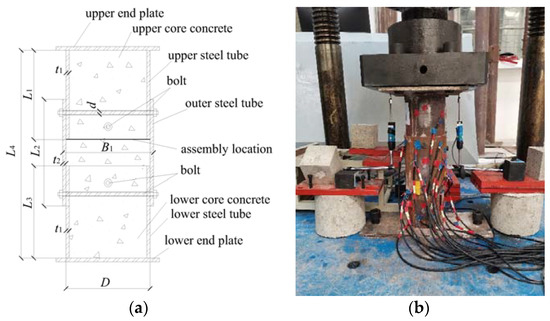
Figure 1.
The schematic diagram of specimen and the picture of the specimen before loading: (a) The schematic diagram of specimen; (b) The picture of the specimen before loading.

Table 1.
Detail information of testing specimens.
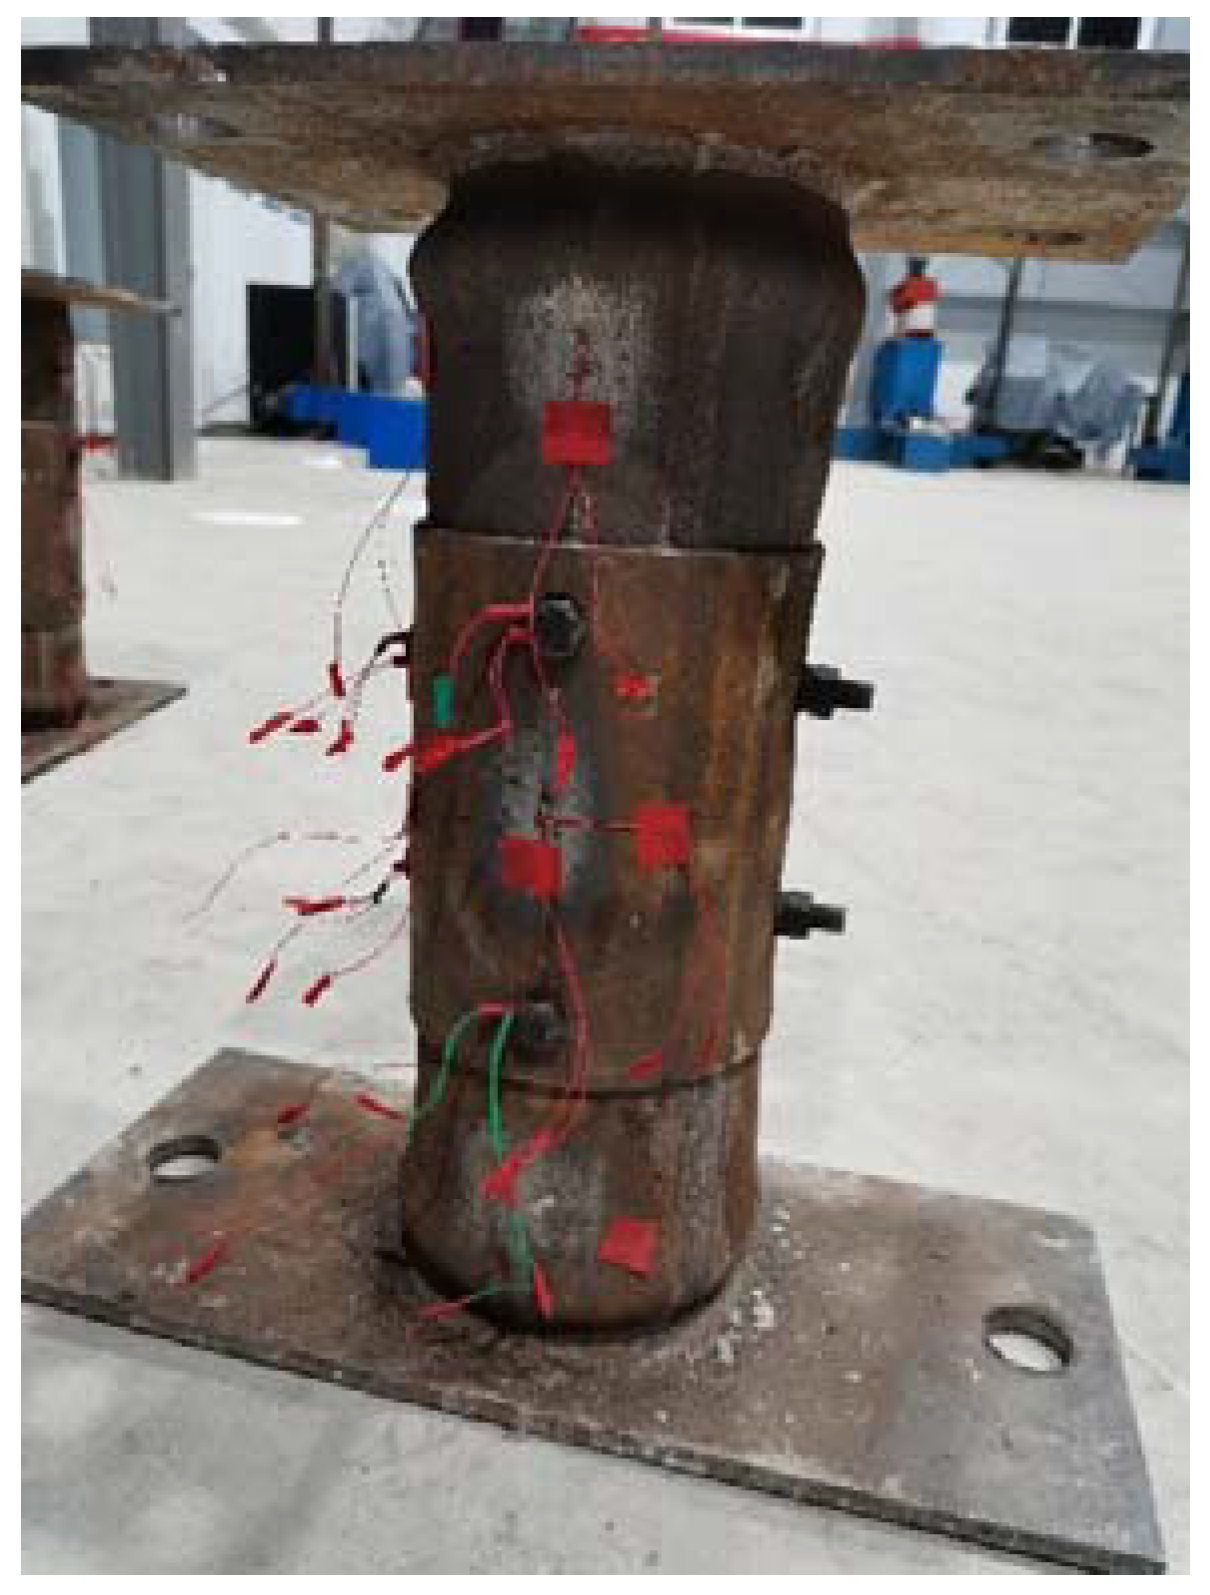
To ensure concentric loading conditions of the pedestal, the mass center of the pedestal, the test specimen and the steel loading block were placed in the same straight line. The reaction force during the test was measured by the force measuring element between the loading platen and the actuator, and the damage state of the specimen after loading is shown in Figure 2.
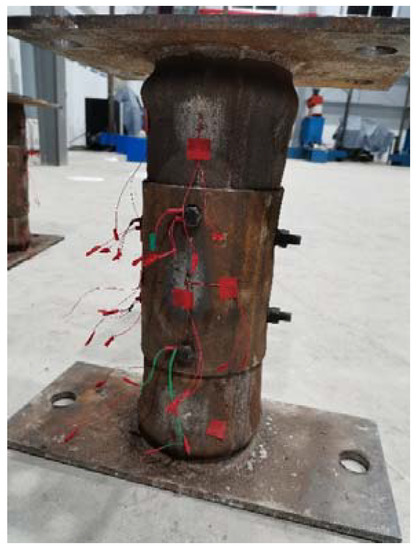
Figure 2.
The damage state of the specimen after loading.
3. Finite Element Model
ABAQUS is a widely used finite element modeling tool for static, dynamic and impact and even explosive loading [38]. A FE model was developed using ABAQUS to simulate the axial compression behavior of the PCSCFST column. C3D8R element was used to simulate the steel tubes and core concrete, which can accurately simulate the local buckling of the steel tube.
3.1. FE Boundary Conditions and Load
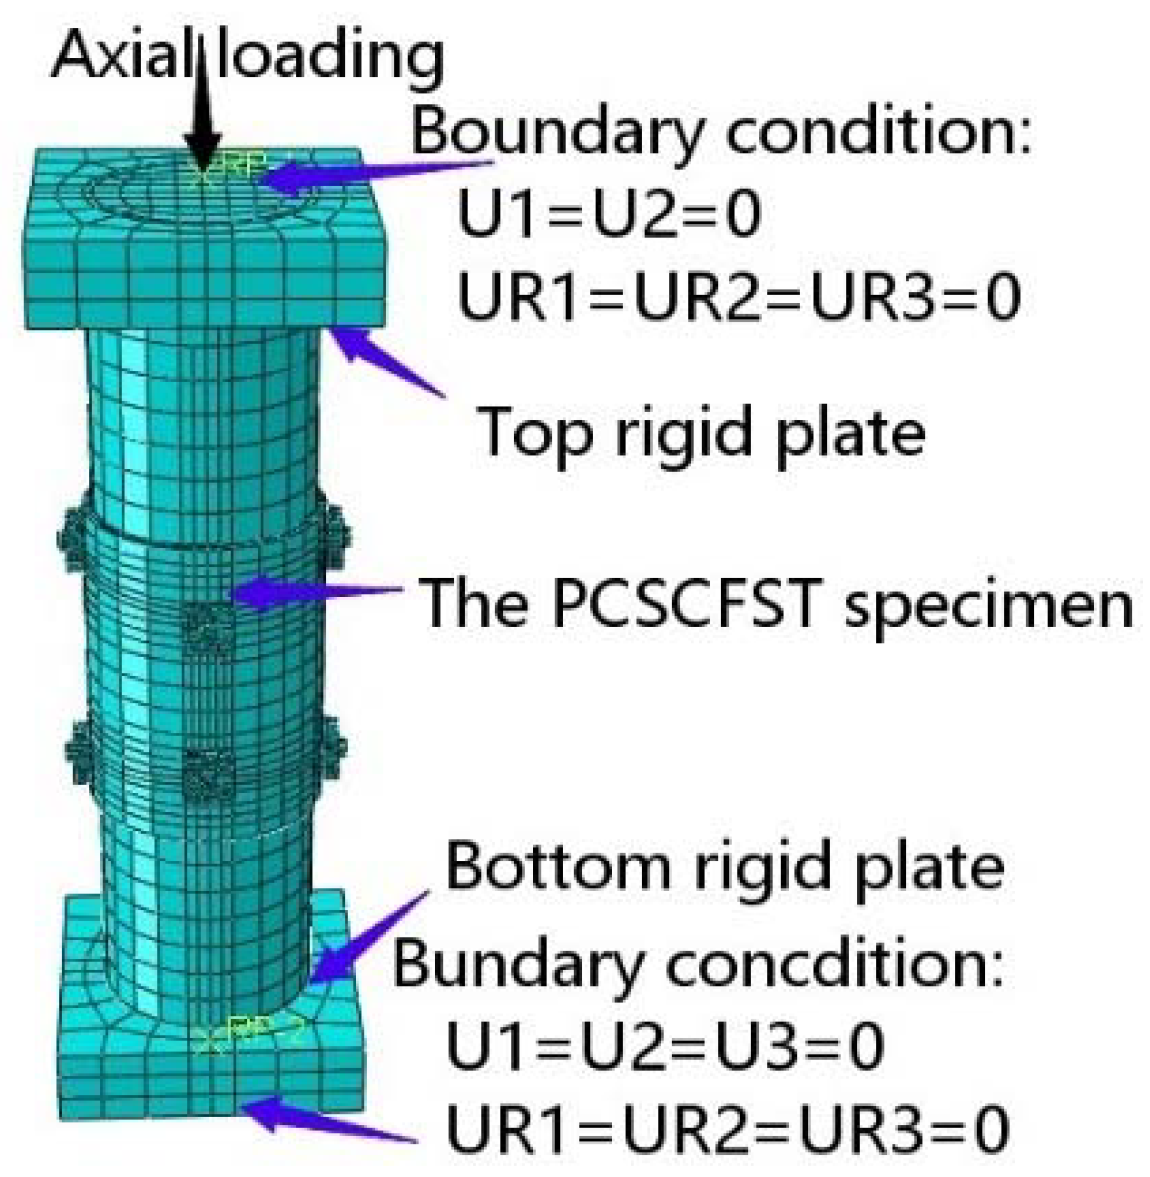
The conditions of the test in [37] show that the lower end of the specimen is completely fixed and only the upper end is not fixed by axial displacement. In order to make the simulation closer to the test, the bottom and top ends of the specimen need to be fixed in all degrees of freedom except for the axial displacement direction of the top end. A displacement was applied at the top rigid plate to apply the load and a reference point was used at the upper end to measure the bearing capacity of the column. The details of the FE model are shown in Figure 3. For the model the application of axial load is operated by the control of the displacement in the boundary conditions.
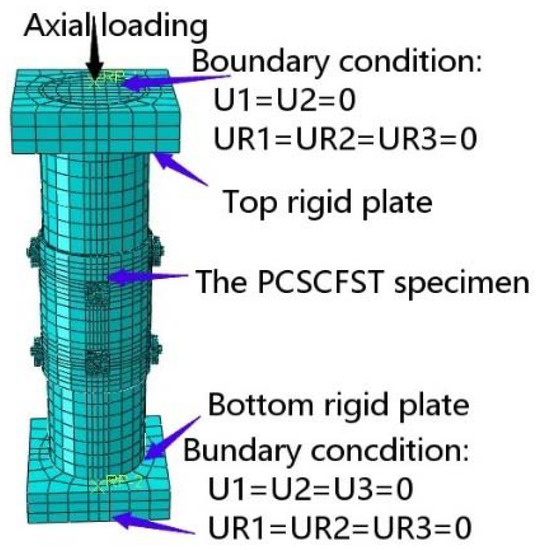
Figure 3.
Finite element model for PCSCFST columns.
3.2. Interaction
The cover plates at both ends of the specimen are set as rigid plates with reference points RP1 and RP2 attached, respectively. The interaction between the inner surface of the steel tube and the outer surface of the core concrete is set as a “surface–surface” contact. The normal behavior of the interaction is set to “Hard” contact and the tangential behavior is set to a “penalty” friction formulation with a friction coefficient of 0.25. Taking into account the differences in friction between different materials, the coefficient of friction in the tangential behavior of the interaction between the tube and the tube is specified as 0.45. For setting the contact properties of the outer surface of the screw with concrete and with steel tube, reference is made to steel tube to steel tube and to concrete. In particular, the contact of the nut with the outer surface of the outer tube is set to “Tie”.
3.3. Material Models
3.3.1. Steel
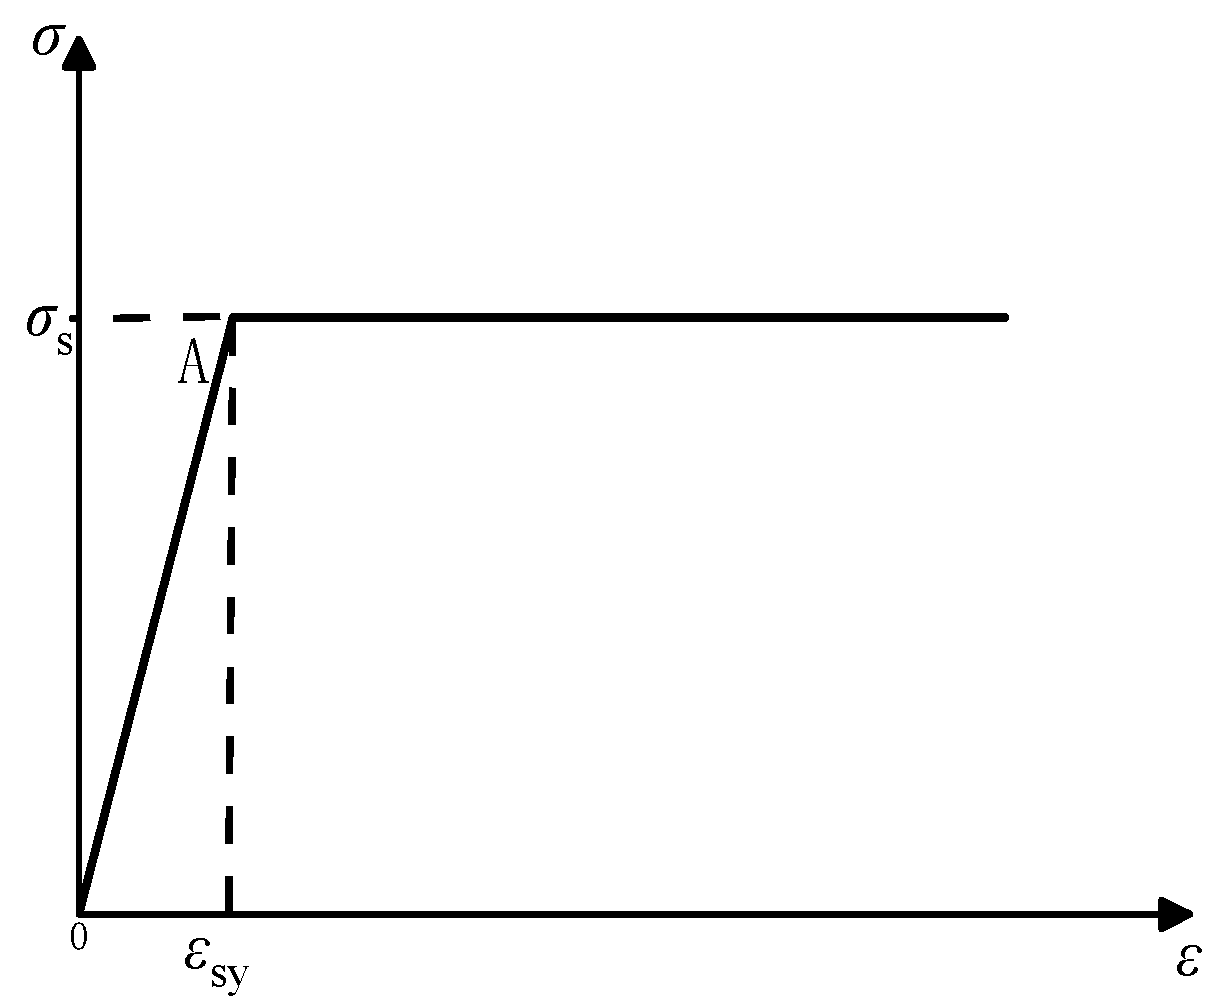
The ideal elastic–plastic model is adopted in this paper, as shown in Figure 4. Before the stress reaches the yield point, Hooke’s law is fully obeyed, and the stress value does not increase after yielding, and the strain value can be increased infinitely. The rising part of the first section is the linear elastic part, which can be obtained by the following equation:
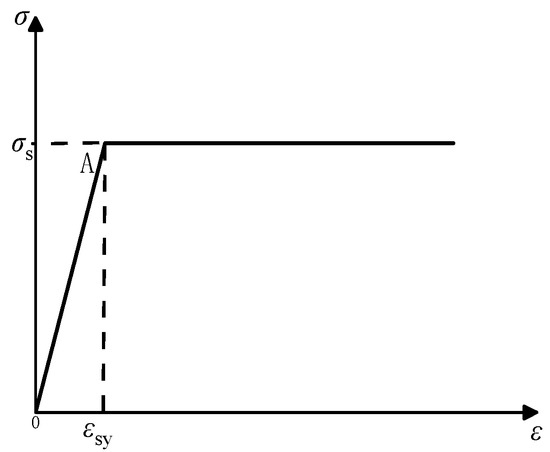
Figure 4.
Schematic diagram of ideal elastic-plastic material model.
The modulus of elasticity set in the ABAQUS model in this paper is 210,000 MPa.
3.3.2. Core Concrete
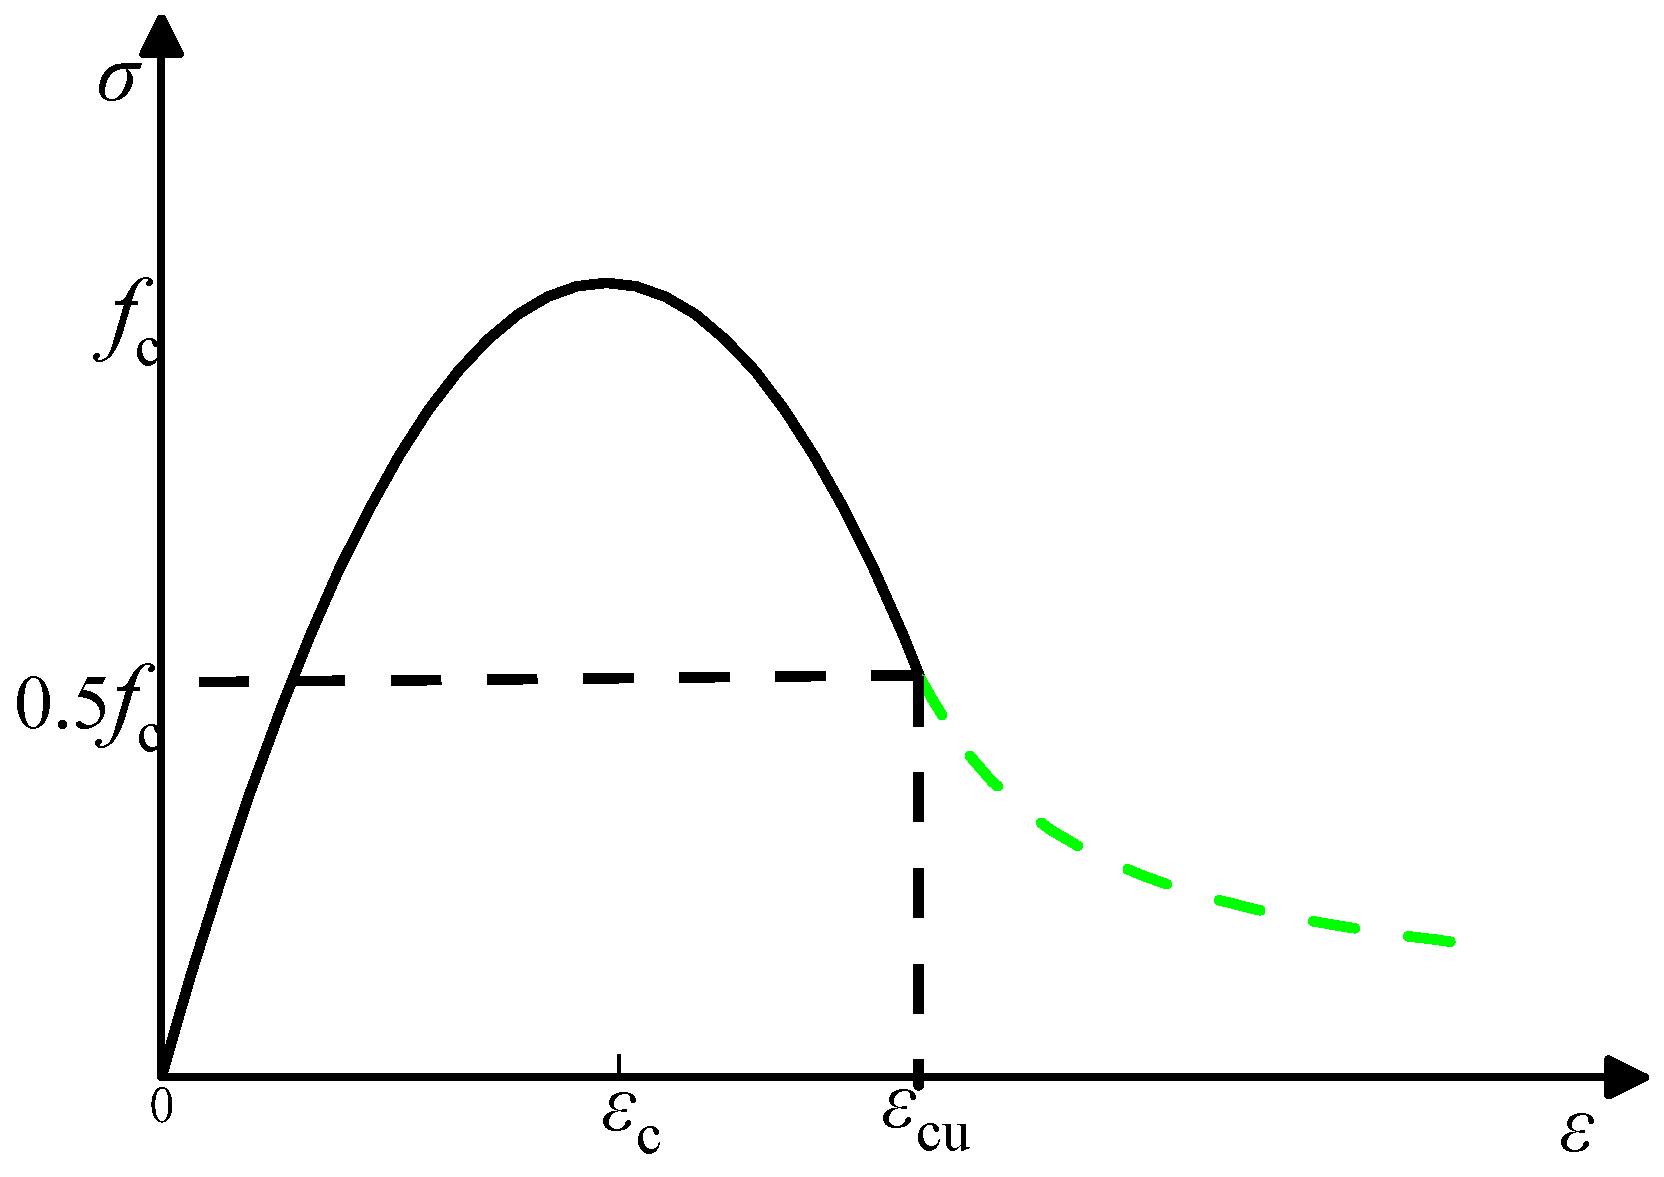
The intrinsic relationship of the elastic phase of concrete is indicated by the modulus of elasticity of concrete as well as Poisson’s ratio ν. Considering the constrained and semi-continuous character of the PCSCFST columns, the core concrete material model is adopted as built-CDP model in ABAQUS, and the data set is adopted as proposed by [39], as shown in Figure 5, and as follow:
where αc is the parameter value of the falling section of the uniaxial compressive stress–strain curve of concrete taken according to Table 2; fc is cylinder compressive strength of concrete; is evolutionary parameters of uniaxial compressive damage to concrete.
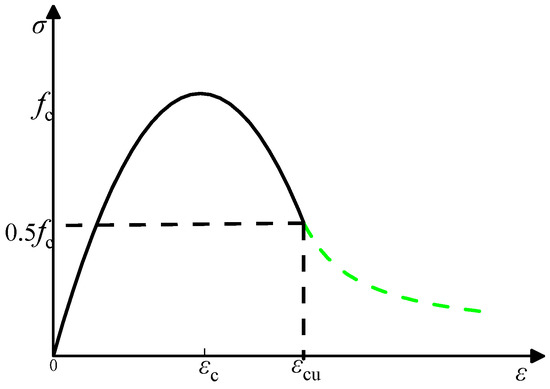
Figure 5.
Axial stress–strain curve for concrete.

Table 2.
Parameter values for uniaxial compressive stress–strain relationship curves of concrete.
3.4. Bolt Pretension Load
Since bolted connections require the application of bolt preload or bolt torque during installation, such loads also need to be replicated in the numerical model. The bolt preloads in the model are designed according to Euro-code 3 [40].
4. Model Verification
4.1. Typical Failure Mode
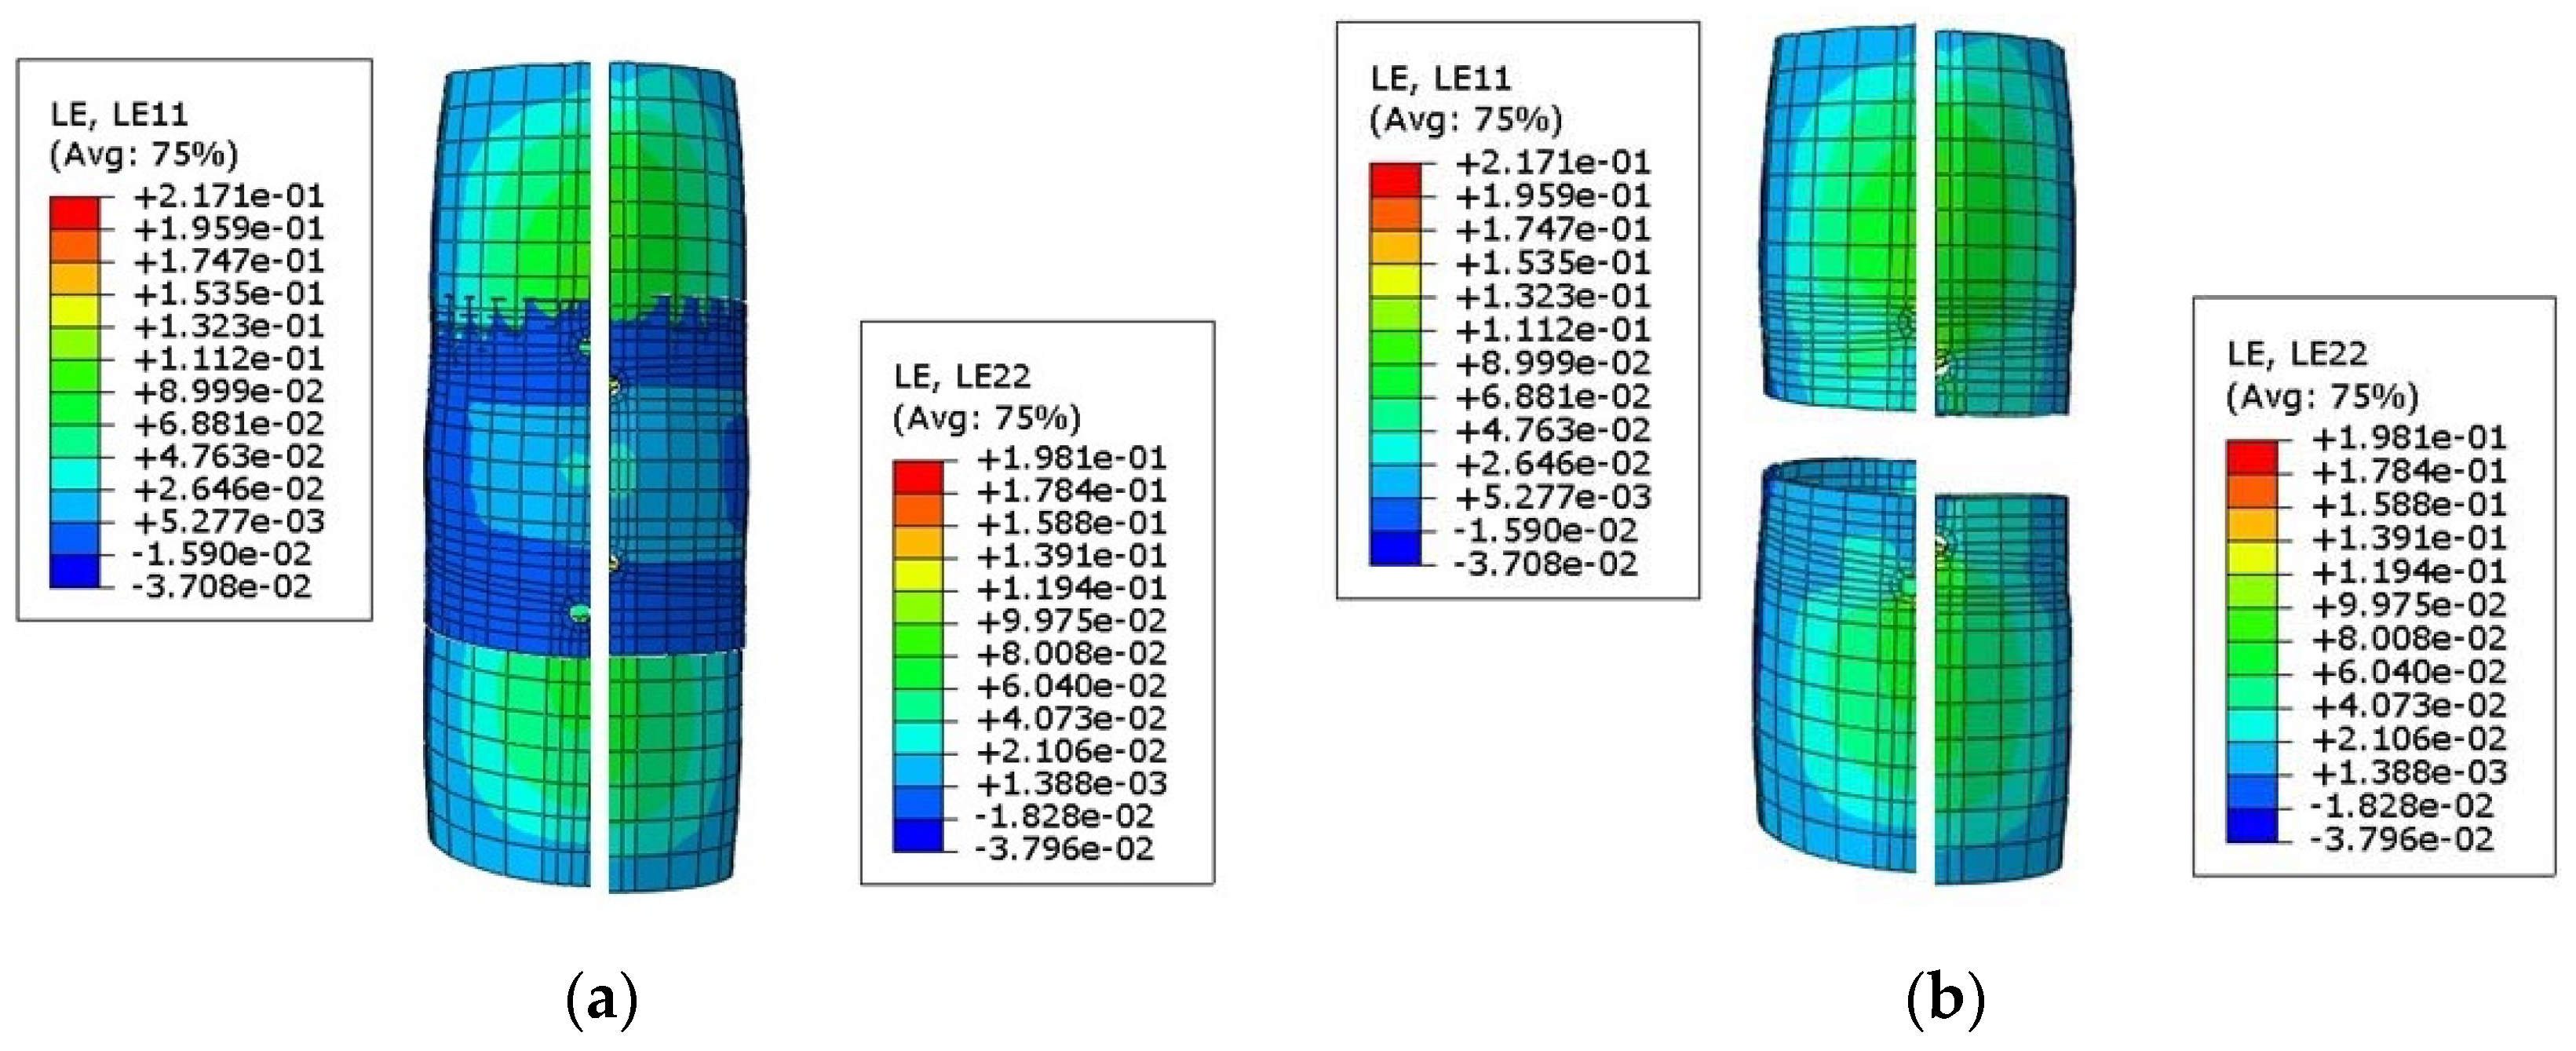
Comparison of numerical calculation results with experimental data shows that the accuracy of the FE model is reliable. The verification of the damage model of numerical simulation and test (take the PCSCFST3 specimen as an example) is shown in Figure 6. It is obvious that the failure modes of both the bolts and the steel tubes are highly consistent with the experiment.

Figure 6.
Comparison of PCSCFST3 column test results and FE results.
4.2. Load-Compression Curve (N–Δ)
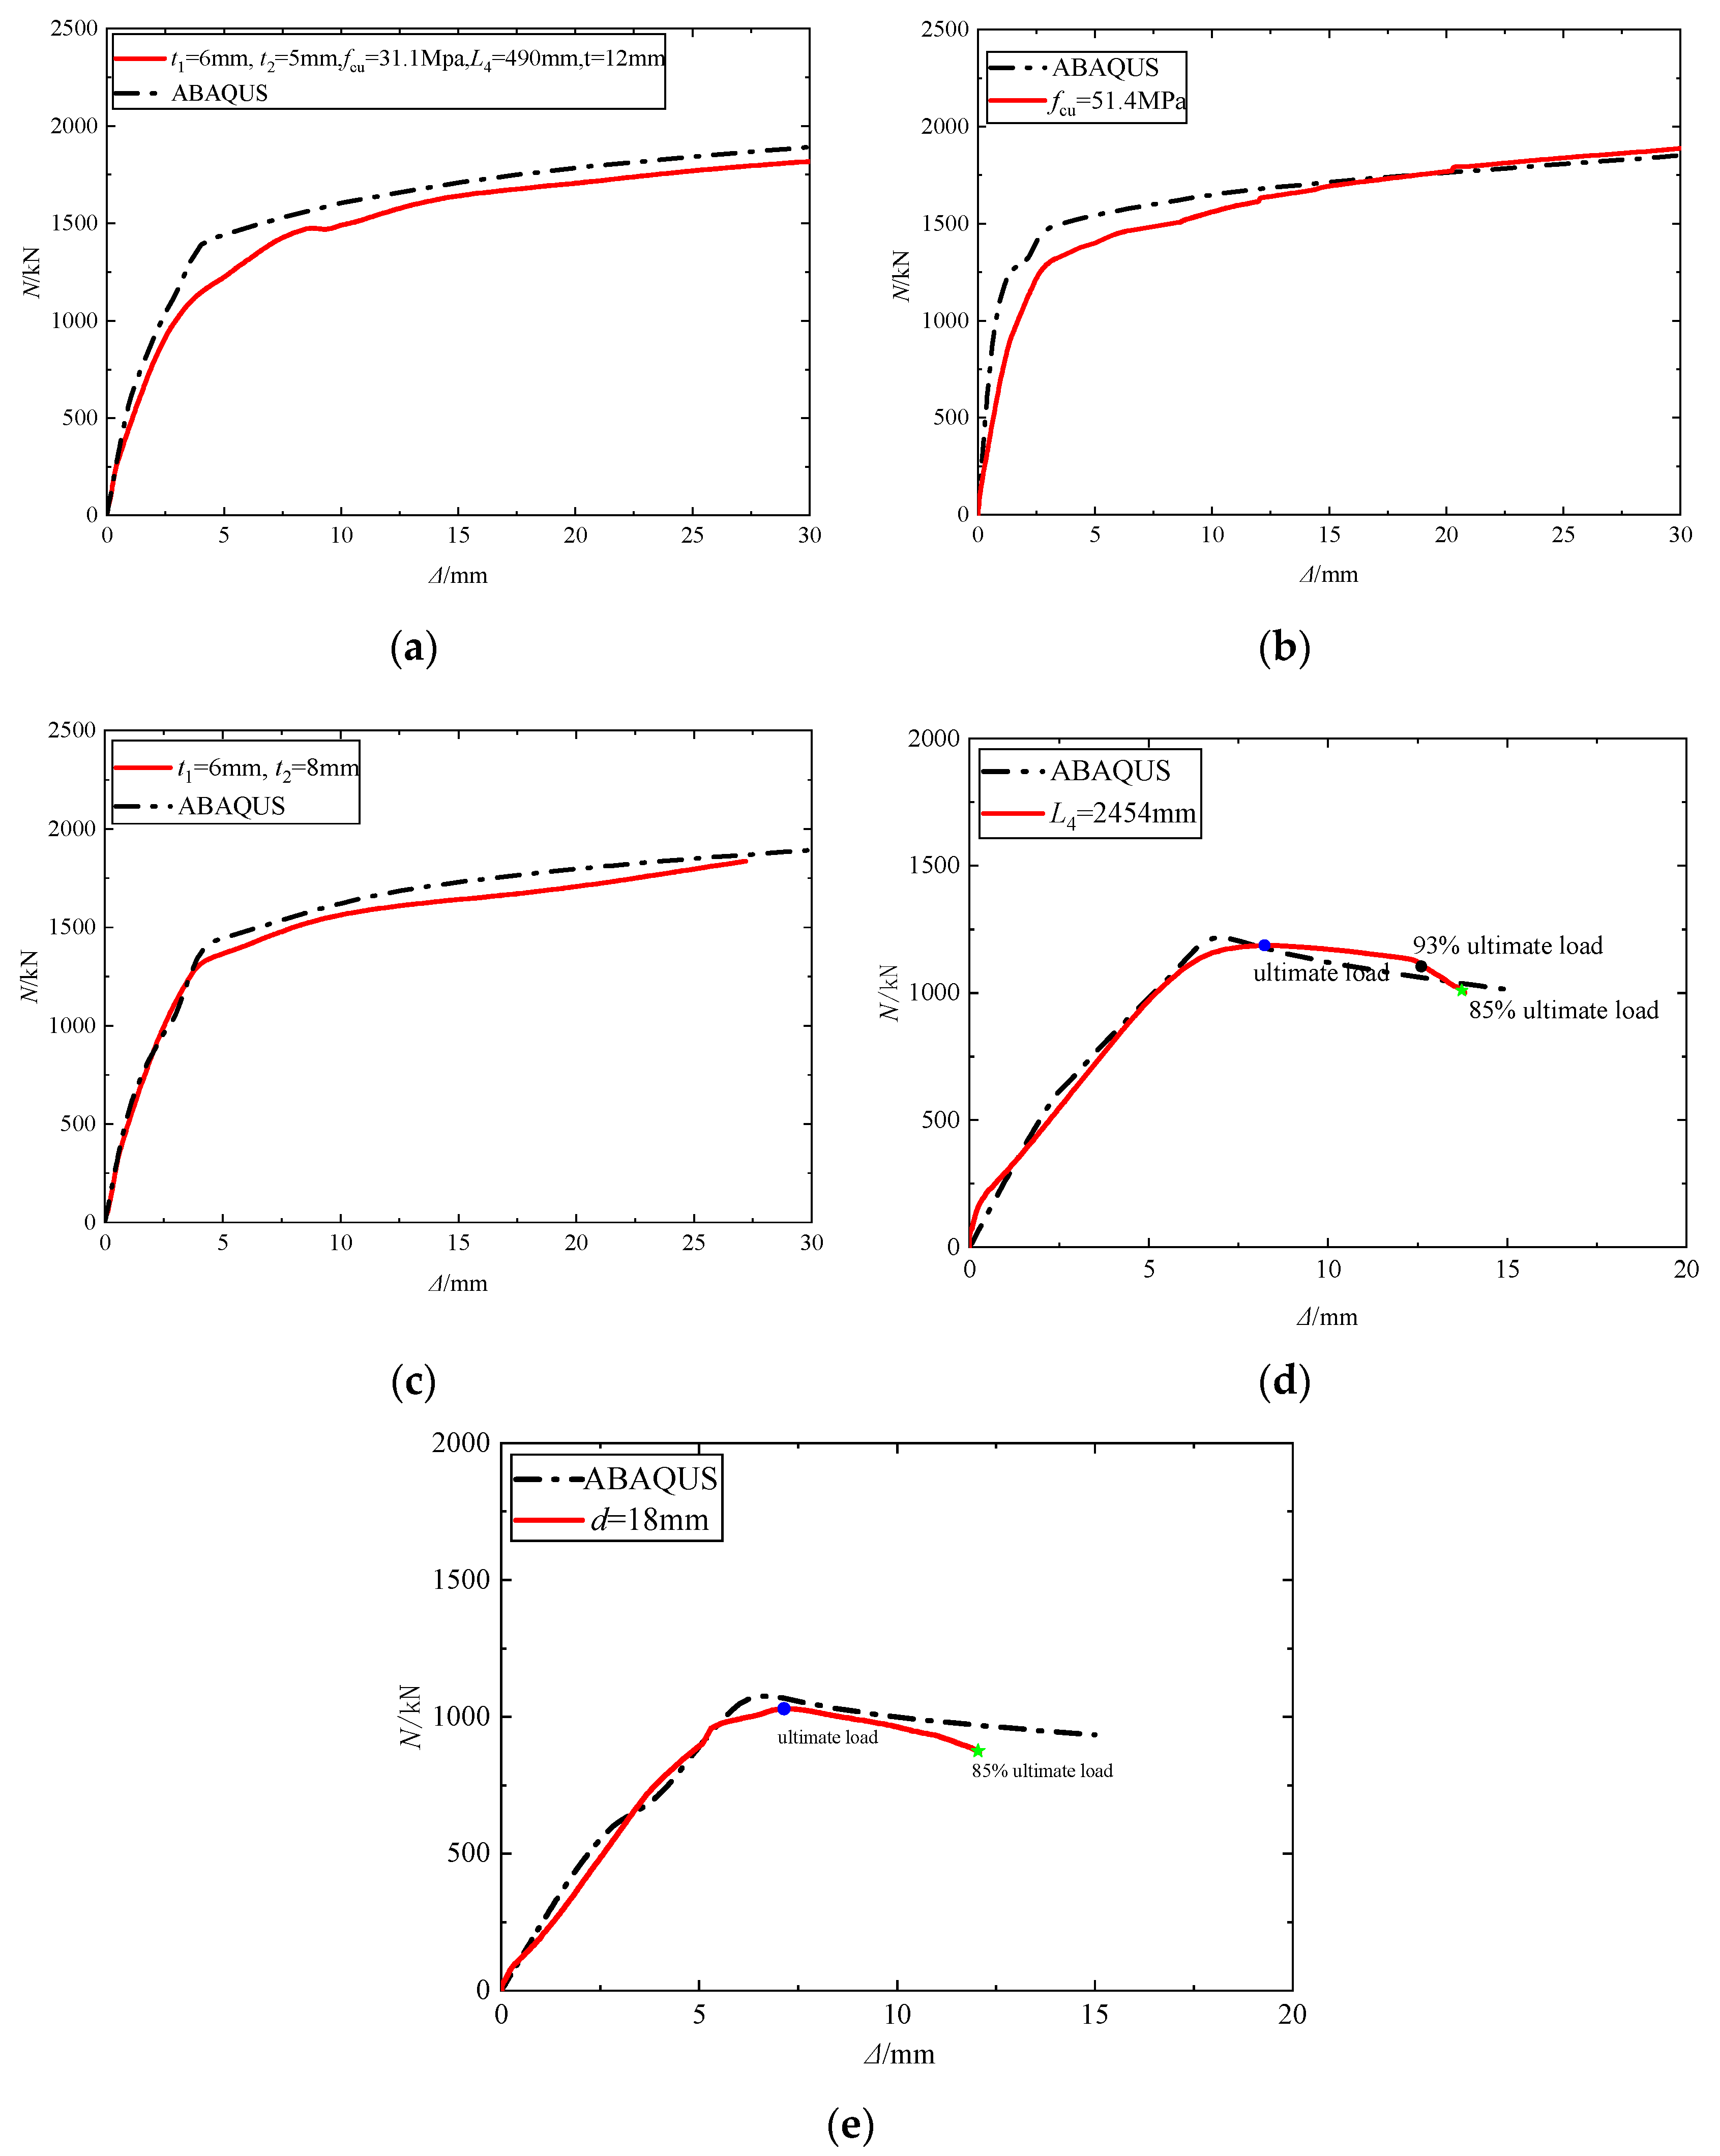
The axial load–axial displacement curves obtained from the numerical simulation were compared with the experimental data, and the situation is shown in Figure 7. PCSCFST3-5 and PCSCFST10-11 were used as typical specimens for comparative analysis. In addition, the high agreement between the ultimate load phase curves and the finite results of each specimen further illustrates the accuracy of the FE model. The FE results are closely related to the ultimate bearing capacity and development trend of the experimental results, which greatly proves the accuracy of the FE model.
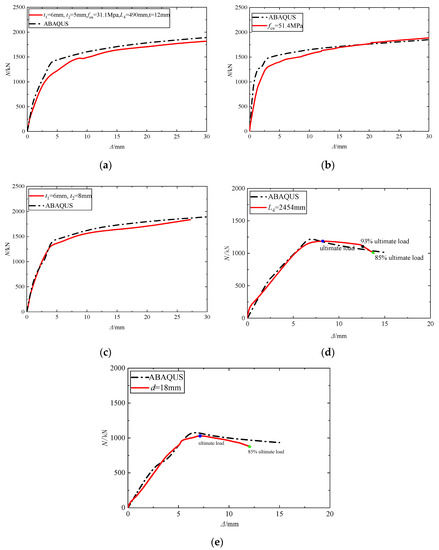
Figure 7.
Comparison of experimental and FE load displacement curves: (a) PCSCFST3; (b) PCSCFST4; (c) PCSCFST5; (d) PCSCFST10; (e) PCSCFST11.
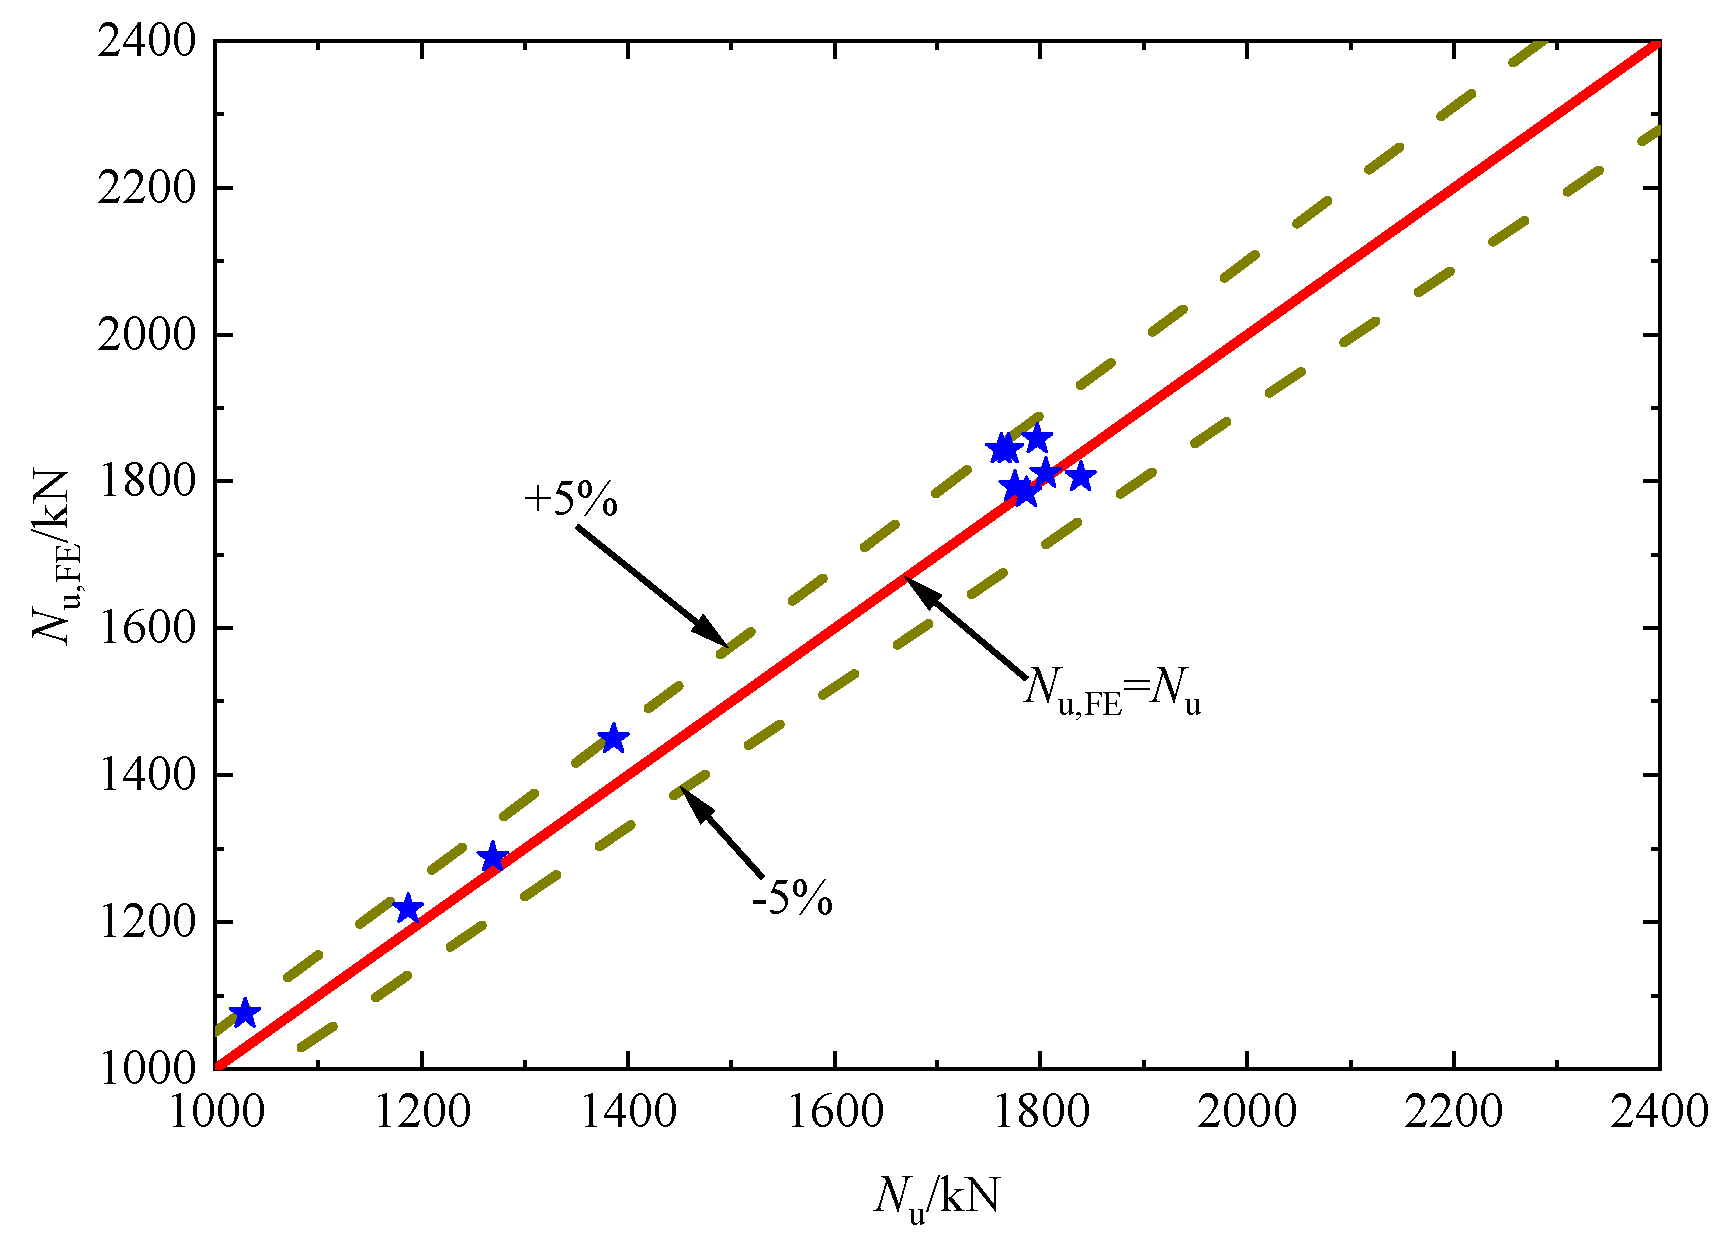
What is presented in Figure 8 and Table 3 illustrates that the experimental and finite element results regarding the ultimate load of the specimen show a high degree of agreement. Where t1 is the thickness of the upper steel tube and lower steel tube, t2 is the thickness of the outer steel tube, L4 is the specimen length, and d is the bolt diameter.
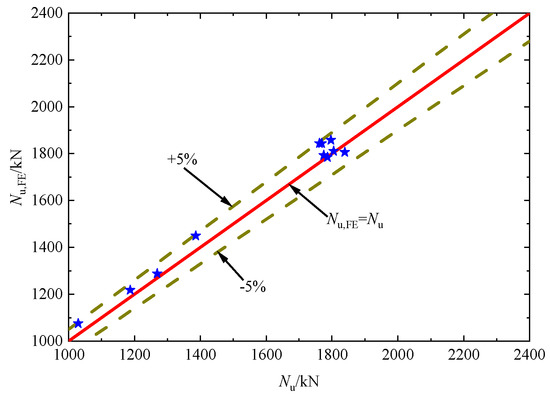
Figure 8.
Agreement of experimental and FE ultimate bearing capacity.

Table 3.
Specimen parameters and the ultimate bearing capacity of test and FE.
4.3. Strain on Steel Tubes
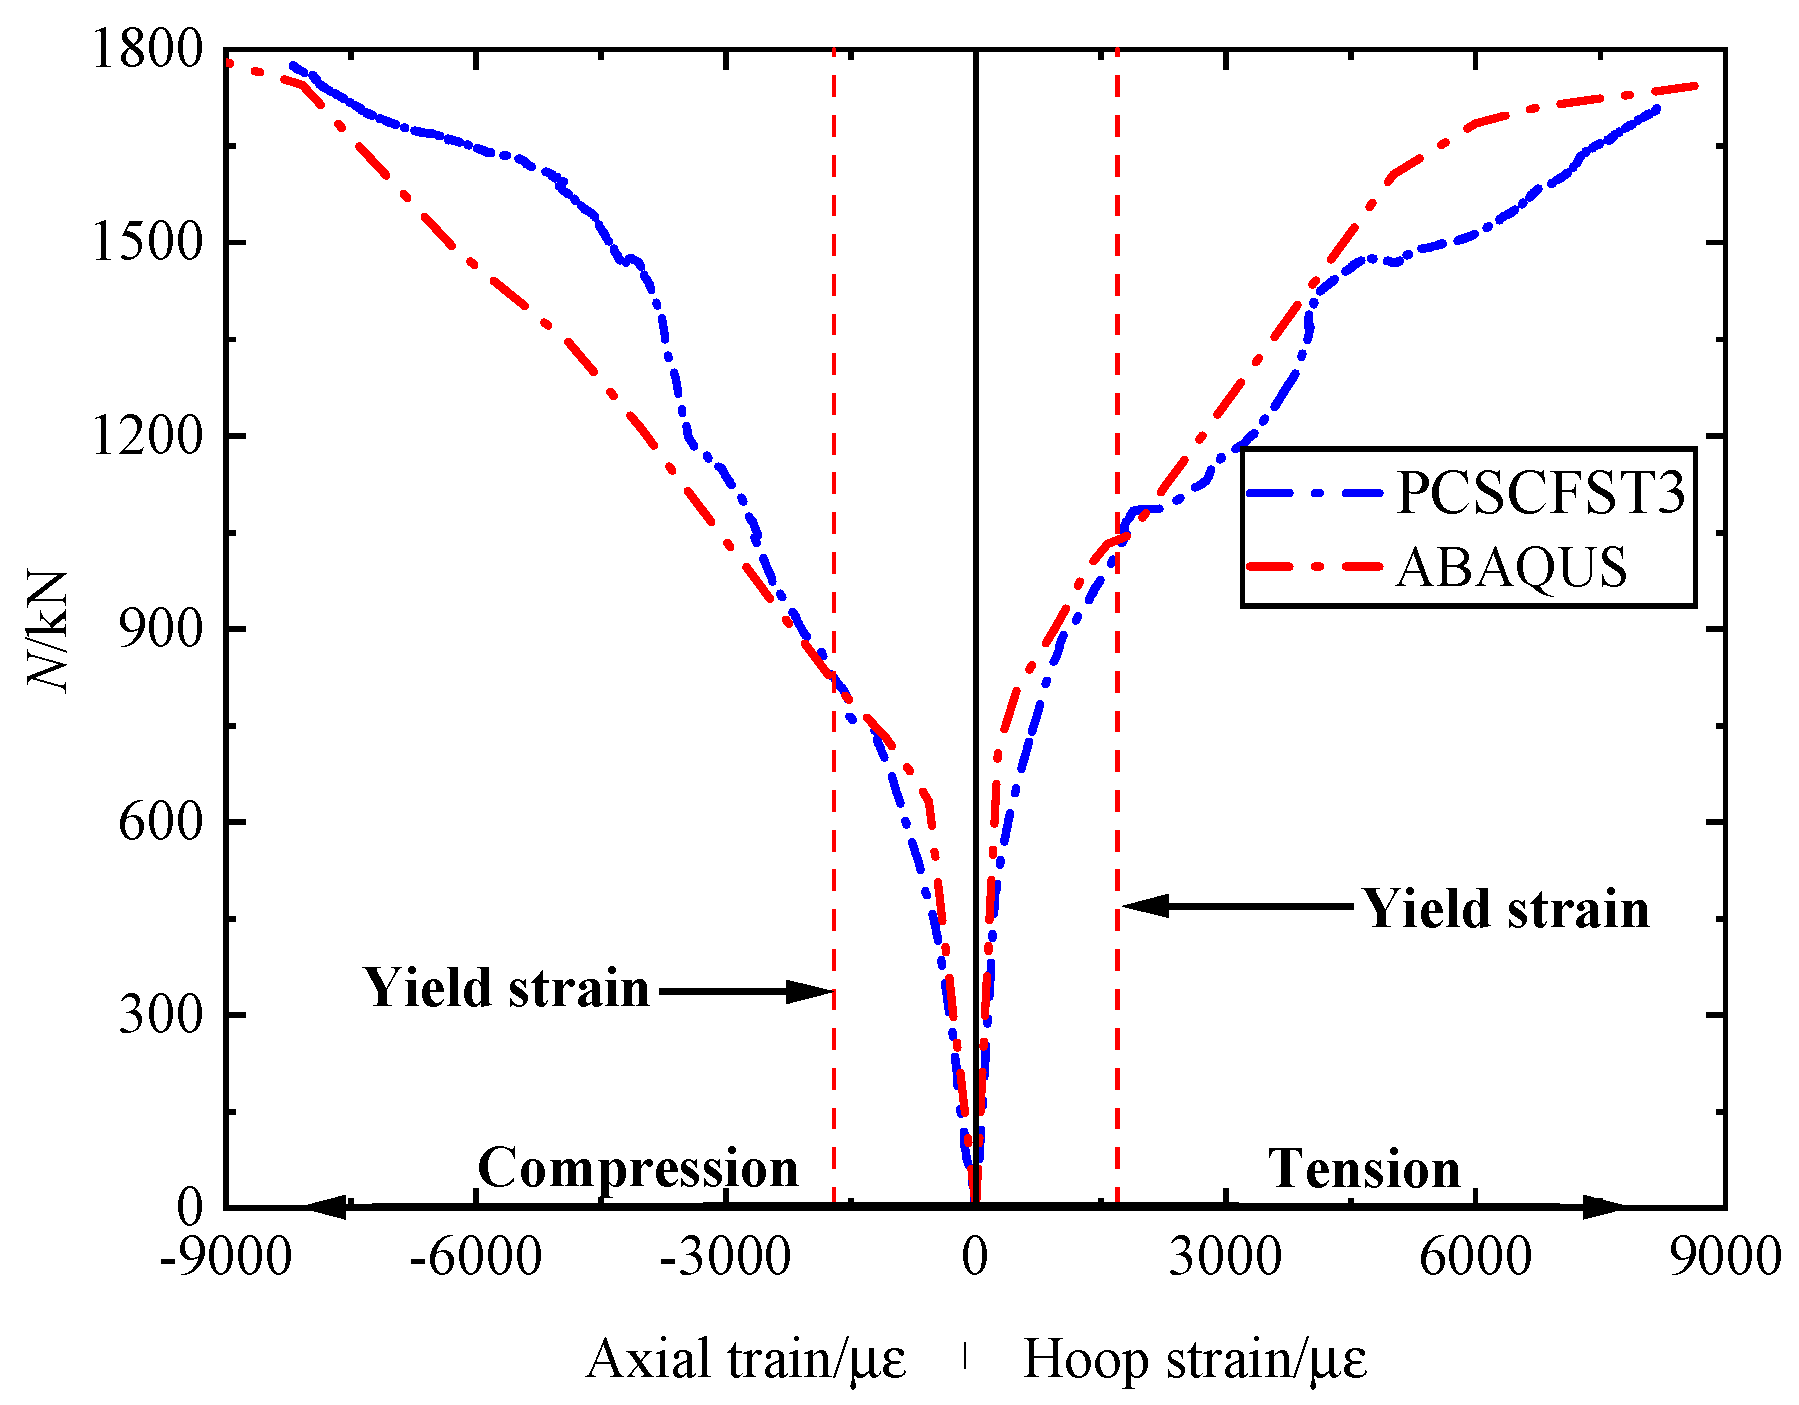
To validate the finite element model in terms of strain, the strain in the middle of the outer tube of a typical specimen PCSCFST3 was chosen to compare the test with its FE, which is shown in Figure 9. From Figure 9, it is easy to see that the strain trends of the tests and the consistency of the loads reaching the yield strain are high, which further verifies the reliability and applicability of the finite element model from the strain level.
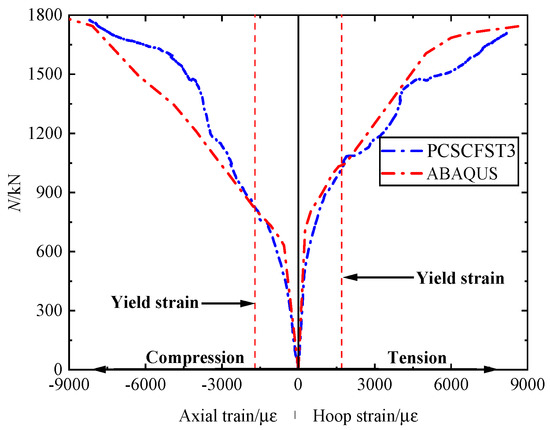
Figure 9.
Comparison of test and FE strains in the middle of the outer steel tube of PCSCFST3.
5. Discussion and Analysis
5.1. Conceptual Load–Compression Curve (N–Δ)
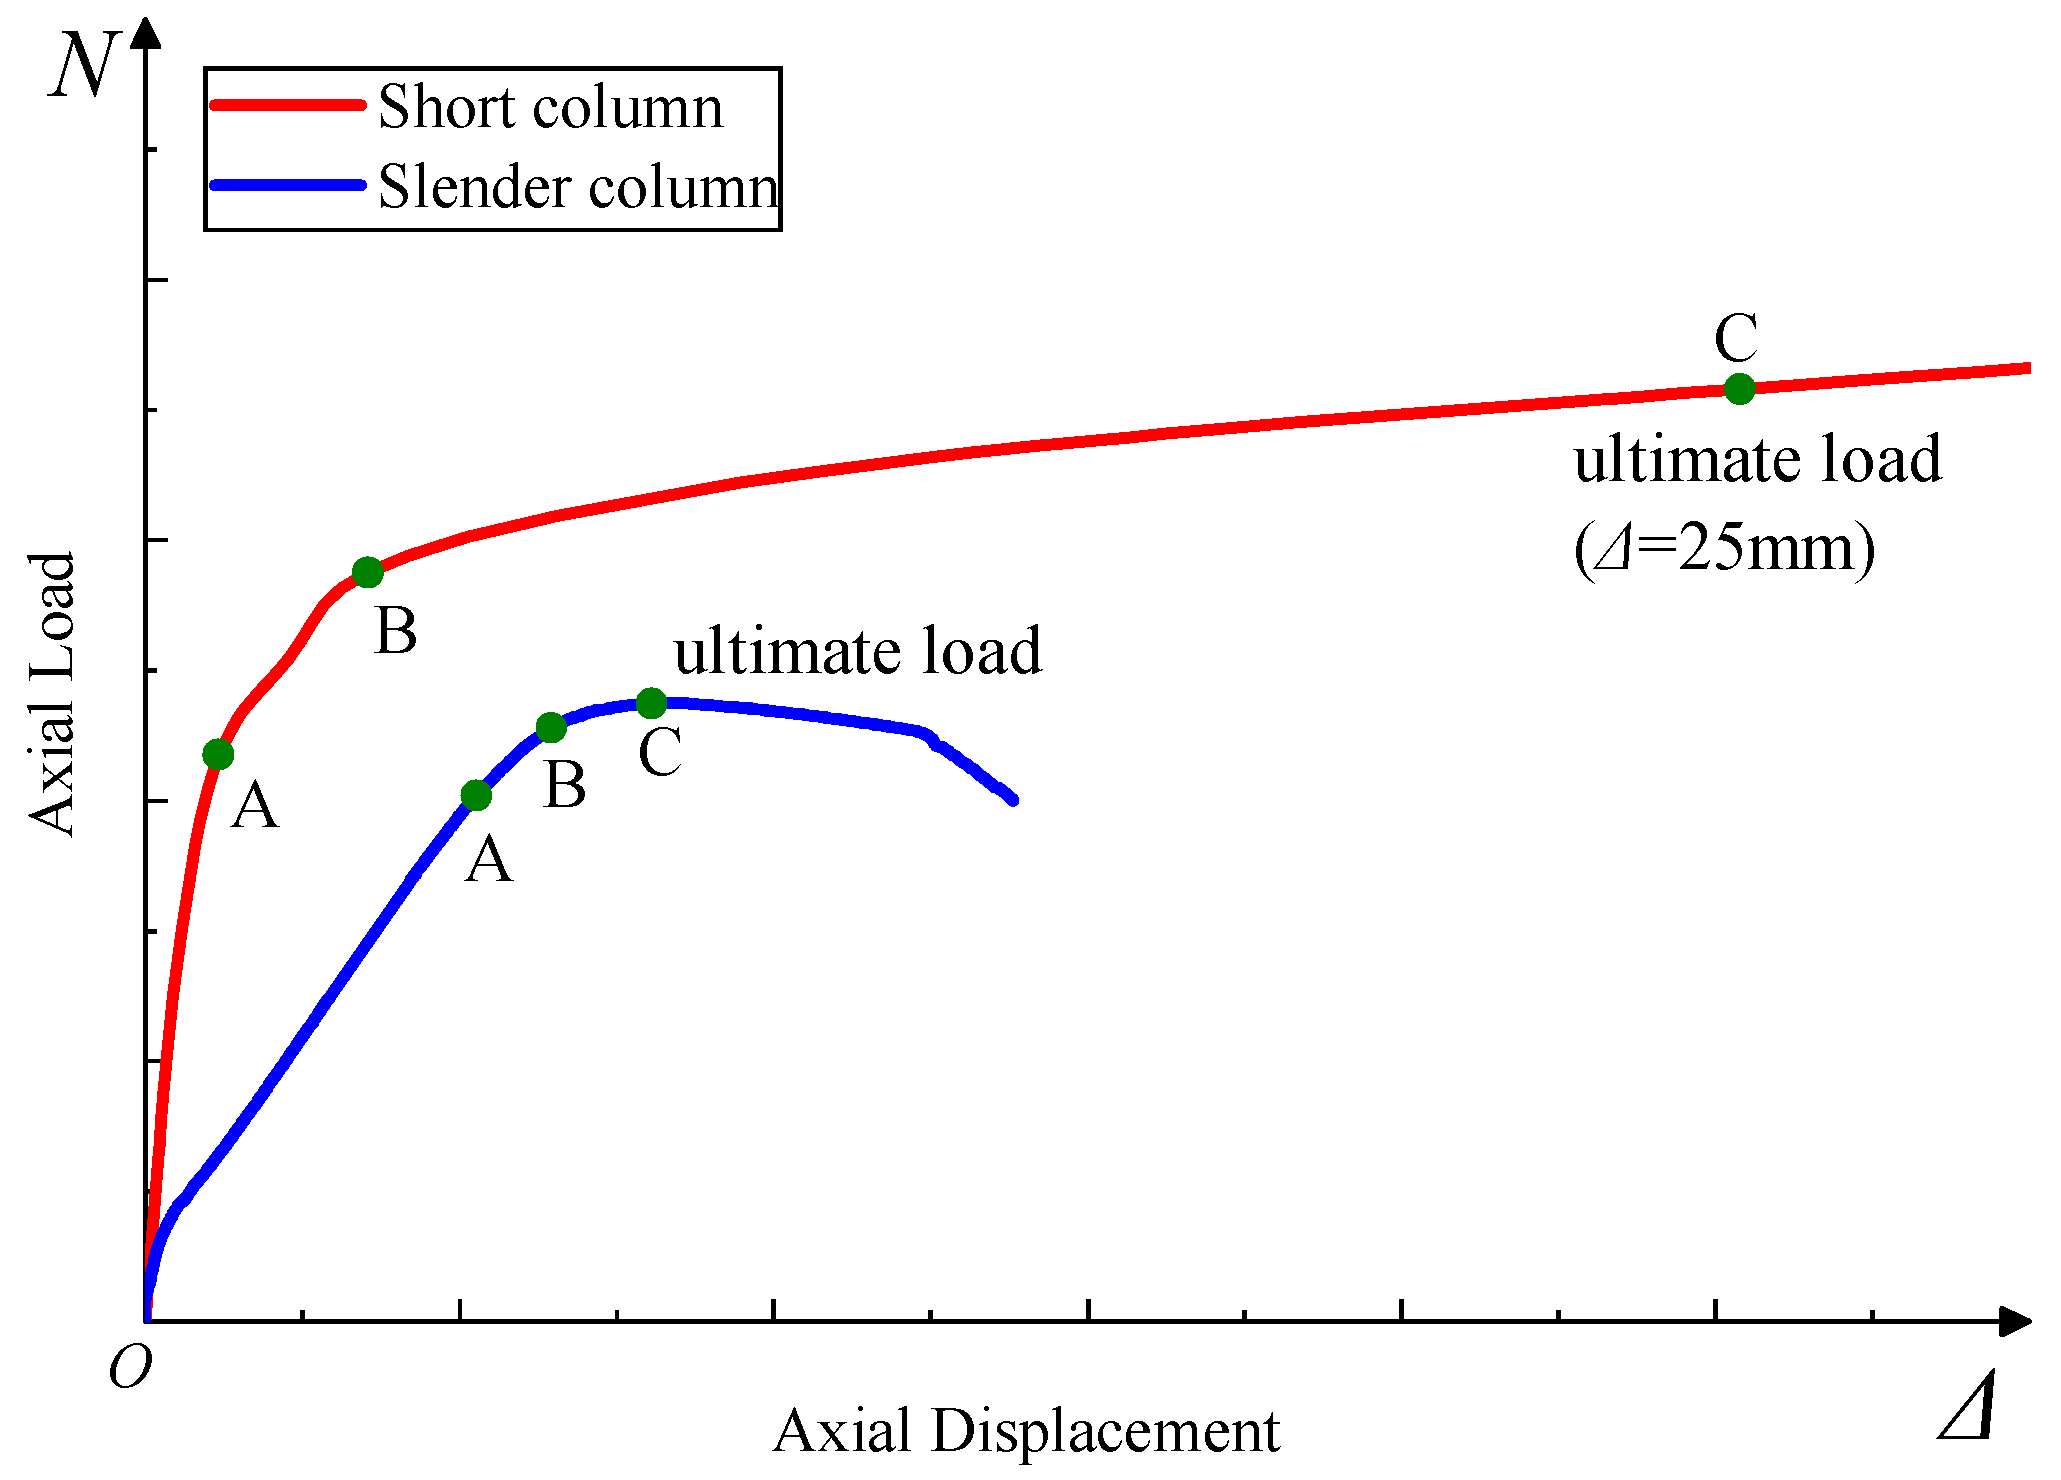
Based on the combination of experimental results and numerical simulations, conceptual graphs capable of characterizing the key part of the N–Δ curve of the PCSCFST column for various parameters were compiled, which is shown in Figure 10.
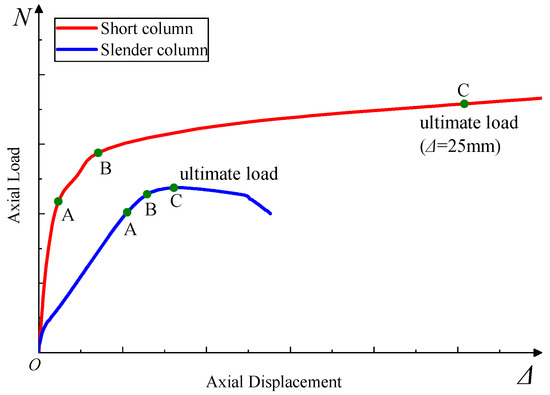
Figure 10.
Conceptual N–Δ curve of PCSCFST column.
- (1)
- The first stage (O~A): The specimen bearing capacity showed linear elastic development, the steel tube did not yield, and the core concrete made the greatest contribution to the overall bearing capacity.
- (2)
- Secondary rise stage (A~B): The stresses in the concrete and steel tubes and bolts also became significantly larger and yielded quickly as the load continued to increase, and the specimens entered a phase of nonlinear development. The reinforcement process of steel makes the steel tube get further after reaching the yield stress.
- (3)
- Continuous strengthening stage of short columns (after the conceptual point B): the steel tube strain hardening phenomenon is obvious, the compressive bearing capacity is presented with a weak magnitude of continuous strengthening phenomenon.
- (4)
- Declining stage after ultimate load of slender column (after the conceptual point C): the increasing lateral deflection increases the load eccentricity, which sympathetically leads to the decrease in the compressive bearing capacity, and this tendency is intensified with the increase in lateral deflection.
5.2. Contact Stress
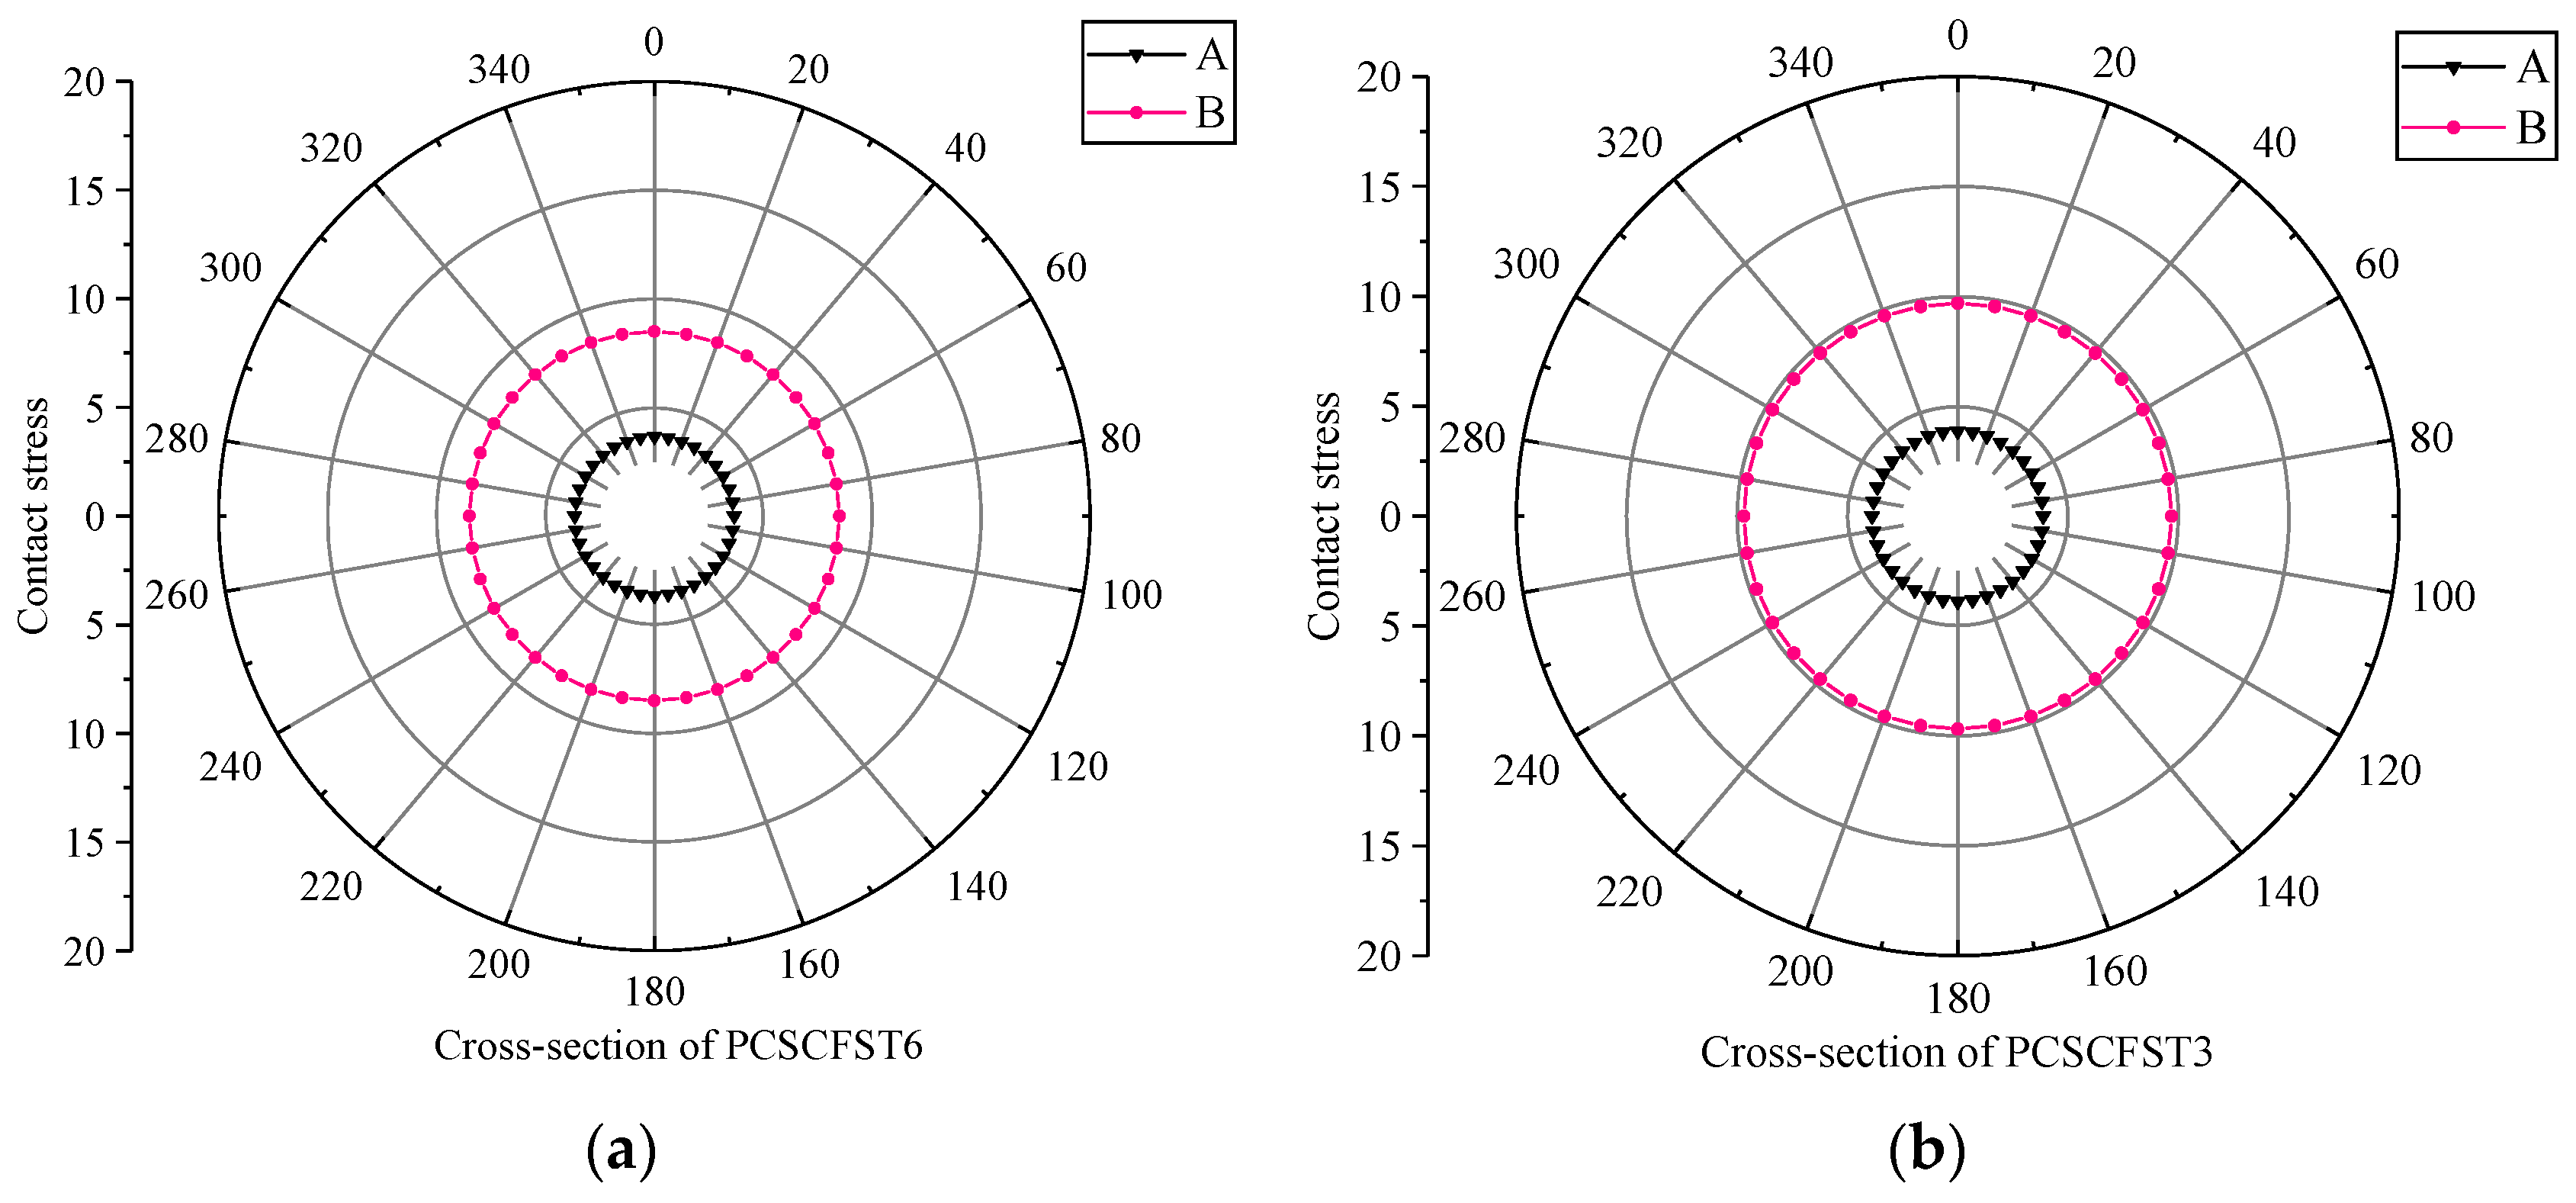
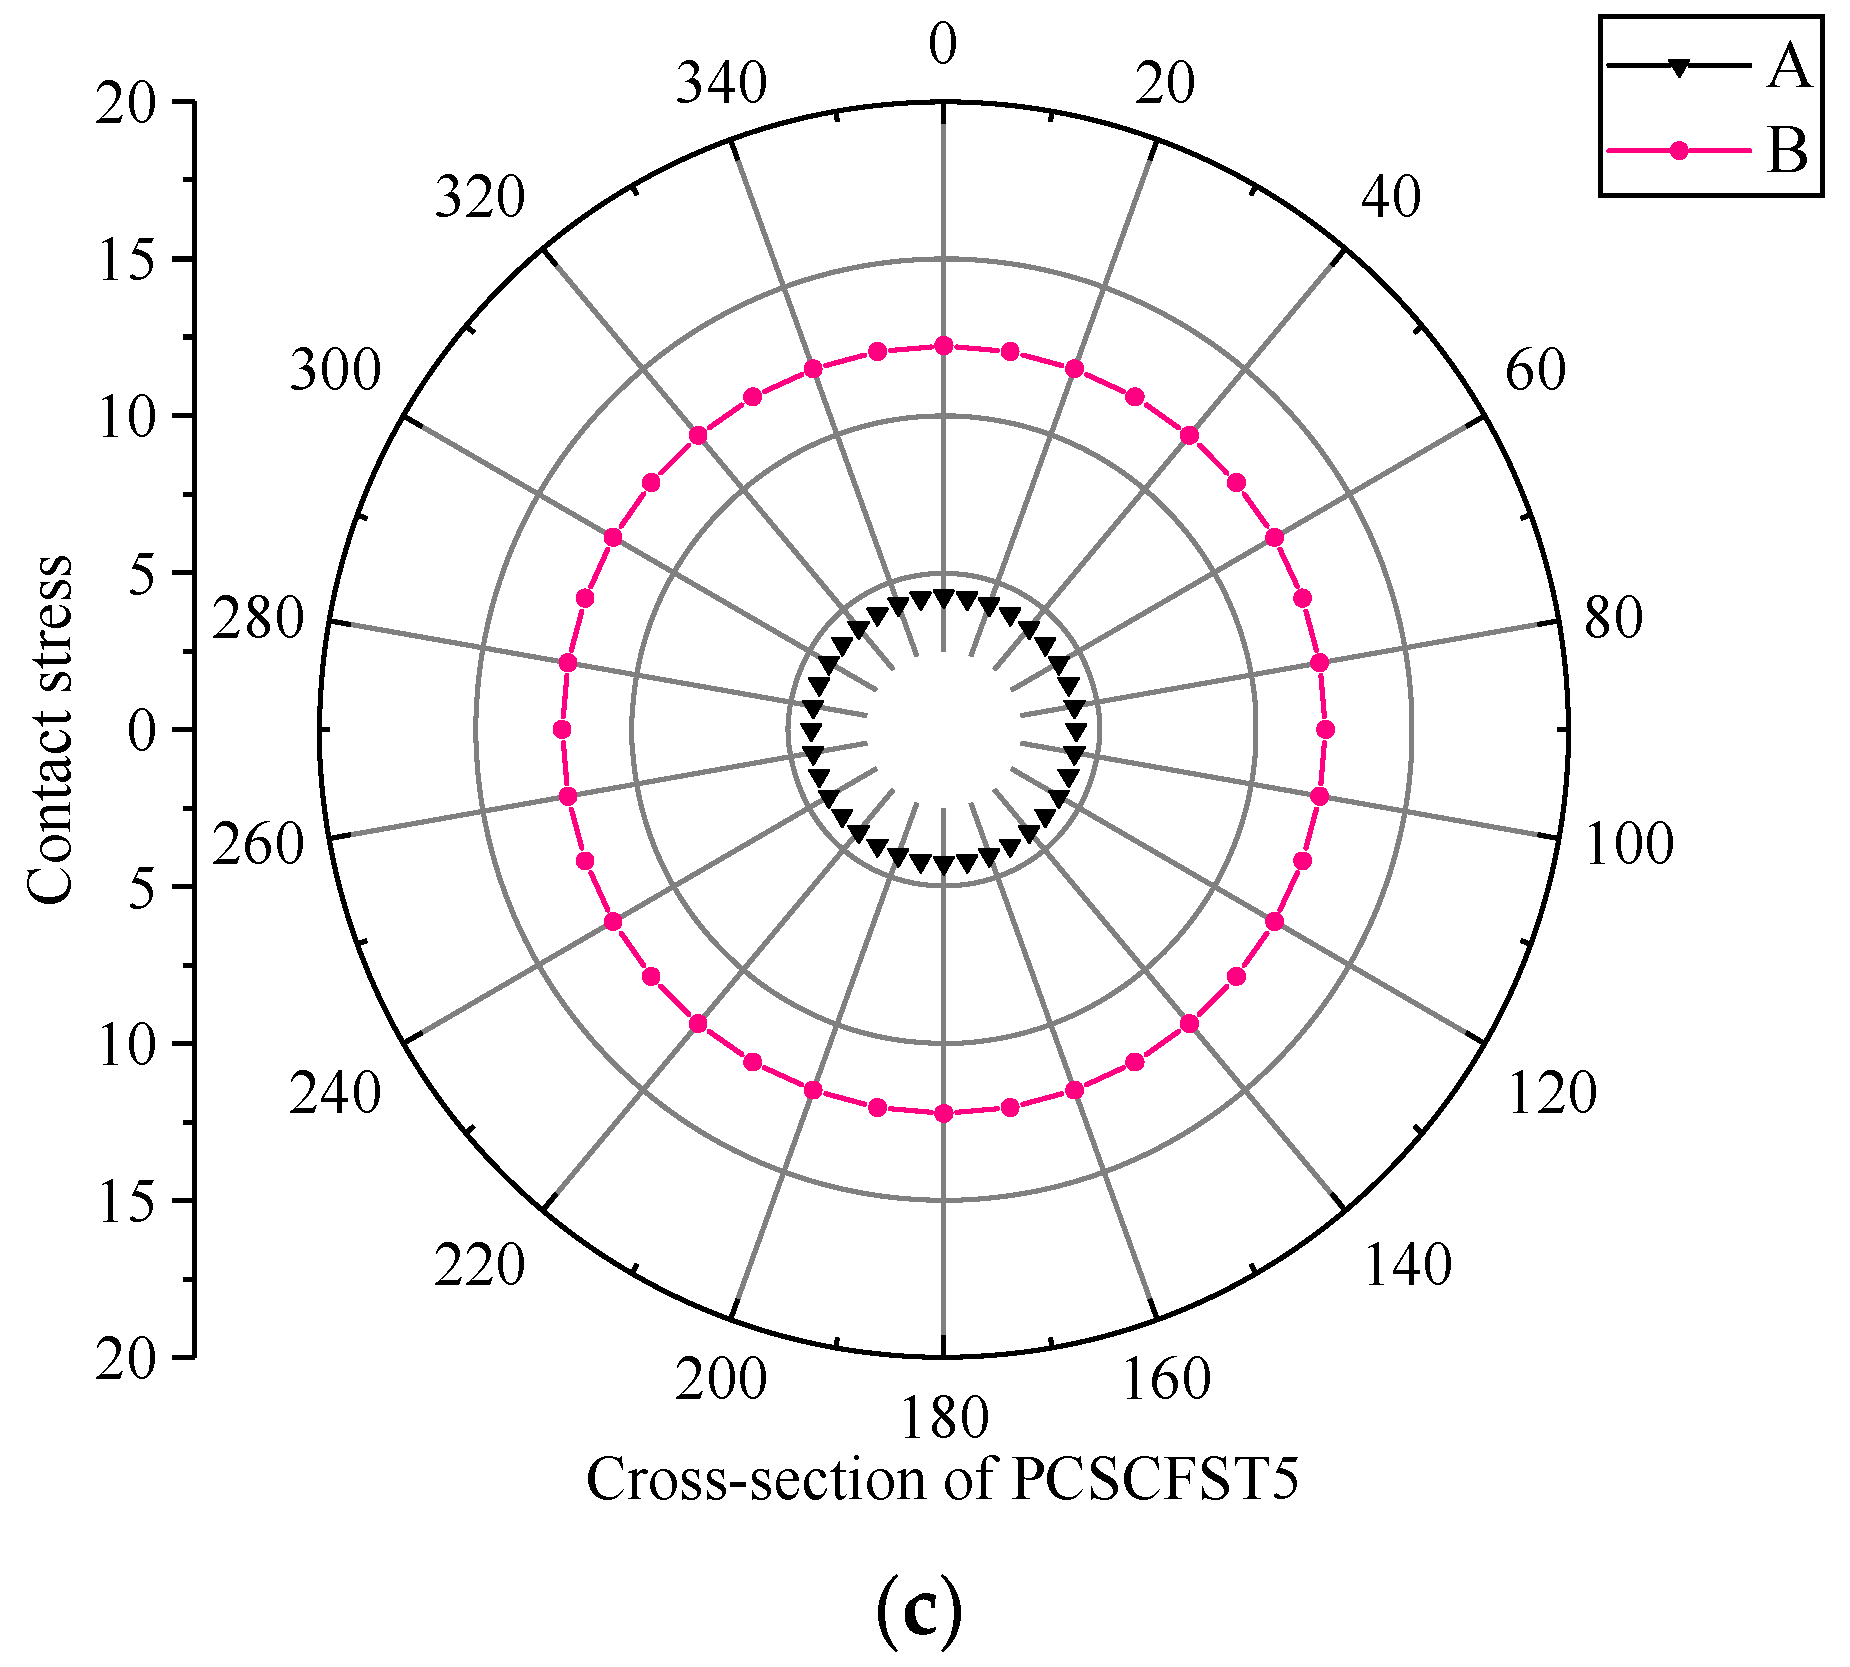
Among the many means that can reflect the circumferential confinement between the steel tube and the concrete, the contact stress is one of the most direct. Owing to the non-uniform distribution of the interaction stress p around the restrained concrete and the semi-continuity of the PCSCFST column, the following analysis uses the average stress at the middle height of the outer steel tube and the concrete, i.e., at the upper and lower column joints. In order to study the confining effect of steel tubes on concrete, the contact stresses were derived from the FE model for different steel tube thicknesses. To investigate the influence of steel tubes thickness on contact stress, the contact stress at the middle position of the uncovered part of the upper and lower steel tubes was deduced from the finite element model based on specimens PCSCFST6,3,5, as shown in Figure 11. In the linear elastic stage, each steel tube has a slight effect on the contact stress. The contact stresses of specimens PCSCFST6, 3 and 5 were 3.65 MPa, 3.88 MPa and 4.25 MPa, respectively. From Figure 11a,b it can be seen that the contact stress between the steel tubes and the outer steel tube is declined with the increase in the thickness of the steel tube, while the contact stress between the steel tube and the core concrete is intensified. Therefore, the greater thickness of the steel tubes allows for enhanced compression between the core concrete and the tubes, while the compression between the steel tube and the outer steel tube is weakened. From Figure 11b,c, the extrusion of the steel tube on the concrete is strengthened to a greater extent by the thickened outer steel tube, which shows from the side that the increase in the contact stress between the steel tube and the concrete is significantly affected by the enhancement of the restriction effect of the outer steel tube.
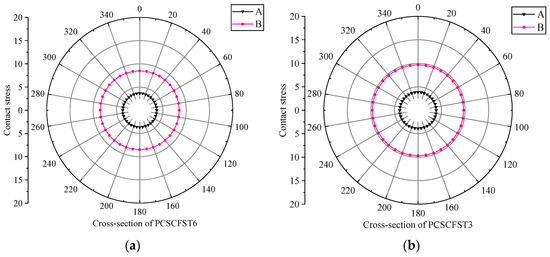
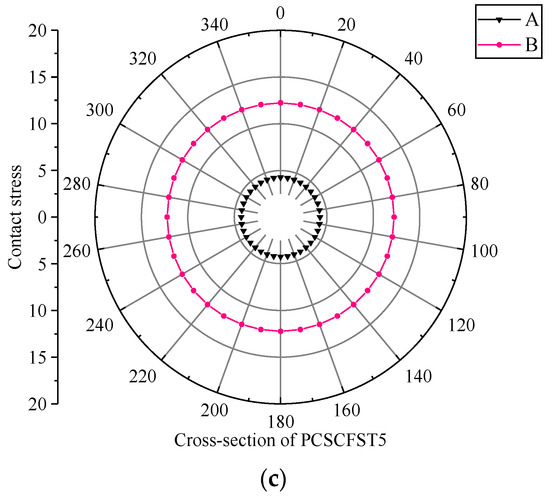
Figure 11.
Effect of steel tube thickness on contact stress: (a) PCSCFST6; (b) PCSCFST3; (c) PCSCFST5.
5.3. Strain of Steel
5.3.1. Strain of Steel Tube
Figure 12 shows the strain of the steel tube. As shown in Figure 12a, the strain in the middle of each steel tube is more pronounced compared to the other parts, which is due to the fact that the upper and lower steel tubes were not crushed by the bolts and the further restraint of the outer steel tube concentrated in the middle region. The conclusion that the strain of the upper and lower steel tube in Figure 12b in the area not restrained by the outer steel tube is higher than the strain of the outer steel tube at the same height is proved by the fact that the restraint of the outer steel tube strengthens the strain of the steel tube.
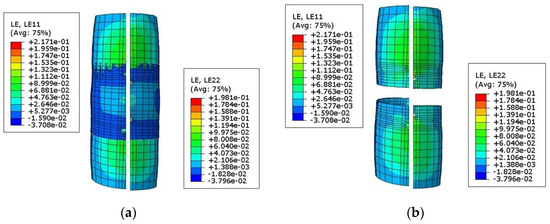
Figure 12.
Strain of steel tubes: (a) strain of all steel tubes; (b) strain of upper and lower steel tube.
5.3.2. Strain of Bolt
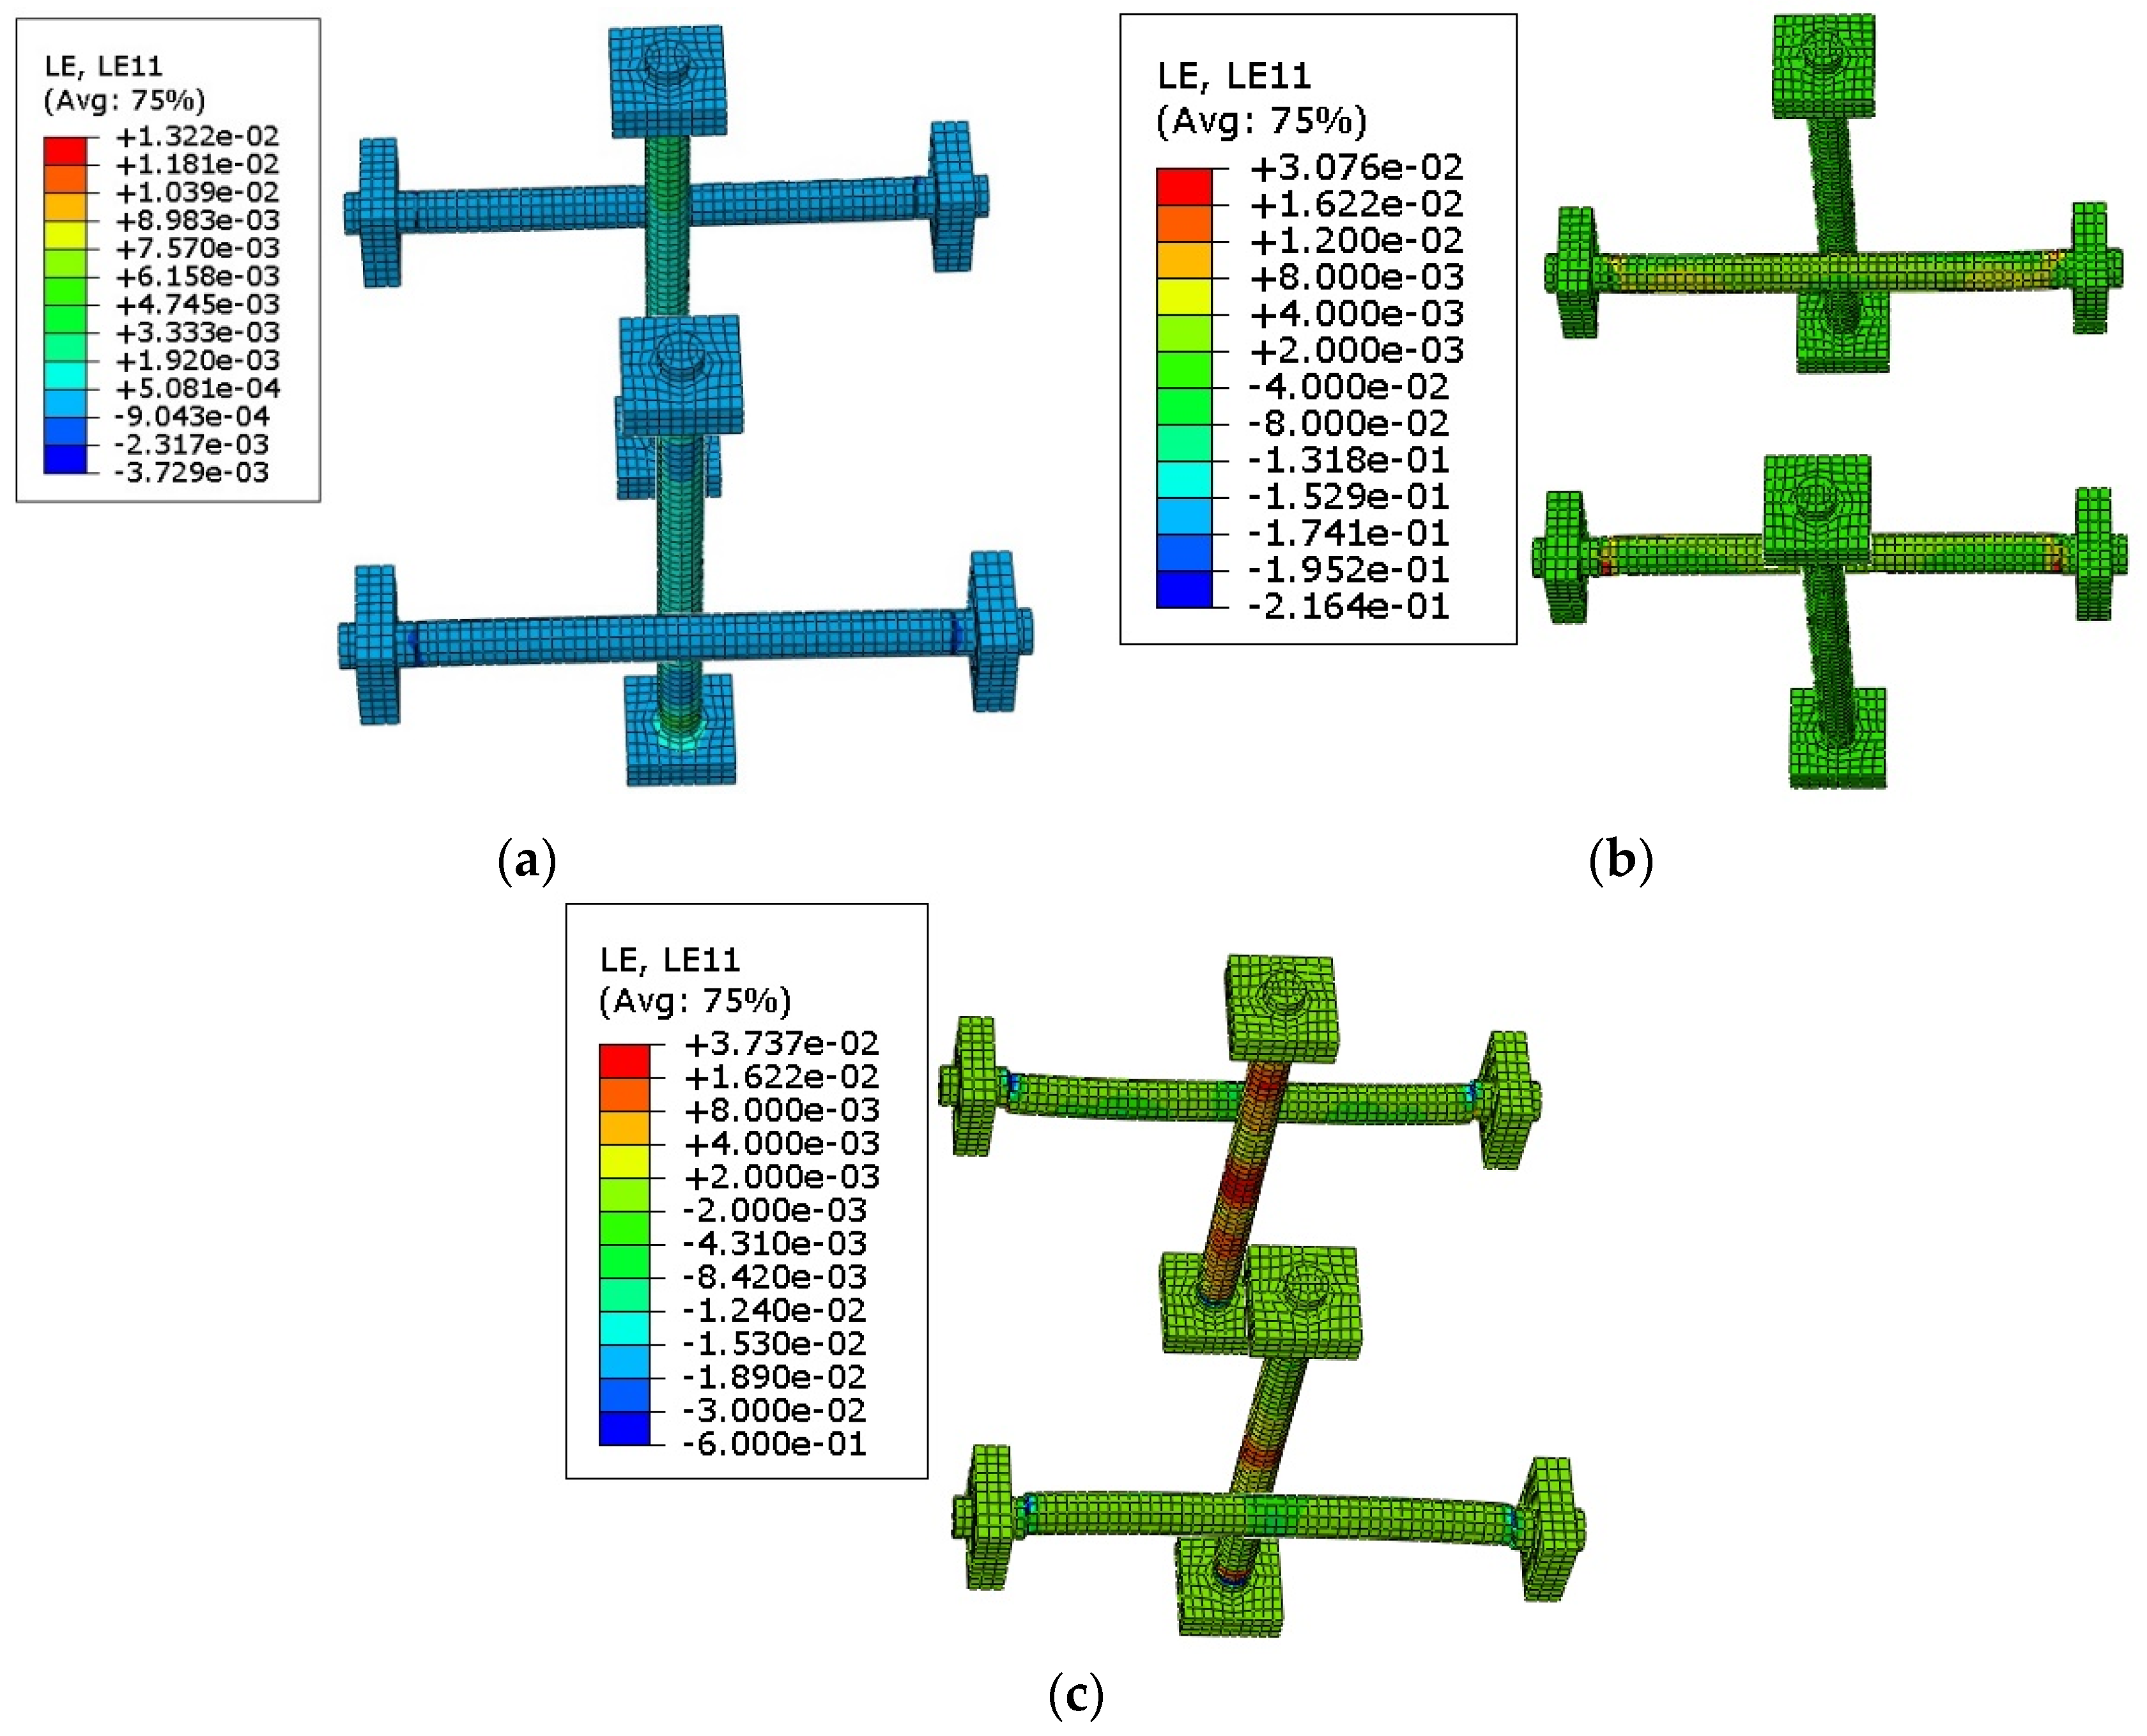
The strain diagrams of the bolt during compression of the conceptual point A, point B and point C are shown in Figure 13, respectively. In Figure 13, the bolt is bent toward the middle of the specimen, and the part of the bolt near the middle of the specimen in Figure 13a,b is deformed to produce tensile strain, while the other parts are gradually transformed from compressed to tensile in Figure 13c, the reason for this phenomenon is that the bolt is extruded by the concrete and steel tube in the early stage, and gradually the steel tube expands due to the breakage of the concrete in the later stage, thus causing the bolt to be tensile.
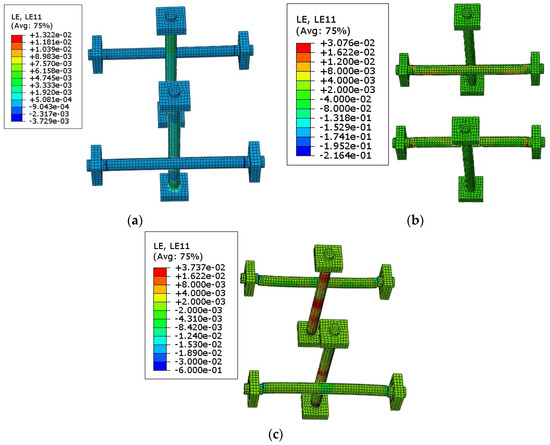
Figure 13.
Strain of each bolt: (a) Compressive strain at conceptual point A; (b) Compressive strain at conceptual point B; (c) Strains at the ultimate load.
5.4. Stress–Strain Response of Core Concrete
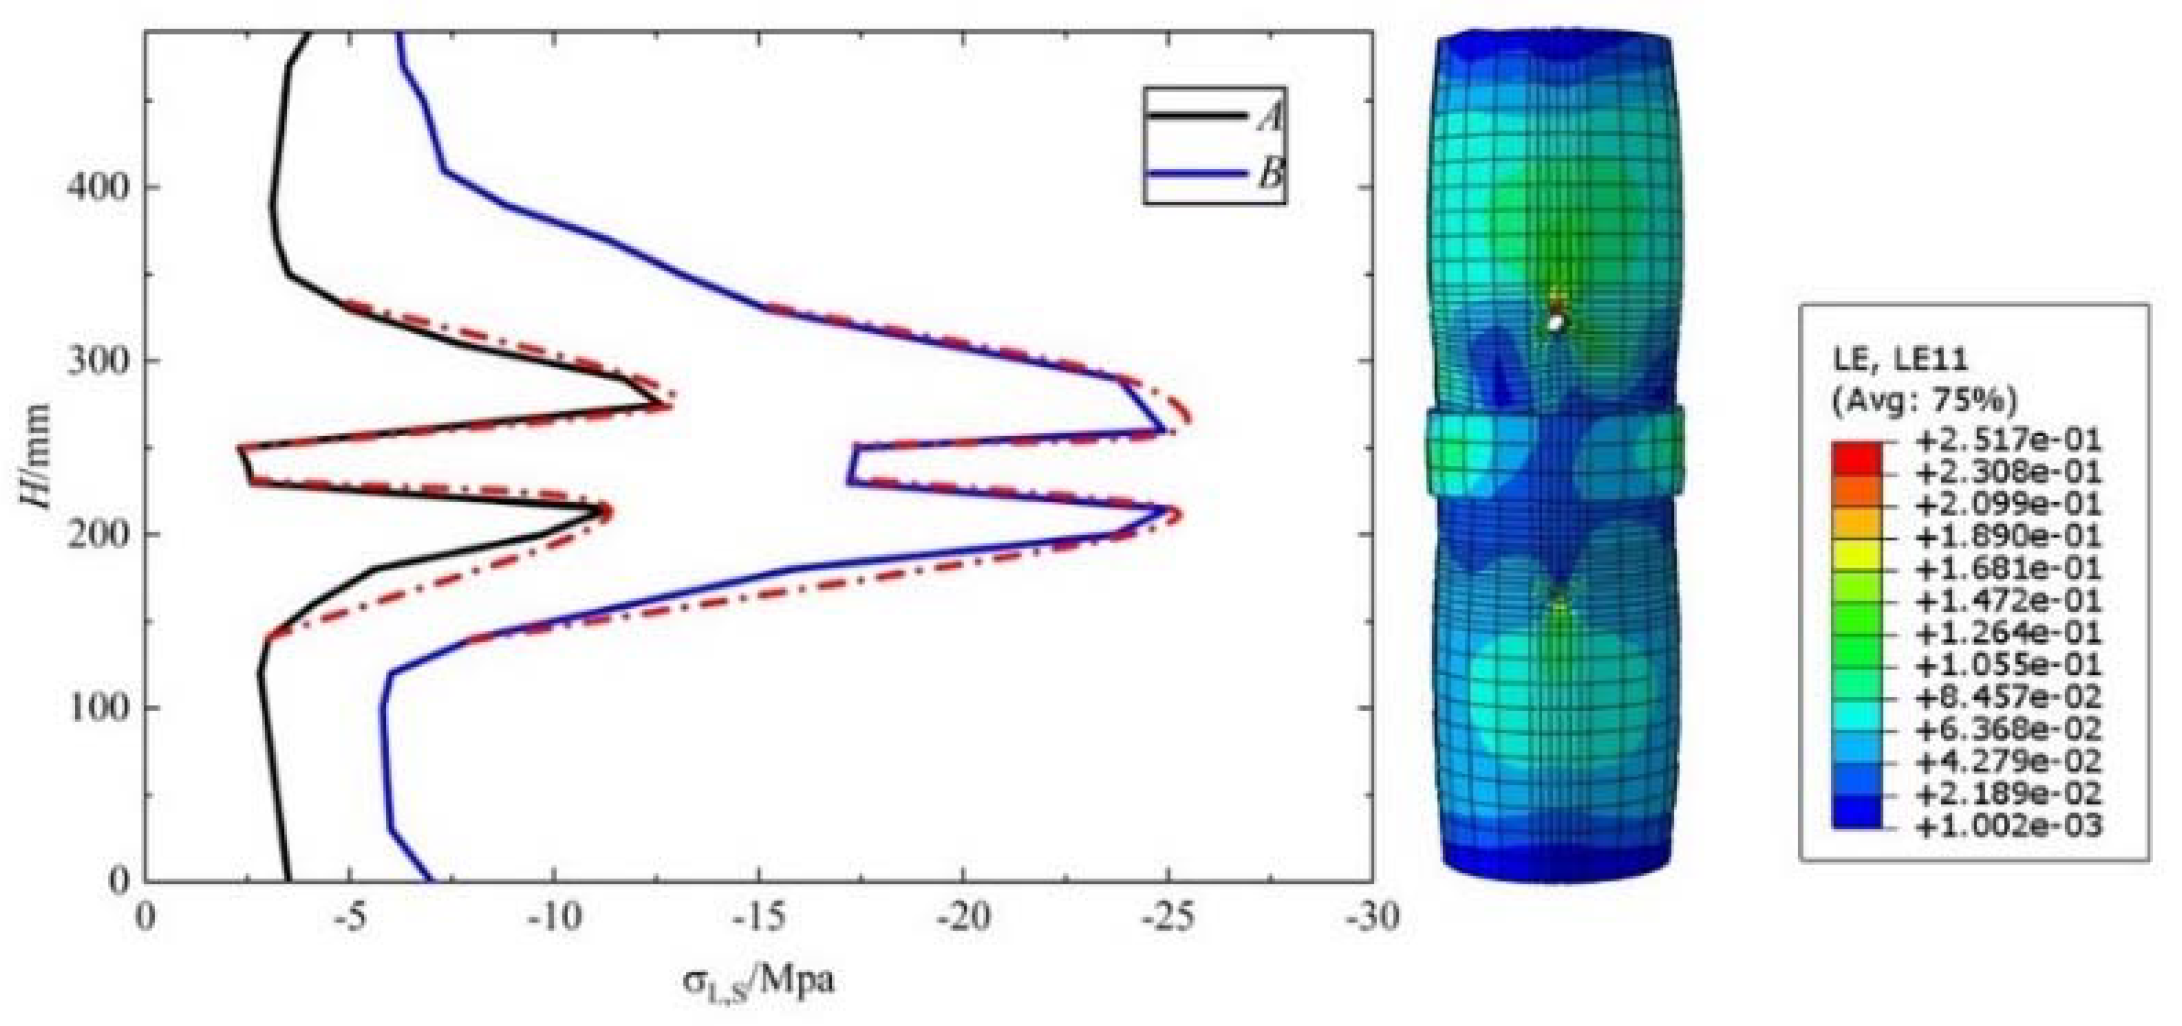
In order to study the stress–strain response of the core concrete of PCSCFST columns under axial compression, PCSCFST6 specimen was analyzed to study the longitudinal stress–strain response of their concrete at conceptual point A and B, as shown in Figure 14. The strain at ultimate load can be observed through the strain diagram, while the stress value is observed through the curve in right angle coordinates.
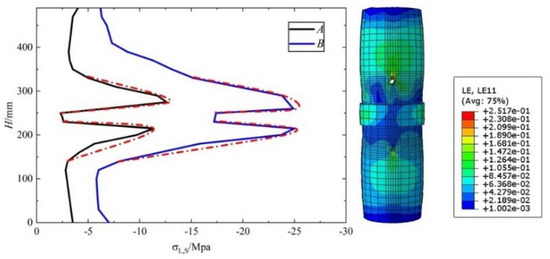
Figure 14.
Stress–strain response of core concrete.
The results reveal that the closer the area covered by the outer steel tube is to the bolt, the higher the longitudinal stress is, until the maximum stress is near the bolt, with a parabolic growth and decay, and the longitudinal stress in the concrete restrained by the outer steel tube only at the semi-continuous place is as low and uniformly distributed as the upper and lower steel tubes near the foot of the column without the outer steel tube restraint. Obviously, the material properties of the core concrete itself are fully exploited by the restraining effect of the bolts and the outer steel tube. The longitudinal stress increases with decreasing the distance of the bolt, because the bolt enhances the restraint effect from conceptual point A to B.
The longitudinal strain of the core concrete is greater in the middle region of the upper and lower steel tubes and decreases nearer to the foot of the column because it is restrained by the foot of the column and the outer steel tube. The longitudinal strain of the concrete at the semi-continuous point is slightly higher than that at the foot of the column, where it is restrained by the outer steel tube and the upper and lower steel tubes together.
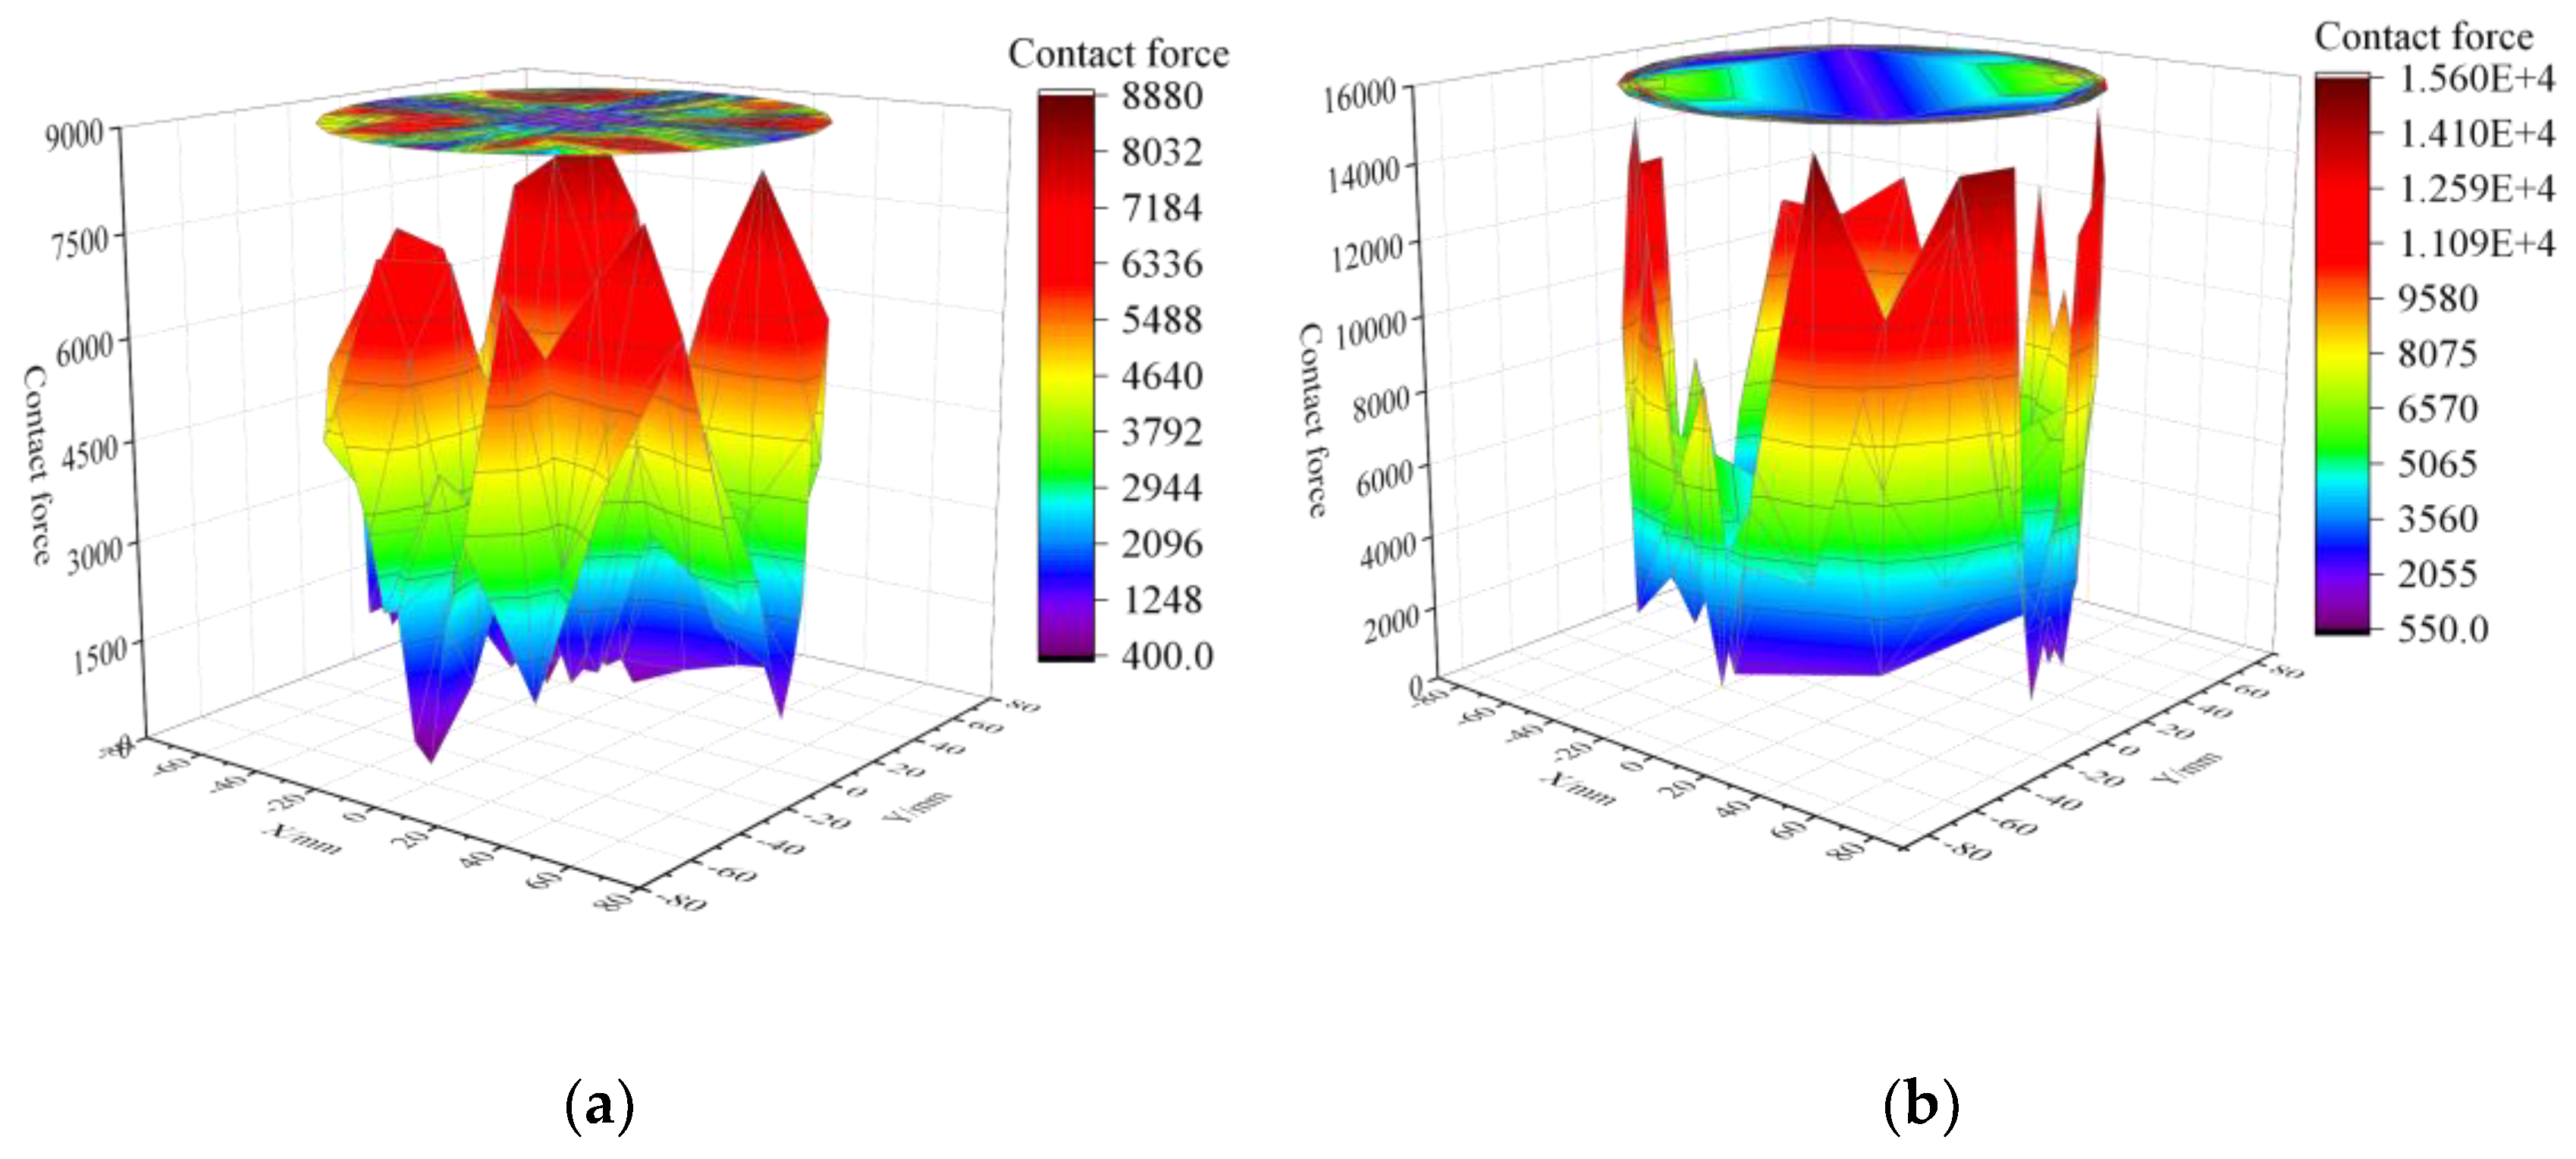
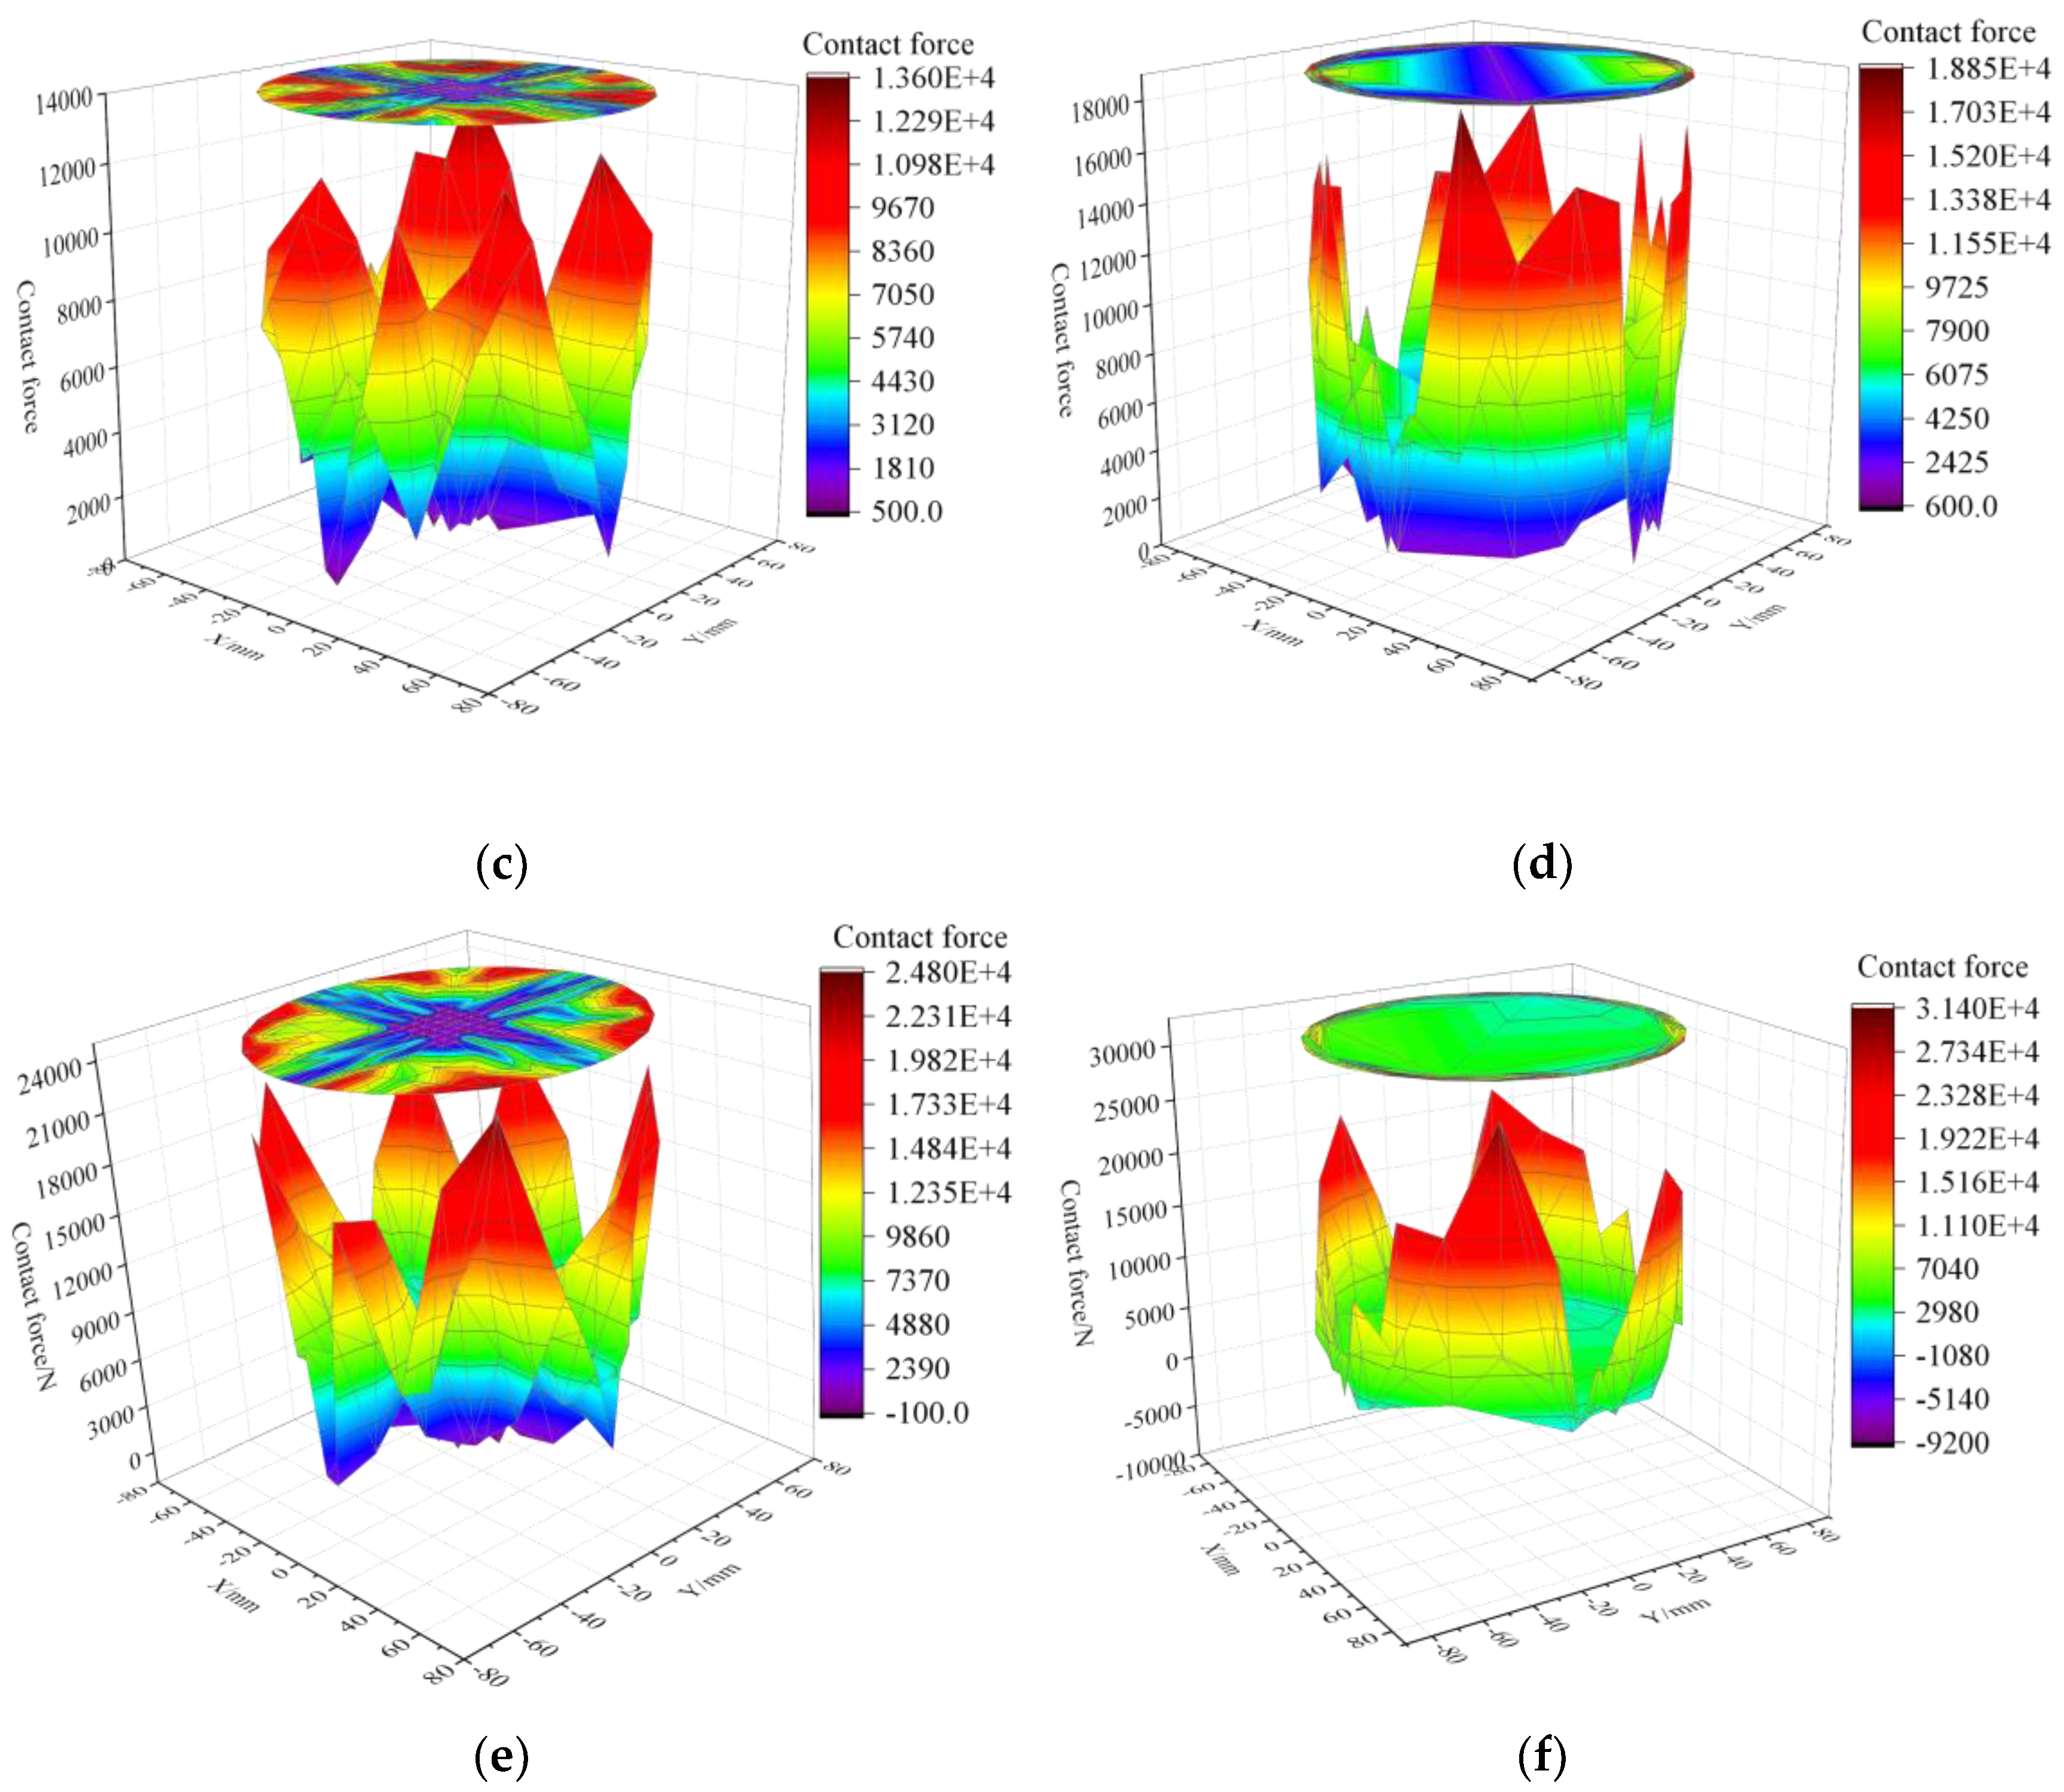
5.5. Contact Force of Steel Tube and Concrete with the Upper End Plate
Figure 15 reflects the contact force of steel tube and concrete with the upper end plate. It can be seen from Figure 15 that the longitudinal bearing capacity of concrete is better than that of steel tube, which makes concrete bear most of the load in each stage of axial compression. From Figure 15a–f, the contact forces on the compressed surfaces of concrete and steel tube are mostly distributed at the edges, where the contact forces on the concrete surface gradually shift to the edges, and the two tend to be similar between the conceptual point A and point B, and after point B there are more contact forces on the concrete surface than on the steel tube. The difference of material properties leads to the difference of contact force between steel tube and concrete on the same section, while the better bearing capacity of concrete makes the contact force of its section mostly distributed near the interface with steel tube. As the compression of the specimen transforms from the elastic phase to the elasto-plastic phase, the contact force of the steel tube section is transferred to the edge due to its deformation, and the contact force of the concrete section is also transferred to the periphery due to its deformation making its difference from the steel tube increase.
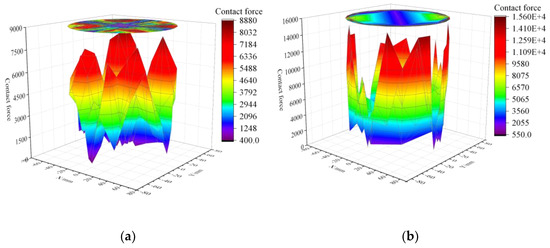
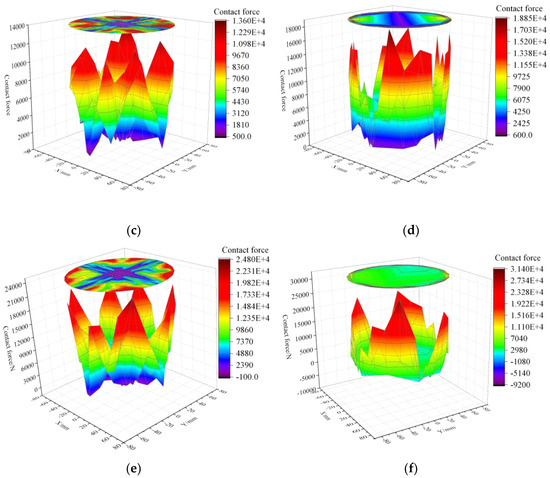
Figure 15.
Contact force of steel tube and concrete with the upper end plate: (a) Upper concrete at conceptual point A; (b) Upper steel tube at conceptual point A; (c) Upper concrete at conceptual point B; (d) Upper steel tube at conceptual point B; (e) Upper concrete at ultimate load; (f) Upper steel tube at ultimate load.
5.6. Parameter Analysis
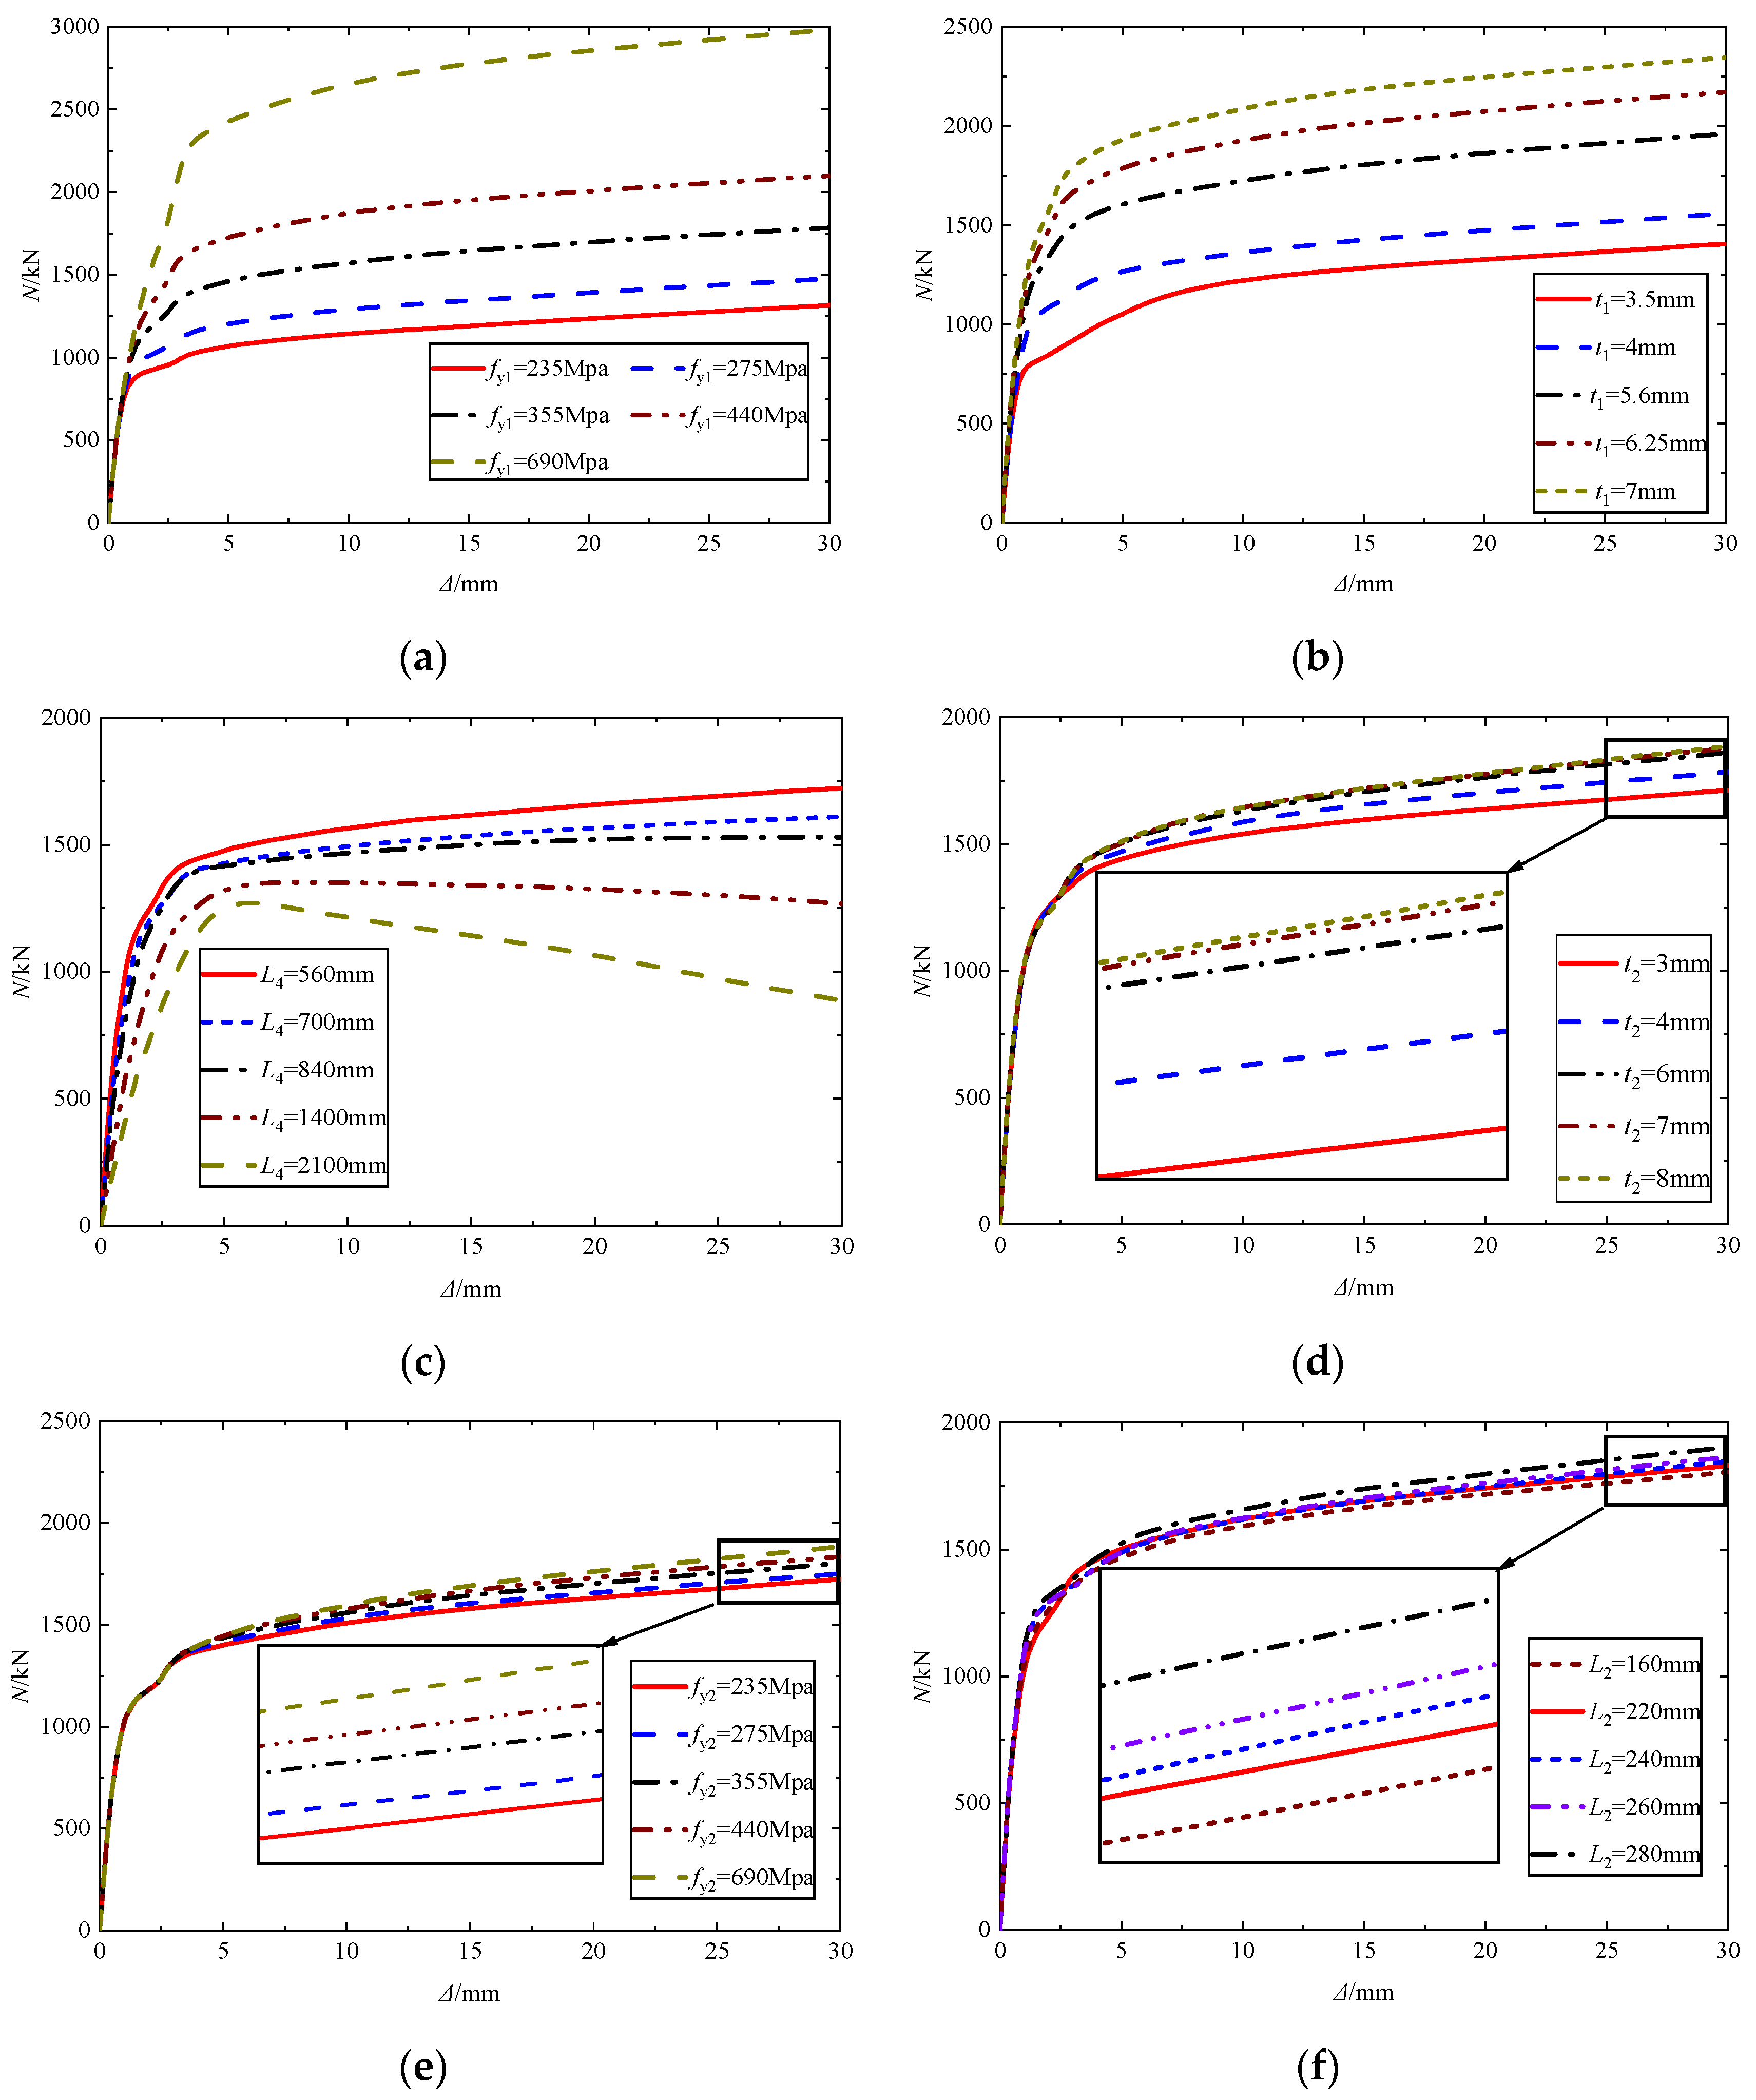
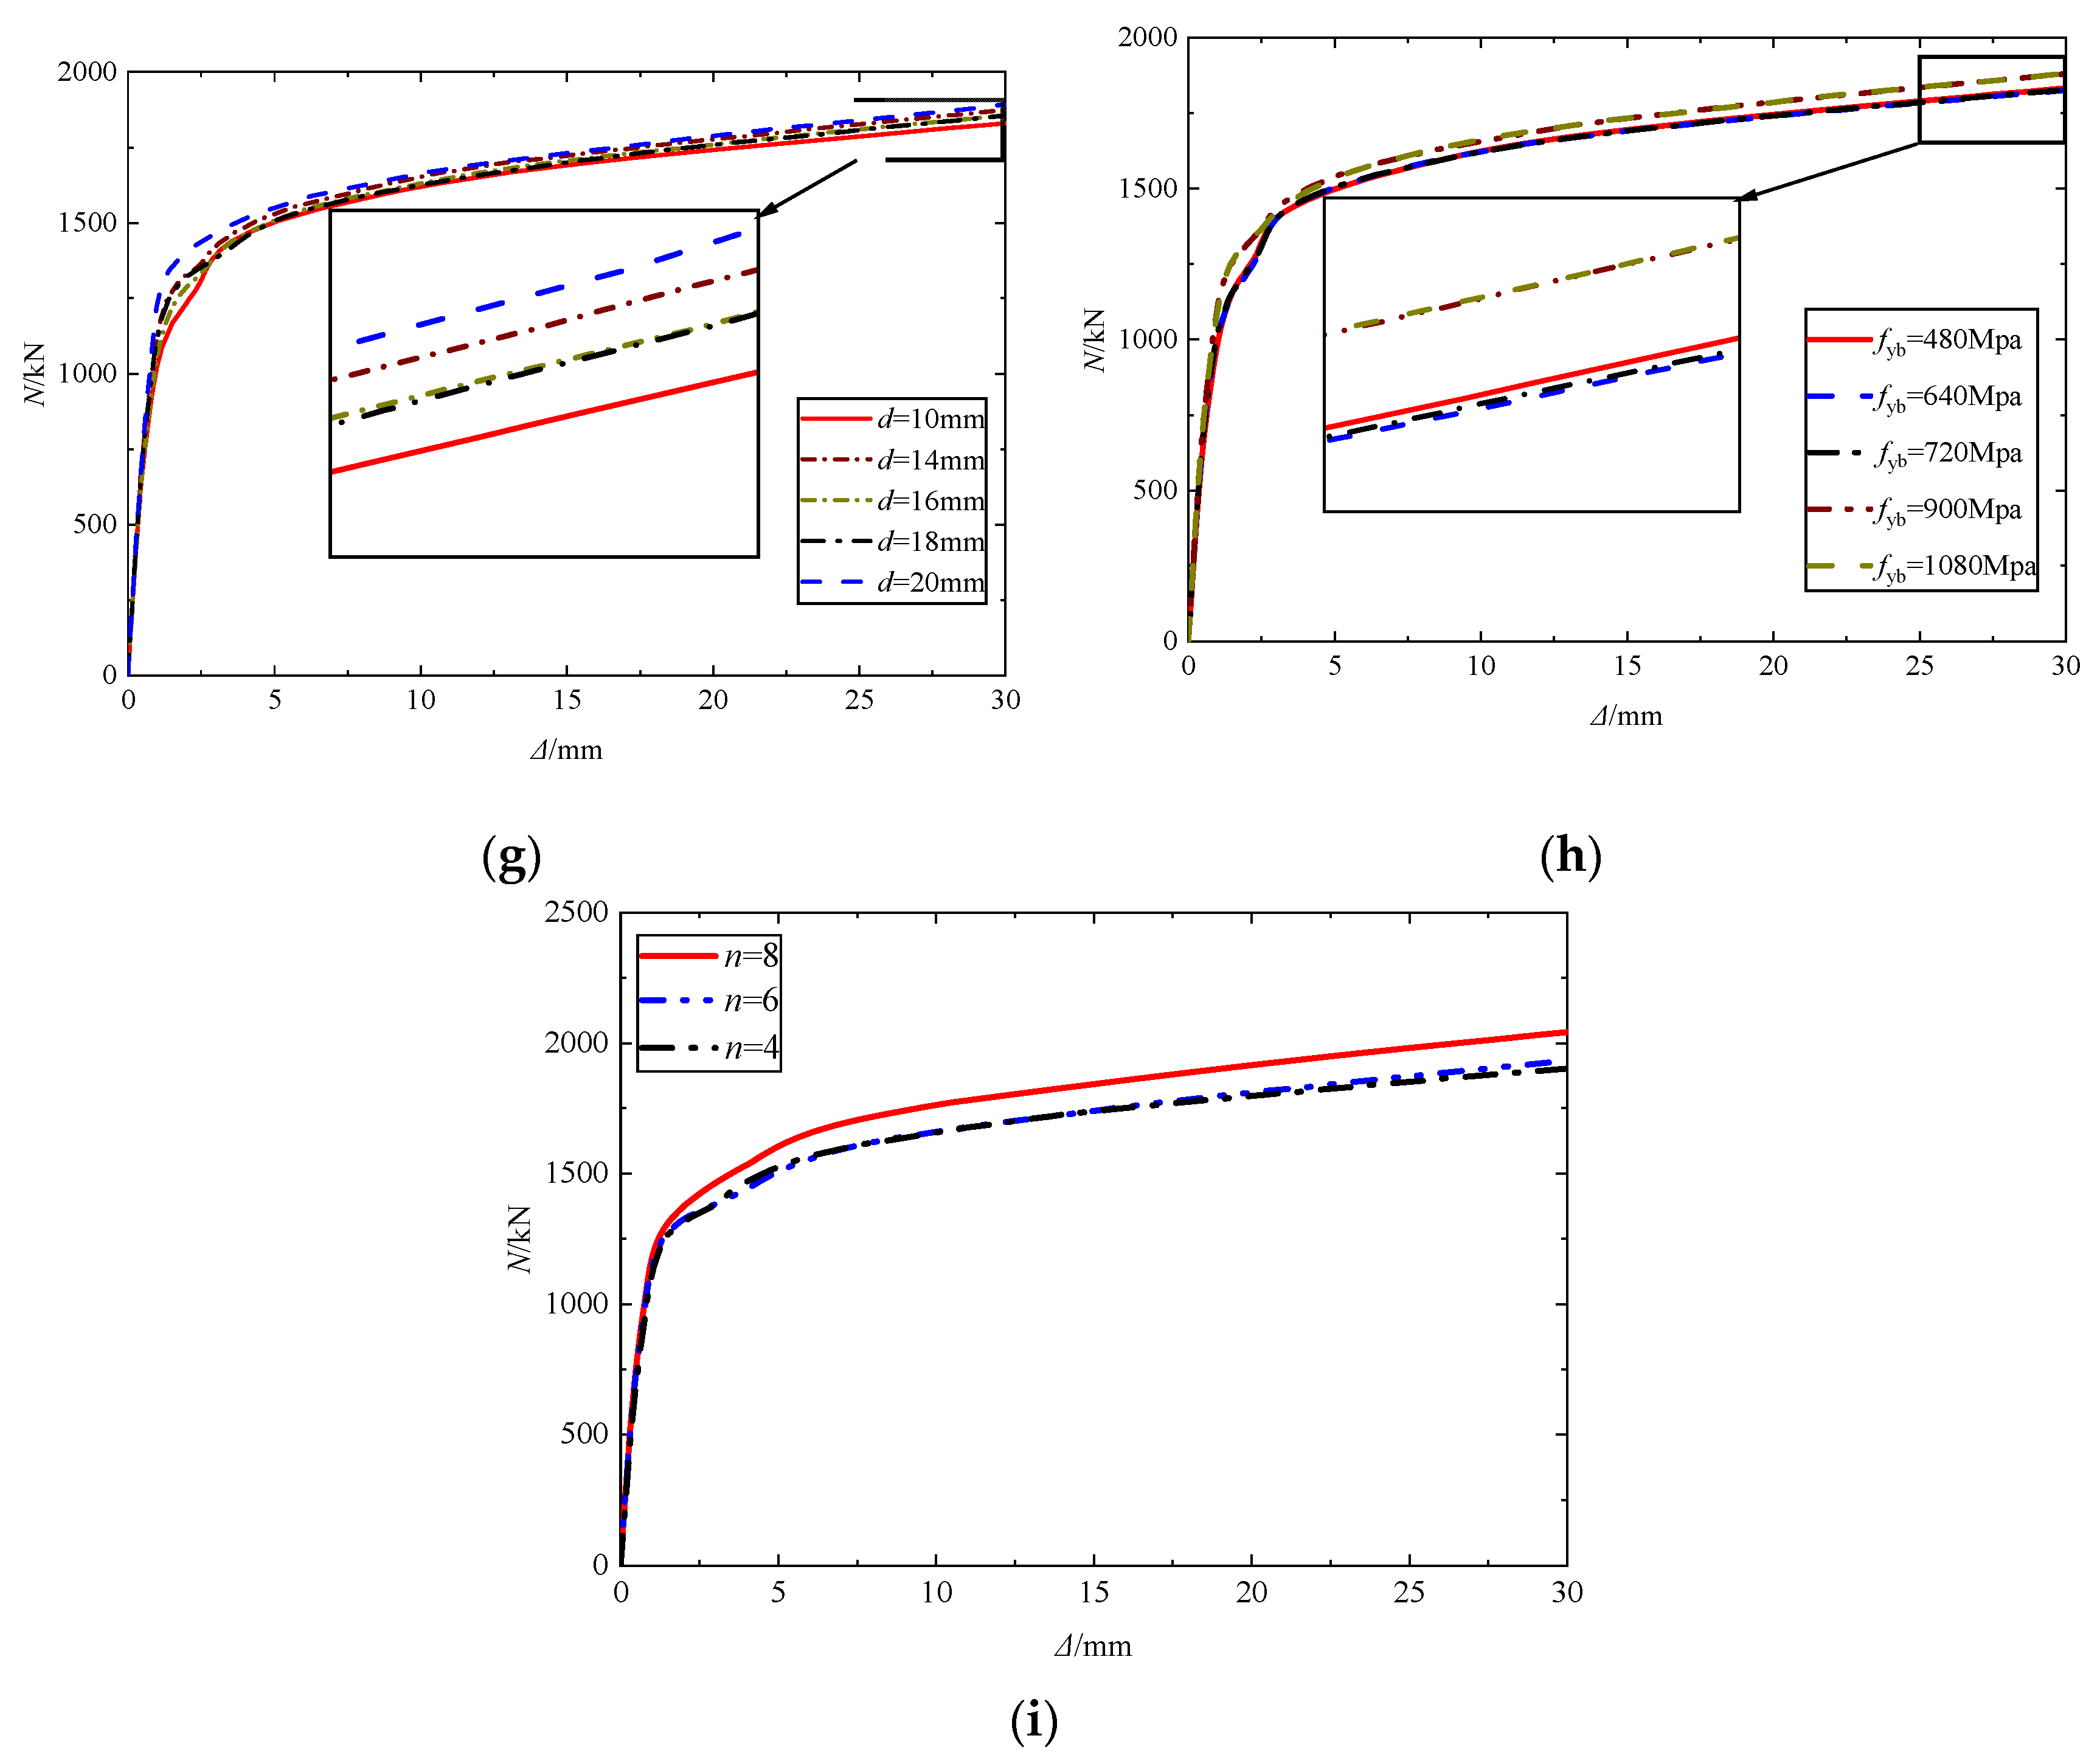
A series of parametric analysis were carried out on the selected specimen PCSCFST6 in the literature [37] to investigate the effects of the yield strength of the steel, the length of the outer steel tube, the specimen length, and the number and diameter of the bolts on the N–Δ histories of the structural performance of the axially loaded column. The structural properties of this new component are analyzed accordingly. Where L2 is the length of the outer steel tube, fy1 is the yield strength of the upper steel tube and lower steel tube, fy2 is the yield strength of the outer steel tube, and fyb is the yield strength of the bolt. In the specimen PCSCFST6, D is the diameter of steel tube, taking 140 mm, B1 is the diameter of the outer steel tube. fcu is 31.1 Mpa, fy1 and fy2 is 367.2 Mpa, fyb is 811.5 Mpa, t1 and t2 is 5 mm, L2 is 200 mm, L4 is 490 mm.
The effect of each parameter changes on the load–compression curve (N–Δ) of the specimen is shown in Figure 16. Figure 16a shows that the increase in the yield strength of the steel tubes (fy1) has almost no effect on the stiffness of the specimen in the first period, but shows a tendency to increase the stiffness and the ultimate load in the second period at the same frequency. The increase in the thickness of the upper and lower steel tubes (t1) strengthens the stiffness and ultimate load of the specimen, and shows a greater strengthening near the thickness of the outer steel tube, as shown in Figure 16b. It can be concluded that the increase in the diameter to thickness ratio of the upper and lower steel tubes (D/t1) contributes positively to the stiffness of the specimen and the enhancement of the ultimate load. Figure 16c shows that as the length of the specimen (L4) increases, both the ultimate load and the stiffness show a tendency to be gradually weakened, which leads to the conclusion that the specimen slenderness ratio (λ = 4D/L4) and the bearing capacity of the specimen show a negative correlation. In particular, the length of the specimen exceeds 840 mm (λ = 24), and a decreasing segment appears in the later part of the load-compression curve. The stiffness and ultimate load of the specimen are affected by the diameter to thickness ratio of the outer steel tube (B1/t2), but the magnitude is weaker. In addition, the higher the consistency of the individual steel tube thicknesses, the more strongly the axial compression properties of the specimens are enhanced, as evidenced by both Figure 16a,b. The higher the thickness (t2) and yield strength (fy2) of the outer steel tube, the higher the ultimate load on the specimen, but the effect on the resistance to deformation is negligible, as shown in Figure 16d,e. From the above analysis, the time to obtain the axial compression performance may be greatly improved by keeping the consistency of each steel tube in terms of material and dimensions.
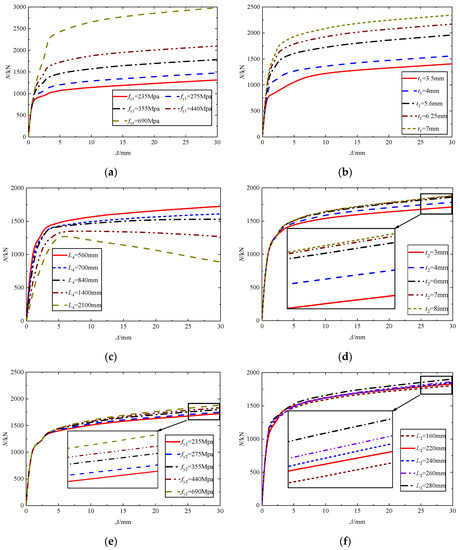
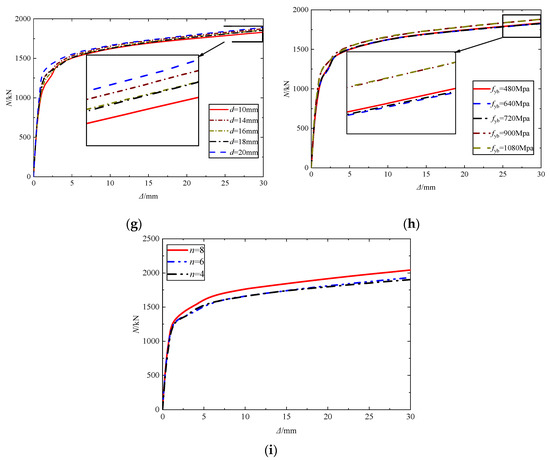
Figure 16.
The effect of each parameter on the N–Δ curve: (a) Yield strength of upper and lower steel tubes; (b) Thickness of upper and lower steel tubes; (c) Length of specimen; (d) Thickness of outer steel tube; (e) Yield strength of outer steel tube; (f) Length of outer steel tube; (g) Diameter of bolt; (h) Yield strength of bolt; (i) Number of bolts.
The N–Δ curve of the specimens in Figure 16f show little change due to the increase in the length of the outer steel tube (L2), so the conclusion that the ratio of the specimen length to the outer steel tube length (L4/L2) has a small effect on the axial compression performance of the PCSCFST column can be drawn without difficulty. It is important to note that the ultimate load reinforcement is larger when L4/L2 increases to 1.75 and 2.45. The ultimate load on the specimen will be positively benefited by the increase in the bolt diameter until it reaches D/10 and the opposite effect beyond D/10 can be deduced from Figure 16g; however, when it reached D/7, the ultimate load increased again and exceeded the previous value. Thus, setting the bolt diameter (d) to one tenth of the diameter of the upper and lower steel tubes of the PCSCFST column is considered to be the best solution to exploit its mechanical properties. The increase in the yield strength of the bolt material over the upper and lower steel tube material weakened the ultimate load of the specimen, and the larger reinforcement presented after reaching twice as much, which then stagnated, as shown in Figure 16h. Thus, in the engineering example of the bolt yield strength (fyb) to close to twice the yield strength of the upper and lower steel tube (fy1) is the best. The curve in Figure 16i can be resolved by the conclusion that the increase in the number of bolts (n) gives an enhanced axial compression performance of the specimen, and this effect is more evident when both axial and upper and lower steel tubes of the specimen are increased at the same time. This may be due to the fact that this arrangement is more conducive to the superior symmetry of the PCSCFST column itself, thus allowing the specimen bearing capacity to be increased. In order to further optimize the bearing capacity of the specimen, the bolts were arranged symmetrically on each axis was suggested.
6. Predictions of Ultimate Bearing Capacity
6.1. The Existing Prediction Formula of Ultimate Bearing Capacity
6.1.1. Lai and Ho [17]
Lai and Ho [17] proposed a theoretical method for bearing capacity prediction based on a certain number of steel rings attached to continuous type steel tube concrete columns, which can be expressed by Equations (7)–(12):
where NuL is the predicted ultimate bearing capacity; d is the diameter of outer rings; is the cross-sectional area of core concrete; fyr is the yield strength of outer rings; and n is the number of rings.
6.1.2. Alrebeh [33]
Using the Von-Mises damage criterion, the longitudinal stress and circumferential stress at the time of steel tube damage can be correlated with the uniaxial yield strength. The radial stresses in the steel tube can be neglected [41,42,43]. The prediction formula of ultimate bearing capacity can be expressed by Equations (13)–(17):
where D, H, and are the same as in Reference [17]; is the yield strength of the spiral; S is the spiral spacing; NuA is the predicted ultimate bearing capacity.
6.1.3. Analysis of the Results of the Cited Literature
The results calculated by the formulas in references [17,33] and their agreement with the results of the finite element model are shown in Table 4. The average error of the results calculated by Lai’s formula is about 14%, but its fluctuation is too large or even more than 50% when the diameter–thickness ratio of steel tubes and the yield strength of steel tubes change. The results calculated by Alrebeh’s formula are mostly far lower than those of finite element simulation, even the average value is about 40% lower than that of finite element simulation, and the overall fluctuation is large.

Table 4.
FE results and predicted results of ultimate bearing capacity of PCSCFST columns.
To sum up, these two formulas have large fluctuation and error, so they can’t predict the ultimate bearing capacity of PCSCFST columns well. Therefore, a new formula needs to be proposed forward to accurately predict the ultimate bearing capacity of the PCSCFST column.
6.2. Propose the Prediction Formula of PCSCFST Column
After the load is transferred from the loading plate into the specimen, it passes through the upper column and then into the lower column through the discontinuity, and there is also the involvement of the bolt and the outer steel tube in the middle region. The concrete, the steel tubes and the bolts need to be allocated to the composition of the bearing capacity of the specimen in different degrees according to the load transfer path.
The constraint index (ξ) (Equation (11)) is an important parameter in the composite action mentioned by [44,45]. In this study, the definition of the value of ξ was broadened to take into account the effect of semi-continuity.
where is the total cross-section area of steel tube and outer steel tube; is cross-section area of steel tube; is the yield strength of outer steel tube; is the spacing between the upper and lower steel tubes; and is 50 mm; D is the outer diameter of the steel tube.
For the core concrete, the following formula is developed to calculate the confined concrete stress under confining pressure ():
where K is the confinement coefficient, and K equals 3.16 as suggested by [46].
Equation (10) was improved according to the construction and discontinuity of the PCSCFST column, and the variability of the enclosing pressure of the concrete restrained only by the outer steel tube and bolts between the upper and lower steel tubes in the middle of the specimen was taken into account.
Considering the presence of bolts in the specimen, the bolt bearing capacity needs to be added to the bearing capacity formula and the bolt restraint index is introduced. Equation (26) is the description of the instability reduction factor of the bearing capacity formula of slender columns in Zhu and Liang’s model [47].
where is the bearing strength design value of bolt, and according to Reference [48] in this paper, is taken as 405 Mpa; n is the number of bolt, is the instability correction factor of the specimen, , , are the discontinuous correction coefficients for steel tube, concrete and bolt, respectively.
In addition, it can be seen in Table 4 that the mean of the results calculated using the proposed new formulation is slightly lower than that of the FE simulation, and the standard deviation of the ratio of the FE results to the predicted values is only 0.0389. Thus, the ultimate bearing capacity of the PCSCFST columns can be well predicted by the proposed formulas.
7. Conclusions
In this paper, the accuracy of the proposed model was verified by numerical simulation of PCSCFST columns in terms of damage modes and load–compression curves, and the axial compression performance of PCSCFST columns was further analyzed in terms of contact stress, stress–strain response, contact force and parameter expansion.
- The FE model of PCSCFST column axial compression specimen was established, and the model was in good agreement with the test results in terms of damage mode, load–compression curves and ultimate bearing capacity.
- In the elastic stage, steel tubes have little effect on the contact stress; the increase in the contact stress between the steel tube and the concrete is significantly affected by the enhancement of the confinement effect of the outer steel tube, while the contact stress between the upper steel tube and the outer steel tube is declined with the increase in the thickness of the steel tube.
- The strains of the steel tube and bolt are maximum in the middle of each; the strain in the middle of the bolt is in tension, and the other areas change from compression to tension due to local buckling of the steel tube.
- The closer the area covered by the outer steel tube is to the bolt, the higher the longitudinal stress is, until the maximum stress is near the bolt, with a parabolic growth and decay, and the longitudinal stress in the concrete restrained by the outer steel tube only at the semi-continuous place is as low and uniformly distributed as the upper and lower steel tubes near the foot of the column without the outer steel tube restraint; and the bolt enhances the restraint effect from conceptual point A to B.
- As the load increases, the load they share gradually shifts to the edge because of the deformation of the compressed surface of concrete and steel tube.
- The increase in the yield strength and diameter–thickness ratio of the upper and lower steel tubes resulted in a significant increase in the bearing capacity of the specimen, while the increase in the thickness and yield strength of the outer steel tube and the number of bolts had a very slight increase in the bearing capacity.
- The diameter ratio of bolt to steel tube (d/D) increases to 1/10, the bearing capacity increases slightly, the ratio (d/D) continues to increase until the bearing capacity decreases slightly, and the bearing capacity appears to increase significantly after the ratio (d/D) reaches 1/7; the yield strength ratio of bolt to upper and lower steel tube (fyb/fy1) increases from 1 to 2, the bearing capacity decreases slightly, and the bearing capacity increases significantly when the ratio (fyb/fy1) reaches about 2. After that, the change is minimal.
- The model for the validation test illustrates that the increase in concrete enhances the bearing capacity of the specimen.
- A theoretical model was developed to predict the ultimate bearing capacity of the PCSCFST columns, and a close correlation was found between the FE simulation results and the theoretical model. The mean ratio of the FE ultimate load Nu,FE to the predicted ultimate load Nu,pre was 1.006 with a standard deviation of 0.0389.
- The eccentric compressive properties of PCSCFST columns can be explored to further refine the study of their mechanical properties.
Author Contributions
Project administration, B.C.; writing—original draft preparation, M.X.; formal analysis, B.H.; software, G.H. and J.W. All authors have read and agreed to the published version of the manuscript.
Funding
The authors disclosed receipt of the following financial support for the research: this study is funded by Anhui Polytechnic University Talent Launch Fund Project (No. 2022YQQ113), Anhui University and College Natural Science Research Project (No. KJ2020A0366, KJ2018A0118 and KJ2021A0504).
Data Availability Statement
Not applicable.
Conflicts of Interest
The authors declared no potential conflict of interest with respect to the research, authorship, and publication of this article.
References
- Pam, H.J.; Ho, J.C.M. Length of critical region for confinement steel in limited ductility high-strength reinforced concrete columns. Eng. Struct. 2009, 31, 2896–2908. [Google Scholar] [CrossRef]
- Yan, Z.H.; Au, F.T.K. Nonlinear dynamic analysis of frames with plastic hinges at arbitrary locations. Struct. Des. Tall Spec. Buildings 2010, 19, 778–801. [Google Scholar] [CrossRef]
- Chen, Z.; Jing, C.; Xu, J.; Zhang, X. Seismic performance of recycled concrete-filled square steel tube columns. Earthq. Eng. Eng. Vib. 2017, 16, 119–130. [Google Scholar] [CrossRef]
- Zhang, Y.T.; Shan, B.; Xiao, Y. Axial impact behaviors of stub concrete-filled square steel tubes. Adv. Struct. Eng. 2019, 22, 2490–2503. [Google Scholar] [CrossRef]
- Ahmed, M.; Liang, Q.Q.; Patel, V.I.; Hadi, M.N.S. Nonlinear analysis of rectangular concrete-filled double steel tubular short columns incorporating local buckling. Eng. Struct. 2018, 175, 13–26. [Google Scholar] [CrossRef]
- Uenaka, K. Experimental study on concrete filled elliptical/oval steel tubular stub columns under compression. Thin-Walled Struct. 2014, 78, 131–137. [Google Scholar] [CrossRef]
- Wang, J.; Shen, Q.; Jiang, H.; Hadi, M.N.S. Analysis and design of elliptical concrete-filled thin-walled steel stub columns under axial compression. Int. J. Steel Struct. 2018, 18, 365–380. [Google Scholar] [CrossRef]
- Liu, X.; Xu, C.; Liu, J.; Yang, Y. Research on special-shaped concrete-filled steel tubular columns under axial compression. J. Constr. Steel Res. 2018, 147, 203–223. [Google Scholar] [CrossRef]
- Liu, X.; Liu, J.; Yang, Y.; Cheng, G.; Lanning, J. Resistance of special-shaped concrete-filled steel tube columns under compression and bending. J. Constr. Steel Res. 2020, 169, 106038. [Google Scholar] [CrossRef]
- Uenaka, K.; Kitoh, H.; Sonoda, K. Concrete filled double skin circular stub columns under compression. Thin-Walled Struct. 2010, 48, 19–24. [Google Scholar] [CrossRef]
- Hassanein, M.F.; Kharoob, O.F. Analysis of circular concrete-filled double skin tubular slender columns with external stainless steel tubes. Thin-Walled Struct. 2014, 79, 23–37. [Google Scholar] [CrossRef]
- Li, W.; Chen, B.; Han, L.H.; Lam, D. Experimental study on the performance of steel-concrete interfaces in circular concrete-filled double skin steel tube. Thin-Walled Struct. 2020, 149, 106660. [Google Scholar] [CrossRef]
- Li, N.; Lu, Y.; Li, S.; Li, W. Axial compressive behavior of steel fibre reinforced self-stressing and self-compacting concrete-filled steel tube columns. Eng. Struct. 2020, 222, 111108. [Google Scholar] [CrossRef]
- Liu, J.; Yang, J.; Chen, B.; Zhou, Z. Mechanical performance of concrete-filled square steel tube stiffened with PBL subjected to eccentric compressive loads: Experimental study and numerical simulation. Thin-Walled Struct. 2020, 149, 106617. [Google Scholar] [CrossRef]
- Wang, F.C.; Zhao, H.Y.; Han, L.H. Analytical behavior of concrete-filled aluminum tubular stub columns under axial compression. Thin-Walled Struct. 2019, 140, 21–30. [Google Scholar] [CrossRef]
- Ding, F.; Liu, Y.; Lyu, F.; Deren, L.; Jun, C. Cyclic loading tests of stirrup cage confined concrete-filled steel tube columns under high axial pressure. Eng. Struct. 2020, 221, 111048. [Google Scholar] [CrossRef]
- Lai, M.H.; Ho, J.C.M. Confinement effect of ring-confined concrete-filled-steel-tube columns under uni-axial load. Eng. Struct. 2014, 67, 123–141. [Google Scholar] [CrossRef]
- Zhang, L.; Zhang, J.B.; Tong, J.Z.; Tong, G.S.; Li, X.G.; Xu, Y.M. Axial resistant behavior of bolt-connected CFST columns: Experimental and numerical studies. Eng. Struct. 2021, 245, 112918. [Google Scholar] [CrossRef]
- Cai, J.; Pan, J.; Tan, J.; Vandevyvere, B. Nonlinear finite-element analysis for hysteretic behavior of ECC-encased CFST columns. Structures 2020, 25, 670–682. [Google Scholar] [CrossRef]
- Al-Ani, Y.R. Finite element study to address the axial capacity of the circular concrete-filled steel tubular stub columns. Thin-Walled Struct. 2018, 126, 2–15. [Google Scholar] [CrossRef]
- Ouyang, Y.; Kwan, A.K.H. Finite element analysis of square concrete-filled steel tube (CFST) columns under axial compressive load. Eng. Struct. 2018, 156, 443–459. [Google Scholar] [CrossRef]
- Ahmed, M.; Liang, Q.Q.; Patel, V.I.; Hadiet, M.N.S. Numerical analysis of axially loaded circular high strength concrete-filled double steel tubular short columns. Thin-Walled Struct. 2019, 138, 105–116. [Google Scholar] [CrossRef]
- Susantha, K.A.S.; Ge, H.; Usami, T. Uniaxial stress–strain relationship of concrete confined by various shaped steel tubes. Eng. Struct. 2001, 23, 1331–1347. [Google Scholar] [CrossRef]
- Tao, Z.; Wang, Z.B.; Yu, Q. Finite element modelling of concrete-filled steel stub columns under axial compression. J. Constr. Steel Res. 2013, 89, 121–131. [Google Scholar] [CrossRef]
- Zhou, F.; Young, B. Numerical analysis and design of concrete-filled aluminum circular hollow section columns. Thin-Walled Struct. 2012, 50, 45–55. [Google Scholar] [CrossRef]
- Duarte, A.P.C.; Silva, B.A.; Silvestre, N.; de Brito, J.; Júlio, E.; Castro, J.M. Finite element modelling of short steel tubes filled with rubberized concrete. Compos. Struct. 2016, 150, 28–40. [Google Scholar] [CrossRef]
- Ahmed, M.; Liang, Q.Q. Numerical modeling of octagonal concrete-filled steel tubular short columns accounting for confinement effects. Eng. Struct. 2021, 226, 111405. [Google Scholar] [CrossRef]
- Lai, M.H.; Ho, J.C.M.A. theoretical axial stress-strain model for circular concrete-filled-steel-tube columns. Eng. Struct. 2016, 125, 124–143. [Google Scholar] [CrossRef]
- Lai, M.H.; Song, W.; Ou, X.L.; Chen, M.T.; Wang, Q.; Ho, J.C.M.A. A path dependent stress-strain model for concrete-filled-steel-tube column. Eng. Struct. 2020, 211, 110312. [Google Scholar] [CrossRef]
- Yin, F.; Xue, S.D.; Cao, W.L.; Dong, H.Y.; Wu, H.P. Behavior of multi-cell concrete-filled steel tube columns under axial load: Experimental study and calculation method analysis. J. Build. Eng. 2020, 28, 101099. [Google Scholar] [CrossRef]
- Teng, J.G.; Huang, Y.L.; Lam, L.; Ye, L.P. Theoretical model for fiber-reinforced polymer-confined concrete. J. Compos. Constr. 2007, 11, 201–210. [Google Scholar] [CrossRef]
- Wei, Y.; Cheng, X.; Wu, G.; Duan, M.; Wang, L. Experimental investigations of concrete-filled steel tubular columns confined with high-strength steel wire. Adv. Struct. Eng. 2019, 22, 2771–2784. [Google Scholar] [CrossRef]
- Alrebeh, S.K.; Ekmekyapar, T. Structural behavior of concrete-filled steel tube short columns stiffened by external and internal continuous spirals. Structures 2019, 22, 98–108. [Google Scholar] [CrossRef]
- Lai, M.H.; Ho, J.C.M. Behavior of uni-axially loaded concrete-filled-steel-tube columns confined by external rings. Struct. Des. Tall Spec. Build. 2014, 23, 403–426. [Google Scholar] [CrossRef]
- Lai, M.H.; Ho, J.C.M. An analysis-based model for axially loaded circular CFST columns. Thin-Walled Struct. 2017, 119, 770–781. [Google Scholar] [CrossRef]
- ABAQUS. ABAQUS Standard User’s Manual; Version 6.14; Dassault Systemes Corp: Providence, RI, USA, 2014. [Google Scholar]
- Cao, B.; Xie, M.; Zhu, L.; Cao, W.; Huang, B.; Du, Y.; Wang, J.; Yang, Y.; Wang, C. Axial compression behavior of precast circular semi-continuous concrete-filled steel tube columns. Adv. Mech. Eng. 2022, 14, 1–18. [Google Scholar] [CrossRef]
- Temsah, Y.; Jahami, A.; Khatib, J.; Sonebi, M. Numerical derivation of iso-damaged curve for a reinforced concrete beam subjected to blast loading. In Proceedings of the MATEC Web of Conferences, Shanghai, China, 24–25 November 2018; 2018; 149, p. 02016. [Google Scholar] [CrossRef]
- GB 50010-2010; Code for design of concrete structures. China Architecture & Building Press: Beijing, China, 2015.
- BS EN 1993-1-8; Eurocode 3: Design of Steel Structures-Part 1–8: Design of Joints. CEN: Brussels, Belgium, 2005.
- Ho, J.C.M.; Lai, M.H.; Luo, L. Uniaxial behavior of confined high-strength concrete-filled-steel-tube columns. Proc. Inst. Civ. Eng. Struct. Build. 2014, 167, 520–533. [Google Scholar] [CrossRef]
- Lai, M.H.; Ho, J.C.M. Effect of continuous spirals on uni-axial strength and ductility of CFST columns. J. Constr. Steel Res. 2015, 104, 235–249. [Google Scholar] [CrossRef]
- Oehlers, D.J.; Bradford, M.A. Composite Steel and Concrete Structures: Fundamental Behavior: Fundamental Behavior; Elsevier: Amsterdam, The Netherlands, 2013. [Google Scholar]
- Zhanshuan, C.S.J. Behavior and ultimate strength of short concrete-filled steel tubular columns. J. Build. Struct. 1984, 5, 13. [Google Scholar]
- Zhong, S.T. Unified Theory of CFST: Research and Application; Tsinghua University Press: Beijing, China, 2006. [Google Scholar]
- Hoang, L.A.; Fehling, E. Numerical study of circular steel tube confined concrete (STCC) stub columns. J. Constr. Steel Res. 2017, 136, 238–255. [Google Scholar] [CrossRef]
- Zhu, T.; Liang, H.; Lu, Y.; Li, W.; Zhang, H. Axial behavior of slender concrete-filled steel tube square columns strengthened with square concrete-filled steel tube jackets. Adv. Struct. Eng. 2020, 23, 1074–1086. [Google Scholar] [CrossRef]
- GB 50017-2017; Standard for Design of Steel Structures. China Architecture & Building Press: Beijing, China, 2018.
Disclaimer/Publisher’s Note: The statements, opinions and data contained in all publications are solely those of the individual author(s) and contributor(s) and not of MDPI and/or the editor(s). MDPI and/or the editor(s) disclaim responsibility for any injury to people or property resulting from any ideas, methods, instructions or products referred to in the content. |
© 2023 by the authors. Licensee MDPI, Basel, Switzerland. This article is an open access article distributed under the terms and conditions of the Creative Commons Attribution (CC BY) license (https://creativecommons.org/licenses/by/4.0/).

