Article

Portland/Sulfoaluminate Cement Blends for the Control of Early Age Hydration and Yield Stress

1
IMT Nord Europe, Institut Mines-Télécom, Centre for Materials and Processes, F-59000 Lille, France
2
4515-LGCgE–Laboratoire de Génie Civil et géoEnvironnement, Institut Mines-Télécom, University Lille, University Artois, Junia, F-59000 Lille, France
3
University Orléans, University Tours, INSA CVL, LaMé, EA 7494, F-45100 Orléans, France
*
Author to whom correspondence should be addressed.
Buildings 2023, 13(2), 409; https://doi.org/10.3390/buildings13020409
Submission received: 12 January 2023 / Revised: 24 January 2023 / Accepted: 30 January 2023 / Published: 2 February 2023

Abstract

:
Early age hydration and the rheological behavior of cement pastes are related to their reactivity. The reactivity of Ordinary Portland Cement (OPC) and calcium sulfoaluminate cement (CSA) blends, with a CSA percentage of less than 10%, are investigated in this paper. Different percentages of CSA replacement are studied. First, an isothermal calorimetry study of the different cement pastes is performed to understand the effect of CSA on the evolution of the heat of hydration. Then, in order to understand the reactional mechanism of these cement pastes, X-ray diffraction (XRD) and thermogravimetric analysis (TGA/DTG) studies were conducted on one blended mix made out of 7% CSA and compared to the pure cement pastes of OPC and CSA. Later, the evolution of the yield stress as a function of the CSA percentage was studied. A synergy is shown between both OPC and CSA once mixed together, leading to a 57% and 45% higher ettringite formation for the blend compared to 100% OPC and 100% CSA cement pastes, respectively. This implies that the CSA amount affects the reactivity of OPC/CSA blends. This was confirmed by the variation in both the heat of hydration and yield stress evolution as a function of the percentage of CSA.

1. Introduction

Portland cement and calcium sulfoaluminate cement blends are nowadays being integrated into a lot of applications, although OPC is still the most important compound of modern cement [1]. Recently, calcium sulfoaluminate cement has been used in the construction field in high early-strength concrete, in self-leveling screed, for alkali-silica reaction mitigation, and for municipal solid waste incineration bottom ash recycling [2,3,4]. The incorporation of CSA is usually partial by mixing both OPC and CSA cement to formulate OPC/CSA blends. OPC/CSA mixes have already been used in special applications [2,5]. For example, these blends are used in ground-granulated blast furnace slag acceleration [5]. Further, OPC and CSA are used in the direct encapsulation of waste materials [5,6]. Combining CSA with OPC is also known to be used in the 3D printing of cementitious material. It has proven to provide buildability for 3D printed mortars by changing the CSA percentage in order to control, in the short term, the chemical and rheological behaviors [7]. The hydration mechanisms of calcium sulfoaluminate cement have been the interest of several studies [8,9]. For example, Garcia-Maria et al. [9] studied the gypsum amount effect on CSA pastes. Others studied the setting and strength of CSA [2] and its advantages in the stabilization of wastes [10,11]. In addition to being considered a green competitor for OPC by releasing less CO2 during its manufacture, CSA cement is characterized by its rapid setting and high compressive strength, resulting in the integration of this cement in the construction field. In CSA cement, setting time and compressive strength are related to the amount of gypsum. Different hydrates can be formed during the hydration of the CSA cement, as shown in Equations (1)–(3). Its main hydrate, ettringite, is a key parameter for controlling mechanical performances in the short term [9]:
C4A3Š + 2CŠH2 + 34H → C3A.3CŠ.32H + 2AH3
C4A3Š + 8CŠH2 + 6CH + 74H → 3 C3A.3CŠ.32H
AH3 + 3CH+ 3CŠ 2 + 20H → C3A.3CŠ.32H
CSA cement is being added as an alternative to OPC since it can control setting time, shrinkage, and durability [12,13]. The formation of ettringite, due to the early hydration of ye’elimite (C4A3Š), is linked to the percentage of CSA in the blend (Trauchessec et al. [13]). Further, these authors relate the composition of the cement (for example, the amount of lime in OPC) to the performance of the blend. Therefore, modifying the CSA amount or the cement composition results in adjusting mortar strength. Moreover, Le Saoût et al. [14] couple thermodynamic modeling with kinetic equations, which describe the dissolution of the OPC and CSA, to adequately predict the number of hydrates and pore solution compositions as a function of time.
The addition of small amounts of CSA in OPC has also proven to significantly change the rheological behavior of the fresh material. In some applications where high thixotropy of the material is required, such as 3D printing [15], adding CSA with OPC also appears to be an interesting solution [7]. The combined effect of CSA on the chemistry and rheology of OPC/CSA blends has not been addressed in the literature. Such data can be of particular interest for the premix development of innovative materials with specific performances (e.g., for 3D printing).
The main objective of this paper was to study the influence of CSA percentage (less than 10%) on the chemistry and rheology of OPC/CSA blend cement pastes in order to better control their very short-term properties. First, cement pastes of 4 percentages with less than 10% of CSA were studied through isothermal calorimetry and compared to pure OPC and CSA cement pastes. Then, the reactional mechanism of two pure cement pastes made out of OPC and CSA and a particular one made out of 7% CSA and 93% OPC—developed in an earlier study [7]—were studied in XRD and DTA-TGA. Finally, the rheological behavior of the 6 cement pastes was evaluated to understand the impact of CSA percentage on the yield stress evolution of the blends.

2. Materials and Methods

2.1. Materials

A CEM I 52.5 N SR3 CE PM-CP2 NF (EXTREMAT) and a calcium sulfoaluminate cement (Alpenat), both from Vicat, a superplasicizer/high water reducer from Sika (Tempo 11), and a calcareous 0/2 mm crushed sand from Carrières du Boulonnais are used in the following study. The chemical and mineral compositions of the two types of cement are shown in Table 1 and Table 2.
Cement pastes P100/0, P98/2, P95/5, P93/7, P90/10, and P0/100 were studied, with the first number referring to the mass percentage of OPC and the second to the mass percentage of CSA. For example, P98/2 refers to a mix made with 98% OPC and 2% CSA. All specimens are manufactured with a water-to-cement ratio of W/C = 0.5.

2.2. Characterization Methods

The heat of hydration of the cement pastes was measured using an isothermal calorimeter, CALMETIX. Both were kept at 20 °C for 24 h. Then, 40 g of blended cement and 20 g of water were mixed for 3 min and placed in the calorimeter. The heat of hydration was measured every minute for 48 h for P100/0, P93/7, and P0/100 pastes and for 1 h for all the other pastes.
Rheological measurements were performed with an Anton Paar MCR 102 rheometer in order to measure the increase in the yield stress of the pastes during the first hour after mixing. The parallel plate geometry was used with plates of 25 mm, made rough by gluing abrasive paper on their surface. Struers waterproof silicon carbide paper P1200 was used as abrasive paper. Measurements were carried out with a gap of 1mm at a temperature of 20 °C. A total of 6 g of cement was manually stirred with 3 g of water. Cement pastes were mixed for 1:40 min, from the water and cement contact, before being placed on the fixed base of the rheometer. After the displacement of the rotating top section to the measurement position, the excess was removed, and measurements started at 3 min after installing a cap on the plates in order to protect the sample from desiccation. The yield stress was measured by applying a constant shear rate of 0.025 s−1 for 30 s, with the shear stress corresponding to the peak value obtained. A total of 11 measurements of shear stress were taken during the first hour (each measurement was preceded by a period of rest of 4:30 min).
In order to identify the hydration products, the hydration of cement pastes P100/0, P93/7, and P0/100 was stopped at 20 min, 1 h, 2, 7, and 28 days. Cement pastes at each term were manually ground into a powder with a mortar and pestle. The powders were immersed in 50 mL of isopropanol in a flask with continuous mixing for 6 min. Then, the content of the flask was filtered using a Buchner filter. Once all the water was removed, 50 mL of isopropanol from a clean flask was added in order to wash the powder. Once the isopropanol was completely removed by filtration, the residue was dried in the oven at 40 °C for 48 h and then placed in a desiccator containing silica gel and sharp soda for 10 days to ensure that the moisture was completely removed from the specimens.
The X-ray diffraction (XRD) analyses were realized using a diffractometer Bruker D8 with an anticathode in cobalt (λKα1 = 1.74 Ǻ). The detector was a lynx eye. The acquisition was carried out over a range of 2θ, from 6° to 80°, with a step of 0.02°, and a time per step of 179 s. Obtained diffractograms were treated by Eva Bruker software.
The thermograms were realized using Netzsch STA 409 in mode TGA/DSC. The heating program was divided into 3 segments: a dynamic of 2 °C/min between 20 and 105 °C, one static of 1 h 15 min at 105 °C and a dynamic of 3 °C/min between 105 and 1200 °C. Thermograms were measured on samples grounded in an agate mortar. The tested sample was 50 ± 2 mg, and the reference sample contained 50 mg of alumina. As the temperature increased, the sample decomposed and released water and/or carbon dioxide, or devitrified. Each phase was characterized by an endothermic or exothermic peak. The amount of chemically bound water present was measured by the mass loss occurring at each peak evaluated and so the phases were determined.

3. Results

3.1. Chemical Characterization

3.1.1. Reactivity of Blends

Figure 1 presents the evolution of the heat of hydration during the first 48 h of the three cement pastes, P100/0, P93/7, and P0/100. After cement mixing, an induction period occurred, during which its consistency remained constant. Induction time was determined by the intercept of two tangent lines obtained from the heat rate data: one during the induction period and the other during the early stage of the acceleration period [16]. The induction periods of the three cement pastes, P100/0, P0/100, and P93/7 differ (5 h, 2 h, and 1 h, respectively). After that, P100/0 and P93/7 presented similar behaviors (second peak), with a delay for P100/0 compared to P93/7. This peak represented the tricalcium silicate (alite) reacting to calcium silicate hydrates and calcium hydroxide. An additional peak was observed after about 15 h (indicated by an arrow) in paste P100/0. It corresponded to the time when calcium sulfate (setting regulator) was consumed and the remaining tricalciumaluminate phase (C3A) no longer reacted to ettringite (calcium aluminate trisulfate hydrate) but reacted to other phases like monosulfate or monocarbonate [17]. This peak was not present for P93/7. According to Le Saout et al. [12], this peak was delayed due to the delay in C3A hydration to 50 h. Over the first 48 h, P93/7 and P100/0 presented similar shapes, but with a shorter induction period for the former. This suggests that both of them presented the same phases, but the kinetic of the hydration reactions was faster for P93/7. P0/100 presented two peaks (in addition to the first one due to dissolution): one for the reaction of the ye’elimite phase (calcium aluminum sulfate, C4A3S) with calcium sulfate to ettringite and the second for the depletion of calcium sulfate to calcium monosulfoaluminate (AFm) [18,19].
Cement pastes made out of 0, 2, 5, 7, 10, and 100% of CSA were studied using an isothermal calorimeter. According to Le Saout et al. [14], the reactional mechanism of OPC was not affected by the percentage of CSA added to the OPC/CA blends for CSA percentages of less than 15%.
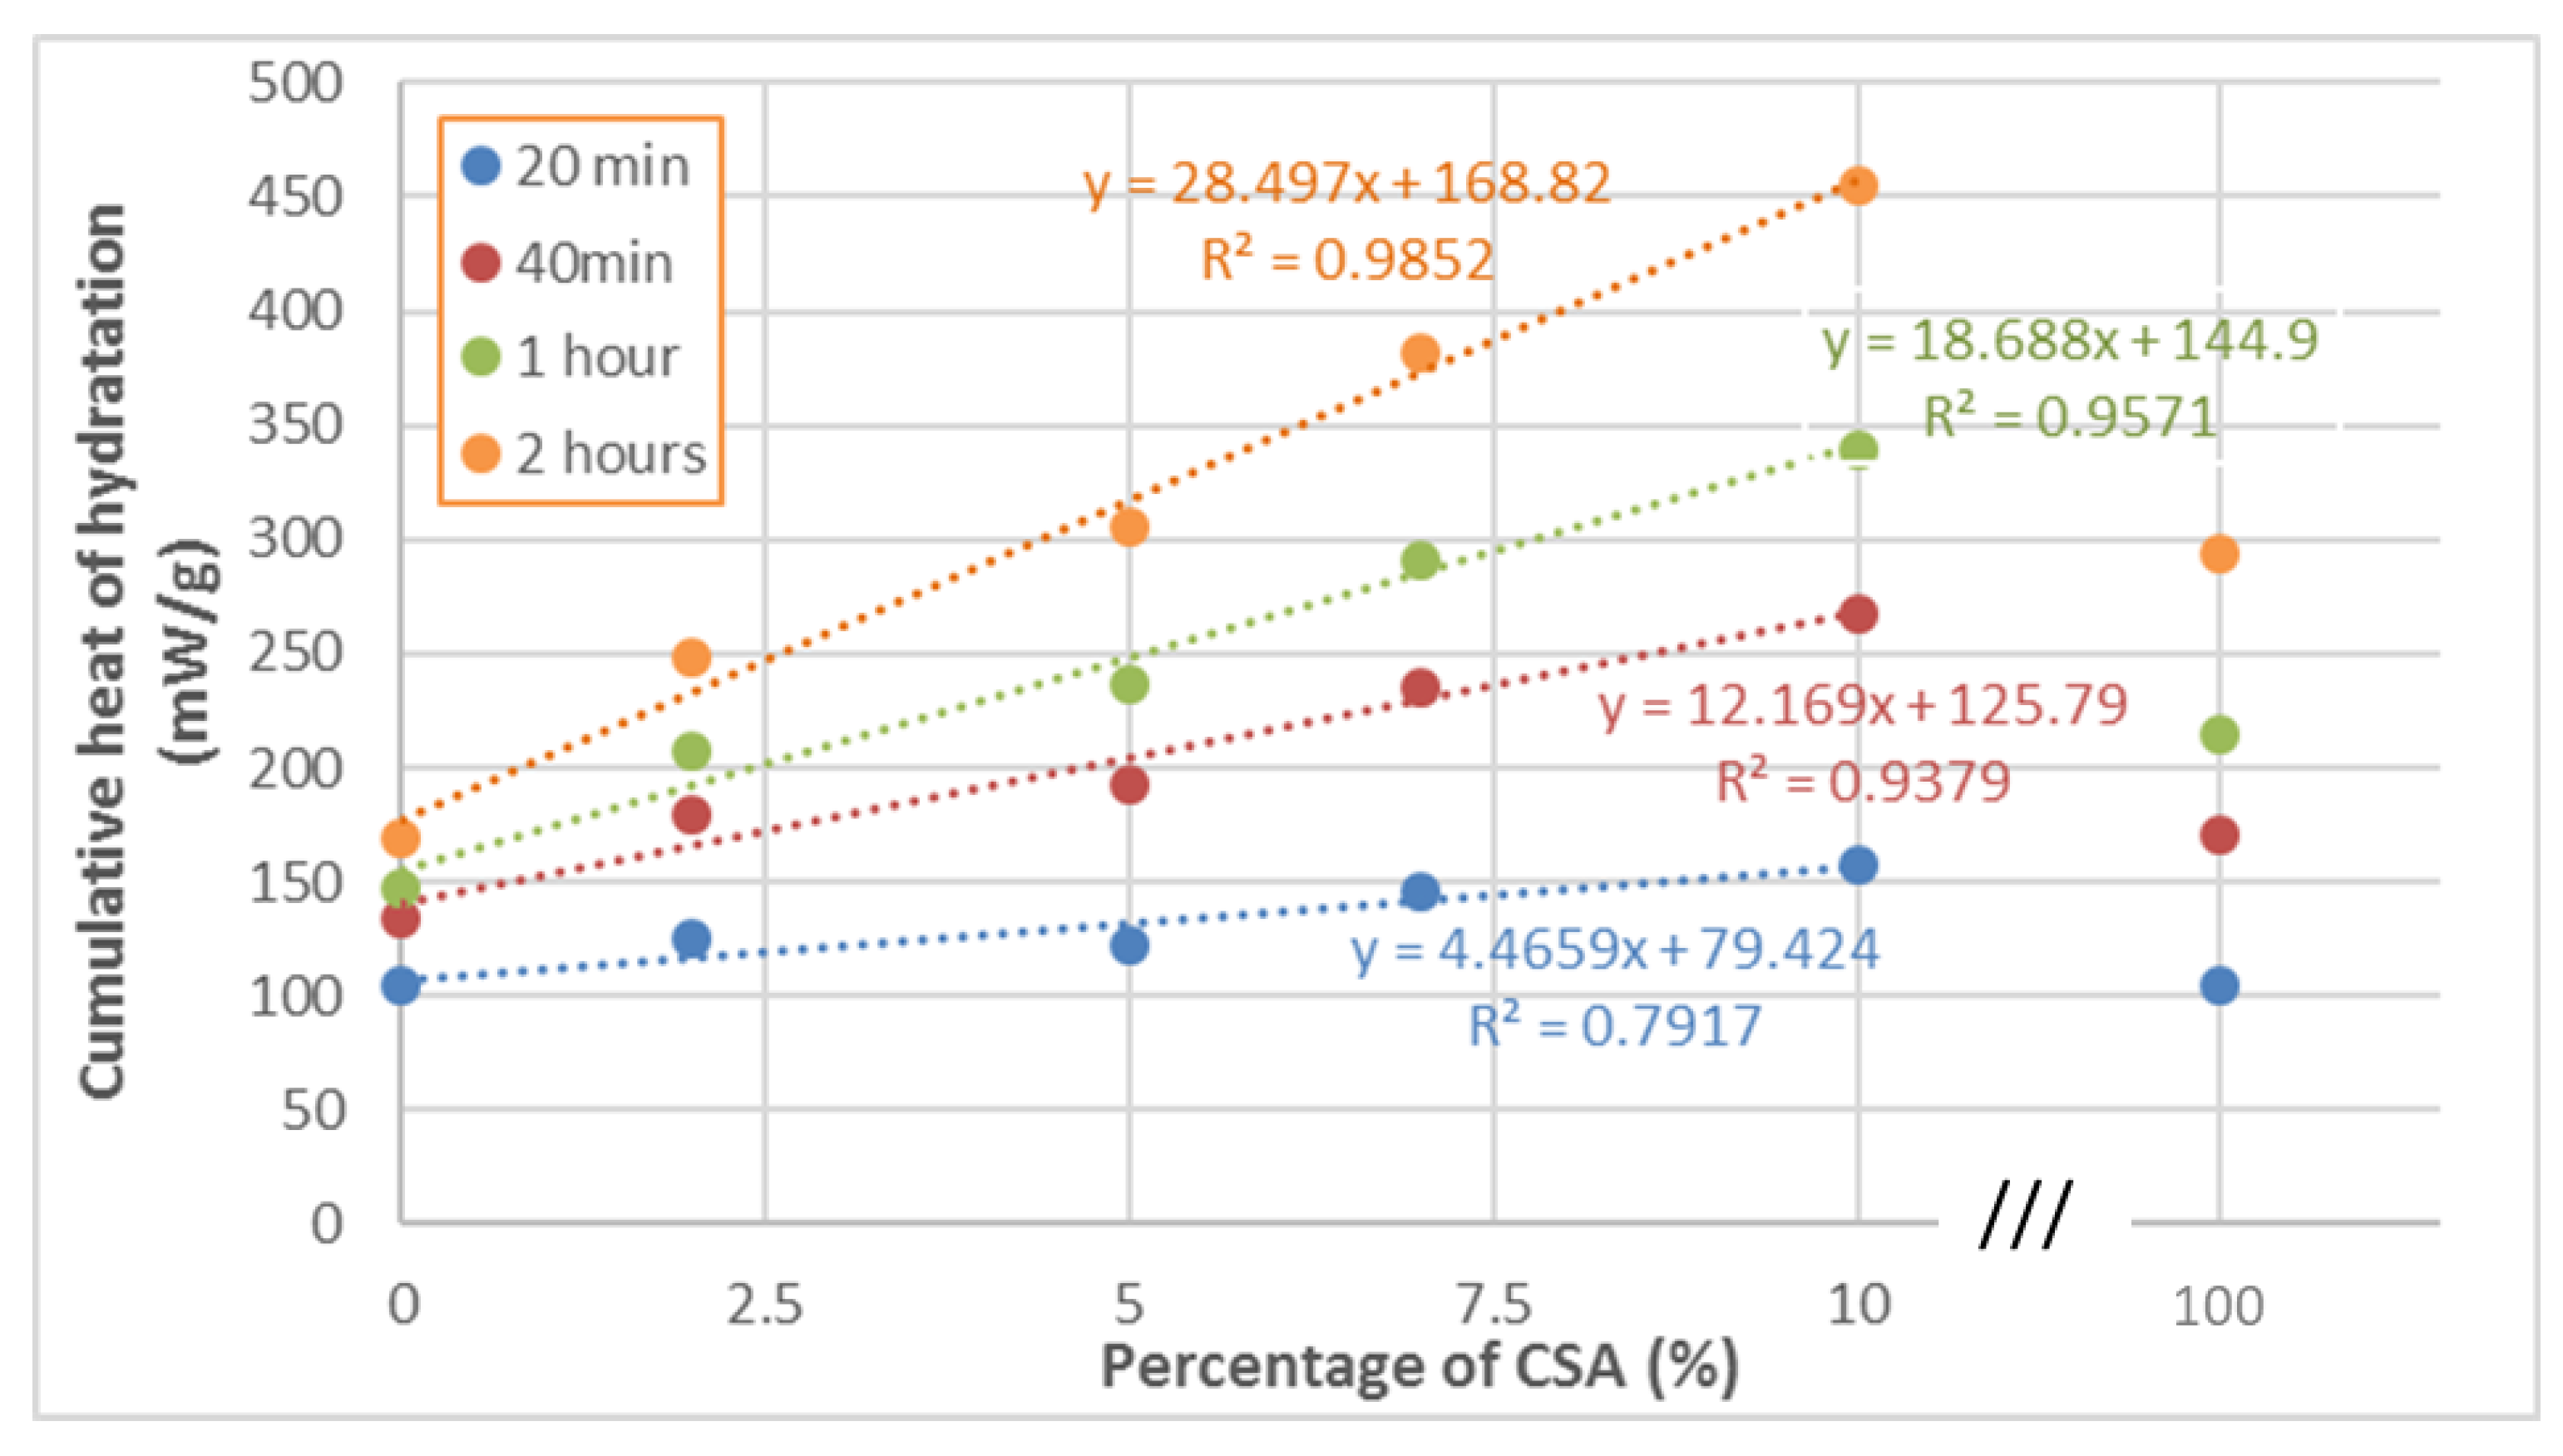
Figure 2 presents the evolution of the cumulative heat of hydration for the P100/0, P98/2, P95/5, P93/7, P90/10, and P0/100 cement pastes at 20 min, 40 min, 1 h, and 2 h. According to Figure 2, the cumulative heat of hydration increased with the increase of the CSA percentage in the blend at all intervals. This increase presents a linear evolution between 0 and 10%. However, the OPC/CSA blends present higher values with respect to both pure OPC and CSA, reflecting an increase in the intensity of the reactions in the blends.

3.1.2. XRD

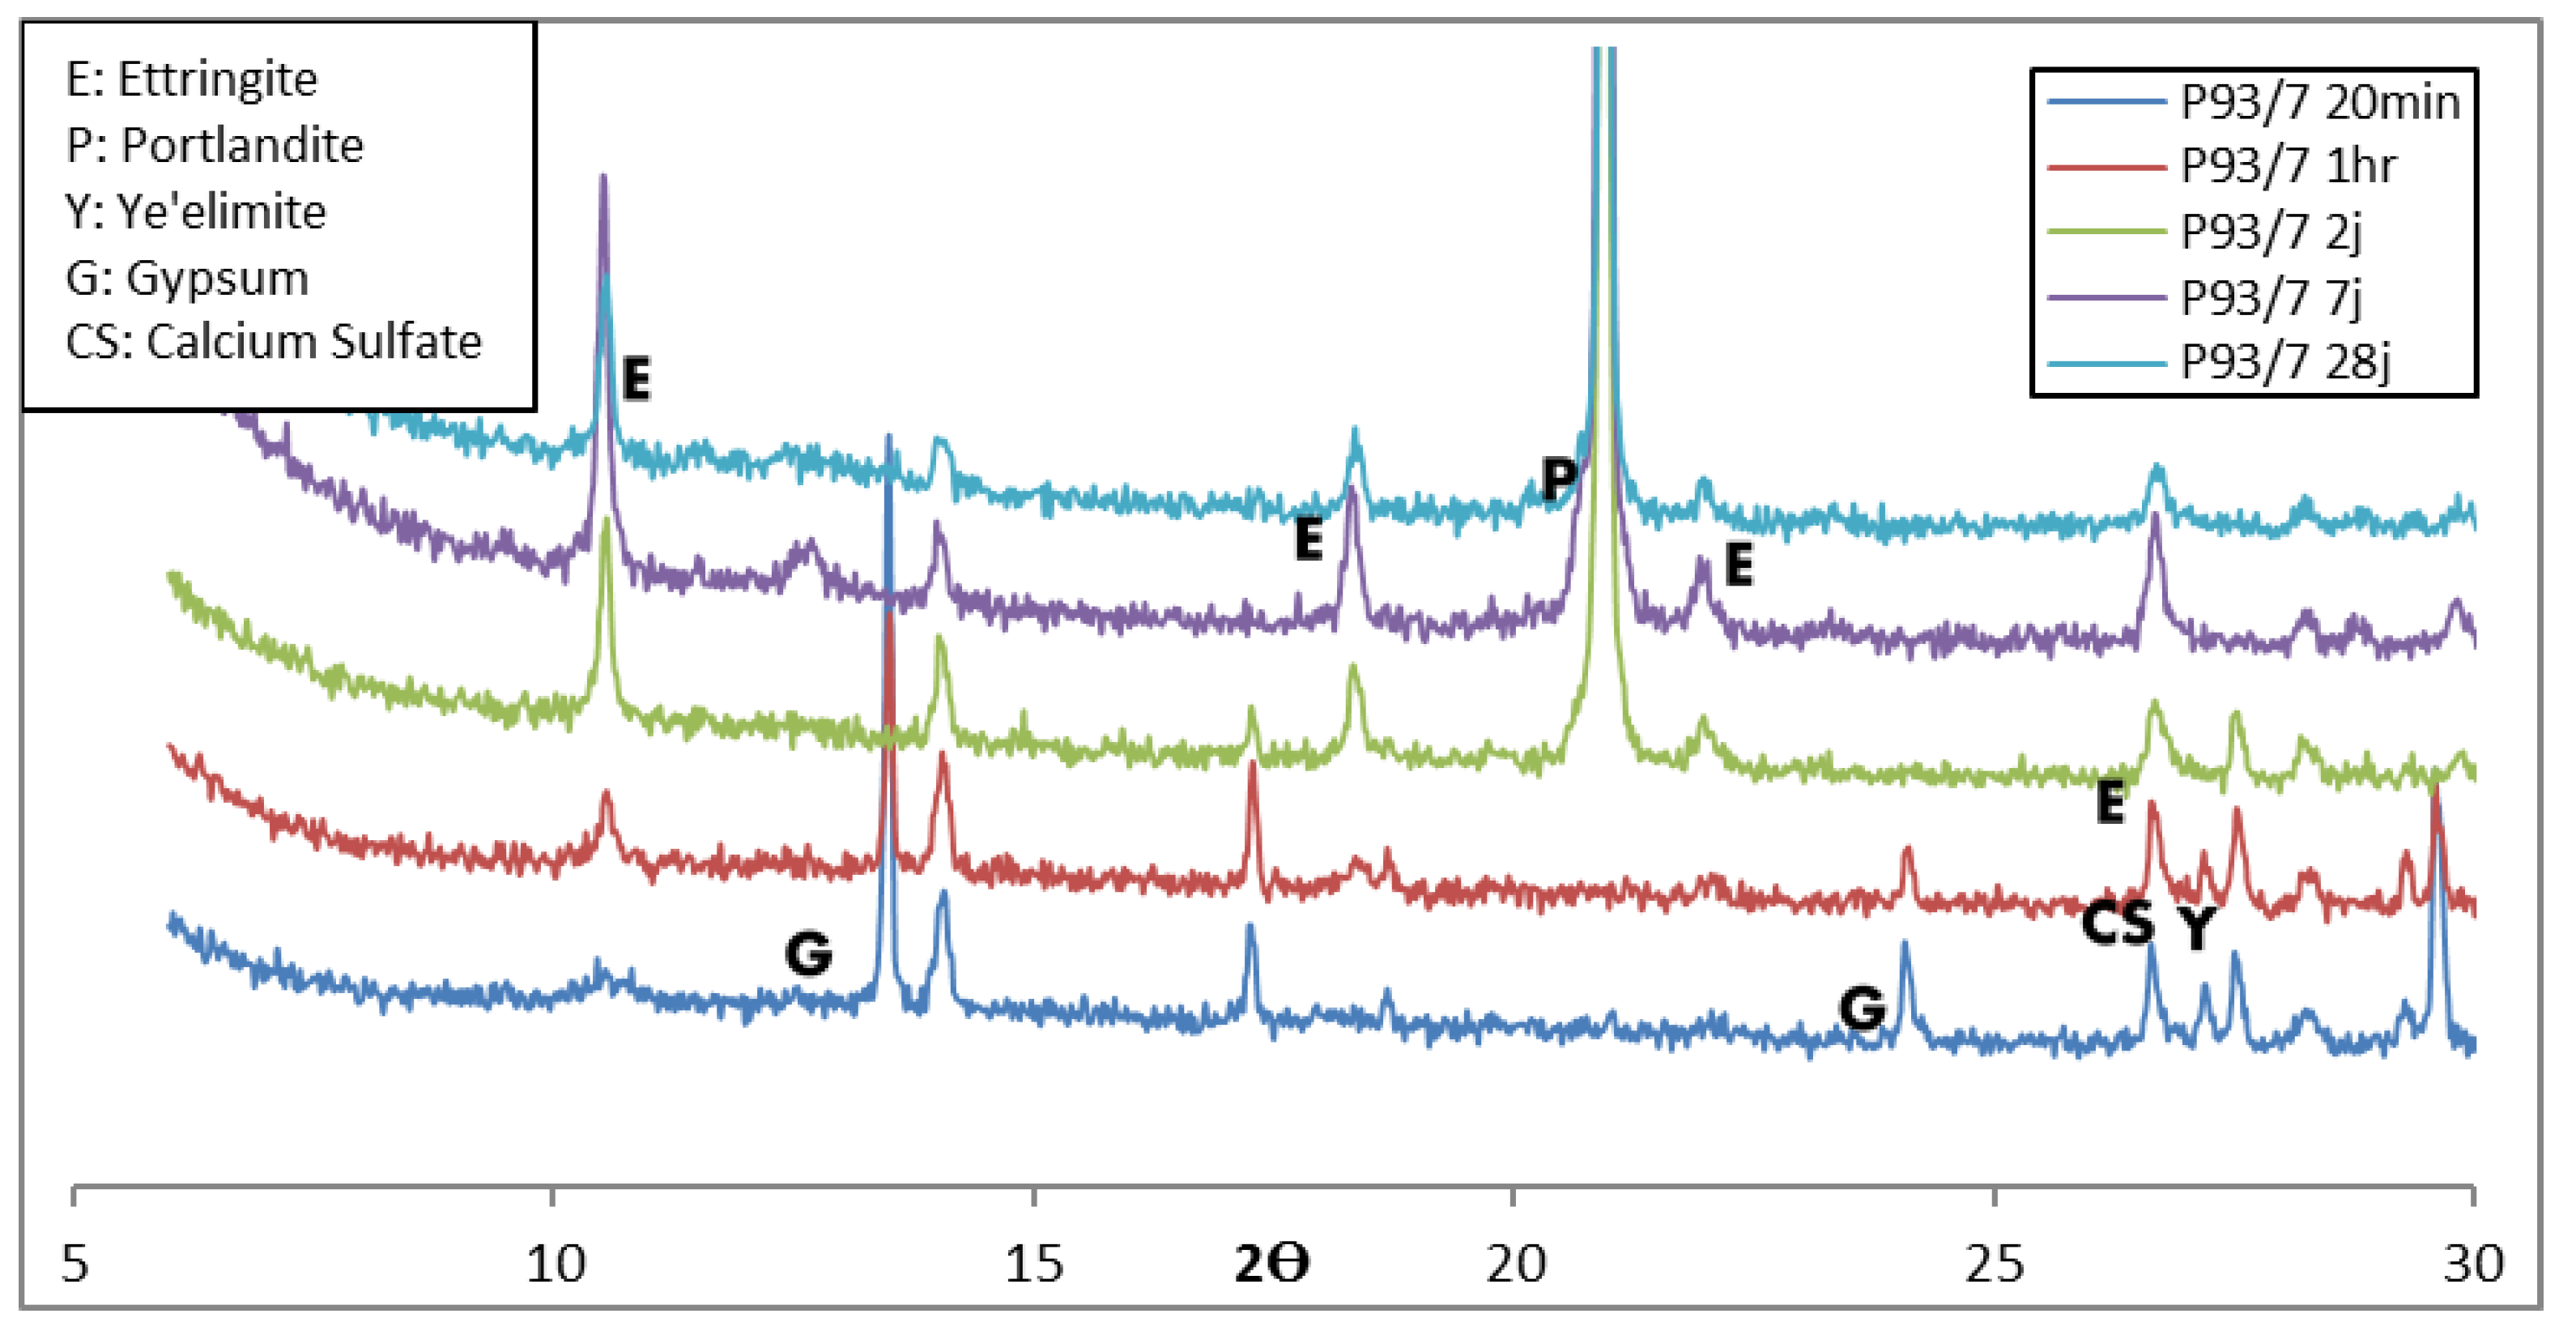
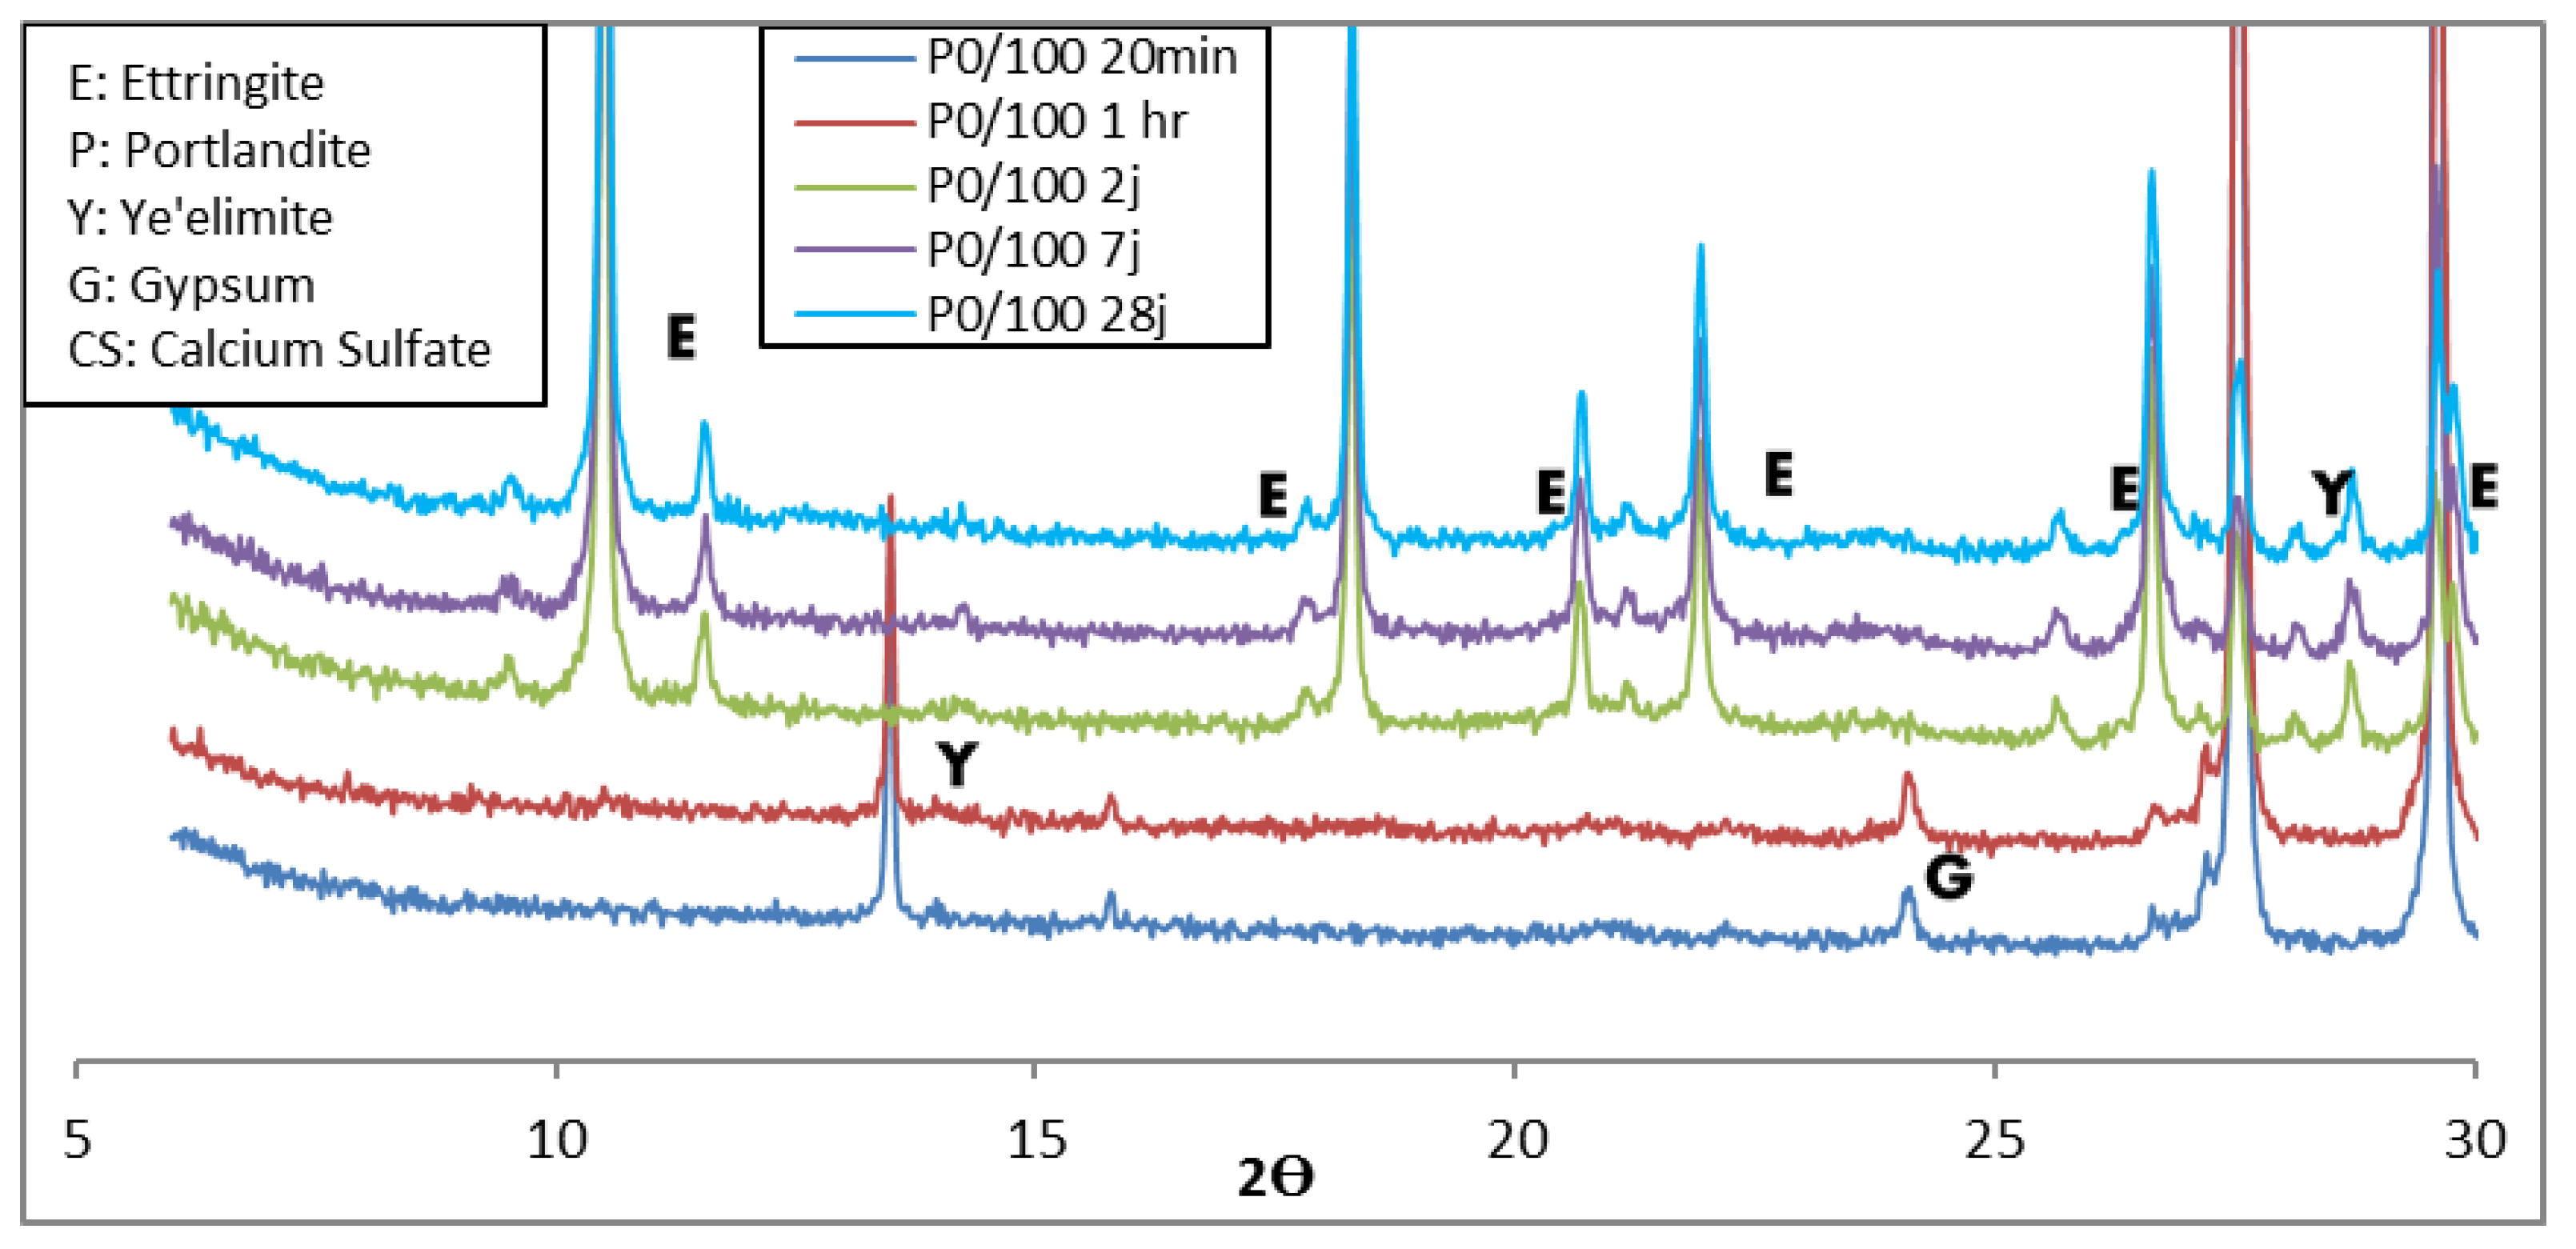
Figure 3, Figure 4 and Figure 5 present the XRD diagrams of cement pastes the P100/0, P0/100, and P93/7, respectively, at 20 min, 1 h, 2, 7, and 28 days between 2ϴ = 5 ° and 2ϴ = 30 °. The XRD of P93/7 presented similar peaks as P100/0 except for some supplementary peaks of ettringite at 20 min and 1 h. By comparing the curves at 2ϴ = 10° of the 3 mixes (20 min and 1 h), ettringite peaks resulting from CSA were not present for P0/100. These results are in good agreement with those of Le Saout et al. [14] and Trauchessec et al. [13], who indicate the presence of ettringite at an early age (1 h) for OPC/CSA blends.
Table 3 summarizes the phases identified by XRD for the three cement pastes. In 100% CSA specimens, the ye’elimite was not hydrated during the first hour and ettringite was formed at 2 days. The ye’elimite present in OPC/CSA blends was no more present after 2 days. This may be due to the small quantity (7%) of CSA added, and this quantity being completely hydrated within two days. However, the ye’elimite and gypsum hydration into ettringite in P93/7 started at 20 min (earlier than both the pure 100% CSA and pure 100% OPC, which did not present ettringite during the first hour). Therefore, ettringite resulted from the hydration of the ye’elimite. The impact of OPC was reflected on CSA by providing the gypsum reacting with ye’elimite (CSA), producing ettringite at early ages [8,9]. The ettringite formation can be explained, according to Telesca et al. [20], by the OPC contribution to ettringite generation depending on the calcium sulfate amounts involved in the reactions with tricalcium aluminate and brownmillerite, and the reaction with C4A3Š and calcium hydroxide produced by the hydration of calcium silicates. In fact, by comparing the ettringite formation in Equation (2) to that in Equation (1), it can be seen that in the presence of portlandite, more ettringite was formed. Gypsum provided the necessary amount of sulfate to form ettringite, but this was not the case for the quantity of calcium required. Portlandite and/or lime, provided by OPC, ensure the remaining needed calcium. The effect of the OPC was confirmed by our results because if the ye’elimite was the only source of ettringite, the latter would have been found in higher concentrations in the 100% CSA. In addition, the source of calcium sulfate in the CSA cement is anhydrite (Table 2). According to Garcia-Matté [9], the production of ettringite due to anhydrite is smaller than that due to gypsum, in the short term. This can be clarified as follows, based on the CSA composition. In fact, in 100% CSA, the anhydrite present will hydrate to produce gypsum;
CŠ + 2H → CŠH2
The latter was, at a later stage, dissolved to react with ye’elimite and produce ettringite according to Equation (3). However, once mixed with OPC, in addition to Equation (4), ettringite was formed directly by the gypsum (provided by OPC) reacting with ye’elimite (provided by CSA).
By comparing XRD results to the calorimetry for the first hour, P93/7 and P100/0 had the same shape but with a shorter induction period for P93/7. XRD results explained the accelerated kinetic of the hydration reactions for the latter. Further, the higher cumulative heat of hydration of P93/7 for this mix, compared to the two others, can be attributed to the ettringite amount produced during the first two hours. A synergy between OPC and CSA, due to the early formation of ettringite, is shown here, thus explaining the higher heat of hydration observed for all the mixes containing CSA and OPC in Figure 2.

3.1.3. TGA-DTG

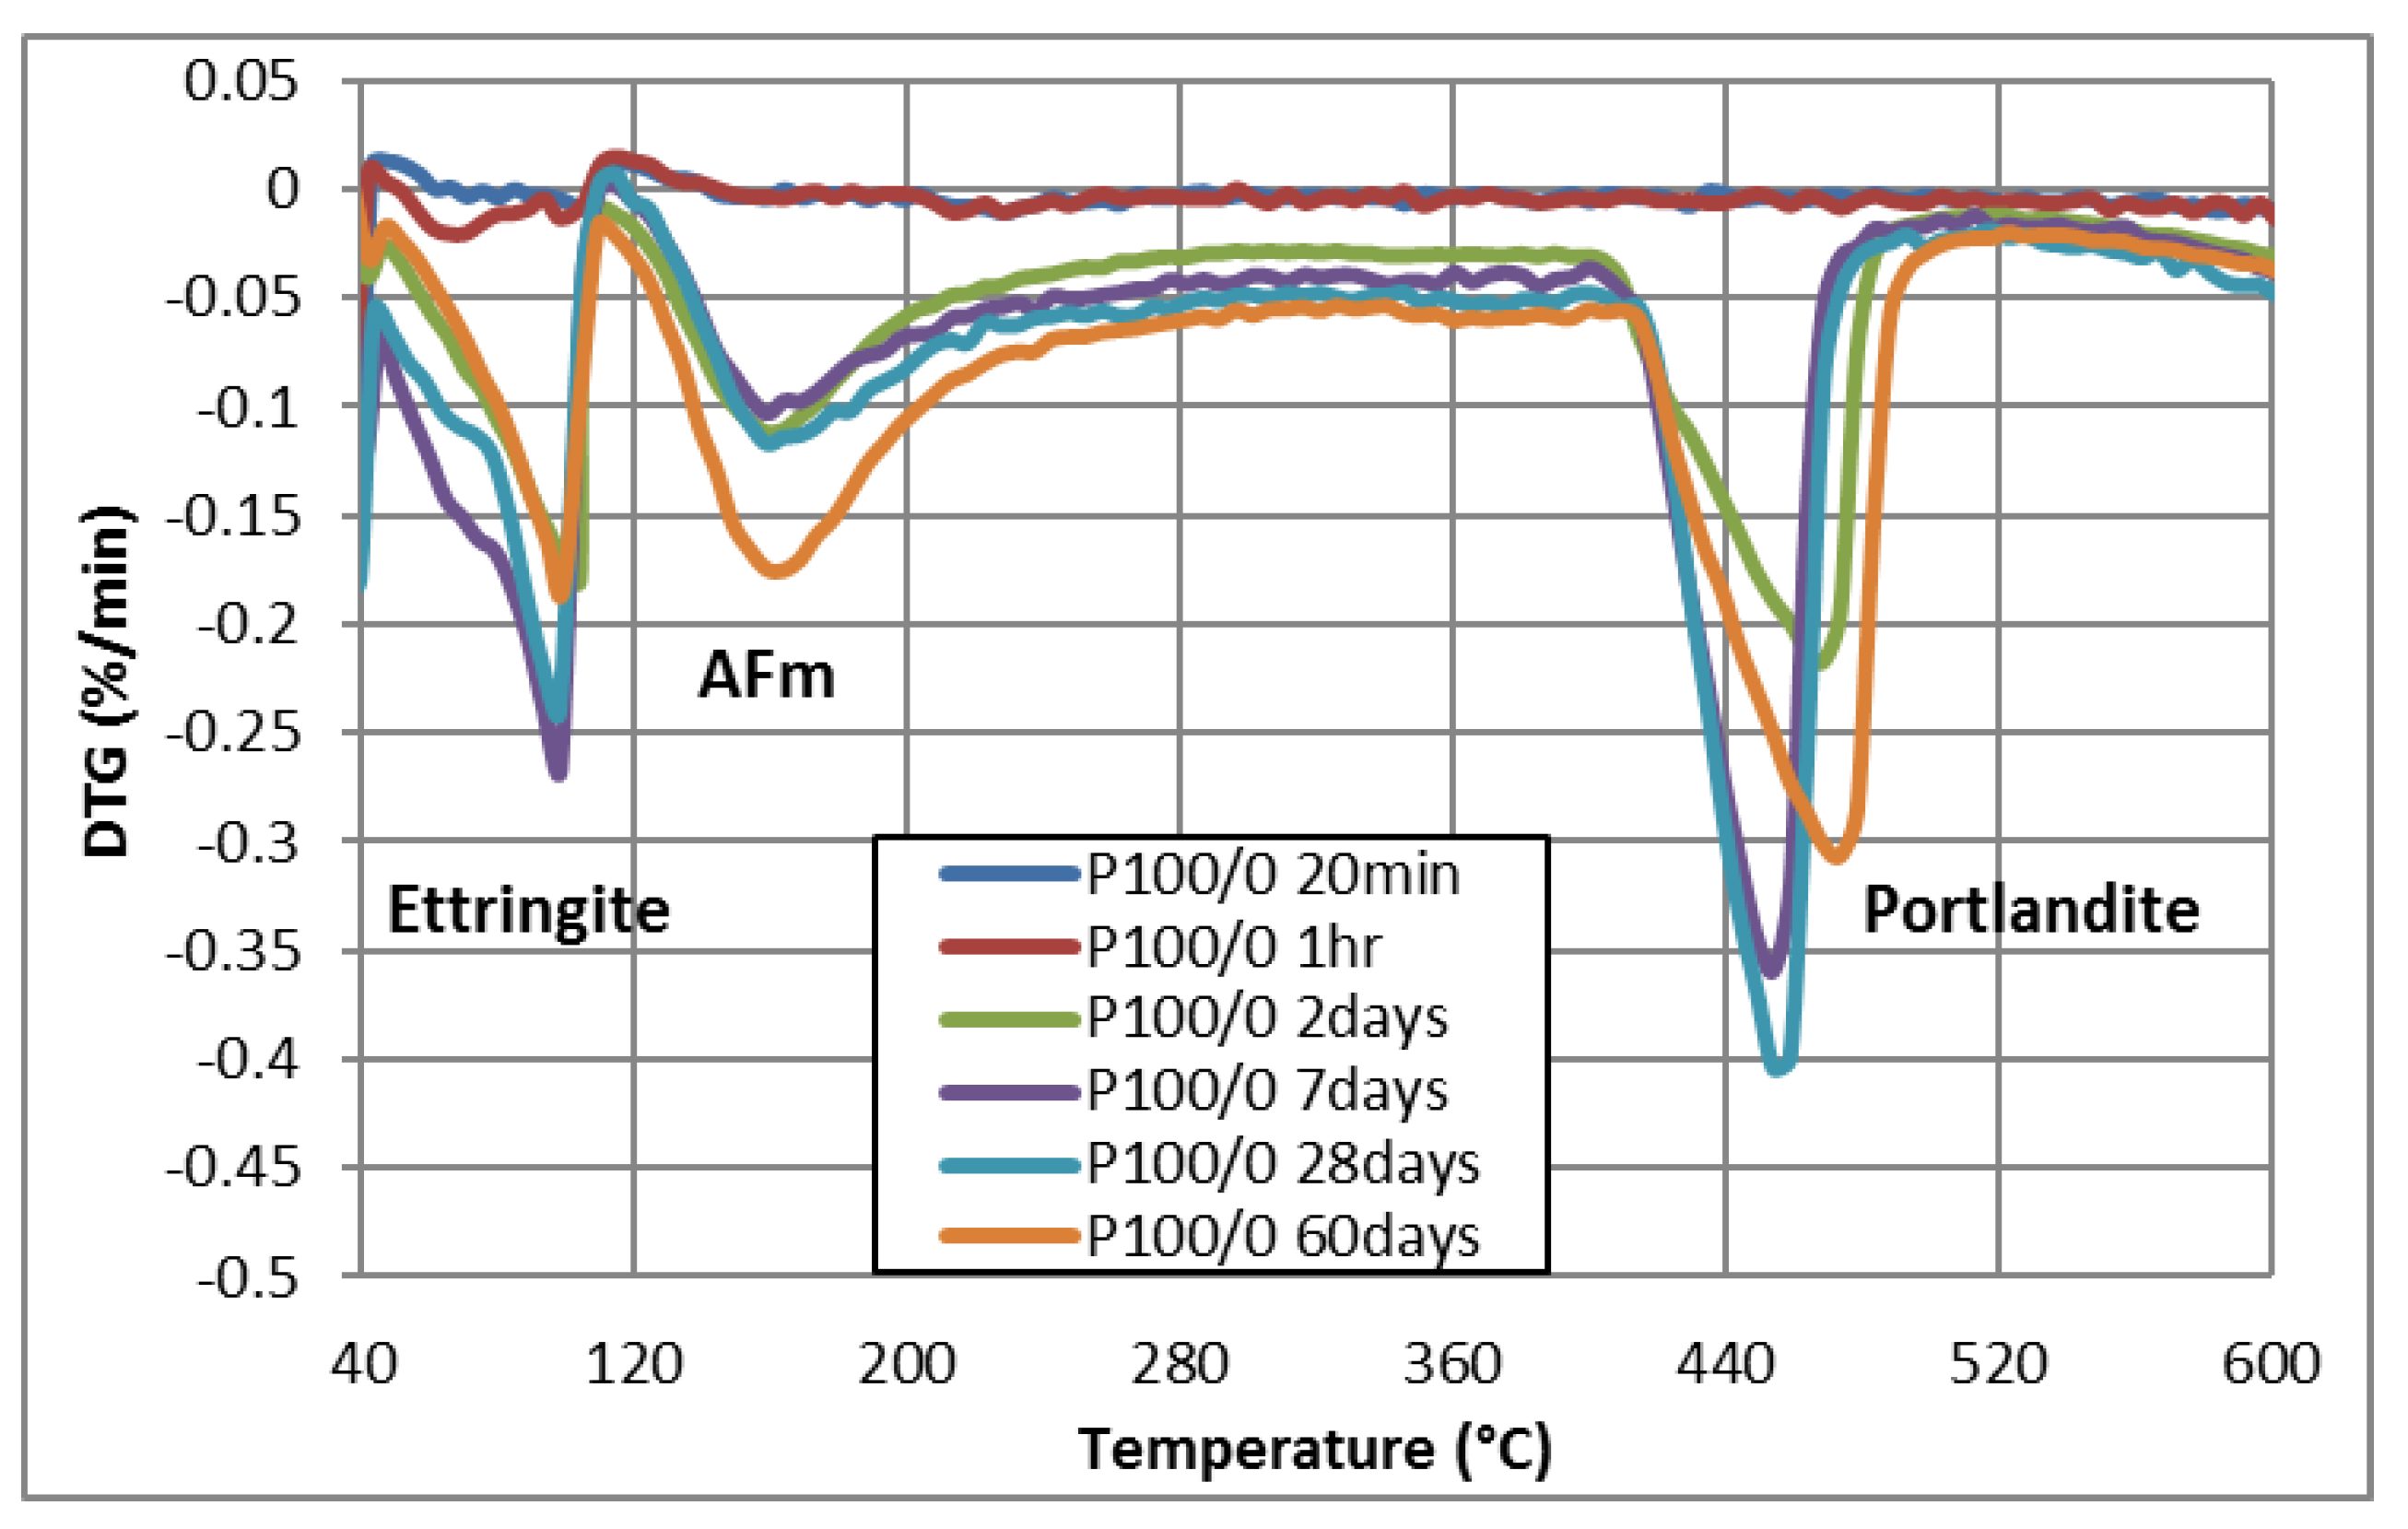
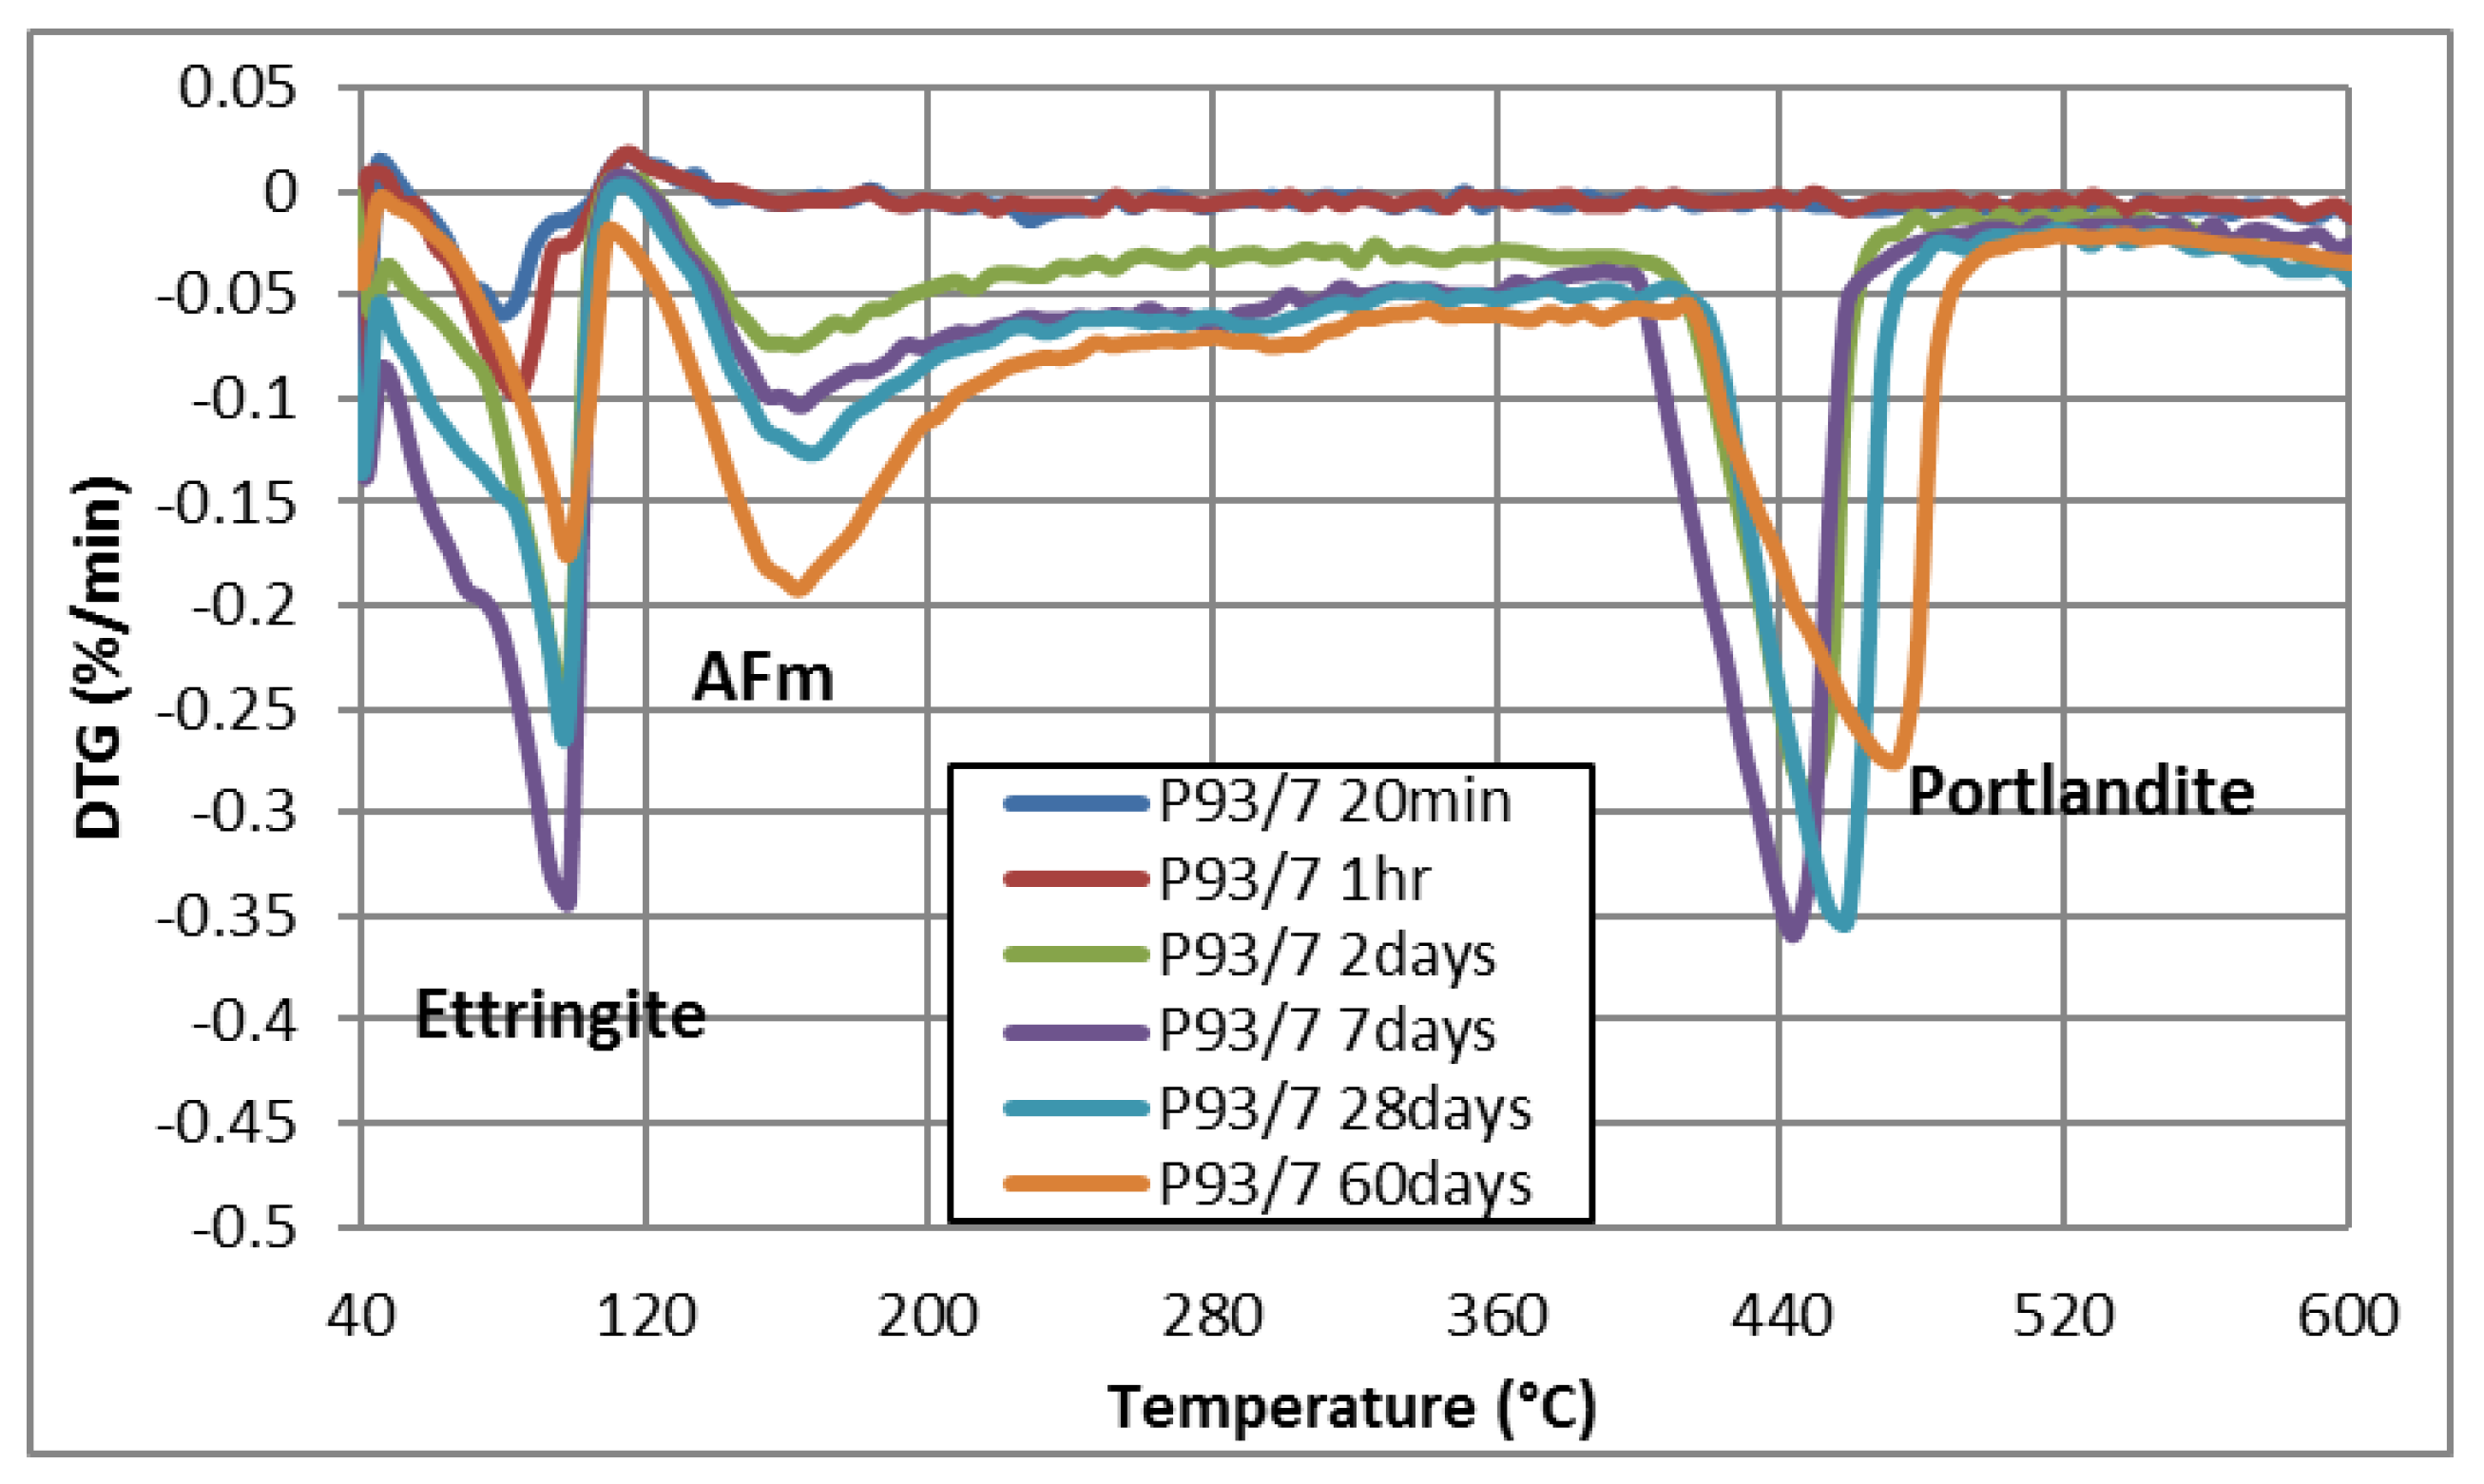
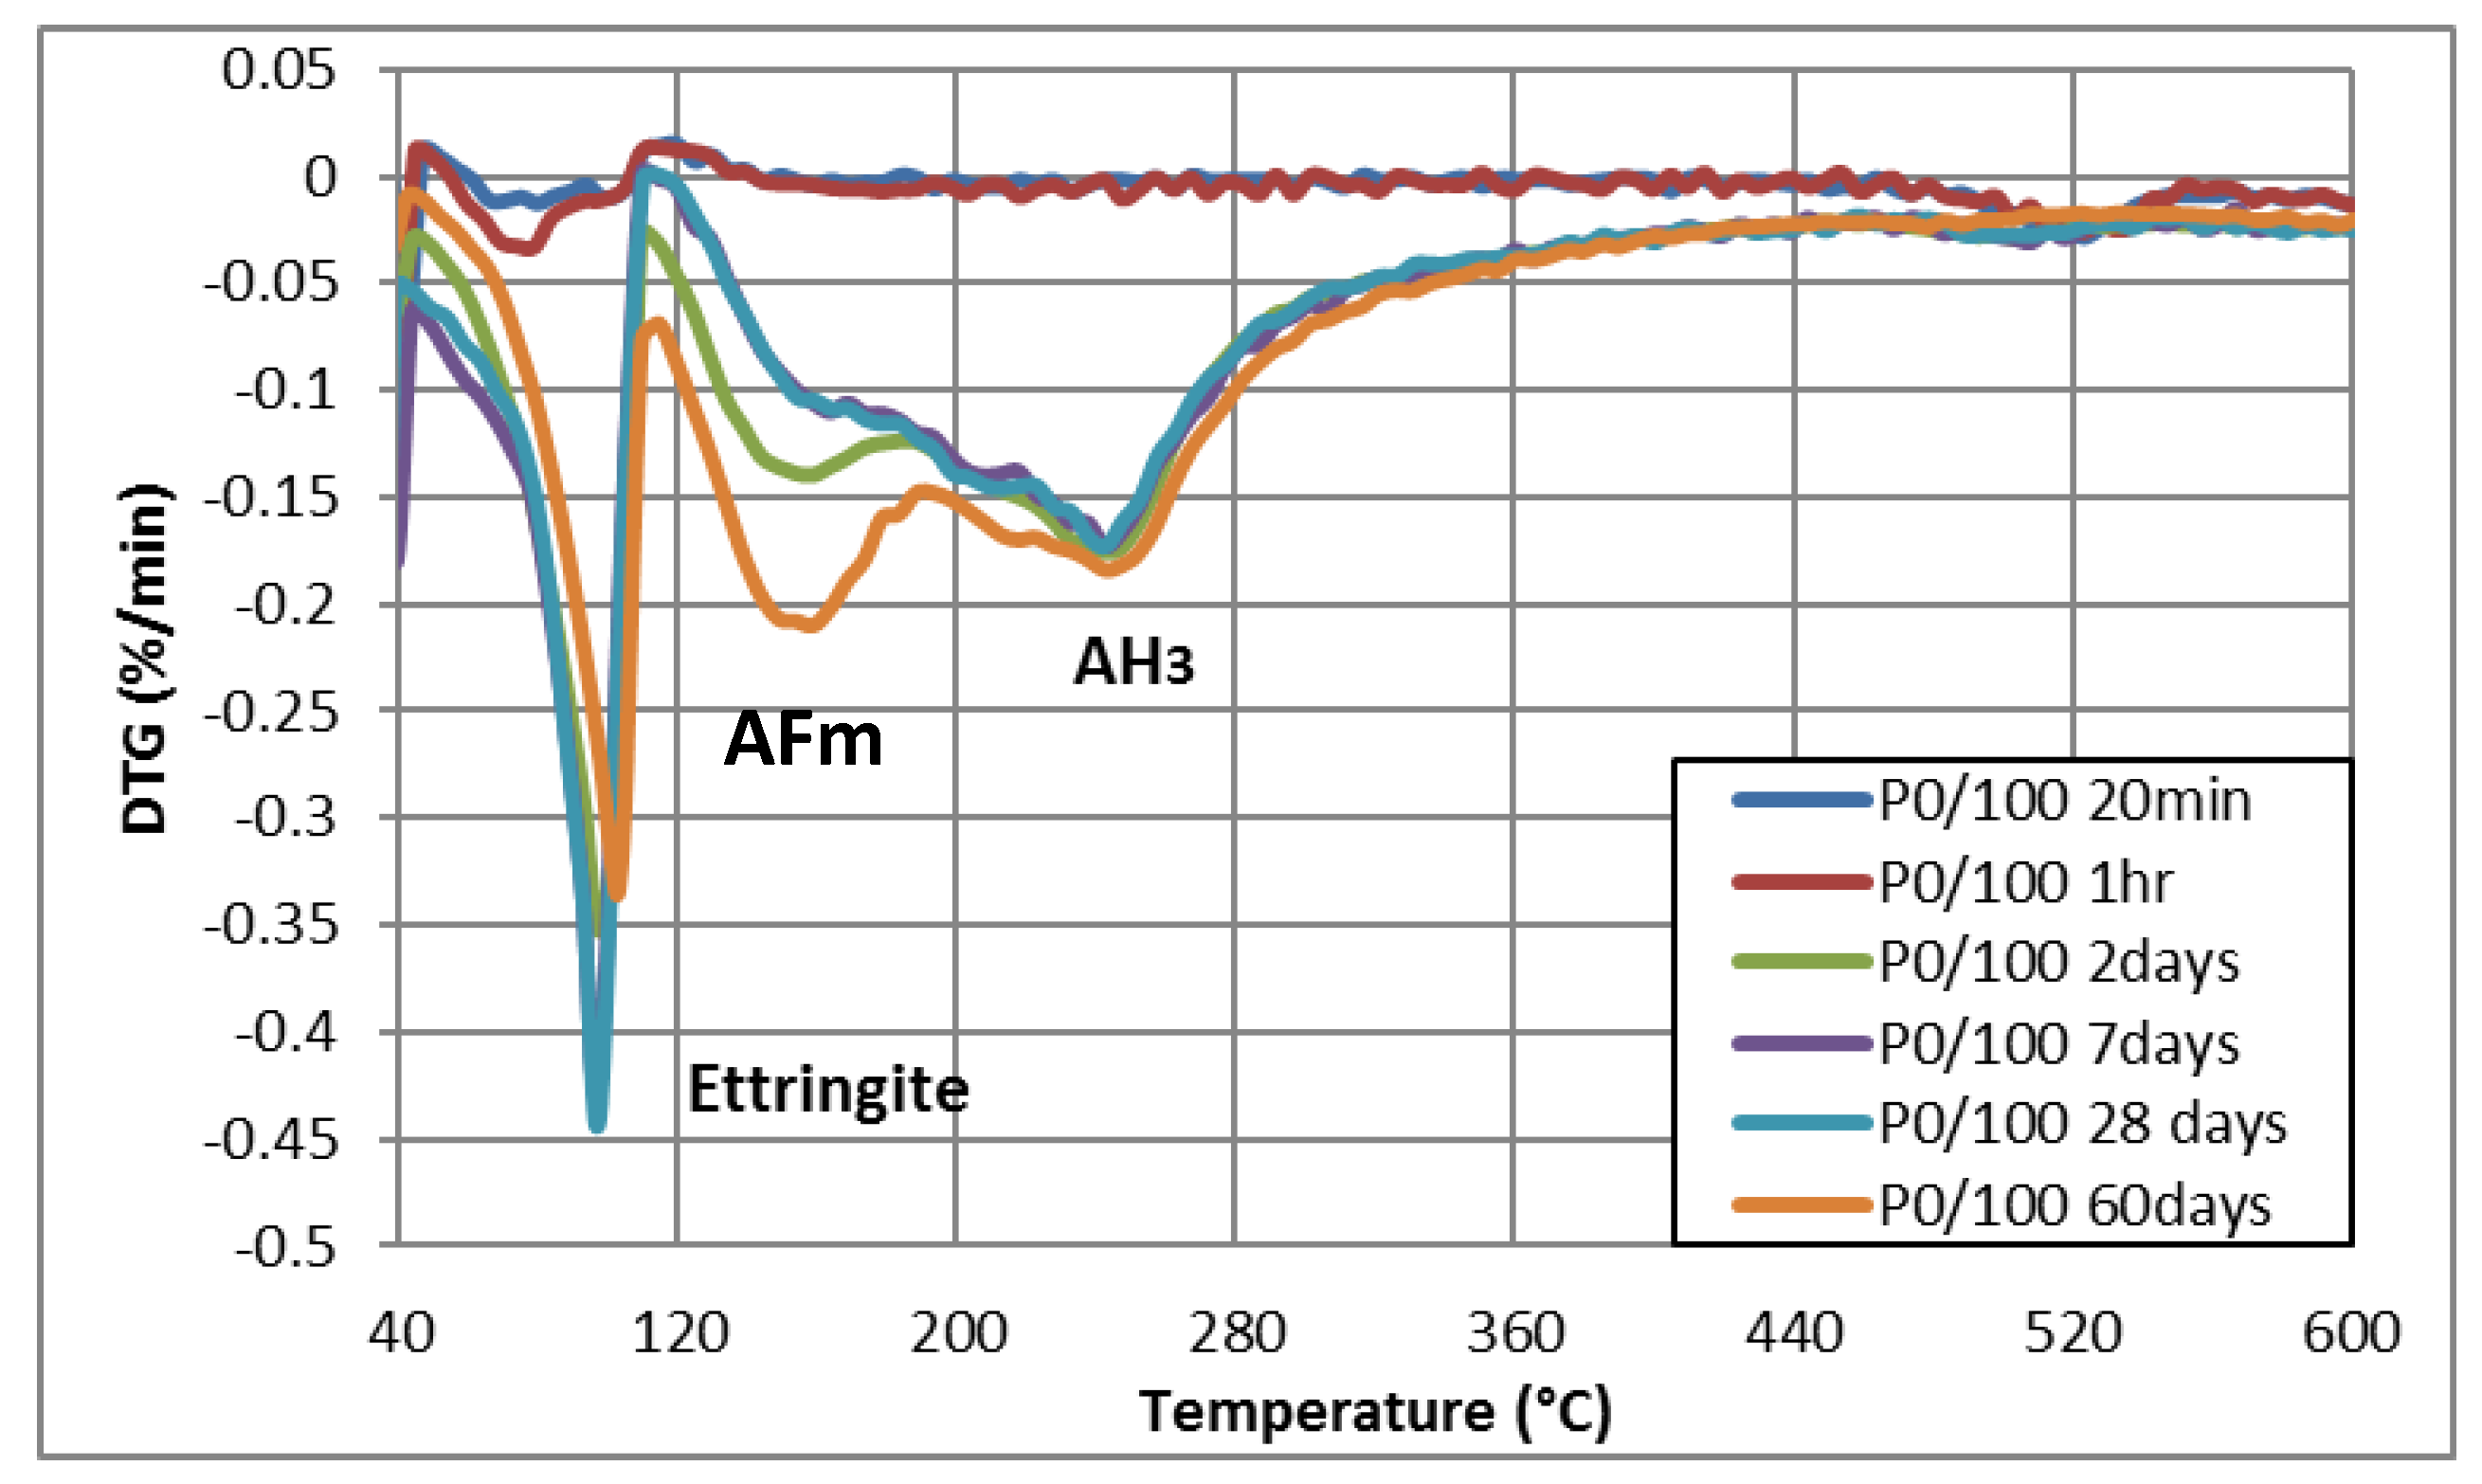
Figure 6, Figure 7 and Figure 8 show thermogravimetric derivative curves of DTG for the three OPC/CSA mixes, P100/0, P93/7, and P0/100, at different terms (20 min, 1 h, 2 days, 7 days, 28 days, and 60 days), respectively. The weight losses corresponding to the ettringite (AFt) (100 °C), calcium monosulfoaluminate (AFm) (160 °C), portlandite (CH) (450 °C), and the decarbonatation (680 °C) were monitored. After one hour, P0/100 reflected 4 weight losses as well. A small peak corresponding to ettringite (100 °C) is shown, with increases up to 28 days. In addition, 2 other peaks corresponding to AFm (160 °C) and Gibbsite (AH3) (240 °C) were detected. There was slight weight loss at 20 min for both P100/0 and P0/100 compared to P93/7, probably due to the negligible hydration during this period. P93/7 reveals the same phase as P100/0 (at the same temperatures and terms), but with ettringite starting earlier at 20 min.
The thermogravimetric analyses of each of the OPC/CSA percentages (P100/0, P93/7, and P0/100) are presented for the different terms (20 min, 1 h, 2 days, 7 days, and 28 days) in Table 4 in order to quantify each phase. When comparing the weight loss of the three cement pastes, the AFt formation was reflected by its weight loss increase up to 28 days. The decrease in weight loss of AFt and increase in AFm shows the transformation of AFt into AFm after 28 days.
The results presented in Table 4 show that the ettringite amount at 20 min was greater for P93/7 than both for P100/0 and P0/100.
The Gibbsite (AH3), theoretically formed through the hydration of the ye’elimite, was highly present in P0/100. However, this was not the case for P93/7. This was due to the lack of calcium and sulfate in the P0/100 mix, as discussed earlier, leading to the formation of AH3. However, the quantity of calcium produced by OPC was enough for the formation of ettringite in P93/7. Both Trauchessec and Chaunsali [13,21] confirm that there is no presence of Gibbsite for OPC/CSA mixes with less than 15% CSA.
From the above XRD and TGA/DTG, we found the same synergy as in isothermal calorimetry between the 2 types of cement. The cumulated heat between t = 0 and the time of appearance of the second sharp peak (around 2 h) corresponded to the heat released by the formation of AFm and ettringite from C3A hydration [22]. Therefore, the increase in the cumulative heat of hydration for the OPC/CSA blends reflected a larger formation of AFm and ettringite when the percentage of CSA increased in the cement paste.
The higher formation of ettringite and AFm for P93/7 compared to the pure mixes (P0/100 and P100/0) was shown in the TGA-DTG. The formation of ettringite may be due to the high presence of lime in the OPC composition compared to the percentage of CSA in the mix (7%). According to Martin et al. [23] and Trauchessec et al. [13], the OPC-free lime is a key parameter that affects the hydration of the CSA. The hydration kinetics of ye’elimite in CSA and the formation of ettringite are accelerated by the increase in the amount of lime in OPC.

3.2. Yield Stress Evolution

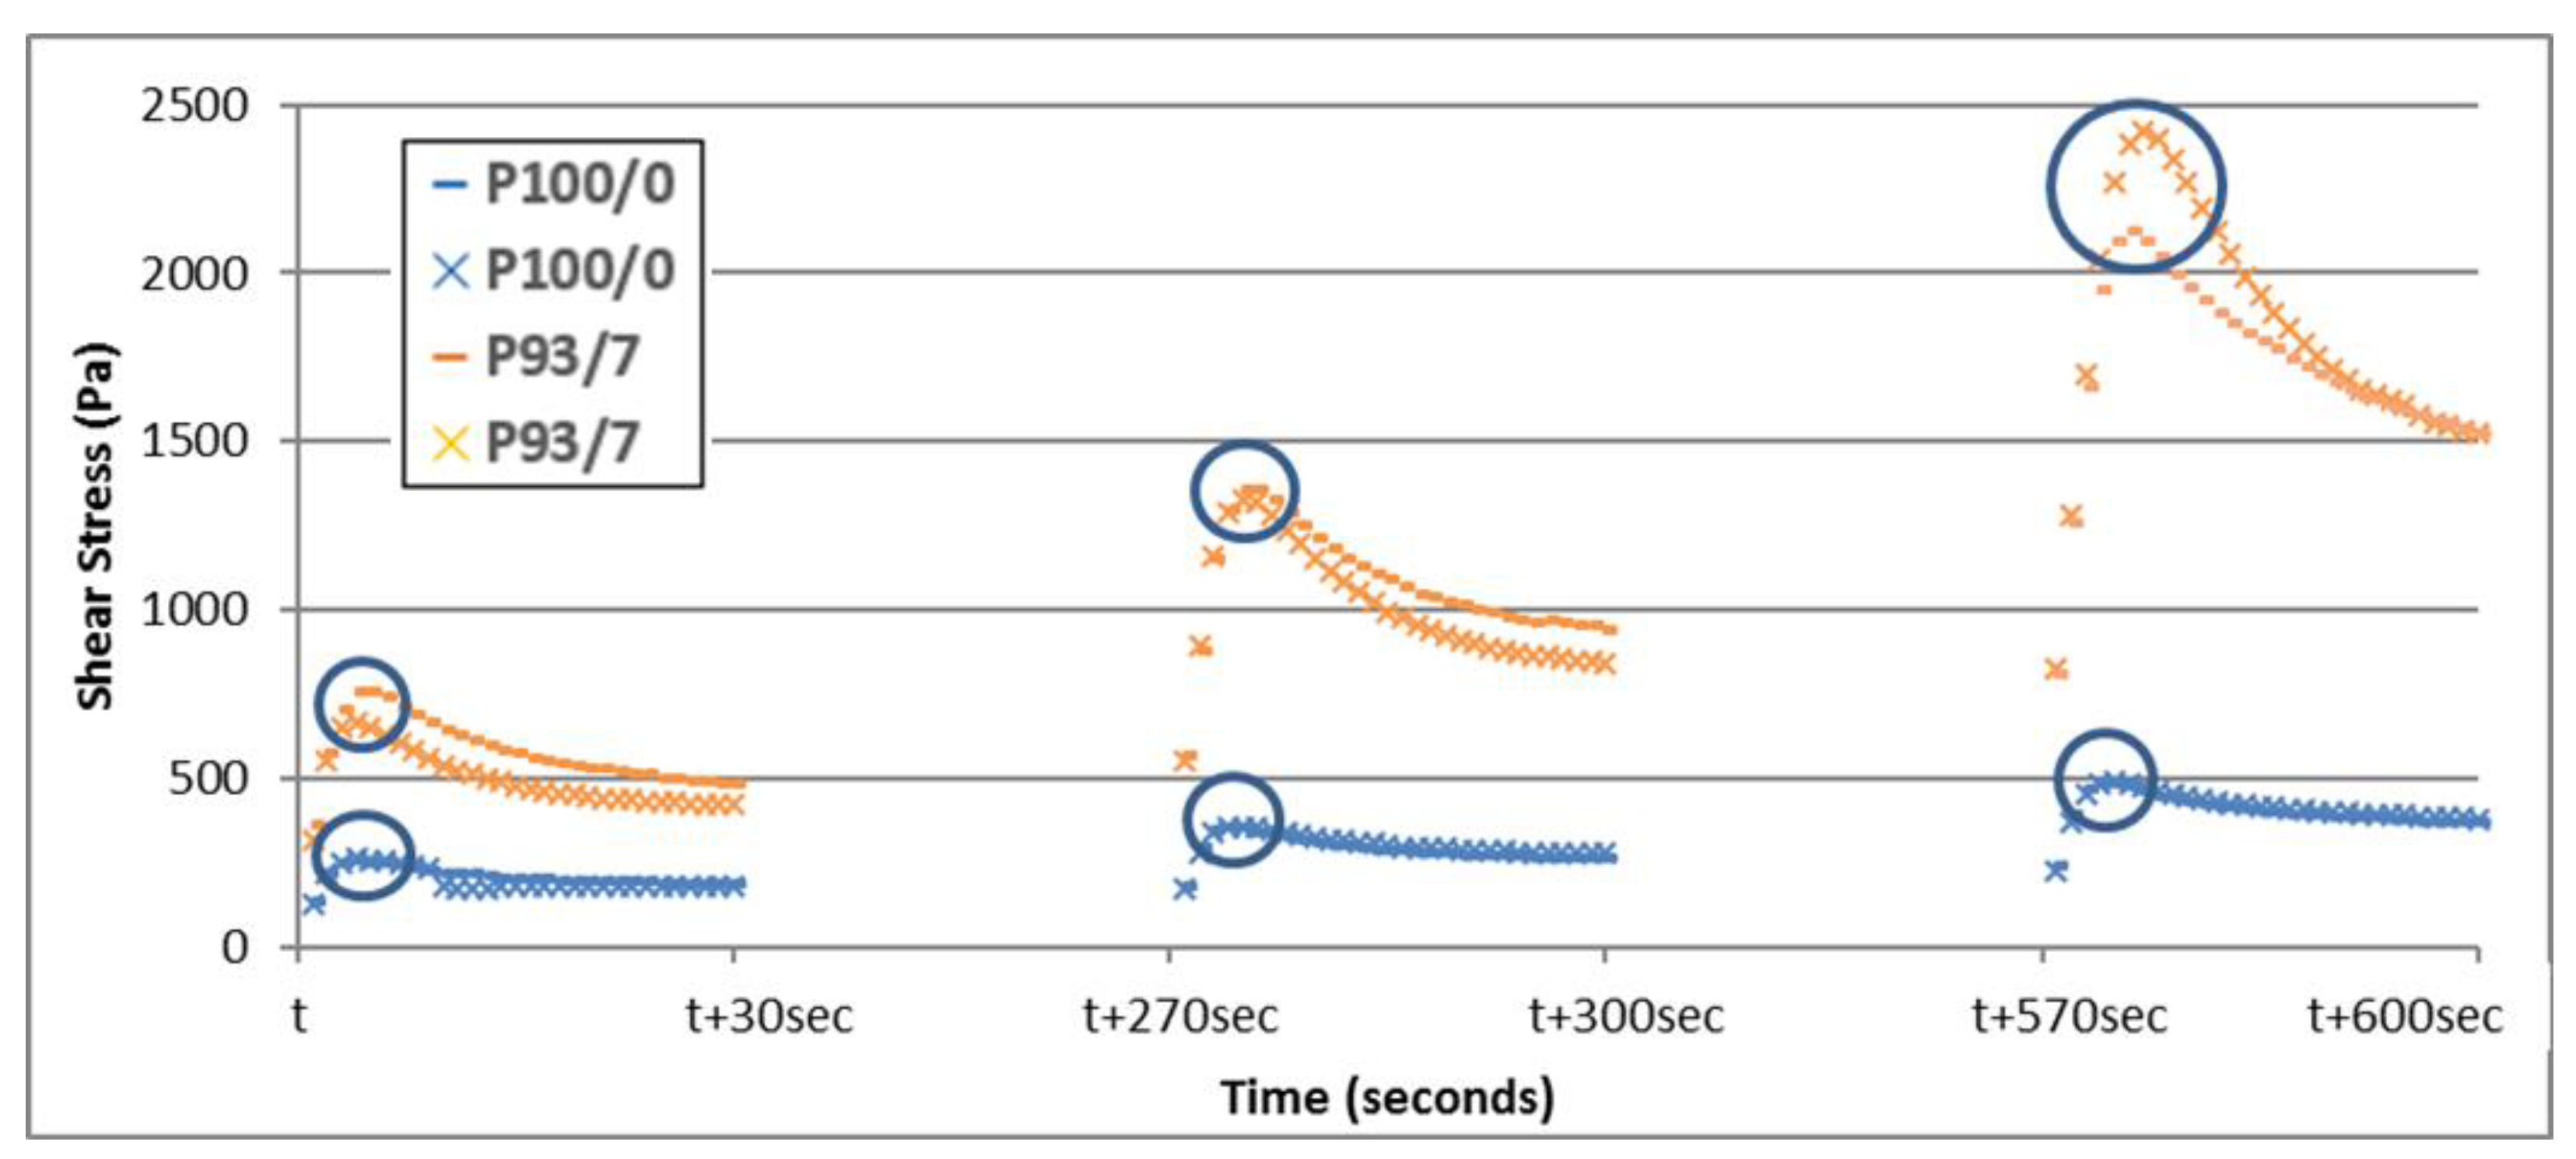
After placing the paste into the rheometer cell, the development of yield stress was examined over a period of 60 min. Before taking the first yield stress value and before each new measurement, the pastes were allowed to stand for 270 s. Each stress measurement was performed for a period of 30 s, during which the cement paste was sheared at a constant rate of 0.025 s−1. Figure 9 shows that during shearing, the stress progressively increases up to a peak value corresponding to the static yield stress of the cement paste.
The reproducibility of this measurement has already been explored in a previous study comparing the yield stress values obtained with two replicates for pure OPC cement pastes (identical to P100/0) and a cement paste containing 7% CSA (identical to P93/7) [24]. It has been shown that yield stress measurement is reproducible with a pure OPC cement paste. However, when CSA was added to the paste, larger differences were observed between the two replicates. This is probably due to the higher reactivity of the mixture, which causes rapid changes in the behavior of the paste. Also, the small quantity of CSA mixed leading to the heterogeneity of the mix may be an additional reason for the dispersion of the values. Nevertheless, these deviations were small compared to the average value of the yield stresses, and the accuracy of the measurement can be considered sufficient for the purpose of this study.
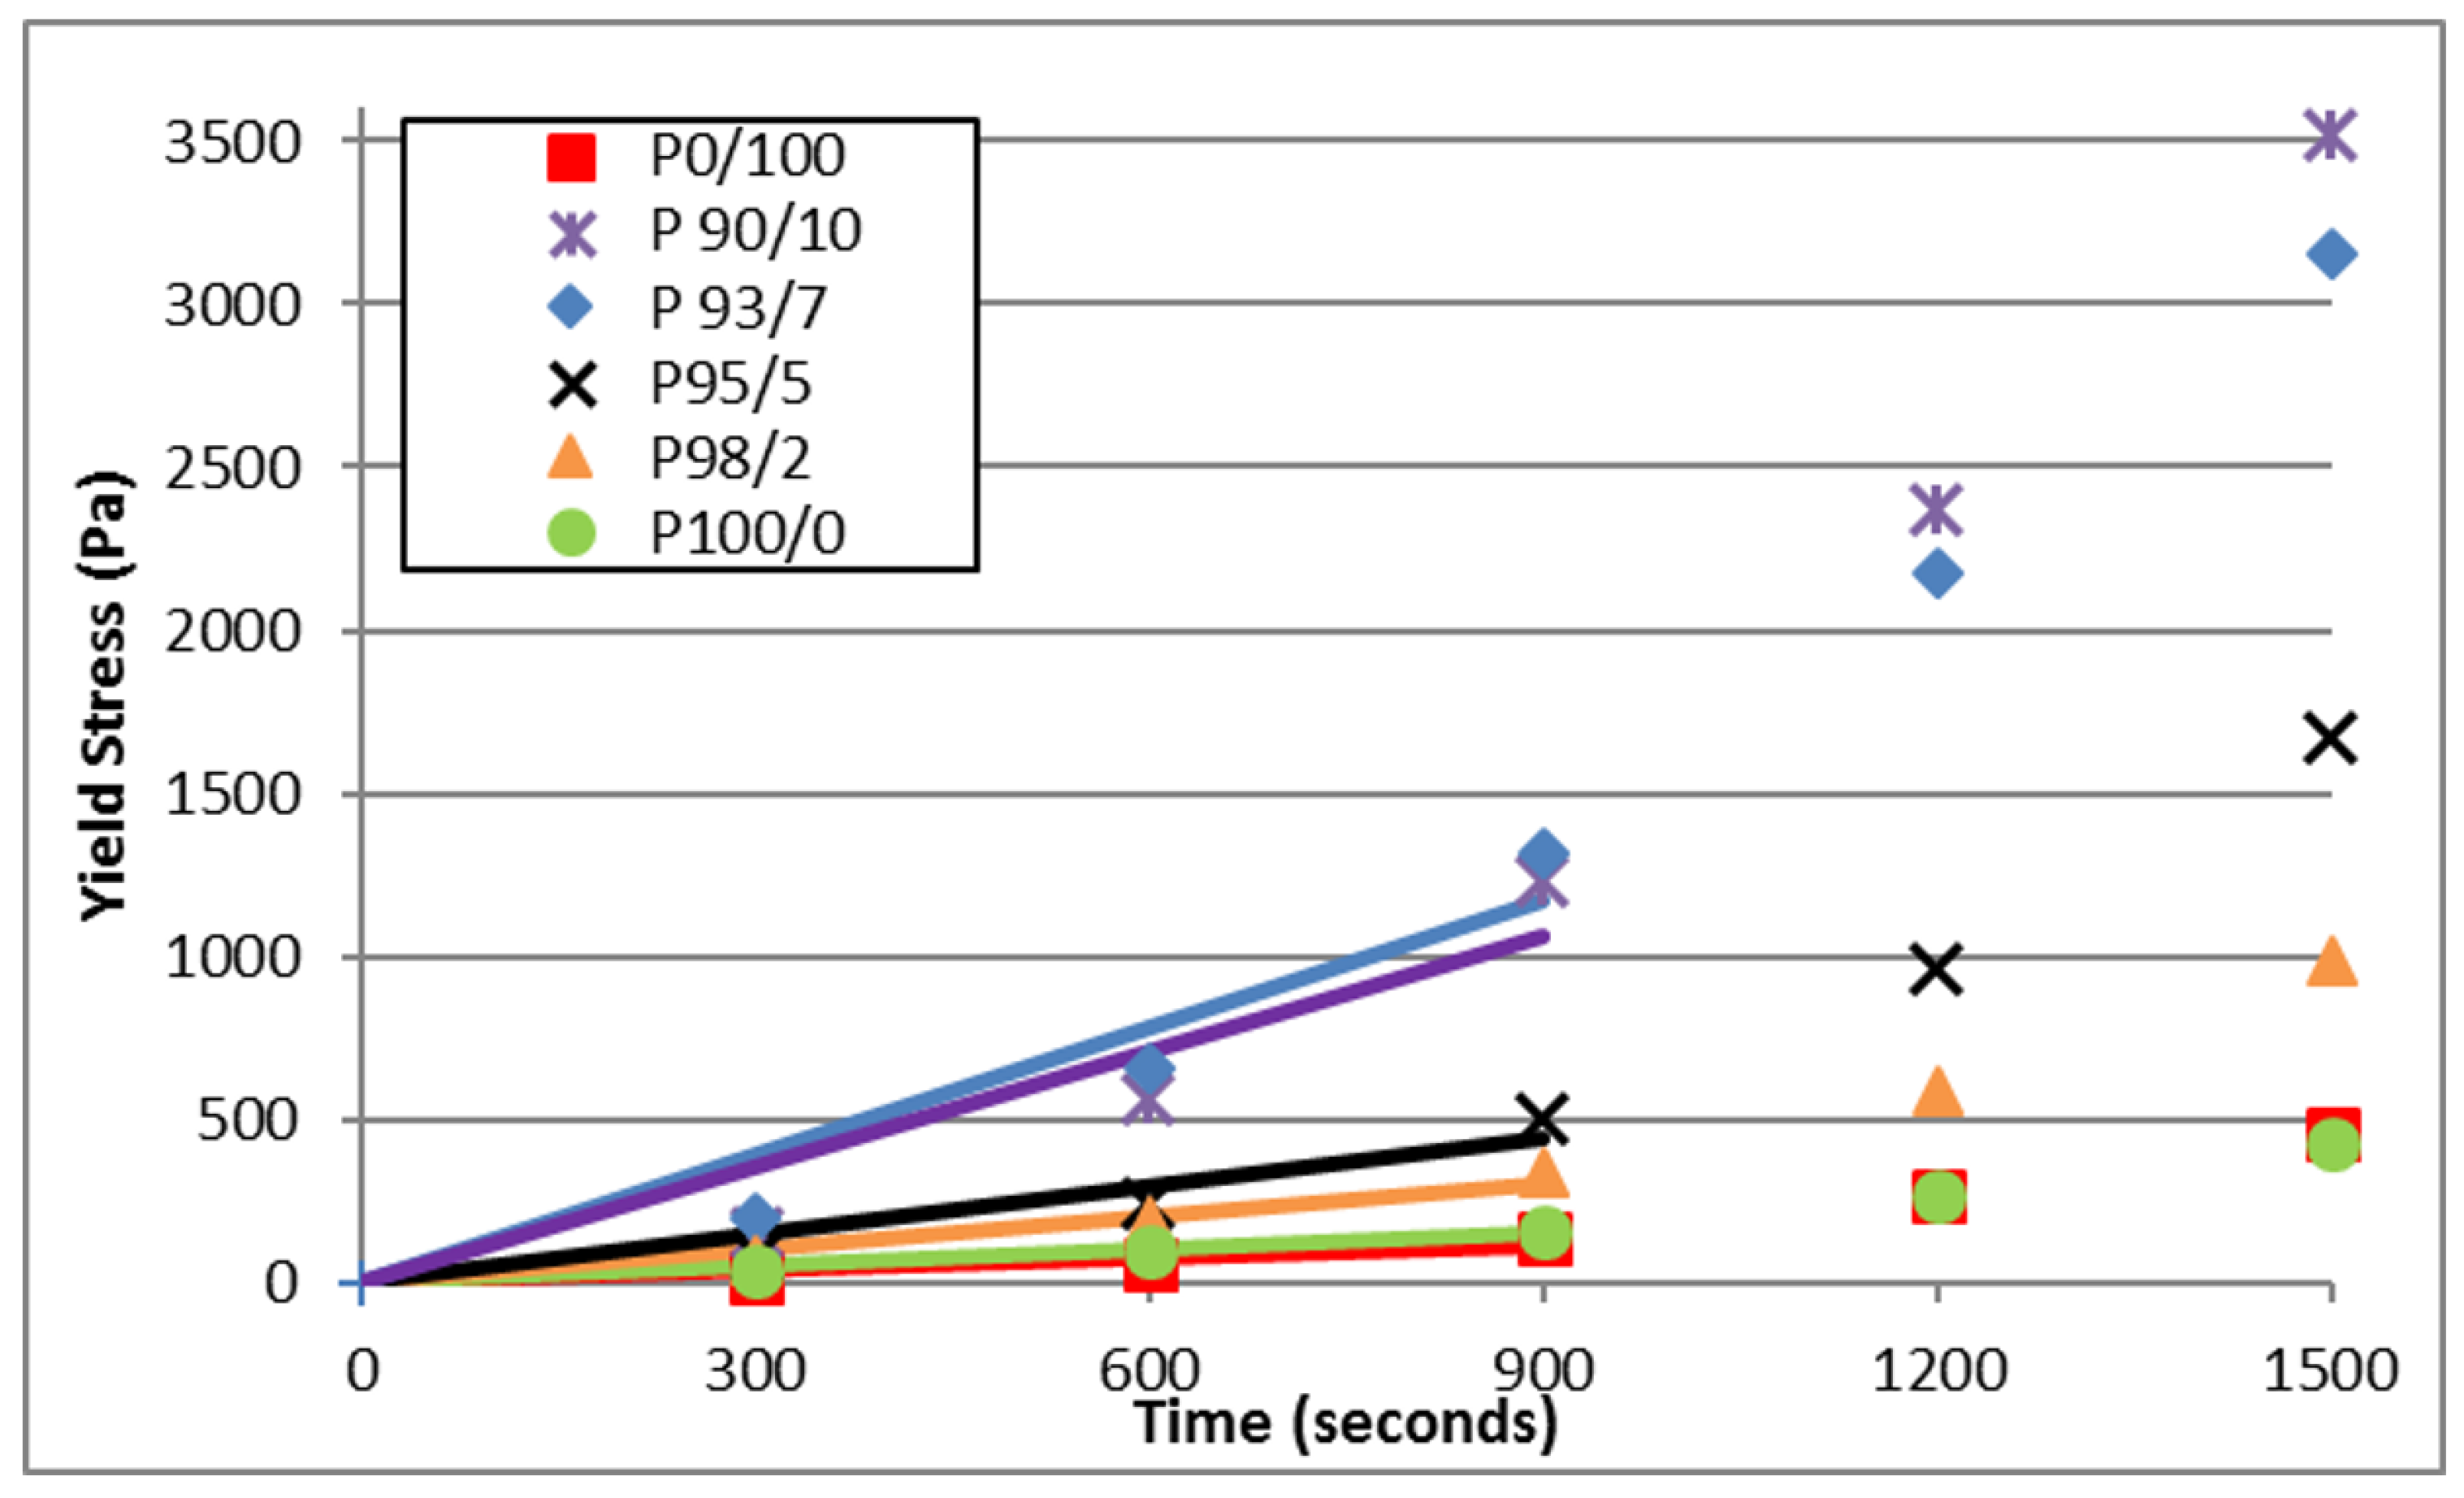
Figure 10 presents the yield stress evolution for each of the cement pastes as a function of time during the first 25 min. These curves reflect a rapid increase in the yield stress when the CSA percentage is increased. The variation of the yield stress follows an increasing polynomial trend curve. Perrot et al. [25] obtained an exponential growth of the yield stress over 75 min for a cement paste containing cement, kaolin, and limestone filler with a polycarboxylate-type polymer powder. However, they considered it linear during the first 40 min. Similarly, in our results, the yield stress evolution is not linear over 60 min, as shown in Figure 10. The yield stress evolution of 100% OPC and 100% CSA cement pastes could be considered linear during the first 30 min. This is not the case for the blended mixes. The blends present behavior that can be assumed to be linear just over the first 15 min. This is probably due to the higher reactivity presented in the earlier part influencing their rheological behavioral evolution in the short term. Therefore, in order to compare the following results, the linearity of all curves has been restricted to the first 15 min.
The rheological parameter of interest in this study is yield stress and its evolution over time. The thixotropic behavior of cement paste is of particular interest in several applications, especially in the case of 3D printing, where the buildability of the cementitious mixture is directly related to the structuration rate of the paste [26]. Roussel et al. [27] define the structuration rate Athix as the constant rate of this increase according to Equation (5):
τ 0 ( t ) = A t h i x t + τ 0 , 0
with τ 0 , 0 being the yield stress of the material with no time at rest, and considering a linear evolution of the yield stress increase in time during the induction period.
By considering these curves linear during the first 15 min, as discussed before, the structuration rate can be calculated. According to Equation (5), yield stress τ 0 ( t ) at a given resting time, t, is calculated as follows: τ 0 ( t ) = A t h i x t + τ 0 , 0 . However, it can be seen in Figure 10 that the initial yield stress is negligible with respect to the yield stress evolution, and the initial yield stress value, τ 0 , 0 , was forced to zero for the identification of the Athix value of all the studied mixes. This hypothesis is in accordance with Ovarlez and Roussel [27], who consider that the initial yield stress value can be neglected as τ 0 ( t ) = A t h i x t . Further, the first value recorded corresponds to the yield stress after a rest of 5 min and does not correspond to τ 0 , 0 .
According to these results, Athix(P0/100) was slightly higher than Athix(P100/0). The Athix of the OPC/CSA blends was higher than both the P100/0 and P0/100. During this period, the shear stresses were shown to increase when the percentage of CSA added to the cement pastes increased. However, the Athix value related to P93/7 was higher than that of P90/10 during the first 15 min. After 15 min, the yield stress of P90/10 rose higher than P93/7.
Table 5 presents the Athix and determination factor of all cement pastes. The R² values progressively decreased from 0.96 for the pure OPC paste, down to 0.82 for the pure CSA paste, with the R² value being globally smaller as the CSA percentage increased. The smaller R² values for pastes containing CSA were mainly due to the nonlinearity of the yield stress–time relation, as presented in Figure 10. Indeed, the presence of a small amount of CSA accelerated the early hydration of the material, and the period, during which the yield stress evolution could be considered linear, is probably smaller than 15 min for these pastes [25]. However, it was decided to determine the Athix value of all the mixes over the same period of time (15 min) in order to easily compare the different pastes with a single value.
The difference in the yield stress curves over this interval, even when the CSA percentage was changed by small amounts, clearly reflects the impact of the CSA on the rheological behavior of the OPC/CSA mixes.
These results are compatible with Champenois et al. [8], where CSA cement paste presented a slow stiffening during the first hour. Further, by comparing these results to Ovarlez and Roussel [28] or to Assaad et al. [29], the structuration rate was between 0.1 and 1.7 Pa/s and between 0.3 and 1.6 Pa/s for self-compacting concrete. Within the first 15 min, the Athix values were within these margins

4. Discussion

The objective of this study was to understand the effect of the partial substitution (less than 10%) of OPC with CSA on the reactional mechanism and the rheological behavior of the cement pastes. The heat of hydration indicated higher hydration for blended cement compared to pure cement. This was proven by the phases shown in the XRD and the weight losses of the TGA-DTG. Cement blends with CSA percentages less than 10% provided the same hydration products as OPC but with a higher amount of primary ettringite. Since the hydration of C3A was delayed, the short-term formation of ettringite in OPC/CSA blends can be interpreted in two ways. On one hand, the ye’elimite in CSA accelerated by the high lime present in the OPC generates more ettringite, according to Equation (2). On the other hand, the hydration of CSA is related to the sulfate source present [30]. There are two sources of sulfate in the OPC/CSA mix: the anhydrite in the CSA and the gypsum in the OPC. Gypsum is shown to hydrate faster at earlier ages than anhydrite [18,30,31,32]. This explains the higher reactivity of the gypsum in OPC with ye’elimite at early ages accompanied by that of the anhydrite hydration. Therefore, a higher amount of ettringite was formed in the OPC/CSA mix compared to 100% CSA.
The ettringite formed has been proven to affect workability. Prince et al. found that the rheology of cement pastes is related to ettringite formation [33]. Our results show that the early formation of ettringite in blend OPC/CSA mixes also affects the rheological behaviors of the pastes. Indeed, the evolution of yield stress over time becomes faster as the amount of CSA in the mixes increases. Therefore, a synergy of up to one hour between the OPC and CSA is reflected in the chemical and rheological studies. This compatibility between the two characteristics allows OPC/CSA blends to be used in special applications in the construction field, such as 3D printing. In fact, the increase in the kinetics of the chemical reactions leads to an increase in the evolution of the structuration rate of the rest of the cement paste [33]. This is reflected in mortars by increases in buildability. In a previous article [7], it has been shown that the addition of 7% of CSA improves the buildability of a mortar made of OPC.

5. Conclusions

In this study, the hydration mechanism and rheological behavior of cement pastes were explored in parallel. Different amounts of CSA cement—less than 10%—replacing the OPC were studied. Chemical and rheological studies showed similar behavior when the CSA cement percentage was varied in OPC/CSA cement pastes. XRD showed that ettringite formation in the blend appeared at an early age for P93/7 (20 min), contrarily to P100/0 and P0/100 pastes. Ettringite formation was accelerated with respect to P0/100, due to the lime and gypsum coming from the OPC accelerating the hydration of the ye’elimite in CSA. These reactions happening at an early age (20 min) show the impact of the addition of these two types of cement with each other. Weight losses in TGA-TDG comply with the XRD results. The ettringite and portlandite amounts found in the blend at early ages (20 min) exceeding both 100% OPC and 100% CSA cement pastes confirm that synergy is found between the two types of cement, increasing the hydration of both once they are mixed.
In addition, the heat of hydration and structuration rate both increase when the percentage of CSA increases in OPC/CSA blends, and they are higher for blends compared to pure OPC and CSA cement pastes. The intensity of the heat of hydration and higher thixotropic behavior can both be explained by the accelerated ettringite formation in the short term.
This compatibility between the OPC and CSA cement will be useful for special applications in the construction field, such as 3D printing. This study can be of particular interest for the premix development of innovative materials with specific performances. It is suggested to study the use of CSA percentage (less than 10%) to reduce the autogenous shrinkage of cement pastes in order to better control the early-age cracking of concrete.

Author Contributions

Funding acquisition, G.A. and S.R.; investigation, N.K.; methodology, G.A. and S.R.; project administration, G.A. and S.R.; resources, G.A. and S.R.; supervision, G.A. and S.R.; validation, G.A. and S.R.; visualization, N.K. and J.K.; writing—original draft, N.K.; writing—review & editing, N.K., G.A. and S.R. All authors have read and agreed to the published version of the manuscript.

Funding

This research work has been carried out in the frame of the MATRICE Project, co-funded by the region “Hauts de France” and the European Union with the European Regional Development Fund.

Data Availability Statement

The data presented in this study are available on request from the corresponding author.

Acknowledgments

The authors acknowledge the supply of materials from Vicat, Sika, and the Carrières du Boulonais.

Conflicts of Interest

The authors declare no conflict of interest.

References

  1. Ludwig, H.-M.; Zhang, W. Research review of cement clinker chemistry. Cem. Concr. Res. 2015, 78, 24–37. [Google Scholar] [CrossRef]
  2. Péra, J.; Ambroise, J. New applications of calcium sulfoaluminate cement. Cem. Concr. Res. 2004, 34, 671–676. [Google Scholar] [CrossRef]
  3. Kleib, J.; Aouad, G.; Louis, G.; Zakhour, M.; Boulos, M.; Rousselet, A.; Bulteel, D. The use of calcium sulfoaluminate cement to mitigate the alkali silica reaction in mortars. Constr. Build. Mater. 2018, 184, 295–303. [Google Scholar] [CrossRef]
  4. Antoun, M.; Becquart, F.; Gerges, N.; Aouad, G. The use of calcium sulfo-aluminate cement as an alternative to Portland Cement for the recycling of municipal solid waste incineration bottom ash in mortar. Waste Manag. Res. 2020, 38, 868–875. [Google Scholar] [CrossRef]
  5. Zhou, Q.; Milestone, N.B.; Hayes, M. An alternative to Portland Cement for waste encapsulation—The calcium sul-foaluminate cement system. J. Hazard. Mater. 2006, 136, 120–129. [Google Scholar] [CrossRef]
  6. Coumes, C.C.D.; Courtois, S.; Peysson, S.; Ambroise, J.; Pera, J. Calcium sulfoaluminate cement blended with OPC: A potential binder to encapsulate low-level radioactive slurries of complex chemistry. Cem. Concr. Res. 2009, 39, 740–747. [Google Scholar] [CrossRef]
  7. Khalil, N.; Aouad, G.; El Cheikh, K.; Rémond, S. Use of calcium sulfoaluminate cements for setting control of 3D-printing mortars. Constr. Build. Mater. 2017, 157, 382–391. [Google Scholar] [CrossRef]
  8. Champenois, J.-B.; Coumes, C.C.D.; Poulesquen, A.; Le Bescop, P.; Damidot, D. Beneficial use of a cell coupling rheometry, conductimetry, and calorimetry to investigate the early age hydration of calcium sulfoaluminate cement. Rheol. Acta 2013, 52, 177–187. [Google Scholar] [CrossRef]
  9. García-Maté, M.; Santacruz, I.; Ángeles, G.; León-Reina, L.; Aranda, M.A. Rheological and hydration characteri-zation of calcium sulfoaluminate cement pastes. Cem. Concr. Compos. 2012, 34, 684–691. [Google Scholar] [CrossRef]
  10. Peysson, S.; Péra, J.; Chabannet, M. Immobilization of heavy metals by calcium sulfoaluminate cement. Cem. Concr. Res. 2005, 35, 2261–2270. [Google Scholar] [CrossRef]
  11. Kleib, J.; Aouad, G.; Khalil, N.; Zakhour, M. Incorporation of zinc in calcium sulfoaluminate cement clinker. Adv. Cem. Res. 2021, 33, 311–317. [Google Scholar] [CrossRef]
  12. Juenger, M.; Winnefeld, F.; Provis, J.; Ideker, J. Advances in alternative cementitious binders. Cem. Concr. Res. 2011, 41, 1232–1243. [Google Scholar] [CrossRef]
  13. Trauchessec, R.; Mechling, J.-M.; Lecomte, A.; Roux, A.; Le Rolland, B. Hydration of ordinary Portland cement and calcium sulfoaluminate cement blends. Cem. Concr. Compos. 2015, 56, 106–114. [Google Scholar] [CrossRef]
  14. Le Saoût, G.; Lothenbach, B.; Hori, A.; Higuchi, T.; Winnefeld, F. Hydration of Portland cement with additions of calcium sulfoaluminates. Cem. Concr. Res. 2013, 43, 81–94. [Google Scholar] [CrossRef]
  15. Perrot, A.; Pierre, A.; Vitaloni, S.; Picandet, V. Prediction of lateral form pressure exerted by concrete at low casting rates. Mater. Struct. 2014, 48, 2315–2322. [Google Scholar] [CrossRef]
  16. Sun, L.; Pang, X.; Yan, H. Hydration kinetics of oil well cement in the temperature range between 5 and 30 °C. Front. Mater. 2022, 9, 558. [Google Scholar] [CrossRef]
  17. Lura, P.; Winnefeld, F.; Klemm, S. Simultaneous measurements of heat of hydration and chemical shrinkage on hardening cement pastes. J. Therm. Anal. Calorim. 2009, 101, 925–932. [Google Scholar] [CrossRef]
  18. Winnefeld, F.; Lothenbach, B. Hydration of calcium sulfoaluminate cements—Experimental findings and thermodynamic modelling. Cem. Concr. Res. 2010, 40, 1239–1247. [Google Scholar] [CrossRef]
  19. Winnefeld, F.; Barlag, S. Calorimetric and thermogravimetric study on the influence of calcium sulfate on the hydration of ye’elimite. J. Therm. Anal. Calorim. 2009, 101, 949–957. [Google Scholar] [CrossRef]
  20. Telesca, A.; Marroccoli, M.; Pace, M.; Tomasulo, M.; Valenti, G.; Monteiro, P. A hydration study of various calcium sulfoaluminate cements. Cem. Concr. Compos. 2014, 53, 224–232. [Google Scholar] [CrossRef]
  21. Chaunsali, P.; Mondal, P. Physico-chemical interaction between mineral admixtures and OPC–calcium sulfoaluminate (CSA) cements and its influence on early-age expansion. Cem. Concr. Res. 2016, 80, 10–20. [Google Scholar] [CrossRef]
  22. Pourchet, S.; Regnaud, L.; Perez, J.; Nonat, A. Early C3A hydration in the presence of different kinds of calcium sulfate. Cem. Concr. Res. 2009, 39, 989–996. [Google Scholar] [CrossRef]
  23. Martin, L.H.; Winnefeld, F.; Müller, C.J.; Lothenbach, B. Contribution of limestone to the hydration of calcium sul-foaluminate cement. Cem. Concr. Compos. 2015, 62, 204–211. [Google Scholar] [CrossRef]
  24. Khalil, N.; Rémond, S.; Baz, B.; Aouad, G. Characterization of 3D Printing Mortars Made with OPC/CSA Mixes. In First RILEM International Conference on Concrete and Digital Fabrication—Digital Concrete 2018; Wangler, T., Flatt, R., Eds.; RILEM Bookseries; Springer: Cham, Switzerland, 2018; Volume 19. [Google Scholar] [CrossRef]
  25. Perrot, A.; Rangeard, D.; Pierre, A. Structural built-up of cement-based materials used for 3D-printing extrusion techniques. Mater. Struct. 2016, 49, 1213–1220. [Google Scholar] [CrossRef]
  26. Baz, B.; Remond, S.; Aouad, G. Influence of the mix composition on the thixotropy of 3D printable mortars. Mag. Concr. Res. 2022, 74, 271–283. [Google Scholar] [CrossRef]
  27. Roussel, N. Steady and transient flow behaviour of fresh cement pastes. Cem. Concr. Res. 2005, 35, 1656–1664. [Google Scholar] [CrossRef]
  28. Ovarlez, G.; Roussel, N. A Physical Model for the Prediction of Lateral Stress Exerted by Self-Compacting Concrete on Formwork. Mater. Struct. 2006, 39, 269–279. [Google Scholar] [CrossRef]
  29. Assaad, J.; Khayat, K.H. Assessment of Thixotropy of Self-Consolidating Concrete and Concrete-Equivalent-Mortar—Effect of Binder Composition and Content. ACI Mater. J. 2004, 101, 400–408. [Google Scholar]
  30. García-Maté, M.; De la Torre, A.G.; León-Reina, L.; Losilla, E.R.; Aranda, M.A.; Santacruz, I. Effect of calcium sulfate source on the hydration of calcium sulfoaluminate eco-cement. Cem. Concr. Compos. 2015, 55, 53–61. [Google Scholar] [CrossRef]
  31. Sahu, S.; Havlica, J.; Tomková, V.; Majling, J. Hydration behaviour of sulphoaluminate belite cement in the presence op various calcium sulphates. Thermochim. Acta 1991, 175, 45–52. [Google Scholar] [CrossRef]
  32. Péra, J.; Ambroise, J.; Holard, E.; Beauvent, G. Influence of the type of calciumsulfate on the properties of calcium sul-foaluminate cement. Int. Congr. Chem. Cem. Durb. South Afr. 2003, 3, 1129–1135. [Google Scholar]
  33. Prince, W.; Espagne, M.; Aïtcin, P.-C. Ettringite formation: A crucial step in cement superplasticizer compatibility. Cem. Concr. Res. 2003, 33, 635–641. [Google Scholar] [CrossRef]
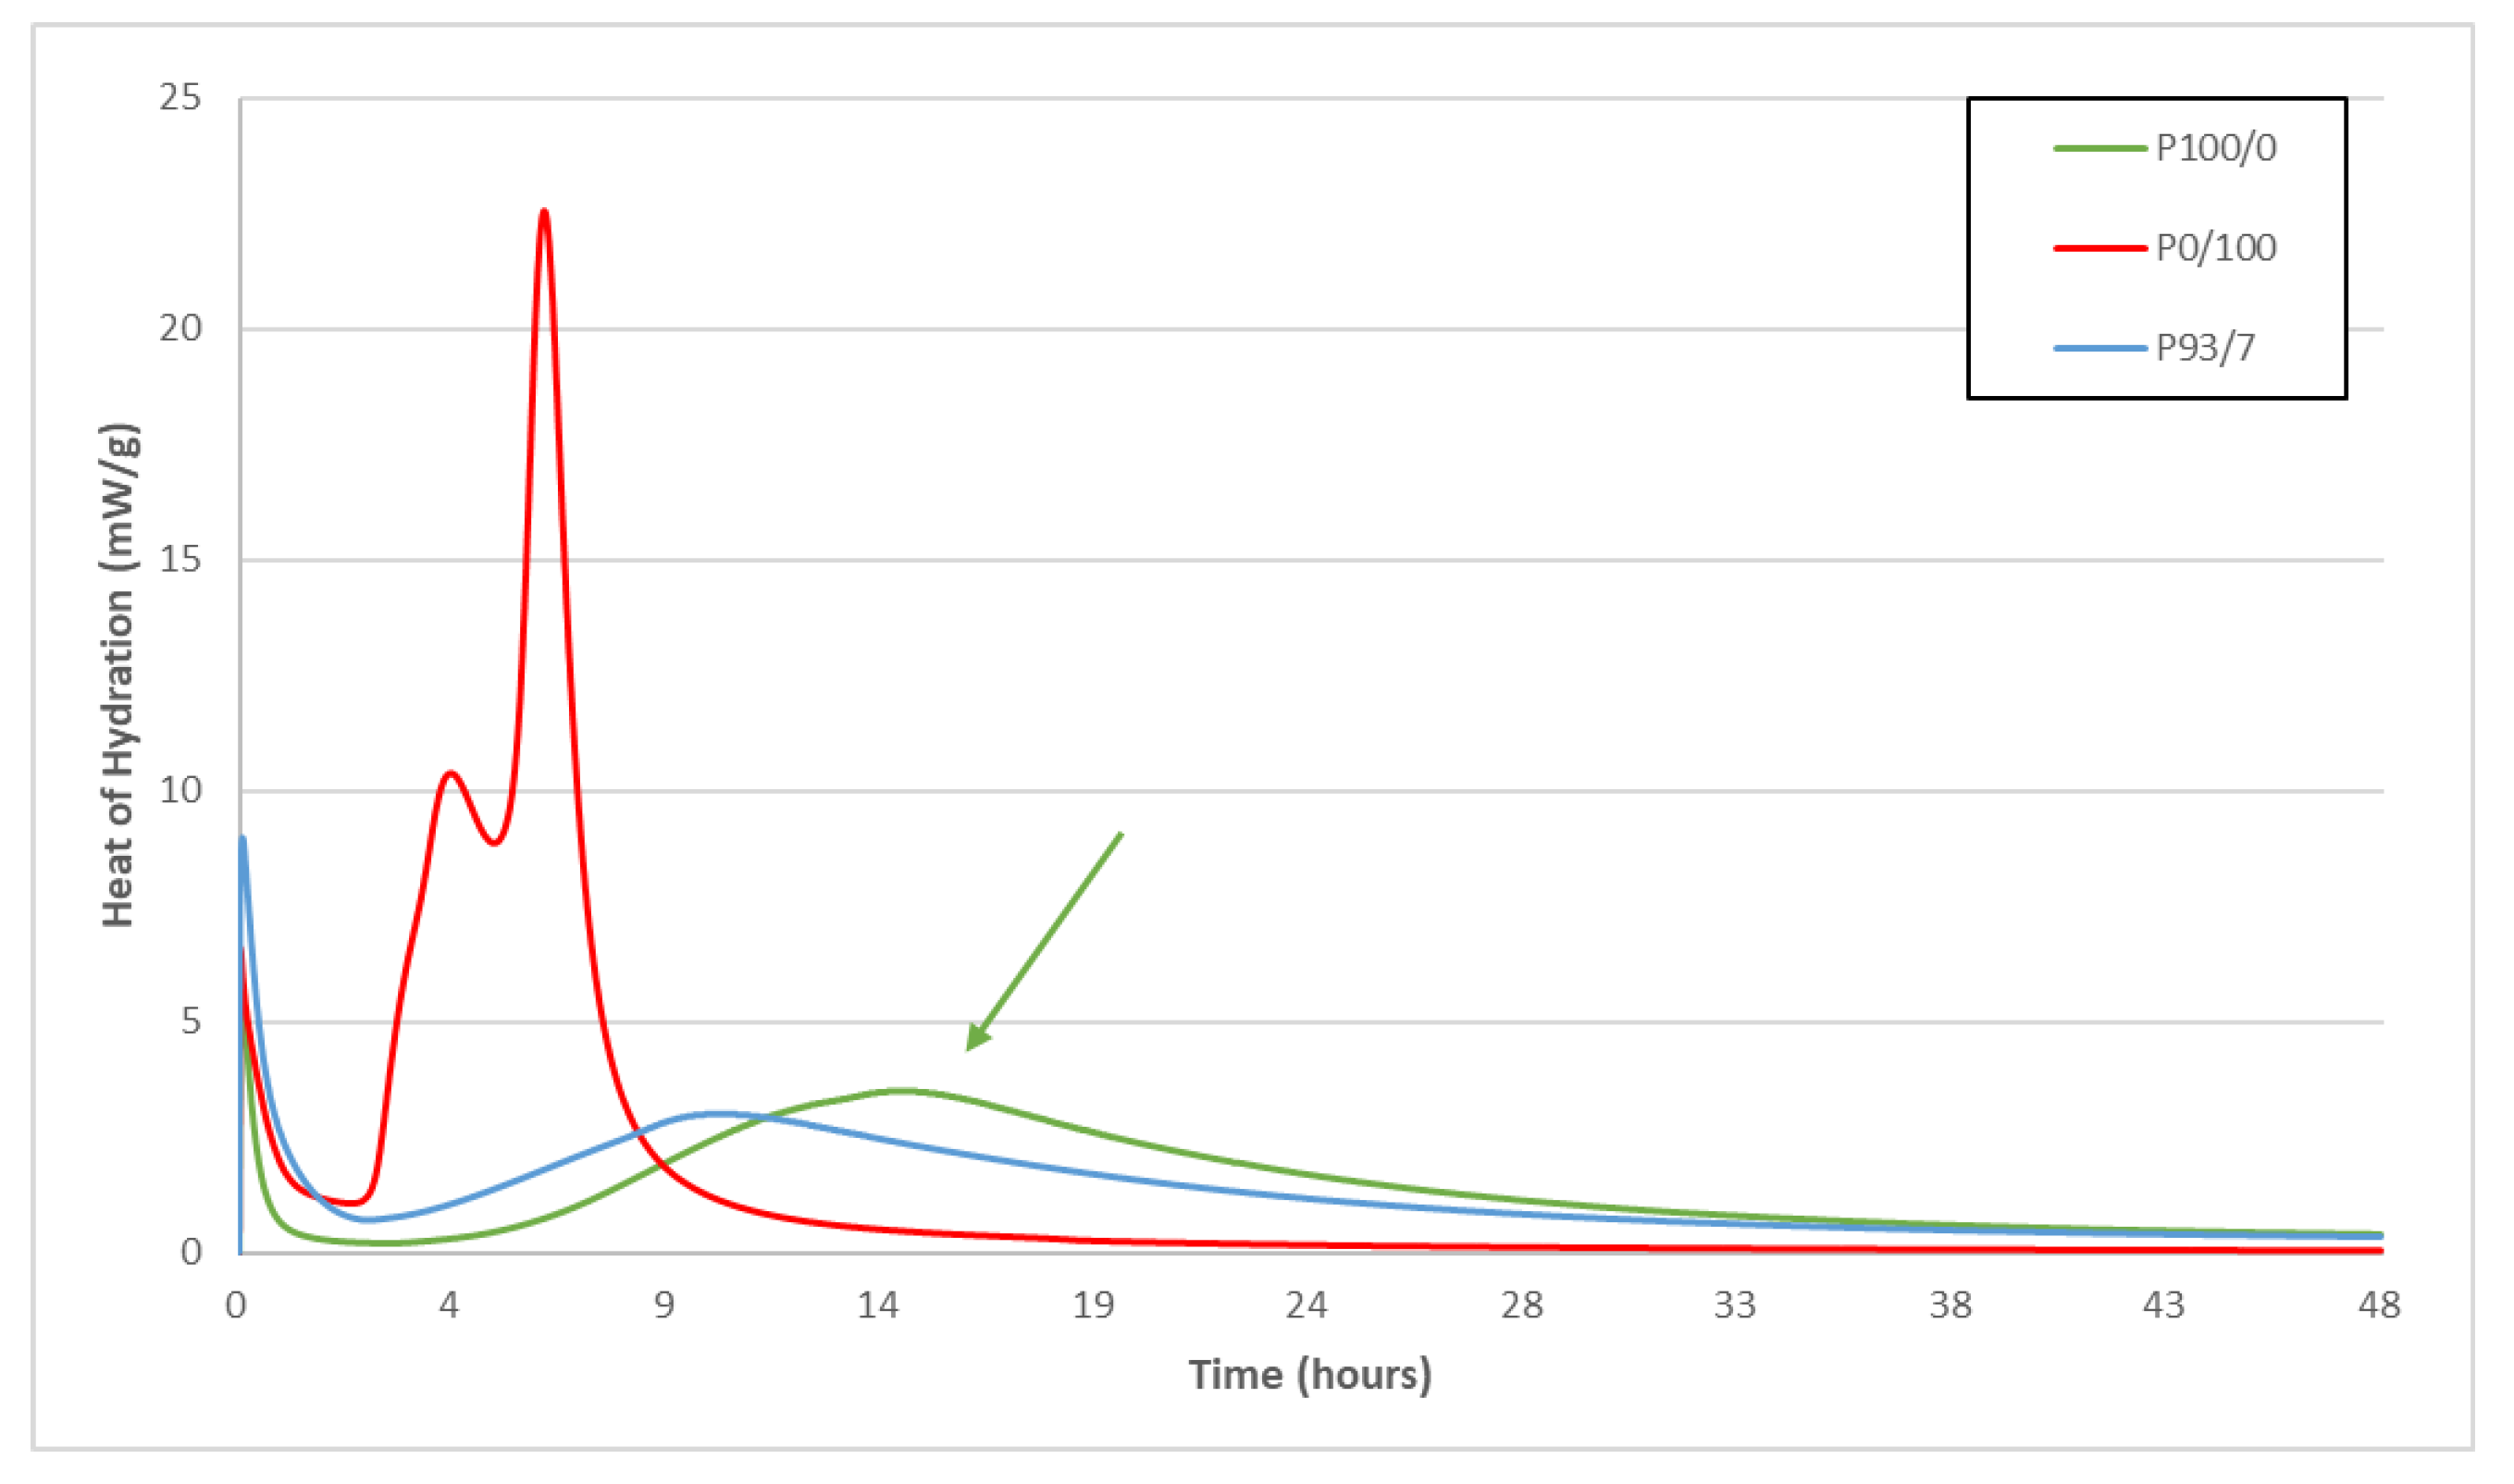
Figure 1. The heat of hydration of the 3 cement pastes: P100/0, P93/7, and P0/100.
Buildings 13 00409 g001
Figure 2. Evolution of the cumulative heat of hydration as a function of the CSA percentage at 20 min, 40 min, 1 h, and 2 h.
Buildings 13 00409 g002
Figure 3. XRD diagrams for P100/0 at 20 minutes, 1 h, 2, 7, and 28 days.
Buildings 13 00409 g003
Figure 4. XRD diagrams for P93/7 at 20 minutes, 1 h, 2, 7, and 28 days.
Buildings 13 00409 g004
Figure 5. XRD diagrams for P0/100 at 20 minutes, 1 h, 2, 7, and 28 days.
Buildings 13 00409 g005
Figure 6. DTG of P100/0 for 20 min, 1 h, 2, 7, 28, and 60 days.
Buildings 13 00409 g006
Figure 7. DTG of P93/7 for 20 min, 1 h, 2, 7, 28, and 60 days.
Buildings 13 00409 g007
Figure 8. DTG of P0/100 for 20 min, 1 h, 2, 7, 28, and 60 days.
Buildings 13 00409 g008
Figure 9. Shear stress diagrams of P100/0 and P93/7 as a function of time at different intervals (note that the time is restricted during the rest period between two consecutive measurements) [24].
Buildings 13 00409 g009
Figure 10. Yield stress evolution as a function of time during the first 1500 first seconds.
Buildings 13 00409 g010
Table 1. Chemical composition of OPC and CSA.
CompositionNa2O eq. Fire Loss 950 °CMgOSiO2Al2O3Fe2O3CaOSO3Cl
OPC0.461.200.9120.963.655.0564.022.240.06
CSA0.163.8nd8.1618.227.6443.6015.240.05
nd: not determined.
Table 2. Mineralogical composition and main characteristics of OPC and CSA.
CompositionC3SC4A3ŠC2SC3MS2C3AC3FTC4AFFree Lime
OPC62.6--16.5--1.5--13.13.80.5
CSA--54.329.14.5--9.3--0.40.2
--: absent. Cement chemistry notation is used, where C = CaO, S = SiO2, A = Al2O3, F = Fe2O3, Š = SO3, M = MgO, and T = TiO2.
Table 3. Phases present in each cement paste, identified at every term using XRD.
PasteTimeYe’elimiteGypsumCalcium Sulfate (Anhydrite)EttringitePortlandite
P100/020 min____
1 h____
2 days___
7 days___
28 days___
60 days___
P93/720 min_
1 h_
2 days__
7 days___
28 days___
60 days___
P0/10020 min__
1 h__
2 days___
7 days___
28 days___
60 days___
Table 4. Weight loss percentage of each of the compositions of P100/0, P93/7, and P0/100 at 20 min, 1 h, 2, 7, 28, and 60 days.
CompositionWeight Loss Percentage (%)
20 min1 h
P100/0P93/7P0/100P100/0P93/7P0/100
AFt (40 °C–110 °C)0.8611.3560.9300.9771.9601.199
AFm (110 °C–250 °C)0.1100.1680.0150.1100.1270.049
CH (390 °C–500 °C)0.1370.2290.2220.1890.1920.240
AH3 (200 °C–350 °C) 0.149 0.213
2 days7 days
P100/0P93/7P0/100P100/0P93/7P0/100
AFt (40 °C–110 °C)4.7065.60712.5937.8219.17115.896
AFm (110 °C–250 °C)2.6892.0293.1422.8433.0382.484
CH (390 °C–500 °C)3.7393.3160.9394.5164.6360.911
AH3 (200 °C–350 °C) 5.069 5.005
28 days60 days
P100/0P93/7P0/100P100/0P93/7P0/100
AFt (40 °C–110 °C)7.3367.81515.2585.2805.2413.468
AFm (110 °C–250 °C)3.2873.5012.5524.5784.90613.386
CH (390 °C–500 °C)5.1834.5310.9455.5294.9840.920
AH3 (200 °C–350 °C) 5.079 6.086
Table 5. Athix and R2 evolution during the first 15 min.
Cement PasteAthix (Pa/s)R2
P0/1000.1280.8202
P90/101.1830.848
P93/71.3020.883
P95/50.4960.876
P98/20.3410.935
P100/00.1670.964
Disclaimer/Publisher’s Note: The statements, opinions and data contained in all publications are solely those of the individual author(s) and contributor(s) and not of MDPI and/or the editor(s). MDPI and/or the editor(s) disclaim responsibility for any injury to people or property resulting from any ideas, methods, instructions or products referred to in the content.