Article

Probabilistic Modeling for Cementitious Materials Based on Data of Nanoindentation

1
Sichuan Institute of Building Research, Chengdu 610081, China
2
School of Civil Engineering, Tongji University, Shanghai 200092, China
3
Sichuan Huashi Group Co., Ltd., Chengdu 610081, China
*
Author to whom correspondence should be addressed.
Buildings 2023, 13(2), 416; https://doi.org/10.3390/buildings13020416
Submission received: 15 August 2022 / Revised: 28 September 2022 / Accepted: 28 November 2022 / Published: 2 February 2023
(This article belongs to the Special Issue Uncertainty Propagation of Complex Engineering Structures/Systems)

Abstract

:
By introducing probabilistic modeling approaches, the interface transition zone (ITZ) and the bulk paste (BP) of concrete are investigated on the basis of the nanoindentation results, especially with respect to the relationship between the microstructure and mechanical properties of cementitious materials. The investigation of the probability density function (PDF) of the random field for nanoindentation properties revealed that the same properties of the ITZ and the BP usually yield the same PDF, which was elaborated from different points of view. Specifically, a log-normal distribution was best for nanoindentation hardness, whereas the Weibull distribution and gamma distribution were much more suitable for the nanoindentation modulus of both the ITZ and the BP. According to the comparative study of the correlation structure, both the ITZ and BP obeyed the exponential correlation structure associated with a first-order autoregressive process, and basically exhibited a similar scale of fluctuation. Furthermore, the scales of fluctuation were found to be directly related to the clinker size and the distance between clinkers. Our work provides a new approach to stochastically modeling cementitious materials, where the content of hydration products controls the mean values of nano-properties, the indentation property dominates the PDF, and the nano-topological structure governs the correlation structure.

1. Introduction

Concrete, a uniquely complex engineering material consisting of a mixture of cement, water, sand, and aggregate, has been used widely due to its economic feasibility and durability. After hydration, concrete becomes a cementitious material in which the hardened cement paste bonds the sand and the aggregate together. Between the inclusions and the cement paste, there is a particular zone named the ITZ, which influences the mechanical properties, as well as the failure of concrete [1,2,3]. Along with the usage history of concrete, the ITZ has consistently attracted the attention of engineers and researchers.
Considerable effort has been made to investigate the microstructure and mechanical properties as a function of the microhardness [4], microindentation [5], and nanoindentation [6,7], using image analyses including the X-ray technique [8,9], scanning electron microscopy (SEM) [7,8,9,10,11,12,13], backscattered electrons (BSEs) [10,11], and atomic force microscopy (AFM) [6,7]. Regarding the mechanical properties, four different microhardness profiles of the ITZ have been reported [4], whereby the microhardness of the ITZ is higher than, equal to, lower than, or much lower than that of the bulk paste due to perfect, mean, poor, or very poor bonding, respectively, between the ITZ and the inclusion. Thus, the ITZ is a highly heterogeneous zone affected by many factors, including the inclusion geochemistry [9], water–cement ratio [8,13], and physical properties of inclusion [14]. However, an increasing trend of properties was reported with increasing distance from the inclusions using nanoindentation [6]; nevertheless, this was not observed in other cases using microindentation [5]. In addition, with the variation of the aggregate type, the average modulus of the ITZ was observed to be 70–85% of that of the paste matrix [6,7]. Concerning the microstructure of the ITZ, previous research has shown that the morphology, chemical and mineral composition (i.e., the hydration products), and density (always characterized by voids, pores, or cracks), were significantly different from those of the bulk paste [7,8,9,10,11,12,13]. According to the literature, it can be confidently hypothesized that the ITZ, a peculiar contact zone, differs from the bulk paste. However, with the development of nanoindentation and recent research on random field modeling for concrete materials [15,16], we specifically address this research question.
In previous studies [15,16], systematic indentation tests were performed by the authors for each constituent of concrete at the nano- and microscales. The focus was on concrete reconstruction as the random medium [15,16,17], evaluating the relationship between both scales, although the scale of fluctuation and the PDF were briefly discussed. In the current study, the differences and similarities between the ITZ and the bulk paste are thoroughly investigated using probabilistic and statistical methods applied to the nanoindentation results, including the statistical characteristics, correlation function, and the accepted and rejected PDF. Furthermore, the link between the scale of fluctuation and the topological structure of cementitious materials is studied.

2. Materials and Methods

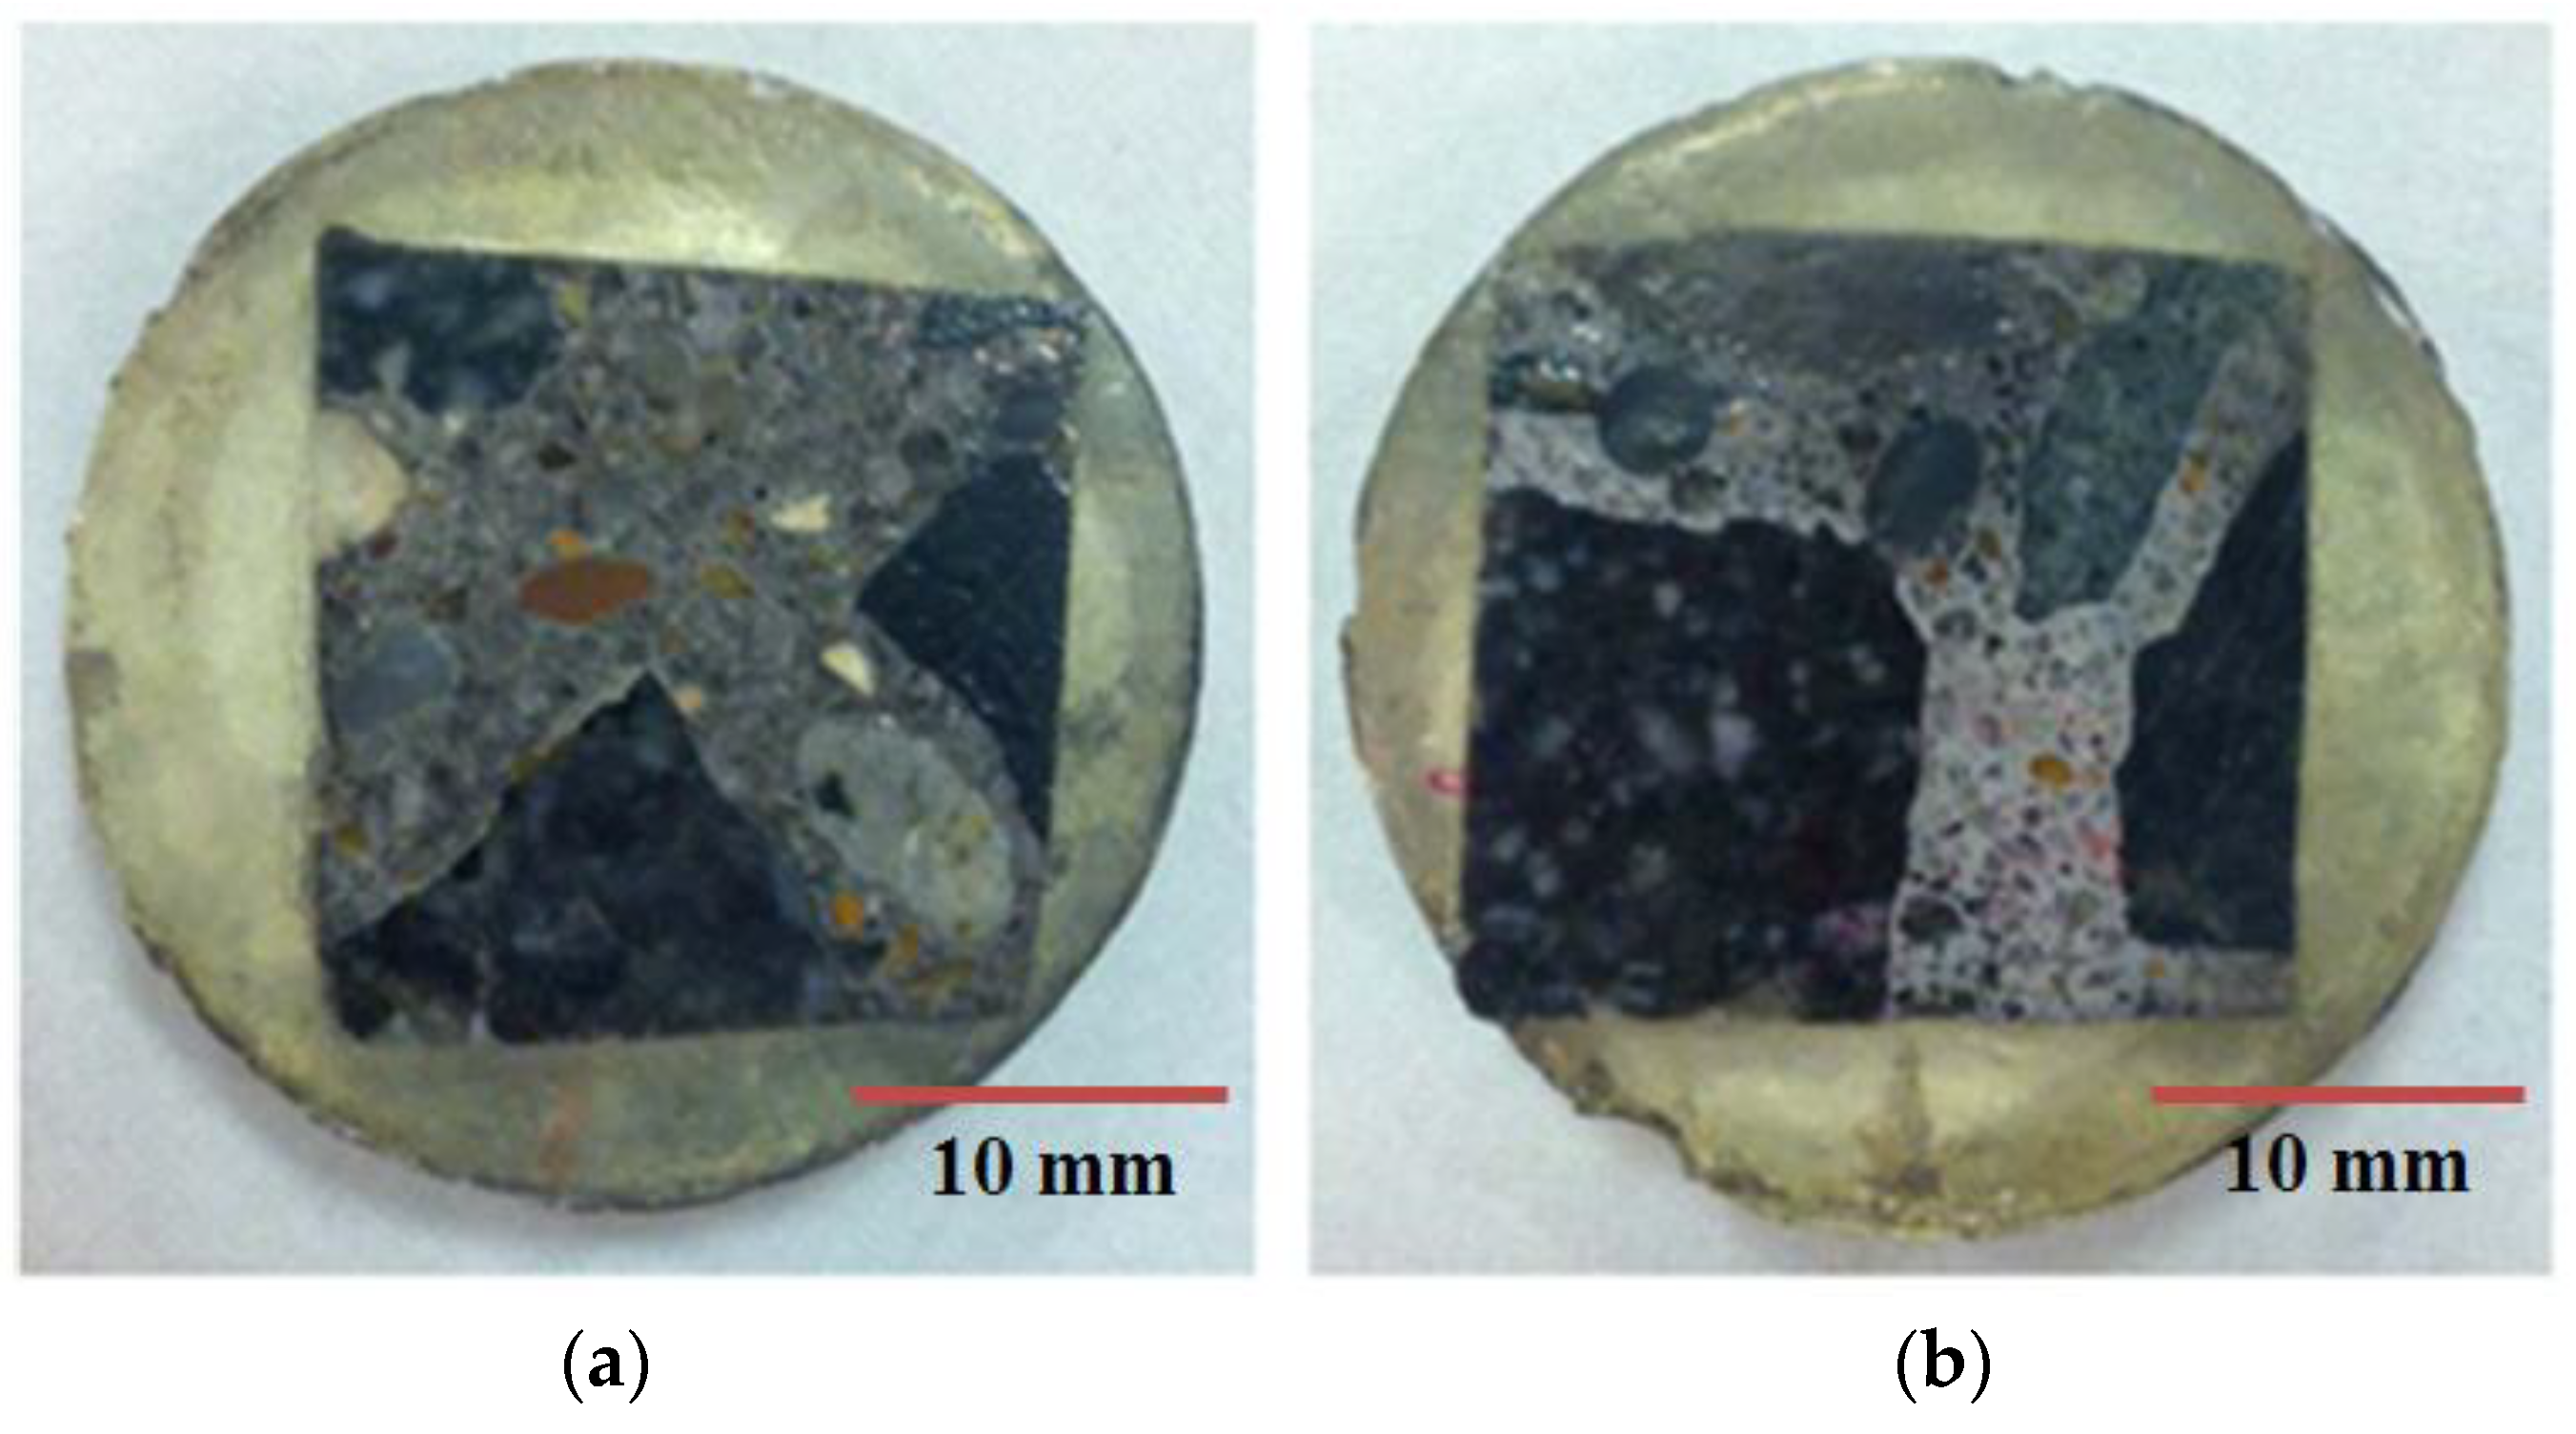
2.1. Concrete Mixes Used and Sample Preparation

The material investigated in the present study was regular concrete, with a water/cement/sand/aggregate ratio of 0.4:1:2:5. Prisms with dimensions of 0.1 m × 0.1 m × 0.3 m were cast into steel molds, which were de-molded after 24 h, cured at room temperature with a humidity of 95%, and kept under water for three months. After grinding, polishing, and cleaning, the samples were prepared for nanoindentation. The samples prepared for nanoindentation are illustrated in Figure 1, and more details of the sample preparation were reported in [15,16].

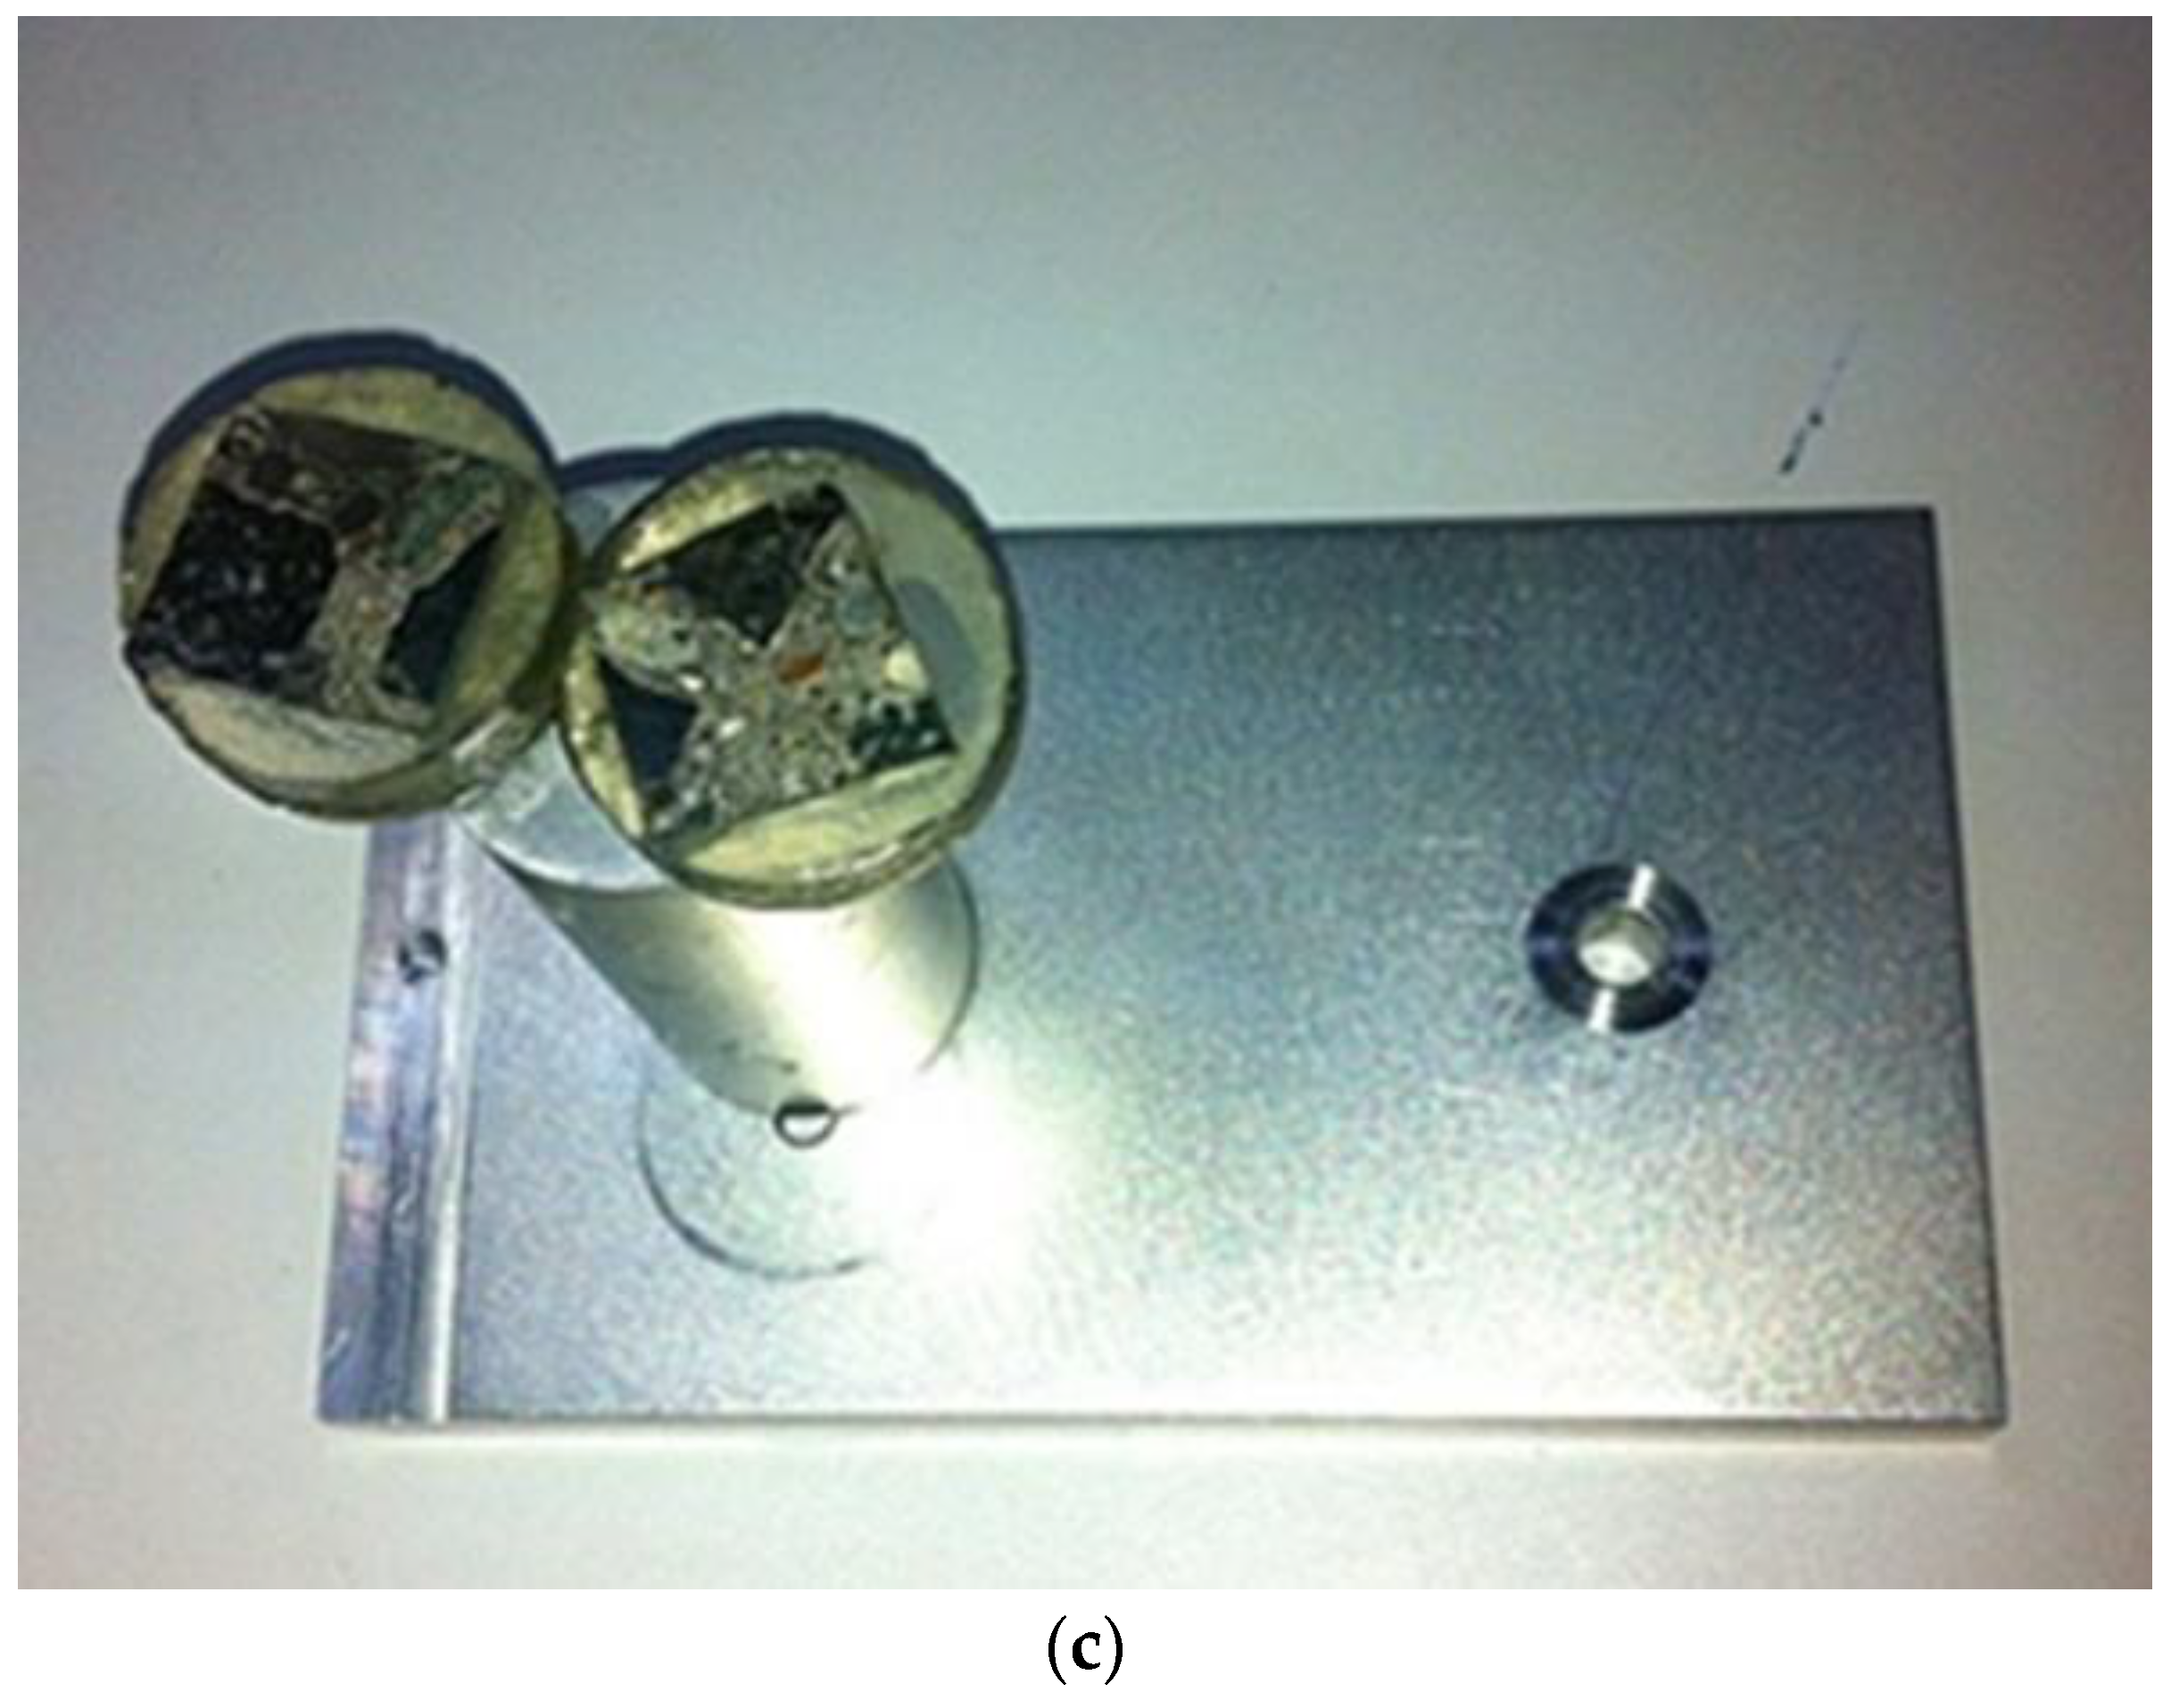
2.2. Nanoindentation

The experiments were performed based on the NanoTest Vantage system (see Figure 2), with Berkovich tip for indentation tests. According to Oliver and Pharr’s method, the indentation hardness and modulus could be calculated by using the following equations [18,19]:
H = P max / A c
M = π S / 2 A c
where P max is the maximum load; A c is the contact area; S = d P / d h h = h m a x is the initial slope of the unloading branch from P-h (load and depth) curve.
To perform the indentation test, we consider the indentation depth to be 300 nm, the unloading rate to be 0.2 mN/s, and the holding time to be 25 s. As shown in Figure 3, the indentation test is organized in patches. For each patch, the indent lattice of 25 × 20 is chosen for the bulk pasts as well as the ITZ.

2.3. Random Field Modeling

To model the results of the indentation test, the random field model is considered. In the present work, we define a 1-D homogeneous random field for which the mean value m X t j and the covariance R X t j ,   t j + τ keep constant, and can be expressed as follows:
m X t j = E X t j
R X t j ,   t j + τ = E X t j X t j + τ
where E X t j is the expectation operator, X t j is the observed sample series with respect to t j . Here, we consider three types of correlation functions commonly used in engineering materials to model the correlation structure of the bulk paste as well as the ITZ:
ρ τ = e τ / a
ρ τ = 1 + τ / b e τ / a
ρ τ = e τ / c 2
where Equation (5) is the exponential correlation function associated with a first-order autoregressive process (correlation function 1); Equation (6) is the correlation function associated with a second-order autoregressive process (correlation function 2); and Equation (7) is the Gaussian correlation function (correlation function 3); a, b and c are the parameters in the correlation function. Based on the derivations mentioned in Ref. [20], the scale of fluctuation θ can be expressed [20] as follows:
θ = 2 0 ρ τ d τ = 2 / a
Based on Equation (8), the scale of fluctuation relates directly to the so -called “correlation length”, which reflects the intrinsic characteristic of random materials.

2.4. Statistical Modeling

To investigate the statistical properties of the random field, Kolmogorov–Smirnov test (referred to as the K-S test) is adopted to acquire the PDF at each point of the obtained random series.
To execute the K-S test, the main procedure is outlined as follows:
(1) Choose a sample X i from the population X and rearrange sample values x i in increasing order of magnitude.
(2) Compute the observed cumulative distribution function (CDF) F n x i at each ordinal sample value.
(3) Estimate the parameters of the hypothesized distribution from the observed data, and determine the theoretical CDF F x i at the same sample value above using the hypothesized distribution.
(4) Form the differences F n x i F x i   , and calculate the statistics:
D = max 1     i     n F n x i F x i
(5) Select a value of α and determine the critical value D α .
(6) Accept or reject the testing hypothesis H by comparing D and D α .
In this study, the hypothesized PDFs are considered to be normal distribution, log-normal distribution, Weibull distributionand gamma distribution, which are commonly used in engineering. Then, the estimated PDF could be acquired by executing the K-S testing. According to Refs. [15,16], the PDF with the mean estimated parameters of 6 points is used and also referred as the best estimate.

3. Results and Discussion
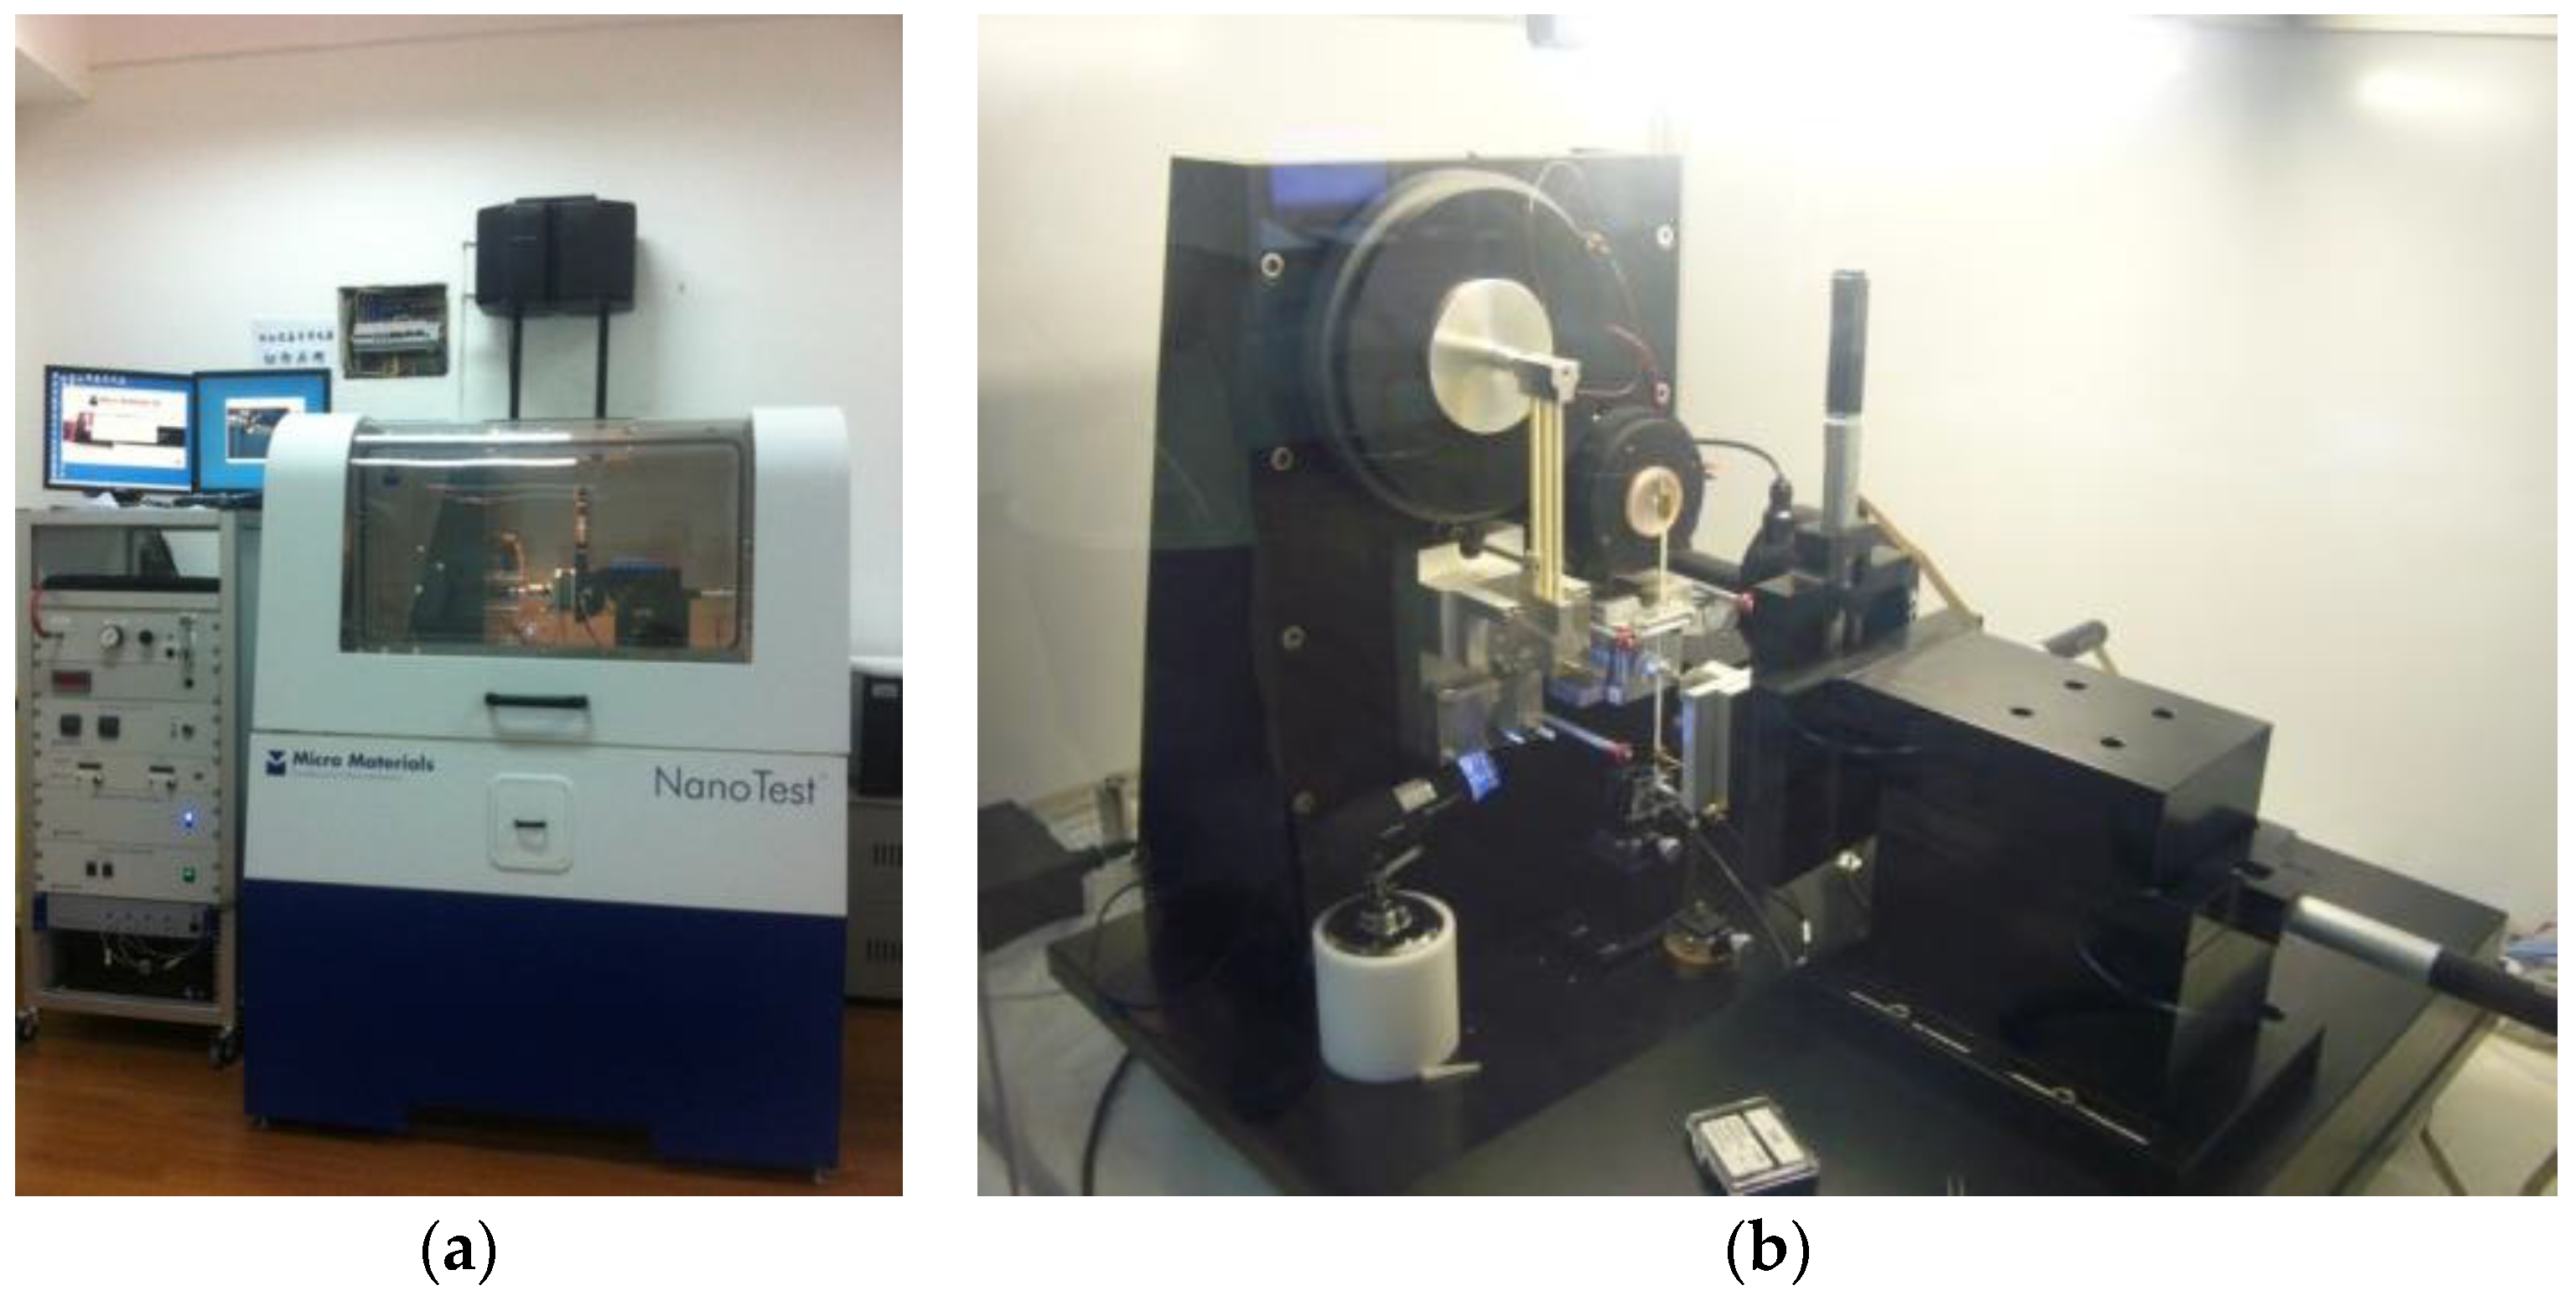
For the purpose of stochastic and statistical modeling, one sample series with 20 observations was divided into four small random series with six observations (see Figure 3). Thus, 25 sample series in a patch could be divided into 100 small random series.
The probabilistic analysis is applied to the small random series obtained above. The sample results, the mean value, and the standard deviation (SD) of nanoindentation properties for concrete components have been shown in the previous research [15]. The samples of the nanoindentation properties exhibit randomness; however, the mean and the SD remarkably keep constant with respect to the location. In the meanwhile, the auto-correlation functions almost remain constant. That is to say, the correlation results only depend on the relative distance instead of the absolute distance. The aforementioned characteristics indicate that the random field of indentation properties could be identified to be homogeneous.

3.1. Mean and SD

The calculated mean value, standard variation, and correlation function are displayed together in Figure 4 for ITZ and the bulk paste, respectively. It is evident that the mean value for indentation properties of the ITZ is 60-70% of that for the bulk paste, while the relative SD for the bulk paste and the ITZ appear almost the same. From the findings of Jennings [21], the C-S-H is made up of two components, i.e., the low-density (LD) C-S-H and the high-density (HD) C-S-H. The LD C-S-H contains imperfect, closely packed, with a porosity of 28%, and the HD C-S-H is squashed together and closely packed with a porosity of 13. The LD C–S–H controls the hardened cement paste of high w/c mass ratios; and the HD C–S–H and UHD C–S–H dominate the micro-structure of low w/c ratio materials [22]. Therefore, more LD C-S-H should be formed in the ITZ due to a higher w/c ratio [1,23,24], compared with the bulk paste. That is why the properties of the ITZ are lower than the bulk paste in most cases [4,5,6,7]. Obviously, the results of this study show the same trend.

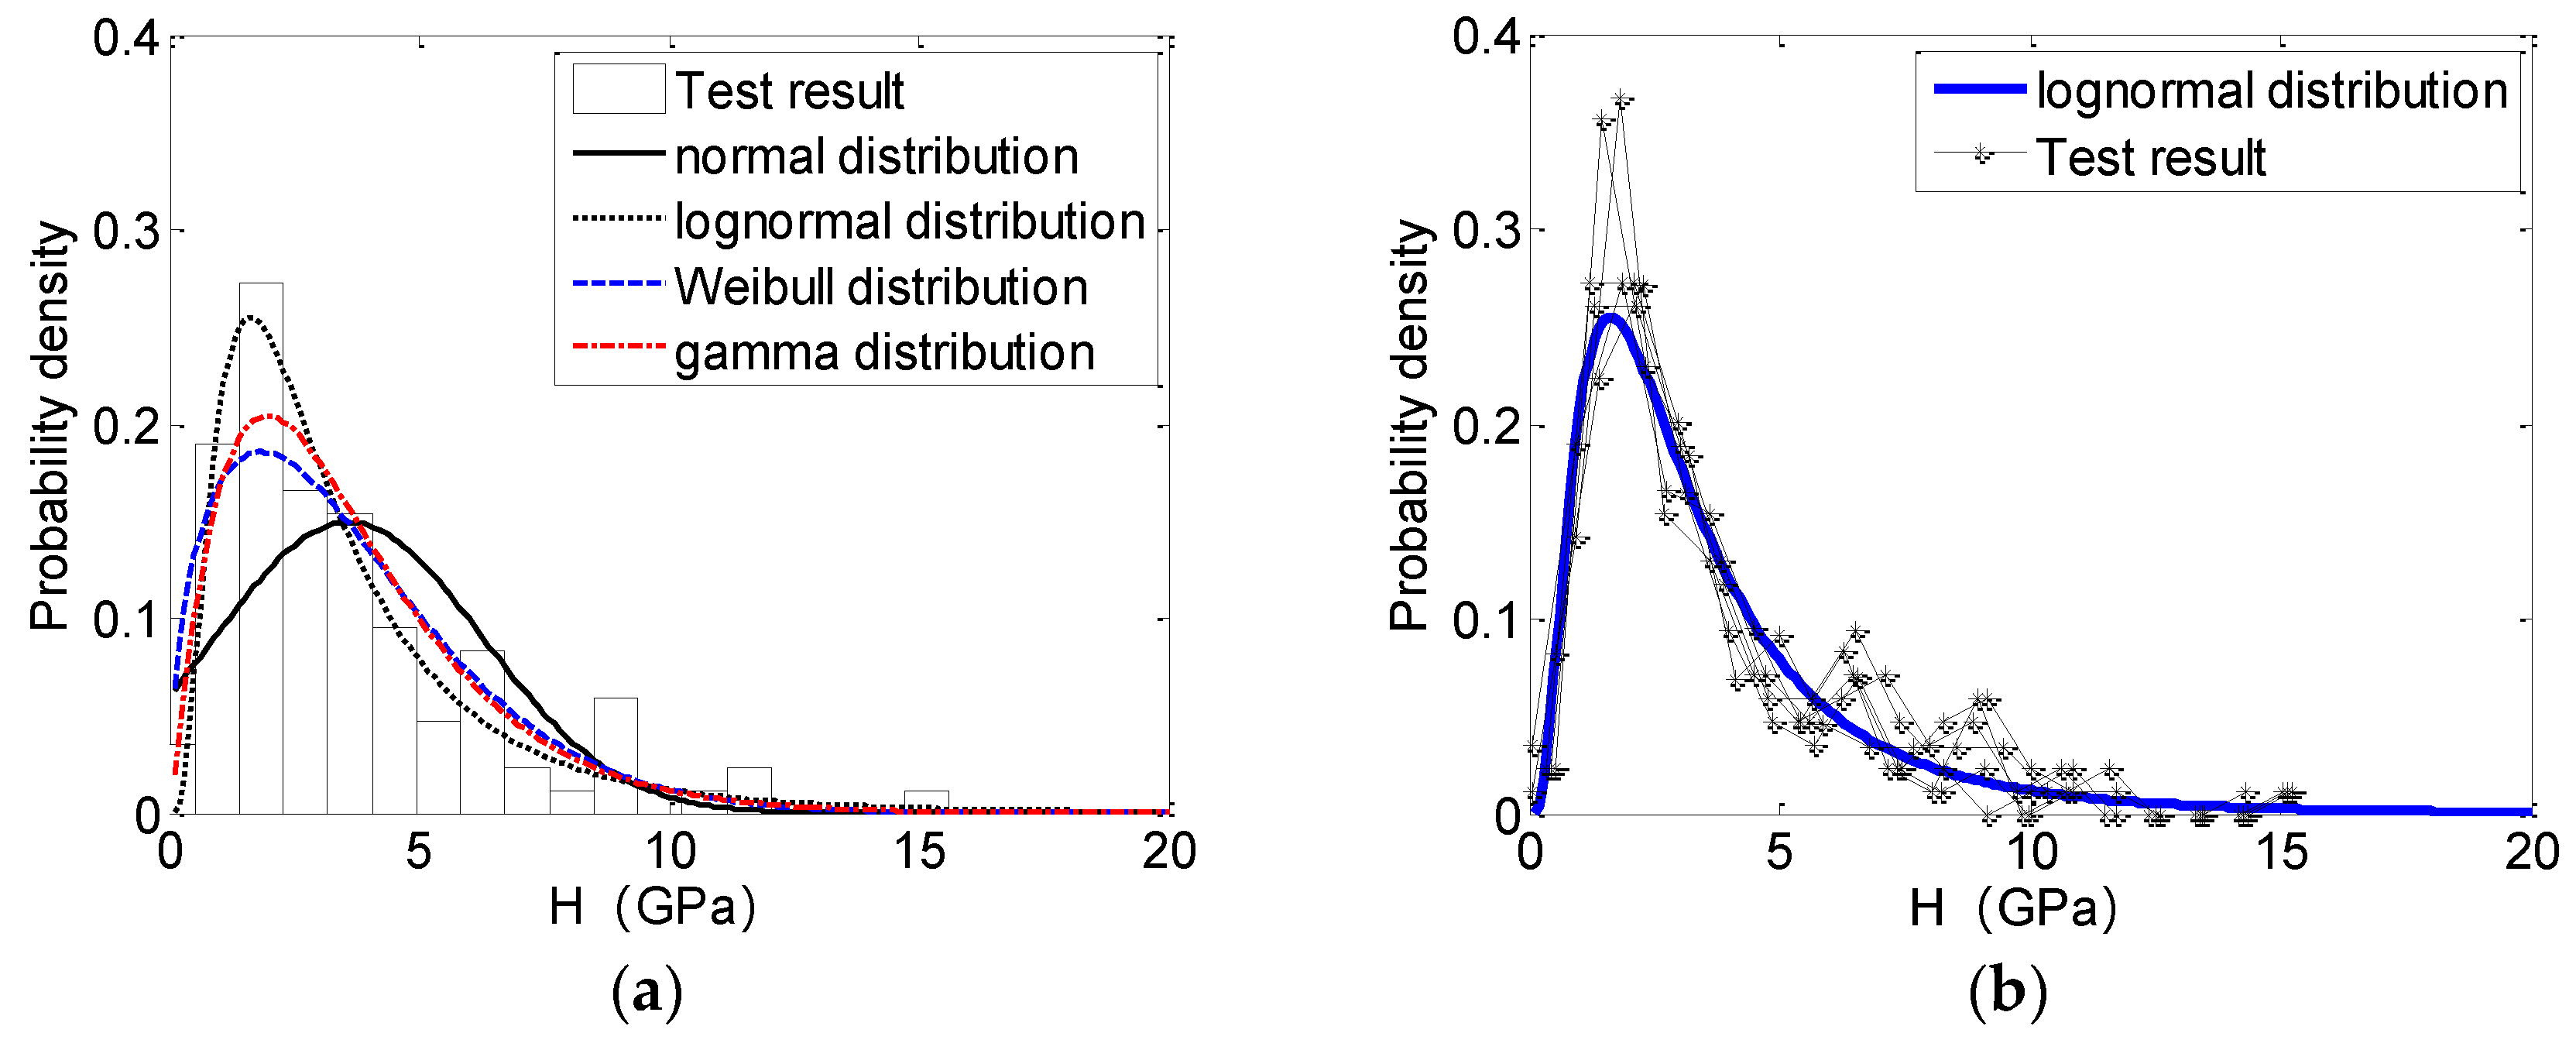
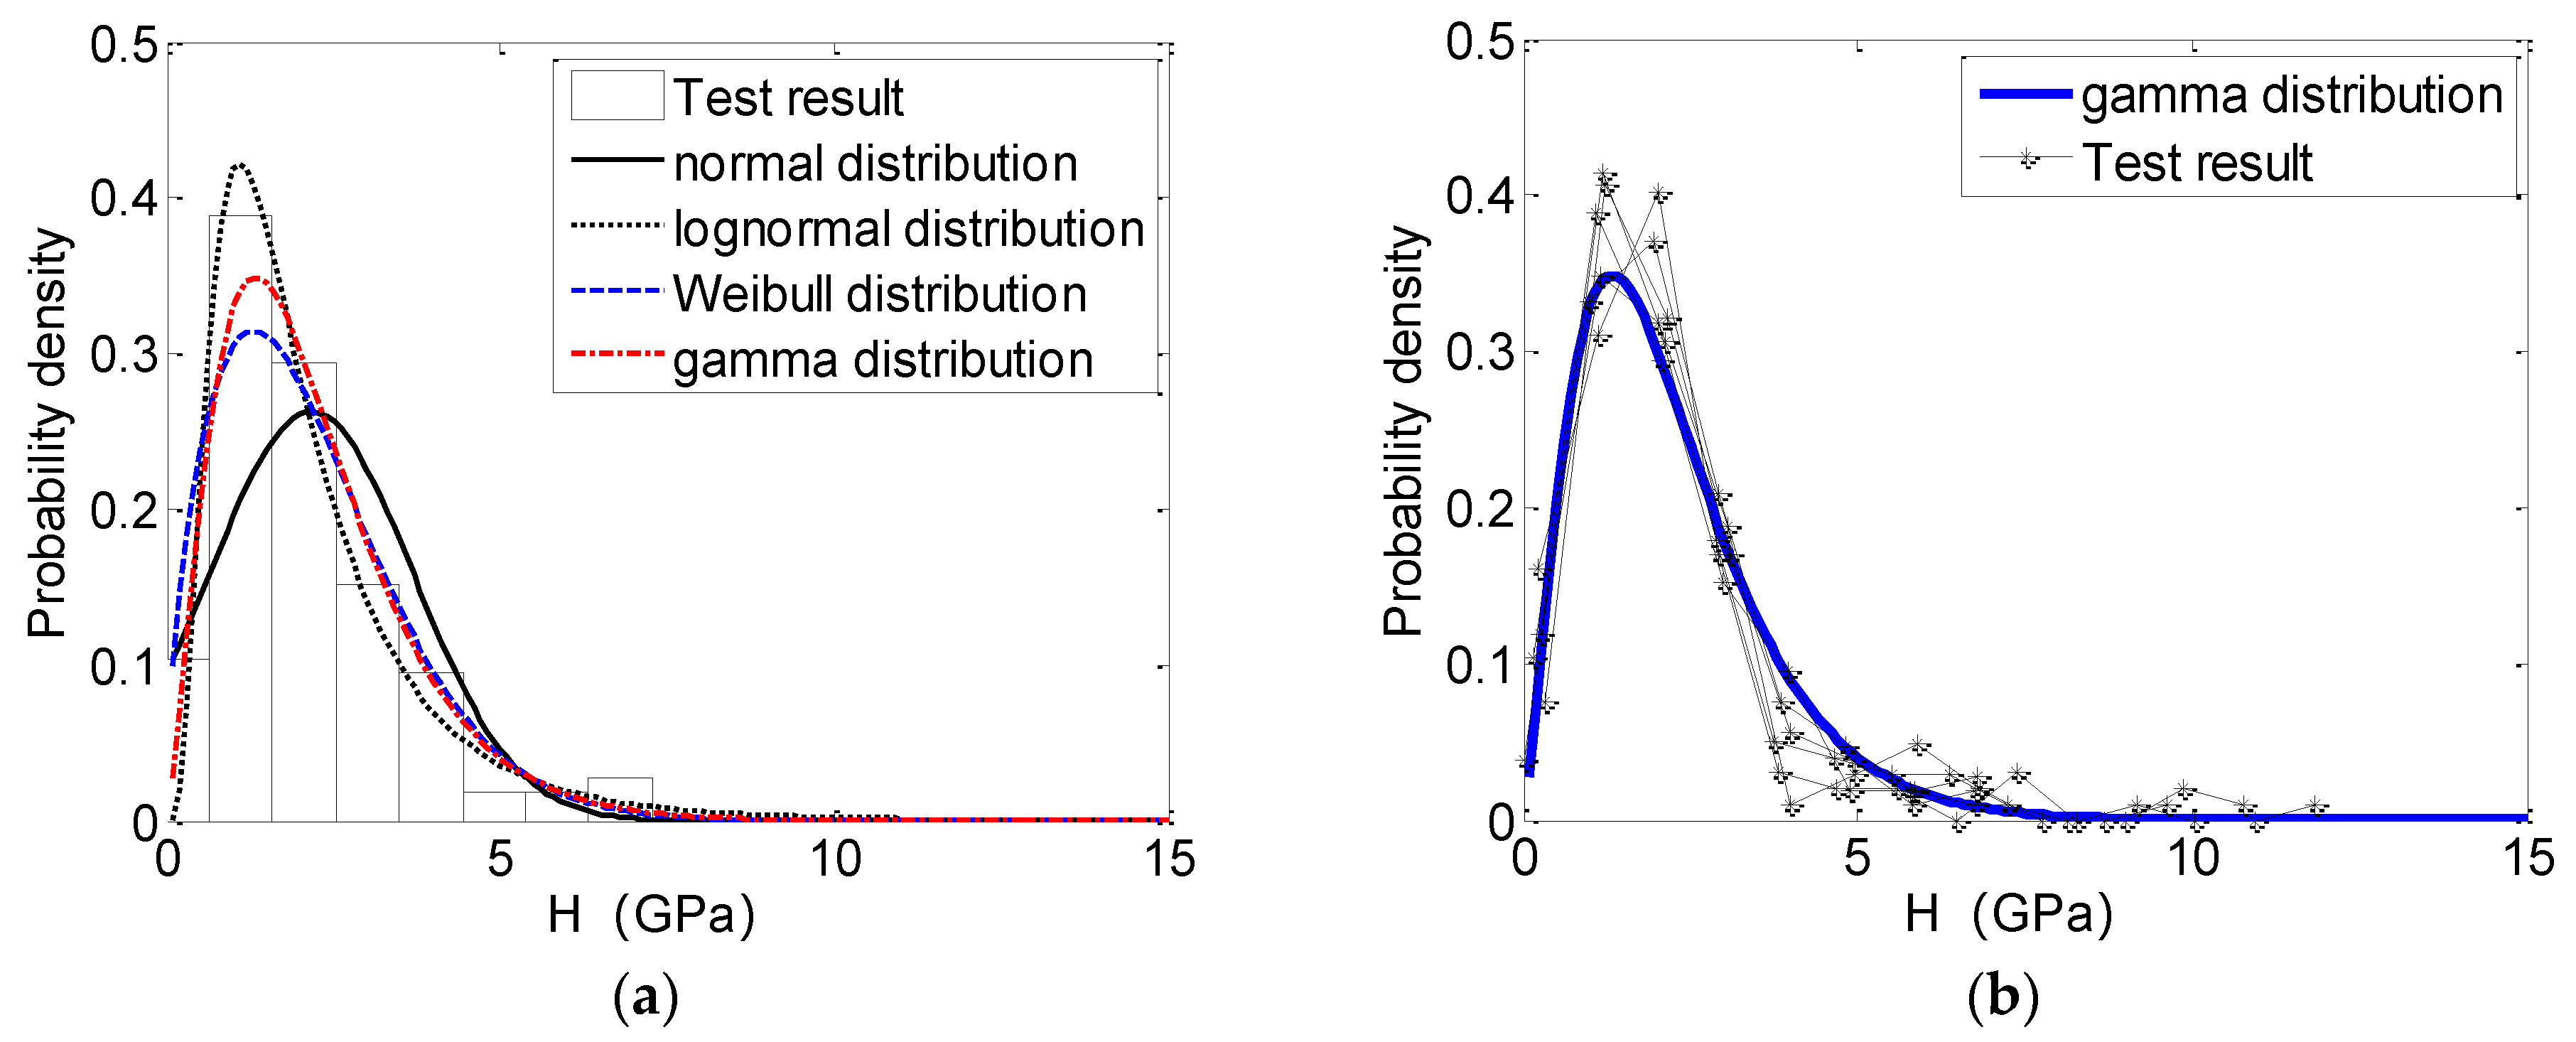
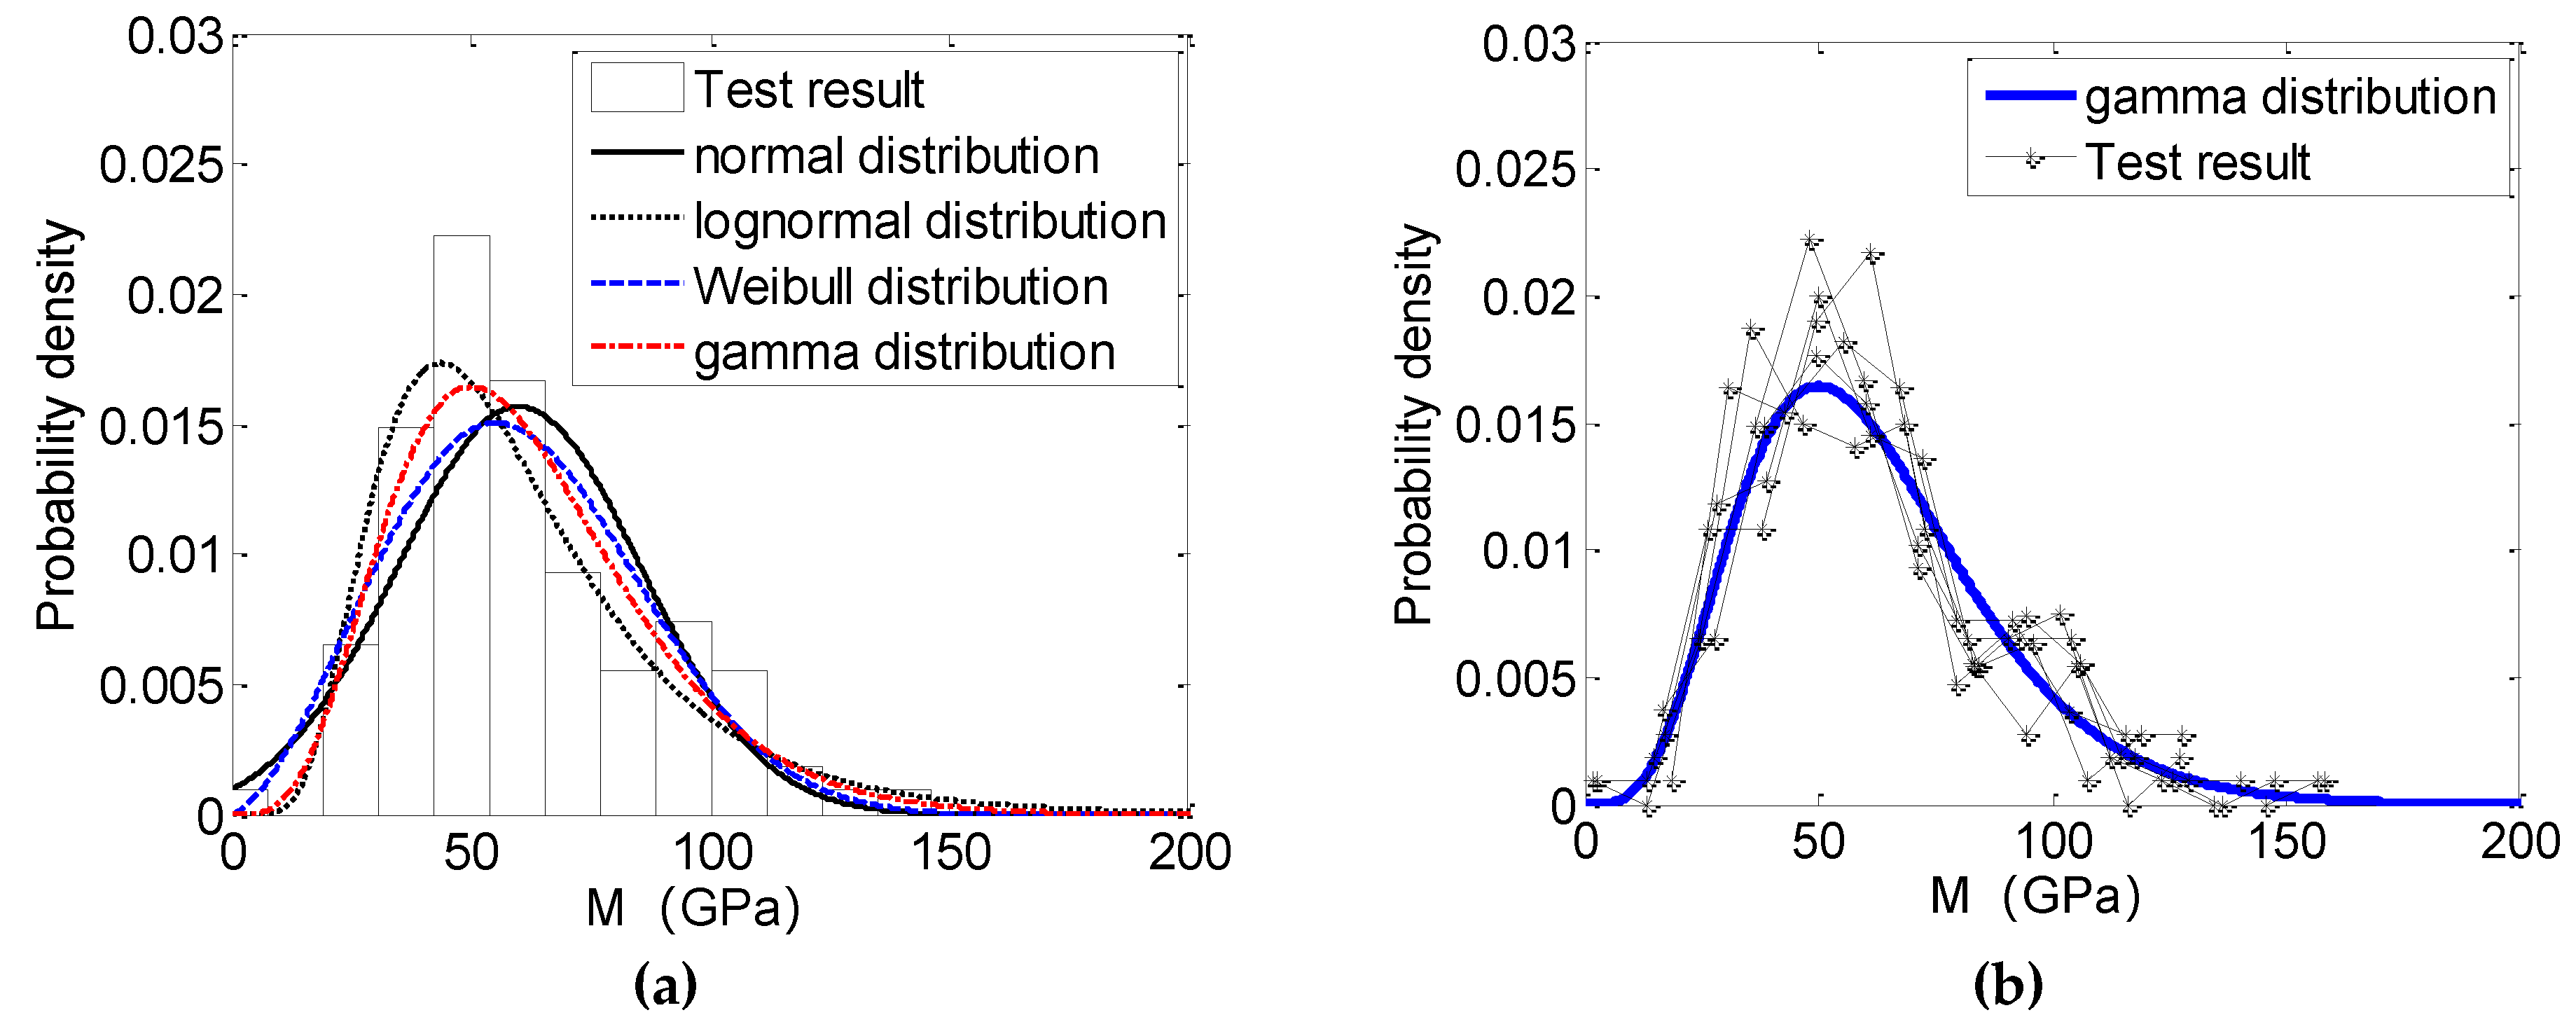
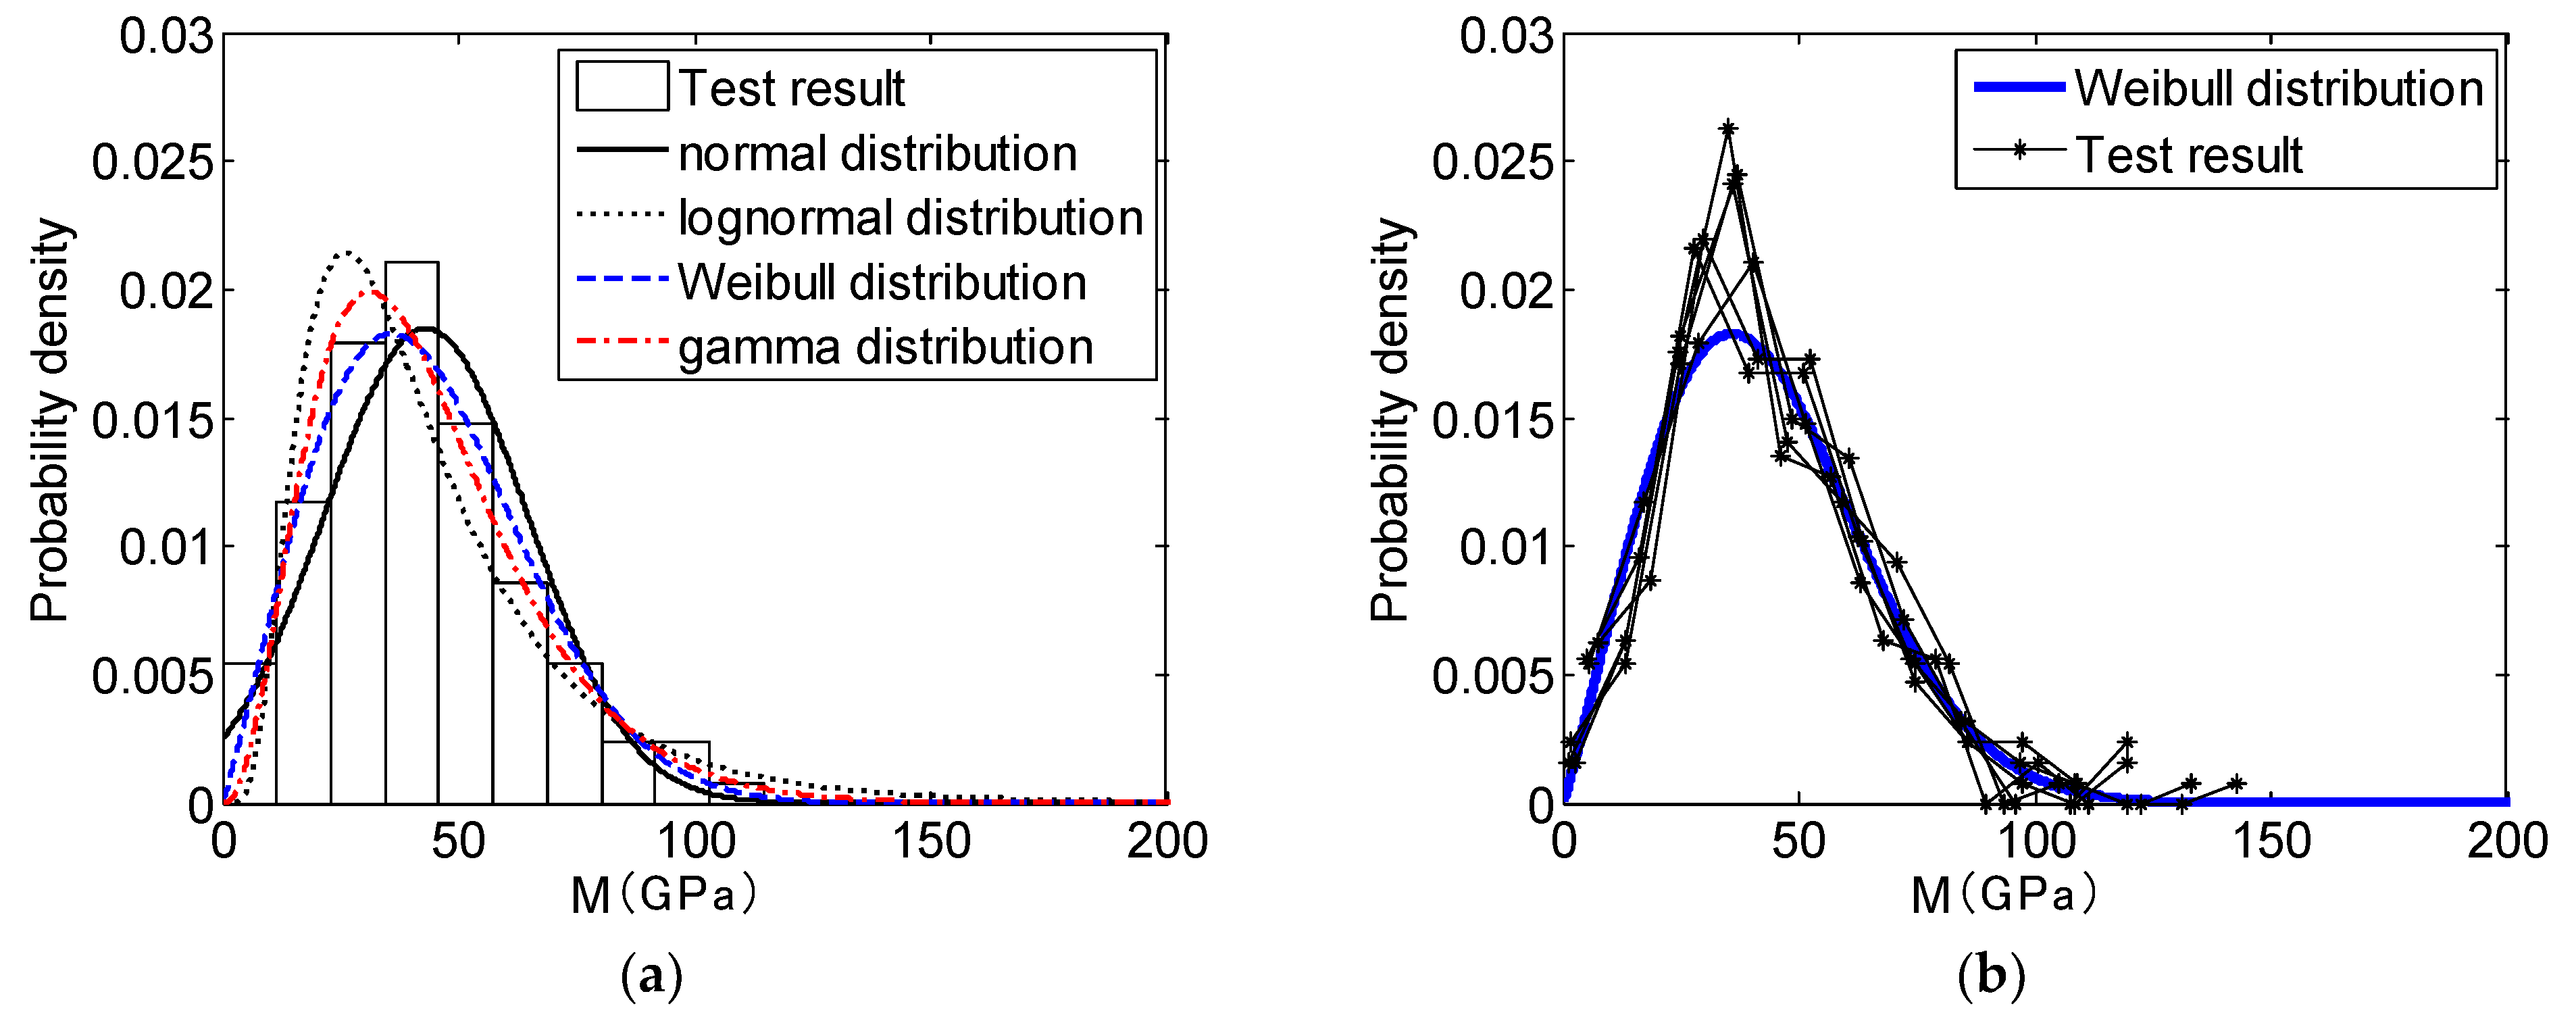
3.2. Probabilistic Distribution

With regard to the PDF and the relevant parameters (i.e., location, shape, and scale parameters) of nanoindentation properties for the ITZ and the bulk paste, estimates are obtained by the K-S test and shown in Table 1, Table 2, Table 3 and Table 4. Usually, the greater p-value indicates a better estimate of PDF. The histogram and the estimated PDF are displayed in Figure 5, Figure 6, Figure 7 and Figure 8.
About the parametric and non-parametric estimations for the nanoindentation hardness shown in Table 1 and Table 2, it is observed that normal distribution is rejected for both the ITZ and the bulk paste; meanwhile, log-normal distribution could be regarded as the best estimate for both the ITZ and the bulk paste. However, Weibull distribution and gamma distribution could also be acceptable for cementitious materials-. Accordingly, the frequency plots for nanoindentation hardness related to Table 1 and Table 2 have been shown in Figure 5 and Figure 6, including the histogram of one point out of six in the 1-D random field compared with four theoretical PDFs, as well as the six frequency plots compared with the theoretical PDF with the best estimates.
Regarding the estimation for nanoindentation modulus presented in Table 3 and Table 4, Weibull distribution and gamma distribution are much better than normal distribution and log-normal distribution for the ITZ and the bulk paste. These four distributions are all acceptable for the nanoindentation modulus of cementitious materials from the perspective of the p-value. However, normal distribution and log-normal distribution seem substantially worse for the ITZ. Figure 5 and Figure 6 illustrate the histogram (one out of six points) and four theoretical PDFs, as well as the six frequency plots and the theoretical PDF with the best estimates.
Notably, the ITZ and bulk paste usually follow the same probability distribution for the same properties. It is also interesting to see that the different properties of the same material usually yield different probability distributions. As for the bulk paste, log-normal distribution and gamma distribution are the best estimates for nano-hardness and nano-modulus, respectively. While for the ITZ, gamma distribution and Weibull distribution are easily found to be the best ones for hardness and modulus, respectively. Additionally, log-normal distribution and gamma distribution are generally more acceptable for the ITZ and the bulk paste with regard to both nanoindentation hardness and modulus. Moreover, the comparison between the histogram and the frequency diagram could also be displayed clearly in Figure 5, Figure 6, Figure 7 and Figure 8. It is revealed that the best-estimated PDF is consistent with the relevant observed histogram; nevertheless, the worst -estimated one disagrees with the histogram.
It is worth pointing out that the estimated PDF for cementitious materials may be varied with different w/c ratio; however, it at least reveals something new in the view of probability. In addition, to solve the problems in engineering applications, the 1-D PDF of the random field is commonly needed. The modeling of the 1-D PDF for the random field is also an important task for the probabilistic analysis. It is worth mentioning that in this study, we focus on the probability characteristics of the global feature for the cementitious materials instead of the local feature, although they are calculated based on the local properties, i.e., nanoindentation hardness and modulus. Moreover, the current study does not in any way contradict the previous research results, which reported that there are various proportions of HD C-S-H, LD C-S-H, and CH in the ITZ and the bulk paste [25]. Precisely, the present work provides probabilistic knowledge from a comparatively macroscopic view, while the previous research paid more attention to the detailed constituents of cementitious materials from a comparatively microscopic perspective.

3.3. Correlation Function

The correlation structure could be modelled for the homogeneous random field. Figure 9a shows that three correlation functions are fitted via the test results with regard to the nanoindentation modulus of the ITZ. Accordingly, the values of the squared 2-norm of the residual for each indentation property of the ITZ and the bulk paste are indicated in Table 5. Remarkably, correlation function 1 is the best form for all the properties of cementitious materials. On the other side, correlation function 3 is in poor agreement with the test results. For correlation function 2, it seems to be acceptable for the nanoindentation properties of the bulk paste, especially for nanoindentation hardness. It is worth mentioning that the nanoindentation properties yield an exponential correlation function associated with a first-order autoregressive process for cementitious materials at the nanoscale. With the perfectly fitted correlation function 1, the scales of fluctuation of the ITZ and the bulk paste could be calculated following Equation (8), with the results in Table 5.
As shown in Figure 9b, the best-fitted model are plotted against the test results for nanoindentation properties of the ITZ and the bulk paste. It could be observed that the best-fitted correlation functions seem to be very similar to each other for the ITZ and the bulk paste. In other words, the aforementioned scales of fluctuation exhibit no obvious difference, although the average values and the SD between the ITZ and the bulk paste differ from each other. In this sense, the cementitious materials, including the ITZ and the bulk paste, possess the same correlative structure at the nanoscale.

3.4. Scale of Fluctuation and Topology Nanostructure

From a statistical point of view, the scale of fluctuation could be regarded as a length within which the properties of materials are of close correlation. As shown from the random series in Figure 10a, the fluctuation could be simply observed, which is attributed to the clinker domain (the light zone in Figure 10b) and the C-S-H domain (the dark zone in Figure 10b). When a series of nanoindentation are conducted on the materials, the clinker exhibits larger values than the C-S-H in terms of mean valuesshown in Figure 10c. Hence, a reasonable assumption could be made that the scale of fluctuation may be related to the nanostructure, including the clinker and the relative distribution, which could be expressed as a function of the particle (i.e., the clinker) size and the net distance between the particles as follows:
θ = λ m + n i   =   1 m a i + i   =   1 n b i  
where a i denotes the size of the clinker, b i denotes the net distance between the particles or the C-S-H size on the random series as shown in Figure 10c, and λ denotes the ratio of the scale of fluctuation θ to the mean value of the clinker size and C-S-H size i   =   1 m a i + i   =   1 n b i / m + n . The values for θ , λ , i   =   1 m a i + i   =   1 n b i / m + n , a i , b i in Equation (10) are displayed in Table 6.
As shown in Table 6, the scale of fluctuation of the ITZ and the bulk paste could be calculated with the value around 20 μm, which matches well with the mean size of the clinker size and the C-S-H size. Then, from the image of the testing zones (see Figure 10b), the clinker size and C-S-H size (the distance between the clinkers) are within the range of 10–35 μm. Additionally, the scale of fluctuation and the mean size of clinker and C-S-H size both fall in the range of 10–35 μm. Accordingly, the scale of fluctuation to the mean size ratio almost keep constant (around 1.000), as indicated in Table 6. It is noteworthy that the scale of fluctuation could be directly related to the nanoscale structure, including the particle size and C-S-H size. In other words, the topological structure, to some extent, controls the correlation structures of the cementitious materials. To further figure out this relation, the scales of fluctuation for the ITZ and bulk paste are investigated with the results of 15 and 10 μm, respectively, when the pure C-S-H is concerned. It is likely attributed to the characterized size of LD C-S-H and HD C-S-H in cementitious materials, which merits to be explored.

4. Conclusions

Probabilistic and statistical analyses on cementitious materials have been comprehensively studied based on random field modeling as well as parametric and nonparametric estimation and verification. In this paper, a comparative study has been conducted between the ITZ and the bulk paste using the samples of a single mix design. The following conclusions could be drawn from the results and discussions introduced above.
(1) For the specific mix in this paper, the mean nanoindentation properties of the ITZ are around 80% of that of the bulk paste due to higher w/cratio in the ITZ, while the SD of the ITZ is 70–80% of that of the bulk paste probably.
(2) For the nanoindentation hardness, the normal distribution is rejected for both the bulk paste and ITZ; meanwhile, the log-normal distribution could be regarded as the best estimate for both the bulk paste and ITZ. For the nanoindentation modulus, Weibull distribution and gamma distribution are much more suitable for both the bulk paste and ITZ. Notably, the same properties of the bulk paste and ITZ usually yield the same probability distribution; however, the different properties of the same material may fail to obey the identical distributions.
(3) The ITZ and bulk paste both obey the exponential correlation structure associated with a first-order autoregressive process, other than the correlation function with a second-order autoregressive process and the Gaussian correlation function. Meanwhile, the scales of fluctuation for both the ITZ and bulk paste are around 20 μm, which coincides with the mean size of the clinker size and C-S-H size and falls within the range of the clinker size and C-S-H size for the cementitious materials.
(4) It is interesting to note that the content of hydration products (e.g., LD C-S-H, HD C–S–H, UHD C–S–H and CH) governs the mean values of nanoindentation properties, the indentation property (i.e., indentation hardness or indentation modulus) dominates the PDF type, while the nanoscale topological structure governs the correlation structure of cementitious materials.
Some interesting results have been displayed from probabilistic and statistical standpoints.. The work in the present paper could be applied in stochastically modeling for cementitious materials; in addition, it lays the basis of stochastic analysis and reliability analysis in the field of structural engineering.

Author Contributions

Conceptualization, H.L. (Hankun Liu), X.R. and J.L.; methodology, H.L. (Hankun Liu), X.R., J.L. and L.L.; software, H.L. (Hankun Liu) and X.R.; validation, H.L. (Hankun Liu); formal analysis, H.L. (Hankun Liu), X.R. and H.L. (Hongbing Li); investigation, H.L. (Hankun Liu) and H.L. (Hongbing Li); resources, H.L. (Hankun Liu) and X.R.; data curation, H.L. (Hankun Liu); writing—original draft preparation, H.L. (Hankun Liu); writing—review and editing, X.R. and H.L. (Hankun Liu); visualization, H.L. (Hankun Liu); supervision, X.R. and L.L.; project administration, H.L. (Hankun Liu) and X.R.; funding acquisition, H.L. (Hankun Liu) and H.L. (Hongbing Li). All authors have read and agreed to the published version of the manuscript.

Funding

This research was funded by China Postdoctoral Science Foundation funded Project (2021M693873), Sichuan Huashi Group funded Technology Project (HXKX2019/002) and Sichuan Huashi Group funded Technology Project (HXKX2019/013).

Data Availability Statement

Not applicable.

Conflicts of Interest

The authors declare no conflict of interest.

References

  1. Scrivener, K.L.; Crumbie, A.K.; Laugesen, P. The interfacial transition zone (ITZ) between cement paste and aggregate in concrete. Interface. Sci. 2004, 12, 411–421. [Google Scholar] [CrossRef]
  2. Ramesh, G.; Sotelino, E.D.; Chen, W.F. Effect of transition zone on elastic moduli of concrete materials. Cem. Concr. Res. 1996, 26, 611–622. [Google Scholar] [CrossRef]
  3. Perry, C.; Gillott, J.E. The influence of mortar-aggregate bond strength on the behaviour of concrete in uniaxial compression. Cem. Concr. Res. 1977, 7, 553–564. [Google Scholar] [CrossRef]
  4. Igarashi, S.; Bentur, A.; Mindess, S. Microhardness testing of cementitious materials. Adv. Cem. Based. Mater. 1996, 4, 48–57. [Google Scholar] [CrossRef]
  5. Zhu, W.; Sonebi, M.; Bartos, P.J.M. Bond and interfacial properties of reinforcement in self-compacting concrete. Mater. Struct. 2004, 37, 442–448. [Google Scholar] [CrossRef]
  6. Mondal, P.; Shah, S.P.; Marks, L.D. Nanoscale characterization of cementitious materials. ACI Mater. J. 2008, 105, 174–179. [Google Scholar]
  7. Mondal, P.; Shah, S.P.; Marks, L.D. Nanomechanical Properties of Interfacial Transition Zone in Concrete. In Nanotechnology in Construction 3; Springer: Berlin/Heidelberg, Germany, 2009; pp. 315–320. [Google Scholar]
  8. Zimbelmann, R. A contribution to the problem of cement-aggregate bond. Cem. Concr. Res. 1985, 15, 801–808. [Google Scholar] [CrossRef]
  9. Tasong, W.A.; Lynsdale, C.J.; Cripps, J.C. Aggregate-cement paste interface: Part I. Influence of aggregate geochemistry. Cem. Concr. Res. 1999, 29, 1019–1025. [Google Scholar] [CrossRef]
  10. Diamond, S. Considerations in image analysis as applied to investigations of the ITZ in concrete. Cem. Concr. Comp. 2001, 23, 171–178. [Google Scholar] [CrossRef]
  11. Scrivener, K.L.; Nemati, K.M. The percolation of pore space in the cement paste/aggregate interfacial zone of concrete. Cem. Concr. Res. 1996, 26, 35–40. [Google Scholar] [CrossRef]
  12. Liao, K.Y.; Chang, P.K.; Peng, Y.N.; Yang, C.C. A study on characteristics of interfacial transition zone in concrete. Cem. Concr. Res. 2004, 34, 977–989. [Google Scholar] [CrossRef]
  13. Akçaoğlu, T.; Tokyay, M.; Çelik, T. Assessing the ITZ microcracking via scanning electron microscope and its effect on the failure behavior of concrete. Cem. Concr. Res. 2005, 35, 358–363. [Google Scholar] [CrossRef]
  14. Tasong, W.A.; Lynsdale, C.J.; Cripps, J.C. Aggregate-cement paste interface: Part II. influence of aggregate physical properties. Cem. Concr. Res. 1998, 28, 1453–1465. [Google Scholar] [CrossRef]
  15. Liu, H.K.; Ren, X.D.; Li, J. Indentation tests based multi-scale random media modeling of concrete. Constr. Build. Mater. 2018, 168, 209–220. [Google Scholar] [CrossRef]
  16. Liu, H.K.; Ren, X.D.; Liang, S.X.; Li, J. Physical Mechanism of Concrete Damage under Compression. Materials 2019, 12, 3295. [Google Scholar] [CrossRef]
  17. Liu, H.K.; Qi, N.P. Discussions on Physical Mechanism of “Inspecting of Concrete Compressive Strength by Rebound Method”. Sichuan Build. Sci. 2017, 43, 117–119. (In Chinese) [Google Scholar]
  18. Oliver, W.C.; Pharr, G.M. An improved technique for determining hardness and elastic modulus using load and displacement sensing indentation experiments. J. Mater. Res. 1992, 7, 1564–1583. [Google Scholar] [CrossRef]
  19. Pharr, G.M.; Oliver, W.C.; Brotzen, F.R. On the generality of the relationship between contact stiffness, contact area, and elastic modulus during indentation. J. Mater. Res. 1992, 7, 613–617. [Google Scholar] [CrossRef]
  20. Vanmarcke, E. Random Fields: Analysis and Synthesis; The MIT Press: Cambridge, MA, USA; London, England, 2010. [Google Scholar]
  21. Jennings, H.M. A model for the microstructure of calcium silicate hydrate in cement paste. Cem. Concr. Res. 2000, 30, 101–116. [Google Scholar] [CrossRef]
  22. Vandamme, M.; Ulm, F.J.; Bazant, Z.P. Nanogranular Origin of Concrete Creep. Proc. Natl. Acad. Sci. USA 2009, 106, 10552–10557. [Google Scholar] [CrossRef]
  23. Barnes, B.D.; Diamond, S.; Dolch, W.L. The contact zone between Portland cement paste and glass “aggregate” surfaces. Cem. Concr. Res. 1978, 8, 233–243. [Google Scholar] [CrossRef]
  24. Neville, A.M. Properties of Concrete; Longman Group Limited: Essex, England, 1995. [Google Scholar]
  25. Mondal, P. Nanomechanical Properties of Cementitious Materials. Ph.D. Thesis, Northwestern University, Evanston, IL, USA, 2008. [Google Scholar]
Figure 1. Samples for testing in nanoindenter [15,16]: (a) specimen 1; (b) specimen 2; and (c) specimens installed.
Buildings 13 00416 g001aBuildings 13 00416 g001b
Figure 2. NanoTest Vantage testing system [16]: (a) appearance; and (b) internal details.
Buildings 13 00416 g002
Figure 3. The schematic diagram for nanoindentation testing and the segmentation for the random series.
Buildings 13 00416 g003
Figure 4. Statistics characteristics of the bulk paste and the ITZ: mean and SD for (a) indentation modulus and (b) indentation hardness; relative SD for (c) indentation modulus and (d) indentation hardness.
Buildings 13 00416 g004
Figure 5. Frequency plots for indentation hardness of the bulk paste: (a) histogram of one point out of six and 4 theoretical PDF curves; (b) frequency plots of 6 points and the theoretical PDF curve with best estimates.
Buildings 13 00416 g005
Figure 6. Frequency plots for indentation hardness of the ITZ: (a) histogram of one point out of six and 4 theoretical PDF curves; (b) frequency plots of 6 points and the theoretical PDF curve with best estimates.
Buildings 13 00416 g006
Figure 7. Frequency plots for indentation modulus of the bulk paste: (a) histogram of one point out of six and 4 theoretical PDF curves; (b) frequency plots of 6 points and the theoretical PDF curve with best estimates.
Buildings 13 00416 g007
Figure 8. Frequency plots for indentation modulus of the ITZ: (a) histogram of one point out of six and 4 theoretical PDF curves; (b) frequency plots of 6 points and the theoretical PDF curve with best estimates.
Buildings 13 00416 g008
Figure 9. Model results and test results of correlation structure: (a) for nanoindentation modulus of ITZ; (b) for nanoindentation properties of the ITZ and the bulk paste.
Buildings 13 00416 g009
Figure 10. The scale of fluctuation and the nanostructure of cementitious materials: (a) random series (samples); (b) image picture; (c) the clinker- C-S-H system.
Buildings 13 00416 g010
Table 1. Pointwise parameters estimation for the nano-hardness of the bulk paste.
Probability
Distribution
Parameters and p-Valuep-Values for 6 Sections of 1D Random Field
123456Mean Value
normal distributionLocation parameter3.3653.4003.6643.6903.8373.5983.592
Scale parameter2.5762.3072.8312.7582.9362.5862.666
p-value0.0020.0110.0230.0070.0020.0100.009
log-normal distributionLocation parameter0.9701.0130.9961.0401.0741.0551.025
Scale parameter0.7070.6530.8620.7780.7460.6780.737
p-value0.9640.7660.5700.3360.7480.8460.705
Weibull distributionLocation parameter3.7463.8244.0274.0944.2514.0283.995
Scale parameter1.4571.6021.3791.4461.4171.5291.472
p-value0.1830.2890.4460.1740.1280.3460.261
gamma distributionShape parameter2.2052.5261.8032.0341.9962.3692.155
Scale parameter1.5261.3462.0331.8141.9231.5191.693
p-value0.3650.4280.4240.1650.1810.3530.319
Table 2. Pointwise parameters estimation for the nano-hardness of the ITZ.
Probability
Distribution
Parameters and p-Valuep-Values for 6 Sections of 1D Random Field
123456Mean Value
normal distributionLocation parameter2.1332.1032.1572.1502.3422.1052.165
Scale parameter1.2531.3741.5761.7511.9051.2521.519
p-value0.0580.0490.0090.0010.0000.0440.027
log-normal distributionLocation parameter0.5690.5280.5370.5240.5940.5770.555
Scale parameter0.7010.7000.7000.6980.7240.5980.687
p-value0.3070.6820.6870.2960.3360.8640.529
Weibull distributionLocation parameter2.4002.3612.4092.3872.5932.3802.421
Scale parameter1.7911.6341.5081.4201.3991.8091.593
p-value0.6600.6070.4130.0570.0750.4770.381
gamma distributionShape parameter2.8142.4722.3122.2262.0993.1402.510
Scale parameter0.7580.8510.9330.9661.1160.6700.882
p-value0.9470.8270.6180.1890.1190.9040.601
Table 3. Pointwise parameters estimation for the nano-modulus of the bulk paste.
Probability
Distribution
Parameters and p-Valuep-Values for 6 Sections of 1D Random Field
123456Mean Value
normal distributionLocation parameter58.43661.35559.83960.28962.14758.22560.049
Scale parameter23.25325.07426.99026.05527.96323.35225.447
p-value0.6390.3680.5570.0670.3220.5180.412
log-normal distributionLocation parameter3.9834.0343.9703.9894.0283.9833.998
Scale parameter0.4320.4130.5600.5480.4640.4150.472
p-value0.2830.9650.1670.2760.9170.9670.596
Weibull distributionLocation parameter65.78169.21567.41967.85170.27065.59967.689
Scale parameter2.7122.6272.3342.4322.3702.6742.525
p-value0.7600.5410.6010.2480.7630.8140.621
gamma distributionShape parameter6.0216.2294.2784.6845.0986.2865.433
Scale parameter9.7069.85013.98912.87112.1909.26311.312
p-value0.6960.9360.5510.7260.9561.0000.811
Table 4. Pointwise parameters estimation for the nano-modulus of the ITZ.
Probability DistributionParameters and p-Valuep-Values for 6 Sections of 1D Random Field
123456Mean Value
normal distributionLocation parameter44.10043.39942.46542.09643.52343.26843.142
Scale parameter21.41323.66021.29521.17120.23621.66821.574
p-value0.1690.3040.6120.1530.1990.1920.272
log-normal distributionLocation parameter3.6453.6043.6053.5963.6333.6283.618
Scale parameter0.6100.6260.5790.5940.6060.5690.597
p-value0.0890.2240.1200.2300.0750.3900.188
Weibull distributionLocation parameter49.67748.99848.00747.50649.03248.90748.687
Scale parameter2.1461.9342.1152.0882.2682.1142.111
p-value0.4570.8790.9240.7460.7230.6850.735
gamma distributionShape parameter3.6913.1553.6353.6273.7223.7363.594
Scale parameter11.94813.75611.68411.60711.69311.58212.045
p-value0.4520.7330.5550.7880.3980.7580.614
Table 5. The values of the squared 2-norm of the residual.
PhaseIndentation
Properties
Correlation
Function 1
Correlation
Function 2
Correlation
Function 3
Bulk pasteH0.01850.02350.0533
M0.02140.07290.1406
ITZH0.00550.04560.1054
M0.00830.05690.1198
Table 6. The values of factors in Equation (10).
PhaseIndentation Properties θ   μ m i   =   1 m a i + i   =   1 n b i / m + n                                                         μ m λ a i ,   b i   μ m
Bulk pasteH19.9920.050.99710–35
M19.7118.801.048
ITZH17.8816.321.096
M23.7917.351.371
Disclaimer/Publisher’s Note: The statements, opinions and data contained in all publications are solely those of the individual author(s) and contributor(s) and not of MDPI and/or the editor(s). MDPI and/or the editor(s) disclaim responsibility for any injury to people or property resulting from any ideas, methods, instructions or products referred to in the content.

