Abstract
People-oriented landscape experiences have become the focus of park design with the increasing demand of outdoor activities from urban residents, whereas thermal-comfort-guided landscape design has attracted more attention in academic circles. Based on the investigation of the microclimate of typical subregions in riverside parks, this paper uses AI recognition to analyze the spatiotemporal distribution of camping crowds, and considers the correlation between landscape morphological parameters, microclimates, and crowd behavior. Finally, we built a model to raise the number of landscape optimization strategies for landscape design. The results show that landscape morphological parameters, such as tree height, crown canopy, and sky visibility factor (SVF), can significantly affect the air temperature (Ta), relative humidity (RH), and physiological temperature (PET) in an environment, while hardly affecting wind speed (WS). For microclimate parameters, Ta has a moderate correlation with camping behavior, with a correlation coefficient of −0.145 and a p-value of 0.040, while the corresponding correlation with PET was non-significant with a p-value of 0.622. The temporal distribution of the number of campers per day show a linear upward trend with a reasonable goodness-of-fit, with an adjusted R2 above 0.789 for all subregions. The model based on landscape morphological parameters has a good fit, with coefficients of tree height and crown canopy of −0.195 and 1.316, respectively. This study provides theoretical support and design suggestions for the design of riverside parks based on crowd behavior patterns.
1. Introduction
In the process of the social development toward urbanization, the phenomenon of urban heat islands has attracted increasing intention. Urban parks can effectively reduce the input of solar radiation, as well as alleviate air temperature (Ta), mean radiation temperature (Tmrt), and thermal indices such as physiological equivalent temperature (PET), and play an important role in improving urban microclimates [1,2,3,4]. Some scholars have conducted further studies on the impact factors of park microclimates. De Abreu-Harbich, L.V. et al. [5] used PET as an optimization index to study the improvement effects of different species planting schemes on outdoor thermal comfort; Guo W. et al. [6] conducted a detailed analysis of the thermal performances of trees using a sky view factor, leaf area index, and enclosure area as planting indices; Li Y. et al. [7] used ENVI met to conduct numerical simulations to explore the impact of different vegetation arrangements on park microclimates and thermal comfort in typical summer days; and Afshar, N.K. et al. [8] studied the impact of plant types and proportions on the thermal comfort in winter via ENVI met.
Riverside parks have a unique microclimate compared with other urban parks in terms of cooling, humidification, and energy conservation [9,10,11,12]. Zhang Z. et al. [13] quantitatively discussed the time-varying characteristics of the microclimate of a wetland park and the thermal comfort of the human body, and put forward clothing suggestions. Currently, research has not yet comprehensively considered the morphological parameters of different tree species in hot and humid areas, nor has it described the correlation between landscape microclimates and crowd behavior.
Outdoor activities have attracted the increasing intention of urban residents after the outbreak of COVID-19 [14]. As a localized, small-radius form of tourism, camping has been growing rapidly, with more and more citizens in China choosing parks for recreation. Currently, there is limited research on camping behavior. Most of the current research on camping behavior focuses on pre-camping behavior, such as the choice of camping location. The influencing factors for this are mostly psychological expectations, site facilities, and economic factors. Jeonghee, N. et al. [15] found that the expectations of crowds have a significant impact on camping willingness using a goal-directed behavior model; Ham, S. et al. [16] analyzed the campers’ selection criteria for camping in Korea by online surveys; Kim, S. et al. [17] examined the relationship between the service capes, place images, and behavior intentions of camping participants, as well as the mediating effect of the place images between service capes and behavior intentions. Currently, there is a lack of research on camping behavior patterns, and no research has been conducted on the impact of landscape microclimates on camping behavior patterns.
In summary, the unique microclimate conditions of riverside parks can provide a suitable environment for the outdoor activities of residents, which has a significant impact on residents’ camping behavior patterns. Furthermore, camping for longer durations can also reflect the thermal comfort of the landscape environment well. This paper takes the riverside park in Guangzhou Higher Education Mega Center as an example; it explores the correlation between the camping behavior patterns and microclimates in different subregions through on-site measurements, providing theoretical support for the climate appropriate riverside park design.
2. Materials and Methods
2.1. Case Selection and Measuring Point Layout
- (1)
- Case selection
Guangzhou is situated in the southern part of China and has a marine subtropical monsoon climate, which is characterized by warm and rainy weather with plenty of light and heat. The summer season in Guangzhou is long, while the frost period is short. The annual average temperature in Guangzhou ranges between 20 and 22 degrees Celsius, making it one of the largest cities in China with the smallest annual average temperature difference. In order to explore the correlation between camping behavior patterns and microclimates under the different landscape patterns of a riverside park, this paper chooses the riverside park in Guangzhou Higher Education Mega Center as the practical measurement site. It is located on the south side of Xiaoguwei Island, stretching from Guangdong Science Center in the east, to Guangzhou Academy of Fine Arts in the west. It is adjacent to the Pearl River, with a wide field of vision and beautiful scenery. At the same time, due to its simple layout, clear boundaries, and flat terrain, it is suitable for outdoor camping activities.
- (2)
- Measuring point layout
Different terrain, plants, waves, and underlying surfaces all have effects on landscape patterns, the actual measurements will mainly consider the influence of plants and underlying surfaces. Excluding the areas that are difficult for camping activities, the park is broken down into five typical landscape subregions. With the spots that have relatively high density for camping activities as microclimate measurement points, the site is divided into 20 × 20 m grids, and a simplified site model is established for subsequent analysis (Figure 1, Table 1).
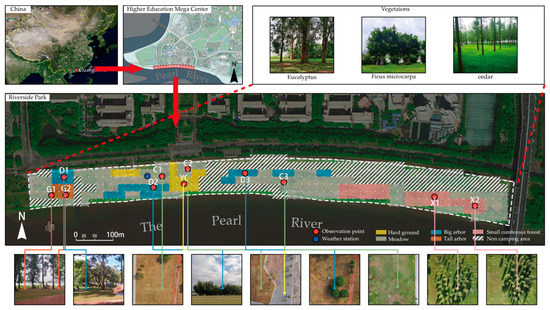
Figure 1.
Comprehensive Map of Subregion Case Information.

Table 1.
Table of Landscape Morphological Parameters for Each Subregion.
2.2. Influencing Factors and Evaluation Indicators of Microclimates
The landscape morphological parameters of trees, such as tree height, crown canopy, and canopy density, have a significant impact on the regional microclimate environment from the aspects of shading and transpiration. Tree height, crown canopy, and canopy density SVF (sky visibility factor) are used as the microclimate-influencing factors to quantitatively characterize the five types of partitions and to explore their impact on the microclimate.
The follow-up evaluation uses air temperature (Ta), relative humidity (RH), water vapor pressure (VP), wind speed (WS), and the difference between mean radiant temperature and air temperature (Tmrt-Ta) as the basic microclimate evaluation indicators. Further, the physiological equivalent temperature (PET), as a comprehensive microclimate evaluation indicator, is also used.
2.3. Capture Method and Evaluation Index of Crowd Behavior Patterns
2.3.1. Crowd Behavior Pattern Capture Method
- (1)
- Capture method selection
In traditional crowd behavior research, the use of behavior observations, interview surveys, questionnaire surveys, and other survey methods consume a lot of manpower and material resources, and this often interferes with the target, resulting in certain theoretical errors. Modern digital technology provides a new option for the study of crowd behavior patterns [18]. Generating pedestrian behavior heat maps based on big data has achieved good results [19,20]. Some scholars also explored the application of deep learning technology in crowd behavior research [21]. The research of small-scale parks, such as the riverside park, require a high accuracy for geographical location information data. Therefore, this paper uses drone aerial photography combined with fixed-point photography to capture the behavior of camping crowds, and it uses AI recognition technology to count the frequency data of camping crowds.
- (2)
- Technical realization
The process of capturing crowd behavior patterns can be divided into 4 steps: (1) The use of drone aerial photography combined with fixed-point shooting to capture camping crowd activities in different time periods; (2) Using Python, we developed the OpenCV-YOLOv3 target detection algorithm [22]. By applying this algorithm, the original crowds are identified across different subregions of a single picture. This allowed us to obtain the original data (Figure 2); (3) data cleaning on the original data is performed and the outliers such as mutation data are eliminated; and (4) generating the crowd distribution heat map with the pyheatmap code base [23].
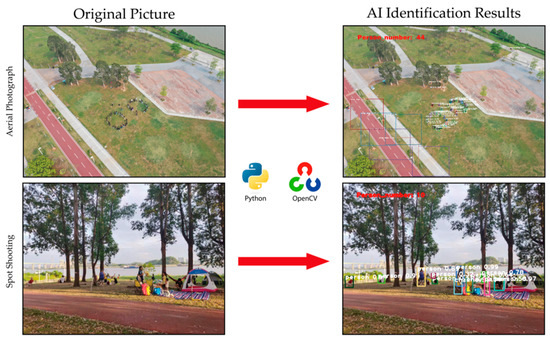
Figure 2.
AI recognition.
2.3.2. Evaluation Index of Crowd Behavior Patterns
This paper uses crowd activity density ρ as the basic evaluation index of the camping crowd behavior patterns. Due to the difference in activity density at different times, this article further defines service efficiency to compare the crowd density at different times and subregions. At a certain time period, the values of the activity density of a certain subregion ρ0, divided by the total activity density of the entire venue ρ is the service efficiency η of the subregion at that moment (1).
2.4. Study Protocol
- (1)
- Measured time selection
In this experiment, the actual measurement was carried out during the “mini vacation” during the typical transitional seasons, May and October, where camping activities are more prevalent.
The actual measurement was carried out from 9:00 to 17:00 daily, the microclimate parameters were recorded every 5 min, and the crowd activities were recorded every 60 min.
- (2)
- Data collection
- (1)
- The calculation of the SVF value of each subregion was obtained by using the Hemi-View canopy analysis system camera (Cannon EOS 60D + Sigma EX-DC 4.5 mm);
- (2)
- The collection of microclimate data, such as Ta, RH, and WS, was obtained by a handheld electronic weather instrument (Kestrel 5500 Weather Meter, Nielsen-Kellerman Company, Boothwyn, PA, USA), and the solar radiation was obtained by a weather station (Davis Vantage Pro2, Davis Instruments Corporation, Hayward, CA, USA);
- (3)
- The recording of crowd behaviors was achieved via drone aerial photography, combined with a fixed-point shooting of outdoor sports cameras;
- (4)
- The calculation of PET was based on the male gender, height 175 cm, weight 75 kg, age 35 years, metabolic rate 85 W, and clothing 0.3 clo as the calculation standard. RayMan 1.2 was used to calculate the PET value of each subregion based on the measured microclimate data [24].
Figure 3 summarizes the study protocol and the measurements.
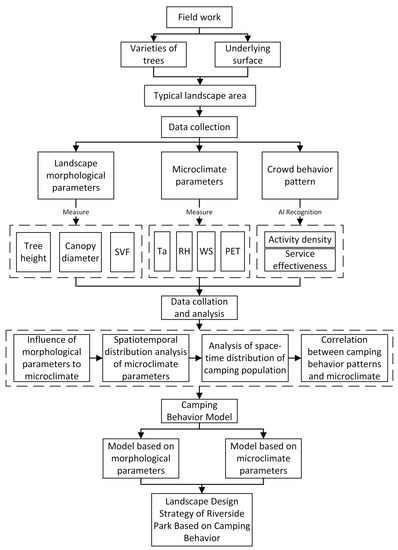
Figure 3.
Study protocol and measurements.
3. Results and Discussion
3.1. Analysis of the Measured Results of Landscape Microclimates
3.1.1. Spatiotemporal Distribution of Microclimate Parameters in Different Landscape Regions
- (1)
- Basic microclimate evaluation indicators
When comparing the time-varying trends of the microclimate over two months, it was observed that the Ta and RH have the same trend: the Ta rises steadily before 4:00 p.m., and then drops rapidly. The peak value of Ta appears around 4:00 p.m. (Figure 4). The trend of RH and VP is opposite to Ta. The nadir value of RH appears around 4:00 p.m. (Figure 5 and Figure 6). The fluctuation trend of WS is relatively random, and there is no obvious pattern in the time distribution (Figure 7). The Tmrt-Ta value was used as a measure of solar radiation on paper. The trend of Tmrt-Ta was roughly in a “convex” shape, but there was no clear interval of peak occurrence that was influenced by solar radiation (Figure 8).
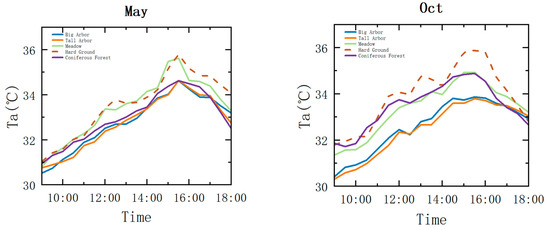
Figure 4.
Monthly averages of diurnal air temperatures.
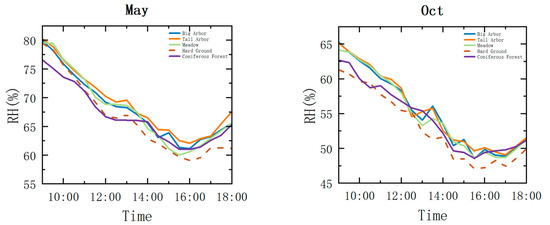
Figure 5.
Monthly averages of diurnal relative humidities.
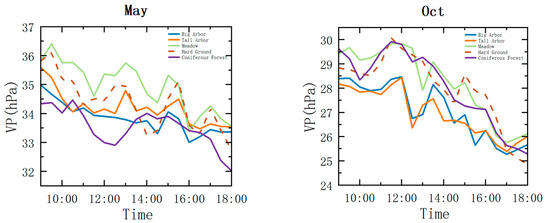
Figure 6.
Monthly averages of diurnal vapor pressures.
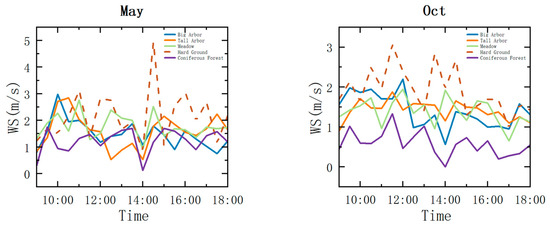
Figure 7.
Monthly averages of diurnal wind speeds.
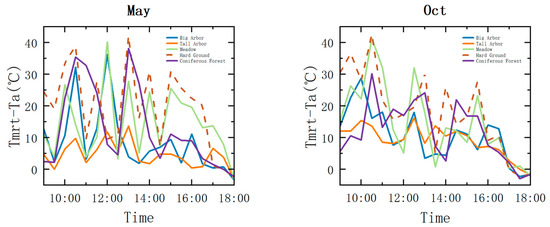
Figure 8.
Monthly averages of diurnal Tmrt-Tas.
Comparing the microclimate spatial distribution trends for the two months, the basic parameters of the microclimate in different subregions had the same stratification. Compared with the hard ground, the vegetation in each environment showed a certain effect of cooling and humidifying, as well as reducing wind speed: (1) The daily average Ta trend was hard floor > meadow > small coniferous forest > big arbor > tall arbor. Among these, the big arbor and tall arbor had the best cooling effect, with the daily average Ta being decreased by 1.1 °C and 1.2 °C, respectively, compared with the hard ground; (2) the daily average RH was stratified into tall arbor > big arbor > small coniferous forest > meadow > hard ground, and the daily average VP was stratified into meadow > hard ground > small coniferous forest > tall arbor > big arbor. The big arbor and tall arbor had a positive effect on increasing the RH, while decreasing VP. Compared with the hard ground, the daily average RH of the big arbor and tall arbor increased by 2.06% and 2.53%, respectively, while the daily average VP of the big arbor and tall arbor decreased by 0.59 and 0.73, respectively; (3) the daily average WS was stratified into hard ground > meadow > tall arbor > big arbor > small coniferous forest. The reduction was largest for the coniferous forests, amounting to 1.16 m/s. The deceleration range of the large arbor, tall arbor, and meadow was relatively close at 0.57 m/s, 0.51 m/s, 0.46 m/s, respectively; and (4) the average Tmrt-Ta was stratified as follows tall forest > large forest > small coniferous forest > meadow > hard ground. Additionally, the fluctuation range of the Tmrt-Ta was inversely related to its average value: the lower the average Tmrt-Ta, the smaller the fluctuation range (Figure 9).
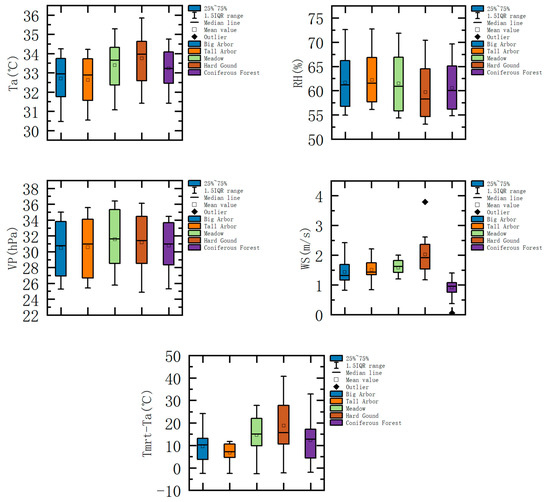
Figure 9.
Box plot of basic microclimate parameters in each subregion.
For Ta, RH, and VP, the different landscape configurations will affect its regional microclimate, but will not be delayed or advanced in its time series. Good shading can reduce direct radiation and take away heat through transpiration, which has a good effect of cooling and humidifying. For WS, all vegetation configuration has a certain retention effect on wind current. Additionally, the arrangement of vegetation will greatly impact the region WS. The coniferous forest with multiple rows of dense planting, for instance, is obviously different from other subregions with strong reductions in WS.
- (2)
- PET analyses
In terms of time distribution, the changes in PET in May and October showed a “convex” trend, and the peak happened around 14:00. Taking the neutral temperature of 31 °C in summer as a reference, all areas reached a good thermal comfort level before 10:00 a.m. and after 5:00 p.m. The thermal comfort of the October group was worse, but the stratification effect of PET in the different environments was more obvious (Figure 10).
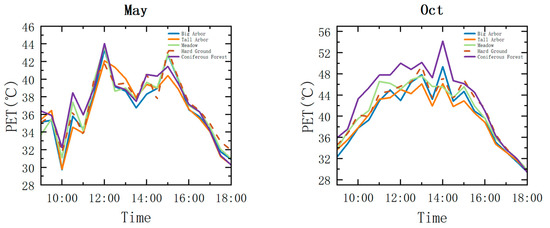
Figure 10.
Monthly PET line chart.
In terms of spatial distribution, the PET values were also stratified: the average PET value of the subregion was small coniferous forest > hard floor > meadow > big arbor > tall arbor at 40.75 °C, 39.5 °C, 39.36 °C, 38.63 °C, and 38.36 °C, respectively (Figure 11).
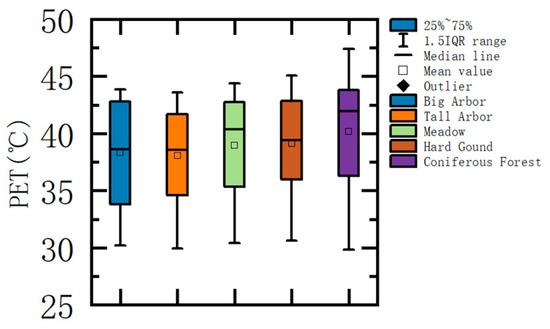
Figure 11.
Box plot of PET in each subregion.
Although the air temperature reached its maximum around 16:00, the solar radiation reached its maximum between 12:00 and 14:00, so the PET peak appeared around 14:00. The effect of single row plants on reducing wind speed was not significant, and compared to the increase in RH caused by vegetation, the cooling effect of vegetation shading had a more significant impact on PET, which makes the vegetation areas in humid and hot areas have good thermal comfort performance. At the same time, the worse the overall thermal comfort of the park, the greater the difference in the improvement effect of vegetation in various thermal environments.
3.1.2. Effect of Landscape Morphological Parameters on Microclimates
Using the hard ground as a reference, the correlation between landscape morphological parameters and microclimates were analyzed (Table 2).
Table 2.
Correlation Analysis of Landscape Morphological Parameters and Microclimates.
For basic microclimate parameters, both tree height, crown canopy, and SVF value can significantly affect the Ta, RH, VP, and solar radiation (Tmrt-Ta) of the environment. Vegetation with a large crown, high tree height, and low SVF could effectively decrease the ambient Ta, VP, and solar radiation (Tmrt-Ta), as well as enhance RH. In this experiment, none of the landscape morphological parameters had a good correlation with wind speed, which suggests that the vegetation mainly affected the WS from the distribution.
For PET, the tree height, crown canopy, and SVF were significantly correlated with environmental PET, and crown width had the highest absolute correlation.
3.2. Analysis of Residents’ Camping Behavior Patterns
3.2.1. Heat Map of Camping Crowds
According to the different measurement points for where the crowd is located, the data of all the experimental groups were counted separately, and the frequency data of crowd activities were assigned to each point to generate a corresponding heat map. In this paper, the data are divided into three time periods: 9:00–12:00, 12:00–15:00, and 15:00–18:00. This was conducted so as to generate a spatiotemporal heat map of the camping crowd (Figure 12, Figure 13 and Figure 14).
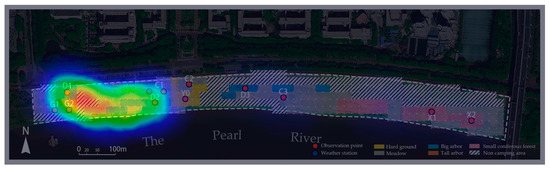
Figure 12.
The 9:00–12:00 Heat map.
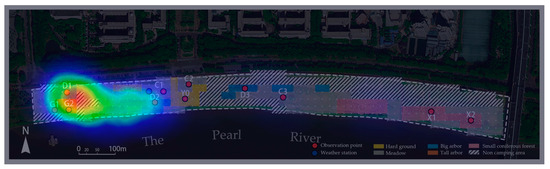
Figure 13.
The 12:00–15:00 Heat map.
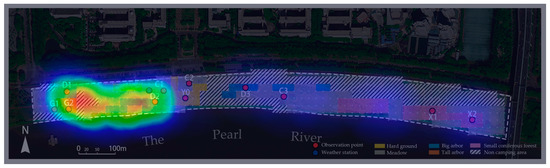
Figure 14.
The 15:00–18:00 Heat map.
As seen from the thermal map, the spatial distribution of the crowd changes over time; initially, from 9:00 to 12:00, the crowd is concentrated in the western area with the tall arbor and big arbor. From 12:00 to 15:00, due to the worsening of the thermal comfort of the environment, the crowd is more concentrated in the tall arbor subregion with its relatively better thermal comfort. From 15:00 to 18:00, as the thermal comfort of the environment begins to improve and the number of campers increases, the crowd begins to expand toward the meadow and the small coniferous forest subregion in the east.
3.2.2. Spatiotemporal Trends of Popularity in Different Regions
Taking the activity density of each subregion at different times as a sample, a scatter diagram of the camping activity density was drawn (Figure 15). It is apparent that the activity density of each region trends to change with time. The frequency of each group increases linearly with the time from 9:00 to 17:00, reaching its highest value at 17:00. At 18:00, it shows a slow downward trend. The overall preference of the camping is big trees > tall trees > small coniferous forest > meadow, and the linear regression coefficients are 10.9, 10.0, 2.0, and 1.2, respectively.
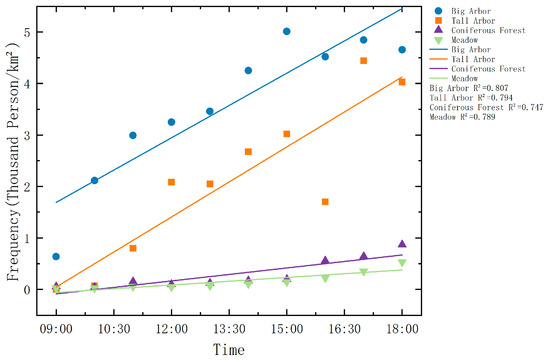
Figure 15.
Time trend of the activity density.
PET reaches its highest values at noon. Here, the thermal comfort is poor, while the thermal comfort is better in the morning and evening. Compared with the morning, the afternoon has a more comfortable PET change trend, and the camping distance is generally longer, so the crowd activity density reaches its peak before and after sunset. Per the preference of the camping crowds, the coniferous forest with a poor PET performance was better than the meadow. From the perspective of environmental psychology, the reason for this is that although the thermal comfort of the coniferous forest is poor, the arrangement of the trees in the coniferous forest makes the space more orderly, whereas the grassland is too empty and lacks a sense of direction. Therefore, people prefer the coniferous forest area with its sense of privacy and space.
3.3. Correlation Analysis between Morphological and Microclimate Factors and Camping Behavior Patterns
3.3.1. Correlation Fitting
The correlation analysis indicates a strong relationship between the landscape morphology and service efficiency, whereas the relationship between microclimate parameters and efficiency is weak. Among the morphological parameters, H, D, and SVF exhibit significant correlations and high correlation coefficients with service efficiency. On the other hand, only the Ta among the microclimate parameters had a moderate negative correlation with the camping preference (correlation coefficient of −0.145), while the others did not show significant correlations (Table 3 and Table 4). The reason for the poor correlation between PET and camping behavior was that, although the Ta had a good correlation with camping behavior, the PET was also affected by WS, RH, and solar radiation.
Table 3.
Correlation analysis of service efficiency and morphological factors.
Table 4.
Correlation analysis of service efficiency and microclimate factors.
3.3.2. Camping Behavior Model
Following the correlation analysis, linear regression was performed to model the relationship between service efficiency (dependent variable) and temperature (univariate), or the landscape morphology parameters (stepwise multiple) as independent variables. In a stepwise linear regression, H and D were retained until the end, while SVF was eliminated. The equations are as follows:
The landscape morphology parameters had a better fit in predicting the service efficiency with an R2 value of 0.867, whereas the goodness-of-fit for microclimate parameters was poor with an R2 value of 0.162 (Table 5 and Table 6).
Table 5.
Model coefficients for landscape morphological parameters as independent variable stepwise linear regression.
Table 6.
Model coefficients for microclimate impact factors as independent variable linear regression.
Although different subregions have certain differences in thermal comfort, the differences are small and difficult to perceive intuitively. The landscape morphological parameters are intuitive and perceptive, and people can choose a camping environment with better thermal comfort according to the landscape morphology. At the same time, from the perspective of environmental psychology, people tend to camp in areas with privacy and a sense of space. The larger canopy and lower height of a tree provide a better sense of site closure, and are more popular with campers who stay for a long time.
3.3.3. Landscape Optimization Strategy of Riverside Park
Through analyzing the thermal environment and crowd behavior, some strategies are proposed to optimize the landscape design of riverside parks:
- (1)
- From the perspective of time, camping is a long-distance and long-stay type of behavior. As demonstrated in Figure 13, the frequency of crowds peaks at 17:00, and this is influenced by the thermal comfort of the environment. When constructing a behavioral design, other short-range behaviors such as walking and exercising can be incorporated to increase the utilization rate of the park;
- (2)
- From the perspective of landscape microclimates, the types and arrangement of vegetation will have a significant impact on the PET value. In this project, the single-row planting of tall arbors reduced PET by 2.39 °C compared to the multi-row planting of coniferous forests. Planting tall trees in single rows can effectively improve the thermal comfort of the environment in humid and hot areas;
- (3)
- In Guangzhou and other hot and humid areas, there is no statistically significant correlation between the PET value and camping behavior, while the landscape morphology parameters (tree height and tree crown diameter) are more suitable for designing camping behavior in hot and humid areas with an R2 of 0.867. Therefore, according to the different behavioral stay times, it is recommended to use morphology parameters to partition and plan the functional area of the site. For instance, in heavily trafficked areas of the park, introducing low-crowned or tall vegetation could help increase overall park utilization and improve traffic flow.
4. Conclusions
In recent years, people-oriented landscape experiences have become the focus of park landscape design, and landscape design based on thermal comfort levels has attracted more and more attention. This paper uses computer vision technology to obtain camping behavior data, which is combined with microclimate measurements. In addition, the camping behavior of a riverside park in Guangzhou Higher Education Mega Center is studied, and the quantitative indicators and theoretical basis for park microclimate design practices based on crowd behaviors are explored. The conclusions are as follows:
- (1)
- In terms of time trends, the time-varying trends of microclimate parameters in different landscape configurations are similar. In Guangzhou, the park landscape has a better thermal comfort level in the morning and evening. In terms of spatial trends, different landscape configurations will lead to differences in regional microclimates. Vegetation with good shade, such as large trees and tall trees, have a better effect of cooling and humidifying. The distribution of trees has a great influence on the wind speed in the active area, while the tree species has little influence on it;
- (2)
- In terms of time trends, the camping population density has a good linear increase trend. In terms of spatial trends, the crowd was initially distributed in the large arbor and high arbor areas at the edge of the site. As the flow of people increased, some of the crowd expanded to the small coniferous forest area. The overall preference comparison of the camping population is big arbor > tall arbor > small coniferous forest > meadow, and the linear regression coefficients are 10.9, 10.0, 2.0, and 1.2, respectively;
- (3)
- Landscape morphological parameters have a significant influence on temperature, humidity, and PET, which, in turn, have a significant impact on environmental service efficiency. Compared with microclimate-influencing factors, landscape morphological parameters can better reflect the selection tendency of campers, and larger canopy width and SVF can better increase the camping density in this environment.
This paper has some limitations that merit further discussion. Due to the epidemic and other factors, this paper did not complete the measurements for each typical month of the year. It is worth conducting further investigations on the similarities and differences between April and October, as well as the other non-transitional months in comparison to the results of this paper.
Author Contributions
Conceptualization, L.L. (Li Li); data curation, D.W.; formal analysis, D.W.; funding acquisition, L.L. (Li Li) and D.W.; investigation, D.W.; methodology, D.W.; project administration, D.W.; resources, D.W.; software, D.W.; supervision, L.L. (Li Li) and L.L. (Lin Liu); visualization, D.W.; writing—original draft, D.W.; writing—review and editing, D.W., L.L. (Li Li) and L.L. (Lin Liu). All authors have read and agreed to the published version of the manuscript.
Funding
This research and the APC was funded by National College Student Innovation and Entrepreneurship Training Program, grant number 202011078031, and by the Natural Science Foundation of Guangdong General Project, grant number 2020A1515011583.
Informed Consent Statement
Informed consent was obtained from all subjects involved in the study.
Data Availability Statement
The data presented in this study are available on request from the corresponding author. The data are not publicly available due to that there was no consent obtained from the subjects to disclose their specific behavioral data.
Acknowledgments
Over the course of researching and writing this paper, we would like to express thanks to all those who helped the authors. First, we would like to thank Weichi Zhang, Chengbing Li, and Lequan Cao, who are in a project group of programs, for providing assistance and companionship in the process of preparing this paper. A special acknowledgement should be shown to Lin Liu, from whose instruction we benefited greatly in writing the paper. Sincere gratitude should also go to Li Li who greatly helped us through all of the study, as well as in life. Finally, we are incredibly grateful to all those who devote their time to reading this paper and who give us advice that will benefit us in our later studies.
Conflicts of Interest
The authors declare no conflict of interest.
Nomenclature
| ρ | The density of crowd activity |
| η | The service efficiency of a certain subregion |
| Ta | The value of air temperature |
| RH | The value of relative humidity |
| VP | The value of water vapor pressure |
| WS | The value of wind speed |
| Tmrt-Ta | The value of mean radiant temperature minus air temperature |
| H | The value of tree height |
| D | The value of tree crown diameter |
| SVF | The value of sky visibility factor |
References
- Brown, R.D.; Vanos, J.; Kenny, N.; Lenzholzer, S. Designing urban parks that ameliorate the effects of climate change. Landsc. Urban Plan. 2015, 138, 118–131. [Google Scholar] [CrossRef]
- Fu, J.; Wang, Y.; Zhou, D.; Cao, S.-J. Impact of Urban Park Design on Microclimate in Cold Regions using newly developped prediction method. Sustain. Cities Soc. 2022, 80, 103781. [Google Scholar] [CrossRef]
- Lee, H.; Mayer, H.; Chen, L. Contribution of trees and grasslands to the mitigation of human heat stress in a residential district of Freiburg, Southwest Germany. Landsc. Urban Plan. 2016, 148, 37–50. [Google Scholar] [CrossRef]
- Sun, S.; Xu, X.; Lao, Z.; Liu, W.; Li, Z.; García, E.H.; He, L.; Zhu, J. Evaluating the impact of urban green space and landscape design parameters on thermal comfort in hot summer by numerical simulation. Build. Environ. 2017, 123, 277–288. [Google Scholar] [CrossRef]
- De Abreu-Harbich, L.V.; Labaki, L.C.; Matzarakis, A. Effect of tree planting design and tree species on human thermal comfort in the tropics. Landsc. Urban Plan. 2015, 138, 99–109. [Google Scholar] [CrossRef]
- Guo, W.; Cheng, B.; Wang, C.; Tang, X. Tree planting indices and their effects on summer park thermal environment: A case study of a subtropical satellite city, China. Indoor Built Environ. 2020, 31, 109–120. [Google Scholar] [CrossRef]
- Li, Y.; Song, Y. Optimization of Vegetation Arrangement to Improve Microclimate and Thermal Comfort in an Urban Park. Int. Rev. Spat. Plan. Sustain. Dev. 2019, 7, 18–30. [Google Scholar] [CrossRef] [PubMed]
- Afshar, N.K.; Karimian, Z.; Doostan, R.; Nokhandan, M.H. Influence of planting designs on winter thermal comfort in an urban park. J. Environ. Eng. Landsc. Manag. 2018, 26, 232–240. [Google Scholar] [CrossRef]
- Cruz, J.A.; Blanco, A.C.; Garcia, J.J.; Santos, J.A.; Moscoso, A.D. Evaluation of the cooling effect of green and blue spaces on urban microclimate through numerical simulation: A case study of Iloilo River Esplanade, Philippines. Sustain. Cities Soc. 2021, 74, 103184. [Google Scholar] [CrossRef]
- Cureau, R.J.; Pigliautile, I.; Pisello, A.L. Seasonal and diurnal variability of a water body’s effects on the urban microclimate in a coastal city in Italy. Urban Clim. 2023, 49, 101437. [Google Scholar] [CrossRef]
- Jin, H.; Shao, T.; Zhang, R. Effect of water body forms on microclimate of residential district. Energy Procedia 2017, 134, 256–265. [Google Scholar] [CrossRef]
- Xu, J.; Wei, Q.; Huang, X.; Zhu, X.; Li, G. Evaluation of human thermal comfort near urban waterbody during summer. Build. Environ. 2010, 45, 1072–1080. [Google Scholar] [CrossRef]
- Zhang, Z.; Dong, J.; He, Q.; Ye, B. The Temporal Variation of the Microclimate and Human Thermal Comfort in Urban Wetland Parks: A Case Study of Xixi National Wetland Park, China. Forests 2021, 12, 1322. [Google Scholar] [CrossRef]
- Schweizer, A.-M.; Leiderer, A.; Mitterwallner, V.; Walentowitz, A.; Mathes, G.H.; Steinbauer, M.J. Outdoor cycling activity affected by COVID-19 related epidemic-control-decisions. PLoS ONE 2021, 16, e0249268. [Google Scholar] [CrossRef]
- Jeonghee, N. A Study on the Behavioral Intention for Chinese Campers in Camping Activities Using Model of Goal-directed Behavior. J. Tour. Leis. Res. 2022, 34, 189–208. [Google Scholar]
- Ham, S.; Kim, H.; Kim, H.-J. Campers’ consumption behaviors: Analysis on site selection criteria and camping activities. J. Tour. Leis. Res. 2018, 30, 79–94. [Google Scholar] [CrossRef]
- Kim, S.; Lee Hyung, R. Relationship between Servicescape and Behavior Intention of Camping Participant: Focused on the Mediating Effects of Place Image. Korean J. Hosp. Tour. KJHT 2021, 30, 153–168. [Google Scholar]
- Swathi, H.Y.; Shivakumar, G.; Mohana, H.S. Crowd Behavior Analysis: A Survey. In Proceedings of the 2017 International Conference on Recent Advances in Electronics and Communication Technology (ICRAECT), Bangalore, India, 16–17 March 2017; pp. 169–178. [Google Scholar]
- Feng, X.X.; Wang, Z.Z. Analysis on the characteristics of Chinese camping tourist basic consumption behavior in China. In Proceedings of the International Conference on Education and Management Innovation (EMI), Wuhan, China, 28 July 2017; pp. 244–248. [Google Scholar]
- Hua, Q. Study on the Application Strategy of Big Data in Park Population Behavior Analysis-Taking Daming Lake Scenic Spot in Jinan as an Example. Master’s Thesis, Shandong Jianzhu University, Jinan, China, 2019. (In Chinese). [Google Scholar]
- Shaoji, W.; Yike, H. A Visualized Research of Human’s Behavior in Public Spaces Based on Deep Learning: A Case Study of Weijin Road Campus, Tianjin University. Landsc. Archit. 2022, 29, 106–111. (In Chinese) [Google Scholar] [CrossRef]
- Ullah, M.B. CPU Based YOLO: A Real Time Object Detection Algorithm. In Proceedings of the IEEE-Region-10 Sympo-sium (TENSYMP)-Technology for Impactful Sustainable Development, Electr Network, Dhaka, Bangladesh, 5–7 June 2020; pp. 552–555. [Google Scholar]
- Oldj. pyHeatMap [Source Code]. 2018. Available online: https://github.com/oldj/pyheatmap (accessed on 1 September 2021).
- Daneshvar, M.R.M.; Bagherzadeh, A.; Tavousi, T. Assessment of bioclimatic comfort conditions based on physiologically equivalent temperature (PET) using the RayMan Model in Iran. Cent. Eur. J. Geosci. 2013, 5, 53–60. [Google Scholar] [CrossRef]
Disclaimer/Publisher’s Note: The statements, opinions and data contained in all publications are solely those of the individual author(s) and contributor(s) and not of MDPI and/or the editor(s). MDPI and/or the editor(s) disclaim responsibility for any injury to people or property resulting from any ideas, methods, instructions or products referred to in the content. |
© 2023 by the authors. Licensee MDPI, Basel, Switzerland. This article is an open access article distributed under the terms and conditions of the Creative Commons Attribution (CC BY) license (https://creativecommons.org/licenses/by/4.0/).