Article

A New Correlation for Single-Sided Natural Ventilation Rate Based on Full-Scale Experimental Study in Mogao Grottoes, Dunhuang, China

1
School of Architecture, Xi’an University of Architecture and Technology, Xi’an 710055, China
2
Conservation Institute, Dunhuang Academy, Dunhuang 736200, China
3
School of Architecture, Chang’an University, Xi’an 710000, China
4
School of Architecture, Zhengzhou University, Zhengzhou 450001, China
*
Author to whom correspondence should be addressed.
Buildings 2023, 13(5), 1298; https://doi.org/10.3390/buildings13051298
Submission received: 15 April 2023 / Revised: 7 May 2023 / Accepted: 11 May 2023 / Published: 16 May 2023
(This article belongs to the Section Building Energy, Physics, Environment, and Systems)

Abstract

:
Although research on the natural ventilation of single-sided buildings is progressing, research on the natural ventilation of the Mogao Grottoes, which have special shapes and structures, is relatively limited. The purpose of this paper is to develop a correlation for calculating the natural ventilation rates of such grottoes. Field experiments were carried out on two typical caves to measure their meteorological parameters and natural ventilation rates to verify the validity of the proposed correlation. The results show that our correlation has good reliability and stability when predicting the natural ventilation rates of the caves. First, the new correlation has a small average deviation of 16.35%. The average deviations in the natural ventilation rates predicted by seven established correlations are as low as 17.85% and as high as 59.39%, revealing a large gap compared with the correlation proposed herein. Second, the maximum deviation in the outputs of the proposed correlation is only 7.70% between each case. Finally, a comparison between the calculated results and the values measured in Cave 328 shows that the correlation is also suitable for large-volume caves. The developed correlation provides theoretical support and a scientific method for preventive protection and a quantitative analysis method for the study of natural ventilation in caves.

1. Introduction

The Mogao Grottoes, a World Heritage Site, are located in Dunhuang city, Gansu Province, China. In 1987, as one of the first projects enacted by the Chinese government, the Mogao Grottoes were included in the World Cultural Heritage List by the World Heritage Committee of the United Nations Educational, Scientific and Cultural Organization (UNESCO). A large number of precious murals and painted sculptures are preserved in the Mogao Grottoes. Among the grottoes, there are 735 caves built by 16 dynasties from the 4th century to the 14th century. These caves are distributed on a north–south-oriented cliff with a length of approximately 1600 m, and the total area of the preserved murals is approximately 45,000 m2 [1].
The murals, paintings and statues in the Mogao Grottoes have been preserved for thousands of years. In addition to the extremely hot and dry climate of the Gobi Desert in Northwest China, another major factor affecting the preservation of these artifacts is the unique architectural form of the caves [2,3]. The Mogao Grottoes are carved into the east-facing cliff at the eastern foot of Mingsha Mountain. The only opening connecting the cave with the outside world is in the east; the other sides of the caves are connected with the mountain [4,5]. However, in recent years, highly humid air has entered the caves under the action of air flow during heavy rainfall and sandstorm weather events. As air is exchanged between the environments inside and outside the caves [4,5,6], the microenvironment inside the caves changes dramatically, causing great and irreversible damage to the preservation of the murals and statues [7,8]. In addition, with the continuous development of tourism, the large number of visiting tourists results in altered temperature, humidity, CO2 concentration, microorganism and aerosol conditions. According to statistics from the Dunhuang Academy, in 1979, the number of tourists was only 26,000, whereas in 2015, the number of tourists reached nearly one million, and in recent years, it has even exceeded tens of millions. Overloading the caves with the continuous reception of tourists has led to a severe decline in air quality inside the caves. For example, the CO2 concentration inside the caves remains high, and human body odors persist. In the summer, the water vapor from visitors’ breathing and skin evaporation cannot be quickly replaced by fresh air from outside due to the inefficient ventilation, leading to long-term stays inside the cave and causing the deterioration of the murals. The poor air quality increases the risk of chemical reactions in the pigments of the murals and greatly affects the quality of visitors’ experiences [4,5,6]. In particular, an increase in the CO2 concentration inside the caves would cause the murals to face an acidic environment, posing a potential threat to the protection of the murals [9,10]. Therefore, natural ventilation plays a crucial role in maintaining the relative stability of the cave environment and protecting the cultural relics inside the caves from damage.
Currently, research on natural ventilation primarily focuses on the building envelope [11,12,13,14,15,16,17], building energy consumption [18,19,20] and the thermal comfort of occupants [13,21,22,23]. The natural ventilation problems of caves differ from those of traditional buildings due to differences in their architectural forms, research contents and boundary conditions. First, the caves analyzed in this study are generally composed of aisles and main rooms, as well as Buddhist niches at the backs of the main rooms (very few caves have front rooms). The cave walls are decorated with exquisite murals and statues. The cave shapes mainly include bucket top-shaped caves, central tower column caves and hall caves. The studied caves were carved into the mountain, and there is thus a great difference between the architectural forms of the caves and other buildings [24,25]. Second, the natural ventilation processes of caves must not only facilitate the removal of high-humidity and high-CO2 air but also, and more importantly, facilitate the relative stability of the environment within the caves and provide favorable conditions for the storage of cultural relics; in contrast, research on the ventilation of general buildings is focused on indoor comfort and reducing indoor pollutant concentrations. Finally, regardless of the size of the building, the indoor and outdoor air environments occur inside and outside the building walls, respectively. The air flows associated with buildings are greatly influenced by the indoor and outdoor wind fields and by other natural environmental conditions. In contrast, the caves are located in a cliff, are up to several hundred meters thick and represent semi-infinite cave-type building architecture; the overall condition of these caves is thus relatively stable. Therefore, the boundary conditions of the two building types are also quite different [26,27].
Although research on the single-sided natural ventilation of buildings has advanced, few studies have been conducted on the single-sided natural ventilation of caves built into mountains. Existing studies have mainly focused on analyzing the current environmental situation [4,5,28,29] instead of conducting in-depth and systematic explorations considering the natural ventilation of traditional buildings. Further study and discussion are needed to determine whether the theory of single-sided ventilation in ordinary civil buildings is applicable to this kind of cave. Additionally, the existence of sand-preventing forest belts in front of the caves, the irregularity of the cliff body and the particularity of the caves themselves substantially complicate the natural ventilation of the Mogao Grottoes. Considering the influence of the wind speed, wind direction and temperature difference between the inside and outside of the caves on the natural ventilation of the caves, it is the ultimate goal of this paper to propose a suitable correlation that systematically considers the impact of different forces for determining the single-sided natural ventilation rate of the Mogao Grottoes.

2. Materials and Methods

2.1. Review of Existing Correlations for Single-Sided Ventilation Rates

Among the existing methods, empirical correlations can rapidly provide estimates of single-sided natural ventilation rates. Additionally, numerous measurements and simulations have been performed for ventilation rates that are driven by wind pressure or buoyancy (or both), and correlations of ventilation rates based on temperature and wind speed parameters have been proposed. However, their applicability is limited to their validity domain, which is not always universal. These expressions are usually derived from theory, and some fitting coefficients are adjusted by experimental data.
Warren [30,31] proposed the most widely used empirical correlation on the basis of mixing layer theory. The correlation calculates the natural ventilation rate by wind-driven and buoyancy-driven methods and uses the larger value obtained between the two methods as the total natural ventilation rate.
Q b = 1 3 A e f f C d g H T T a v e
Q w = 0.025 A e f f U
Q T = m a x Q b , Q w
where Q b and Q w are the ventilation rates due to buoyancy and wind pressure, respectively, m3/s; Q T is the total ventilation rate, m3/s; C d is the discharge coefficient; A e f f is the effective area of the opening, m2; T is the temperature difference inside and outside the opening, K; H is the opening height, m; g is the gravitational acceleration, m/s2; T a v e is the average temperature between the inside and outside of the opening, K; U is the wind velocity along the facade wall in front of the opening, m/s.
Dascalaki et al. [32,33] compared predicted and measured data output by various network correlations for the case of single-sided natural ventilation and found that the buoyancy-driven effect was more obvious than the wind-driven effect; furthermore, the authors conducted four single-sided natural ventilation experiments in the PASSYS Test Cell using the N2O tracer gas decay method and found a systematic deviation between the theoretical and experimental values. A modified coefficient, C F , was proposed for G r and R e to characterize the effect of wind pressure on the total ventilation rate:
Q T = 1 3 A C F g H T i T o T i
C F = 0.08 G r R e D 2 0.38
where A is the area of the opening, m2; T i and T o are the temperatures inside and outside the opening, respectively, K; G r and R e D are the Gasthof number and Reynolds number, respectively.
De Gids and Phaff [34] conducted full-size experiments, including 33 cases at three different locations on buildings in urban environments that were surrounded by other buildings up to four floors high, involving the wind speeds inside and outside windows and rooms, the ventilation rate and the ambient temperature. The average wind speed through the opening, U m , can be obtained; this value depends on the wind pressure effect, the buoyancy effect and the turbulence effect. Finally, an expression of the volume flow rate was proposed. However, unlike most correlations, their correlation did not consider C p , whose value was instead included in U m . This decision caused the accuracy of the calculations to be dependent on the window type. Moreover, the correlation did not account for the wind direction:
Q T = A e f f U m = 1 2 A U m
U m = D 1 U 10 2 + D 2 H T + D 3
where U m is the mean air velocity in the opening, m/s; U 10 is the mean wind speed in H = 10 m, m/s; D 1 is a dimensionless coefficient linked to the wind effect; D 2 is a coefficient linked to the stack effect; and D 3 is a turbulence constant, with values of 0.001, 0.0035 and 0.01, respectively.
The data obtained in the wind tunnel experiments were fitted and combined. Larsen and Heiselberg [35,36] proposed a correlation that comprehensively considered the wind-driven, buoyancy-driven and airflow fluctuation processes caused by various factors by measuring 159 cases in a wind tunnel. Empirical constants were determined according to the relations among windward, parallel and leeward winds:
Q T = A C 1 f β 2 C p U r e f 2 + C 2 H T + C 3 C p , o p e n i n g ( β ) T U r e f 2
where C 1 , C 2 and C 3 using the least squares method were fitted on 159 measurements made in the wind tunnel. For parallel flow, the values for the three constants were 0.0010, 0.0005 and 0.0111, respectively; f β is the function of the wind incident angle determined experimentally; U r e f is the reference wind speed, m/s; C p , o p e n i n g ( β ) is the largest measured deviation of C p at the opening.
Caciolo et al. [37,38] transformed wind speeds into effective temperatures by CFD simulations on the interactions among wind pressures, wind directions and thermal pressures and proposed that an interaction between wind-driven and buoyancy-driven processes affects the windward and leeward sides to illustrate the correlation. For leeward ventilation:
Q T , l e e w a r d = Q s , e f f = 1 3 A C d T e f f H g / T a v e
where the effective air temperature difference is T e f f = T · T * = T ( 1.355 0.179 U ) , K.
For windward ventilation:
Q T , w i n d w a r d = Q b + Q w = 1 3 A C d T e f f H g / T a v e + 0.0357 A ( U U l i m )
where the effective air temperature difference is T e f f = T · T * = T · ( 1.234 0.490 U + 0.048 U 2 ) , K; U l i m = 1.23 m/s.
Pan et al. [39] proposed a new correlation reflecting the interactions between wind-driven and buoyancy-driven processes through field tests of outdoor meteorological parameters, indoor temperatures, the wind pressure coefficient and the ventilation rate of an apartment in Tianjin; this correlation could comprehensively and systematically explain the natural ventilation rate under the actions of various influencing factors:
Q T = C d l z 0 H C p U r e f 2 z r e f 2 α T i T a v e z 2 δ z 0 2 δ + 2 T i T o T a v e g z 0 z d z
where l is the opening width, m; z 0 is the neutral plane height, m, which can be obtained by solving the equation; z r e f is the height of the reference location, m; and δ is determined by the terrain category.
When the temperature difference is less than 1 K, the correlation proposed by Warren et al. [30,31] would have outputs with large deviations. Tang et al. [40] thus proposed a low-wind speed correlation in an urban environment based on a primary school in Beijing to solve this problem:
Q T = 1 3 A C d g H T i T o T i + C T i T o
The correlations mentioned above are currently the most widely accepted (Warren, Dascalaki, De Gids and Phaff and Heiselberg) and latest research results (Caciolo, Pan and Tang) in the field of natural ventilation, with strong representativeness and authority.

2.2. Experimental Methods

In typical tracer gas attenuation experiments, a large amount of CO2 gas is injected far beyond the threshold over a short period of time; these full-scale experiments would more or less cause irreparable damage to the extremely precious and rare murals and statues within the studied caves, thus introducing a great obstacle in these experiments. After a multiparty coordinated effort, two typical caves were finally selected, as shown in Figure 1, and the specific parameters of these caves are shown in Table 1.
There are a total of 735 existing caves in the Mogao Grottoes, of which 492 have complete cave shapes, with 492 of them containing murals and statues, and 363 of them, including Cave 45 and Cave 46, are covered with a bucket caisson roof, accounting for 73.78%. There are also 247 medium-sized caves along with them, accounting for 50.20%. Both percentages are over 50%, indicating strong representativeness, and therefore can be regarded as representative of the complex cave system.
Cave 45 was excavated in the Tang Dynasty. The cave is square in plan and is decorated at the top with a bucket caisson, at the center with a group of flowers and with four paintings of thousands of Buddhas. The west wall of the cave opens into a flat-roofed niche containing seven body image models of Buddha, disciples, Bodhisattvas and Heavenly Kings. The north and south walls are covered by longitudinal frescoes. The two sides of the east wall door are divided into pictures of Guanyin and Bodhisattvas. Cave 46 was dug in the Tang Dynasty and was rebuilt in the Five Dynasty and Song Dynasty. The cave is shaped like a bucket roof. The main room contains a top-caisson painting with a group of flowers in the center. Four paintings in this cave depict thousands of Buddhas. On the roof of the aisle are two rows of chess patterns painted during the Five Dynasty. The existing Buddhas in the two caves are not internal heat sources. Both of them belong to small caves, and the plans and profiles of the caves are shown in Figure 1.
Current research [4,5,6,8,9,10,26,27] indicates that the damage to the murals and statues is mainly caused by water and salt migration in the wall, and the direct causes include carbon dioxide exhaled by tourists, sweat evaporation and rainwater during the summer. Our experiments were conducted in September and January, during the peak tourist season and the rainy season, respectively. The data collected during these periods have higher similarity with the environmental parameters of the damaged caves compared to other months. In consideration of various constraints, the experiments were conducted on 14 January 2019, from 10:30 a.m. to 4:30 p.m., and on 25 September 2019, from 5:30 p.m. to 7:00 p.m., as well as on 26 September 2019, from 1:40 p.m. to 3:20 p.m.
The measured variables included the outside wind speed at the reference position, the outside air temperature, the inside air temperature, the wind velocity along the facade wall of the cave in front of the single opening, the air flow rate inside the cave and the ventilation rate.
Due to the difficulty of conducting field experiments, the wind pressure coefficient was obtained using a previously described method [41]. The detailed experimental methods used to obtain the other parameters are described in the following sections.

2.2.1. Meteorological Parameters Outside the Caves

The Dunhuang Research Institute installed a weather station on top of the Mogao Grottoes to monitor the environmental parameters in the grotto zone, including the temperature, relative humidity, wind pressure, wind speed, wind direction and solar radiation, as shown in Table 2.
Figure 2 shows the location of the installed weather station. Meteorological observations are obtained at a 10 min frequency. It should be noted that the wind speed recorded by the weather station represents an average wind speed, so these measurements cannot be used by the existing correlations directly and instead must be vector-decomposed, as shown in Equation (13):
U r e f = U r e f c o s β
where U r e f is the average wind speed used, m/s; U r e f is the average wind speed recorded by the weather station, m/s; and β is the average wind direction corresponding to the average wind speed, °.

2.2.2. Temperature Inside the Caves

A thermohygrometer (Testo AG, Titisee-Neustadt, Germany) was used to measure the air temperature in the caves, and the specific parameters used to obtain these measurements are shown in Table 3. Since the temperature distribution may be uneven within the caves, four sets of temperature and humidity sensors were used in this experiment, as shown in Figure 3. The four temperature and humidity sensors used to measure the air temperatures in the caves were distributed behind the opening of each cave (P1), at the upper and lower center of the main room (P2, P4) and at the rear corner of the main room (P3).

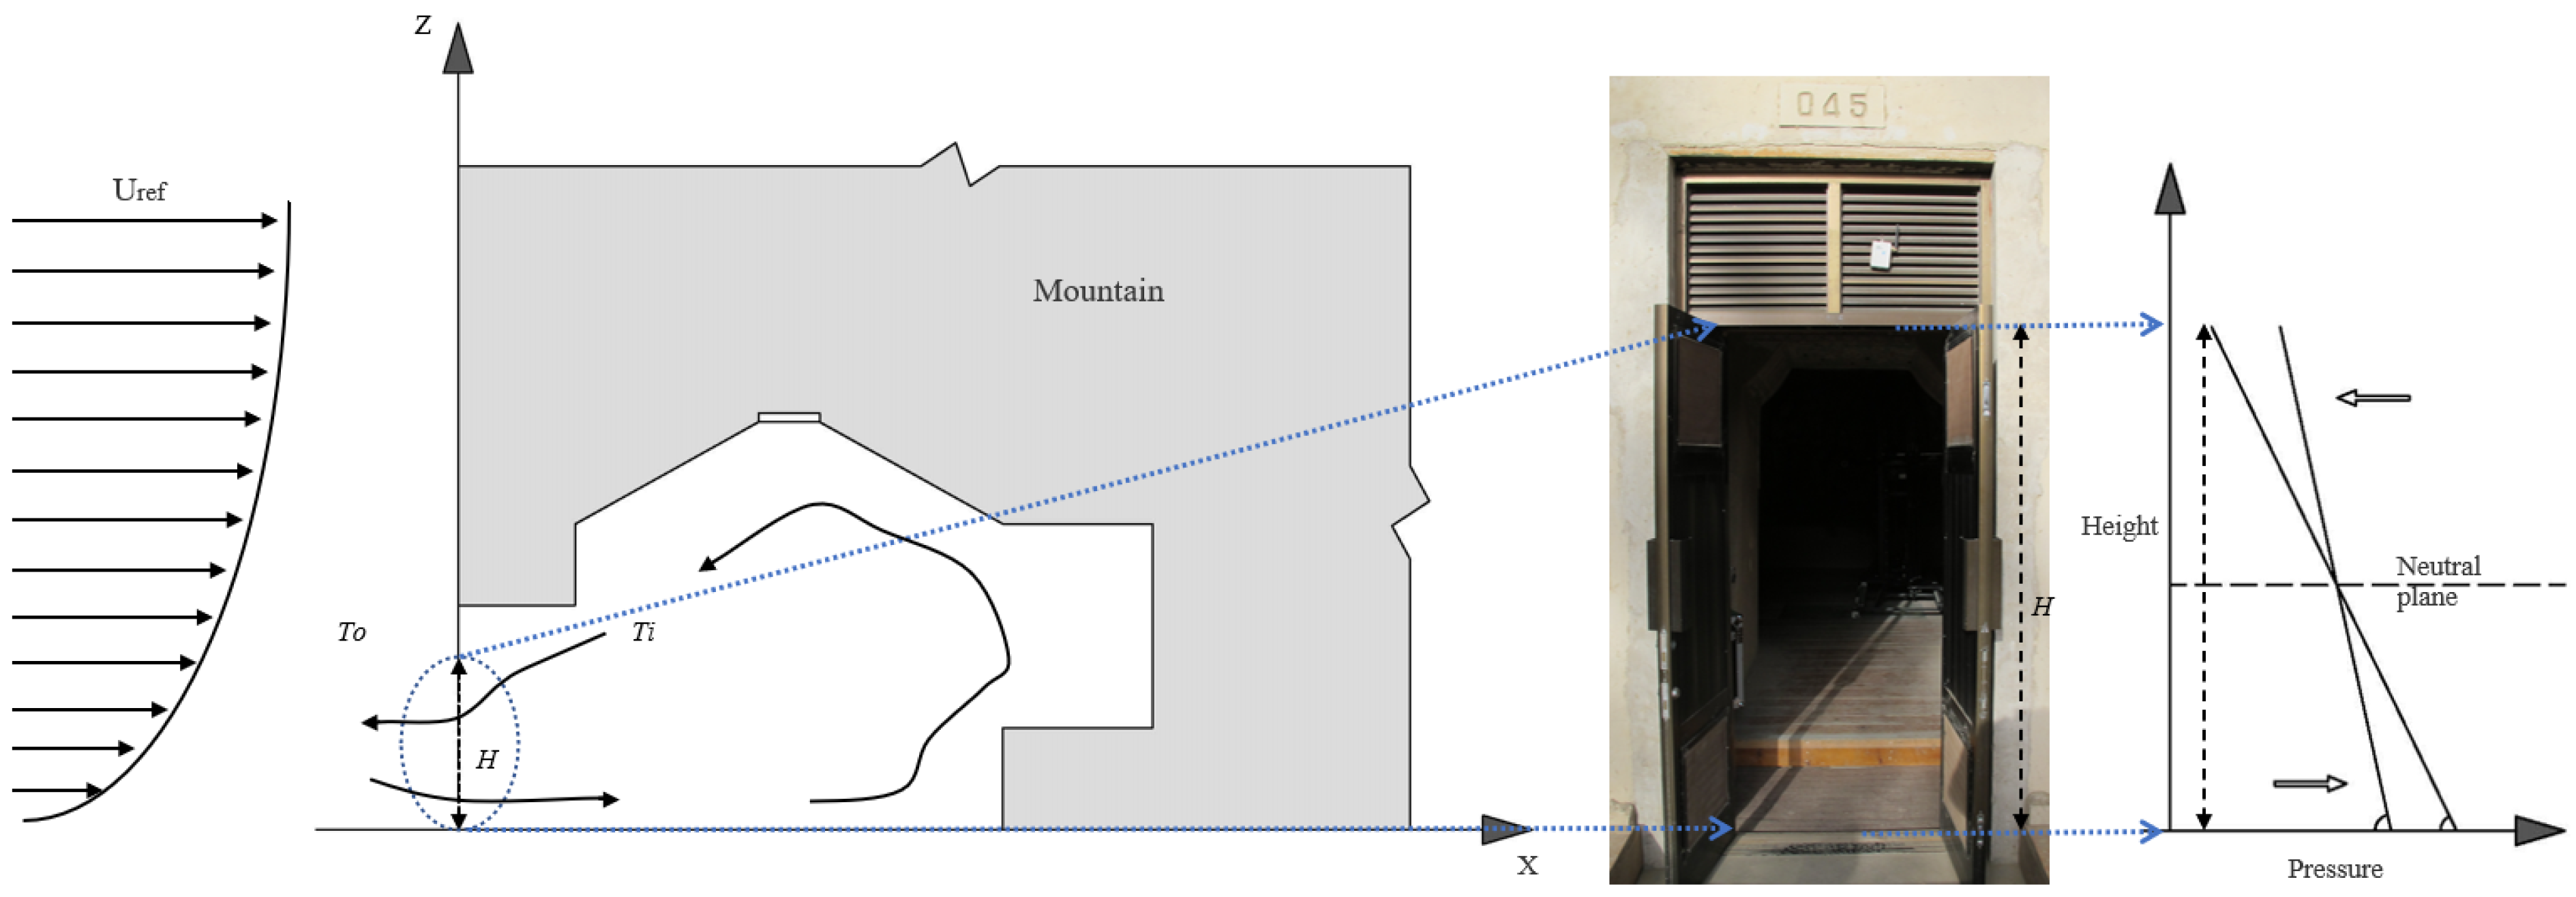
2.2.3. Wind Pressure Coefficient

We did not directly measure the wind pressure coefficient, C p , for a variety of reasons. However, it can be calculated from the measured pressure and wind speed data, as shown in Equation (14):
C p = p 1 2 ρ 0 U r e f 2
where p is the difference between the pressure P c a v e on the central surface of the cave openings and the pressure P r e f on the meteorological station, Pa. P c a v e and P r e f were measured at synchronous positions and times with the wind speed at the entrance to the caves and the weather station, Pa.

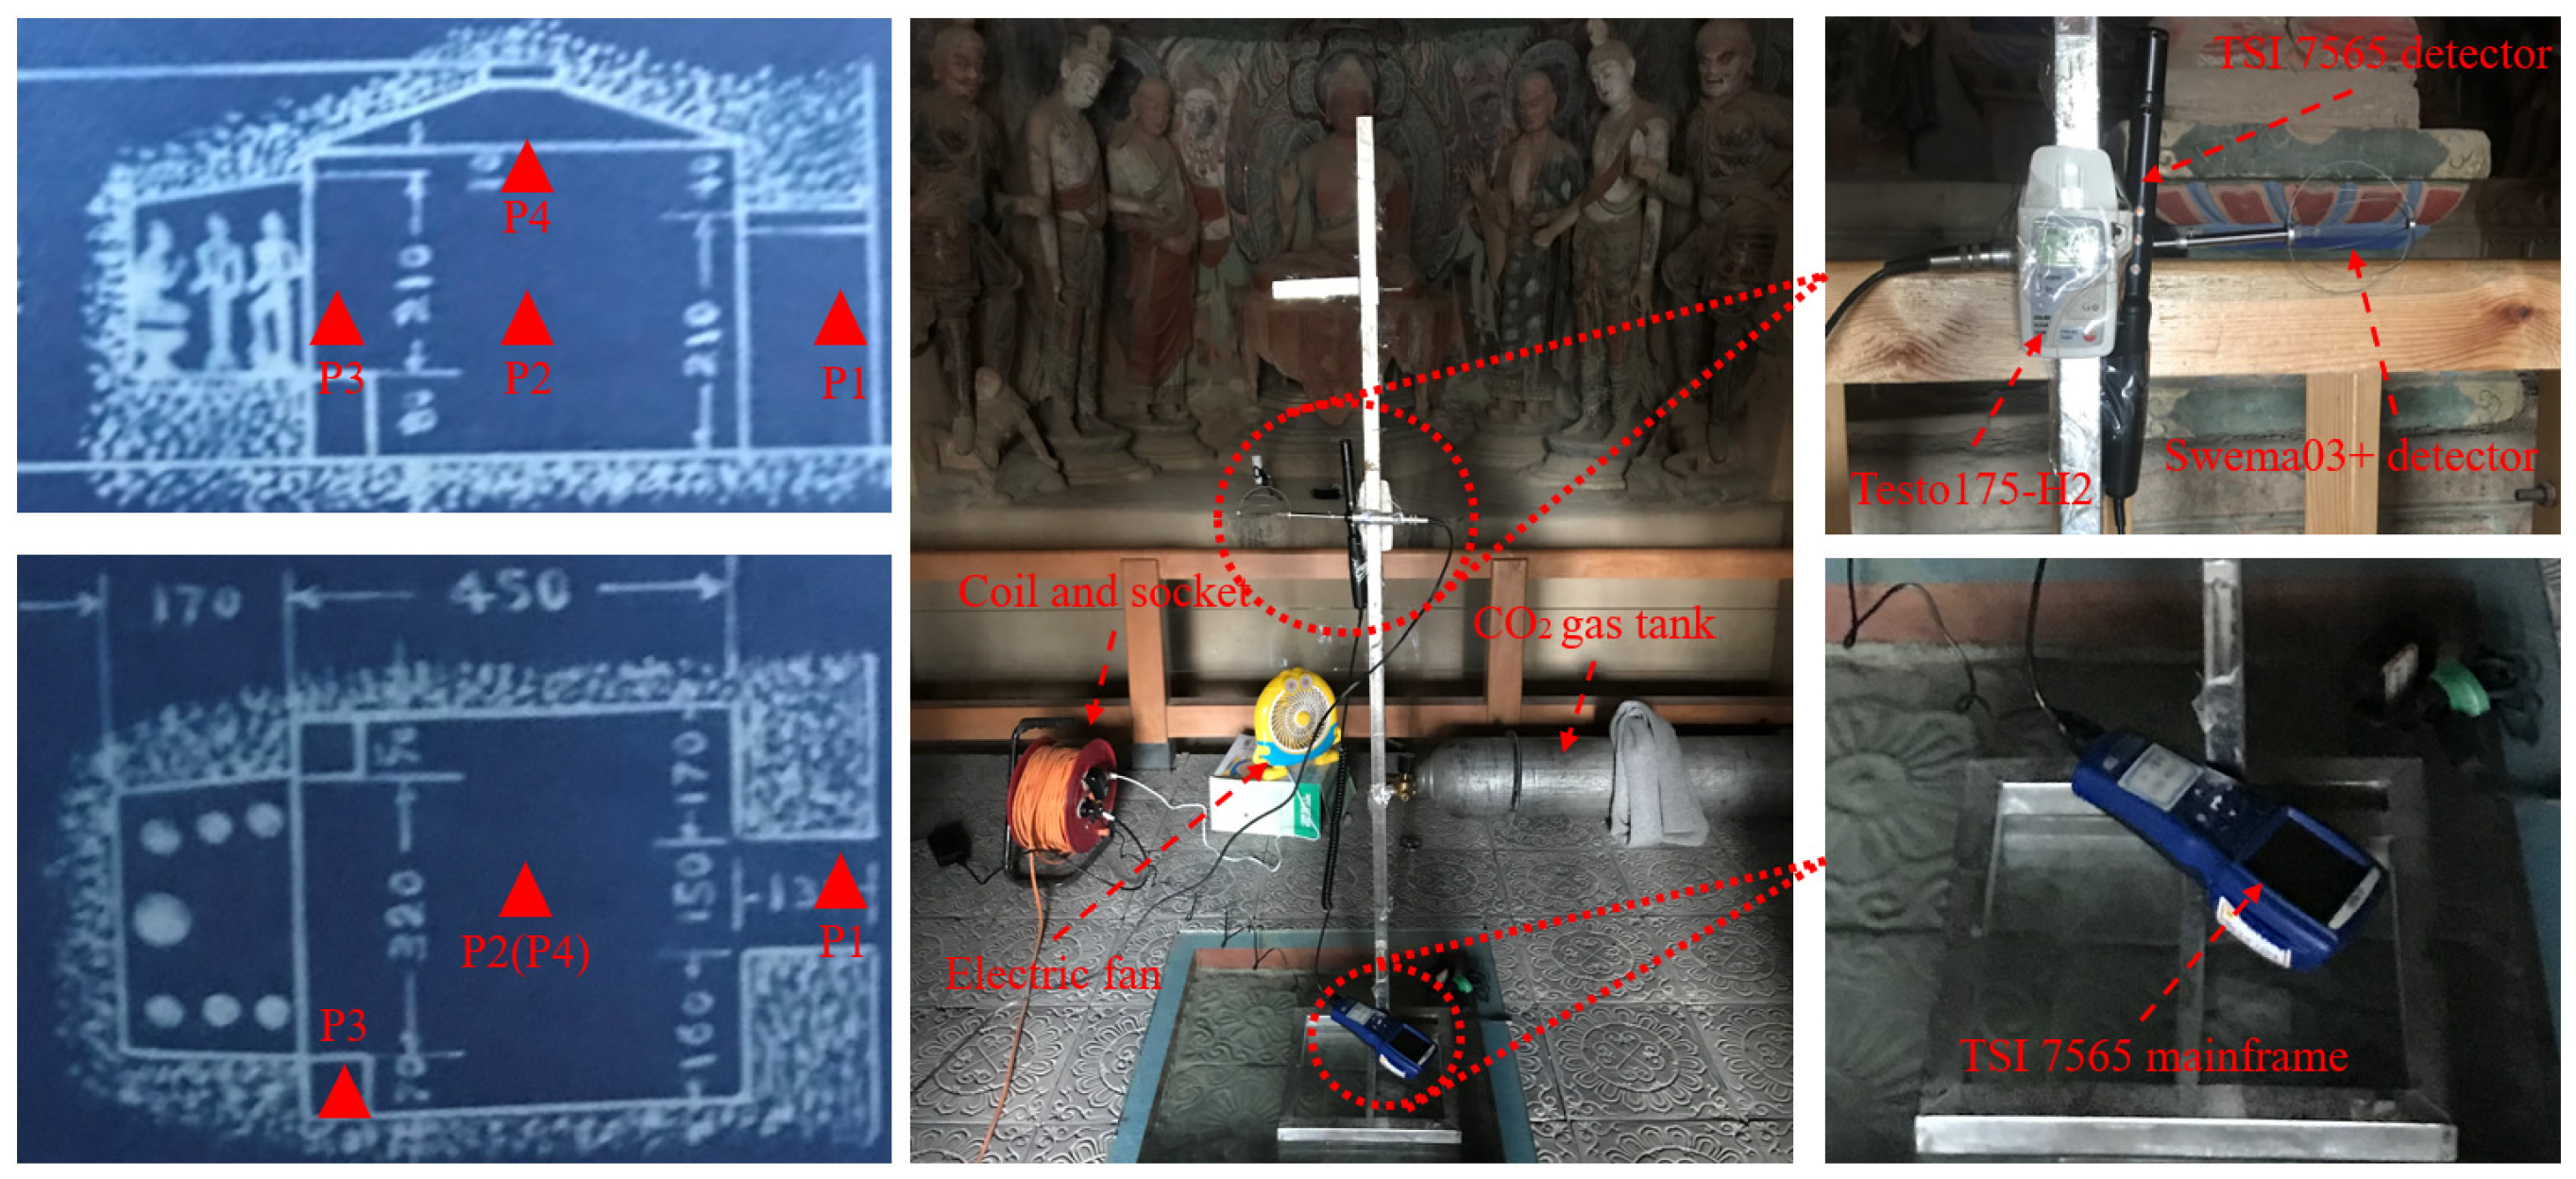
2.2.4. Natural Ventilation Rate

To measure the natural ventilation rate of the cave, experiments were conducted using the tracer gas attenuation method [4,34,42,43,44,45], a mature and widely used method. The experimental process was divided into the following steps. (1) The CO2 concentration tester was installed, the door of the examined cave was opened, the natural ventilation of the cave was maintained, and the initial CO2 value in the cave was tested for 5 min. (2) The door was closed, and the gap in the door was sealed with a plastic sheet. (3) A pressure-reducing valve was installed on the CO2 compression tank, and CO2 tracer gas was released. (4) The fan was opened for 5 min to accelerate the indoor airflow disturbance, so that the CO2 and air were fully and evenly mixed. (5) The door was opened to ensure continuous testing without anyone in the cave. Due to the limitation of the test environments, attenuation tests were carried out in four positions (Figure 3), located at the entrance of the cave (P1), the geometric center of the main chamber (P2 and P4) and the corner (P3), with the aim of observing the CO2 concentration attenuation at different locations. P1, P2 and P3 are 900 mm above the ground, and P4 is 2000 mm above the ground. The instrument parameters are shown in Table 3. The ventilation rate was determined by the method described in the literature [46,47].

3. Results

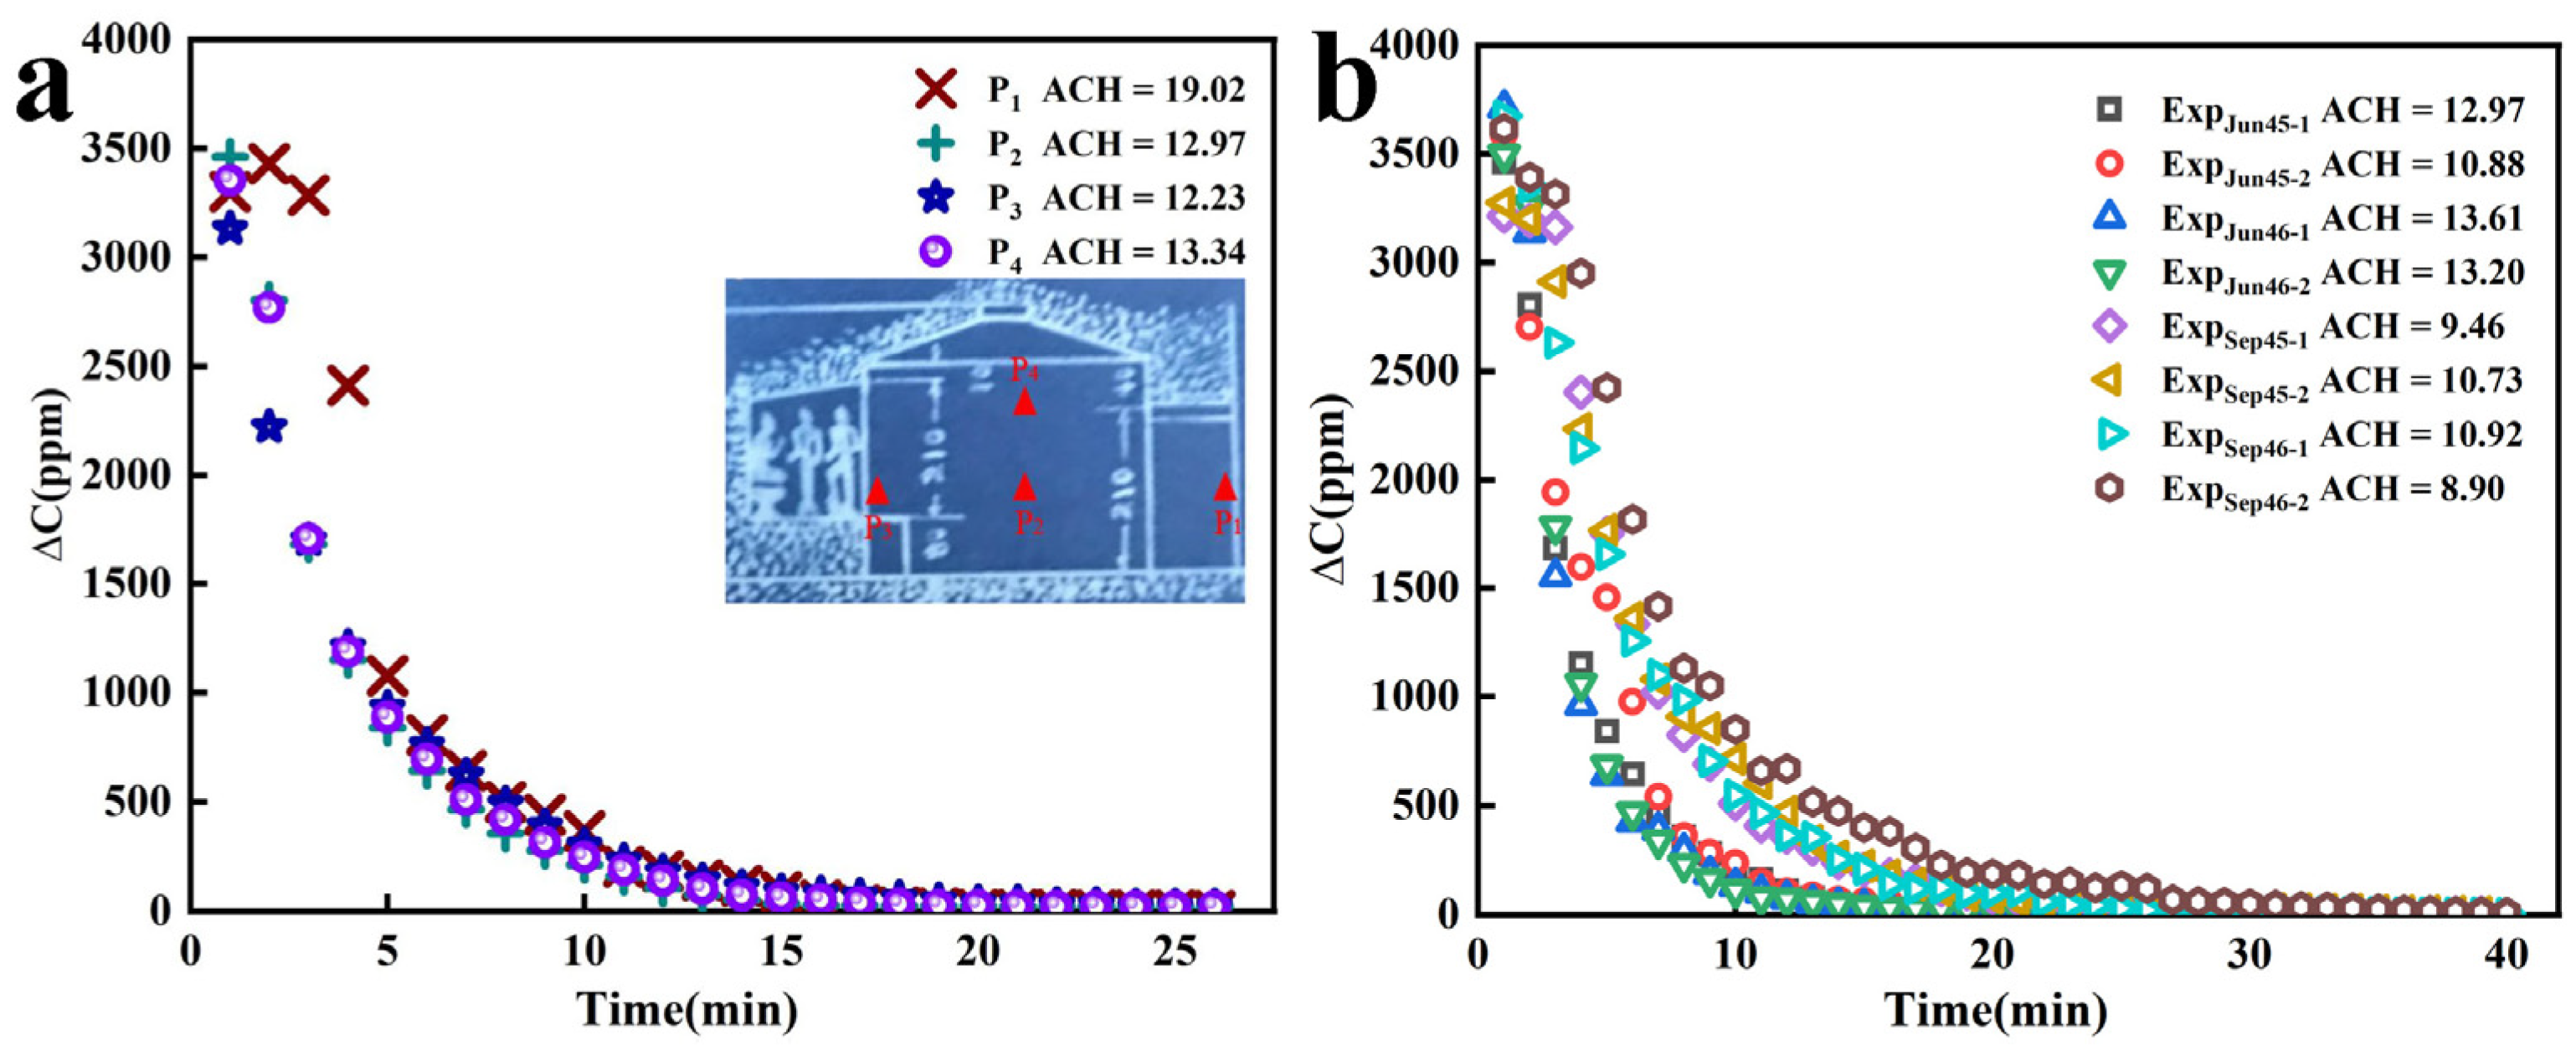
3.1. Analysis of Experimental Results

The Mogao Grottoes are a popular tourist attraction, and cultural relics and environmental protection requirements make it impossible to carry out large-scale experiments in the caves. As a result, eight field experiments were conducted each in January and September, and the relevant test parameters are shown in Table 4.
The Table lists the temperature inside the cave, the temperature outside the cave, the wind speed outside the cave, the wind direction outside the cave and the ventilation rate obtained in each experimental case. The parameters used in the correlation were all average values, so all parameters listed in the Table, except the ventilation rate, were also the experimental average values. In the experiments conducted in January, the temperature in Cave 45 ranged from −6.7 °C to −5.4 °C, the temperature outside the cave ranged from −10.26 °C to −7.83 °C, and the wind angle varied from 192° to 201°. The temperature in Cave 46 ranged from approximately −4.2 °C, the temperature outside the cave ranged from approximately −7.85 °C, and the wind angle was between 341 and 350°. In the experiments conducted in September, the temperature in Cave 45 ranged from 23.5–25.0 °C, the temperature outside the cave was between 24.99 and 26.73 °C, and the wind angle was approximately 25°. The temperature in Cave 46 was between 25.8 and 26.2 °C, the temperature outside the cave was between 27.46 and 28.71 °C, and the wind direction ranged from 8° to 26°. Due to the instability and pulsation characteristics of wind, the wind speeds measured in all experiments fluctuate relatively widely, and the wind speeds measured in all experiments ranged between 1.58 and 4.61 m/s. The caves are carved into the cliff, and the enclosure structures of the caves are very stable. Even without an internal heat source, the temperature fluctuates less inside the caves than outside the caves. Due to terrain and meteorological effects, the wind speed is higher in the morning and evening in this area than at other times of day. In Cave 45, the experiments were conducted in the morning in winter and in the evening in summer. The wind speeds measured in these four cases were higher. In the other cases, the wind speeds were relatively low.
The term T i listed in Table 4 represents the average temperatures obtained among the four measuring points and the experimental results obtained at the locations shown in Figure 3. The air temperature distributions were uneven in the caves due to the large cave depths and the presence of many corners and deformed areas. In January, each measuring point was relatively uniform. The maximum temperature difference was 2.1 °C, and the minimum was 1.7 °C. In September, the maximum temperature difference was 4.0 °C, and the minimum temperature difference was 1.6 °C. Generally, the closer the measuring point was to the cave opening, the greater the measured fluctuation was.
The average wind pressure coefficient of each case was calculated using Equation (14), and the experimentally measured outside wind directions are displayed in Table 5.
The experimental ventilation rate Q m e a was obtained in Section 3.4 using tracer gas attenuation experiments. Figure 4a shows the change in the CO2 concentration attenuation recorded near the cave opening (P1), in the lower zone of the main room (P2), at the back corner of the main room (P3) and in the upper zone of the main room (P4) under the initial experimental conditions of Cave 45 in winter. The ventilation rate (air changes per hour (ACH)) of each measuring point was calculated using the method described in the literature [46]. P1 is directly connected with the outside environment and can be rapidly diluted by the air outside the cave. Therefore, the CO2 concentrations recorded at the measurement point revealed rapid decay, and the data measured at this point were not analyzed in the experiments. Though no wind zone or vortex zone was observed at the back corner of the main room of the cave, the decay rate was relatively slow at this measuring point. The maximum difference in ventilation rates between measuring points P1, P2, P3 and P4 was 5.71%, indicating that the uniformity of the CO2 distribution in the cave was acceptable. Therefore, the data measured at P2 were used to represent the experimental ventilation rate in this paper. Figure 4b shows the tracer gas attenuation curves obtained under the eight cases considered in this study, as well as the ventilation rates obtained during the cave experiments calculated according to the CO2 concentration attenuation.

3.2. Evaluation of Existing Correlations

The existing correlations come from theoretical derivations, full-scale experiments, wind tunnel experiments and numerical simulations. Warren’s equation for wind-driven natural ventilation is an empirical correlation, and its applicability needs further confirmation. Dascalaki et al.’s experiment was carried out in the Test Cell. The experimental boundary conditions were idealized (there was no shelter in front of the opening), and the wind speeds were less than 2 m/s. De Gids and Phaff did not consider the use of a C d value, which is included in U m . This decision makes the accuracy of the calculation dependent on the window type. The temperature difference and wind speed covered a wide range in the Larsen and Heiselberg experiments, which were carried out in the wind tunnel, and the problem was the same as that in Dascalaki. The simulation method has certain limitations, and most of Caciolo et al.’s working conditions were carried out under large temperature differences and high wind speeds; additionally, they also ignored the influence of the wind pressure coefficient and wind direction. The correlation deduced by Pan et al. does not consider the influence of a disturbance on ventilation. Tang et al. ignored the role of wind pressure.
It is shown by our experimental results that the temperature difference is within 5 °C, and the wind speed is basically between 1~5 m/s. There is still a certain gap between the existing correlations and our tests. Overall, their correlations may also have some limitations, and the correlations close to our experimental results will be rewritten and corrected to meet the actual situation in the Mogao Grottoes.

3.3. New Correlation

The purpose of this investigation was to expand upon Tang et al.’s study to provide a suitable correlation prediction method for the natural ventilation rates of caves based on different driving forces containing special relics and to fill the gap in this research field.
Tang’s research is based on Larsen and Heiselberg’s correlation and combined with the actual characteristics of a single-sided natural ventilation experiment in a primary school, focusing on buoyancy and fluctuation and ignoring the effect of wind pressure. The pressure difference inside and outside the opening can be written as Equation (15) [35].
P b u + P f l = ρ 2 T i T o g H T i + C T i T o
where P b u is the pressure difference caused by buoyancy, Pa; P f l is the pressure difference caused by fluctuation, Pa.
Our experiments and related studies [4,5,6,9,10,28,29,48] in recent years show that the wind speed in the Mogao Grottoes is high, so the role of P w i n d needs to be reconsidered in the new correlation. The airflow through the opening is shown in Figure 5.
The correlation proposed herein assumes that the two-way flow through the cave opening is governed by the nonuniform wind pressure distribution along the opening height. The wind pressure on the opening can be described by Equation (16) [49].
P w i = 1 2 C p ρ 0 U 2
The correlation assumes that the environmental wind speed distribution in the Mogao Grottoes meets the power-law function equation (Equation (17)) [50].
U U r e f = α z z r e f γ
where α and γ are topographic parameters that represent the locations of buildings and weather stations, as shown in Table 6. The Mogao Grottoes are backed by mountains and abutted by poplar forests at the opening. This correlation adopts α and γ values of 0.85 and 0.20, respectively.
The wind speed at a neutral plane U ( z 0 ) = 0 . Combining Equations (16) and (17), the wind pressure difference inside and outside of the opening can be rewritten as Equation (18).
P w i = 1 2 C p ρ 0 α z z r e f γ U r e f 2
where P w i is the pressure difference caused by wind pressure, Pa.
Previous research shows that single-sided natural ventilation is caused by wind pressure, buoyancy and fluctuation. The pressure difference inside and outside the opening P can be expressed as Equation (19).
P = P w i + P b u + P f l
Equation (20) is used as the basis for the correlation [35].
Q T = C d A e f f 2 P ρ
A e f f refers to the fact that only half of the opening area in single-sided ventilation is used for the ingoing airflow. Q i n = Q o u t , so A e f f can therefore be replaced by 1 2 A .
Then, combined with Equation (19), Equation (20) can be rewritten as Equation (21).
Q T = 1 2 C d A 2 P w i + P b u + P f l ρ
The physical meaning of the square root is the pressure difference caused by wind, buoyancy and fluctuation. By combining Equations (15), (18) and (21), the ventilation rate correlation can comprehensively consider these factors, as shown in Equation (22).
Q T = 1 2 C d A C p α 2 z 2 γ z r e f 2 γ T i T a v e U r e f 2 + g H T i T o T i + C T i T o
The study of Per Heiselberg et al. [51] revealed that the discharge coefficient is not a constant value and is actually related to the area of the cave opening, window form, indoor–outdoor temperature difference and other factors. However, their study showed that the discharge coefficient value of a cave with a large opening is approximately equal to 0.6. Therefore, the C d value applied in our study was 0.6 [51,52]. α and γ are the terrain parameters in Equation (17). Fitted with the 534 data samples, the empirical constant C was found to be 0.02 [40]. Refer to Section 2 for the physical meaning of the other parameters in the above equations.

3.4. Correlation Verification

Generally, we use the Archimedes number, A r , to preliminarily judge the factors affecting natural ventilation. After the calculations, all eight cases were determined to mainly represent wind-driven natural ventilation.
In order to verify the accuracy of our correlation, Figure 6 shows the experimental ventilation rates and the calculated ventilation rates by Equation (22), in which the parameters are obtained from the experimental test in Section 3. All absolute deviations in the calculations are found from Equation (23) in this paper [35]:
1 n · i = 1 n Q m e a Q c a l Q m e a · 100 %
There is little difference between the experimental result and the calculated result in each case, the maximum deviation occurs in case 6, which is 18.92%, and the minimum deviation occurs in case 1, which is 11.22%. At this time, the wind speed outside the cave is the largest, the wind pressure is more obvious, and the calculated value is closer to the experimental value, which coincides with our conjecture about the driving force. It is worth noting that our correlation overestimates the natural ventilation rate in most cases. Fortunately, the average deviation calculated by the correlation is only 16.35%, which proves its feasibility and reliability.
In transition seasons, the Mogao Grottoes enjoy a low wind velocity and small inside–outside temperature difference. Given that the majority of caves are generally located in the suburbs of cities with complex terrain and lush trees, the hypothesis presented in this paper can be of great value in predicting air change rates for these caves. At the same time, the defect of Tang’s correlation is effectively solved, which is only applicable to the case that the local wind speed U r e f is less than 1 m/s in our equation.
The question of whether our correlation has better reliability than other correlations and higher stability under different environmental parameters will be further verified in Section 5.

4. Discussion

4.1. Comparisons with Existing Correlations

The comparison between the predicted and measured ventilation rates shows that our correlation achieves good performance. However, further research is needed to determine whether the prediction of the natural ventilation rates of single-sided openings in the Mogao Grottoes is superior and advanced when compared with the predictions obtained using existing correlations. Therefore, Figure 7 shows a comparison between the natural ventilation rates predicted by our correlation and other correlations in each case as well as the amount of experimental data points that fall within the zone after setting ±25% as an acceptable deviation range for each prediction.
The correlation proposed by Warren [30] calculates the ventilation rate under wind-driven and buoyancy-driven conditions. The average deviation between the calculated results and the experimental ventilation rates measured in the eight cases was 50.44%, with a minimum difference of 39.44% and a maximum difference of 64.53%. The prediction effect of the Warren correlation on the natural ventilation rates of the studied caves is thus not ideal. Previous studies have verified that Warren’s correlation is advanced in predicting building ventilation rates. The results obtained herein show that the correlation is not very suitable for predicting the ventilation rates of the Mogao Grottoes, which characterize uniquely shaped buildings.
The average deviation of the Dascalaki et al. [32] correlation was 59.39%, which is the same as the verification result in Pan and Tang’s study, which is a high deviation. This high deviation results from the correlation paying more attention to the buoyancy effect and extensively reducing the weight of the inertia effect. In addition, the wind speed was set to 1–5 m/s in Dascalaki’s wind tunnel experiments, indicating high wind speeds. The average annual wind speed in the vicinity of Cave 72 in 2019 was measured at only 1.12 m/s, suggesting that the forest belt and terrain in front of the caves had a great shielding effect, so the actual wind speed entering the caves was much lower than the experimental wind speed considered in Dascalaki’s correlation.
De Gids and Phaff’s [34] correlation comprehensively considered the influences of the temperature difference, wind speed and wave term combined with the air flow conditions. Surprisingly, the average deviation in the ventilation rates predicted by this correlation was 18.61%. However, their correlation ignores the role of C p , and the constants in the equation were obtained from their experimental data without considering wind angles or the sign of T . Obviously, their correlation is not superior to ours, although the deviation was improved compared with the two correlations described above.
Larsen and Heiselberg’s correlation [35,36] comprehensively considers the buoyancy effect and wind pressure effect, as well as the deviation caused by the combined turbulence, temperature difference, wind speed and pressure difference conditions at the opening. The influence of different wind directions is also taken into account in this correlation. The average deviation of the correlation was 20.47%. The deviation of the windward case was 12.28%, that of the parallel case was 25.16%, and that of the leeward case was 25.72%. In a few cases, the deviations were very significant. A possible reason is that their data did not fully cover our cases, and the values of f θ 2 , C p and C p determined by consulting the chart may have been the cause of these deviations.
The correlation proposed by Caciolo et al. [37] for predicting single-sided natural ventilation rates defines the effective air temperature difference, T ˙ , to correct the influence of the wind speed on the ventilation rate. The average deviation of this correlation was 25.61% for our eight cases. In particular, the deviations of several cases are even less than 10%. Unfortunately, the deviation of the seventh case is as high as 65.13%, and the difference between the maximum deviation and the minimum deviation is more than 55%. Therefore, the results of their correlation are not stable enough.
The average deviation in the outputs of Pan et al.’s correlation [39] was 26.18%. The buoyancy effect played a leading role in most of their cases, whereas the wind pressure effect played a leading role in the cases considered herein. Comparing the results of the eight cases, it is found that the prediction deviation in the case of a small wind speed is smaller. The effect of buoyancy increases gradually, which is close to the actual situation of their correlation.
Tang et al.’s [40] correlation performed best among all correlations, with an average deviation of 17.85%, compared with our correlation with 16.35% deviation. The reason for this result is that the Tang experiment was performed under similar weather conditions to the actual situation of our experimental caves, and our correlation develops from their correlation and uses their empirical correlation coefficient directly. Therefore, such good performance should not be surprising. In addition, their correlation ignores the effect of wind pressure. Nevertheless, our correlation’s performance is no poorer than that of theirs.
The ASHRAE [53] estimation method considers the empirical air buoyancy and vertical wind direction formulas when calculating the total air permeability through the opening and then estimates the air flow rate, as shown in Equation (24).
Q = A a T + b U r e f 2
where a and b are the thermal pressure coefficient and wind pressure coefficient, respectively.
a = 0.00188 was selected for a one-story building, and b = 0.00135 was selected for a one-story, grade IV shelter, respectively. The average deviation obtained for our case using these values was only 41.58%. The accuracy of this correlation completely depends on the rationality of the a and b values.
In addition, Table 7 summarizes the minimum, maximum and average absolute deviation of the calculated natural ventilation rate by each correlation.
Compared with the experimentally measured ventilation rates, the average deviation in our correlation outputs was 16.35%, which was lower than that of De Gids and Phaff’s and Tang’s correlation and far better than the deviations obtained for other correlations. Some correlations perform well using the experimental data of these authors but have relatively large deviations when our experimental data are input. This does not mean that the correlations are deficient or flawed, but instead suggests the differences and complexity of the natural ventilation of the Mogao Grottoes compared with the natural ventilation of rooms in general civil buildings; this was also the original motivation for finding a suitable correlation for predicting the natural ventilation rate of the Mogao Grottoes.

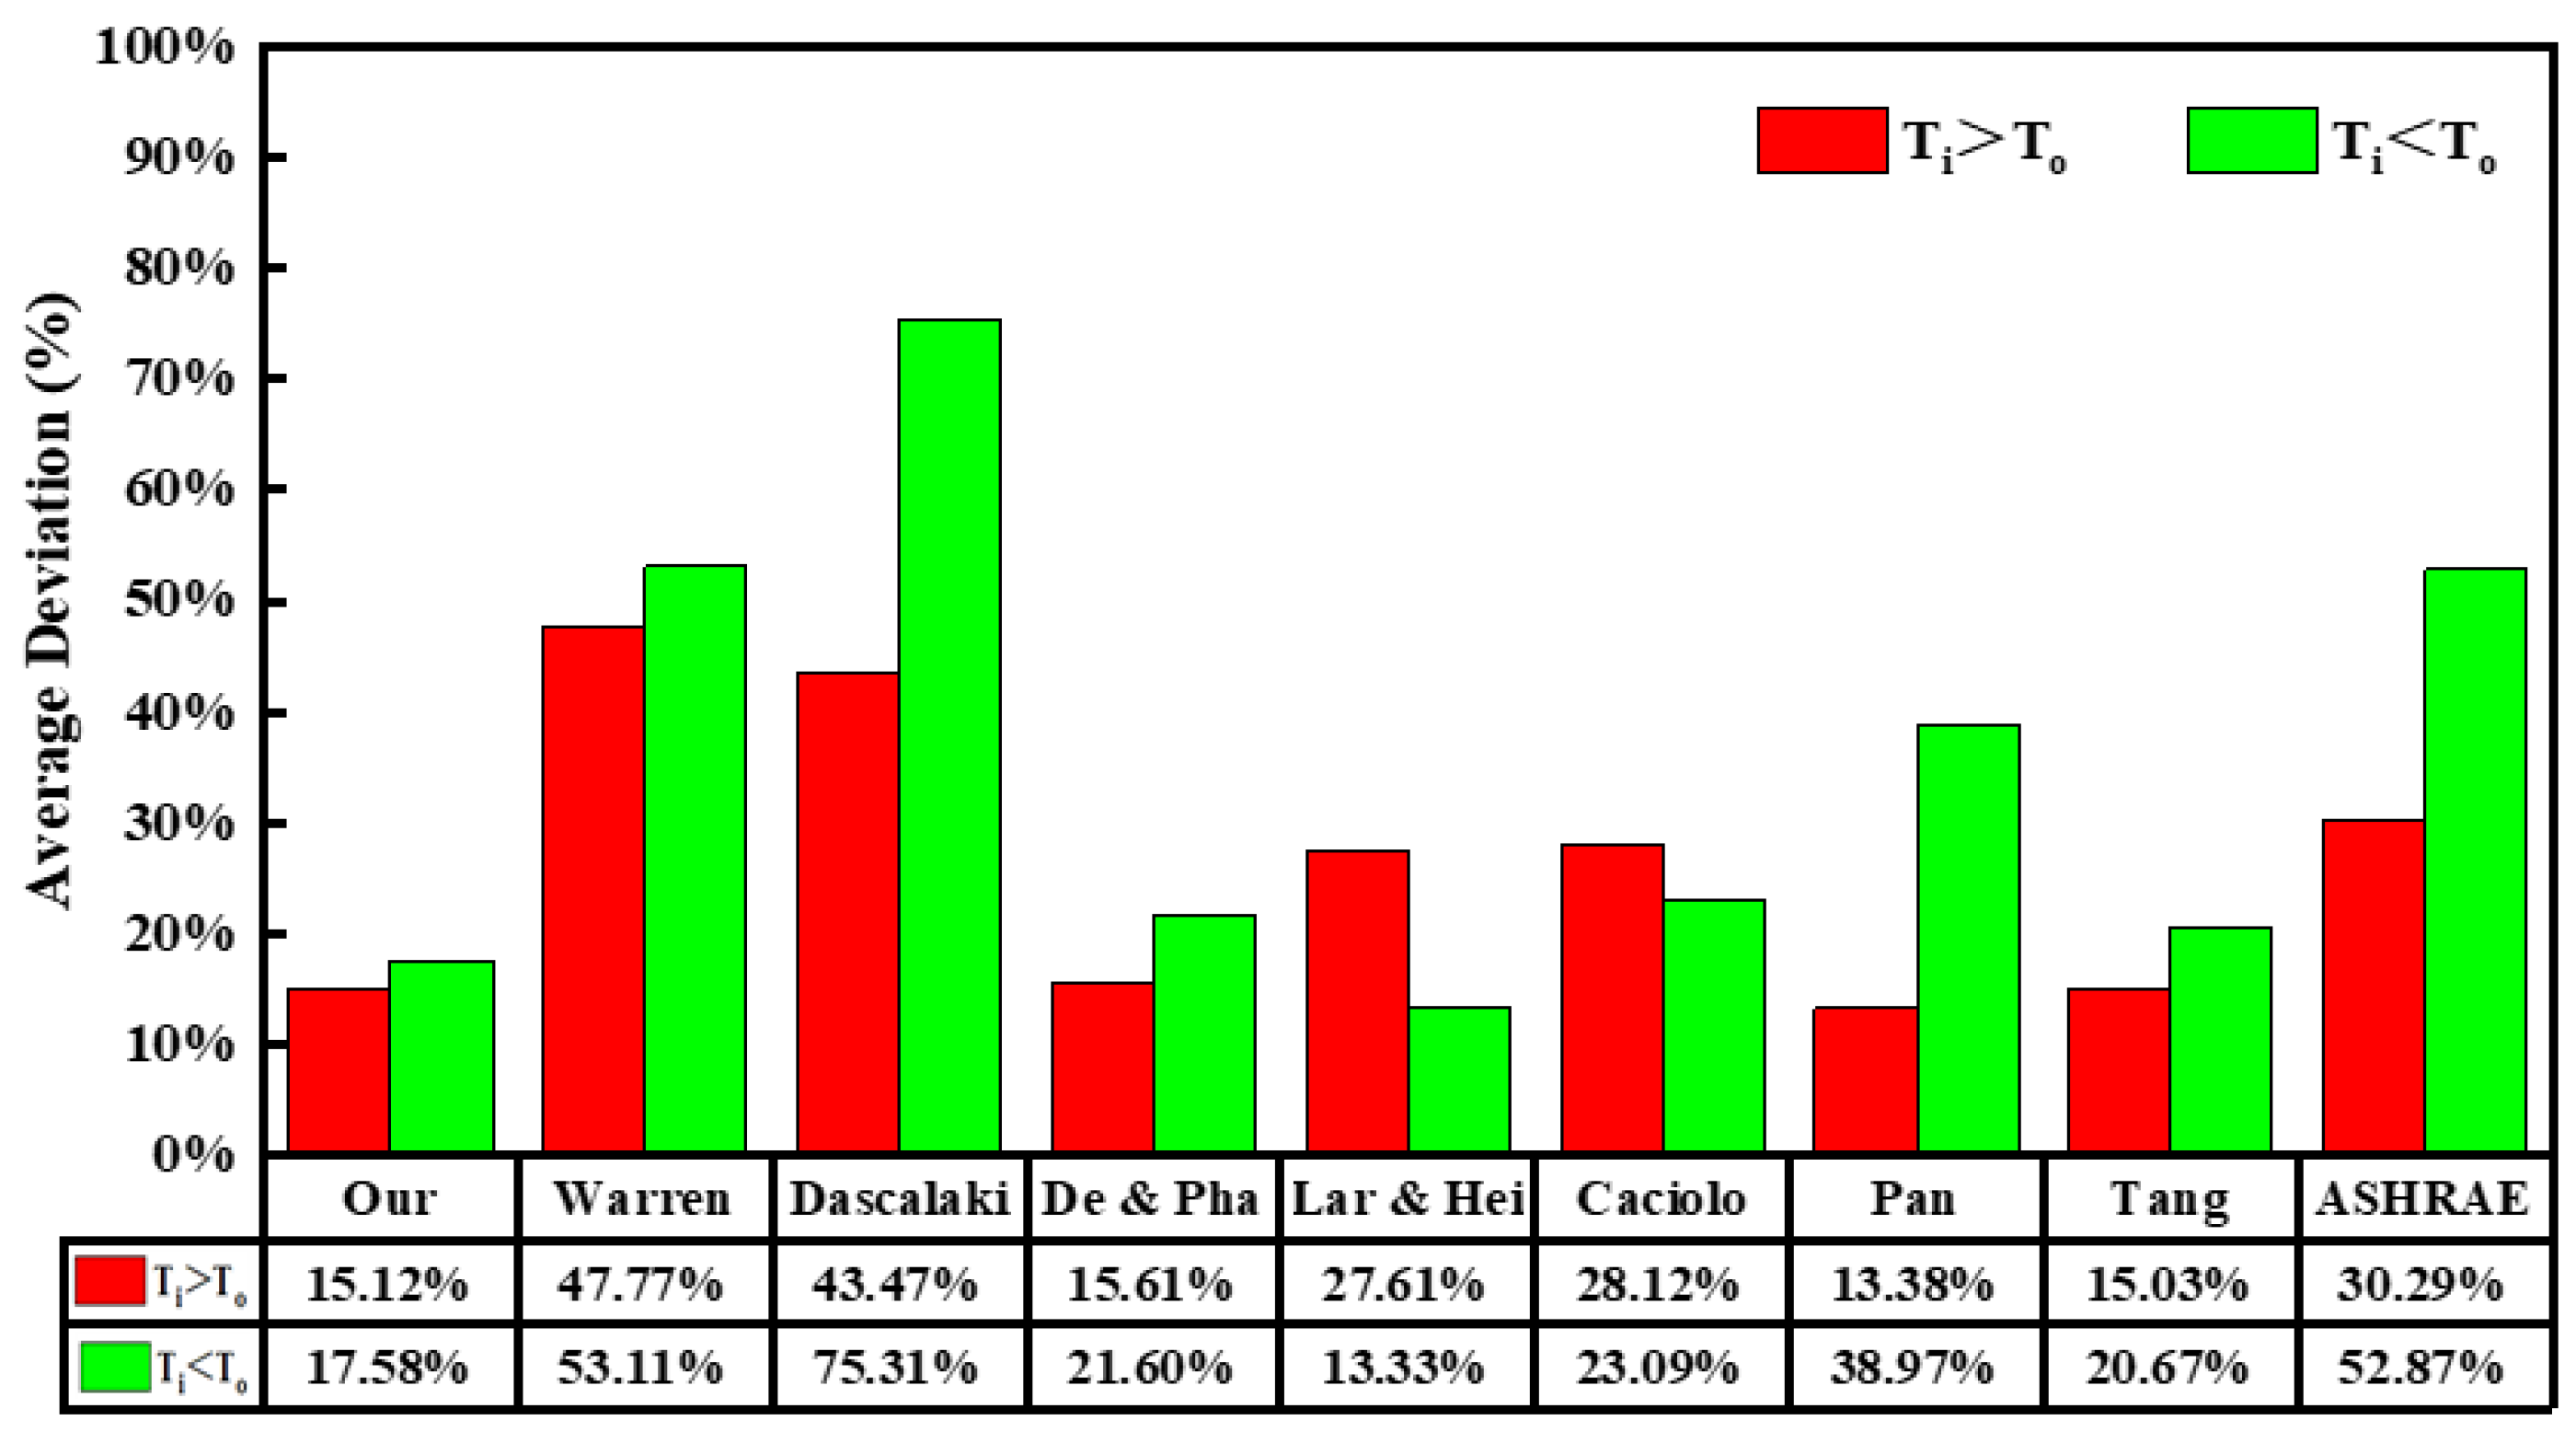
4.2. Stability Analysis

4.2.1. Temperature Inside and Outside the Cave

The correlations found in our paper did not emphasize the significance of the sign in the inside and outside temperature difference T . Since our experiments were carried out in January and September, T i T o will have signs. Our correlation considered the sign of T , which could be important for the interaction between wind and buoyancy.
The average deviations of our correlation outputs and of the outputs of other correlations were arranged according to the air temperatures inside and outside the cave, as shown in Figure 8. The average deviations in our correlation outputs were 15.12% when T i > T o and 17.58% when T i < T o , and the difference between these two deviations is very small. The average deviations of Warren, De Gids and Phaff, Caciolo and Tang’s correlation were approximately 5%. Most of the existing correlations consider the inside temperature to be higher than the outside temperature [34,35,36,37,38,39,40,41]. Therefore, these correlations from Warren, Dascalaki, De Gids and Phaff, Pan, Tang and ASHRAE performed better with T i > T o than with T i < T o for our cases. Our correlation could effectively reduce the deviations caused by the sign of T .

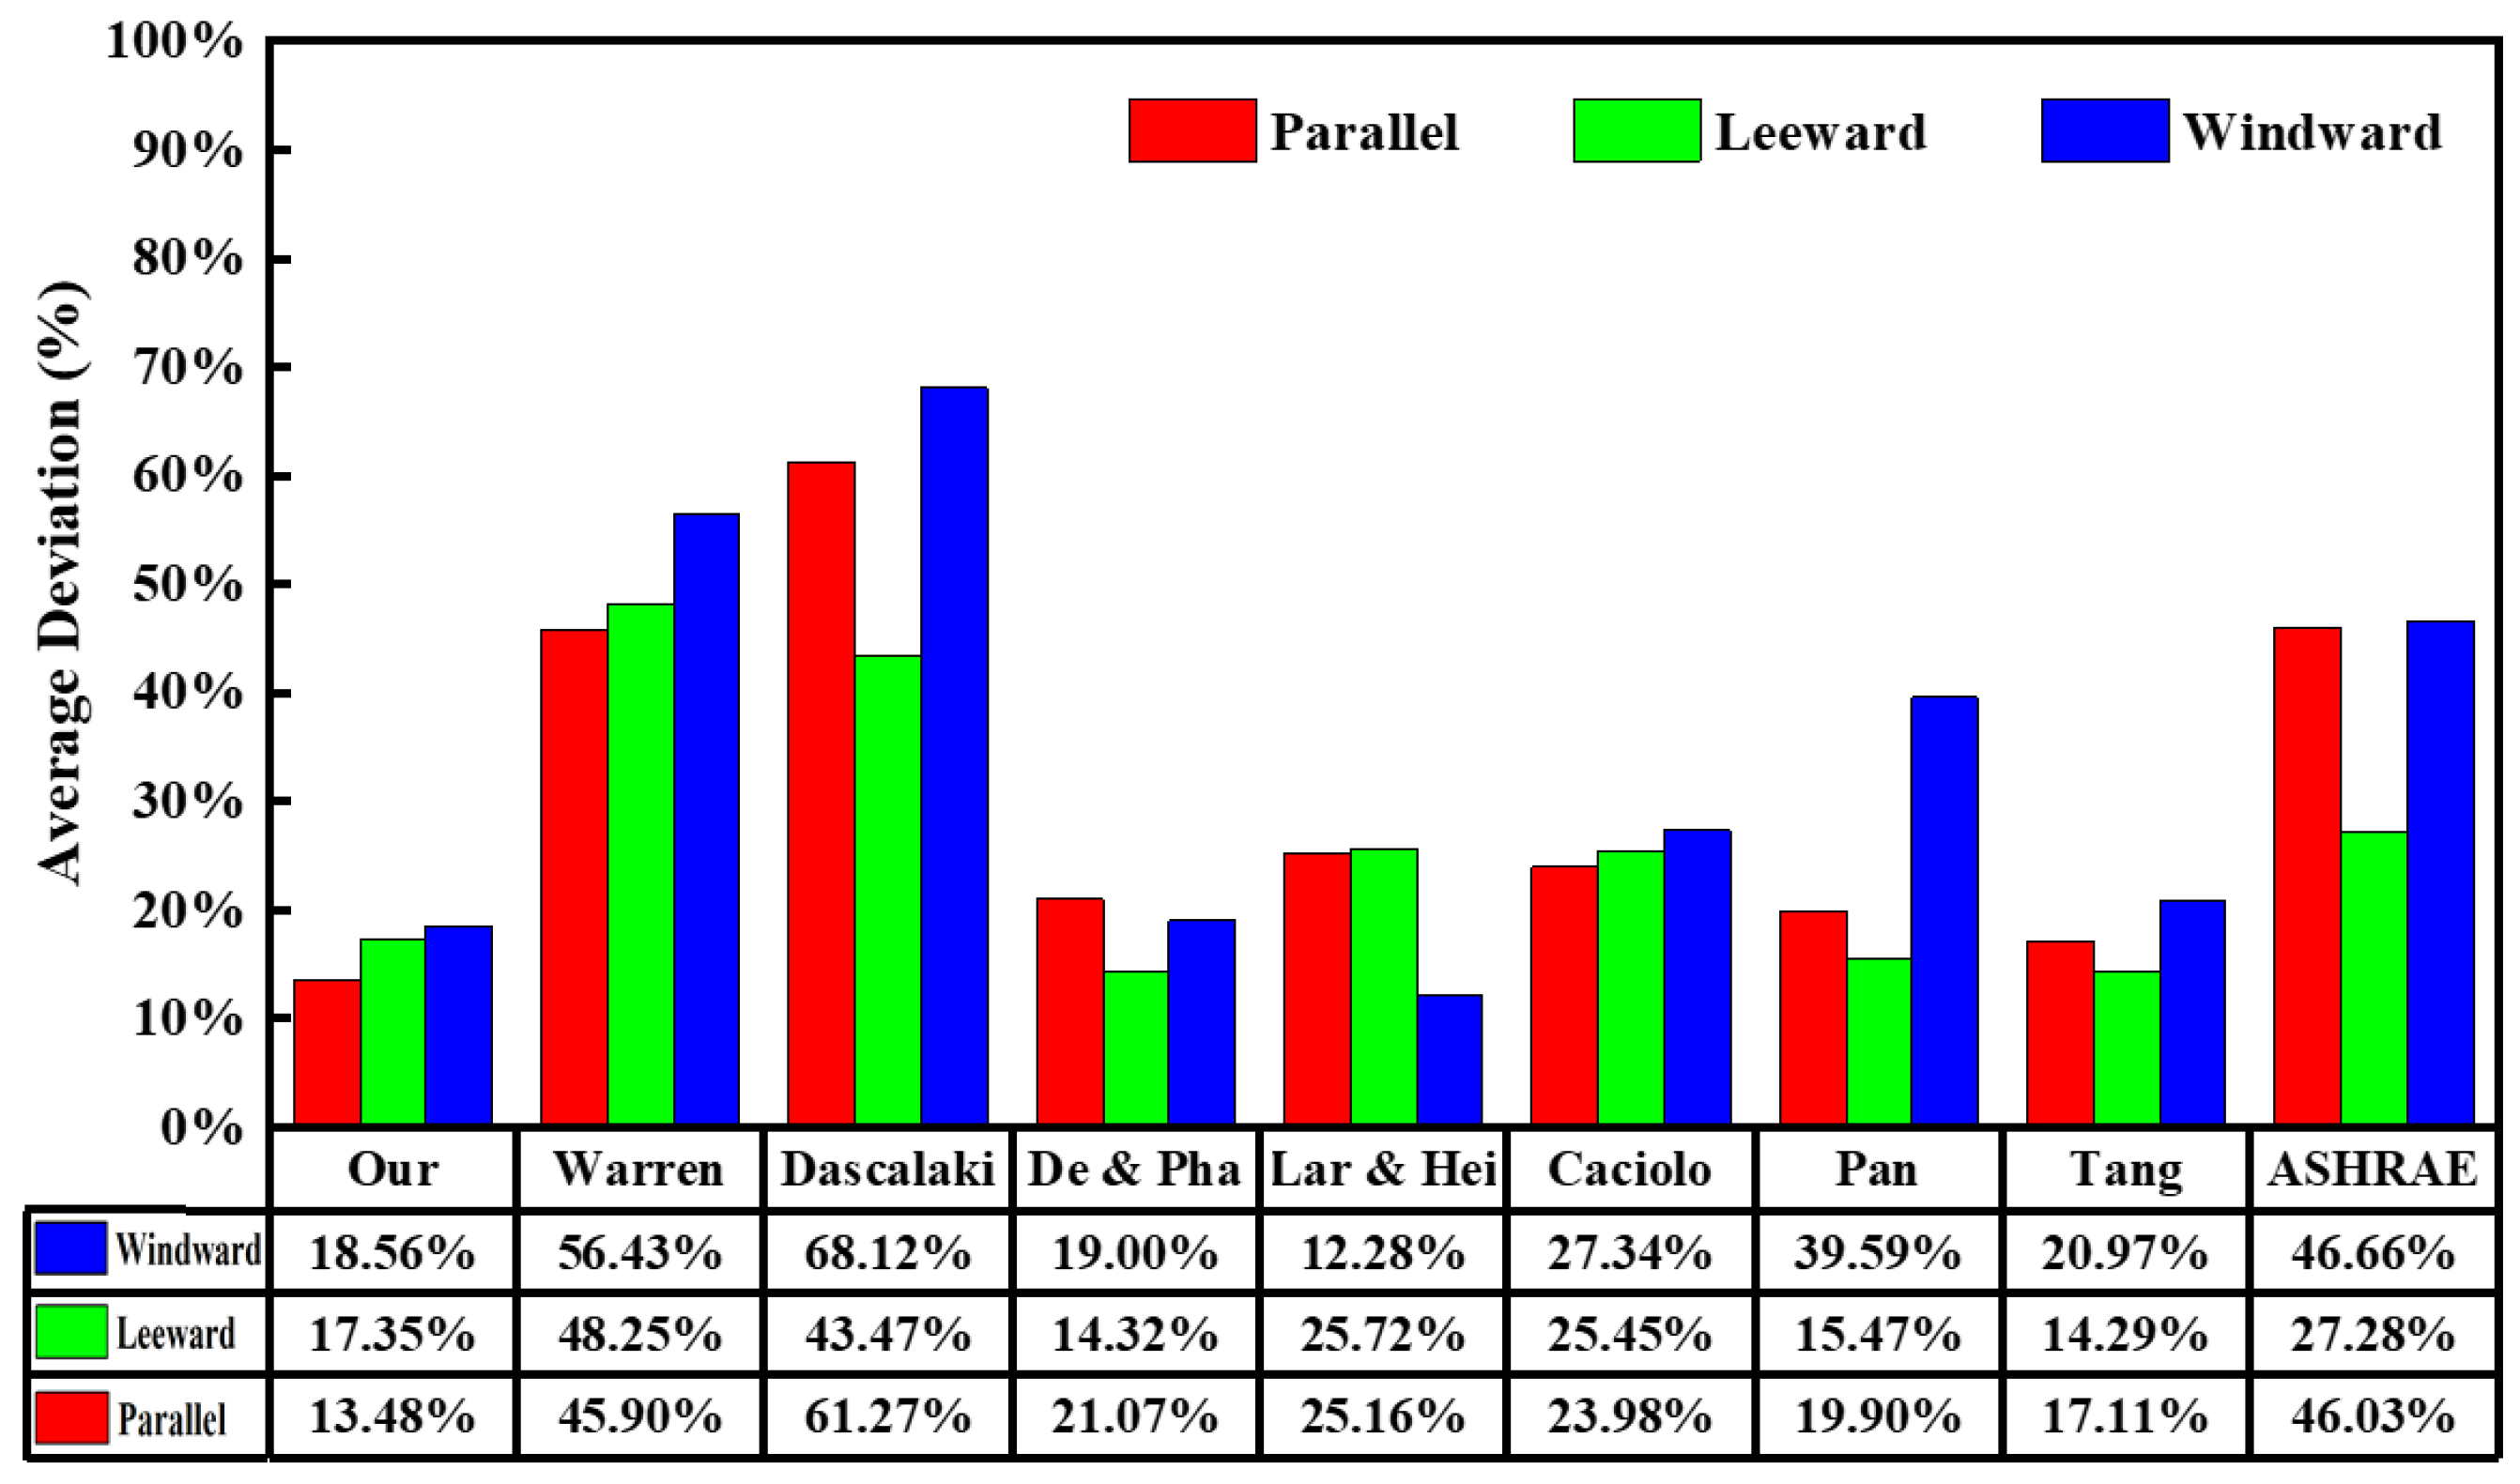
4.2.2. Wind Direction Outside the Cave

According to the orientation of the cave and its opening, the experimental wind directions outside the cave were divided into windward, parallel and leeward directions, as listed in Table 8.
According to Table 8, all cases were divided into parallel, leeward or windward conditions, as shown in Figure 9, and the average deviations of our correlation outputs under these three conditions were found to be 13.48%, 17.35% and 18.56%, respectively. Our correlation thus performs best under parallel conditions, but the overall difference is not large. In addition, the correlations of Warren, De Gids and Phaff, Caciolo and Tang were also stable under our input data. The correlations of Warren and Caciolo performed better under parallel conditions than under windward or leeward conditions, and these results were similar to those obtained for our correlation. Unexpectedly, Dascalaki, De Gid and Phaff, Pan and Tang’s correlations performed best under leeward conditions. Among correlations with defined wind directions, Pan’s correlation had an average deviation of 19.90% in the parallel case, a deviation of 15.47% in the leeward case and the worst performance of 39.59% in the windward case. These overall trends were basically consistent with the authors’ own case results. In the literature, the correlation proposed by Larsen and Heiselberg obtained output deviations of 18% under parallel conditions, 19% under leeward conditions and 28% under windward conditions; these results are contrary to the results verified by our cases. A possible reason for these contrasting results is that our cases were mainly affected by the wind pressure, whereas their cases covered a wider range of conditions, resulting in a relatively large value deviation in the value of the wind pressure coefficient.
The above results show that the between-case deviations predicted by our correlation were small. Moreover, our correlation can more accurately predict the natural ventilation rates of the Mogao Grottoes and other cave sites than other correlations, with high reliability and stability.

4.3. Verification of Cave 328

Wang [4,48] conducted experiments, evaluated a mechanical ventilation system in Cave 328, a medium-sized cave, and tested the natural ventilation rate of the cave in February 2015, as shown in Figure 10.
Their experimental results, as shown in Table 9, reveal that the natural ventilation rate in Cave 328 was 3.21 h−1, i.e., 0.123 m3/s. The ventilation rate calculated by inputting this test data into our correlation was 0.151 m3/s, with a deviation of 22.46%. From the comparison of the results, our correlation is still widely applicable for predicting natural ventilation rates.

5. Conclusions

Our research can effectively solve the prediction and calculation processes of the natural ventilation rates of the Mogao Grottoes and other cave sites. The accuracy and reliability of our correlation were verified by field experiments in Cave 45 and Cave 46, and the following conclusions were drawn.
1.
A correlation is established for calculating natural ventilation rates in cave sites, which considers wind-driven, buoyancy-driven and fluctuation-driven effects. The correlation is verified by comparison with measured data and shows an average deviation of 16.35%, a maximum deviation of 18.92% and a minimum deviation of 11.22% for eight experimental cases.
2.
Our correlation is found to be more accurate than eight other existing correlations selected from the literature, with average deviations ranging from 17.85% to 59.39%. Our correlation outperforms other correlations in predicting natural ventilation rates of caves, and its reliability is demonstrated through consistent and small deviations across individual cases.
3.
Our correlation has the advantage of reducing the impact of temperature differences, wind speeds and wind direction changes on natural ventilation rates. The deviations in ventilation rates under different temperature differences and wind directions are only 2.46% and 5.08%, respectively.
4.
Our correlation is applicable to other types and sizes of caves, as demonstrated by the 22.46% deviation obtained between the results calculated using our correlation and the measured natural ventilation rates in Cave 328. This suggests that our correlation has high popularization value.
The correlation developed in this paper provides theoretical support and a scientific method for predicting the natural ventilation rates of cave sites and offers a quantitative method for analyzing natural ventilation. Finally, the preventive protection of cultural heritage artifacts can be realized using the correlation proposed herein. This research could also be extended for conservation applications in other cave sites along the Silk Road, such as the Maijishan Grottoes, the Binglingsi Grottoes, the Yungang Grottoes, and the Yulin Grottoes.
In this study, the natural ventilation rate was found to be relatively low, and the CO2 concentration often exceeds the threshold when there are a large number of visitors. Therefore, it is recommended to control the opening time and reception duration of the open caves, and at the same time, to consider implementing some active measures to enhance ventilation effectiveness, such as mechanical air supply systems.
In future research, we plan to expand on passive protection and conduct further research on natural protection, as well as on the coupling of heat, humidity, wind and salt fields to comprehensively improve the basic research on the physical environment of the Mogao Grottoes.

Author Contributions

Conceptualization, J.Z. and Z.Y.; Methodology, J.Z. and Z.Y.; Validation, J.Z.; Resources, Z.Z.; Data curation, Z.Z., W.B. and S.Y.; Writing—original draft, J.Z.; Supervision, W.B. and S.Y.; Funding acquisition, Z.Y. All authors have read and agreed to the published version of the manuscript.

Funding

This research was funded by National Natural Science Foundation of China, grant Nos. 51378412, 51978554 and 52208037.

Data Availability Statement

Data will be made available on request.

Acknowledgments

Thank you to my girlfriend Lele Xue for her support and encouragement. We thank Dengchao Zhang, Baofa Zhou, Junqi Zhang and Junpei Sa of Xi’an University of Architecture and Technology and Wangbing Lin of Dunhuang Research Institute for their help during the experiments.

Conflicts of Interest

The authors declare that they have no conflict of interest or personal relationships that could have appeared to influence the work reported in this paper.

References

  1. Fan, J.S. The protection and management of the Mogao Grottoes in Dunhuang. Dunhuang Res. 2000, 1, 1–9. [Google Scholar]
  2. Li, Z.X. The protection of the Dunhuang Grottoes and its tasks. Dunhuang Res. 2000, 1, 10–23. [Google Scholar]
  3. Yang, S.L.; Wang, X.D.; Guo, Q.L.; Zhao, L.Y.; Lin, Q.T. Preliminary analysis of moisture distribution in cliff rocks of the Mogao Grottoes in Dunhuang. Hydrogeol. Eng. Geol. 2009, 36, 94–97. [Google Scholar]
  4. Wang, J.L.; Yan, Z.F.; Wang, X.D.; Zhang, Z.M.; Shang, R.H.; Bi, W.B. Experimental research on mechanical ventilation system for Cave 328 in Mogao Grottoes, Dunhuang, China. Energy Build. 2016, 130, 692–696. [Google Scholar] [CrossRef]
  5. Wang, J.L.; Yan, Z.F.; Wang, X.D.; Zhang, Z.M.; Shang, R.H.; Xu, J.T.; Gao, W.Q. Test research on the natural ventilation of the Mogao Grottoes. Dunhuang Res. 2015, 4, 121–126. [Google Scholar]
  6. Wang, J.L.; Yan, Z.F.; Wang, X.D.; Zhang, Z.M.; Shang, R.H.; Bi, W.B. Experimental research on natural ventilation of the Mogao Grottoes in Dunhuang. Xi’an Univ. Arch. Technol. 2015, 47, 712–716. [Google Scholar]
  7. Li, Z.X. Sixty years of the Dunhuang Grottoes protection. Dunhuang Res. 2004, 3, 10–26. [Google Scholar]
  8. Wang, Y.J.; Zhang, Y.J.; Guo, Q.L.; Yang, S.L.; Zhang, G.B. Characteristics of temperature and relative humidity of Cave 87 in Mogao Grottoes. J. Lanzhou Univ. 2014, 50, 1–6. [Google Scholar]
  9. Guo, J.; Zheng, Q.P.; Zhang, C.T. The Design and CFD Simulation of the Mogao Grottoes Micro Environment Control System. Discuss. Commun. 2015, 4, 27–30. [Google Scholar]
  10. Wang, J.L.; Yan, Z.F. The environmental control equipment system of the Mogao Caves under heavy rainfall. Archit. Cult. 2014, 3, 58–62. [Google Scholar]
  11. Zhong, W.Z.; Xiao, W.; Zhang, T. Numerical Investigations on Natural Ventilation in Atria of China’s Southern Yangtze Vernacular Dwellings. Sustain. Cities Soc. 2023, 89, 104341. [Google Scholar] [CrossRef]
  12. Ziarani, N.N.; Cook, M.J.; Freidooni, F.; O’Sullivan, P.D. The role of near-façade flow in wind-dominant single-sided natural ventilation for an isolated three-storey building: An LES study. Build. Environ. 2023, 235, 110210. [Google Scholar] [CrossRef]
  13. Xie, M.J.; Wang, Y.R.; Liu, Z.X.; Zhang, G.Q. Effect of the location pattern of rural residential buildings on natural ventilation in mountainous terrain of central China. J. Clean. Prod. 2022, 340, 130837. [Google Scholar] [CrossRef]
  14. Yi, Y.K.; Anis, M.; Jang, K.; Kim, Y.J. Application of machine learning (ML) and genetic algorithm (GA) to optimize window wing wall design for natural ventilation. J. Build. Eng. 2023, 68, 106218. [Google Scholar] [CrossRef]
  15. Li, H.; Li, A.; Hou, Y.C.; Zhang, C.; Guo, J.N.; Li, J.X.; Ma, Y.Q.; Wang, T.Q.; Yin, Y.F. Analysis of Heat and Humidity in Single-Slope Greenhouses with Natural Ventilation. Buildings 2023, 13, 606. [Google Scholar] [CrossRef]
  16. de la Hoz-Torres, M.L.; Aguilar, A.J.; Costa, N.; Arezes, P.; Ruiz, D.P.; Martinez-Aires, M.D. Predictive Model of Clothing Insulation in Naturally Ventilated Educational Buildings. Buildings 2023, 13, 1002. [Google Scholar] [CrossRef]
  17. Bramiana, C.N.; Aminuddin, A.M.R.; Ismail, M.A.; Widiastuti, R.; Pramesti, P.U. The Effect of Window Placement on Natural Ventilation Capability in a Jakarta High-Rise Building Unit. Buildings 2023, 13, 1141. [Google Scholar] [CrossRef]
  18. Surendran, V.M.; Irulappan, C.; Jeyasingh, V.; Ramalingam, V. Thermal Performance Assessment of Envelope Retrofits for Existing School Buildings in a Hot–Humid Climate: A Case Study in Chennai, India. Buildings 2023, 13, 1103. [Google Scholar] [CrossRef]
  19. Austin, M.C.; Bouzouidja, R.; Bruneau, D.; Sempey, A.; Wu, T.T.V.; Mora, L. Experimental Evidence of the Coupling between the Energy Charge–Discharge and Natural Ventilation in a Full-Scale Passive Building. Buildings 2023, 13, 632. [Google Scholar] [CrossRef]
  20. Zoure, A.N.; Genovese, P.V. Implementing natural ventilation and daylighting strategies for thermal comfort and energy efficiency in office buildings in Burkina Faso. Energy Rep. 2023, 9, 3319–3342. [Google Scholar] [CrossRef]
  21. Chu, C.-R.; Su, Z.-Y. Natural ventilation design for underground parking garages. Build. Environ. 2023, 227, 109784. [Google Scholar] [CrossRef]
  22. Li, C.; Chen, Y. A multi-factor optimization method based on thermal comfort for building energy performance with natural ventilation. Energy Build. 2023, 285, 112893. [Google Scholar] [CrossRef]
  23. Sung, H.J.; Kim, S.H.; Kim, H. Analysis of Building Retrofit, Ventilation, and Filtration Measures for Indoor Air Quality in a Real School Context: A Case Study in Korea. Buildings 2023, 13, 1033. [Google Scholar] [CrossRef]
  24. Li, L.S.; Du, J.G.; Liu, H.L.; Chen, R.H.; Liu, T. Dynamic characteristics and seismic responses of painted sculptures of Dunhuang Mogao Grottoes. J. Cult. Herit. 2016, 22, 1040–1048. [Google Scholar] [CrossRef]
  25. Liu, B.L.; Peng, W.Y.; Li, H.D.; Qu, J. Increase of moisture content in Mogao Grottoes from artificial sources based on numerical simulations. J. Cult. Herit. 2020, 45, 135–141. [Google Scholar] [CrossRef]
  26. Bi, W.B.; Yan, Z.F.; Zhang, Z.M.; Yao, S.S.; Zhang, J.J.; Wang, X.D. Modeling and numerical simulation of heat and mass transfer in the cave wall of the Mogao Grottoes in China. Build. Environ. 2021, 201, 108003. [Google Scholar] [CrossRef]
  27. Yao, S.S.; Yan, Z.F.; Ma, Q.; Xu, B.K.; Zhang, Z.M.; Bi, W.B.; Zhang, J.J. Analysis of the annual hygrothermal environment in the Maijishan Grottoes by field measurements and numerical simulations. Build. Environ. 2022, 221, 109229. [Google Scholar] [CrossRef]
  28. Zhang, G.B.; Wang, W.F.; Xu, P.; Qianchuan, X.; Hou, W.F.; Zhang, Z.M. Comparative analysis of air exchange rate in typical caves of the Mogao Grottoes in Dunhuang. Dunhuang Res. 2009, 6, 100–104. [Google Scholar]
  29. Zhang, J.J. Study on Key Technical Parameters of Mechanical Ventilation of the Mogao Grottoes in Dunhuang; Xi’an University of Architecture and Technology: Xi’an, China, 2017. [Google Scholar]
  30. Warren, P.R. Ventilation through openings on one wall only. In International Centre for Heat and Mass Transfer Seminar “Energy Conservation in Heating, Cooling, and Ventilating Buildings”; Hemisphere: New York, NY, USA, 1977. [Google Scholar]
  31. Warren, P.R.; Parkins, L.M. Window-opening behaviour in office buildings. Build. Serv. Eng. Res. Technol. 1984, 5, 89–101. [Google Scholar] [CrossRef]
  32. Dascalaki, E.; Santamouris, M.; Argiriou, A.; Helmis, C.; Asimakopoulos, D.N.; Papadopoulos, K.; Soilemes, A. On the combination of air velocity and flow measurements in single sided natural ventilation configurations. Energy Build. 1996, 24, 155–165. [Google Scholar] [CrossRef]
  33. Dascalaki, E.; Santamouris, M.; Asimakopoulos, D.N. On the use of deterministic and intelligent techniques to predict the air velocity distribution on external openings in single-sided natural ventilation configurations. Sol. Energy 1999, 66, 223–243. [Google Scholar] [CrossRef]
  34. Phaff, H.; Gids, W.D. Ventilation rates and energy consumption due to open windows: A brief overview of research in the Netherlands. Air Infiltration Rev. 1982, 4, 4–5. [Google Scholar]
  35. Larsen, T.S.; Heiselberg, P. Single-sided natural ventilation driven by wind pressure and temperature difference. Energy Build. 2008, 40, 1031–1040. [Google Scholar] [CrossRef]
  36. Larsen, T.S.; Tine, S.; Heiselberg, P.; Sawachi, T. Analysis and Design of Single-Sided Natural Ventilation. In Proceedings of the 4th International Symposium on HVAC, Beijing, China, 9–11 October 2003; pp. 159–163. [Google Scholar]
  37. Caciolo, M.; Cui, S.Q.; Stabat, P.; Marchio, D. Development of a new correlation for single-sided natural ventilation adapted to leeward conditions. Energy Build. 2013, 60, 372–382. [Google Scholar] [CrossRef]
  38. Caciolo, M.; Stabat, P.; Marchio, D. Full scale experimental study of single-sided ventilation: Analysis of stack and wind effects. Energy Build. 2011, 43, 1765–1773. [Google Scholar] [CrossRef]
  39. Pan, W.X.; Liu, S.M.; Li, S.S.; Cheng, X.L.; Zhang, H.; Long, Z.W.; Zhang, T.F.; Chen, Q.Y. A model for calculating single-sided natural ventilation rate in an urban residential apartment. Build. Environ. 2019, 147, 372–381. [Google Scholar] [CrossRef]
  40. Tang, Y.Q.; Li, X.F.; Zhu, W.M.J.; Cheng, P.L. Predicting single-sided airflow rates based on primary school experimental study. Build. Environ. 2016, 98, 71–79. [Google Scholar] [CrossRef]
  41. Sun, X.Y.; Yu, R.T.; Wu, Y. Investigation on wind tunnel experiments of ridge-valley tensile membrane structures. Eng. Struct. 2019, 187, 280–298. [Google Scholar] [CrossRef]
  42. Buratti, C.; Mariani, R.; Moretti, E. Mean age of air in a naturally ventilated office: Experimental data and simulations. Energy Build. 2011, 43, 2021–2027. [Google Scholar] [CrossRef]
  43. Cui, S.Q.; Cohen, M.; Stabat, P.; Marchio, D. CO2 tracer gas concentration decay method for measuring air change rate. Build. Environ. 2015, 84, 162–169. [Google Scholar] [CrossRef]
  44. Meiss, A.; Feijó-Muñoz, J.; García-Fuentes, M.A. Age-of-the-air in rooms according to the environmental condition of temperature: A case study. Energy Build. 2013, 67, 88–96. [Google Scholar] [CrossRef]
  45. Sherman, M.H. Tracer-gas techniques for measuring ventilation in a single zone. Build. Environ. 1990, 25, 365–374. [Google Scholar] [CrossRef]
  46. Dai, X.L.; Liu, J.J.; Yin, Y.H.; Song, X.; Jia, S.S. Modeling and controlling indoor formaldehyde concentrations in apartments: On-site investigation in all climate zones of China. Build. Environ. 2018, 127, 98–106. [Google Scholar] [CrossRef]
  47. Li, X.T.; Wang, X.; Li, X.F.; Zhu, Y.X. Study on air age in ventilated room by tracer gas method. HVAC 2001, 31, 79–81. [Google Scholar]
  48. Wang, J.L. Research on the Technology of Ventilation Regulation of the Mogao Grottoes in Dunhuang; Xi’an University of Architecture and Technology: Xi’an, China, 2016. [Google Scholar]
  49. Liu, S.M.; Pan, W.X.; Zhang, H.; Cheng, X.L.; Long, Z.W.; Chen, Q.Y. CFD simulations of wind distribution in an urban community with a full-scale geometrical model. Build. Environ. 2017, 117, 11–23. [Google Scholar] [CrossRef]
  50. Counihan, J. Adiabatic atmospheric boundary layers a review and analysis of data from the period 1880–1972. Atmos. Environ. 1975, 9, 871–905. [Google Scholar] [CrossRef]
  51. Heiselberg, P.; Svidt, K.; Nielsen, P.V. Characteristics of airflow from open windows. Build. Environ. 2001, 36, 859–869. [Google Scholar] [CrossRef]
  52. Li, Y.G. Buoyancy-driven natural ventilation in a thermally stratified one-zone building. Build. Environ. 2000, 35, 207–214. [Google Scholar] [CrossRef]
  53. ASHRAE 62.1-2022; Ventilation and Acceptable Indoor Air Quality. ANSI/ASHRAE: Peachtree Corners, GA, USA, 2022.
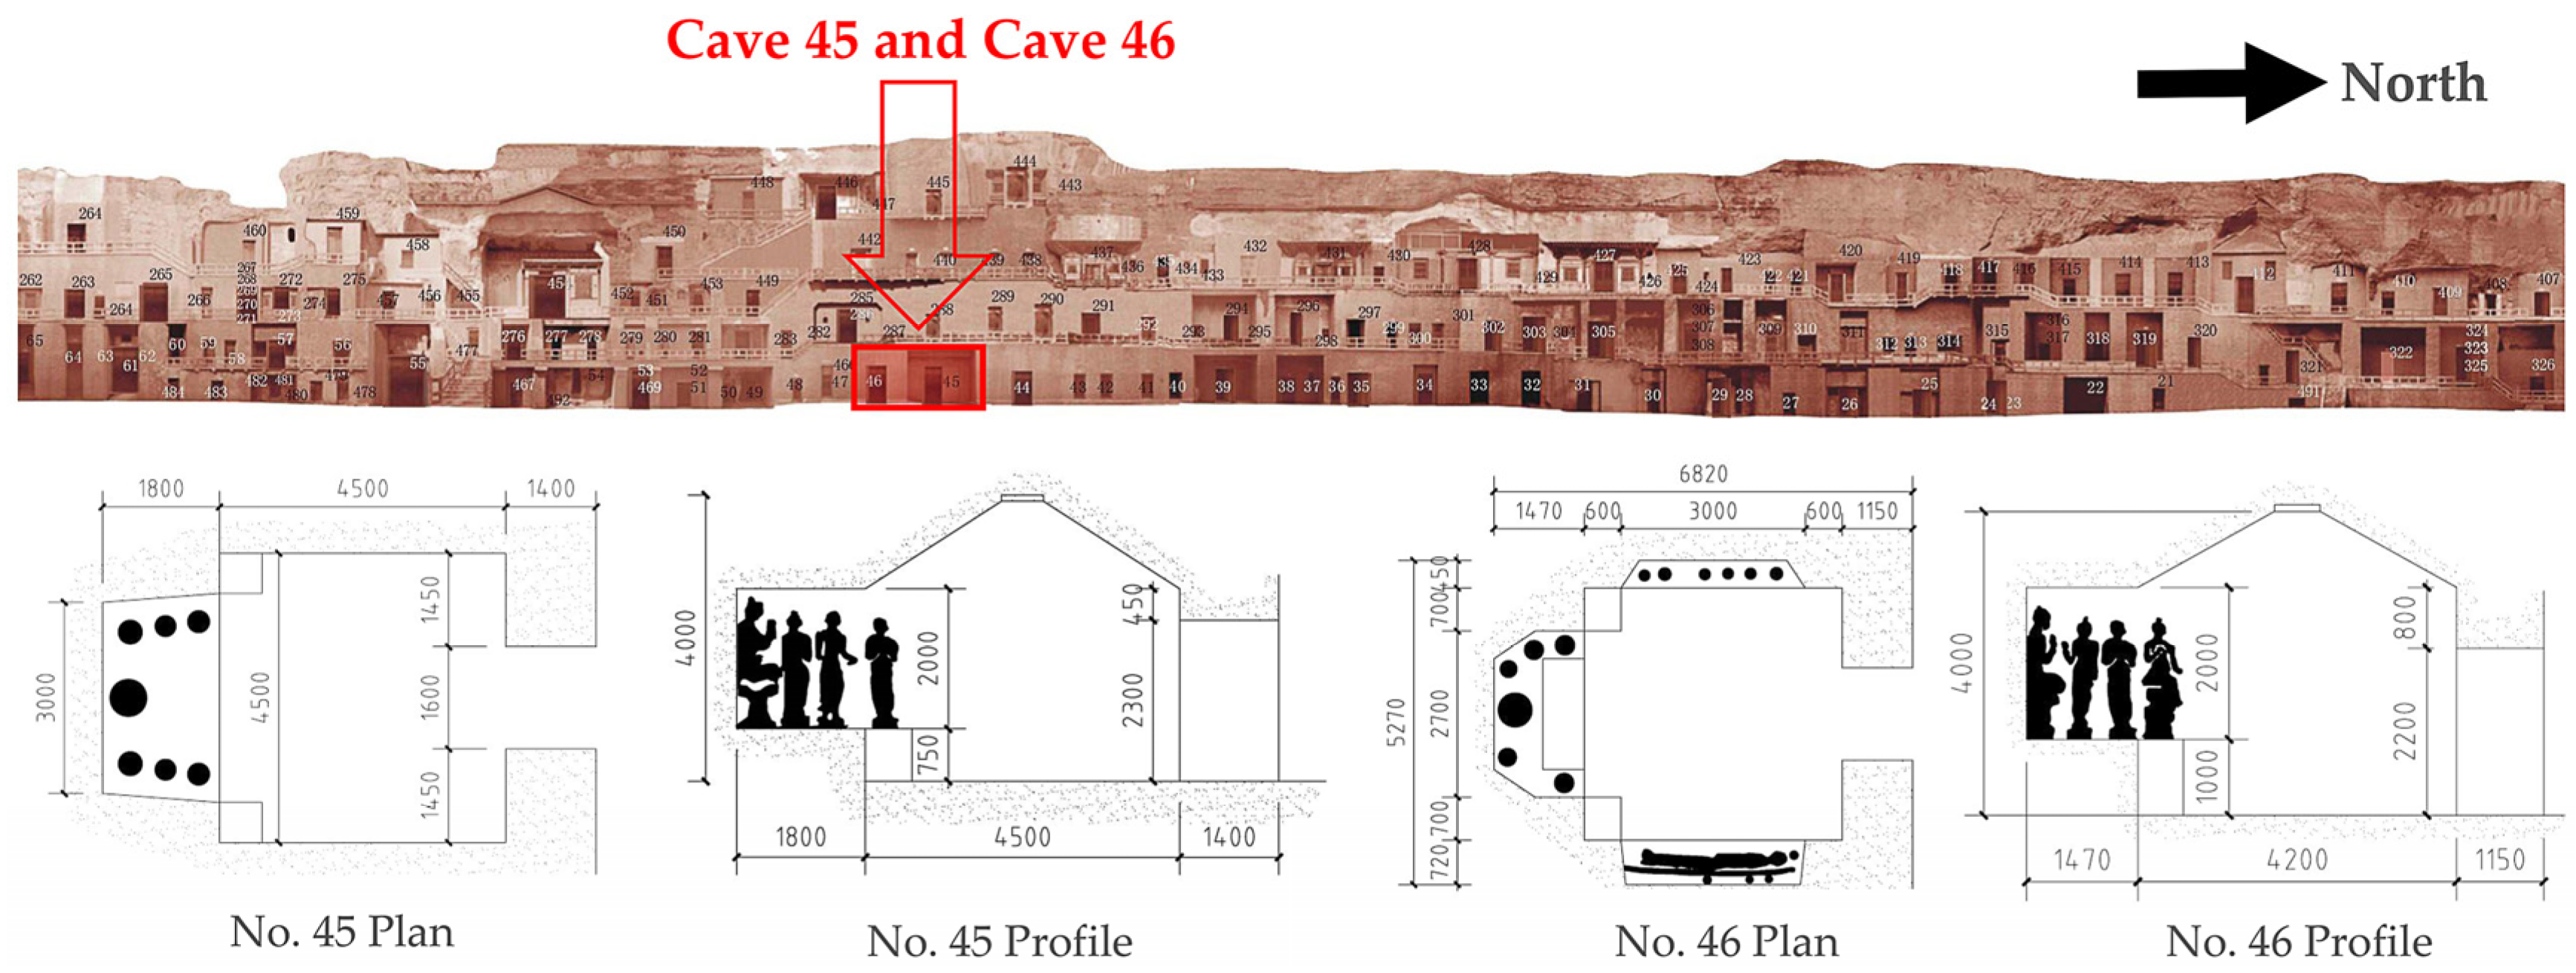
Figure 1. Cave 45 and Cave 46 plans and profiles.
Buildings 13 01298 g001
Figure 2. Weather station at the top of the Mogao Grottoes.
Buildings 13 01298 g002
Figure 3. Positions of measuring points and instruments in the cave.
Buildings 13 01298 g003
Figure 4. (a) CO2 concentration attenuation and ventilation rates determined at the four measuring points during the first experiment in Cave 45; and (b) CO2 concentration attenuation and ventilation rates measured in the lower zone of the main room.
Buildings 13 01298 g004
Figure 5. Single-sided natural ventilation in the Mogao Grottoes under different driving forces.
Buildings 13 01298 g005
Figure 6. Natural ventilation rates calculated by the correlation and the experimentally determined ventilation rates.
Buildings 13 01298 g006
Figure 7. Comparisons of the performance of natural ventilation rates between our prediction and (a) Warren [30]; (b) Dascalaki et al. [32]; (c) De Gids and Phaff [34]; (d) Larsen and Heiselberg [35]; (e) Caciolo et al. [37]; (f) Pan et al. [39]; (g) Tang et al. [40]; (h) ASHRAE [53] prediction with the use of our measured data as a reference.
Buildings 13 01298 g007aBuildings 13 01298 g007b
Figure 8. Deviations in the outputs of various correlations under different temperature differences inside and outside the caves.
Buildings 13 01298 g008
Figure 9. Deviations of various correlation outputs under different external wind direction conditions.
Buildings 13 01298 g009
Figure 10. Wang’s experimental data: (a) CO2 concentration attenuation and (b) the regression curve of ln c c e and time [4,48].
Buildings 13 01298 g010
Table 1. Parameters of the experimental caves.
No.DynastyMain Room Size (m)Aisle Size (m)Niche Size (m)Opening Size (m)Location
45Tang4.50 × 4.50 × 4.001.60 × 1.40 × 2.303.00 × 1.80 × 2.001.20 × 2.101st layer in south
46Tang4.10 × 4.20 × 4.001.50 × 1.15 × 2.202.70 × 1.47 × 2.001.40 × 2.101st layer in south
Table 2. Characteristics of sensors in the meteorological station.
SensorsVaisala HMP155ACMP3Gill WindSonic
1405-PK-100
Setra Model 261C
Test parametersTemperature; relative humiditySolar radiationWind speed; wind directionWind pressure
Method range−80~60 °C; 0.8~100%300~2800 nm0~60 m/s0–25 Pa
Accuracy±0.12 °C; ±1% RH<5%±2; ±3°0.4%
Table 3. Characteristics of sensors used in the experiment.
SensorsTesto 175-H2TSI 7565Swema03+
Test parametersTemperature; relative humidityCO2; CO; temperature; etc.Wind speed; wind pressure; etc.
Method range−20~70 °C; 0~100%0~5000 ppm0.05~3 m/s
Accuracy±0.6 °C; ±3% RH±3.0% or ±50 ppm±0.03 m/s or ±3%
Table 4. Data obtained for each experimental case.
DateCaveCase T i T o T i T o
(°C)
U r e f
(m/s)
Wind Angle (°)Air Change Rate (ACH)
January 2019451−6.7−10.263.564.6119212.97
2−5.4−7.832.432.6820110.88
463−4.1−7.853.751.5834113.61
4−4.2−7.873.671.7535013.20
September 201945523.524.99−1.492.46269.46
625.026.73−1.732.352510.73
46726.228.71−2.512.202610.92
825.827.46−1.661.6988.90
Table 5. Wind pressure coefficients and wind directions outside the caves determined in the experimental cases.
CaseWind Angle (°)Wind Pressure Coefficient
1192−0.0359
2201−0.0498
3341−0.4621
4350−0.3668
5260.2503
6250.3112
7260.1809
880.1884
Table 6. Wind profiles of different terrains.
Terrainαγ
Flat terrain with sparse trees or small buildings1.000.14
Towns and suburbs0.850.20
Urban, industrial or forest terrain0.670.25
A large city with a dense cluster of tall buildings0.470.35
Table 7. Minimum, maximum and average absolute deviation of calculated natural ventilation rate by each correlation.
CorrelationsDeviation
Min (%)Max (%)Ave (%)
Ours11.2218.9216.35
Warren [30]39.4464.5350.44
Dascalaki et al. [32]4.1996.8959.39
De Gids and Phaff [34]13.3329.4018.61
Larsen and Heiselberg [35]10.0547.2020.47
Caciolo et al. [37]8.0265.1325.61
Pan et al. [39]5.1548.1326.18
Tang et al. [40]9.6225.5917.85
Table 8. Wind direction and wind angle at the cave opening.
Wind DirectionWind Angle
Parallel0–15°, 165–195°, 345–360°
Leeward195–345°
Windward15–165°
Table 9. Case evaluation of Wang’s experiments.
ParameterOpening T i
(°C)
T o
(°C)
T
(°C)
U r e f
(m/s)
Wind Angle (°)Wang’s Experimental Ventilation Rate
(m3/s)
Ventilation Rate Calculated by Our Correlation
(m3/s)
Deviation (%)
Value1.5 × 2.45.0−0.325.323.14251.790.123050.1506922.46
Disclaimer/Publisher’s Note: The statements, opinions and data contained in all publications are solely those of the individual author(s) and contributor(s) and not of MDPI and/or the editor(s). MDPI and/or the editor(s) disclaim responsibility for any injury to people or property resulting from any ideas, methods, instructions or products referred to in the content.

