Abstract
As the need for digital transformation (DT) increased in order to improve productivity in the construction industry, the market for building information modeling (BIM), the main technology of DT, gradually expanded. Strategies for promoting BIM have been established and announced in South Korea. Accordingly, the related regulations have been modified and there is continuous investment in BIM. Despite these efforts, BIM adoption has not gone smoothly. This study aims to empirically verify an acceptance model as of 2021 based on the BIM acceptance models proposed by previous studies, and to propose implications by analyzing the significant relationship changes in acceptance models by period. It found a change in the mechanism of accepting BIM over time and derived implications about the causes of changes in connection with the comparative analysis results and the status of BIM-related policy announcements. If promotion strategies are inspected and adoption strategies suitable for each period are established through the regular verification of the BIM acceptance mechanism, we expect that the effectiveness and efficiency of investments in promoting BIM will improve.
1. Introduction
1.1. Research Background and Objective
Advanced nations show an interest in the use of building information modeling (BIM) to improve productivity through the fusion of the latest technologies [1]. Building information modeling (BIM) is the foundation of digital transformation in the architecture, engineering, and construction (AEC) industry. BIM is the holistic process of creating and managing information for a built asset. Based on an intelligent model and enabled by a cloud platform, BIM integrates structured, multi-disciplinary data to produce a digital representation of an asset across its lifecycle, from planning and design to construction and operations [2]. It becomes the basis of digitization. In particular, the USA, UK, and Singapore are striving to accelerate digital transformation through the mandatory use of BIM as the key to smart construction technology. Owing to mandatory use in many nations, the global BIM market is expected to grow 12.5% annually on average, to USD 10.7 billion by 2026 from USD 6.6 billion in 2022 [3].
The construction industry in South Korea is also trying to achieve BIM-based digitized and intelligent industry. As part of its efforts to promote BIM, South Korea has established and announced several BIM roadmaps. The Sixth Construction Technology Promotion Plan [4] aims to complete smart construction automation technology development by 2025 through pre-construction using BIM. The Roadmap to Smart Construction Technology [5] contains the BIM designs which are mandatory in turnkey (2019) and public road projects (2020) to create the conditions for BIM expansion and the step-by-step expansion of BIM in public projects, and also contains the details of the revisions to standards such as guidelines on design drawing preparation. The Roadmap to Construction BIM Promotion [6] presents the direction for BIM policies in construction areas and contains details about mandatory BIM application in public buildings (2022–2030), the expansion of support for designs in the private sector, the establishment and revision of guidelines by project owners, and the preparation of guidelines on BIM model submission. Based on this, the Digital Transformation Roadmap of Construction Industry based on BIM [1] was announced to establish detailed BIM-related execution strategies throughout the construction area.
Despite these efforts, the degree of interest among the participating stakeholders such as project owners, designers, and builders differed, something which did not make for systematic and speedy progress on BIM promotion. The main obstacles to BIM promotion are the lack of common standards in terms of BIM-related systems and standards, the burden of initial costs, insufficient development to allow the use of BIM technologies due to a lack of incentives, a shortage of experts who can fuse various technologies, and the lack of a support system to strengthen the fundamental BIM industry.
The diffusion of innovation proposed by Everett Rogers [7] is a model that theoretically explains how new technology or innovation is accepted and widely diffused in the market. According to this model, new technology is propagated to innovators or early adopters first and then spreads to many. Thus, because the characteristics of users differ depending on the period of adoption, it is necessary to identify the influencing factors and set up an appropriate strategy. In this regard, several longitudinal studies on technology acceptance have been conducted [8,9,10,11]. The main purpose of a longitudinal study is to see how the direction and strength of the causal relationship between specific variables change over time. On the other hand, the understanding of the mechanism by which technology users come to use technology is largely based on Davis’s technology acceptance model [12], and the author’s previous research [13] suggested a BIM acceptance model based on TAM. In addition, until recently, the issue of BIM acceptance has been studied by examining different countries and project stages. According to Julfikar, A. et al. [14], although BIM is a technology which is expected to have many effects such as cost reduction and productivity improvement, only a very small number of architects in India are using it. In this study, to understand the main factors that make India’s Architects adopt BIM, a research model for India’s Architects was proposed and statistically verified based on the technology acceptance model. According to Carlos, S. P. et al. [15], the application of BIM is expanding in European and North American countries, but South American countries are still only using it in the design stage and the maturity level is also low. Meanwhile, studies have been conducted to statistically verify the BIM acceptance model in various countries including Korea, China, Ghana, and the United Kingdom, but such studies are still insufficient in South America. In this study, a research model was presented based on previous studies of the BIM acceptance model proposed for each country, and the research model was statistically verified with data collected from architects and engineers in Peru. Zhao, Y. et al. [16] conducted a study to confirm whether there is a difference in the acceptance mechanism of BIM according to Architecture/Engineering/Construction and to find out what efforts are needed to improve BIM acceptance. A conceptual model based on TAM and TOE (Technology Organization Environment) theory was proposed and statistically verified based on the collected data. As a result, it was confirmed that the BIM acceptance mechanism of A/E/C experts was different.
Through the preceding studies, differences were found in the acceptance mechanism of BIM on the basis of country, specialized field within a given country, and the time of introduction. BIM is not meant to be used efficiently by only one sector among Architecture/Engineering/Construction; rather it is only when all the sectors participating in the construction phase can use BIM smoothly that the expected effects of BIM are be obtained. Therefore, research to understand technology acceptance should be conducted from various perspectives, such as by period/sector. In addition, based on the results, it is necessary to confirm what kind of effort is needed to increase the degree of acceptance and to update the utilization strategy.
Our previous study also compared the acceptance models of 2012 and 2019 [10]. In South Korea, BIM acceptance is generally divided into adoption in 2012, preparation from 2013 to 2018, and diffusion from 2019 to 2022 [17]. The final empirical verification of the acceptance model was conducted in 2019, which was not long ago, but since 2019 several developments of BIM enforcement guidelines and establishments and revisions of related standards have been announced. Thus, this study aims to conduct a comparative analysis by verifying the acceptance mechanism after 2019. By checking the change in the BIM acceptance mechanism by period and by reviewing the causes of the change through this study, we expect our study results to be referenced to establish the promotion plans suitable to the acceptance period by industries and governments.
1.2. Research Structure
The study structure to achieve the research objective is organized as follows. First, we reviewed BIM promotion strategies announced in South Korea and performance using BIM to determine the causes of the change in the acceptance mechanism by period (Chapter 3). Second, we empirically verified the BIM acceptance model of 2021 using AMOS 28.0 based on the models proposed in our previous study (Chapter 4). Third, we comparatively analyzed the explanatory power of potential variables in the BIM acceptance models which were verified in 2012, 2019, and 2021, and also analyzed whether there were causal relationships and the strength of these causal relationships. Based on the analysis results of BIM promotion strategies announced in Korea and performance using BIM (which were reviewed in Chapter 3), we studied the causes of the difference and presented implications accordingly (Chapter 5).
2. Materials and Methods
To measure the performance of BIM and verify the BIM acceptance model of 2021, we surveyed working staff who had experience using BIM. The survey was conducted from March to April 26 in 2021, and 101 respondents answered. The survey respondents had expertise in design (34.7%) and construction (65.3%). Their average number of years in the construction industry was around 9.5 years, and the number of years of BIM use was around 3.5 years (Table 1). The response was measured with a seven-point Likert scale from “strongly disagreed” to “strongly agreed”.

Table 1.
Profile of the Respondents.
The collected data was statistically verified for the 2021 BIM acceptance model by conducting a structural equation model analysis using AMOS 28.0.
3. The Current Status of BIM Use in Korea
In our previous study [18], the importance and performance of the benefits at the design and construction phases were measured through literature reviews, and then the performance of BIM use in South Korea was analyzed through interpretative phenomenological analysis. The analysis results showed that all items in both the design and construction phases belonged to Q2, where the importance and achievement were both above average, and Q3, where the importance and achievement were both below average. The items with high importance are also items with high performance due to the long-term investment in BIM promotion based on step-by-step goal establishment and detailed implementation plans to achieve the goals. More specifically, in terms of phase, in the design phase, “design quality improvement”, “interference check efficiency improvement”, “collaboration efficiency improvement”, “smooth communication about design intention”, and “information sharing efficiency” belonged to the Q2 quadrant. In the construction phase, “the reduction in re-work request”, “improvement of effectiveness in construction plans and constructability reviews”, “improvement of effectiveness in space plan of construction sites”, “reduction in the preparation of shop drawings and enhancement of efficiency”, “improvement in the effectiveness of collaboration with business partners”, “maintaining smooth work relationships with project owner”, “improvement of cost/project cost management effectiveness”, “enhancement of effectiveness in schedule and process management”, and “improvement of effectiveness in installation work” belonged to the Q2 quadrant. Through this, we found that BIM in South Korea has been used to improve design quality and collaboration efficiency in the design phase. BIM information has been used primarily in reviewing construction plans and constructability up until now, as BIM has been viewed as a tool for information sharing and collaboration. Still, the use of BIM for construction management is now gradually expanding to cover cost and process management as well.
We also reviewed the roadmaps relating to BIM which have been announced since 2010, so we could be aware of what investments in BIM promotion in South Korea were made for which purposes during each period.
The Public Procurement Service announced the “Roadmap to Expand the Application of Three-dimensional (3D) Construction Technique” [19] to spread the BIM application in the public facility sector in April 2010. In this 2010 BIM expansion roadmap, the BIM implementation plan in South Korea was divided into short-term, mid-term, and long-term plans, as presented in Table 2.
Table 2.
Implementation plan to activate BIM.
Since then, the “Fifth Construction Technology Promotion Plan (Dec. 2012)” [20] and the “Sixth Construction Technology Promotion Plan (Dec. 2017)” [4] have provided a basis for applying state-of-the-art industrial technologies to the construction industry by strengthening the competitiveness of the latest construction technologies, including BIM, and improving the systems as a measure to solve problems in the construction industry. Based on this, the “Roadmap to Construction BIM Promotion (Dec. 2020)” [6] and the “Digital Transformation Roadmap of Construction Industry based on BIM (Jun. 2021)” [1] were announced for BIM promotion. In these roadmaps, promotion tasks in “system improvement”, “technological development”, “human resource fostering”, and “industrial promotion” were included with the goals of developing a BIM design basis by 2025, with complete implementation of digital construction services by 2030. In addition, the “Roadmap to Smart Construction Technology (Oct. 2018)” [5] and the “Measure to Promote Smart Construction (Jul. 2022)” [21] were announced to promote smart construction technologies. They contain measures to promote BIM as a technology for the digitization of the construction industry. Table 3 presents the comparative analysis of implementation tasks for creating and promoting BIM expansion circumstances in each roadmap.
Table 3.
Comparative analysis of BIM-related roadmaps.
4. BIM Acceptance Model in 2021
4.1. Research Model
In this study, the BIM acceptance models of 2012, 2019, and 2021 were compared based on the BIM acceptance model [13] proposed by the authors. The research model consisted of nine latent constructs and 44 observed indicators, which were evaluation items in the latent constructs (see, Figure 1). Each construct is defined in Table 4.
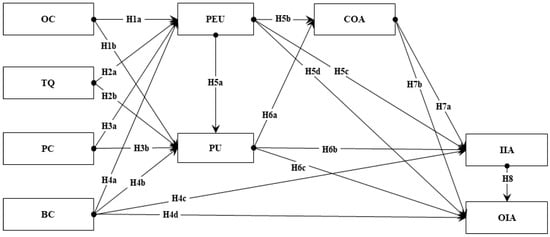
Figure 1.
Research Model.
Table 4.
Definition of constructs.
- H1: Organizational Competency will positively affect perceived usefulness (H1a) and perceived ease of use (H1b)
- H2: Technology quality will positively affect perceived usefulness (H2a) and perceived ease of use (H2b)
- H3: Personal Competency will positively affect perceived usefulness (H3a) and perceived ease of use (H3b)
- H4: Behavior Control will positively affect perceived usefulness (H4a), perceived ease of use (H4b), individual intention to accept BIM (H4c), and organizational intention to accept BIM (H4d)
- H5: Perceived ease of use will positively affect perceived usefulness (H5a), consensus on appropriation (H5b), individual intention to accept BIM (H5c), organizational intention to accept BIM (H5d)
- H6: Perceived usefulness will positively affect consensus on appropriation (H6a), individual intention to accept BIM (H6b), and organizational intention to accept BIM (H6c)
- H7: Consensus on appropriation will positively affect organizational intention to accept BIM (H7a), and individual intention to accept BIM (H7b)
- H8: Individual intention to accept BIM will positively affect organizational intention to accept BIM.
4.2. Result of Hypothesis Testing
To determine the fitness of the model, the ratio of X2 to the degree of freedom (df), the root-mean-square residual (RMR), the parsimonious goodness of fit index (PGFI), the Tucker–Lewis index (TLI), the comparative fit index (CFI) and the root-mean-square error of approximation (RMSEA) [23] were used. For the acceptance level of the determination index, the criteria suggested by previous studies were referred to. The comparison results of model fitness and the acceptance level of the proposed model showed that df 1.9 (≤3.0), PGFI 0.53 (≥0.5) and RMSEA 0.091 (≤0.1) satisfied the acceptable level, whereas RMR 0.186 (≤0.1), TLI 0.749 (≥0.9) and CFI 0.768 (≥0.9) did not satisfy the acceptable level but were close to the acceptable level. That is, the hypothesis can be tested based on the structural model. The hypothesis testing results are shown in Figure 2.
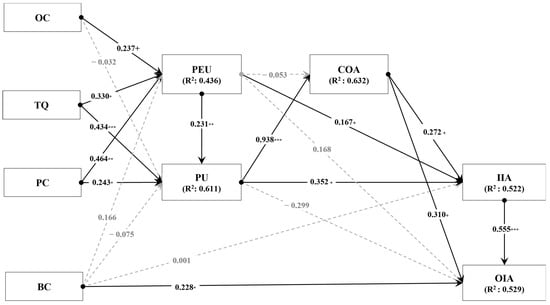
Figure 2.
BIM Acceptance Model 2021, + < 0.1, * < 0.05, ** < 0.01, *** < 0.001.
The testing results of the hypotheses contain the standardized path coefficients that refer to the strength of the relationship between independent and dependent variables and the squared multiple correlations (R2) for an endogenous construct that refer to the percentage of variation in the dependent variable explained by variation in the independent variables. H1a, H2a, and H3a out of the hypotheses in relation to perceived ease of use (PEU) were statistically significant (γ = 0.237, γ = 0.330, and γ = 0.464, respectively). This means that when the level of psychological readiness to use BIM in organizations and individuals and the information quality that can be obtained from BIM tools and BIM are high, it can positively impact PEU. H1a, H2a, and H3a can explain around 43.6% of the variance of PEU.
In the perceived usefulness (PU)-related hypotheses, H2b, H3b, and H5a were statistically significant (γ = 0.434, γ = 0.243, and β = 0.231, respectively). That is, as the information quality that can be obtained from BIM tools and BIM and individual competence rose, PU increased further. H2b, H3b, and H5a can explain around 61.1% of the PU variance. In the consensus on appropriation (COA)-related hypothesis, H6a was statistically significant (β = 0.938). That is, as the awareness of usefulness rose, the level of consensus on the BIM application increased. H6a explained 63.2% of the COA variance.
In the individual intention of acceptance (IIA)-related hypotheses, H5c, H6b, and H7a were statistically significant (β = 0.167, β = 0.352, and β = 0.272, respectively). This means that the more the use of BIM was recognized as easy and useful, and the higher the consensus on BIM application, the higher the individual’s willingness to accept BIM. H5c, H6b, and H7a explained 52.2% of IIA. In the organizational intention of acceptance (OIA)-related hypotheses, H4d, H7b, and H8 were statistically significant (β = 0.228, β = 0.310, and β = 0.555, respectively). This means that as the intention to accept BIM increased among individual members in the organization, there was a consensus on the use of BIM. The more outside organizations enforced the use of BIM, the more the acceptance level of BIM increased in the organization. H4d, H7b, and H8 explained 52.9% of OIA. The results found that both PEU and PU had indirect impacts through COA or IIA. COA influenced both IIA and OIA, which meant that the level of consensus on using BIM was an important factor in both individuals and organizations.
5. Comparative Analysis of the BIM Acceptance Model
The comparison results of the path coefficients and R2 values between the BIM acceptance model verified in our previous studies [10,13] and the 2021 BIM acceptance model verified in the present study are presented in Table 5.
Table 5.
Comparison between BIM acceptance models.
Finding 1: Significant causal relationship in common in 2012, 2019, and 2021 acceptance models (Figure 3).
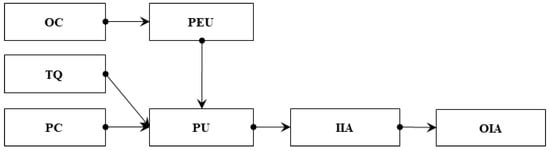
Figure 3.
Significant relationships in all 2012, 2019, and 2021 BIM acceptance models.
First, IIA is an important factor in encouraging organizational members to use BIM and to be proactive in the project progress using BIM, and is also important in reaching the “organizational acceptance stage” where organizational members participate in the development of applied BIM technology. IIA means the willingness of individuals constituting the organization to apply BIM to their work and the willingness to be trained for BIM application. The reason for the emergence and emphasis on the importance of fostering acceptance in human resources in local BIM-related roadmaps was that acceptance by the organization, which is the ultimate goal of BIM acceptance, can be only achieved when individuals accept BIM.
Second, to raise the level of individual acceptance, individuals need to recognize that BIM is useful technology. In South Korea, a plan to develop a feedback system was announced through the BIM project performance evaluation in the “Roadmap to BIM-based Digital Transformation in the Construction Industry (2021)” [1]. Verifying and advertising BIM’s usefulness is expected to raise the individual architecture engineer’s acceptance level of BIM through the provision of the performance evaluation system.
Third, technology quality (TQ), personal competence (PC), and organization competence (OC) are important external variables for the acceptance of BIM in the construction industry. The reason for including “technology development”, “human resource fostering”, and “providing the basis to use” in the BIM-related roadmaps, which were announced in South Korea as described in Chapter 3, was that these factors were important for technology adoption. In addition, improvement of technology quality (TQ) and improvement of technicians’ willingness and capacity to utilize BIM (BC) directly affect the usefulness of BIM utilization. In contrast, willingness to use BIM within the organization and the degree of resource investment (OC) have an indirect impact through the ease of BIM use. This result means that BIM can be recognized as useful when it is recognized that it is easy to use BIM as the foundation for the use of BIM is prepared with the investment of the organization.
Finding 2: Significant causal relationships are found for the first time in the 2021 acceptance model (Figure 4).
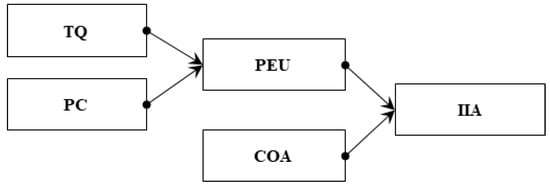
Figure 4.
Significant relationships only in the 2021 BIM acceptance model.
First, the PEU of BIM was analyzed as the factor that directly impacted IIA. As the scope of mandatory BIM application gradually expands, it becomes inevitable to use BIM, and ’PEU’ is acting as an important factor.
Second, TQ and PC were analyzed as the factors that significantly impacted PU and PEU. The results of the analysis of BIM-related policies in South Korea described in Chapter 3 revealed that measures to make BIM-applied projects easy to carry out were included in the roadmaps and development plans announced after 2019. These measures included the installation of the national BIM center (Apr. 2020), the establishment of standards and systems to provide the basis of BIM use (Dec. 2020), the development of basic BIM guidelines (Dec. 2020), the provision of pricing standards (Sep. 2020), and license and permit digitization (Dec. 2020).
Third, COA was analyzed as the factor that significantly impacted IIA. The only factor that affected IIA was PU. However, as works and projects subject to BIM application have expanded since 2020, PEU and COA were added as the factors that directly impacted IIA. In particular, COA in the 2012 acceptance model was a factor that directly impacted OIA, and its influence was significant. In contrast, COA in the 2021 acceptance model became a factor that significantly impacted IIA, so its indirect impact on OIA through IIA increased more than its direct impact on OIA. In addition, COA in the 2019 acceptance model did not influence IIA or OIA. Thus, COA was important at the early adoption time, but the consensus on BIM use was achieved to some extent over time, which was why COA was not a significant factor anymore. However, it was derived as the significant factor in the 2021 acceptance model because new policies were proposed or detailed standards were announced after 2019, thereby requiring a great deal of consensus in the organization.
Finding 3: Changes in the awareness of PU and PEU over time.
First, until 2012, BIM was being introduced in earnest, but the basis of the technology use was not put in place until then. Thus, external variables impacted the awareness of usefulness more than the ease of technology use by users. Since then, promotion measures have been announced over time, and detailed efforts have been made for each organization. Thus, external variables had increased positive impacts on the ease of use for users. Then, after the BIM promotion roadmaps were first announced in 2010, detailed policies were newly proposed by area in the 2020 Roadmap to Construction BIM Promotion, which impacted users’ awareness of PU.
Second, PEU and PU in the 2012 acceptance model significantly impacted the consensus on BIM-applied work and how to apply it. In contrast, the level of ease significantly impacted the 2019 acceptance model, and the level of usefulness significantly impacted the 2021 acceptance model. This meant that early technology adoption targeted relatively easy tasks and scope at the early adoption, but the target and scope were expanded to those where the most effect could be seen when the technology was adopted over time. In the BIM performance analysis [18] conducted by the authors, tasks that were relatively easy to apply, such as “improvement of interference check efficiency”, “smooth communication about design intention”, and “improvement of quantity calculation efficiency”, had a high level of importance and performance. However, the roadmaps announced in recent years are gradually expanding the use of information on BIM in various construction management areas.
Finding 4: Changes in the relationship between mandatory BIM and BIM acceptance over time (Figure 5).
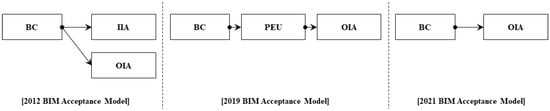
Figure 5.
Changes in the relationship between behavior control and intention to accept.
In the 2012 acceptance model, the behavior control (BC) factor was a significant variable for both IIA and OIA. This meant the mandatory systems that enforced the use of BIM at the early adoption time were effective. The mandatory application of BIM in public projects was announced in local policies.
Next, the analysis results showed that in the 2019 acceptance model the BC factor did not affect IIA, but it indirectly impacted OIA through PEU. This meant that an organization’s acceptance could only be achieved when an environment for easy BIM application was provided institutionally through mandatory enforcement, as opposed to through the adoption effect by mandatory enforcement after BIM had been adopted to some extent. It is important to encourage IIA through an awareness that BIM is useful by creating a convenient environment instead of by unconditional enforcement, even within the organization.
Finally, in the 2021 acceptance model, the BC factor did not affect IIA, whereas it directly impacted OIA. This was due to the expansion of mandatory scopes, such as the full use of BIM and expansion of BIM to the private sector since 2020, thereby having a direct impact on OIA. On the other hand, IIA, which has the greatest impact on OIA, was influenced by various factors such as PEU, PU, and COA rather than BC. Thus, it is necessary to provide detailed adoption policies that can create an environment and atmosphere which is conducive for individuals to use BIM.
6. Conclusions
The market for BIM, which is the main technology of DT for the improvement of productivity in the construction industry, has gradually expanded. Strategies for promoting BIM have been continuously established and announced in Korea. Accordingly, the related regulations have been modified and there is continuous investment in BIM. Despite these ongoing efforts, interest among the participating stakeholders, such as project owners, designers, and builders, differed, something which did not lead to systematic and speedy progress on BIM promotion. Everett Rogers [7] claimed that the acceptance pattern for new technology or innovation varied over time. Longitudinal studies on technology acceptance have been conducted. Thus, the present study empirically verified the 2021 acceptance model based on the BIM acceptance model proposed by our previous studies and comparatively analyzed acceptance models by the periods that represent the adoption (2012), preparation (2019), and diffusion (2021) periods, respectively.
The implications derived from the comparative analysis results of acceptance models by period are discussed below.
- Importance of technology development, fostering human resources, and providing a basis for use. TQ, PC, and OC, which were the external variables of the BIM acceptance models proposed in this study, were analyzed as the significant variables in all periods. Thus, strategies to promote BIM must include strategies related to technology development (TQ), human resource fostering (PC), and to providing the basis to use (OC).
- Need to establish performance evaluation systems and to foster strategy by individual attributes: To reach the organizational acceptance stage, which is the ultimate goal of BIM technology acceptance, the will to apply BIM to their work or to learn BIM for application is an important factor for individuals in the organization. Furthermore, to raise individual willingness to accept BIM, individuals need to recognize that BIM is a useful technology. Thus, when establishing a human resources development strategy for vitalizing BIM, it is necessary to define the attributes such as the organization to which an individual belongs and the task in charge, and to design an education program suitable for the definition. In addition, in order to recognize the usefulness of the technology, in the early stage of introduction, the effectiveness of BIM utilization was persuaded through BIM utilization cases in developed countries. However, as the application cases of BIM have increased in South Korea, it is necessary to verify the effects of BIM through the provision of a performance evaluation system and to expand the use scope based on the verification results.
- Need to provide an environment which allows for easy use of BIM. At early adoption time, mandatory enforcement was effective in making organizations and individuals use the technology. However, over time individual acceptance was impacted by various factors such as PEU, PU, and COA rather than by mandatory enforcement, and there was only an indirect impact on organizational acceptance through PEU. Furthermore, PU of BIM was a more important factor at the early adoption time, but the importance of PEU of BIM gradually increased over time. For this reason, it is important to create an environment where use of BIM is easy so that adoption can continue. Thus, it is necessary to create an environment which makes BIM use easy, for instance by providing a basis for use including the provision of standards, promoting the development of technology that can raise work efficiency, and establishing a differentiated human resource fostering plan for each sectors.
- Relationship between organizational consensus and acceptance. Organizational consensus played an important role in acceptance when technology was first adopted or new standards and policies were announced. Thus, it is necessary to have a decision-making tool by which organizational members can agree during decision-making on BIM adoption, selection of application target and scope, and investment. Moreover, indirect impacts through individual acceptance became more important over time, although organizational consensus directly impacted organizational acceptance at first. In this regard, a bottom-up approach rather than a top-down approach was more effective in policies to adopt BIM at times, such as today, of expanded awareness of the effects of BIM use. Thus, it is necessary to configure an organizational body where various BIM-related experts from industry, academia, and research institutions gather to collect opinions on how to promote BIM, and where policies and systems are developed.
- Relationship between organizational consensus and PU/PEU. At the time of early adoption, it is necessary to stress that the technology is useful. However, for the selection of application targets, it is easy to obtain an organizational consensus by selecting easy-to-apply targets from the beginning. Thus, at early adoption time, easily applied targets are accepted and then adoption is gradually expanded to useful fields.
Expected effects and future research of this study are as follows.
- Expected effects. This study contributes to the comparative analysis of empirical verification results of the BIM acceptance model at the main period and the verification of changes in the BIM acceptance mechanism, thereby confirming the need for longitudinal studies. In addition, this study contributes to deriving implications of the cause of changes in connection with the comparative analysis results for acceptance models and the current status of local BIM-related policy announcements, and BIM performance measurement results for construction and works phases. The study also derives the direction of the strategy established to promote BIM accordingly. Thus, if the promotion strategies are inspected and suitable adoption strategies for each period are established accordingly through the regular verification of the BIM acceptance mechanism, we expect the effectiveness and efficiency of investments for promoting BIM will be improved.
- Limitation and Future study. In this study, the suitability of the direction of BIM policies was indirectly found out through the difference in BIM acceptance models. However, it is necessary to present an evaluation model that can quantitatively diagnose the suitability of the current policy direction in the future. In addition, the premise of presenting a BIM acceptance model is based on the fact that when organizations and individuals adopt BIM instead of simply using BIM tools, work efficiency and effectiveness are likely to increase. Thus, a study on determining the importance of BIM uses by systematic adoption strategies by empirically verifying the influence relationship between BIM performance evaluation results and BIM acceptance level. Moreover, this study presented the difference in BIM acceptance models over time through the empirical verification results of the BIM acceptance model by period. However, for future studies, it is necessary to achieve empirical verification by deriving the determination factors that can bring about the change in the acceptance mechanism by adoption period. Finally, the current research model evaluates BIM usage capabilities from the viewpoints of industrial enterprises and engineers who have already entered the industry. In future research, we will expand the subject of evaluation by conducting research that can analyze the university education system from the perspective of future engineers.
Author Contributions
Conceptualization, S.L. and J.Y.; methodology, S.L.; validation, S.L. and J.Y.; formal analysis, S.L.; data curation, J.Y.; writing—original draft preparation, S.L.; writing—review and editing, S.L. and J.Y. All authors have read and agreed to the published version of the manuscript.
Funding
This research received no external funding.
Institutional Review Board Statement
Not applicable.
Informed Consent Statement
Not applicable.
Data Availability Statement
Not applicable.
Conflicts of Interest
The authors declare no conflict of interest.
References
- MOLIT. Digital Transformation Roadmap of Construction Industry Based on BIM, June 2021. Available online: http://www.molit.go.kr/USR/NEWS/m_71/dtl.jsp?id=95084979 (accessed on 20 December 2022).
- Building Information Modeling. Available online: https://www.autodesk.com/industry/aec/bim (accessed on 20 May 2023).
- Markets and Markets, Building Information Modeling Market (2020–2026). Available online: https://www.marketsandmarkets.com/Market-Reports/building-information-modeling-market-95037387.html?gclid=Cj0KCQjw8qmhBhClARIsANAtboesaJMYP_FLXIXDl_Nz8oiZ21utfoBRey8V68bEERH_GG_uTx8LfggaAnxoEALw_wcB (accessed on 15 January 2023).
- MOLIT. Sixth Construction Technology Promotion Plan, December 2017. Available online: https://www.korea.kr/archive/expDocView.do?docId=38136 (accessed on 20 December 2022).
- MOLIT. The Roadmap to Smart Construction Technology, October 2018. Available online: https://www.codil.or.kr/filebank/files/201811/helpdesk/BBS_201811010848325131.pdf?atchFileId=FILE_000000000007539&fileSn=1 (accessed on 20 December 2022).
- MOLIT, the Roadmap to Construction BIM Promotion, December 2020. Available online: http://www.molit.go.kr/USR/NEWS/m_71/dtl.jsp?lcmspage=1&id=95084979 (accessed on 20 December 2022).
- Everett, M.R. Diffusion of Innovations, 5th ed.; The Free Press: New York, NY, USA, 1962. [Google Scholar]
- Venkatesh, V.; Davis, F.D. A Theoretical Extension of the Technology Acceptance Model: Four Longitudinal Field Studies. Manag. Sci. 2000, 46, 169–332. [Google Scholar] [CrossRef]
- Choe, M.J. Combined Model of Technology Acceptance and Innovation Diffusion Theory for Adoption of Smartwatch. Int. J. Contents 2018, 14, 32–38. [Google Scholar] [CrossRef]
- Lee, S.K.; Yu, J.H. Longitudinal Study on Construction Organization’s BIM Acceptance. Appl. Sci. 2019, 10, 5358. [Google Scholar] [CrossRef]
- Elodie, A.; Lars, M.W. The acceptance and usage of smart connected objects according to adoption stages: An enhanced technology acceptance model integrating the diffusion of innovation, uses and gratification and privacy calculus theories. Technol. Forecast. Soc. Chang. 2022, 176, 121485. [Google Scholar] [CrossRef]
- Davis, F.D. Perceived usefulness, perceived ease of use, and user acceptance of information technologies. MIS Q. 1989, 13, 319–340. [Google Scholar] [CrossRef]
- Lee, S.K.; Yu, J.H.; Jeong, D. BIM acceptance model in construction organizations. J. Manag. Eng. 2015, 31, 04014048. [Google Scholar] [CrossRef]
- Julfikar, A.; Chandika, A.; Kritika, A.; Jasleen, K. A Critical Analysis of Technology Acceptance Model (TAM) Towards Adopting BIM by Architects in India. ECS Trans. 2022, 107, 6209–6220. [Google Scholar] [CrossRef]
- Carlos, S.P.; Juan-Manuel, V.A.; Antonio, L. BIM: A Technology Acceptance Model in PERU. ITcon 2020, 25, 99–108. [Google Scholar] [CrossRef]
- Zhao, Y.; Sun, S.; Zhou, Q.; Cui, C.; Liu, Y. How A/E/C professionals accept BIM technologies in China: A technology acceptance model perspective. Eng. Constr. Archit. Manag. 2022. [Google Scholar] [CrossRef]
- Moon, H.S. Construction Industry BIM Policy Status and Direction. In Proceedings of the 2022 Smart Construction Expo, Goyang-si, Republic of Korea, 30 August 2022. [Google Scholar]
- Lee, S.K.; Song, J.; Yu, J.H. Comparative Analysis of BIM Performance between Korea and China using IPA. J. Archit. Inst. Korea 2021, 37, 317–326. [Google Scholar] [CrossRef]
- Public Procurement Service. Expand Application of 3D Building Method (BIM). 2010. Available online: https://www.korea.kr/news/pressReleaseView.do?newsId=155457720 (accessed on 20 December 2022).
- MOLIT. Fifth Construction Technology Promotion Plan, December 2012. Available online: http://www.molit.go.kr/USR/policyData/m_34681/dtl.jsp?search=&srch_dept_nm=&srch_dept_id=&srch_usr_nm=&srch_usr_titl=Y&srch_usr_ctnt=&search_regdate_s=&search_regdate_e=&psize=10&s_category=p_sec_3&p_category=&lcmspage=7&id=3092 (accessed on 20 December 2022).
- MOLIT. The Measure to Promote Smart Construction; S-Construction 2030, July 2022. Available online: https://www.korea.kr/news/pressReleaseView.do?newsId=156517315 (accessed on 20 December 2022).
- Joint Ministries. The Development of Construction Engineering, September 2020. Available online: http://www.molit.go.kr/USR/NEWS/m_72/dtl.jsp?lcmspage=22&id=95084415 (accessed on 20 December 2022).
- Baumgartner, H.; Homburg, C. Application of structural equation modeling in marketing and consumer research: A review. Int. J. Res. Mark. 1996, 13, 139–161. [Google Scholar] [CrossRef]


Disclaimer/Publisher’s Note: The statements, opinions and data contained in all publications are solely those of the individual author(s) and contributor(s) and not of MDPI and/or the editor(s). MDPI and/or the editor(s) disclaim responsibility for any injury to people or property resulting from any ideas, methods, instructions or products referred to in the content. |
© 2023 by the authors. Licensee MDPI, Basel, Switzerland. This article is an open access article distributed under the terms and conditions of the Creative Commons Attribution (CC BY) license (https://creativecommons.org/licenses/by/4.0/).