Article

The Effect of ECC Materials on Seismic Performance of Beam—Column Subassemblies with Slabs

1
Shaanxi Key Laboratory of Safety and Durability of Concrete Structures, Xijing University, Xi’an 710123, China
2
School of Civil Engineering, Xi’an University of Architecture and Technology, Xi’an 710055, China
*
Author to whom correspondence should be addressed.
Buildings 2023, 13(8), 1942; https://doi.org/10.3390/buildings13081942
Submission received: 7 June 2023 / Revised: 24 July 2023 / Accepted: 28 July 2023 / Published: 30 July 2023

Abstract

:
The main objective of this investigation was to study the influence of an Engineered Cementitious Composite (ECC) on the seismic performances of beam–column–slab subassemblies. Tests and simulations were conducted on several models. The bearing capacity of the ECC model was 15% higher than that of the RC member, the deformability increased by 19%, and the energy dissipation capability increased by 34%. The use of an ECC in the slab could reduce the contribution of the reinforced bars in the slab to the flexural strength of the beam. At a drift of 2%, the range of the yielding bars in the slab of the RC models was 5h to 6h. However, the yield range of reinforcement in the slab of the ECC models was nearly 3h. As a result, the ECC subassemblies were prone to reach a “strong column and weak beam” yield mechanism.

1. Introduction

Floor slabs cast in situ floor slabs have a great influence on the “strong column–weak beam” failure mechanism of a frame structure. Earthquake damage investigations have shown that most frame structures designed without considering the effect of the floor slab on the beam bearing capacity experienced the “strong beam–weak column” failure mechanism and thus did not reach the anticipated failure mechanism [1,2]. In cast—in—place reinforced concrete structures, the strength and stiffness of the beams are increased because of the floor acting as a flange to the beams. It is possible to underestimate the strength of a beam if the slab contribution is ignored. Therefore, the failure mechanism of the structures might be changed to unanticipated [3].
The effective flange width value of a slab differs by country. For the interior joint of a frame structure, the current Chinese code specifies a flange width as b + 6h (b is the beam width, and h is the slab thickness) [4]. The design code in the United States [5] provides guidelines for determining an effective slab width, which is approximately 8h on each side of the beam. In the New Zealand code [6], the effective slab width on each side of the web should not exceed 8h. The effects of the slab are complicated, and there are many influencing factors; together with the limited experimental data, the values of effective flange widths are still approximations.
The extent to which the slab contributes to the lateral strength of a frame structure is still a disputable question at present.
Pantazopoulou et al. [7] noted that many parameters may affect the slab participation, such as the reinforcement of the slab, the transverse beam element, and the initial damage to the structure. The slab participation increased with an increasing drift. As shown in the test result, at a drift of 2%, the measured flexural strength was within 10% of the value calculated using the ACI width assumptions. Many investigations were conducted on the mechanism by which the slab participates in the lateral—resistant system of a frame structure [8]. Nevertheless, some other studies on the RC frames coupled with the precast–prestressed floor had shown that the presence of floor units also increased the strength of the beam [9], even more than 8h.
Many fiber materials were applied to structures to improve the mechanical properties of the RC frame structures [10,11,12]. The cementitious matrix used in this study, the ECC, shows tensile stress–strain and multiple cracking behaviors [13]. For the members in shear or flexural failure mode, using an ECC material can enhance their shear, deformation, and energy dissipation capacity [14]. The frame structure, in which the ECC material was used in the key positions, showed better seismic behaviors in deformation, shear capacity, energy dissipation, and integrity [15,16]. Moreover, it was able to control the damage degree, cracking development, and failure mechanism [17,18].
It is expected to improve the seismic performances of a beam and column subassembly by the use of the ECC in the joint region, beam ends, column ends, and the adjacent slab. In this study, the influences of the ECC on the contribution of the slab—reinforced bars to the bending bearing capacity of the beam were studied, as well as the damage mechanism of the subassemblies. Additionally, simulations were carried out to further discuss the influence of the ECC on the seismic performance of the beam–column subassembly. The research results of this paper will have an important theoretical significance and practical value for improving the seismic performance of RC frame structures and realizing the control of the seismic performance of RC frame structures.

2. Materials and Methods

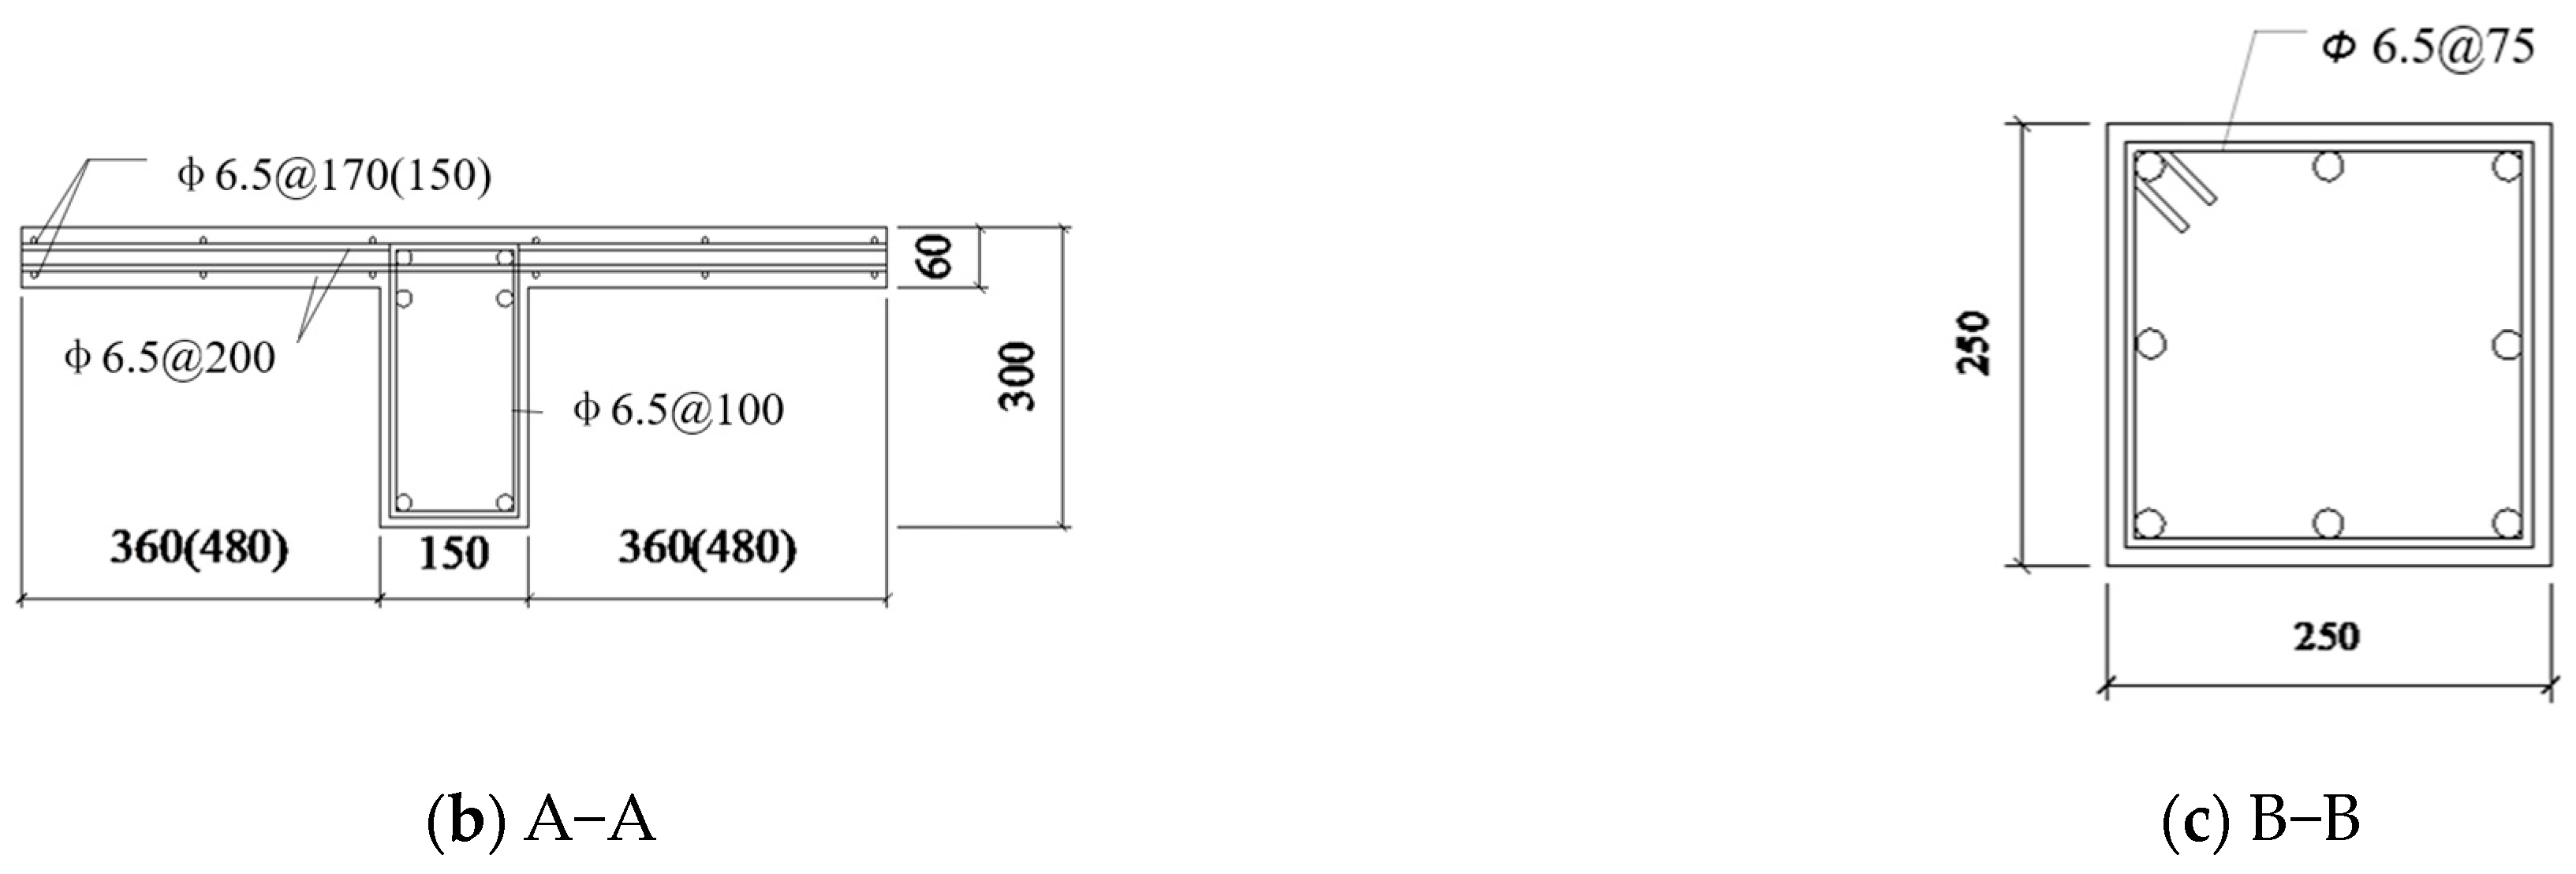
2.1. Design of Experiment

In this study, quasi—static tests were conducted on several beam–column subassemblies with slabs. The designed components were a 1/2 scale of the prototype structure. The dimension details of the subassemblies are shown in Figure 1. The thickness of the floor slab “h” was 60 mm. The flange width of the specimens FBCS-2 and FBCS-3 was 6h, and the flange width of the specimens FBCS-4 and FBCS-5 was 8h. The column axial load ratio μ was 0.4. Specimens RBCS-1 and FBCS-2 had the same parameters (dimension and reinforcement) for comparison.
The reinforcement in the beams of each specimen was the same. The flexural strength Mb of the beam was calculated by considering the flange effect. The flexural strength Mc of the column was calculated on the basis of Mb, the factor η (∑Mc/∑Mb), and the axial load ratio. The reinforced details are listed in Table 1, and the component dimension information of the subassemblies is shown in Figure 1.

2.2. Material Properties
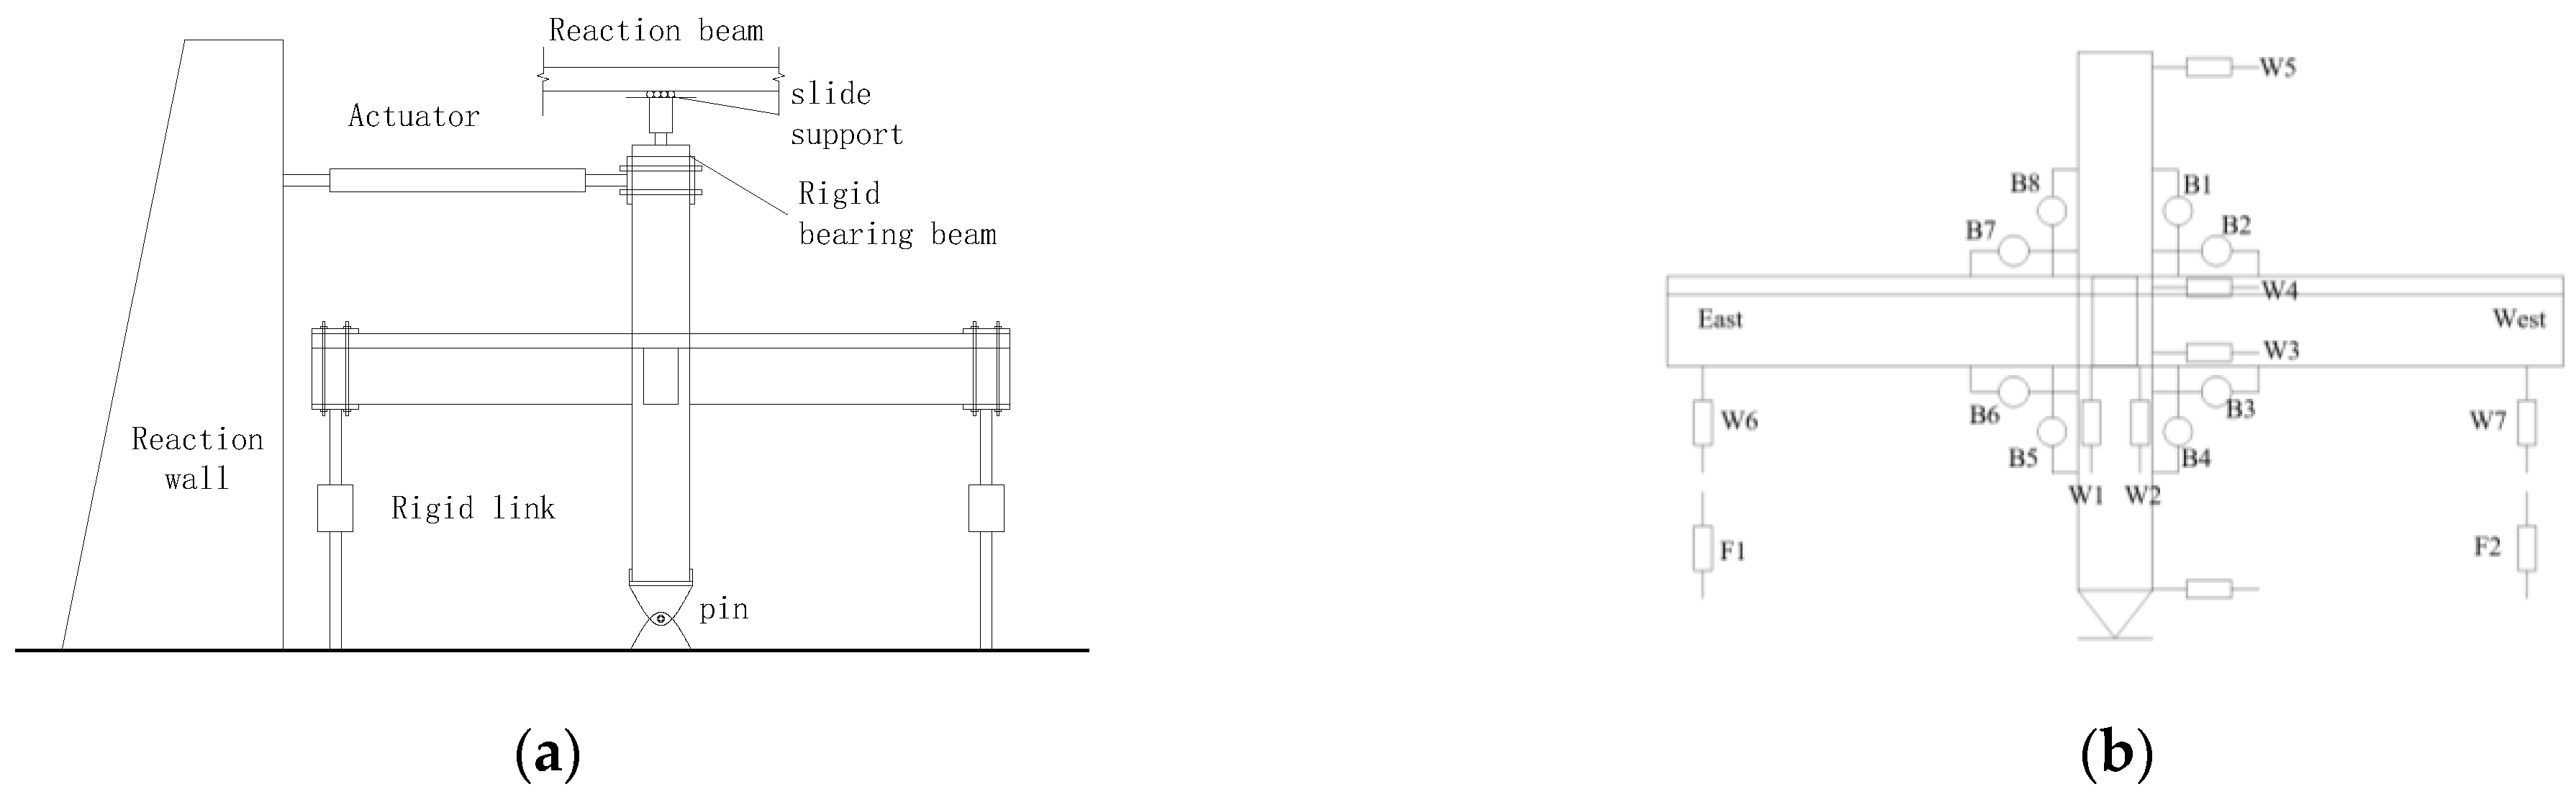
The ECC is mixed using cement, fly ash, fine sand, and water with the following weight: 565:635:465:480. The PVA fibers were mixed in the ECC material at a 2% volume fraction. The length of the PVA fibers is 12 mm, and the diameter is 39 µm. The tensile strength of the fibers reached 1600 MPa. The normal concrete was fine aggregate concrete to cast the slab easily.
The material mechanical properties were tested after the test of the column–beam–slab subassemblies. The tensile strength (ft) of the ECC was 4.18 MPa, and the ultimate tensile stain was 1%. The axial compressive strengths fc of the ECC and RC were 43.19 MPa ad 33.59 MPa, respectively. The cubic compressive strengths (fcu) of the ECC and RC were 47.85 MPa and 44.20 MPa, respectively. The mechanical parameters of the reinforced bars are listed in Table 2.

2.3. Test Setup

The quasi—static test setup and measurement layout are illustrated in Figure 2. A 500 kN electro—hydraulic servo actuator provided the lateral load, and the force was applied on the upper end of the column. The axial load was provided through a 500 kN hydraulic jack. The shear force values of the beam section were collected through two force sensors F1−F2. Strain gages were instrumented to monitor the strain of reinforcement. The beam end and column end section rotations were monitored using the dial indicators B1~B8.
The load procedure consisted of two stages. The test began using a force—controlled method with a load of 10 kN per stage. And each level executed only one cycle. When the load reached the calculated yielding load, the remaining cycles were changed to a displacement—controlled method. The displacement increment was y (the yield displacement corresponding to the calculated yield load). Each increment had with three cycles. The test was stopped when the bearing capacity was down to 60% of the peak load or the interlayer deformation of the subassembly reached a drift of 10%.

3. Results

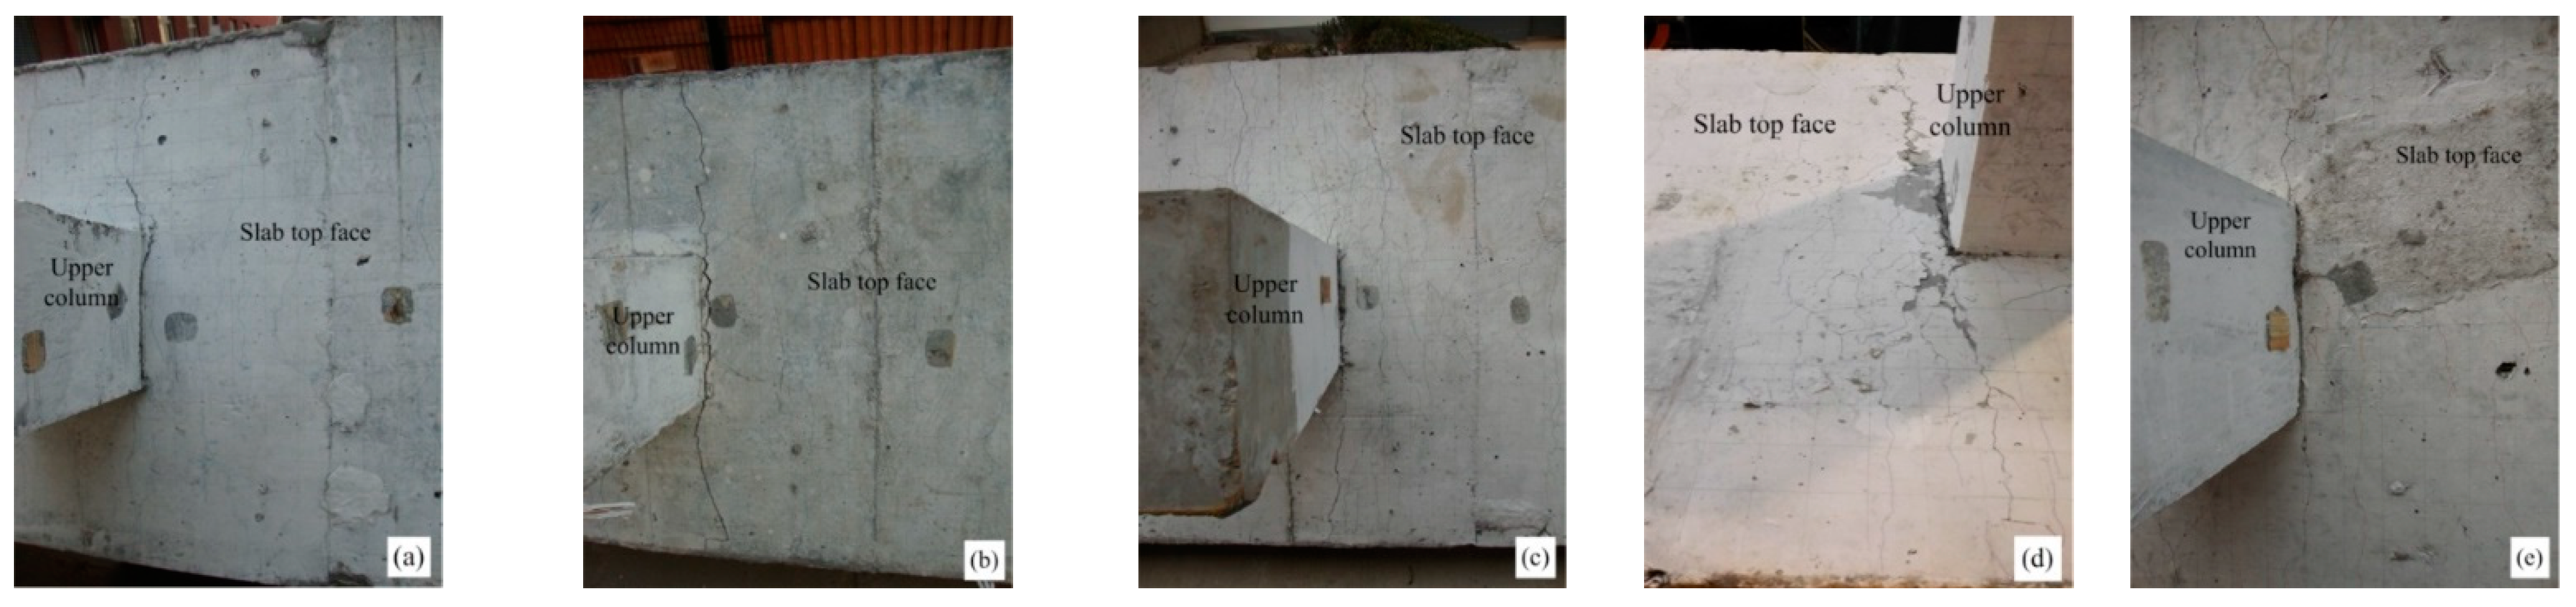
3.1. Failure Description

(1) The concrete specimen, RBCS-1, had serious permanent damage. Cracks appeared at a load of 20 kN on the beam ends, and they extended from the bottom to the top of the beam. The cracks ran through the whole top surface of the slab when they appeared at 50 kN. Horizontal micro—cracks appeared on the column during the first circle of 70 kN. The concrete in the joint area spalled off at a 2.8% drift (the corresponding load was 92 kN), and the reinforced bars were exposed.
(2) Specimen FBCS-2 had serious damage in the ECC region of the beam and column but with better integrity. Cracks on the top of the slab were first observed at a load of 50 kN. The cracks elongated to the flange edge at a 2% drift. The cracks on the slab bottom occurred at about a 3% drift. After unloading, the crack width on the top of the slab was approximately 0.5 mm, and the crack did not run through the slab surface.
For RBCS-1, the beam end section formed a plastic hinge at a drift of 1.0%, while the beam end section of FBCS-2 formed a plastic hinge at about 1.1% drift. The bars in the column of RBCS-1 yielded at a 1.0% drift, while the bars in the FBCS-2 column yielded at a drift of 1.8%. This implied that the specimen FBCS-2 showed the mechanism of “strong column–weak beam”, and the RBCS-1 did not reach the expected damage mechanism.
(3) For specimen FBCS-3, micro—cracks were observed in the plastic region (ECC material) of the beam at a load of 30 kN. Then, the column end began cracking at 70 kN. A major diagonal crack was observed on the transverse beam at about a 3.4% drift. No major crack formed on the column until the test stopped. The subassembly maintained better integrity when the drift reached 6%. Micro—cracks appeared on the slab surface at 50 kN. At about a drift of 2%, the crack on the surface of the slab began to extend. The crack width on the bottom of the slab reached 1.5 mm at a 5% drift.
The plastic hinge of beam FBCS-3 formed at a drift of 1.0%. Then, the plastic hinge of the column was formed at a drift of 2.3%. The damage on the column end was lighter than that of FBCS-2 when the test stopped. Thus, FBCS-3 reached the “strong column–weak beam” mechanism.
In the test of specimen FBCS-4, on the slab surface near the support end, several diagonal cracks appeared at approximately a 2.5% drift. At about a 4% drift, several diagonal cracks appeared on the slab surface adjacent to the joint. The maximum crack widths on the longitudinal beams reached 9 mm. Some vertical cracks appeared on the column end when the test was complete.
The ECC material on the longitudinal beam ends of FBCS-5 was crushed at last. However, there was no obvious damage on the column ends—only multiple cracks. Cracks also emerged on the floor slab surface adjacent to the support end at approximately 2.2% drift. The crack width on the top surface of the slab was 1 mm.
For FBCS-4 and FBCS-5, the longitudinal reinforced bars on the beam ends of specimens FBCS-4 and FBCS-5 also reached yielding before those on the column ends. However, the column end of FBCS-4 had slight damage when the test was complete. In contrast, for specimen FBCS-5, only some horizontal cracks appeared on the column. Thus, specimens FBCS-4 and FBCS-5 reached the “strong column–weak beam” mechanism.
All the ECC specimens maintained better integrity at a 6% drift. Figure 3 shows the final failure patterns of the five subassemblies, and Figure 4 shows the cracking state of the slab surface. The ECC subassemblies showed better integrity than the RC subassembly, and were prone to the “strong column–weak beam” yielding mechanism.

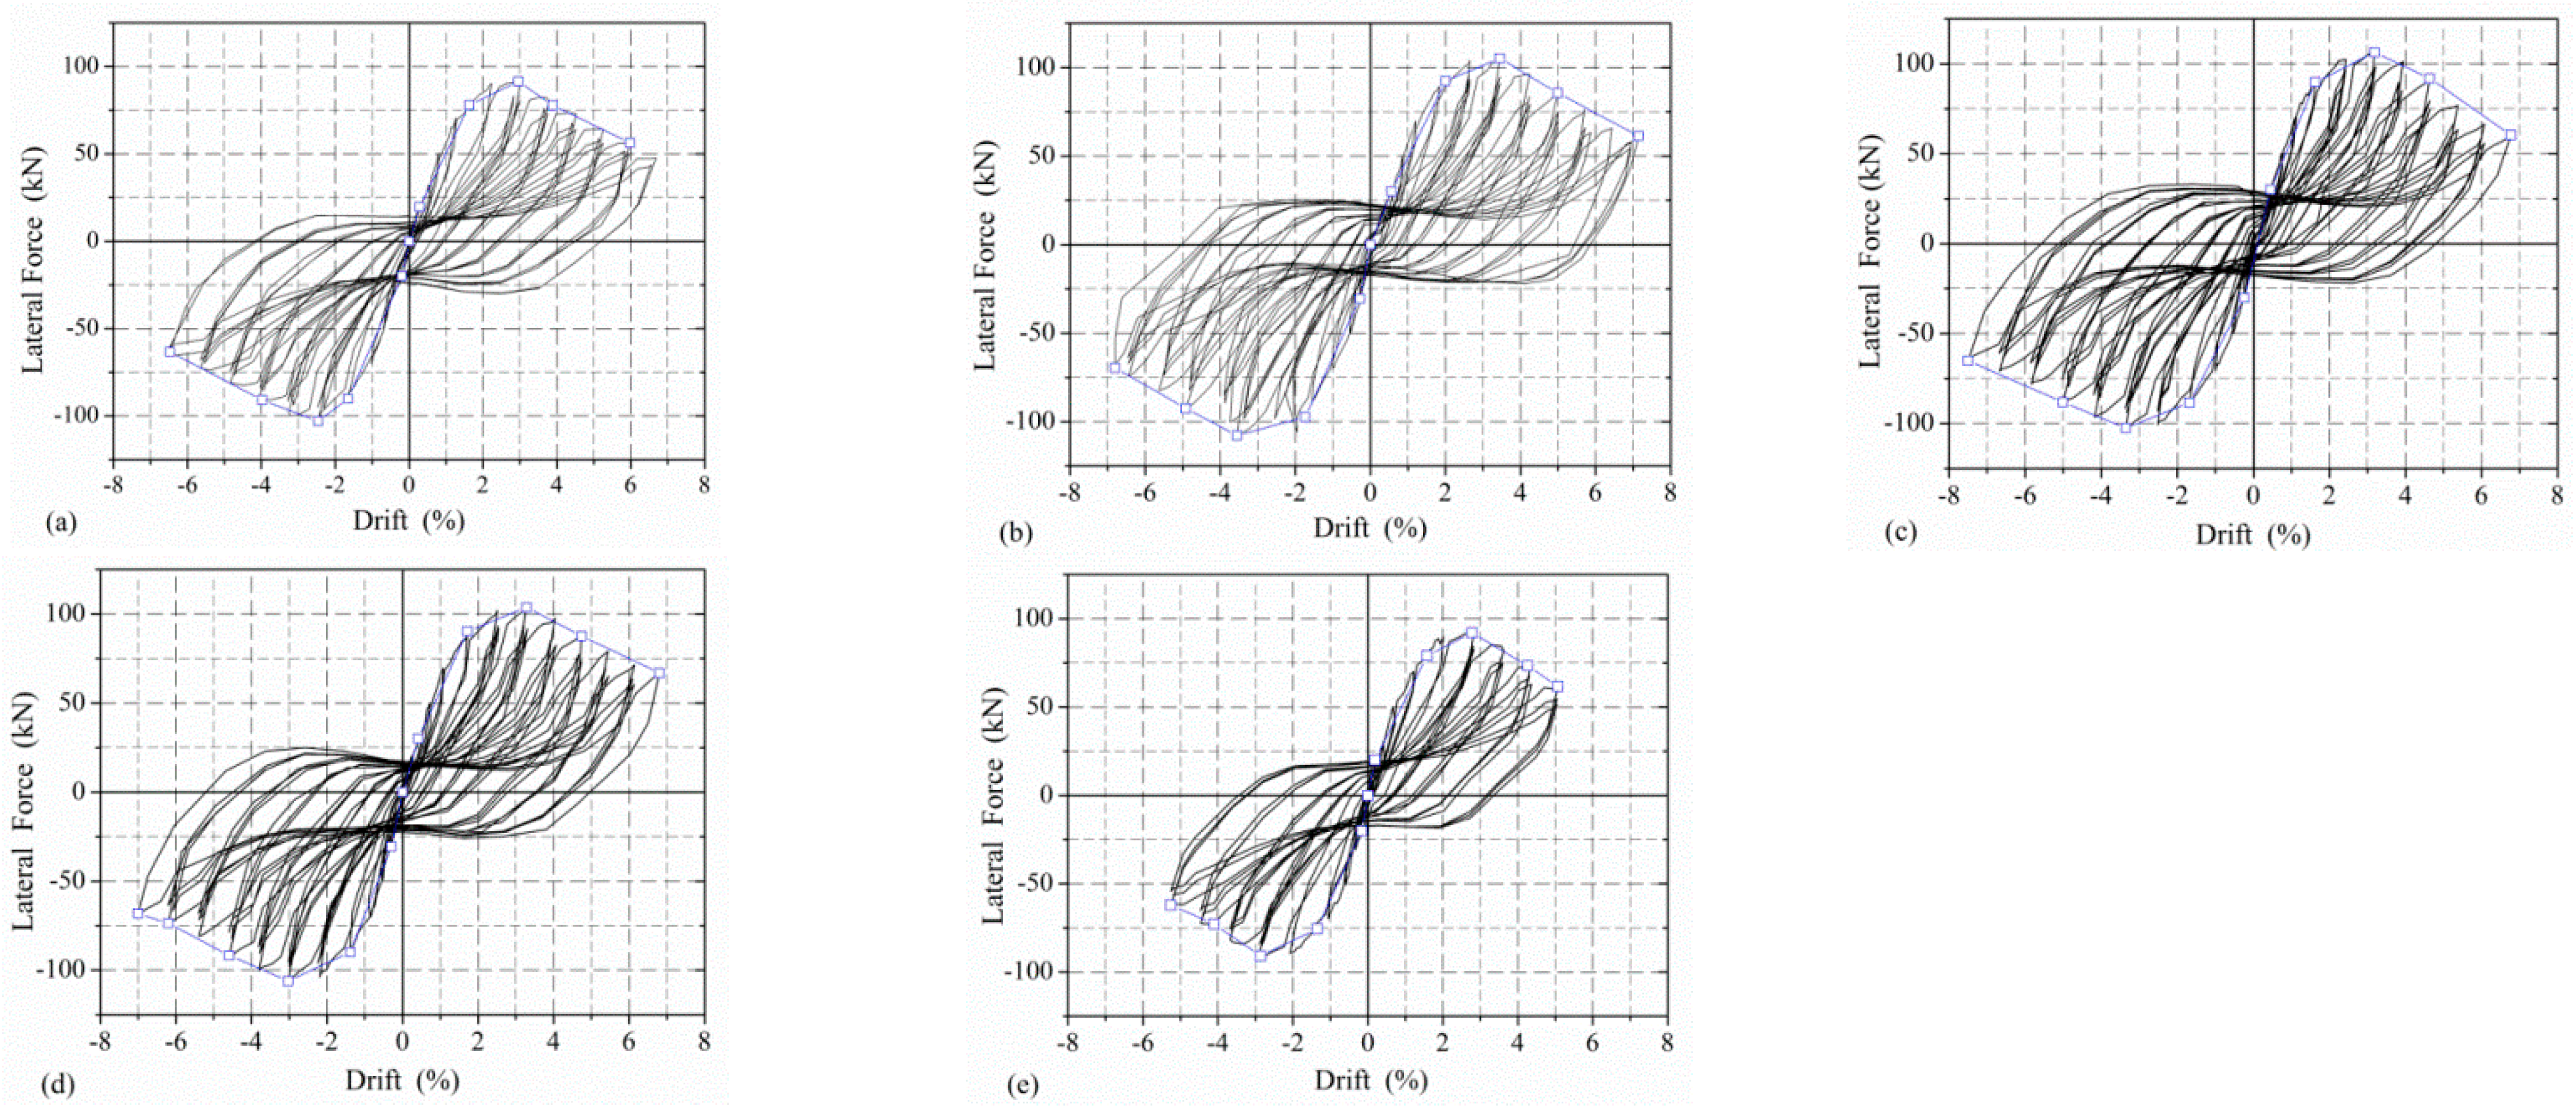
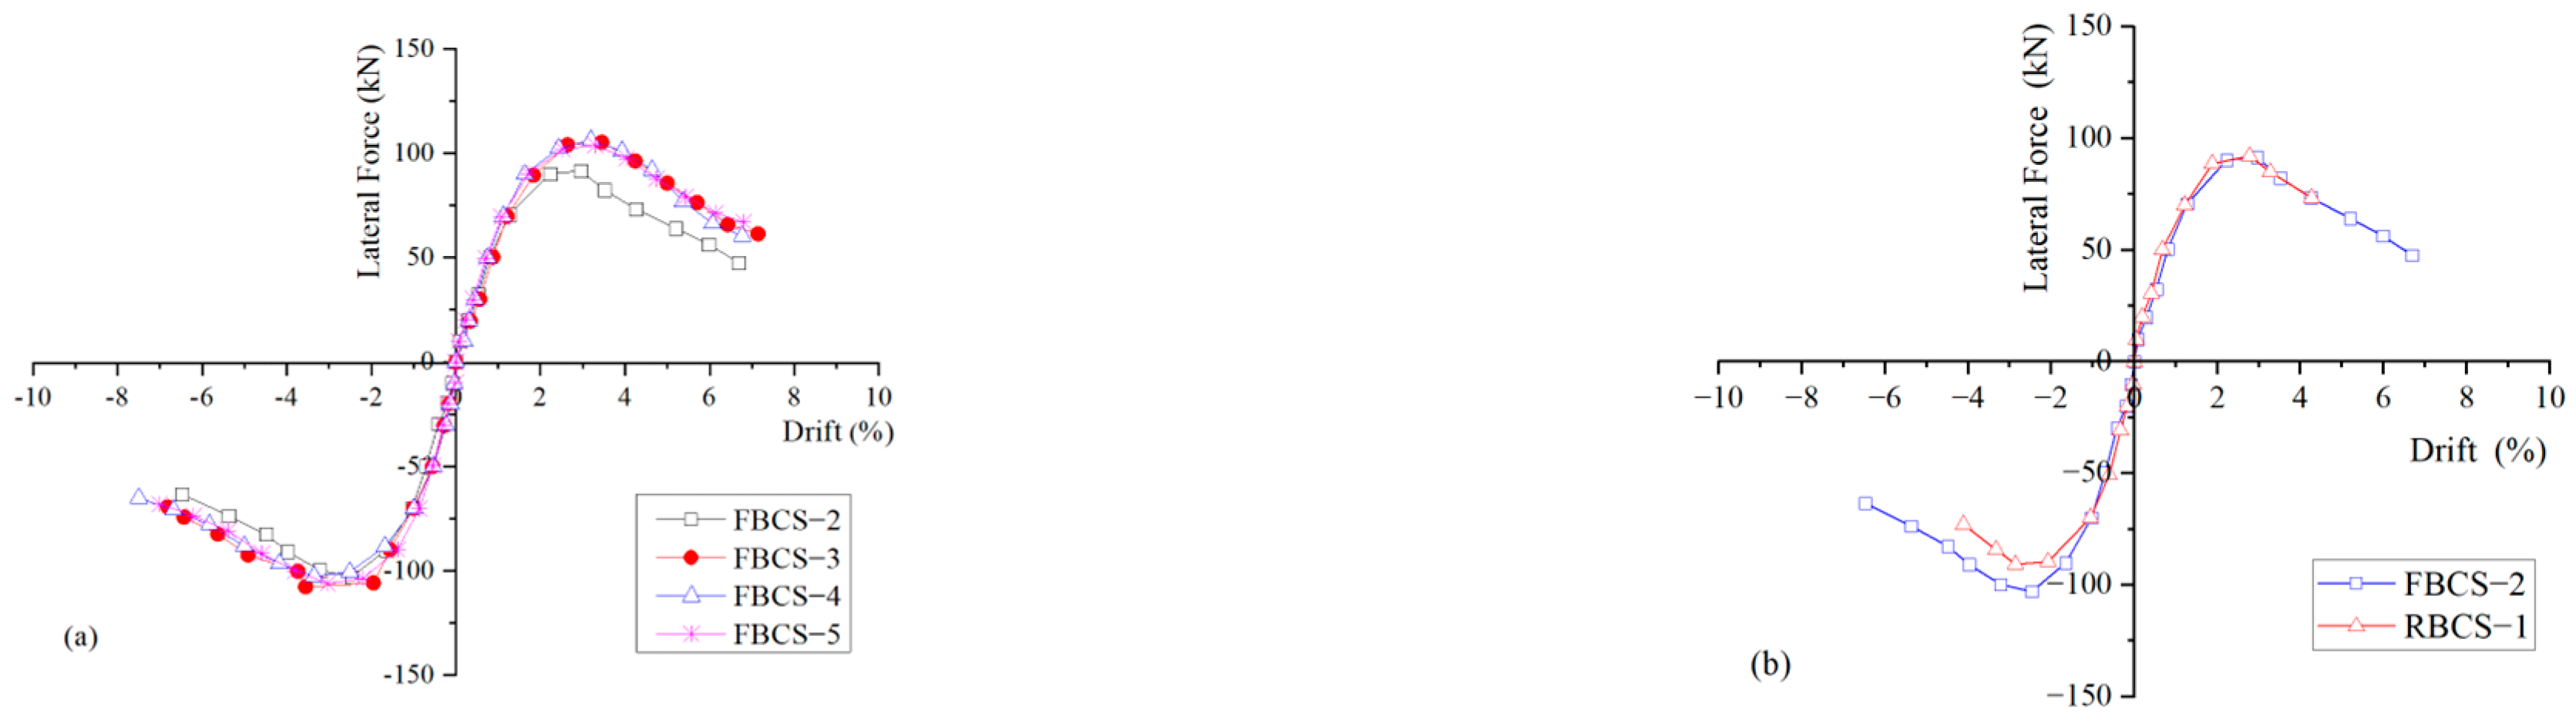
3.2. Load versus Deflection Response

Figure 5 shows the hysteretic curves of the five subassemblies, and Figure 6 shows the skeleton curves. The maximum loads at each level for the five specimens are listed in Table 3.
(1) For specimens RBCS-1 and FBCS-2, the two specimens had the same design parameters, except for the material used on the expected damaged positions. Compared with RBCS-1, the hysteresis curve area for specimen FBCS-2 (Figure 5b) was larger. The ultimate drift θu (the corresponding drift when the horizontal load capacity was down to 85% of the peak load) increased by 17%. The maximum load of FBCS-2 increased by 16% in the negative direction. The strain hardening properties of the ECC material still worked together with the reinforced bar despite the appearance of cracks, and this was supplemented by the higher ultimate compressive strain of ECC in the compression region. However, the concrete stopped working when the cracks appeared.
(2) When the ƞ was 1.2, the maximum load of FBCS-4 increased by about 16% over that of FBCS-2. There was little difference between the two specimens at a negative displacement. When the ƞ was 1.4, the maximum loads of FBCS-5 and FBCS-3 were similar to each other. This indicated that the hysteretic behavior was affected by the flange width when the ƞ was 1.2. Moreover, the flange width had little influence on the hysteretic behavior when the ƞ was 1.4.

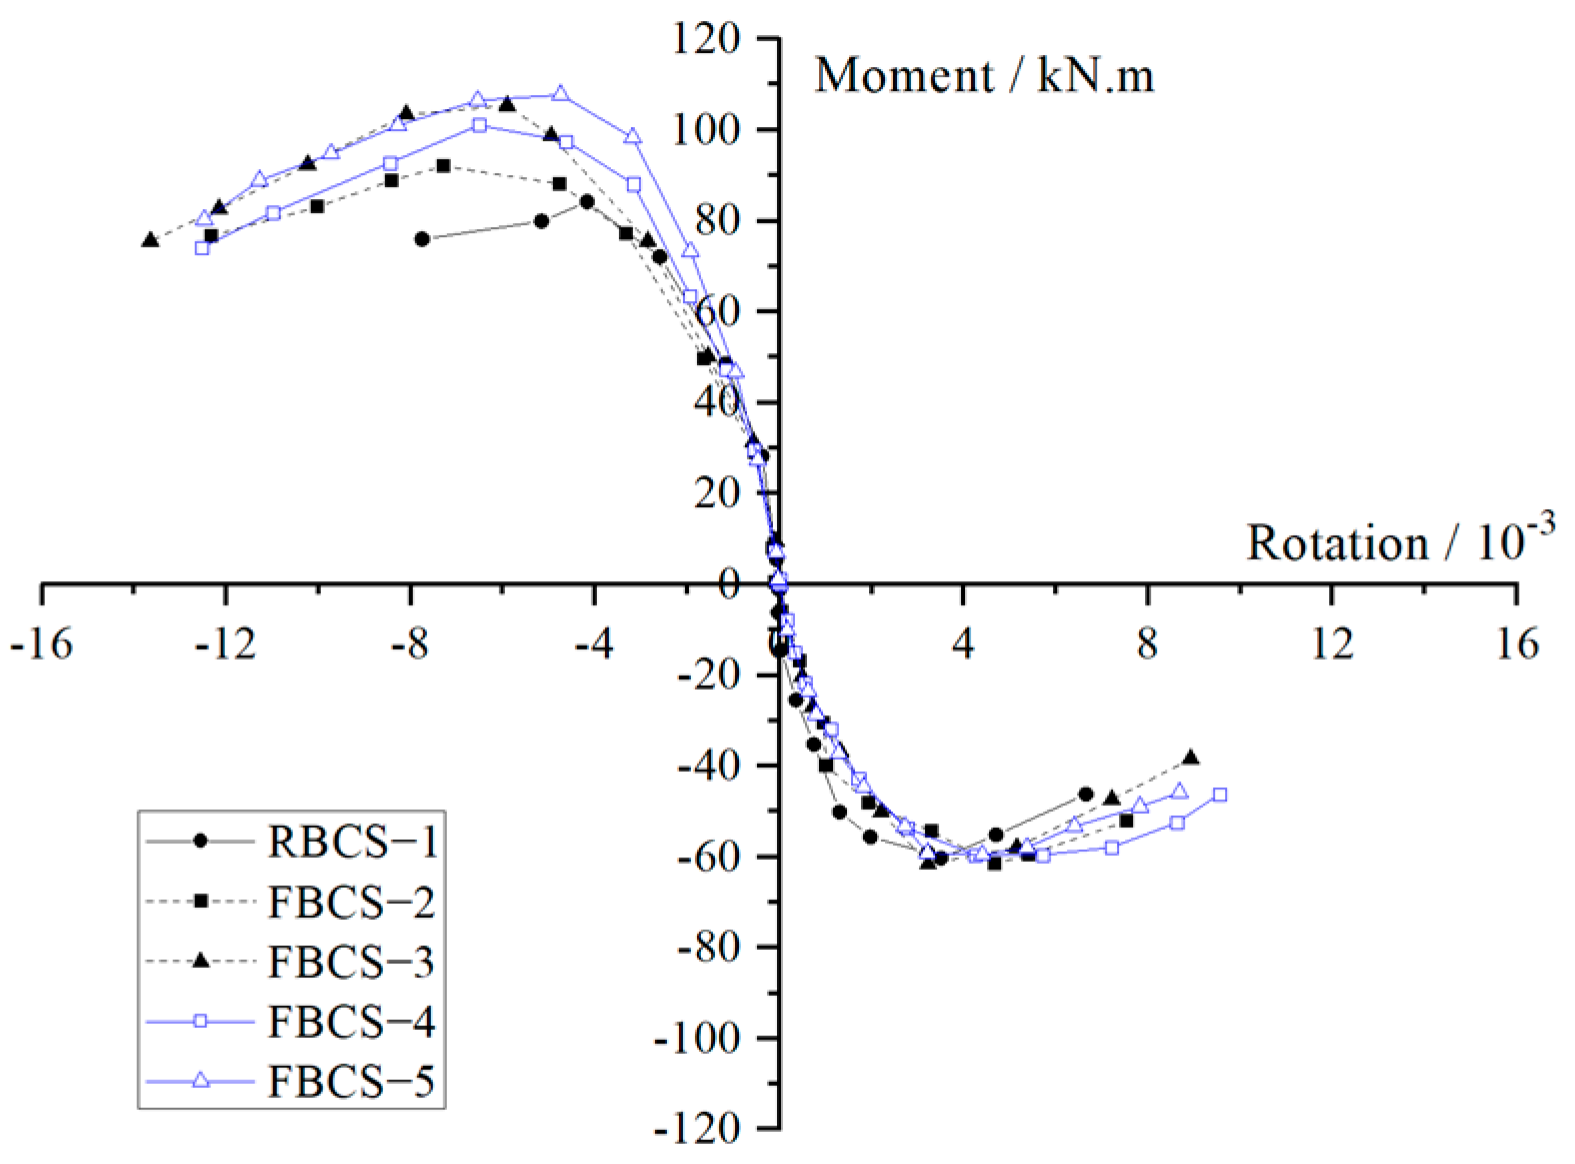
3.3. Moment versus Rotation Response

The moment in Figure 7 corresponded to the beam (on the west) section, which was 100 mm from the column edge (Mb = Nb × lb). Nb was obtained through the force transducer F2. The corresponding rotation φ was monitored through the dial indicator.
When the bottom of the beam was in tension, the maximum moments of the five specimens were similar, between 59.54 kN and 61.57 kN. However, the rotation φ corresponding to the maximum moment of RBCS-1 was about 34% smaller than that of FBCS-2. And the rotation φ corresponding to the maximum moments of FBCS-2 and FBCS-4 (the η values were 1.2) were similar, about 4.50 × 10⁻³~4.60 × 10⁻³. Then, the rotation φ corresponding to the maximum moments of FBCS-3 and FBCS-5 (the η values were 1.4) were similar, about 3.21 × 10⁻³. This was mainly because as the coefficient η increased, the damage to the beam end became more serious.
When the top of the west beam was in tension, the maximum moments of the five specimens were different from each other. For RBCS-1, the maximum moment reached 84.21 kN·m, and the corresponding rotation φ was 4.17 × 10⁻³. The maximum moment of FBCS-2 reached 92.04 kN·m, and the corresponding rotation φ was 4.17 × 10⁻³. Mainly because using the ECC in the plastic hinge area postponed the reinforced bar yielding in the slab, and reduced the yield range of the plate longitudinal ribs (in Section 3.5). Then, the occurrence of the peak loads was postponed, and the deformation ability of the beam improved. The maximum moment of FBCS-4 was 101.05 kN·m, which is 9.87% higher than that of FBCS-2, and the corresponding rotation φ was 11.81% smaller than that of FBCS-2. The maximum moment of FBCS-5 was 107.71 kN·m, while the maximum moment of FBCS-3 was 105.36 kN·m. The corresponding rotation φ was 24.42% smaller than that of FBCS-3. Because FBCS-4 and FBCS-5 were equipped with an 8h flange width, the rotational stiffness was greater than that of FBCS-2 and FBCS-3.

3.4. Stiffness

As shown in Figure 8a, the initial stiffness of RBCS-1 at a 0.085% drift was higher than that of FBCS-2 by a factor of approximately 1.55 since there was no coarse aggregate in the ECC material. However, the stiffness of specimen RBCS-1 decreased to less than that of specimen FBCS-2 at a drift of approximately 1.45%. The concrete under tension stopped working when cracks appeared and multiple micro—cracks formed in the ECC region. The ECC material could still work together with the bars.
For the specimens with an ƞ of 1.2, the initial stiffness of FBCS-4 was slightly greater than that of FBCS-2. During the following loading, the stiffness degradation of specimen FBCS-4 was slower. The secant stiffness of FBCS-4 was 19% larger than that of specimen FBCS-2 at 3% drift, because the lower column end of FBCS-2 was seriously damaged, but the column end of specimen FBCS-4 exhibited only slight vertical cracks.
For the specimens with an ƞ of 1.4, the difference in initial stiffness between FBCS-5 and FBCS-3 was small. During the following loading, the downward trend of the stiffness of the two specimens was close.

3.5. Energy Dissipation
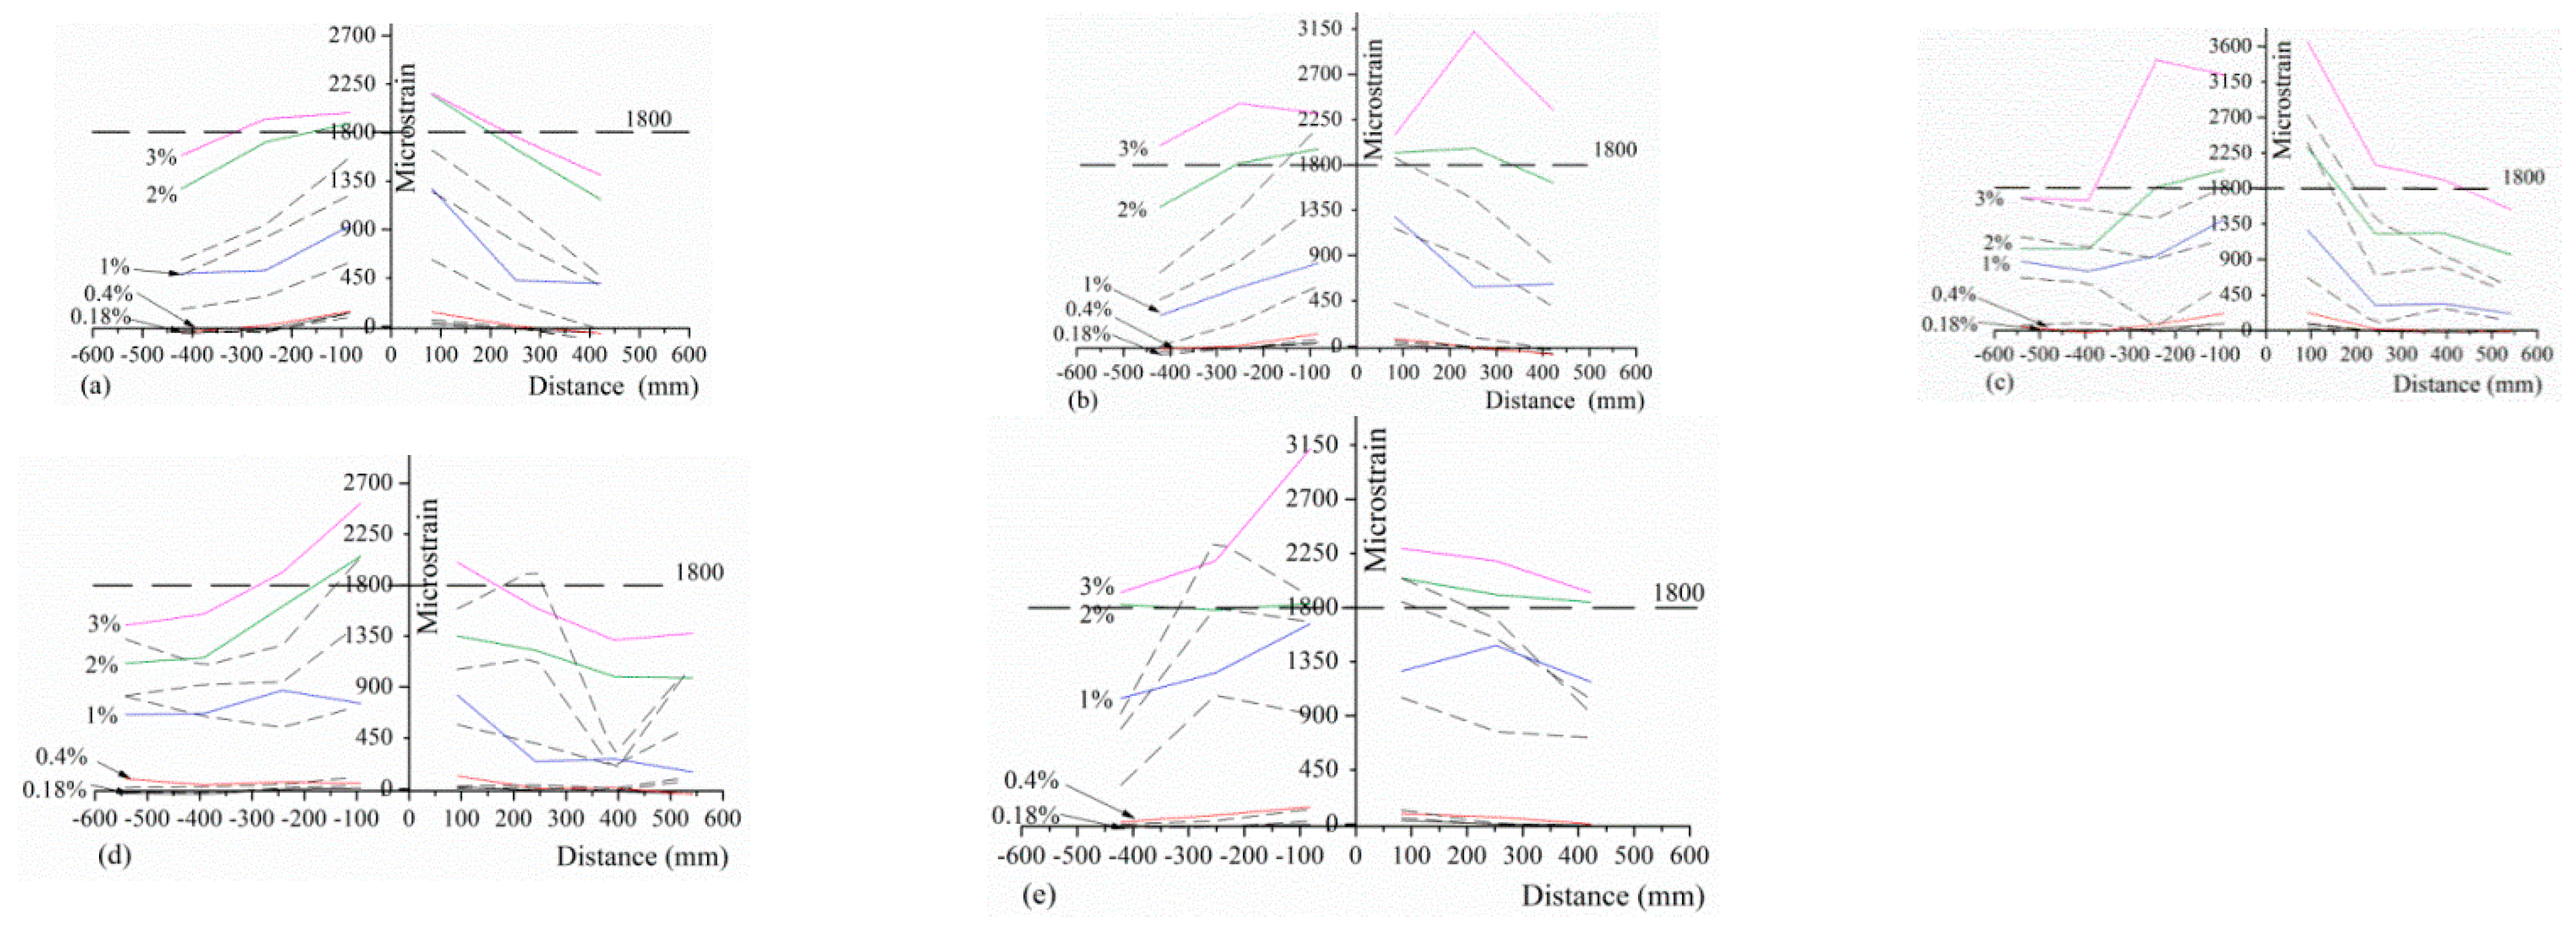
The ECC material showed micro—crack development characteristics. Therefore, it is expected that using the ECC material partially instead of concrete could dissipate more energy in an earthquake. The cumulative energy dissipation Esum was calculated as the sum of the energy dissipated from the previous cycles. As shown in Figure 9, the Esum of specimen FBCS-2 was smaller than the Esum of specimen RBCS-1 when the drift was between 2% and 4%. The reinforcement in the column and slab of specimen RBCS-1 yielded earlier than those of specimen FBCS-2. In addition, this was supplemented by the crushing and spalling concrete on the column end and the larger yielding rebar range in the flange. However, the test on RBCS-1 was stopped for safety reasons as the displacement increased. At a drift of 5.3%, the corresponding Esum of FBCS-2 was 1.38 times the Esum of RBCS-1.
For the specimens with an ƞ of 1.2, the energy dissipation capacities of specimen FBCS-2 were higher than those of specimen FBCS-4 when the drift was more than 4% because of the development of a horizontal crack, the appearance of a vertical crack, and yielding rebars in the column. However, as the displacement increased, FBCS-2 had serious damage, while specimen FBCS-4 increased energy dissipation by the reinforced bars yielding on the beam and slab. The Ecp (representing the accumulated dissipated energy corresponding to the peak load) of specimen FBCS-4 was 2.2 times that of specimen FBCS-2, and the Ecu (representing the accumulated dissipated energy corresponding to the failure load) of specimen FBCS-4 increased by 39%.
For the specimens with an ƞ of 1.4, the Ecp of FBCS-5 was 27% higher than that of FBCS-3. The cumulative energy of FBCS-5 was also higher than that of specimen FBCS-3 at the same drift ratio. For instance, at a drift ratio of 5%, the cumulative energy of specimen FBCS-5 was 1.18 times that of specimen FBCS-3.
Consequently, using the ECC in the expected positions would increase the energy dissipation capacity of the subassembly. The Ecu of the specimens with a flange width of 8h on each side of the beam was higher than those with a flange width of 6h.

3.6. Strain in Slab

A strain analysis was performed to study the influences of the yielding rebar range in the flange. Figure 10 shows the strain distribution of the reinforcement when the slab was in tension for different specimens. The measuring points on the reinforced bars were 50 mm and 250 mm apart from the column edge. The horizontal axis of the plot represents the location of the strain gauge with respect to the centerline of the longitudinal beam (zero position). The ordinate represents the strain gauge reading. The solid lines in the plots represent the strains measured on the top of the slab reinforcement; the dashed lines indicate the strains on the bottom slab reinforcement. For simplicity, only the strains measured at several drift levels are shown in the plots. The drift ratio of 2% is the plastic limit value of the concrete frame structure specified in the “Code for seismic design of building” [19]. This limit value is the controlling index of the design for the safety margin; the drift ratio measured in many tests in China has shown that the average drift of a concrete frame structure can reach approximately 3%. The yield strain of the reinforcement was approximately 1800 micro—strains.
The strains of the reinforced bars in the cross—section of the slab in specimen FBCS-2 (Figure 10a) were generally smaller than those of RBCS-1 (Figure 10e). All the reinforcement in the top slab of specimen RBCS-1 reached their yielding at a drift of 2%, and the reinforced bars on the bottom of the flange in a range of 4h reached its yield. For specimen FBCS-2 at a drift of 3%, the reinforcement on the top slab in the range of approximately 4h reached yielding; each strain on the bottom slab reinforcement was less than the yield strain. Due to the ECC material strain hardening behavior, the ECC could still bear the tensile stress together with the reinforced bars after the initial cracks appeared. Then, the range of slab reinforcement participation was limited.
For specimen FBCS-4 at a drift of 3%, the reinforcement in the range of a 5h flange width on the top slab reached yielding, and the reinforcement on the slab edge was close to yielding; the bottom slab reinforcement was close to yielding. For specimens FBCS-5 and FBCS-3 at a drift of 3%, the yield reinforcements on the top slab were similar; the strain of the reinforcements in the range of approximately 6h reached the yield strain. Moreover, the strain values of the reinforcement on the bottom slab edge of specimen FBCS-5 were higher than those of specimen FBCS-3.
The strains on the top slab—reinforced bars of specimen FBCS-3 were higher than those of specimen FBCS-2; however, the yield strains at the longitudinal slab—reinforced bars of specimen FBCS-4 and FBCS-5 were similar.
Consequently, for the specimens with an ƞ of 1.4, the reinforced bars in the range of approximately 6h of the slab reached yielding or close to yielding. For the specimens with an ƞ of 1.2, the reinforced bars in the range of approximately 4h–5h of the slab reached yielding. This showed that the ƞ had a great influence on the slab participation range.

4. Numerical Simulation

Six prototype models were simulated using the ABAQUS 6.12 finite element software package. The large universal finite element software package ABAQUS has been widely used in the nonlinear analysis of reinforced concrete structures.
Concrete Damaged Plasticity (CDP) is one of the most important concrete constitutive models in ABAQUS. This plastic damage model was used in the finite element analysis of concrete and ECC. The parameters for normal concrete were defined on the basis of the ABAQUS Analysis Manual [20]. The ECC constitutive model was a reference to Li Yan [21]. The reinforced bar used the strengthening plastic bilinear model.
The embedded restrain was used to simulate the relationship between the RC(ECC) and the rebars. However, this restrain could not simulate the bond–slip. Thus, the bond–slip was reflected by the stress–strain relationship between the reinforced concrete and the ECC.

4.1. Design of the Prototype Models

To further investigate the influence of the flange width on the seismic behavior of the beam–column–slab subassembly, including the failure mechanism, the effect of the ECC material on the slab contribution to beam flexural capacity, and the range of the yielding slab reinforcement, six models were designed and analyzed. The simulation models are shown in Figure 11.
On the basis of the prototype, the basic parameters of the beam and slab remained unchanged, and the reinforcement of the column adjustment was maintained according to the coefficient ƞ. The longitudinal beam and transverse beam cross—sections were 250 mm × 600 mm, and those of the column 600 mm × 600 mm. The floor slabs were 120 mm thick. The ECC material was used in the mesh refinement region (Figure 11); the other region was constructed with concrete. The five models are similar in shape to those in Figure 11; only the distance between the inflection points of the external ends of the left and right beams was 6 m; the distance between the inflection points on the top and bottom column ends was 3.6 m. The reinforcement in the slab was 8@180, and the grade was HRB400; the other reinforcement parameters of the models are listed in Table 4.
The grade of the ECC and concrete strength was C35. The mechanical properties of the concrete, ECC, and reinforced bar are listed in Section 2.2 and Table 5.

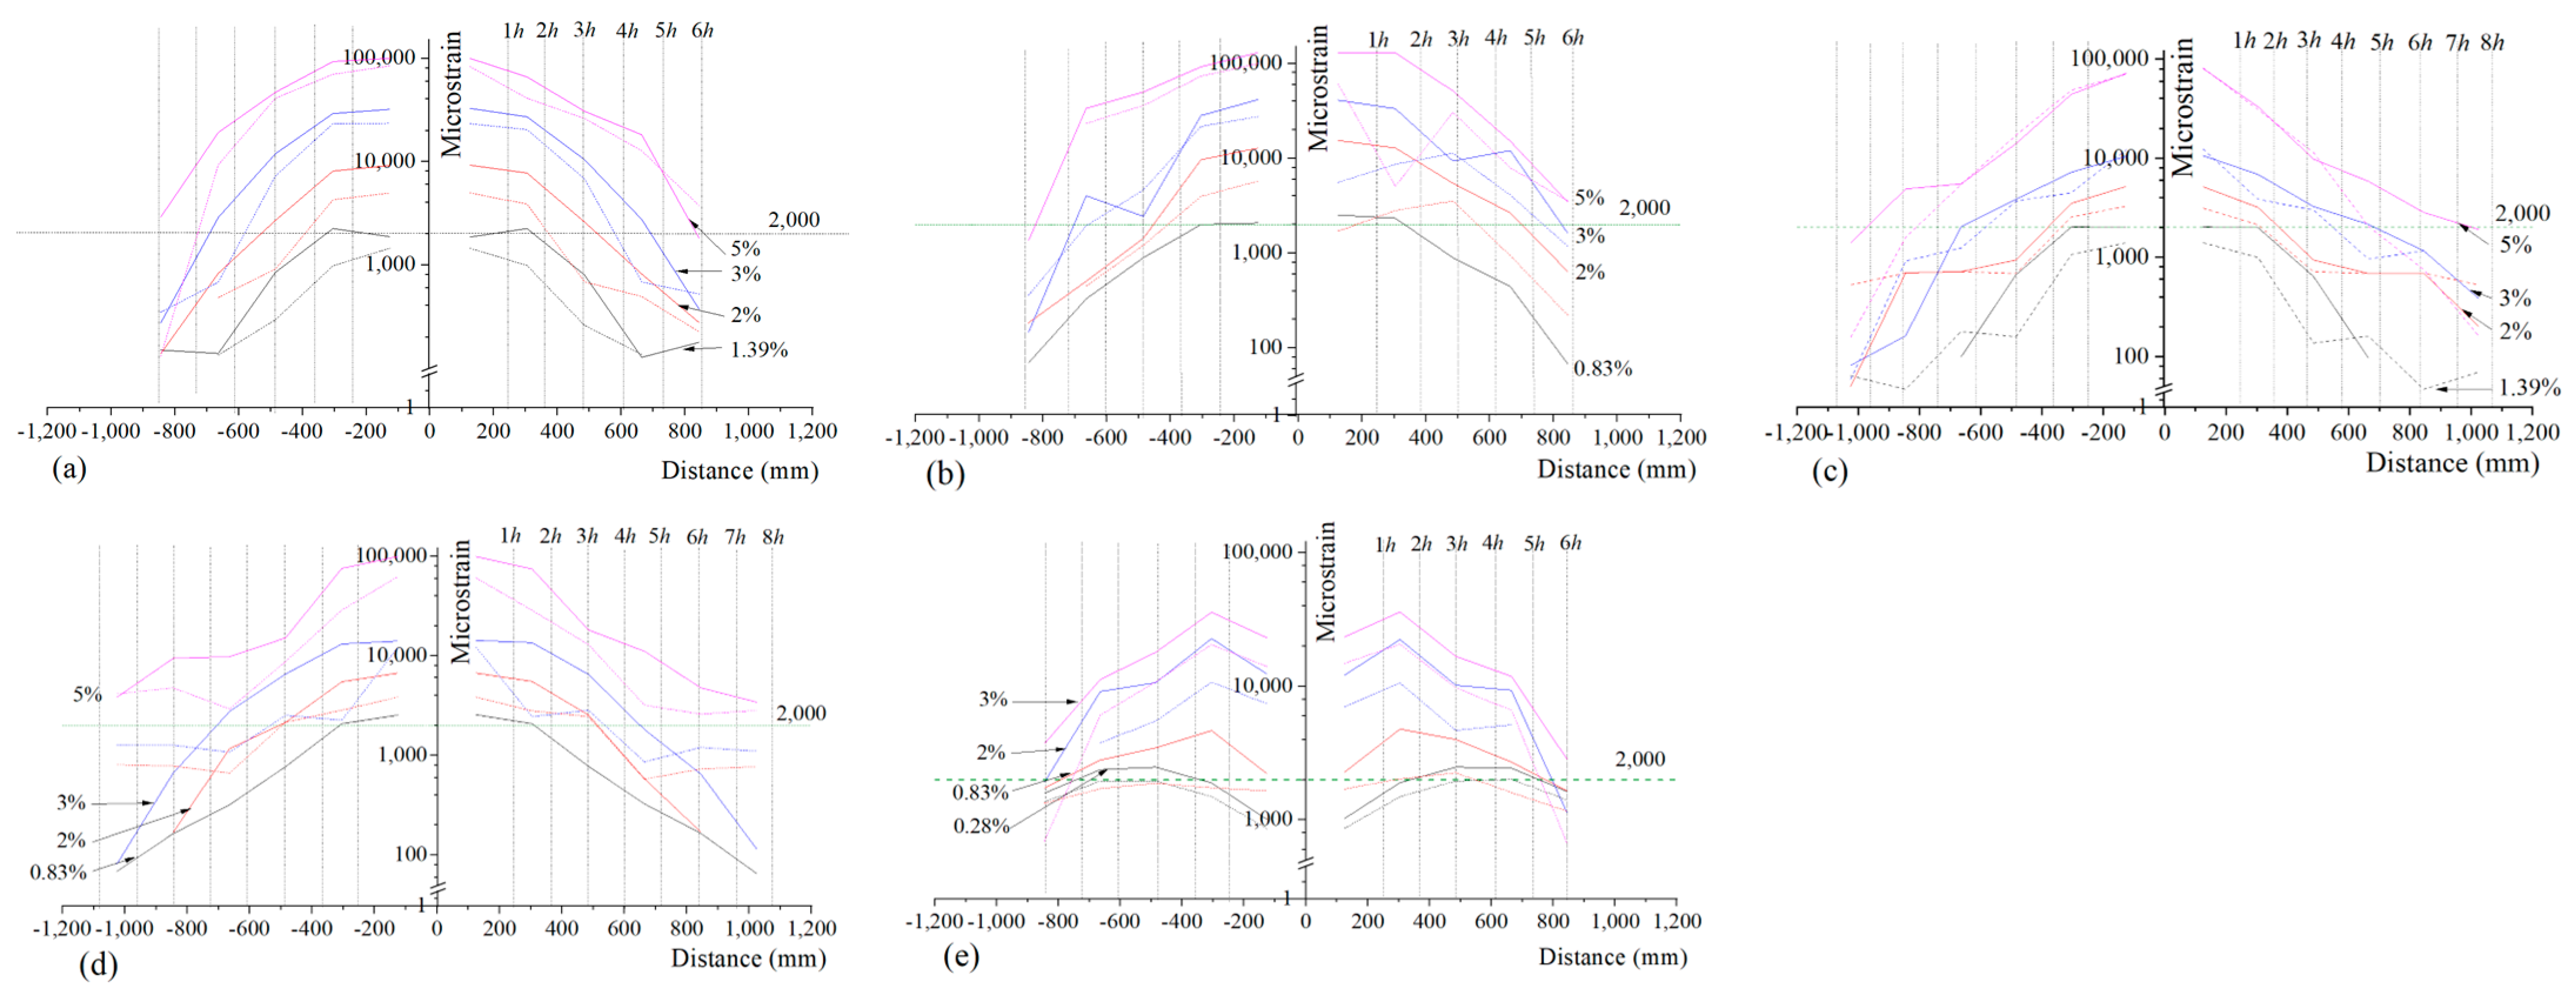
4.2. Analysis of Simulation Result

Quasi—static reversed cyclic load simulations were conducted on the five models. According to the data of the strain monitored in the simulation, the four ECC models all achieved a strong column and weak beam. The longitudinal reinforced bars at the ends of the beam and column of the RC model S-RBCS-1 (the ƞ was 1.2) reached yielding simultaneously. In the tests, the column end of FBCS-2 had serious damage, and the reinforced bars at the column end of specimen RBCS-1 yielded before those at the beam ends. These differences were because the material strength used in the simulation was the average value of the material strength according to the code. Thus, there is no difference between the material strengths of the beam and column. However, in the tests, the actual material strength of the beam—reinforced bars was 1.23 times the average value in the code; the actual strength of the column—reinforced bars was 1~1.1 times that in the code. This all resulted in the failure of the column in the tests of the two specimens.
Figure 12 shows the strain distribution of the slab—reinforced bars. The measuring points were 100 mm apart from the column edge. The horizontal ordinate in the plot represents the location of the strain gauge with respect to the centerline of the longitudinal beam (zero position). The ordinate represents the strain gauge reading. For simplicity, only the strains measured at special drifts are shown in the plots.
(1) The ECC material could influence the range of slab reinforcement participation in the beam flexural strength. Comparisons were made between Figure 12a,e. The reinforced bars in the slab of model S-RBCS-1 began to yield at a drift of 0.28%; those on the top slab in a range of 5h reached yielding at a drift of 0.83%; those on both the top and bottom slabs in the range of 5h width reached yielding at a drift of 2%. For model S-FBCS-2 at a drift of 0.83%, the gage at the borderline of the ECC and RC in the slab reached the yielding strain; the strains on the top slab bars that were 100 mm apart from the column edge yielded at a drift of 1.39%. The bars in a range of 3h yielded at a drift of 2%; this value was approximately 5h at a drift of 3% and 6h at a drift of 5%, except for the bars at the outermost layer of the bottom slab.
(2) The effect of the flange width on the slab reinforcement participation.
Models S-FBCS-2 and S-FBCS-4 were designed with the same ƞ of 1.2 but with different flange widths. The situations of the reinforcement yielding of the two models were similar. The strains on the slab bars reached the yield strain at a drift of 1.39%; at the drift of 2%, the reinforcement in the range of a 3h flange width reached yielding. And the yielding reinforcement range reached 5h at a drift of 3%. At the drift of 5%, plotted in Figure 12a,c, the bars in the range of 6h on the slab of model S-FBCS-2 reached yielding; however, the yielding bar range in the flange of model S-FBCS-4 was approximately 7h, and the bars at the outermost layer were close to yielding.
Models S-FBCS-3 and S-FBCS-5 were designed with the same column-to-beam flexural strength ratio of 1.4 but with different flange widths. When interlayer deformation reached 3%, the slab bars of models S-FBCS-3 and S-FBCS-5 in a range of 5h reached yielding. As plotted in Figure 12b,d, the bars in the range of 6h in the slab of model S-FBCS-3 reached yielding at a drift of 5%; however, the bars in the slab of model S-FBCS-5 all reached yielding with a flange width of approximately 8h.
Meanwhile, the reinforced bars on the columns of models S-FBCS-2 and S-FBCS-3 reached yielding at a drift of 1.67%. Those of model S-FBCS-3 and model S-FBCS-5 yielded at a drift of 2.5%.
(3) The influence of ƞ on slab reinforcement contribution
The forced states of models S-FBCS-2 and S-FBCS-3 were similar during the initial loading procedure. The strain values and yielding reinforcement range in the flange of S-FBCS-3 were higher than those of model S-FBCS-2 at drifts of 2% and 3%. All the bars in the slabs of models S-FBCS-3 and S-FBCS-2 reached yielding.
The ranges of the yield reinforced bars in the slab of model S-FBCS-5 at different specific drifts were all wider than those of model S-FBCS-4. For instance, at a drift of 5%, all the bars in the slab of model S-FBCS-5 had yielded, but the reinforced bars at the outermost layer in the slab of model S-FBCS-4 had not.
For the different material values used in the test and simulation, the result of the yielding reinforcement region in the flange appeared slightly different.
As discussed above, the range of the yield reinforced bars in the slabs of the ECC models was a 5h flange width at a drift of 3%. At a drift of 5%, all the bars in the slab of each model reached yielding, except for very few bars at the outermost layer.

5. Conclusions

Using the ECC in key positions of beam–column–slab subassemblies was studied in both experiments and simulations. The influence of the ECC material on the seismic performance and damage mechanism was investigated. The following conclusions can be drawn:
(1)
The maximum bearing capacity of the ECC subassembly was increased by 15% compared to the RC specimens, and the θu was improved by 19%. The Esum (cumulative hysteretic energy) increased by 34%.
(2)
The use of the ECC material in an RC beam–column assembly can result in a strong column and weak beam failure mechanism. As shown in the results of the tests and simulations, using the ECC material instead of concrete in key positions of the beam–column–slab subassemblies could reduce the range of slab reinforcement participation to beam flexural strength. At a drift of 2%, the range of the yielding bars in the slab of the RC models was 5~6 times the slab thickness, nearly all the reinforcement in the flange. In comparison, the range of the yielding bars in the slab of the ECC models was 3 times the slab thickness. It is beneficial for beam–column–slab subassemblies to reach the “strong column–weak beam” yielding mechanism.
(3)
As the ƞ increased, the cumulative energy dissipation capacity of the beam–column–slab subassemblies increased, and the strength degeneration coefficient decreased. The specimens with a flange width of 8h on both sides of the longitudinal beam had a higher energy dissipation capacity and a reduced the strength degeneration coefficient compared with those with a flange width of 6h.
(4)
The range of the yield reinforcement in the flange of specimens FRCS-4 and FRCS-5 was larger than that of specimens FRCS-2 and FRCS-3 at a drift ratio of 3%, because the column flexural strength corresponding to the former was larger than that of the latter. At a drift of 3%, strains on the slab—reinforced bars in the range of 5h reached the yield strain in both the tests and simulations; at a drift of 5%, the strains at the slab bars in the range of approximately 8h reached the yield strain.
(5)
The ƞ had some influence on the yielding range in the flange. With the increasing ratios, the strains and range of the yield bars all increased slightly.

Author Contributions

Conceptualization, X.L.; software, K.G.; formal analysis, J.P.; investigation, T.L. and J.P.; data curation, K.G.; writing—original draft preparation, T.L. and K.G.; writing—review and editing, T.L. and X.L.; supervision, X.L.; project administration, X.L.; funding acquisition, T.L. and J.P. All authors have read and agreed to the published version of the manuscript.

Funding

This research was funded by the Natural Science Foundation of Shaanxi Province, grant number were “2021JQ–873” and “2022JQ–557”; the Youth Innovation Team of Shaanxi Provincial Department of Education, grant number was 21JP140; the Special Fund for High–level Talents of Xijing University, grant number was XJ20B08.

Data Availability Statement

The data that support this study are available from the corresponding author upon reasonable request.

Acknowledgments

The authors express their gratitude to those who provided the equipment and technical support for the test of the paper.

Conflicts of Interest

The authors declare no conflict of interest.

References

  1. Civil Structural Groups of Tsinghua University, Xinan Jiaotong University, and Beijing Jiaotong University. Analysis on Seismic Damage of Buildings in the Wenchuan Earthquake. J. Build. Struct. 2008, 4, 1–9. [Google Scholar] [CrossRef]
  2. Lin, X.C.; Pan, P.; Ye, L.P. Analysis of the Damage Mechanism of a Typical RC Frame in Wenchuan Earthquake. China Civ. Eng. J. 2009, 29, 13–20. [Google Scholar]
  3. Park, S.; Mosalam, K.M. Experimental Investigation of Nonductile RC Corner Beam—Column Joints with Floor Slabs. J. Struct. Eng. 2013, 39, 1–14. [Google Scholar] [CrossRef]
  4. GB 50010-2010; Code for Design of Concrete Structures. MOHURD (Ministry of Housing and Urban—Rural Development of China): Beijing, China, 2011.
  5. ACI 318-2014 and ACI318R-14; Building Code Requirements for Structural Concrete and Commentary. American Concrete Institute: Farmington Hills, MI, USA, 2014.
  6. NZS3101; Concrete Structures Standard. The trading arm of the Standards Council, Standards New Zealand: Wellington, New Zealand, 2006.
  7. Pantazopoulou, S.J.; French, C.W. Slab Participation in Practical Earthquake Design of Reinforced Concrete Frames. ACI Struct. J. 2001, 98, 479–489. [Google Scholar]
  8. Cheung, P.C.; Paulay, T.; Park, R. Mechanism of Slab Contribution in Beam—Column Subassemblages; Design of Beam—Column Joint for Seismic Resistance, ACI SP—123; American Concrete Institute: Farmington Hill, MI, USA, 1991; pp. 259–290. [Google Scholar]
  9. Dhakal, R.P.; Peng, B.H.H.; Fenwick, R.C.; Carr, A.J.; Bull, D.K. Cyclic Loading Test of Reinforced Concrete Frame with Precast—Prestressed Flooring System. ACI Struct. J. 2014, 111, 777–788. [Google Scholar] [CrossRef]
  10. Li, V.C.; Kanda, T. Engineered Cementitious Composites for Structural Applications. J. Mater. Civ. Eng. 1998, 10, 66–69. [Google Scholar] [CrossRef] [Green Version]
  11. Zhang, Q.; Wei, Z.Y.; Gu, X.L.; Yang, Q.H.; Li, S.Y.; Zhao, Y.S. Confinement behavior and stress—strain response of square concrete columns strengthened with carbon textile reinforced concrete (CTRC) composites. Eng. Struct. 2022, 266, 114592. [Google Scholar] [CrossRef]
  12. Zhang, Q.; Yang, Q.C.; Gu, X.L.; Jiang, Y. Study on axial compression properties of concrete columns wrapped with basalt textile—reinforced fine concrete (BTRC) jackets. Constr. Build. Mater. 2023, 363, 129809. [Google Scholar] [CrossRef]
  13. Zhang, Q.; Yang, Q.C.; Li, W.J.; Gu, X.L.; Dai, H.H. Study on model of flexure response of Carbon Fiber Textile Reinforced Concrete (CTRC) Sheets with short AR—glass fibers. Case Stud. Constr. Mater. 2023, 18, e01791. [Google Scholar] [CrossRef]
  14. Fischer, G.; Li, V.C. Deformation Behavior of Fiber—Reinforced Polymer Reinforced Engineered Cementitious Composite (ECC) Flexural Members under Reversed Cyclic Loading Conditions. ACI Struct. J. 2003, 100, 25–35. [Google Scholar]
  15. Mirzahosseini, H.; Mirhosseini, S.M.; Zeighami, E. Progressive collapse assessment of reinforced concrete (RC) buildings with high—performance fiber—reinforced cementitious composites (HPFRCC). Structures 2023, 49, 139–151. [Google Scholar] [CrossRef]
  16. Zhang, Y.X.; Yao, X.Y.; Li, T.; Deng, M. Application of engineered cementitious composites in the plastic hinge of reinforced concrete beams for seismic enhancing. Struct. Concr. 2022, 23, 2732–2747. [Google Scholar] [CrossRef]
  17. Han, S.W.; Lee, S.H. Cyclic behavior of high—performance fiber—reinforced cementitious composite corner joints. J. Build. Eng. 2022, 47, 103892. [Google Scholar] [CrossRef]
  18. Han, S.W.; Kang, H. Seismic behavior of high—performance fiber reinforced cementitious composites columns with limited reinforcement details. Eng. Struct. 2023, 277, 115419. [Google Scholar] [CrossRef]
  19. GB50011-2010; Code for Seismic Design of Buildings. MOHURD (Ministry of Housing and Urban—Rural Development of China): Beijing, China, 2010.
  20. ABAQUS Inc. Abaqus Analysis User’s Manual 6.12; ABAQUS Inc.: Providence, RI, USA, 2012. [Google Scholar]
  21. Li, Y.; Liang, X.W.; Deng, M.K. A constitutive model for high performance PVA fiber reinforced cement composites under conventional triaxial compression. Eng. Mech. 2012, 29, 106–113. [Google Scholar]
Figure 1. Dimensions Details of models: (a) details of specimens; (b) A–A beam section; (c) B–B column section. Note: the values between the brackets are the dimensions of FBCS-4 and FBCS-5.
Buildings 13 01942 g001aBuildings 13 01942 g001b
Figure 2. Test setup and measurement: (a) test setup; (b) measurement layout.
Buildings 13 01942 g002
Figure 3. Final failure pattern of specimens: (a) FBCS-2; (b) FBCS-3; (c) FBCS-4; (d) FBCS-5; (e) RBCS-1.
Buildings 13 01942 g003
Figure 4. Final failure pattern of slabs: (a) FBCS-2; (b) FBCS-3; (c) FBCS-4; (d) FBCS-5; (e) RBCS-1.
Buildings 13 01942 g004
Figure 5. Load—deformation curves: (a) FBCS-2; (b) FBCS-3; (c) FBCS-4; (d) FBCS-5; (e) RBCS-1.
Buildings 13 01942 g005
Figure 6. Skeleton curves: (a) comparison between ECC specimens; (b) comparison between RC and ECC specimens.
Buildings 13 01942 g006
Figure 7. Moment–rotation skeleton curves (west beam).
Buildings 13 01942 g007
Figure 8. Stiffness–drift curves of specimens: (a) comparison between ECC and RC specimens; (b) comparison between FBCS-2 and FBCS-4; (c) comparison between FBCS-3 and FBCS-5.
Buildings 13 01942 g008
Figure 9. Stiffness–drift curves of specimens: (a) comparison between ECC and RC specimens; (b) comparison between ECC specimens.
Buildings 13 01942 g009
Figure 10. Strain distribution on the cross—section of the plate: (a) FBCS-2; (b) FBCS-3; (c) FBCS-4; (d) FBCS-5; (e) RBCS-1.
Buildings 13 01942 g010
Figure 11. Simulation model.
Buildings 13 01942 g011
Figure 12. Strain distribution of longitudinal slab reinforcement for simulation models: (a) model S-FBCS-2; (b) model S-FBCS-3; (c) model S-FBCS-4; (d) model S-FBCS-5; (e) model S-RBCS-1.
Buildings 13 01942 g012
Table 1. Parameters of subassemblies.
Specimen NumberColumnBeamSlab
/Flange Width
Compositesη
UpperLower
RBCS-14–184–162–16ϕ6.5@170
/6h
RC1.2
FBCS-24–18R/ECC1.2
FBCS-34–18 + 4–16R/ECC1.4
FBCS-44–16 + 4–14ϕ6.5@150
/8h
R/ECC1.2
FBCS-58–18R/ECC1.4
Table 2. Mechanical properties of reinforced bars.
d (mm)fy (Yield Strength, MPa)fu (Ultimate Strength, MPa)
6.5 (HPB300)385560
12 (HRB400)472659
14 (HRB400)430615
16 (HRB400)533710
18 (HRB400)460660
20(HRB400)426610
Table 3. Maximum values of the load at each level.
CyclesP+ (kN)P (kN)
RBCS-1FBCS-2FBCS-3FBCS-4FBCS-5RBCS-1FBCS-2FBCS-3FBCS-4FBCS-5
0.75Δy80.578.382.188.185.2−80.4−85.9−92.0−87.3−93.9
Δy92.0 *91.5 *104.0102.3101.8−90.8 *−103.0 *−105.9−100.6−103.7
2Δy84.982.3105.2 *106.3 *103.8 *−84.2−99.7−107.7 *−102.6 *−106.0 *
3Δy73.373.496.3101.197.6−72.9−90.9−100.3−96.5−100.2
4Δy61.664.285.691.987.762.0−82.6−92.4−88.2−91.7
5Δy56.376.476.979.1−73.7−82.4−77.9−80.8
6Δy47.765.766.371.5−63.4−74.3−70.8−73.6
7Δy61.460.467.0−69.5−65.1−68.1
* Maximum measured loads.
Table 4. Information of simulation subassemblies.
NumberBeamFlange WidthColumnƞ
LongitudinalStirrupsLongitudinalStirrups
S-RBCS-18–22/
5–22
8@1006h a8–228@100/150
(12@100) b
1.2
S-FBCS-26h8–228@100/150
(12@100)
1.2
S-FBCS-36h4–25 + 8–228@100/150
(12@100)
1.4
S-FBCS-48h12–208@100/150
(12@100)
1.2
S-FBCS-58h16–228@100/150
(12@100)
1.4
a h is the slab thickness. b Data in the brackets are the stirrup in the joint core.
Table 5. Mechanical properties of reinforced bars (the average value specified in the code).
Bars GradeYield Strength (MPa)Yield StrainUltimate Strain
HRB4004320.0020.01
Disclaimer/Publisher’s Note: The statements, opinions and data contained in all publications are solely those of the individual author(s) and contributor(s) and not of MDPI and/or the editor(s). MDPI and/or the editor(s) disclaim responsibility for any injury to people or property resulting from any ideas, methods, instructions or products referred to in the content.

