Article

Source Identification and Characterization of Indoor Particulate Matter in Potala Palace Museum

1
School of Civil and Resource Engineering, University of Science and Technology Beijing, Beijing 100083, China
2
National Centre for Archaeology, Beijing 100013, China
3
Chinese Academy of Cultural Heritage, Beijing 100029, China
*
Author to whom correspondence should be addressed.
Buildings 2023, 13(9), 2138; https://doi.org/10.3390/buildings13092138
Submission received: 2 May 2023 / Revised: 14 August 2023 / Accepted: 16 August 2023 / Published: 23 August 2023
(This article belongs to the Section Building Energy, Physics, Environment, and Systems)

Abstract

:
This study aims to determine the sources of indoor particulate matter at the Potala Palace Museum in Tibet, China, and evaluate the potential hazards of these pollutants for cultural relics. Long-term monitoring of indoor and outdoor suspended particulate matter concentrations was conducted, and sediment particle samples were collected. The chemical composition of the deposited particles was determined using X-ray fluorescence analysis (XRF). The outdoor suspended particulate concentration was much lower than that indoors; the indoor PM1-10 concentration was much higher than that outdoors and was less affected by outdoor sources. The sources of indoor deposited particles in the high-plateau museum can be classified into four categories: soil dust brought in by tourists from the outdoors, incense ash, pollution from human activities, and ores. Based on data analysis and discussion, proper ventilation can dilute indoor suspended particulate matter, and the installation of air conditioning systems can control temperature and humidity at 20 °C and about 45–60%, respectively, and reduce the fluctuation value, so as to promote particle deposition and better protect the museum’s cultural relics.

1. Introduction

Particulate matter plays a significant role in the preservation environment for cultural relics made of paper [1]. The influence of particulate matter on books and paper is mainly manifested in physical, chemical, and biological effects. Particulate matter shapes vary, primarily with edges and corners, and will gather on the page over time. Browsing books with particulate matter will cause friction damage, lower the mechanical strength of the paper, and produce poor adherence of the writing material and impair legibility. Particulate matter can absorb chemical pollutants in the air. When particulate matter adheres to the surface of cultural relics, some chemical substances carried by this matter will react with the surface materials of cultural relics or mineral pigments under certain temperature and humidity circumstances. The combination of particles and micro-environmental conditions in the scripture cabinet may lead to insect infestation and microbial proliferation [2]. Acids, alkalis, enzymes, and other chemicals produced by microorganism development may corrode cultural relics.
To effectively minimize the danger of particulate matter harming historical artefacts, it is helpful to have a thorough understanding of the source of indoor particulate matter. Examining the sample data gathered at the receptor’s location, the receptor model approach is an useful way to determine the source and contribution ratio of particulate matter. The Factor analysis (FA) model, Chemical Mass Balance (CMB) model, Positive Matrix Factorization (PMF) model, enrichment factor (EF) method, and isotope tracer method are commonly used receptor model methods. The research results show that indoor particulate matter comes from both outdoor and indoor sources. For instance, Zhang et al. used the enrichment factor method to study the source of mercury in soil and found that there was significant anthropogenic interference in approximately 50% of the areas studied [3]. Utilizing comparative analysis and the EF approach, Zhang et al. examined 355 precipitation samples from the upper reaches of the Shiyang River and discovered that the majority of the particles in the samples originated from the crust [4]. Daher et al. used the CMB model to investigate the chemical composition of indoor particulate matter in a Milan museum, and the results revealed that only 11.2% of it came from gasoline automobiles, urban soil, and wood smoke [5]. In Beijing, China, Liang et al. conducted a source study of particulate matter using principal component analysis (PCA) and factor analysis (FA), and they discovered that the contribution of coal burning to particulate matter reduced by more than 40% during the non-heating period [6]. PMF was employed by Cuccia et al. to examine the origins of PM2.5 and PM10 in urban areas of Genoa, Italy [7]. Ludmila et al. measured the concentration of particulate matter in the Baroque Library of the National Library of Prague, and used the CMB model to estimate the ventilation rate, deposition rate, and infiltration factors. The findings indicated that 35% of the indoor particulate matter content was attributable to tourists [8].
Many researchers have collected particles in museums, art galleries, and other buildings and analyzed their species, composition, and source. Wang et al. [9] analyzed the composition of particulate matter in the air in a museum in the CBD of Shanghai, and the results showed that coarse particles were mainly soot aggregates and minerals, while fine particles were mainly soot aggregates. Ca, Si, Al, Na, C, O, S, and Mg were enriched on coarse particles, and S was mainly enriched on fine particles. De Bock et al. [10] determined the chemical composition and associated diameter particles of individual aerosol particles in the air of the Correa Museum in Piazza SAN Marco, Venice, Italy. The results showed that calcium-rich particles, aluminosilicate, and organic materials were the most dominant particles, and deterioration of the indoor wall plaster wall may be the source of Ca-rich particles. Gysels et al. [11] collected aerosol samples inside and outside the Royal Art Gallery in Antwerp and performed compositional analysis, finding that construction works in winter constitute an indoor source of calcium and calcium–silicon particles, with the most S-rich particles being present in summer. Hu et al. [12] examined the total suspended particulate matter collected inside and outside the Museum of Qin Emperor’s Terra-Cotta Warriors and Horses, and found that most of the particles consisted of soil dust, S-containing particles, and low-Z particles (such as soot aggregates and biological particles). Krupińska et al. [13] analyzed the particulate matter using an energy-dispersive X-ray fluorescence (EDXRF) and electron probe micro-analyzer (EPMA) in the Plantin-Moretus Museum/Print Room in Antwerp, Belgium. The results show that in the fine fraction, the contribution of the C-rich particles varied between 35% and 80% while in the coarse fraction, the values were between 25% and 45%. The particle sources of the religious museum located on the plateau are unique due to its special geographical location, religious activities, and tourism-related activities. Plateaus are generally less populated and produce less pollution from human activities. Compared to megacities, particulate matter has a much lower concentration of trace components [14]. The atmospheric lead content in Lahore, a city on the plains of the neighboring country, Pakistan, is 119 times greater than that of Lhasa, China, which is located on a plateau [15]. The formation of particulate matter in the environment used to preserve cultural relics is also influenced by temperature and humidity [16]. From a chemical perspective, the low temperature and low-humidity conditions on the plateau slow down the chemical reaction rate, which is conducive to the preservation of cultural relics. However, fiber artifacts such as paper, cotton, hemp, leather, etc., can crack and become fragile if the temperature and humidity are too low, due to the loss of moisture. The wide daily temperature and humidity range will lead to fracture and disconnection between various components of the cultural relics if they are made of different materials. Burning incense can release a large amount of fine particulate matter. In 2001, Jetter et al. discovered that the concentration of indoor PM2.5 with burning incense might greatly exceed the outdoor concentration regulated by the National Ambient Air Quality Standards (NAAQS) set by the US Environmental Protection Agency [17]. The particulate matter concentration in the museum is also significantly influenced by visitors [18,19,20]. For instance, the amount of indoor particulate matter increased by more than 50% while the Royal Museum of Wowell Castle in Krakow, Poland, was open [21].
With an average altitude exceeding 4000 m, many temples in Tibet, China serve as museums, housing a large collection of religious artifacts and publications. To assess the potential harm of particulate matter to cultural relics and provide useful information for preventative conservation strategies, this study was conducted on the particulate matter present in the preservation environment of the Potala Palace Museum in Tibet, China.

2. Materials and Methods

2.1. Site Description

The Potala Palace Museum is located on a hill, i.e., away from residential areas, roads, and factories, etc. The museum is an ancient Tibetan-style civil and stone structure. The museum is open to the public from 10:00 a.m. to 5:00 p.m. and welcomes an average of 5000 visitors per day. Temperature and humidity control equipment and mechanical ventilation are not installed. The religious artifacts and publications are mainly stored in Buddhist halls, stockrooms, and a basement. The burning of incense sticks is a common practice in the Buddha halls of the museum, which sets it apart from other museums. However, this also presents an environmental issue. Details of the sampling rooms are shown in Table 1.

2.2. Sampling

In August 2020, concentrations of suspended particulate matter were monitored outside the museum, including four Buddha halls and three stockrooms, using particle counters TSI Aero Trak 9310. More than 5 sampling points were taken in each sampling area, and a data average value greater than 15 was calculated after three consecutive measurements at each sampling point. The sampling interval was 1 min, and the sampling flow rate was 2.83 L/min. The measuring point avoided the vent, and the distance from the wall was greater than 0.5 m; the distance from the doors and windows was greater than 1 m, and the instrument was kept out of the reach of visitors. The height of the measuring point was between 0.5 and 1.5 m relative height. The excluded data accounted for less than 1% of the total sample size.
A low-power multi-environmental parameter monitor (Model MPEM-07M) based on the MSP430 microcontroller was placed near the cabinet in Buddha Hall 1 to continuously monitor PM10 concentrations. The measurement range was 0–999 μg/m3, the data consistency was ±10%, and the resolution was 1μg/m3. A handheld particle counter 9306 produced by TSI Company was used to correct the monitoring results, with a resolution of 1 μg/m3. The sampling period was two weeks, and the sampling interval was 30 min.
Samples of peeling wall surface, incense ashes, and sedimentary particulate matter were collected from four Buddha halls, three stockrooms, the plaza, and the ticket office. Using a nylon brush, a sample weighing approximately 200 g was swept at each sampling point, and then placed in a brown, light-proof container. After the samples were taken back to the laboratory, impurities were removed, and the collected samples were air-dried under the conditions of room temperature and light-proofing for 2 to 3 weeks. Approximately 50 g of the dried samples was taken out and filtered through a 0.9 mm nylon sieve, ground, and crushed using a vibrating mill to obtain particles less than 200 mesh (74 μm) for chemical composition analysis.

2.3. Chemical Composition Analysis

Quantitative analysis of sedimentary particulate samples was conducted to determine the content of 25 chemical constituents including SiO2, CaO, K2O, MgO, Fe2O3, Al2O3, Na2O, Cl, S, P, Ti, Ba, Sr, Rb, Zr, Hg, Ga, Mn, Zn, Cr, Cu, Ni, Pb, As, and Co. X-ray fluorescence analysis (XRF) was used for the analysis, and an XRF-1800 scanning X-ray fluorescence spectrometer was employed as the analytical instrument.

2.4. Statistical Analysis

The enrichment factor (EF) method was used to evaluate the enrichment level of chemical components in the samples and determine if the chemical components originated from the crust or from human activities. The formula for calculating EF is as follows:
E F i = ( M i / M r ) sample / ( M i / M r ) background
where Mi/Mr is the ratio of the studied heavy metal element i to the reference element r. In this paper, Al is chosen as the reference element. Al2O3 is an appropriate reference element because it does not volatilize, has stable chemical properties, and causes little pollution. The level of enrichment is broken down into the following categories: EF ≤ 2, no enrichment or slight enrichment; 2 < EF ≤ 5, moderate enrichment; 5 < EF ≤ 20, significant enrichment; 20 < EF ≤ 40, strong enrichment; EF > 40, very strong enrichment.
SPSS 23.0 software was used to perform cluster analysis on the chemical composition data of the measured samples. Cluster analysis can determine whether chemical compositions come from the same source by attempting to group together data of the same type while separating various data as much as possible.

3. Results

3.1. Concentration of Suspended Particulates

Table 2 displays the suspended particulate matter concentration (μg/m3) distribution by particle size for both the interior and outdoor areas of the museum. The particulate matter levels outside are extremely low, with PM2.5 concentrations of 3.8 μg/m3 and PM10 concentrations of 30.8 μg/m3. The difference in particulate matter concentration between indoor and outdoor air is statistically significant within the 99% confidence interval. The particulate matter concentrations in Buddha Halls 1 and 2 are obviously lower than those in Buddha Halls 3 and 4, as the first two areas have windows that provide exposure to the outside. The particulate matter concentrations in each size distribution in the Buddha hall area are noticeably greater than those outside. The conclusion is that opening windows helps lower the particulate matter concentration. Compared to outdoor air, the stockroom area has a slightly higher concentration of particulate matter with a size smaller than 1 μm, while the outdoor air and the Buddha hall area have significantly higher concentrations of particulate matter with a size greater than 1 μm.
To evaluate particulate matter pollution, the PM2.5 concentration measured in this study was compared with the concentration set by the World Health Organization (2006), while the PM10 concentration was compared with the standards set by the US National Standards Bureau (1983) and the British National Standard (2000).The data show that the average PM2.5 concentration in the stockroom area is slightly higher than the standard set by the World Health Organization (10 µg/m3), the average PM10 concentration is far higher than the standards set by the US National Standards Bureau and the British National Standard (75 µg/m3), and the average PM2.5 and PM10 concentrations in the Buddha hall area are far higher than the standard.
The concentration of PM10 varies throughout the day. Taking Buddha Hall 1 as an example, the time series of particle concentration during sampling is shown in Figure 1. The sampling period was 14 days from 6 August 2020 to 19 August 2020. The concentration of indoor particulate matter peaked at 11 a.m. and reached a low value at about 6 p.m. and then remained stable, indicating that human disturbance had a great impact on indoor particulate matter concentration. The diurnal variation of particulate matter in other indoor places was similar to that in Buddha Hall 1, but the degree of variation varied with the number of people and the amount of ventilation.

3.2. Chemical Composition Characteristics of Sedimentary Particulate Matter

The chemical composition of particulate matter from the plaza, ticket office, incense ash, and wall materials were analyzed using X-ray Fluorescence (XRF) analysis, as shown in Table 3. The particulate matter from incense ash was collected from the incense burning inside the Buddha hall, while the wall materials were taken from the house under construction at the museum.
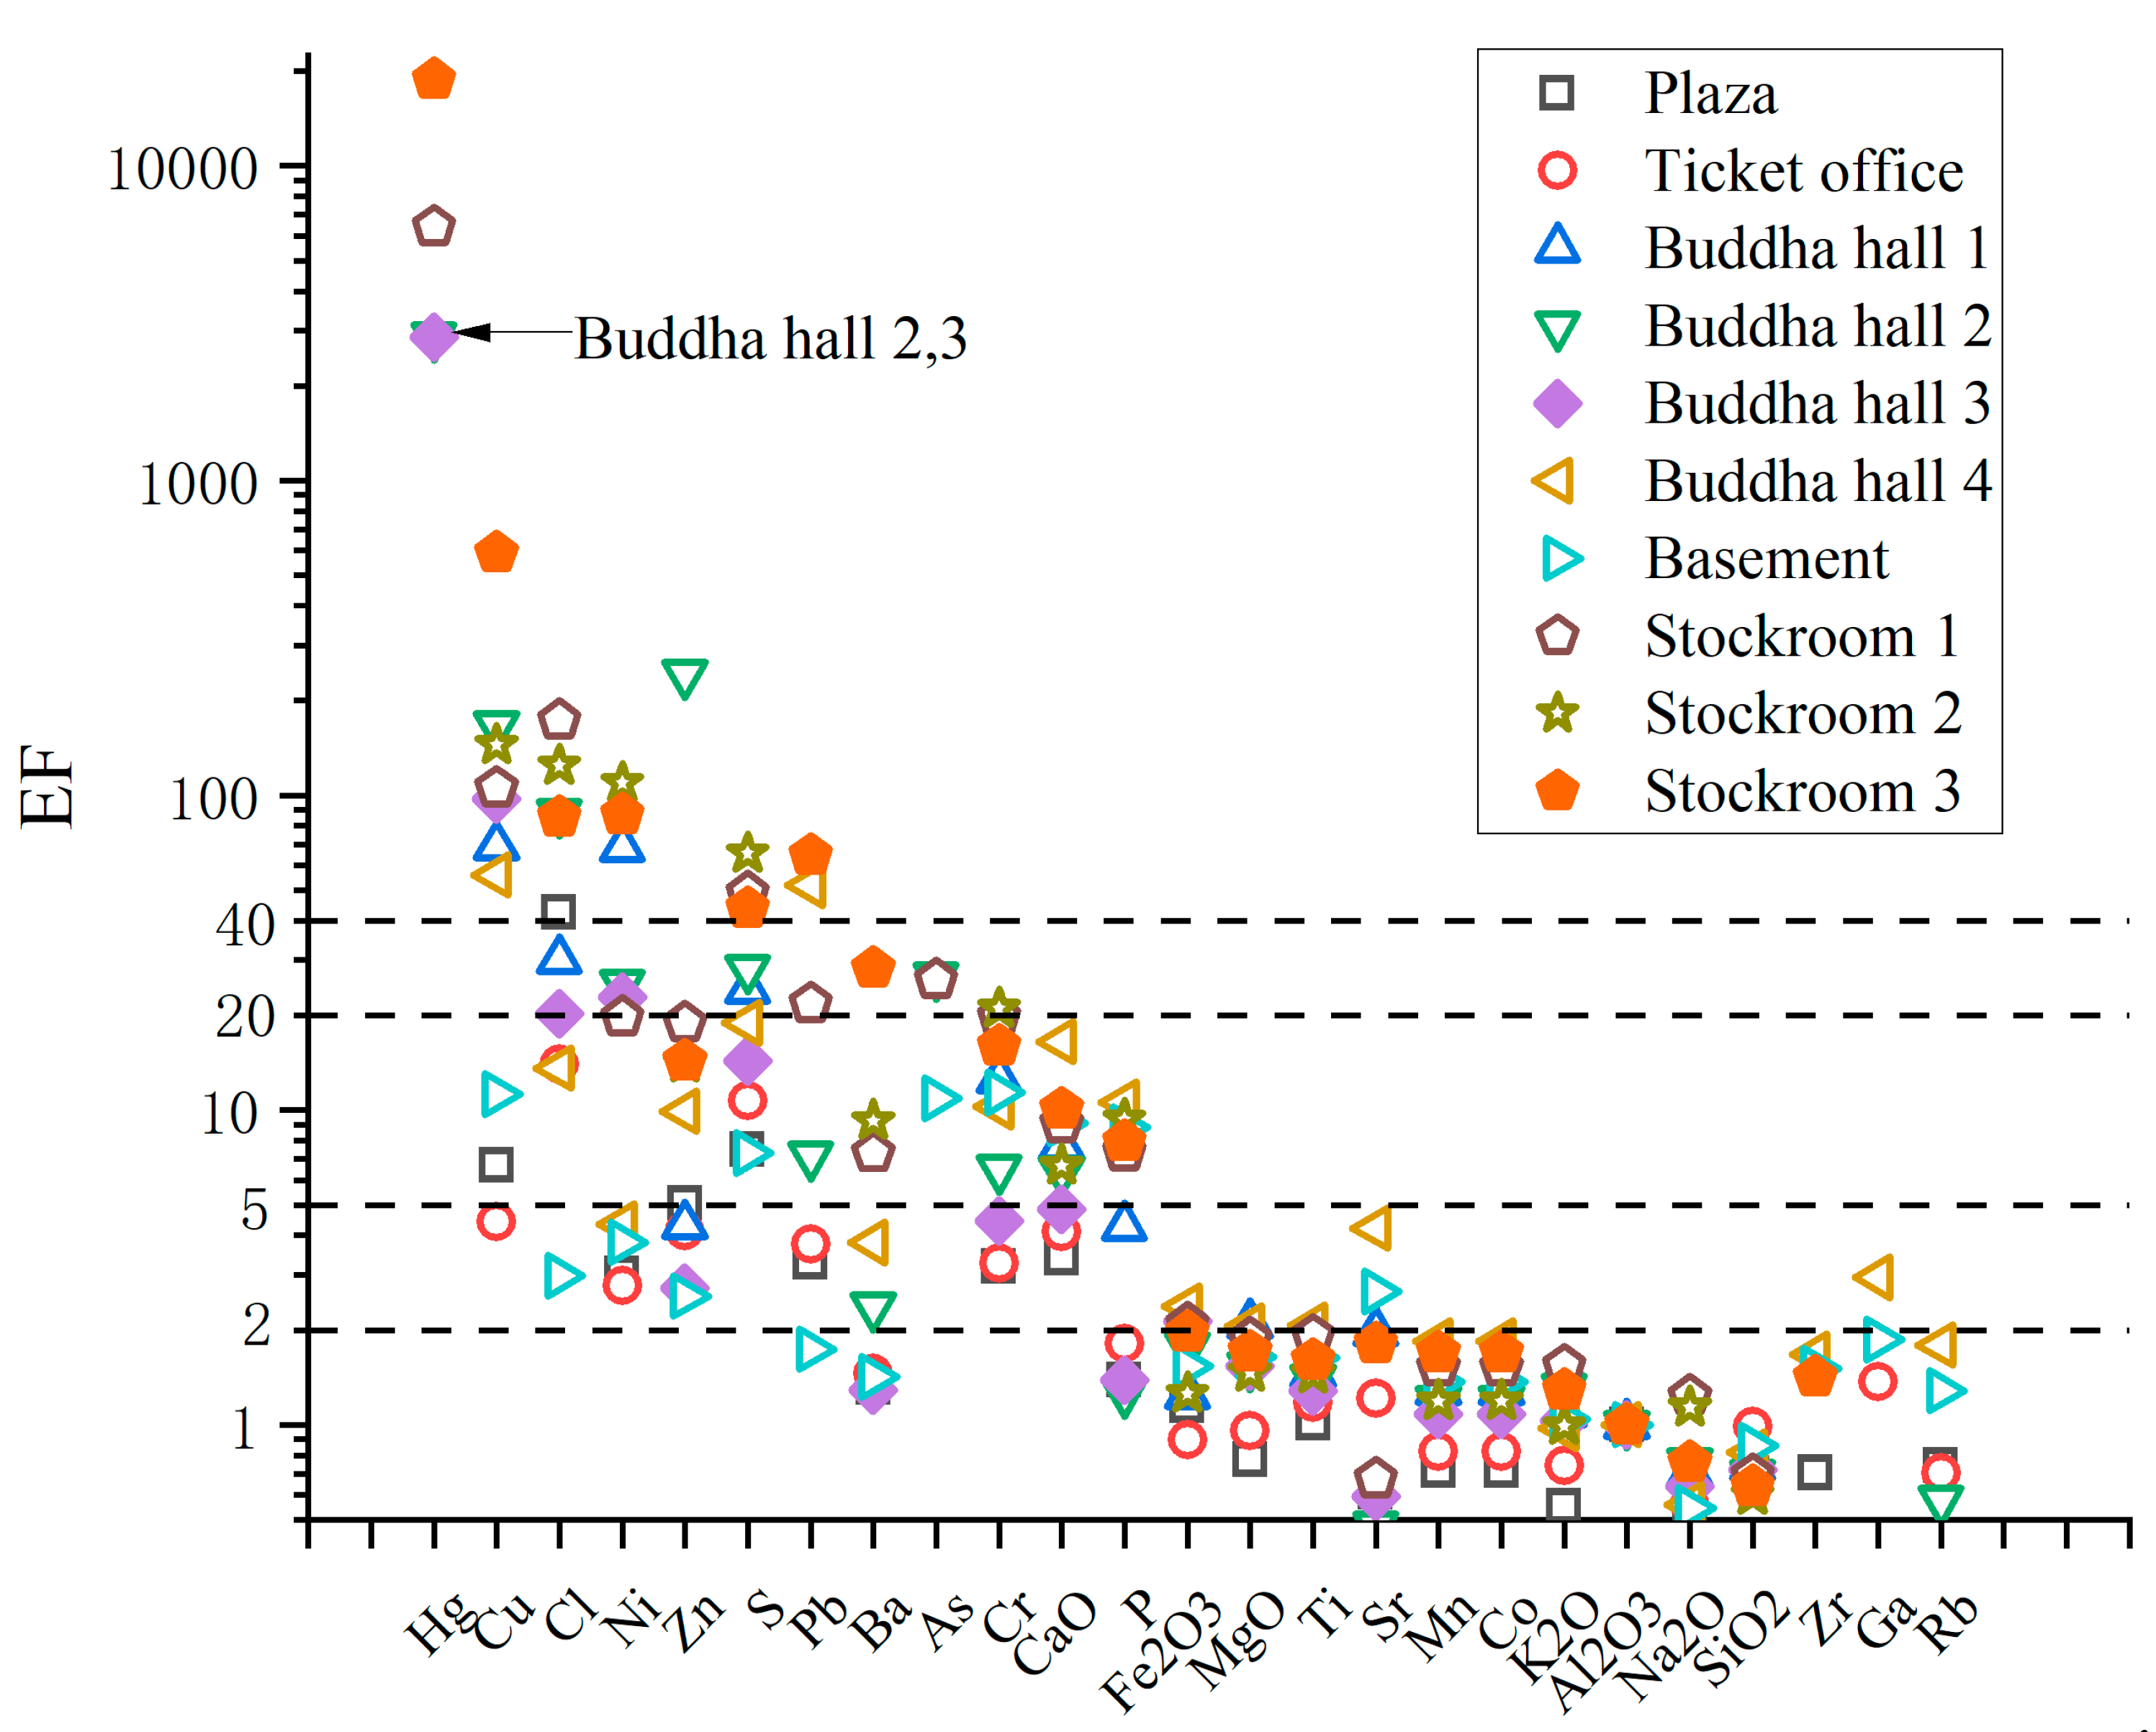
As described in Section 2.4, the larger the value of the enrichment factor (EF) for a certain chemical component, the greater the impact of human interference. The enrichment characteristics of various chemical components in the deposited particles in each area of the museum are shown in Figure 2. Elements with extremely strong enrichment include Hg in Buddha Hall 2 and 3 and Stockroom 1 and 3; Cu in all Buddha halls and stockroom areas; Cl in all stockrooms, Buddha Hall 2, and the plaza; Ni in Buddha hall 1, 2, 3, and all stockrooms; Zn in Buddha Hall 2, S in all stockrooms and Buddha Hall 1 and 2; and Pb in Buddha Hall 4 and Stockroom 1 and 3. These results indicate that human activities played a major role in these components in these areas. Elements that exhibit strong or significant enrichment include Ba in the stockroom area, As in stockroom 1, Buddha Hall 2, and the basement; Cr and CaO in all areas except the plaza, ticket office, and Buddha hall 3; and P in the basement, Buddha hall 4, and stockroom areas. This indicates that these components in the corresponding areas have been influenced by human interference. The unmentioned components are moderately or lightly enriched in all areas, or not enriched at all, suggesting that these components may be primarily influenced by natural factors.
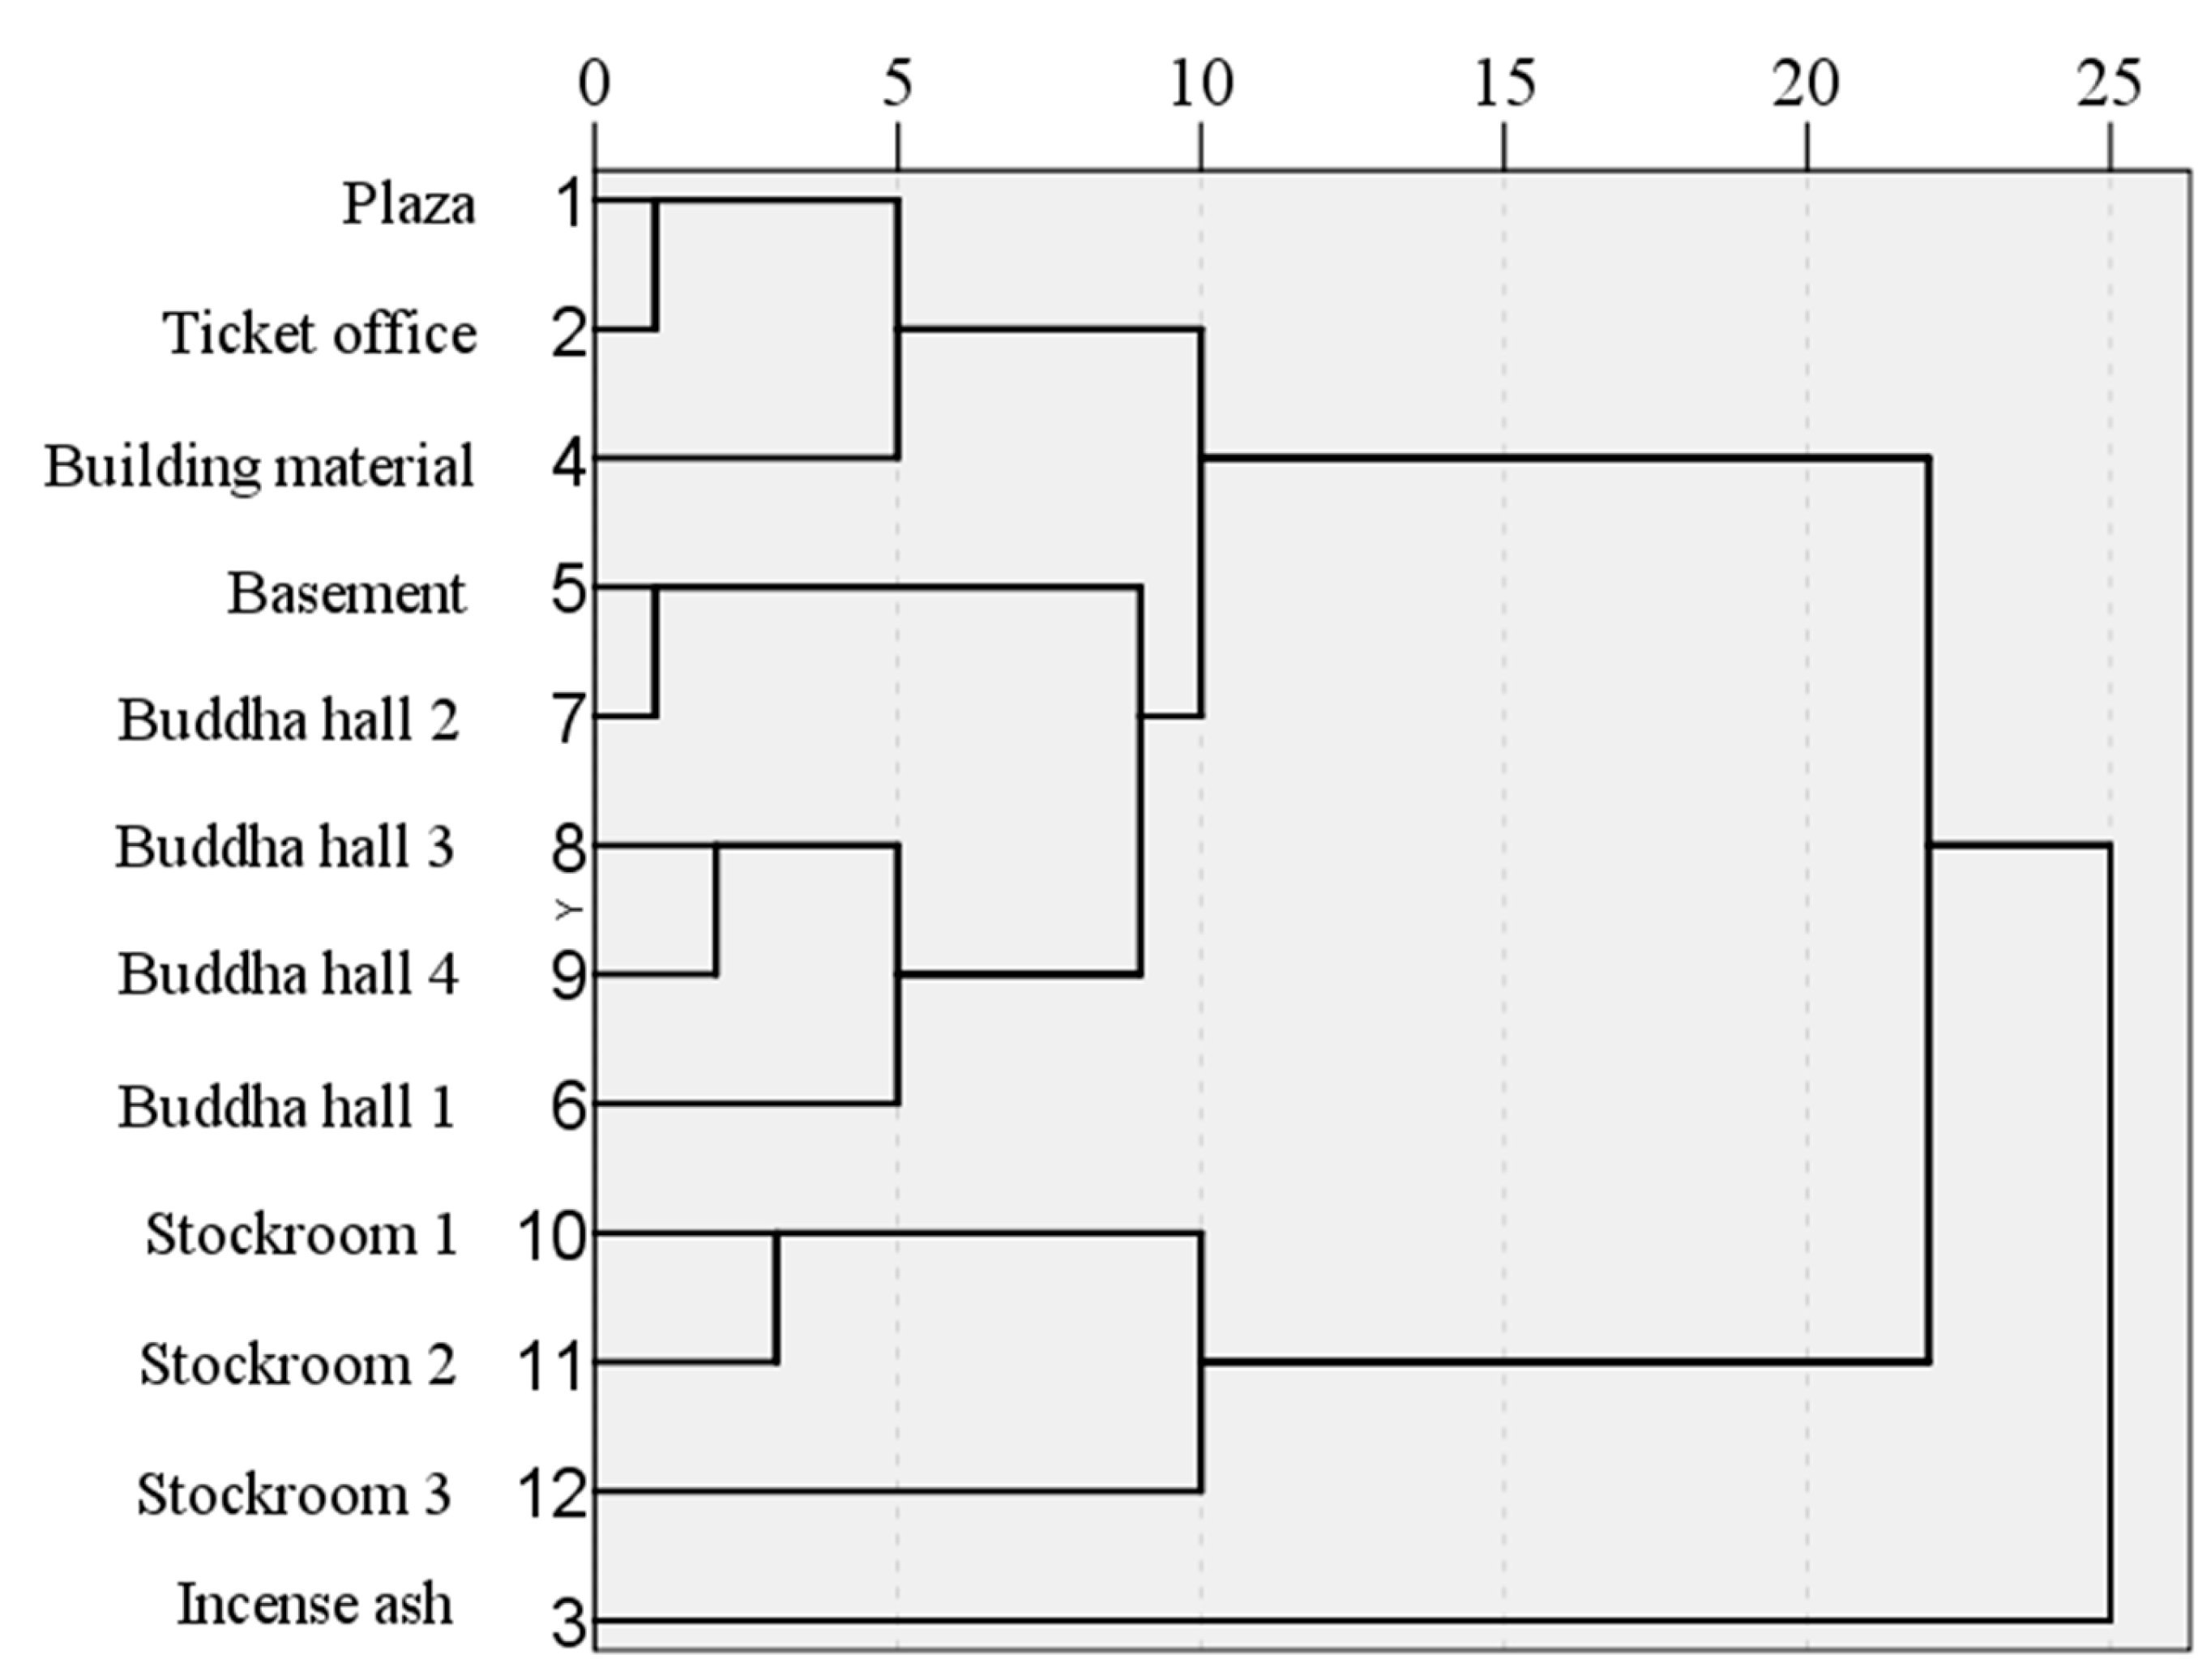
The dendrogram can clearly reflect the relationship of particle sources between sampling points. The Z-score was used to standardize the concentration data of the above chemical components, and the Euclidean distance of similarity between each sampling point was calculated. The Ward method was used to perform hierarchical clustering on the standardized data. The clustering results are shown in Figure 3, except for the incense ash, which can be divided into three categories: the plaza, ticket office, and wall materials in the museum belong to one category; the basement, Buddha Halls 1–4 belong to another category; and stockrooms 1–3 belong to another category. Samples belonging to the same category have closer chemical compositions, indicating similar particle sources.

4. Discussion

4.1. Particulate Matter Source Comprehensive Analysis

Based on the findings of enrichment factor analysis and clustering analysis, this study identified four sources of sediment particles in the Potala Palace.
The first source of sediment particles was identified as soil dust brought in by tourists from outside. The sediment samples derived from this source contained SiO2, MgO, Fe2O3, Al2O3, Na2O, and Ti, which accounted for more than 65.5% of the total. The chemical components of this group were similar to the average value of the chemical background value of the surface soil in Lhasa city. The lack of enrichment in the chemical components in this group suggests that they are of natural origin. SiO2 predominated, probably as a result of its frequent occurrence in surface soil and building materials. Previous research by J.D. Miller et al. supported the finding that SiO2, MgO, Fe2O3, and Al2O3 mainly originate from surface soil [22], while Na2O and Ti also come from surface soil and building materials.
The second source identified in this study is burning incense ash, which contributes to the sediment samples’ chemical components, including P, S, Cl, CaO, and K2O. These components account for more than 14.9% of the total sediment composition. The sedimentary particulate samples showed a strong positive correlation between P, S, and Cl, and their contents are significantly higher than the mean value of the surface soil’s chemical background in Lhasa. The study found that the burning of incense ash contributed to the high levels of P, S, and Cl in the sediment samples. Compared to the average chemical background value of the surface soil in Lhasa, the amounts of P, S, and Cl in the burning incense ash were 26.7, 77, and 87.2 times higher, respectively. Therefore, the P, S, and Cl in the sedimentary particulate matter came from the burning of incense ash. Although K element in cities mainly comes from motor vehicle exhaust, the museum’s location on a hill far away from the city meant that the K2O in the museum square and ticket counter was only 0.7 and 0.8 times the average value of the surface soil’s chemical background in Lhasa. Therefore, it can be deduced that the K2O in the museum mainly came from indoor burning of incense.
The third source of pollution is attributed to human activities and production processes. The sediment samples analyzed in this study contained chemical components including Co, Zn, Cr, Cu, Ni, Pb, and Hg, which collectively accounted for less than 11.4% of the total composition. The concentration levels of these chemical components in the sediment samples were considerably higher than the average chemical background value of surface soil in Lhasa City. This pollution is a result of various human activities associated with modern-day living and industrial production [23,24,25,26]. For example, Co and its compounds are commonly used in the production of batteries, ceramics, stainless steel, and other applications. Mining and smelting activities, as well as the burning of fossil fuels, can also contribute to Co pollution [27]. Pb is frequently used in paint production, and P. Rasmussen found significantly higher concentrations of indoor Pb and Hg in 50 indoor dust samples collected in the Canadian capital compared to outdoor samples.
The fourth source is ore, from which the sediment samples derive the chemical elements Sr, Rb, Zr, Ga, Mn, As, and Ba. There are no developing mineral veins around the museum, so the sediment particles inside the museum contain relatively lower levels of Sr, Rb, Zr, Ga, Mn, and As. The Ba element content in the samples collected from the incense sticks and stockrooms 1, 2, and 3 is 7.8, 6.9, 10.3, and 27.4 times higher than the chemical background value of surface soil in Lhasa. Therefore, it is speculated that the Ba element in the samples is also related to the incense sticks.
The above analysis indicates that human activities and burning incense are the main sources of indoor particles, with the greatest impact on the Buddha halls and basement. Hence, restricting the number of visitors and properly disposing of incense ashes can somewhat limit the particulate matter deposition in the museum, improving the safety of cultural artifact preservation.

4.2. Influence of Temperature and Humidity on Particulate Matter

The deposition of particulate matter can be accelerated by high temperatures and significant temperature changes, as shown by numerous studies. Jahanbin et al. investigated the impact of a ventilation system (i.e., operating a heat recovery ventilation unit alone) on particle dispersion and deposition. Their findings indicated that, at an equivalent ventilation rate, a decrease in outdoor temperature could reduce the particle decay rate [28]. In another study, Han et al. investigated the effects of air temperature and humidity on the deposition of 1 μm particles in fully developed turbulent pipe flow. They discovered that when the temperature differential between the airflow and the windpipe wall surface grew, so did the velocity at which particles descended [29].
Based on previous research, it has been demonstrated that higher humidity levels can increase the deposition of particulate matter. In a study conducted by Kim et al., burned incense was used as test particles to compare the deposition of particulate matter under both dry and wet conditions, with a maintained relative humidity difference of at least 35% and a relative humidity range of 15% to 80%. The results of this study indicate that the removal efficiency and deposition constant of particulate matter were higher in wet conditions compared to dry conditions. The hygroscopic properties of the particles were found to play a significant role in this result. In particular, the particulate matter produced by burning incense consists of hydrophilic oxidation chemicals that have a strong affinity for water molecules. As a result, the hydrophilic particles are more prone to agglomeration, which can lead to an increase in smoke particle size [30].
Inadequate air temperature and heat transfer may cause expansion, acceleration of natural damage and chemical processes, partial drying up, and an increase in fragility. Likewise, hygrometric fluctuations may generate size and shape modifications, chemical reaction, and biological deterioration. These effects are catalyzed by a low ventilation rate and a high air velocity [31]. One review points out that the best hygrothermal conditions for preserving the collections have been debated for decades (1976–1995), sometimes producing harsh discussions [32]. Van Schijndel [33] summarized the recommended temperature and humidity for paper storage: a RH between 45 and 60% and a mean temperature of 20 °C. In addition, to reduce damage to the exhibits, temperature and humidity fluctuations should be slow, rather than fast and short lasting [34]. Mueller [35] and Papadopoulos [36] recommends a temperature range of ± 3 °C and a humidity range of ±5%.To study the influence of temperature and humidity on the level of particulate matter in the Potala Palace, this research collected data on temperature and humidity. The data were collected from 28 August 2020 to 15 September 2021, covering all four seasons: autumn, winter, spring, and summer. Low-power and multi-environmental parameter monitors for temperature, humidity, carbon dioxide, light, and ultraviolet were placed in the Buddhist hall and stockroom area of the museum. The location was away from air vents and out of reach of visitors. Data were automatically uploaded to the background server. The parameters of the environmental monitoring equipment are shown in Table 4.
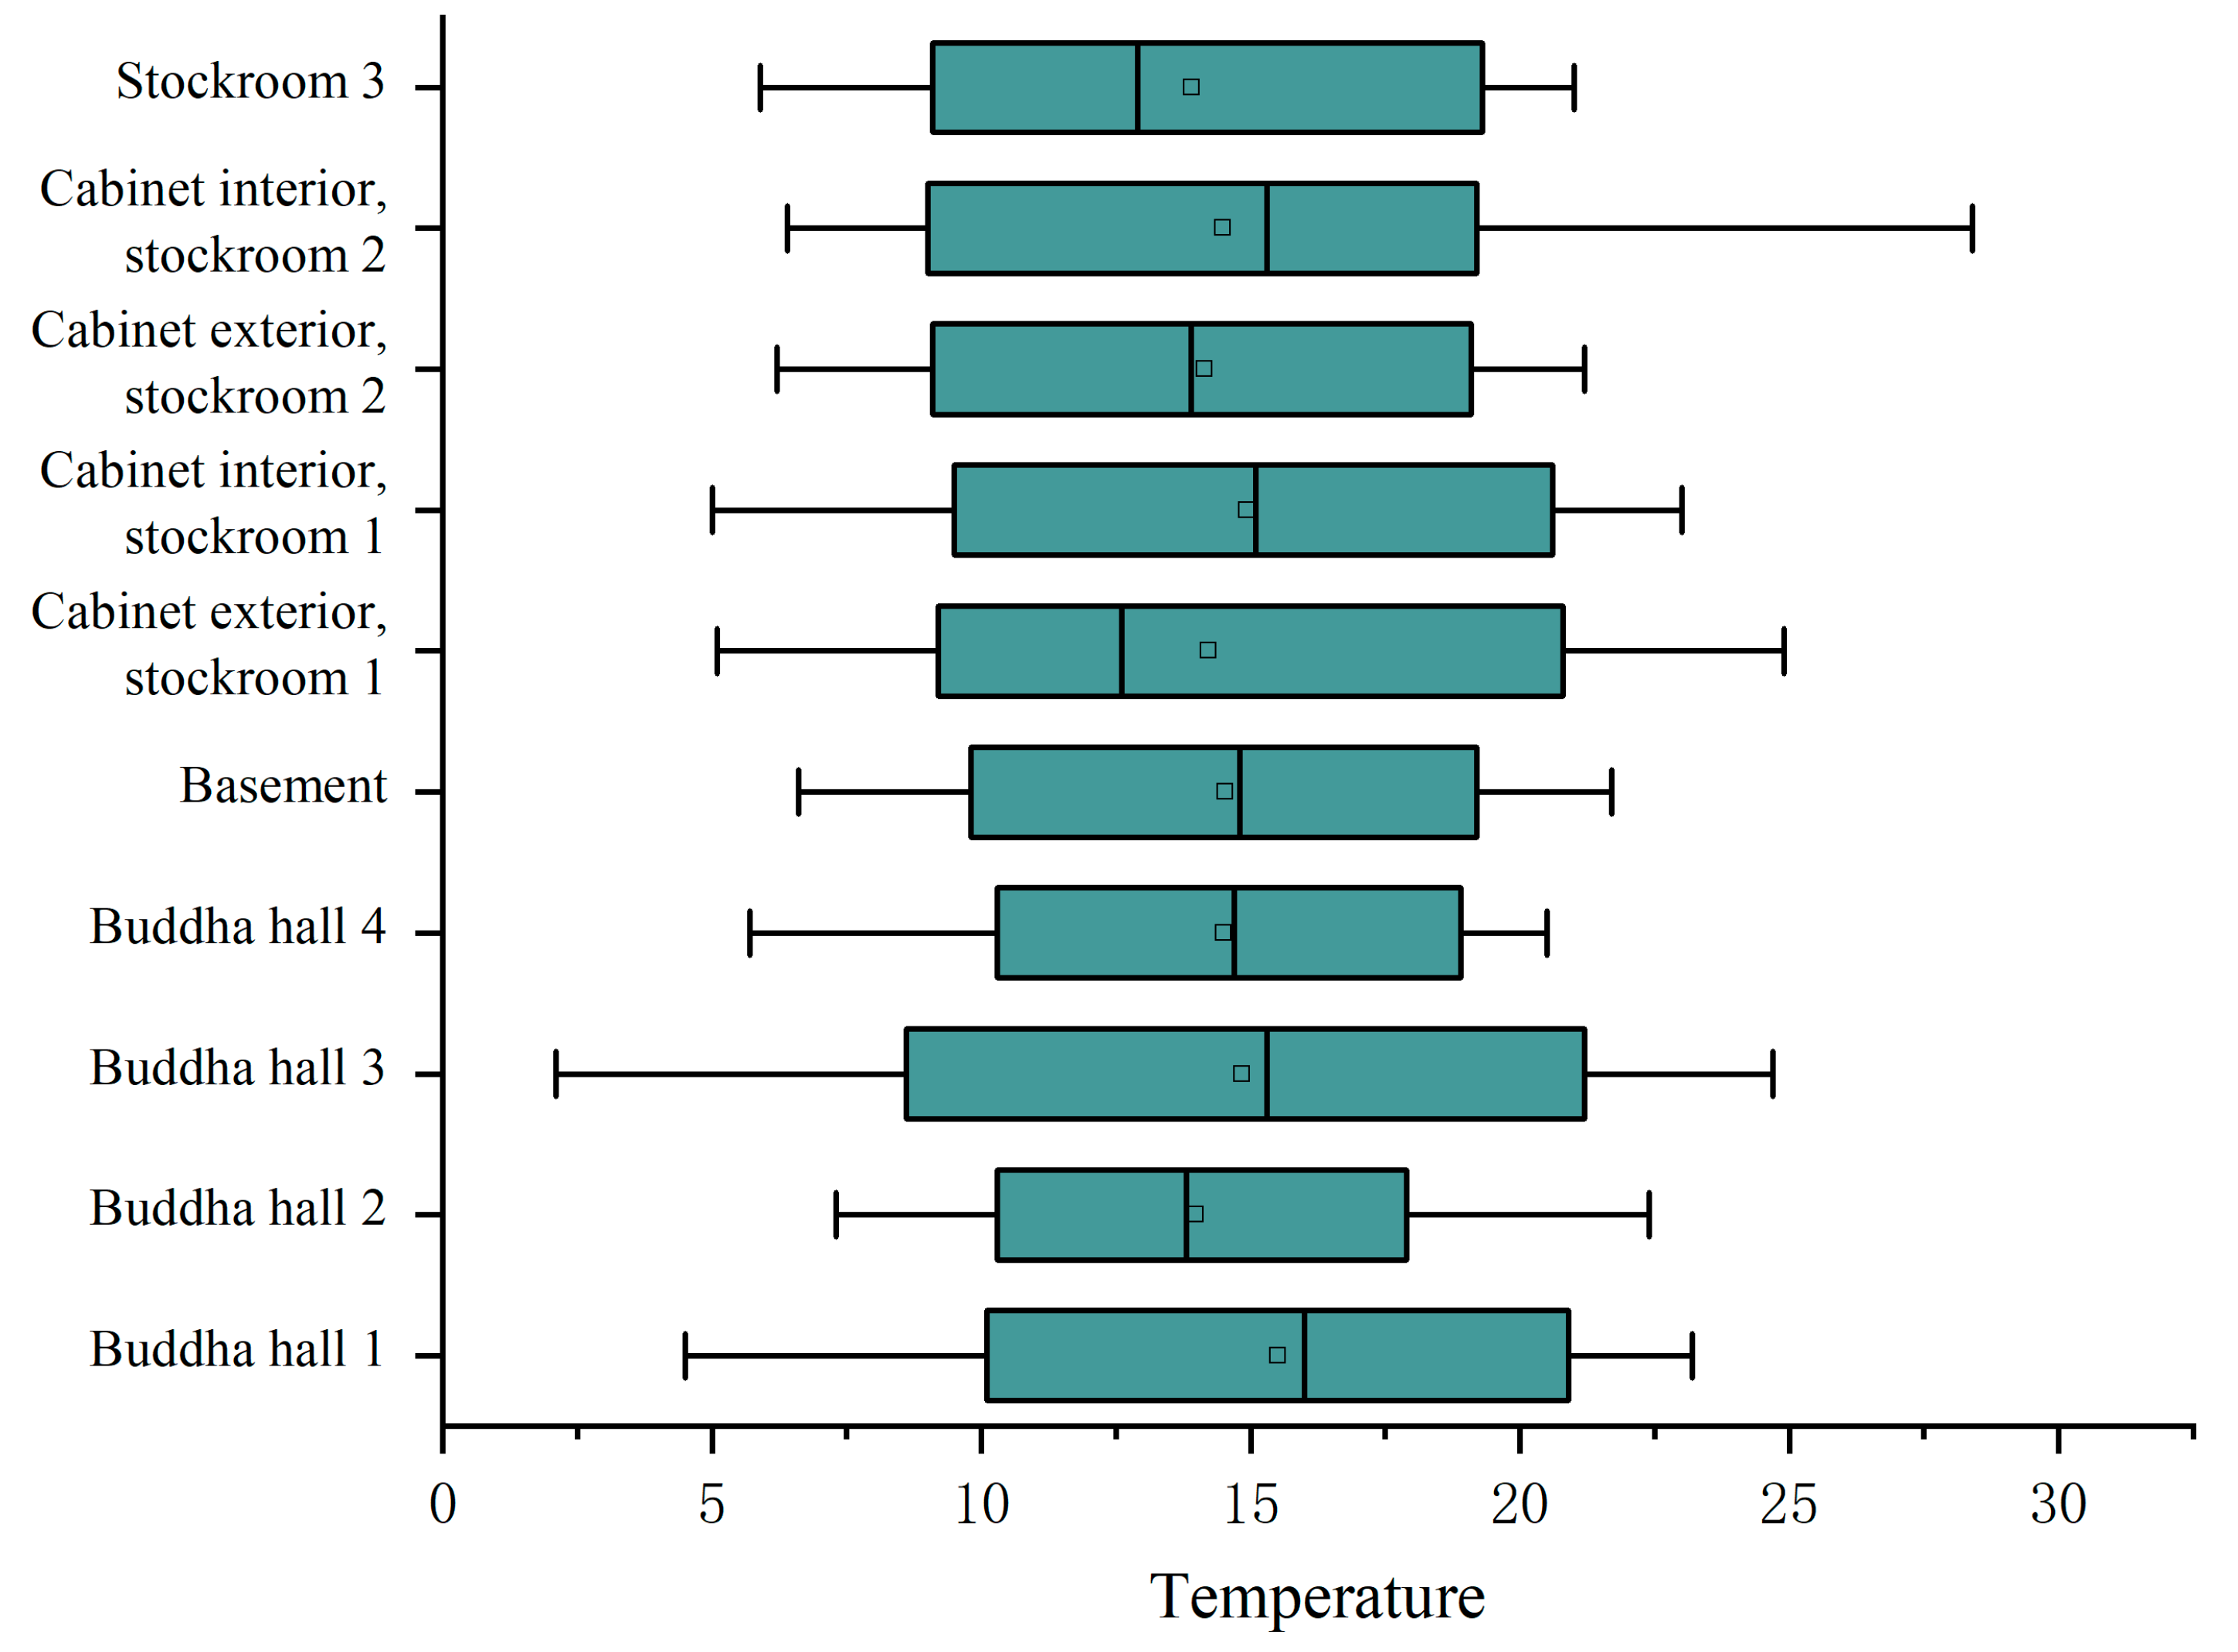
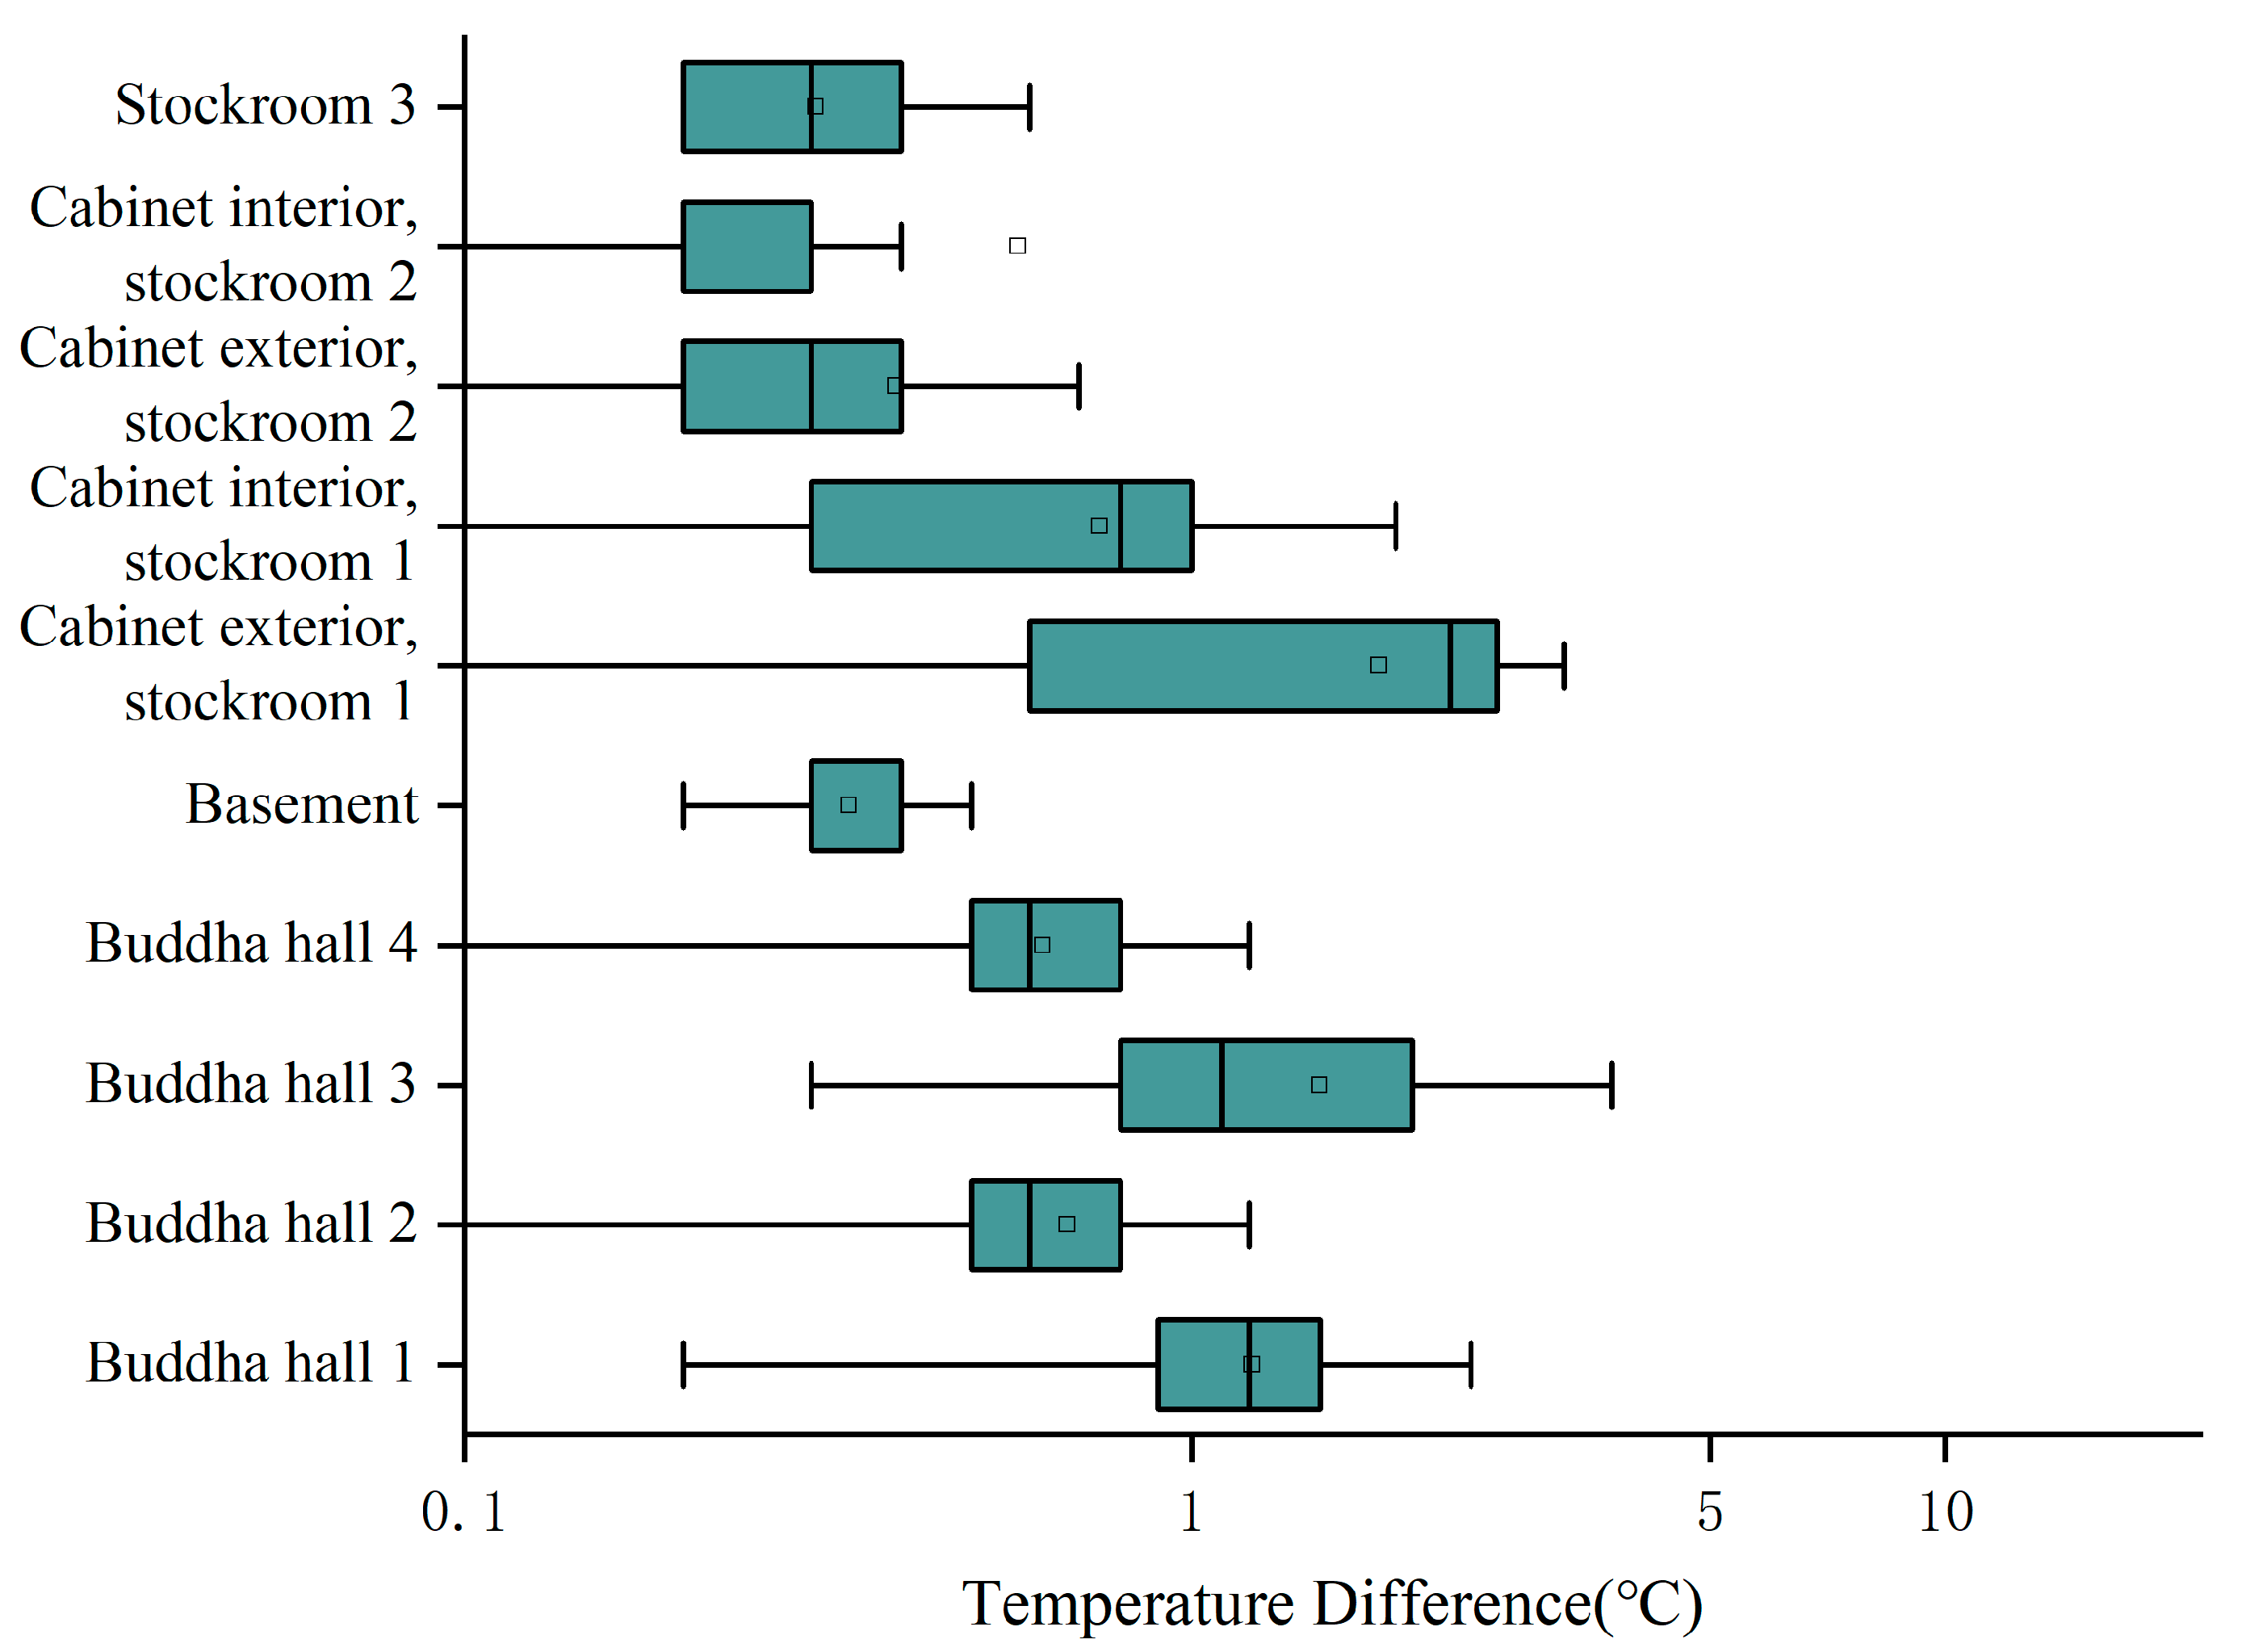
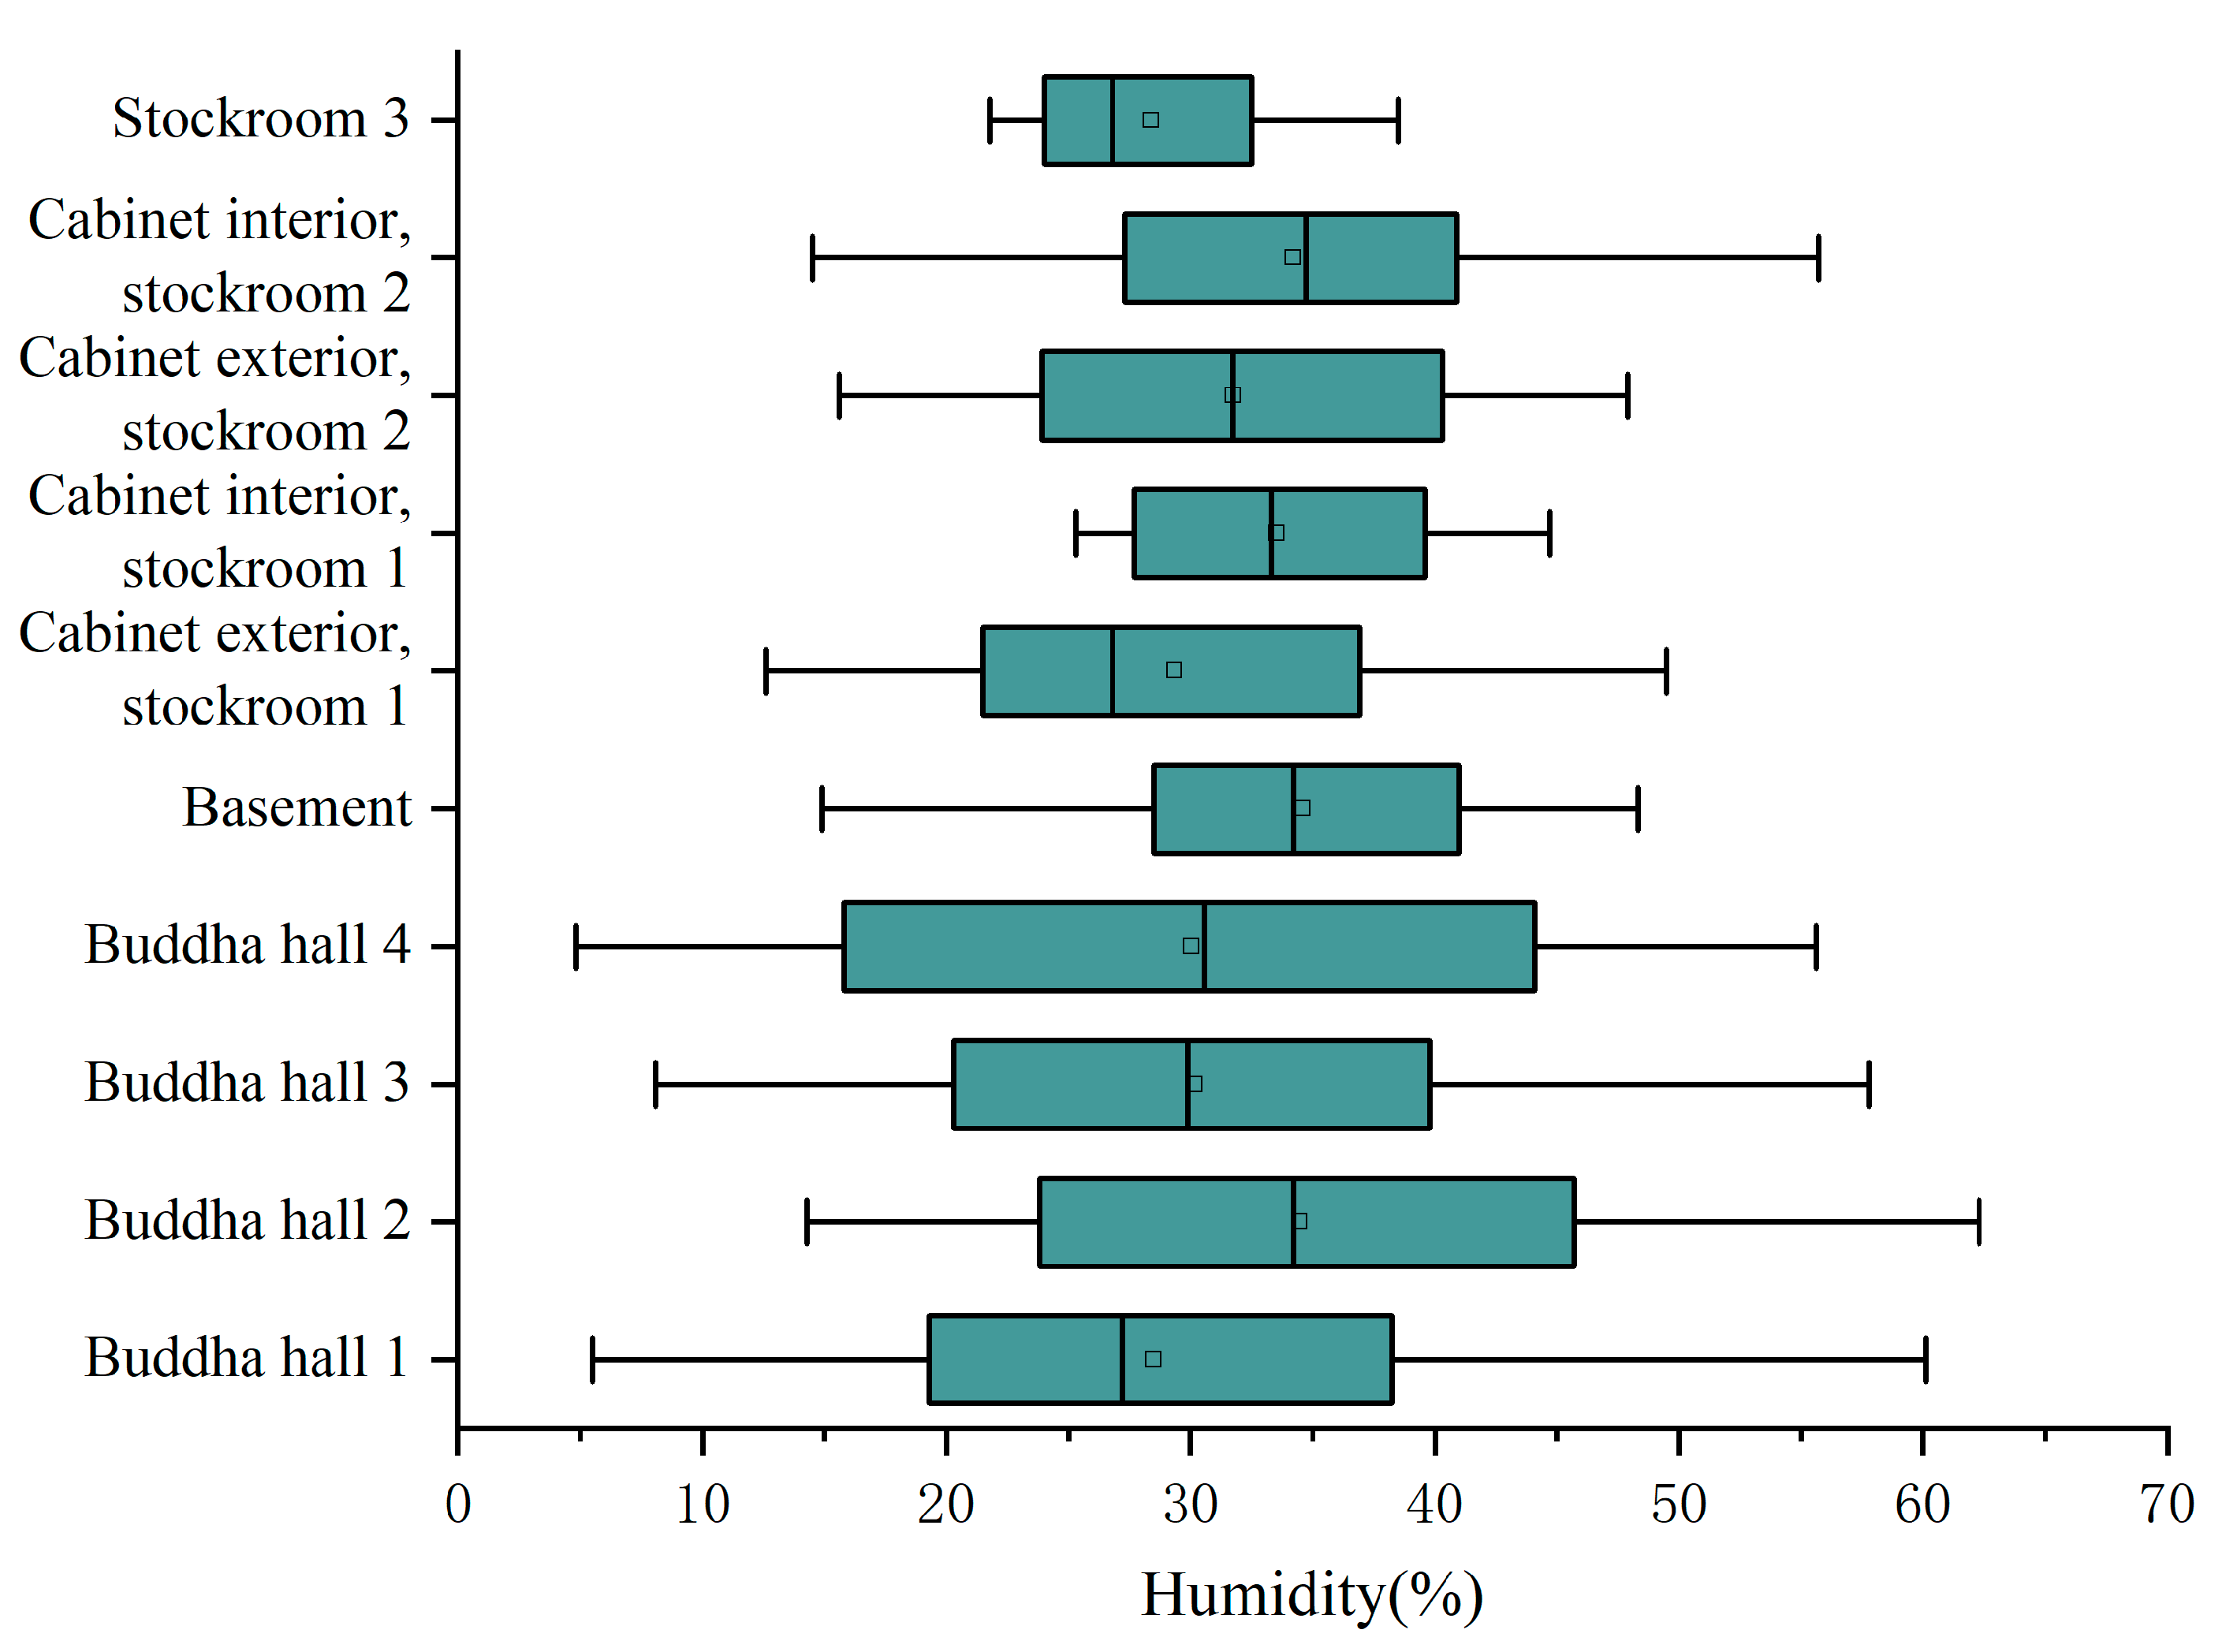
Figure 4 shows the daily average data, with a considerable difference in temperature between winter and summer across all regions. The annual temperature range for areas affected by outdoor conditions, such as Buddha Halls 1 and 2 and stockroom 1, was 18.7 °C, 22.6 °C, and 19.5 °C, respectively. Moreover, Buddha Halls 1 and 2 experienced the lowest temperatures, as low as 2.1 °C and 4.5 °C, respectively, while other regions did not fall below 5 °C. Figure 5 illustrates the daily temperature range, and apart from Buddha Halls 1 and 2 and stockroom 1, the temperature range throughout the museum was usually below 2 °C, accounting for over 96.93% of the total sampling period. Figure 6 presents the daily average humidity data, and all regions displayed notable humidity differences between winter and summer. The Buddha hall area is accessible to tourists, with a higher annual humidity range of around 50%, whereas the humidity range in other areas ranged from 32.3% to 41.2%.
According to the results, it can be concluded that the annual and daily temperature variability of the areas in Buddha Halls 1 and 2, as well as stockroom 1, are more significant, and this variability favors the deposition of particles, but it is not conducive to the protection of cultural relics. Meanwhile, due to these areas’ susceptibility to temperature changes, indoor temperatures are often too low, and humidity is below 40% during many months, making it not conducive to the preservation of cultural relics and particulate deposition. For the cabinets in the stockrooms, although they can block indoor particles, they may also reduce the effectiveness of particle deposition during cold and dry months by causing minimal temperature and humidity variation. As a result, it is advised to construct a temperature and humidity control system in the museum to maintain a temperature at roughly 20 °C and a humidity between 45% and 60%, to lessen fluctuations that could encourage particle deposition and better conserve the museum’s historical artifacts.

5. Conclusions

In conclusion, a deeper understanding of the chemical composition and sources of indoor particulate matter, coupled with annual environmental monitoring data, will facilitate the development of effective management strategies for controlling the health risks of indoor particulate matter deposition and its related components that are toxic to ancient books and cultural relics. According to the statistics and analysis provided, burning incense ash and soil dust carried in by visitors from outside accounts for the majority (over 80%) of the particulate matter in the Potala Palace. It can be inferred that controlling human flow, timely cleaning of the museum, and cleaning of incense ash can partially reduce the concentration of suspended particulate matter and its deposition. While ventilation can also reduce the concentration of suspended particulate matter, it may lead to low temperature and humidity levels in the library, which could be counterproductive for particulate matter deposition. Therefore, it is recommended that museums install a ventilation fresh air air-conditioning system. At the same time, the temperature and humidity should be controlled at around 20 °C and 45–60%, respectively, in order to promote the deposition of particulate matter and reduce the concentration of suspended particles.
However, the influence of temperature and humidity on the concentration and source of particulate matter was not compared throughout the year since there was no year-round measurement of particulate matter in this study. Future studies should conduct more comprehensive monitoring of particulate matter data to assess the impact of different factors on particulate matter and provide suggestions for energy saving and more effective protection of cultural relics in museums.

Author Contributions

G.Z. performed the study conceptualization; W.L. performed data curation and wrote the original draft; Q.C. provided the study materials and performed the sampling; Z.Z. performed the data validation; Q.W. performed data visualization and editing; Z.P. performed comparative analysis of literature data. All authors have read and agreed to the published version of the manuscript.

Funding

This study was supported by the Chinese Academy of Cultural Heritage under Grant No. [2019]31.

Institutional Review Board Statement

Not applicable.

Informed Consent Statement

Not applicable.

Data Availability Statement

All data in this study are available from the corresponding author by request.

Conflicts of Interest

The authors declare no conflict of interest.

References

  1. Grau-Bové, J.; Mazzei, L. Corrigendum to “Simulation of particulate matter ingress, dispersion and deposition in a historical building” [J. Cult. Herit. 18 (2016) 199–208]. J. Cult. Herit. 2017, 24, e1. [Google Scholar] [CrossRef]
  2. Gawade, D.R.; Ziemann, S. A Smart Archive Box for Museum Artifact Monitoring Using Battery-Less Temperature and Humidity Sensing. Sensors 2021, 21, 4903. [Google Scholar] [CrossRef] [PubMed]
  3. Zhang, H.; Chen, J. Anthropogenic mercury enrichment factors and contributions in soils of Guangdong Province, South China. J. Geochem. Explor. 2014, 144, 312–319. [Google Scholar] [CrossRef]
  4. Zhang, Z.Y.; Jia, W.X. Hydrochemical Characteristics and Ion Sources of Precipitation in the Upper Reaches of the Shiyang River, China. Water 2020, 12, 1442. [Google Scholar] [CrossRef]
  5. Daher, N.; Ruprecht, A. Chemical Characterization and Source Apportionment of Fine and Coarse Particulate Matter Inside the Refectory of Santa Maria Delle Grazie Church, Home of Leonardo Da Vinci’s “Last Supper”. Environ. Sci. Technol. 2011, 45, 10344–10353. [Google Scholar] [CrossRef]
  6. Liang, C.; Wu, H. Efficient data preprocessing, episode classification, and source apportionment of particle number concentrations. Sci. Total Environ. 2020, 744, 140923. [Google Scholar] [CrossRef]
  7. Cuccia, E.; Massabo, D. Size-resolved comprehensive characterization of airborne particulate matter. Atmos. Environ. 2013, 67, 14–26. [Google Scholar] [CrossRef]
  8. Masková, L.; Smolík, J. Contribution of Visitors to the Indoor PM in the National Library in Prague, Czech Republic. Aerosol Air Qual. Res. 2016, 16, 1713–1721. [Google Scholar] [CrossRef]
  9. Wang, L.; Xiu, G. Characterizing Particulate Pollutants in an Enclosed Museum in Shanghai, China. Aerosol Air Qual. Res. 2015, 15, 319–328. [Google Scholar] [CrossRef]
  10. De Bock, L.A. Microanalysis of museum aerosols to elucidate the soiling of paintings: Case of the Correr Museum, Venice, Italy. Environ. Sci. Technol. 1996, 30, 3341–3350. [Google Scholar] [CrossRef]
  11. Gysels, K.; Deutsch, F. Characterisation of particulate matter in the Royal Museum of Fine Arts, Antwerp, Belgium. Atmos. Environ. 2002, 36, 4103–4113. [Google Scholar] [CrossRef]
  12. Hu, T.; Lee, S. Characterization of winter airborne particles at Emperor Qin’s Terra-cotta Museum, China. Sci. Total Environ. 2009, 407, 5319–5327. [Google Scholar] [CrossRef]
  13. Krupińska, B.; Worobiec, A. Assessment of the air quality (NO2, SO2, O3 and particulate matter) in the Plantin-Moretus Museum/Print Room in Antwerp, Belgium, in different seasons of the year. Microchem. J. 2012, 102, 49–53. [Google Scholar] [CrossRef]
  14. Cong, Z.; Kang, S. Elemental composition of aerosol in the Nam Co region, Tibetan Plateau, during summer monsoon season. Atmos. Environ. 2007, 41, 1180–1187. [Google Scholar] [CrossRef]
  15. Li, H.; Wang, Y. Research on the Application of Intelligent Monitoring Technology for Collection of Cultural Relics Based on the Internet of Things. In Proceedings of the 2017 7th International Conference on Mechatronics, Computer and Education Informationization (MCEI 2017), Shenyang, China, 3–5 November 2017. [Google Scholar]
  16. Cong, Z.; Kang, S. Trace elements and lead isotopic composition of PM10 in Lhasa, Tibet. Atmos. Environ. 2011, 45, 6210–6215. [Google Scholar] [CrossRef]
  17. Jetter, J.J.; Guo, Z.S. Characterization of emissions from burning incense. Sci. Total Environ. 2002, 295, 51–67. [Google Scholar] [CrossRef]
  18. Camuffo, D.; Brimblecombe, P. Indoor air quality at the Correr Museum, Venice, Italy. Sci. Total Environ. 1999, 236, 135–152. [Google Scholar] [CrossRef]
  19. Camuffo, D.; Van Grieken, R. Environmental monitoring in four European museums. Atmos. Environ. 2001, 35, S127–S140. [Google Scholar] [CrossRef]
  20. Gao, Y.; Chen, F. The distribution and influential factors of PM2.5 and CO2 in urban rail carriages. Indoor Built Environ. 2019, 28, 1383–1395. [Google Scholar] [CrossRef]
  21. Worobiec, A.; Samek, L. A seasonal study of atmospheric conditions influenced by the intensive tourist flow in the Royal Museum of Wawel Castle in Cracow, Poland. Microchem. J. 2008, 90, 99–106. [Google Scholar] [CrossRef]
  22. Miller, J.D.; Kelly, A. Changes in rainfall chemistry and airborne particulates during a period of major local industrial change. Sci. Total Environ. 2000, 262, 137–145. [Google Scholar] [CrossRef] [PubMed]
  23. Turner, A.; Sogo, Y. Concentrations and bioaccessibilities of metals in exterior urban paints. Chemosphere 2012, 86, 614–618. [Google Scholar] [CrossRef] [PubMed]
  24. Rasmussen, P.E.; Subramanian, K.S. A multi-element profile of housedust in relation to exterior dust and soils in the city of Ottawa, Canada. Sci. Total Environ. 2001, 267, 125–140. [Google Scholar] [CrossRef] [PubMed]
  25. Harrison, R.M.; Tilling, R. A study of trace metals and polycyclic aromatic hydrocarbons in the roadside environment. Atmos. Environ. 2003, 37, 2391–2402. [Google Scholar] [CrossRef]
  26. Zou, J.Y.; Liu, Z. Sources and distribution of heavy metal and C-N isotopes in topsoils across an urban-rural gradient in a typical hazy city, northern China. Atmos. Environ. 2020, 241, 117802. [Google Scholar] [CrossRef]
  27. Pan, H.Y.; Lu, X.W. A comprehensive analysis of heavy metals in urban road dust of Xi’an, China: Contamination, source apportionment and spatial distribution. Sci. Total Environ. 2017, 609, 1361–1369. [Google Scholar] [CrossRef] [PubMed]
  28. Jahanbin, A.; Semprini, G. Integrated effects of the heat recovery ventilation and heat source on decay rate of indoor airborne particles: A comparative study. J. Build. Eng. 2022, 50, 104156. [Google Scholar] [CrossRef]
  29. Han, Y.; Hu, Y. Effects of air temperature and humidity on particle deposition. Chem. Eng. Res. Des. 2011, 89, 2063–2069. [Google Scholar] [CrossRef]
  30. Kim, J.J.; Hann, T. Effect of flow and humidity on indoor deposition of particulate matter. Environ. Pollut. 2019, 255, 113263. [Google Scholar] [CrossRef]
  31. Lucchi, E. Review of preventive conservation in museum buildings. J. Cult. Herit. 2018, 29, 180–193. [Google Scholar] [CrossRef]
  32. Luciani, A. Historical Climates and Conservation Environments. Historical Perspectives on Climate Control Strategies within Museums and Heritage Buildings. Ph.D. Thesis, Politecnico di Milano, Milan, Italy, 2013. [Google Scholar]
  33. van Schijndel, A.W.M.; Schellen, H.L. Application of an integrated indoor climate, HVAC and showcase model for the indoor climate performance of a museum. Energy Build. 2008, 40, 647–653. [Google Scholar] [CrossRef]
  34. Ferdyn-Grygierek, J. Indoor environment quality in the museum building and its effect on heating and cooling demand. Energy Build. 2014, 85, 32–44. [Google Scholar] [CrossRef]
  35. Mueller, H.F.O. Energy efficient museum buildings. Renew. Energy 2013, 49, 232–236. [Google Scholar] [CrossRef]
  36. Papadopoulos, A.M.; Avgelis, A. Energy study of a medieval tower, restored as a museum. Energy Build. 2003, 35, 951–961. [Google Scholar] [CrossRef]
Figure 1. Time series diagram of particulate matter concentration in Buddha Hall 1.
Buildings 13 02138 g001
Figure 2. Enrichment factor of chemical composition of sediment particles.
Buildings 13 02138 g002
Figure 3. Dendrogram of sediment particles in different regions.
Buildings 13 02138 g003
Figure 4. Annual Temperature difference in various places.
Buildings 13 02138 g004
Figure 5. Temperature diurnal range distribution characteristics in different areas.
Buildings 13 02138 g005
Figure 6. Annual humidity difference in various places.
Buildings 13 02138 g006
Table 1. Details of sampling rooms.
Sampling RoomsArea (m2)Description
Basement47A small, windowless room typically kept closed.
Stockroom 1109A room with openable windows and occasional staff repairing scriptures.
Stockroom 236.5A windowless room that is regularly cleaned and relatively tidy.
Stockroom 3164A room with closed windows and occasional staff activities.
Buddha hall 1102A room with windows, tourists, and burning incense sticks and butter lamps.
Buddha hall 2120
Buddha hall 3270A windowless room with tourists and burning incense sticks and butter lamps.
Buddha hall 4445
Table 2. Size distribution of suspended particulate matter (in µg/m3).
Distribution of Particle Size<0.5 μm0.5–1 μm1–2.5 μm2.5–5 μm5–10 μmPM2.5PM10
Outdoor0.5 ± 0.50.8 ± 0.42.5 ± 0.75.1 ± 121.9 ± 4.53.830.8
Basement1 ± 02 ± 020 ± 3.270.3 ± 9.5340.1 ± 4323433.4
Stockroom 10.9 ± 0.31.9 ± 0.420.3 ± 2.676.6 ± 10.8333.5 ± 58.923.1433.2
Stockroom 20.9 ± 0.30.9 ± 0.34 ± 0.911 ± 3.348.1 ± 16.65.864.9
Stockroom 30 ± 00.7 ± 0.59.1 ± 3.245.5 ± 16244.6 ± 80.49.8299.9
Buddha Hall 11.8 ± 0.92.2 ± 0.96.8 ± 2.38.9 ± 239.5 ± 9.710.859.3
Buddha Hall 21.3 ± 0.71.6 ± 0.96.3 ± 2.311.1 ± 5.549.1 ± 32.89.269.4
Buddha Hall 330.7 ± 5.146.2 ± 17.986.8 ± 51.217.8 ± 6.850.7 ± 10.7163.7232.3
Buddha Hall 425.1 ± 14.448.4 ± 32.998.8 ± 63.542 ± 24163.5 ± 163.1172.3377.8
Table 3. Chemical composition of particles.
TopsoilPlazaTicket OfficeIncense SticksConstruction SiteBuddha Hall 1Buddha Hall 2Buddha Hall 3Buddha Hall 4BasementStockroom 1Stockroom 2Stockroom 3
SiO2 a65.7459.466.420.275.450.847.853.144.054.343.143.940.9
CaO a2.19.28.832.62.016.814.111.428.418.41815.720.6
K2O a312.12.313.94.53.44.13.52.434.43.33.8
MgO a1.191.21.28.00.92.61.922.01.92.122
Fe2O3 a3.925.83.64.92.55.17.39.37.75.87.85.57.5
Al2O3 a13.8917.914.25.811.914.514.515.511.413.413.215.513.5
Na2O a2.141.51.21.92.11.61.71.51.01.12.52.71.6
Cl1498152.02133.012,991.0126.04666.013,68133791659.042724,43920,74212,380
S2552467.62800.919,638.9122.66419.27494.64081.33952.01792.711,848.318,659.210,871.8
P7641372.01418.020,421.0487.06643.0649934111008.01184534579625907
Ti33204342.34009.02908.02278.75058.54862.547575633.95230.56027.75383.45195.2
Ba436741.6650.23381.1231.10.01081628.71356.0596.53019.24510.511,961.4
Sr177139.5220.72443.8275.7364.488.8117.5612.2452.4113.30312
Rb14757.6106.1353.0220.40.088.764.9215.8182000
Zr266174.7389.4219.1129.60.0091.8364.2386.400367.2
Hg00.00.00.00.00.0276293.60.00560.301683.7
Ga170.023.80.016.40.00040.930.5000
Mn619571.5521.21831.6353.2827.9773.7750.4936.3818.6896.88241020.7
Zn65425.0274.8509.443.4292.416476.4197.6528.6160.71166.61024.4907.1
Cr42173.1140.3149.8144.4550.1285.3209.4353.1459.8789.6989.4654.1
Cu22189.399.9167.037.51581.038292393.41006.6238.12207.33561.412594.2
Ni2181.759.775.440.91492.2554535.974.677393.72573.41778.2
Pb31131.8118.80.00.00.0232.101313.652642.401947.6
As200.00.00.00.00.0000.0209.8000
Co10129.30.00.00.00.0278.600.00245.900
Note a: The unit of SiO2, CaO, K2O, MgO, Fe2O3, Al2O3, and Na2O is %, and the others are mg/kg.
Table 4. Environmental monitoring equipment parameters.
Measuring RangeAccuracyResolution RatioPhysical Drawing
Temperature/°C−20~70±0.30.01Buildings 13 02138 i001
Relative humidity/%0~100±20.05Buildings 13 02138 i002
Concentration of CO2/ppm0~2000±501Buildings 13 02138 i003Buildings 13 02138 i004
Illumination intensity/Lux0~10,000±4%0.06Buildings 13 02138 i005Buildings 13 02138 i006
Ultraviolet intensity μw/cm20.02~230±8%0.01Buildings 13 02138 i007Buildings 13 02138 i008
Disclaimer/Publisher’s Note: The statements, opinions and data contained in all publications are solely those of the individual author(s) and contributor(s) and not of MDPI and/or the editor(s). MDPI and/or the editor(s) disclaim responsibility for any injury to people or property resulting from any ideas, methods, instructions or products referred to in the content.