Article

Numerical Simulation of Pressure Wave Propagation and Its Effect on Damage to the Reactor Cavity under TNT Detonation for Steam Explosion

1
Department of Structural Systems and Site Safety Evaluation, Korea Institute of Nuclear Safety (KINS), 62 Gwahak-ro, Yuseong-gu, Daejeon 34142, Republic of Korea
2
Research and Development Team, Korea Simulation Technologies (KOSTECH), 18 Mugunghwa-ro, Ilsandong-gu, Goyang 10401, Republic of Korea
*
Author to whom correspondence should be addressed.
Buildings 2023, 13(9), 2152; https://doi.org/10.3390/buildings13092152
Submission received: 19 July 2023 / Revised: 11 August 2023 / Accepted: 23 August 2023 / Published: 24 August 2023
(This article belongs to the Special Issue Structural Performance in Blast Load Scenarios)

Abstract

:
In a severe accident, molten corium may penetrate the reactor pressure vessel and enter the cooling water in the reactor cavity, and then a steam explosion may occur. Steam explosions can initiate pressure waves and threaten the structural integrity of the reactor cavity. To investigate the propagation characteristics of the pressure waves, including the propagation pattern, attenuation, and amplification under TNT detonation, a coupled numerical approach combined with arbitrary Lagrangian–Eulerian and fluid–structure interaction methods are utilized. The peak pressures of the incident and reflected shock waves decrease rapidly with increasing distance from the charge center, whereas the reflected pressure in the reactor cavity can be between 1.30 and 1.67 times the incident pressure. Then, structural analysis is performed to evaluate the damages to the concrete, liner plate, and reinforcements. From the numerical results, localized and superficial concrete damages are observed in the reactor cavity and the basemat; however, the risk of damage to the concrete, resulting in the collapse of these components is very low. The risk of damage to the liner plate and reinforcements is also very low since the maximum strain values are much lower than the failure criteria. Finally, the structural integrity of the reactor cavity will be maintained during the TNT detonation for the steam explosion.

1. Introduction

When molten corium penetrates the reactor pressure vessel and is propelled into the cooling water in the reactor cavity in a severe accident, the steam explosion phenomenon may occur [1,2,3,4]. In general, the steam explosion begins and continues through four steps of premixing, triggering, propagation, and expansion [3,5]. First, during the premixing process, the molten corium drops into the cooling water and coarsely mixes together [3,5]. Then, the explosive system can remain in this metastable state until a steam explosion is triggered [3,5]. The triggering process is a disturbance that weakens the vapor film surrounding melted particles, permitting liquid contact, and resulting in locally enhanced heat transfer, pressurization, and fine fragmentation [3,5]. During the propagation process, an increase in intensity occurs due to heat transfer, following the triggering [3,5]. During the expansion process, the thermal energy of the molten corium is rapidly and intensively converted to mechanical energy, which can lead to the formation and propagation of pressure waves in the cooling water of the reactor cavity [2,6,7]. The explosion loads as pressure waves can affect the structural integrity of the reactor cavity [2,6].
Therefore, numerous studies have been conducted on energetic explosive phenomena for the steam explosion in a severe accident [1,8,9,10]. However, limited research has been carried out on explosion loads and their effects on components or structures in the containment buildings [3,5,6,7,11]. In their studies, the pressure profiles caused by the steam explosion were simulated using computational fluid dynamics (CFD) or hydrodynamics codes, and then they were implemented into finite element analysis [3,5,6,7,11]. Then, the dynamic response of the components or structures of the reactor cavity was numerically evaluated [3,5,6,7,11]. In the previous study conducted by Kim et al. [3], the hydrodynamics code, i.e., TEXAS-V, and the computational fluid dynamics code, i.e., ANSYS CFX v. 14, were combined and used to simulate the pressure time histories in accordance with ten postulated conditions under the steam explosions. The structural analyses using finite element codes, i.e., Civil-FEM v.13, were carried out to evaluate the structural integrity of the reactor cavity [3]. Finally, the reactor cavity prevented radioactive release during steam explosions despite minor to medium localized damage [3]. Kim et al. [5] performed a series of numerical studies utilizing finite element analyses to determine the effect of yield criteria on damage to the reactor cavity. The previous computational fluid dynamics analysis with ANSYS CFX v.14 [3] was used to obtain steam explosion loading histories [5]. Then, systematic structural analyses using the finite element code, i.e., Civil-FEM v.13, were conducted to determine the stress or strain levels of the reactor cavity [5]. On the basis of the numerical findings, it was determined that the reactor cavity maintained its structural integrity under steam explosion conditions, regardless of yield criteria [5]. Cizelj et al. [6] used ABAQUS Explicit code and CFD code, i.e., CFX-5.7.1, to assess the vulnerability of a partially flooded reactor cavity in a pressurized water reactor (PWR) subjected to the steam explosion. During premixture high-pressure relief, CFD simulations showed a propagation pattern of the pressure loads into cavity walls, and ABAQUS/Explicit simulations demonstrated that cavity walls will not collapse [6]. Chunyu et al. [7] used the thermo-hydraulic multiphase flow code, i.e., MC3D, to calculate the pressure wave profile based on five typical steam explosion scenarios. They used a finite element code, i.e., ABAQUS, to evaluate the integrity of the whole CPR-1000 containment building during steam explosions [7]. According to numerical analyses [7], the majority of the blast energy was absorbed by the deformation of the structures and internal components. Even though the internal facilities and structures were severely damaged by the pressure waves, it was determined that negligible damage to the containment was observed, and structural integrity was maintained [7]. Park et al. [11] utilized the transient analysis code for explosive reactions (TRACER-II) to perform a numerical simulation of a steam explosion load. The damages to the concrete, rebars, and liner plate in the reactor cavity for the APR-1400 containment during a steam explosion were subsequently evaluated [11]. Their study concluded that the structural integrity of a reactor cavity was guaranteed during a steam explosion [11].
Even though significant progress has been made in the steam explosion modeling and structural analysis of the reactor cavities, it is still challenging to simulate the propagation of the complex pressure waves and to assess proper damages to the concrete, reinforcements, and liner plate, as stated by Chunyu et al. [7]. To date, little research has been conducted on the characteristics of pressure wave propagation in cooling water and the reactor cavity. It is crucial to comprehend these propagation characteristics, such as propagation pattern, attenuation, and amplification since explosion loads will be overestimated or underestimated, respectively, if pressure waves are improperly amplified during the pressure–structure interaction or insufficiently attenuated along the stand-off distance. Moreover, the propagation characteristics of the pressure waves can affect the distribution and level of potential damage to internal structures and facilities, such as the reactor cavity, basemat, and components near the reactor cavity, as well as the reactor pressure vessel, its supporting system, and the pipelines connected to the reactor pressure vessel. As a result, the propagation characteristics of the pressure waves, such as amplification and attenuation, should be considered in order to establish realistic and reasonable load conditions for structure analysis. In addition, the systematic procedure needs to be validated in order to assess potential damage to the concrete and steel materials of the reactor cavity. The findings from the numerical simulation results will be of interest to nuclear or civil engineers attempting to solve problems associated with the evaluation of the safety of existing nuclear power plants. This study will provide significant information for evaluating the propagation characteristics of pressure waves caused by a steam explosion and assessing the structural integrity or damage to the reactor cavity in the containment buildings. To address these issues, the advanced numerical technique, i.e., arbitrary Lagrangian–Eulerian (ALE) and fluid–structure interaction (FSI) methods in LS-DYNA explicit code, are adopted and utilized in this study. Using the relationship between the thermal energy of the molten corium and the equivalent mechanical energy of the TNT, the equivalent TNT mass for the steam explosion is calculated and implemented as an initial condition for finite element analyses. By using a coupled numerical approach with ALE and FSI methods, the propagation characteristics of the pressure waves of the incident and reflected shock waves in the reactor cavity with a complex configuration are numerically simulated. For this, a comprehensive three-dimensional finite element model is developed for air and water fluids, as well as structures such as the reactor cavity and basement of the PWR containment building. The structural analysis is carried out to evaluate the characteristics of the effective stress wave propagation. According to the IAEA technical report [12], the principal strain distribution and concrete cracks are observed to evaluate the concrete damage in the reactor cavity and basemat. In accordance with NEI 07-13 [13], the damage to the liner plate and reinforcements is also evaluated. Based on these findings, the structural integrity of the reactor cavity is numerically assessed.

2. Methodologies

2.1. Material Models

2.1.1. Material Models for Concrete and Steel

A non-linear material model called Winfrith was developed and validated against impact or blast tests on civil structures during the past three decades [14,15]. By analyzing and comparing the dynamic response of the reinforced concrete structures with impact or blast tests, its validity has been widely demonstrated [14,15]. In particular, it is known that the behavior of the concrete has been strain-rate dependent; thus, the coding in LS-DYNA for the Winfrith model follows the recommendations of the enhancement factors for tension and compression [16]. The Winfrith concrete model is based on the Ottosen yield criterion to describe the behavior of the concrete, where its mathematical expression in Equations (1)–(5) are as follows [17,18,19,20]:
F I 1 , J 2 , c o s 3 θ = a J 2 ( f c ) 2 + λ J 2 f c + b I 1 f c 1
where
c o s 3 θ = 3 3 2 J 3 J 2 1.5
and
λ = k 1 c o s 1 3 c o s 1 ( k 2 c o s ( 3 θ ) )   for   c o s 3 θ 0
            λ = k 1 c o s π 3 1 3 c o s 1 ( k 2 c o s ( 3 θ ) )   for   c o s 3 θ 0
while   α 0 ;   λ 0 ;   k 1 0 ;   0 k 2 0
where I1 is the first invariant of the stress tensor; J2 is the second invariant of the deviatoric part of the stress tensor; J3 is the third invariant of the deviatoric part of the stress tensor; q is the angular coordinate; fc is the strength of concrete in uniaxial compression; ft is the strength of concrete in uniaxial tension; and the parameters a, b, k1 and k2 are functions of the ratio of concrete strength in uniaxial tension to the strength of concrete in uniaxial compression (ft/fc), where they are determined from tests in uniaxial compression or tension as well as biaxial or triaxial compression. More information on details of the Winfrith concrete model can be found in Schwer [17], Kral and Husek [18], and Hokes et al. [19].
The required input parameters for the Winfrith concrete model are provided via empirical formulae as Equations (6) and (7) [21].
T M = 57,000 f c   ( psi )
U T S = 7.0 f c   ( psi )
G F = G F 0 f c 10 0.7   ( lb / in )
where TM is the initial tangent modulus in psi, UTS is the uniaxial tensile strength in psi, GF is the fracture energy in accordance with CEB [22], where GF0 is a coefficient as a function of maximum aggregate diameter in lb/in, and  f c  is the unconfined compressive strength of the concrete in psi. The material properties of concrete in a reactor cavity and basemat are summarized in Table 1. For this study, it is assumed that the material properties of the concrete in the reactor cavity and the basemat are the same. In this study, the strain rate effect is taken into account by selecting the strain rate effect option offered by the Winfrith concrete model, i.e., RATE = 0 [23]. The strain rate enhancement of the Winfrith concrete model is described by Broadhouse and Attwood [15].
The piecewise linear plasticity model was developed for an elastoplastic material with an arbitrary stress versus strain curve and an optional arbitrary strain rate dependence [23]. Failure can be defined as a function of plastic strain or a minimal time step size, and a bilinear stress–strain curve can account for the stress–strain behavior by defining the tangent modulus [23]. To account for the strain rate effects of the steel materials, strain rate parameters C and P in the Cowper and Symond model [23] are set to 40,400 s−1 and 5.0, respectively. Table 2 summarizes the reinforcement and liner plate material properties for the piecewise linear plasticity model.

2.1.2. Material Models for TNT, Water and Air

Explosive (TNT) is modeled with Eulerian elements and the Jones–Wilkins–Lee state equation (*EOS_JWL), as shown in Equation (9) [23,24].
p = A 1 ω R 1 V e R 1 V + B 1 ω R 2 V e R 2 V + ω E V
where E is the specific internal energy per explosive mass, V is its initial relative volume, A, B, ω, R1, and R2 are its constants, and a variety of experimental data are taken into consideration. The *EOS_JWL parameters are derived from Dobratz and Crawford [25] with the following values: A = 371.2 GPa, B = 3.231 GPa, R1 = 4.15, R2 = 0.95, ω = 0.30, and Eo = 7.0 GPa. To define the explosive material model and manage the chemical energy relationship during the explosion analysis, *MAT_HIGH_EXPLOSION_BURN is used along with the equation of state for the explosive. *INITIAL_DETONATION is used to specify the initial explosion location and time within a component containing explosive material.
The water equation of state, *EOS_GRUNEISEN, and Eulerian elements are used to model the fluid area of the cooling water [23]. As the equation of state for shock wave velocity as a function of particle velocity, *EOS_GRUNEISEN can be utilized to calculate the pressure of a compressed material, such as cooling water, in Equation (10) [23].
p = ρ 0 C 2 μ 1 1 + 1 r 0 2 μ 1 a 2 μ 1 2 1 S 1 1 μ 1 S 2 μ 1 2 μ 1 + 1 S 3 μ 1 3 ( μ 1 + 1 ) 2 2 + r 0 + a μ 1 E 0
Equation (11) can be used to calculate the pressure of the expanding material.
p = ρ 0 C 2 μ 1 + r 0 + a μ 1 E 0
where C is the intercept of the particle velocity versus time curve, vp in velocity units, S1, S2, and S3 are dimensionless slope constant values of the vp curve,  γ 0  is the dimensionless Gruneisen gamma constant, a is the first order volume,  μ 1 = ρ / ρ 0 1  for  γ 0 , and E0 is the internal energy. The parameters of *EOS_GRUNEISEN are derived from Trevino and Shin [26], with the following values: C = 1480, S1 = 1.75, S2 = 0.00, S3 = 0.00, a = 0.00,  γ 0 =  0.4934, and E0 = 2.03 × 10⁻⁴ GPa, respectively.
During explosion analysis, *EOS_LINEAR_POLYNOMIAL identifies the coefficient values of a linear polynomial and assigns the initial pressure of the air above the surface of the free water to 1 bar [23].
p = C 0 + C 1 μ 2 + C 2 μ 2 2 + C 3 μ 2 3 + C 4 + C 5 μ 2 + C 6 μ 2 2 E
where C0 = 0, C1 = 0.0001, C2 = 0, C3 = 0, C4 = 0.4, C5 = 0.4, and C6 = 0.0 for the linear polynomial, E = 2.5 × 10⁻⁴ GPa for internal specific energy per mass and  μ 2 = 1 / V , where the relative volume, V is assumed to be 1.0 [25].
In this study, air and water are modeled using null materials. The null material model is chosen due to its capacity to define dynamic viscosity, incorporate a strain rate, and calculate fluid stresses [26]. The air and water parameters in *MAT_NULL are taken from Webster [27]. The air and water parameters in *MAT_NULL are taken from Webster [26]. The corresponding values for air are  ρ   = 1.280 kg/m3, Pc (pressure cutoff) = 0.00 Pa, μ3 (viscosity coefficient) = 0.00 Pa·s, respectively, while those for water are  ρ 0   = 1025 kg/m3, Pc (pressure cutoff) = −1 × 10²⁰ Pa, μ4(viscosity coefficient) = 1.13 × 10⁻³ Pa·s, respectively [26].

2.2. Numerical Modeling

2.2.1. Arbitrary Lagrangian–Eulerian and Fluid–Structure Interaction Methods

An arbitrary Lagrangian–Eulerian (ALE) method combined the benefits of Lagrangian and Eulerian algorithms to effectively solve some problems related to fluid–structure interaction and large deformation [28,29]. In this method, Eulerian elements may impose pressure on Lagrangian surfaces, resulting in the deformation of the solid medium [28,29]. In other words, Lagrangian elements implement displacement boundary conditions on the Eulerian algorithm, whereas Eulerian material imposes pressure boundary conditions on Lagrangian grids [29]. Besides that, the fluid–structure interaction method was defined to preserve the system’s total energy using a penalty-based formulation [30]. Its basic idea was to track the relative displacement between the coupled Lagrangian nodes and the fluid, and the coupling forces were determined in proportion to these displacements [30].

2.2.2. Mesh Sensitivity of Fluid Model Using 1D ALE Method

To determine the optimal mesh size of the fluid model for water in the reactor cavity, the mesh sensitivity is conducted using the one-dimensional (1D) fluid model with five different meshes of 10, 30, 50, 70, and 90 mm. The material models for TNT and water described in Section 2.1.2 are adopted and implemented in the 1D ALE analysis. Figure 1 presents the peak incident pressures as a function of the distance from the charge center, as determined by the 1D ALE analysis. To validate the accuracy of the numerical results, the peak incident pressures as a function of stand-off distance are predicted using the following empirical formula (Cole’s model) [31,32]:
p m a x = 52.3 m 3 / r 1.13
where pmax is the maximum incident pressure (MPa), m is the mass of the explosive charge (kg) and r is the stand-off distance (m) [31,32].
Comparing the numerical results to the empirical results, Figure 1 reveals discrepancies between the numerical results and the empirical prediction near the explosive charge. However, as the distance from the charge center increases up to approximately 2.0 m, the numerical results match the empirical prediction increasingly well. As shown in Figure 1, mesh sizes of 10.0 mm and 30.0 mm produce higher maximum incident pressures than the empirical predictions, whereas mesh sizes of 50.0 mm or less produce relatively lower maximum incident pressures. By further reducing element size, computational time, and computer memory, the cost can increase substantially. Thus, for the fluid model in the near-field zone of the TNT charge, a 50 mm mesh size is selected to increase calculation efficiency.

2.2.3. FE Modeling

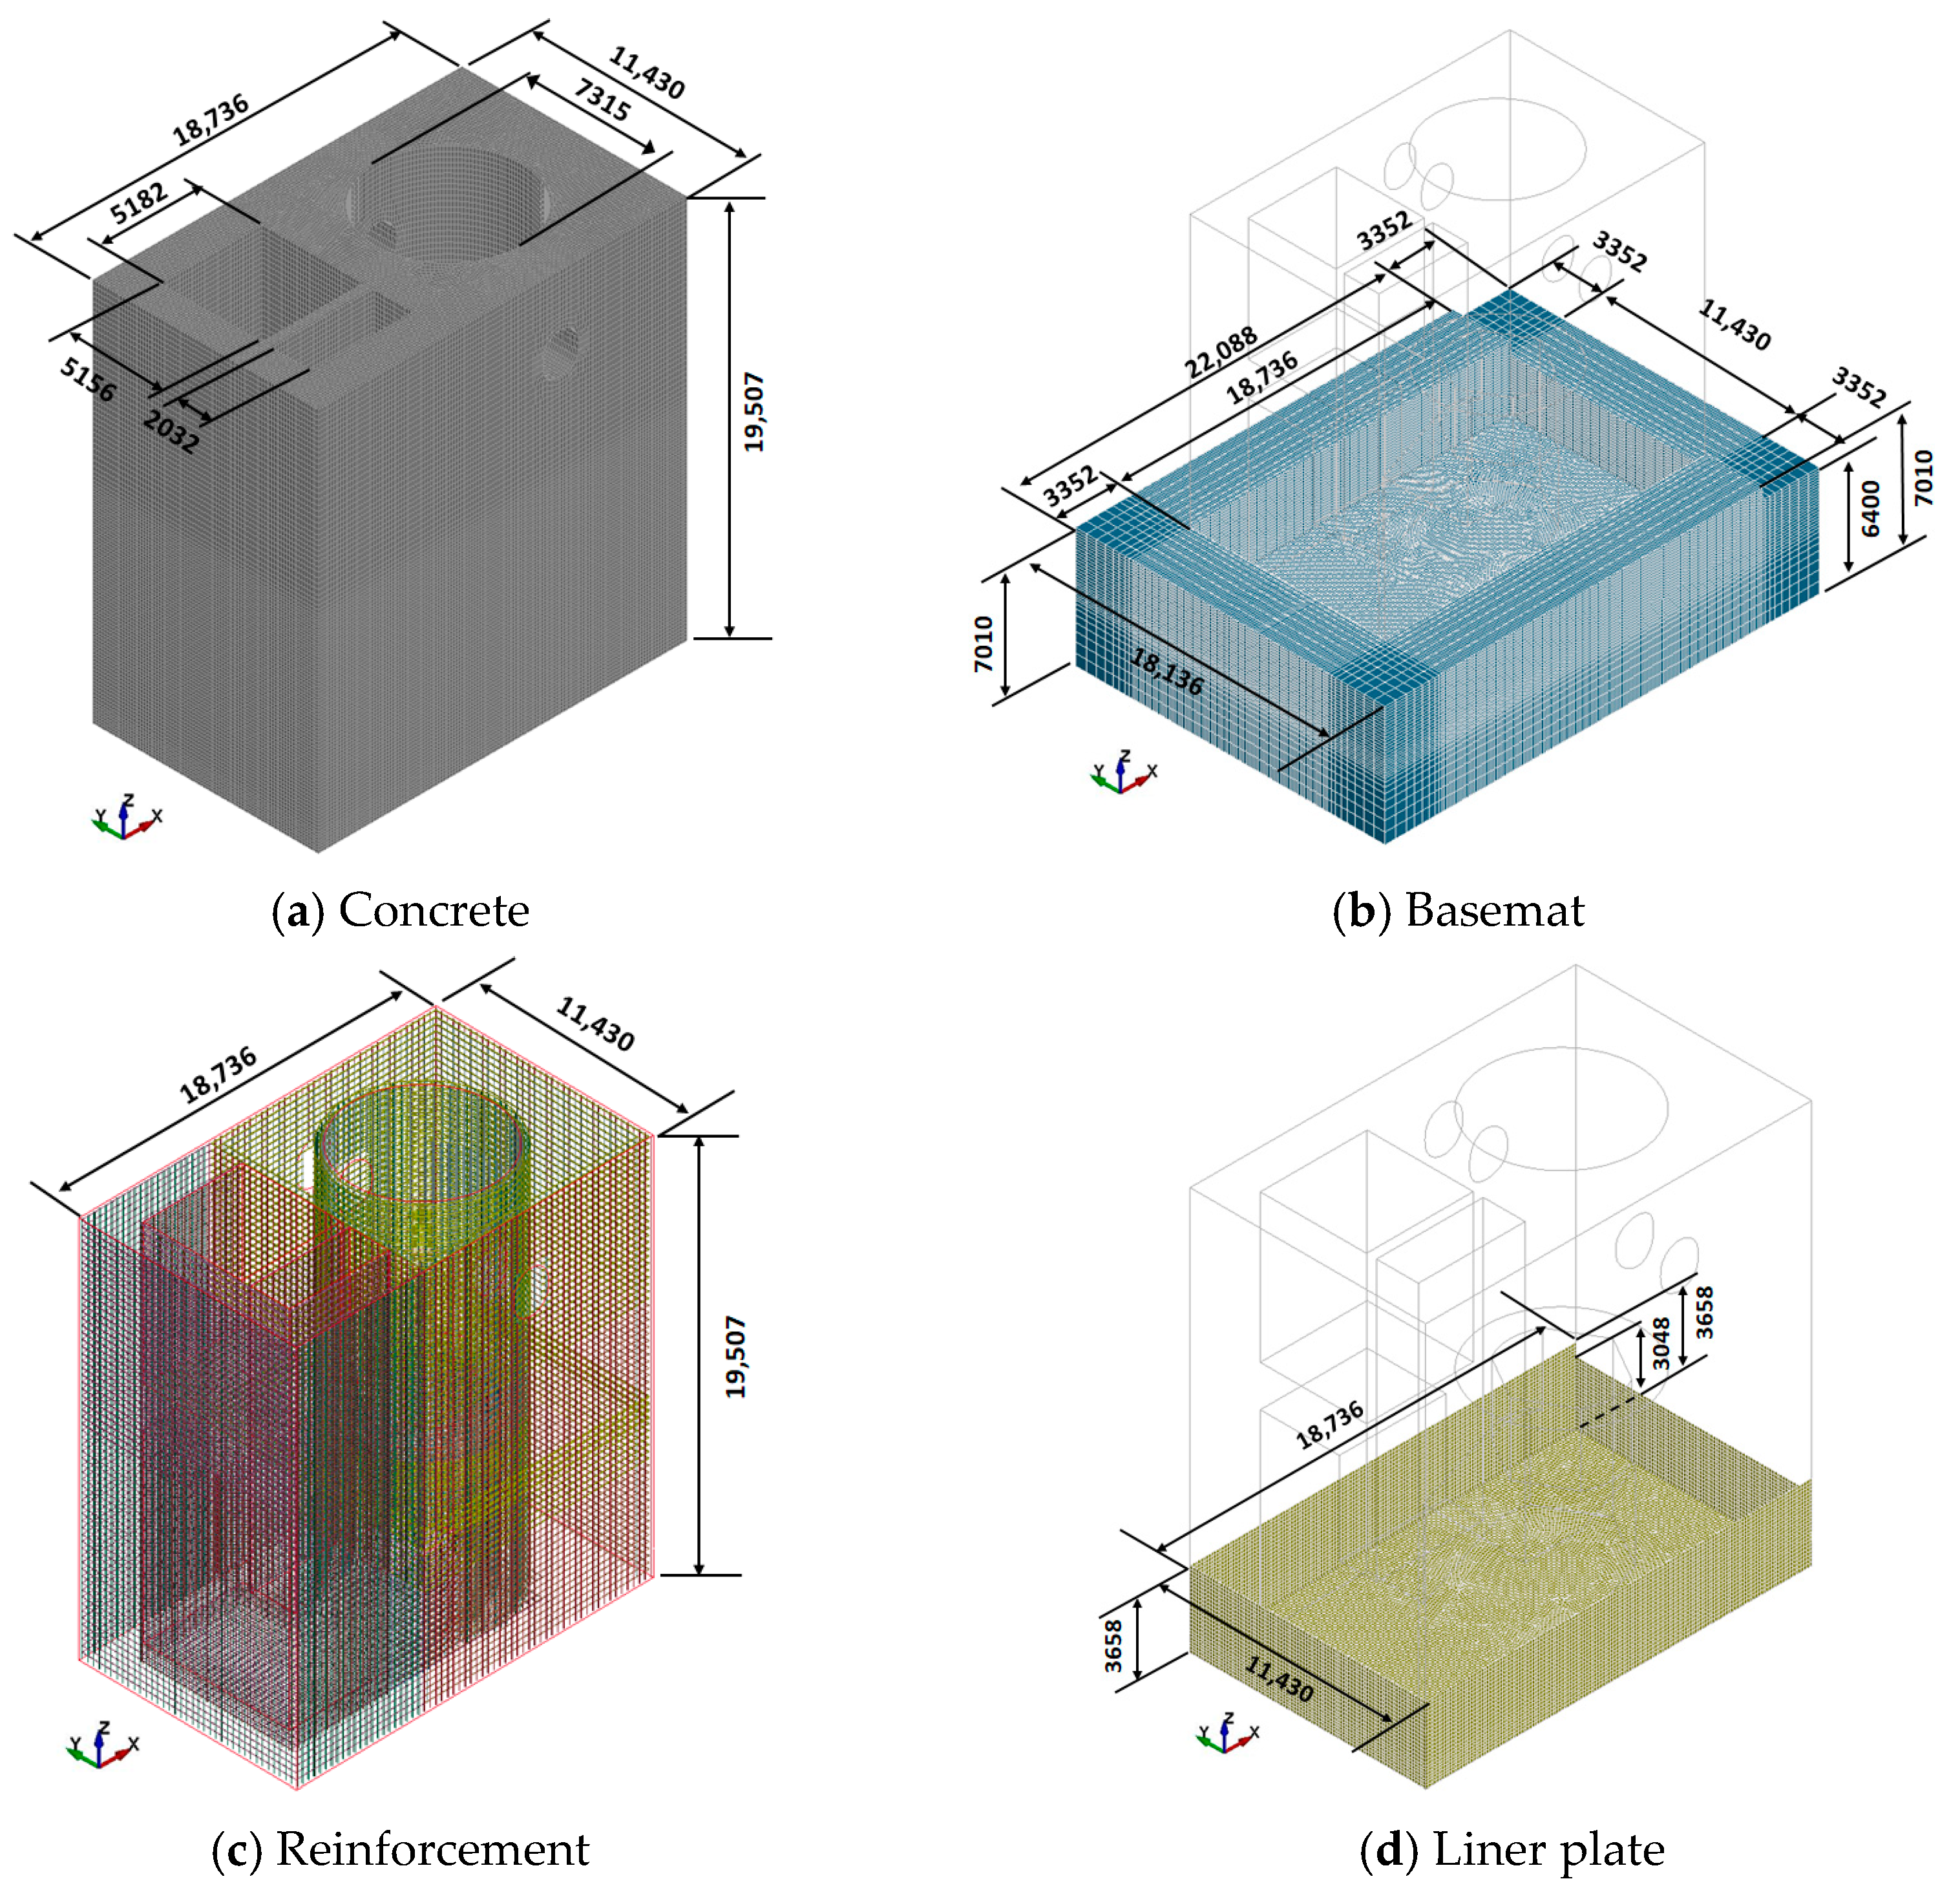
Figure 2 depicts the finite element modeling of the concrete, reinforcements, and liner plate of the reactor cavity, as well as the concrete of the basemat for the PWR containment building. The length, width, and height of the respective finite element models of the concrete, reinforcements, and liner plate of the reactor cavity, as well as the concrete of the basemat, are depicted in Figure 2a–d. As shown in Figure 2a, the concrete in the reactor cavity is modeled with 3D (solid) elements using 940,981 solid elements. The concrete element size of 150 mm is used in the area of the reactor cavity containing cooling water, while the concrete element size of 250 mm is used in all other areas. This is intended to accurately calculate the damage caused by the dynamic loading in the vicinity of the TNT detonation region in the reactor cavity. To establish the boundary conditions of the reactor cavity, the concrete of the basemat in the containment building in contact with the liner plate was modeled as 227,840 solid elements, as seen in Figure 2b.
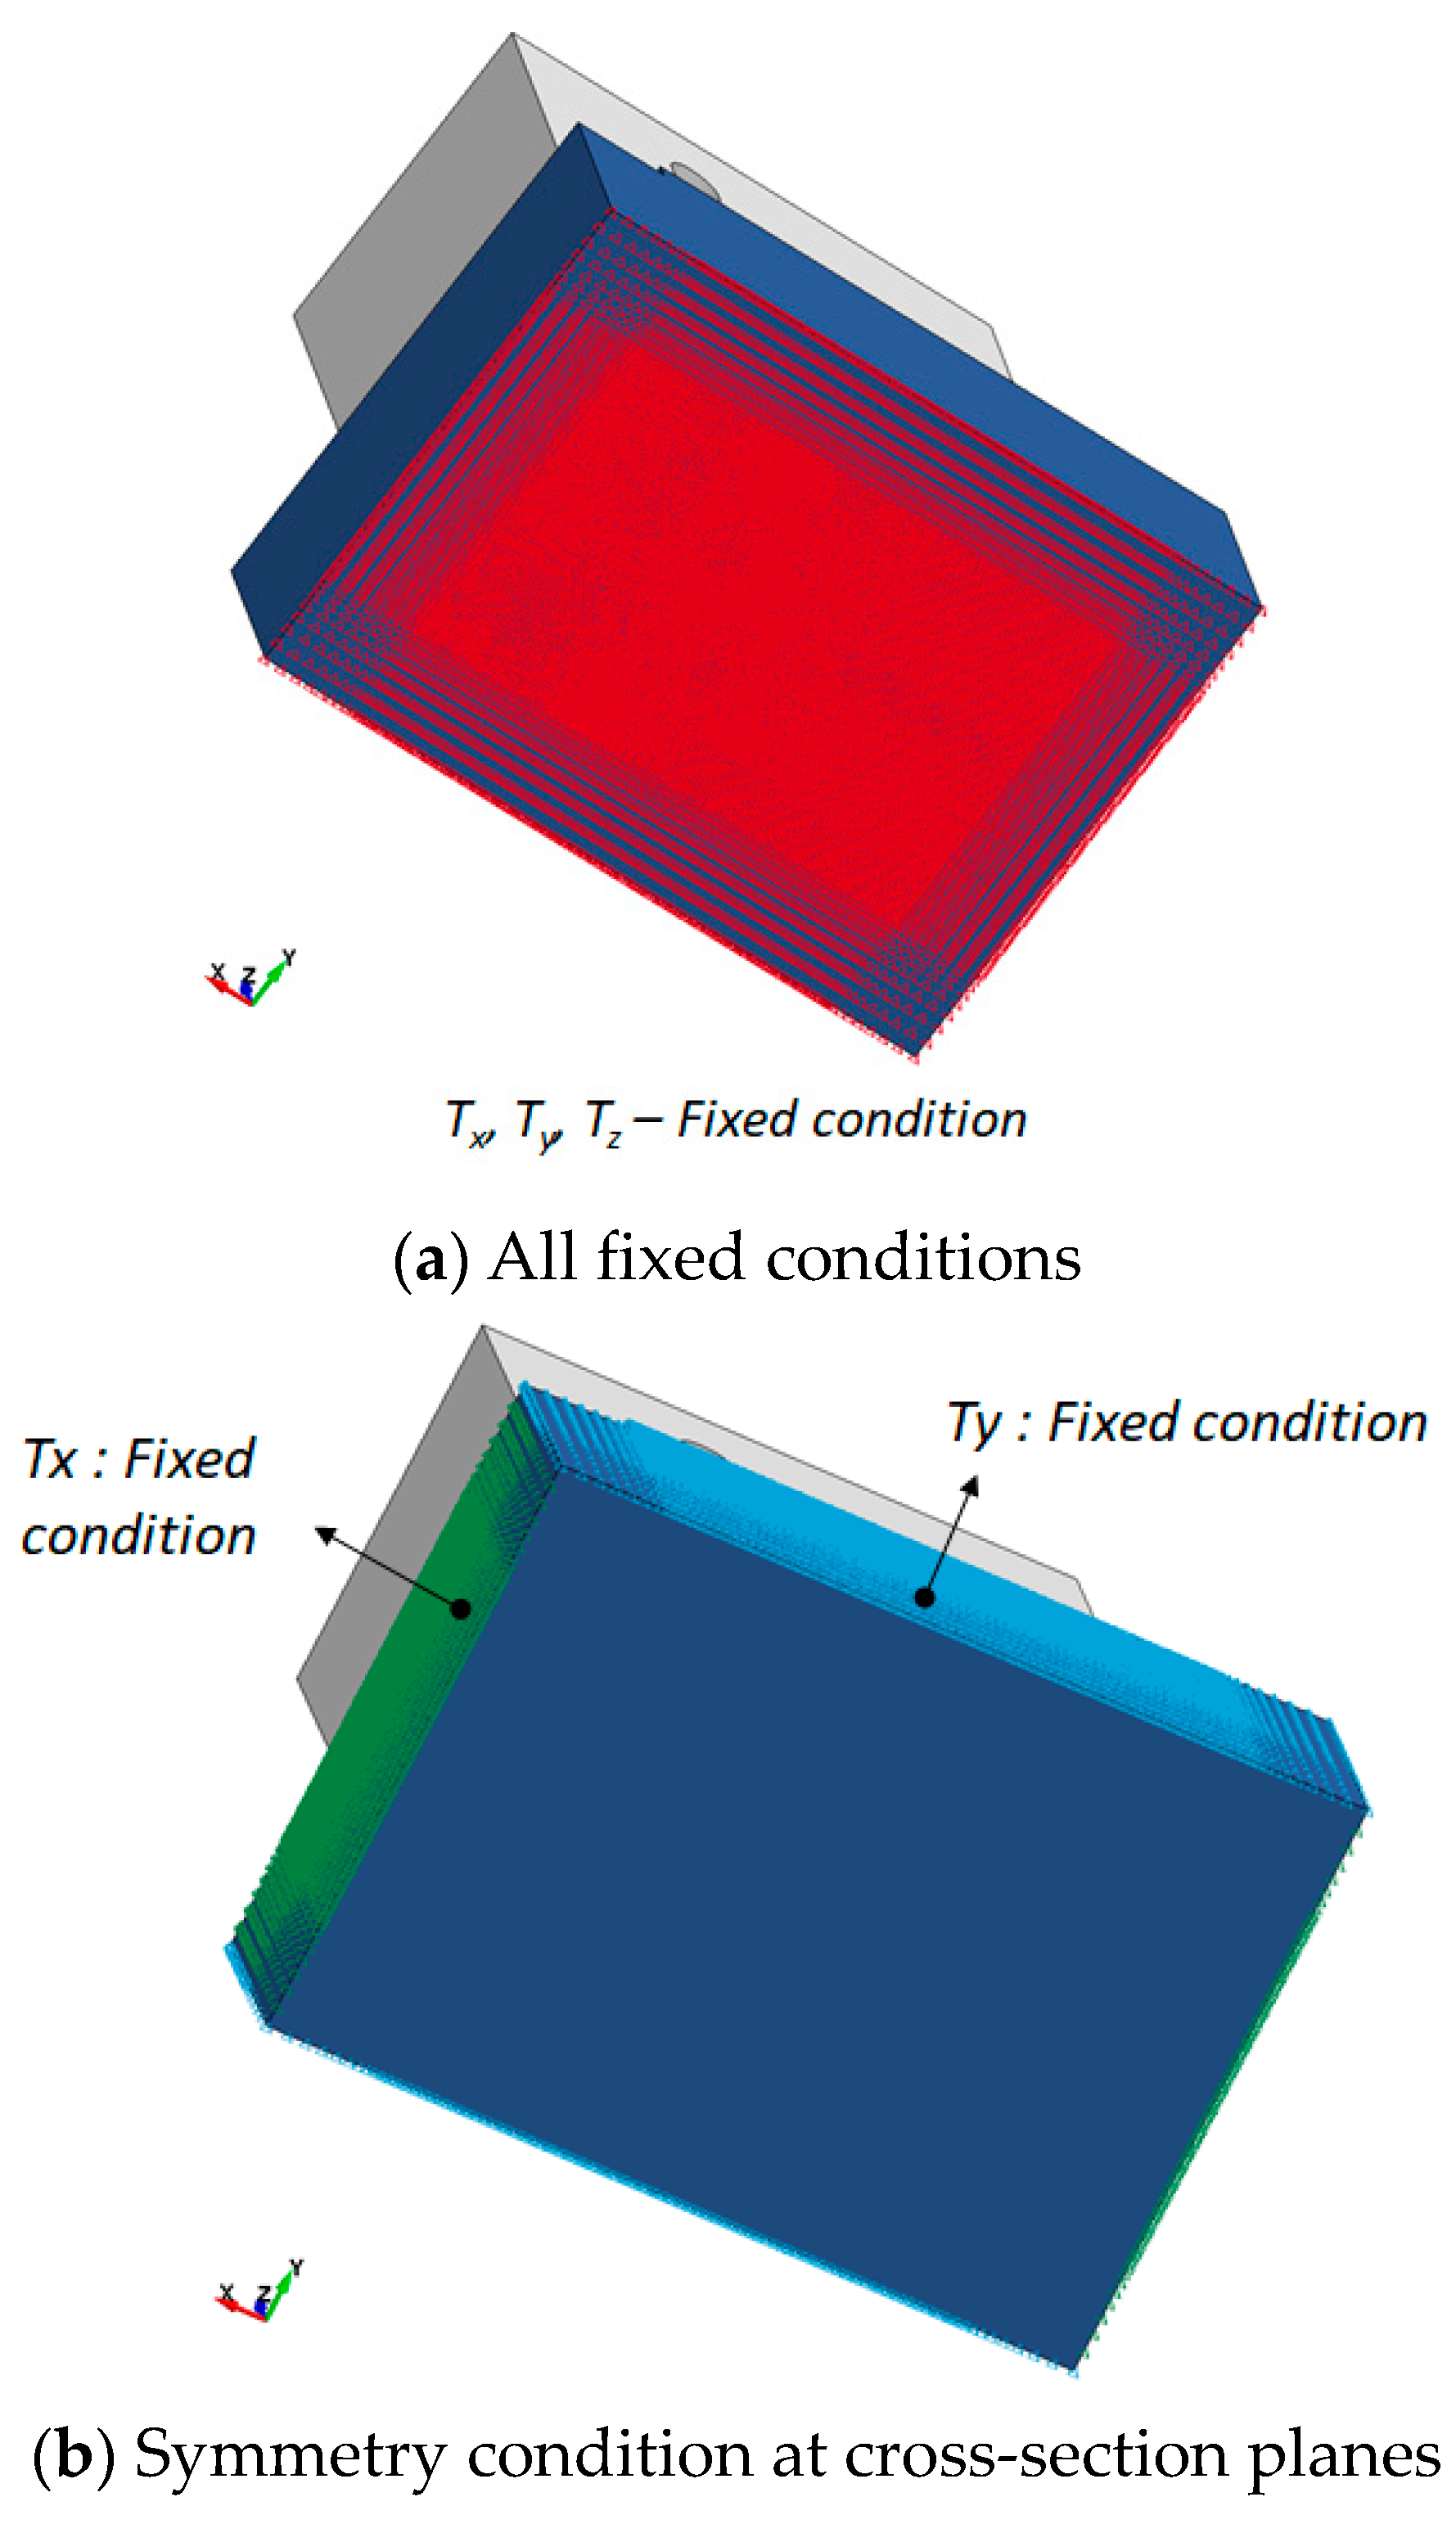
For reinforcements, a concrete cover thickness of 40 mm is assumed. As depicted in Figure 2c, the reinforcements are constructed using 1,168,019 beam elements and are positioned appropriately in the finite element model of the reactor cavity. The carbon steel liner plate is modeled using 23,784 shell elements, as shown in Figure 2d. The liner plate is affixed to the exterior of the reactor cavity as well as the upper surface of the basemat to allow it to achieve the same behavior by sharing nodes with concretes. As depicted in Figure 3a, all nodes on the bottom surface of the basemat are pinned (constrained in the Tx, Ty, and Tz axes). As seen in Figure 3b, the symmetry condition is applied to the cross-section planes to simulate the continuous components of the basemat of the containment building.
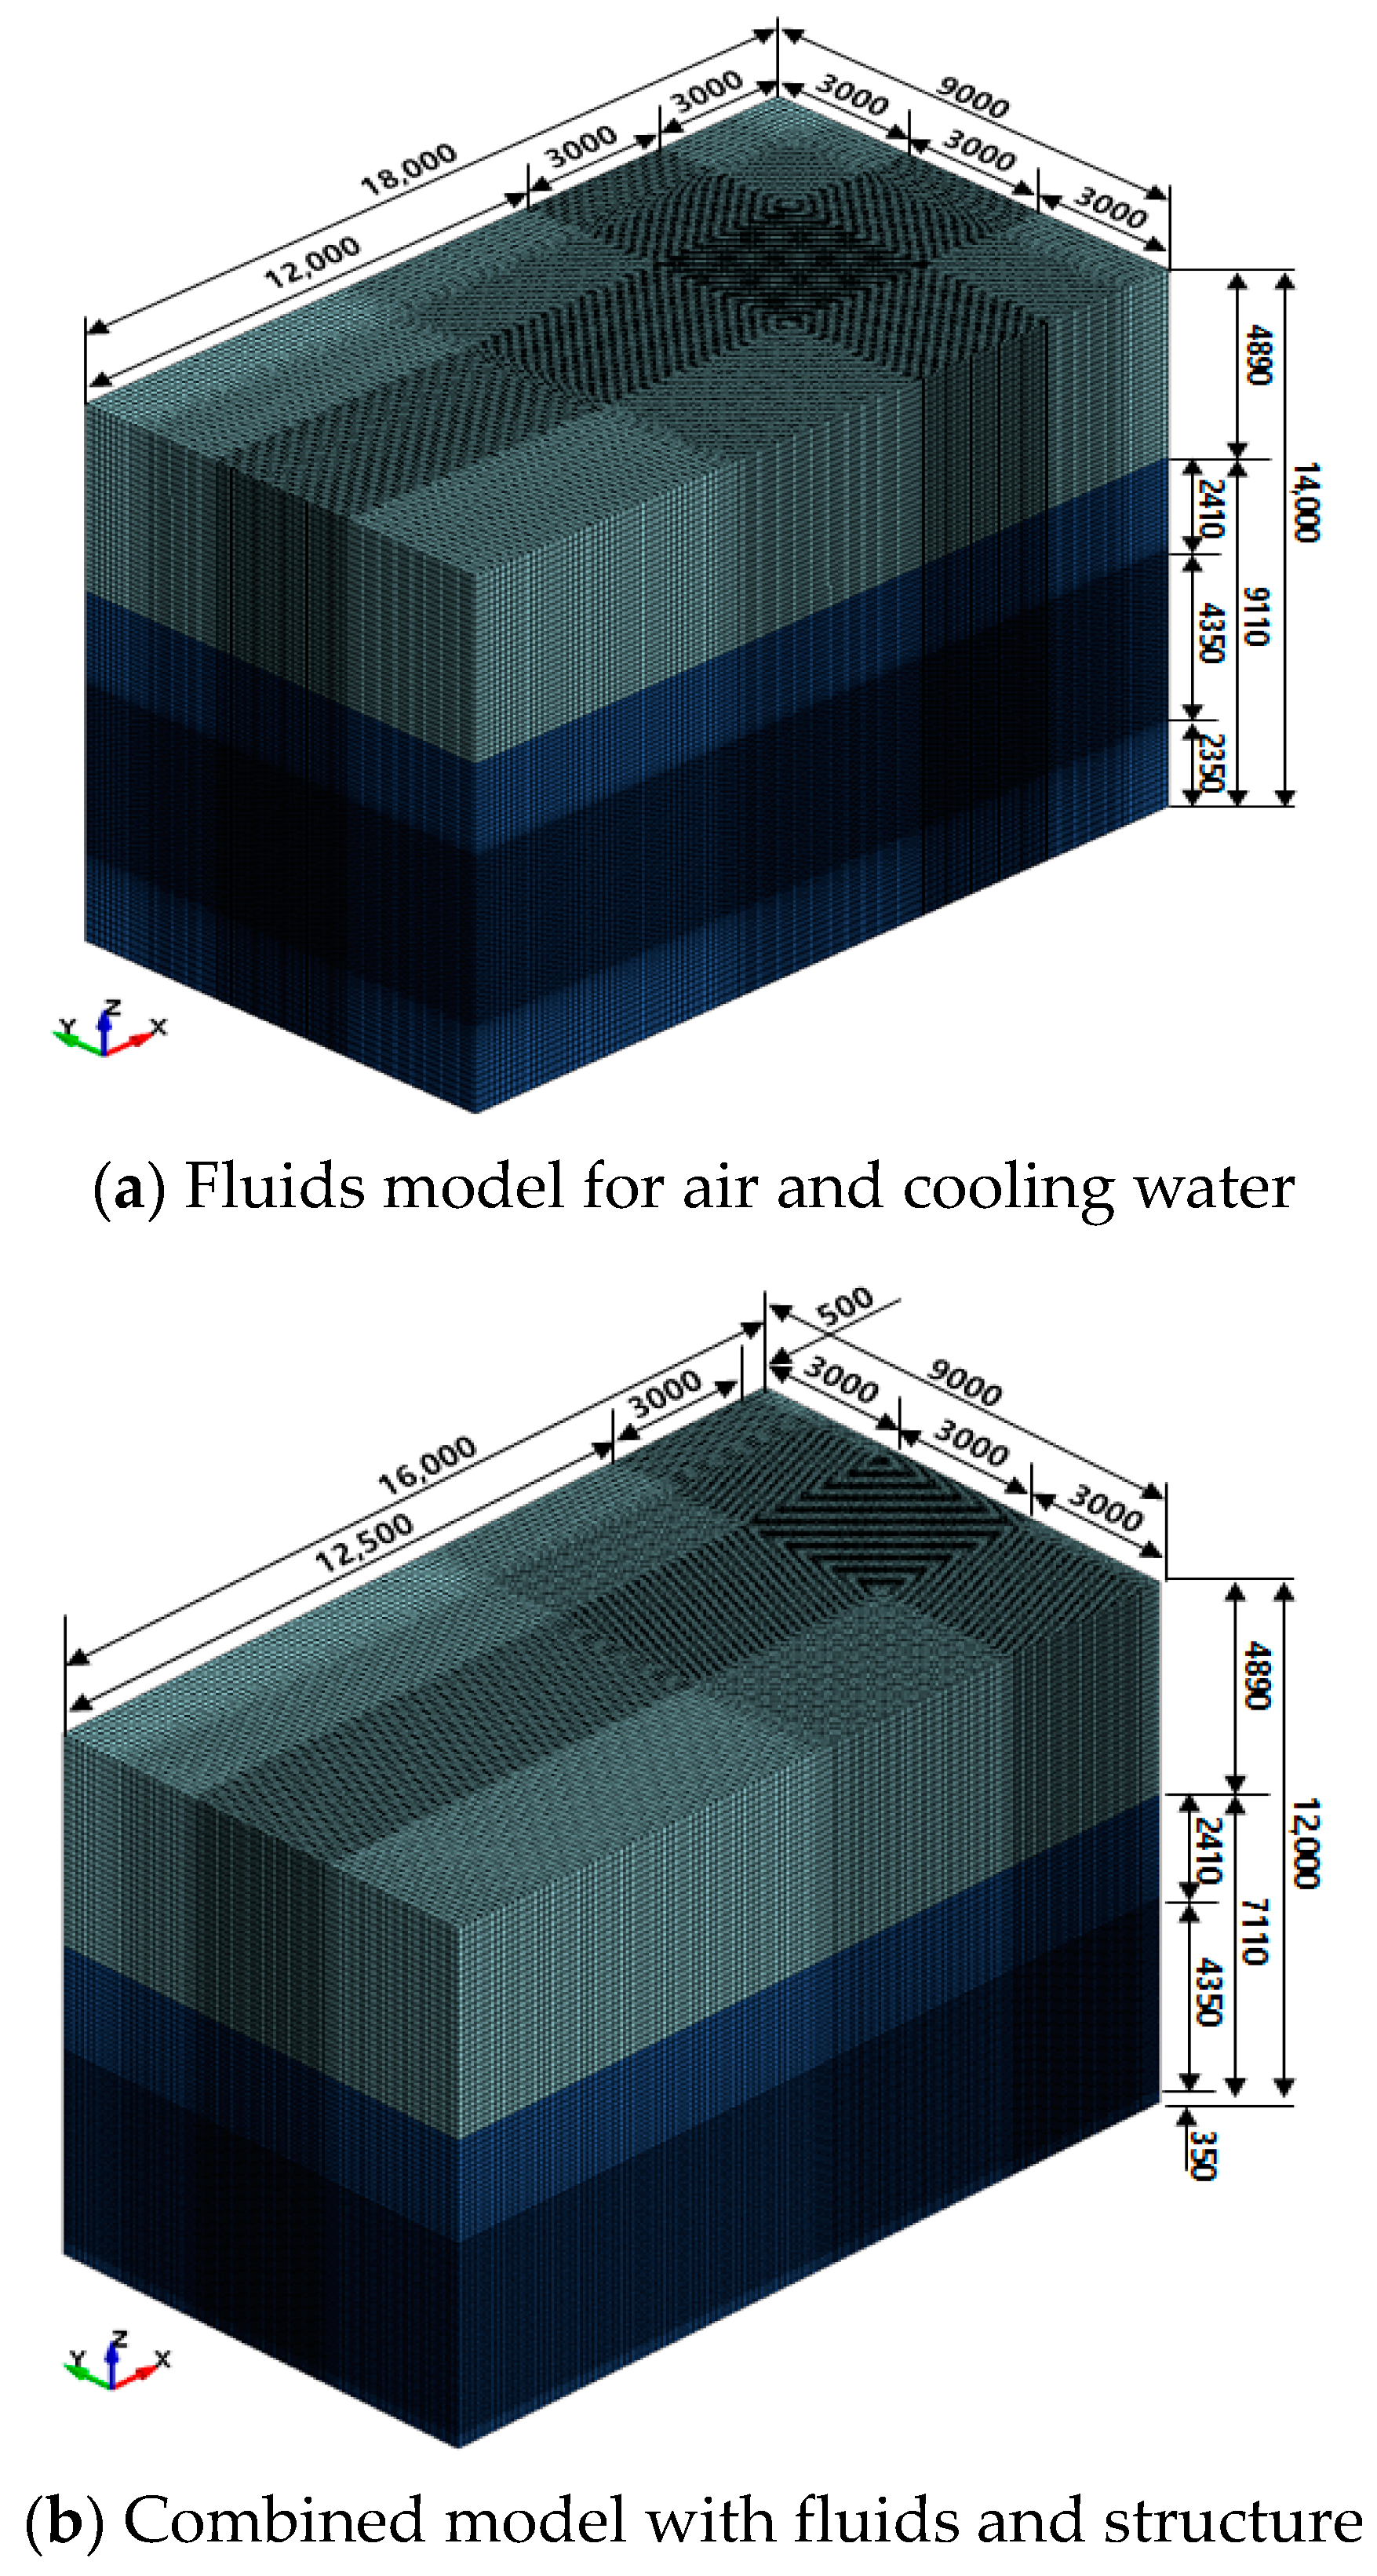
As illustrated in Figure 4a, an adequate finite element model for water and air is developed and incorporated into ALE analysis to simulate the incident pressure wave. As shown in Figure 4b, the combined model, including the structural model of the reactor cavity along with the fluid models for water and air, is developed and incorporated into the FSI analysis to simulate the reflected pressure waves. For the ALE analysis, a water fluid model with a height of 9.1 m is developed to represent the free water surface of the cooling water in the reactor cavity, and an air-fluid model with a height of approximately 4.9 m is constructed from the free water surface. A water fluid model with a height of approximately 7.1 m and an air fluid model with a height of approximately 4.91 m are constructed for the FSI analysis. As depicted in Figure 4a,b, the regions of the water and air-fluid models containing TNT detonation positions are uniformly modeled with a 50 mm element size, while other regions were modeled by increasing the mesh size from 100 mm to 200 mm to improve calculation efficiency for both ALE and FSI analyses. In this study, fluid–structural interaction is applied using *CONSTRAINED_LAGRANGE _IN_SOLID, with the reactor cavity structure as the slave and the cooling water as the master. As shown in Figure 5a, the TNT model is placed in the corner of the reactor cavity where a steam explosion may occur. It was assumed that the TNT detonation for the steam explosion occurs as a contact explosion at the corner of the reactor cavity. To reduce the numerical errors and improve the precision of the numerical results, the TNT model is positioned 80 mm (0.08 m) from the bottom or side wall surfaces, as shown in Figure 5b.
Using the relationship between the thermal energy of the molten corium and the equivalent mechanical energy of TNT, it is feasible to calculate the equivalent mass of TNT for simulating the phenomenon of the steam explosion [33]. In order to determine the equivalent mass of TNT for the steam explosion, two assumptions are required: (1) molten corium ejected from a reactor pressure vessel forms a virtual cylindrical column with a specific diameter and height in the cooling water of the reactor cavity, and (2) the thermal energy of the entire mass of ejected molten corium can be converted to mechanical energy.
For this study, the diameter of the molten corium ejected from the reactor pressure vessel is assumed to be 0.118 m, and the height of the cooling water is assumed to be approximately 6.4 m; therefore, the area and volume of a virtual cylindrical column filled with molten corium are calculated to be 1.094 × 10⁻² m2 and 7.00 × 10⁻² m3, respectively. Using a density of 7960 kg/m3 for the molten corium [34], the mass of all of these substances is calculated to be 557.2 kg. The heat capacity of the molten corium, consisting of 80% fuel (UO2) and 20% oxidized cladding material (ZrO2) has become approximately 1298 kJ/kg at 2800 K [35]. Consequently, the total thermal energy in the virtual cylindrical column is calculated to be approximately 723,246 kJ. By determining the relationship between the thermal energy of the molten corium and the equivalent mechanical energy of 1 kg TNT, it is possible to calculate the equivalent TNT mass using Equation (14) as follows [33]:
E q u i v a l e n t   T N T   m a s s ( k g ) = T o t a l   h e a t   c a p a c i t y k J × E n e r g y   c o n v e r s i o n   r a t i o % E q u i v a l e n t   m e c h a n i c a l   e n e r g y   o f   1   k g   T N T k J
where an average energy conversion ratio of 0.029% is chosen based on measured data in the range of 0.01% to 0.05% from the KROTOS experiment with molten corium in the technical report [36]. The equivalent mechanical energy of 1 kg of TNT is assumed to be approximately 4393 kJ [37]. According to Equation (14), the equivalent TNT mass is calculated to be approximately 4.90 kg in this study.

3. Results and Discussion

To investigate the characteristics of the pressure wave propagation in the cooling water and reactor cavity subjected to the TNT detonation, ALE analysis using fluid models (air and water) and fluid–structure analysis utilizing the combined model with fluid models and structures, i.e., reactor cavity and basemat, are carried out.

3.1. Characteristics of the Pressure and Stress Waves Propagation

3.1.1. Pressure Wave Propagation

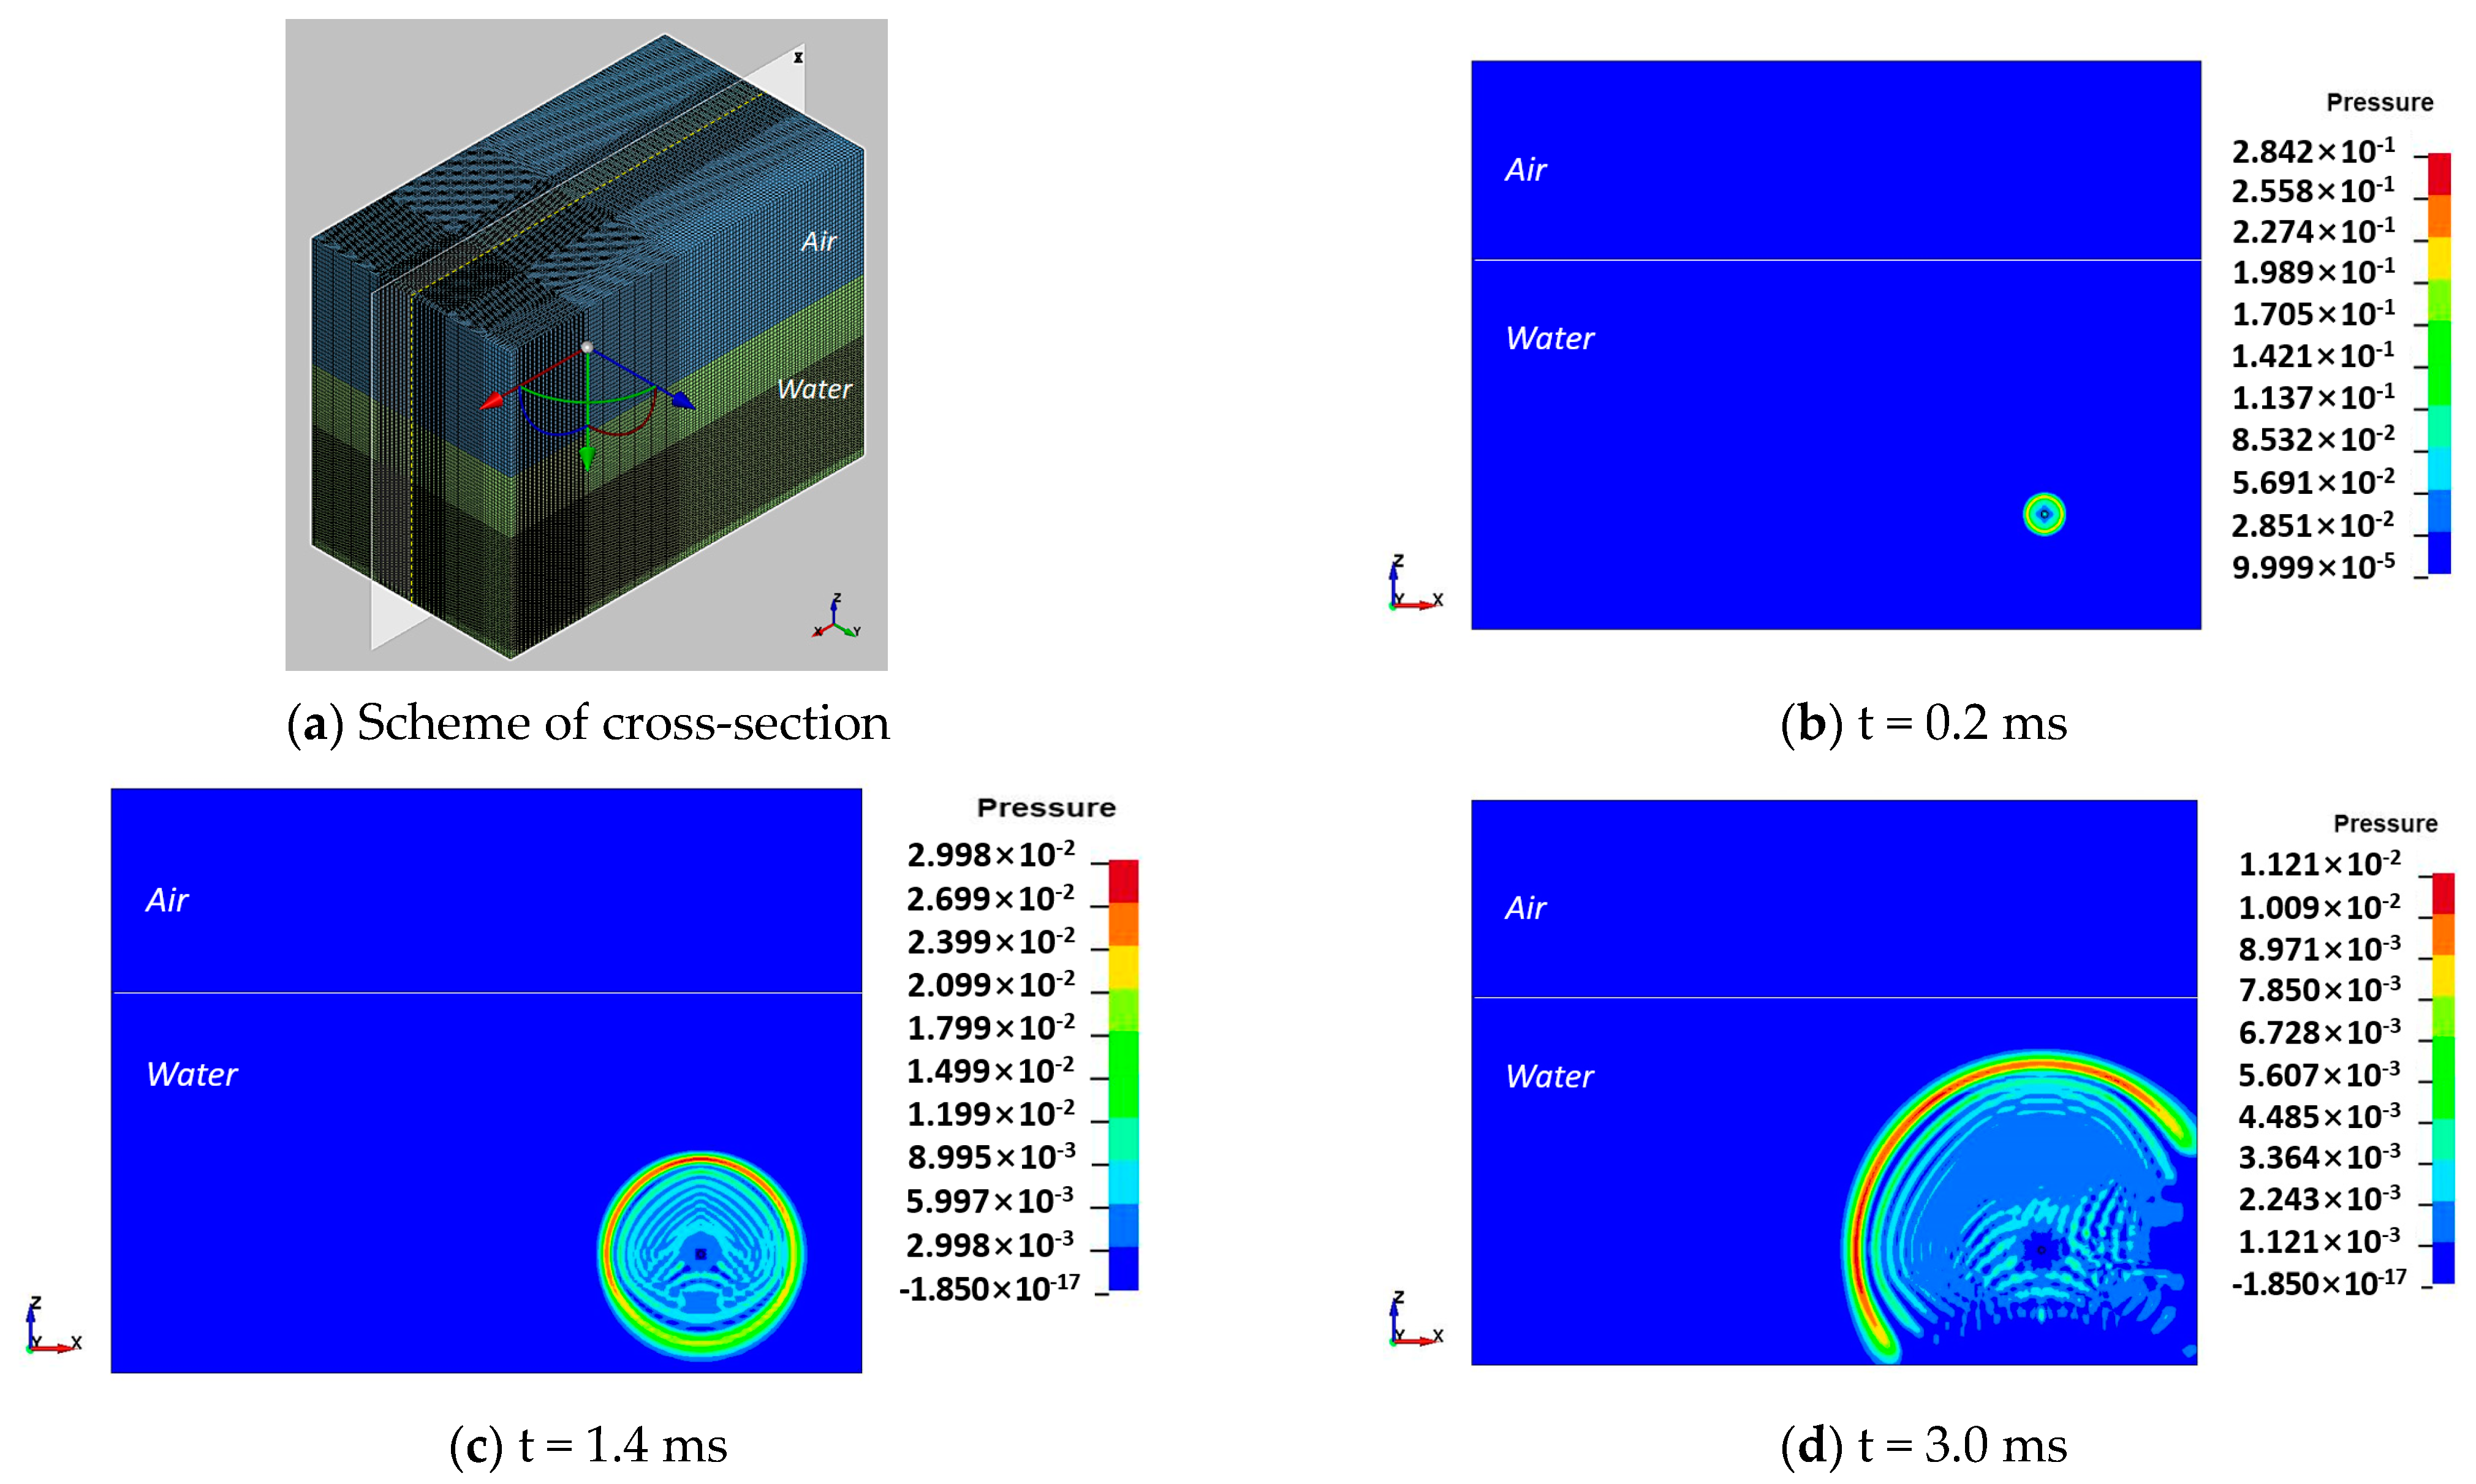
Figure 6 illustrates the propagation contours of the incident pressure waves in the cooling water at different times. The scheme of the cross-section in the fluid model for air and water along the xz planes at the TNT charge center is depicted in Figure 6a. After the TNT detonation in the cooling water, Figure 6b–d demonstrate that spherical incident shock waves initiate and radiate outward from the explosive charge along the x and z axes at different times.
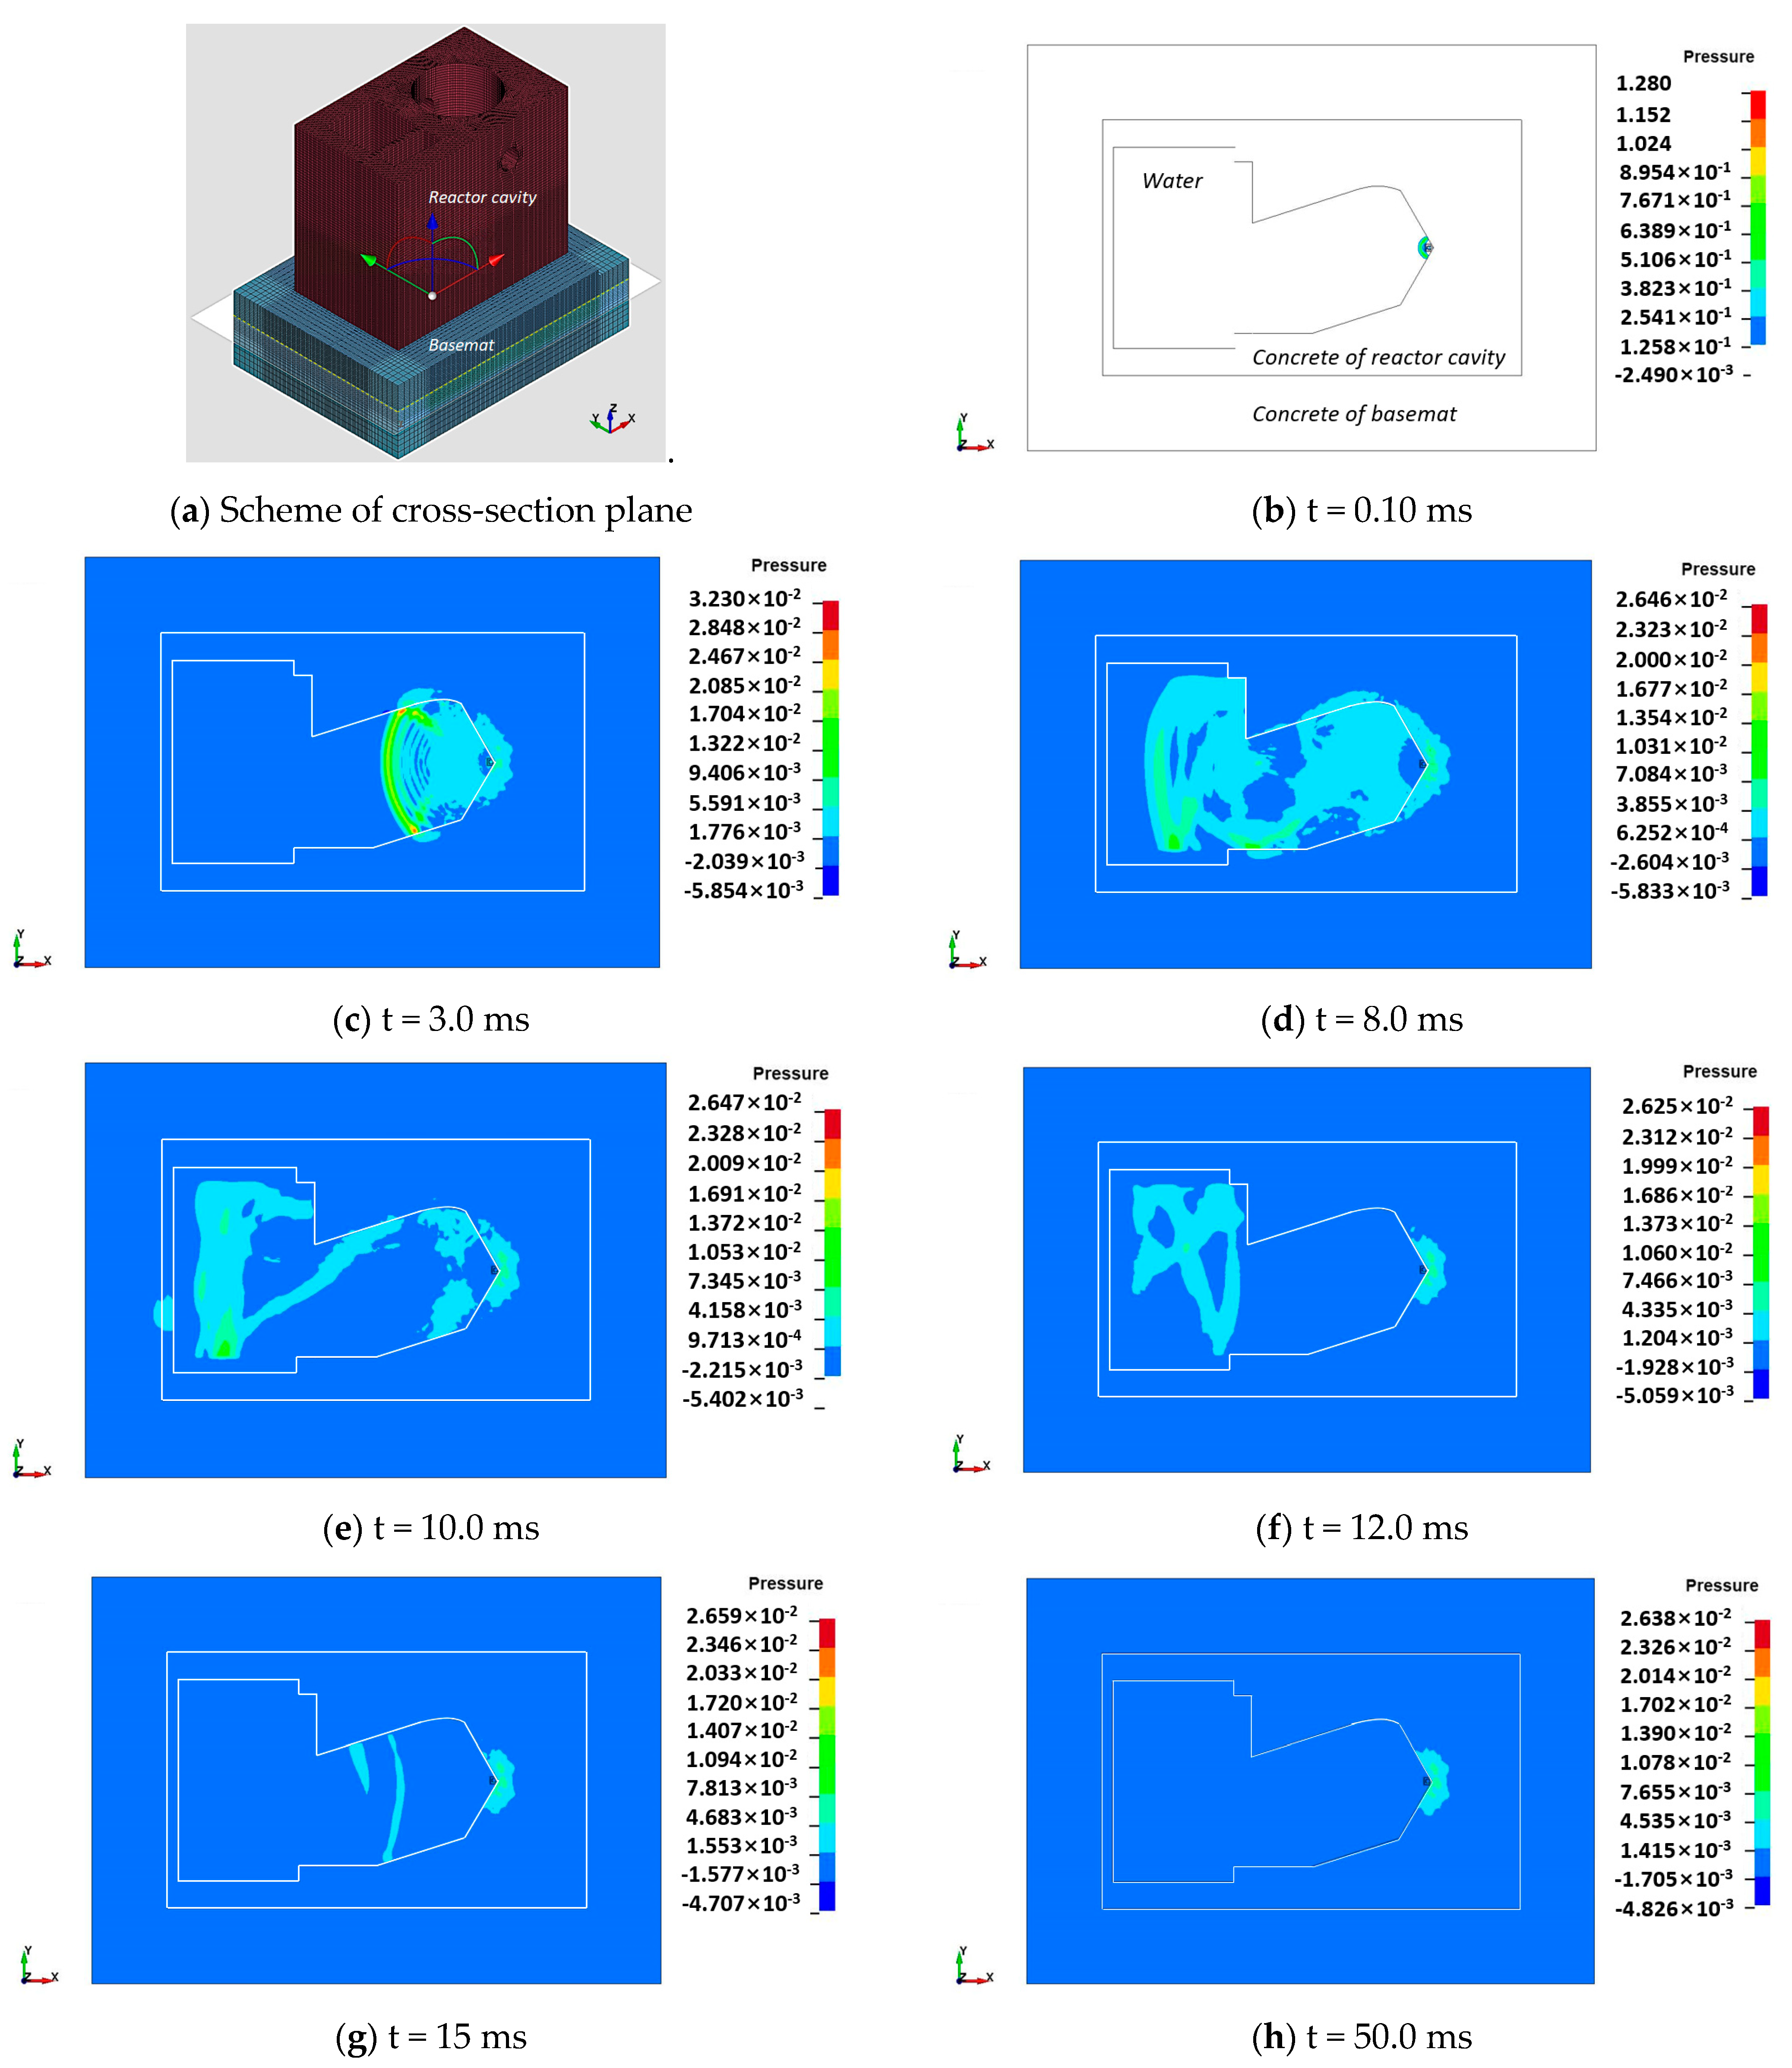
Figure 7 shows the propagation contours of the reflected pressure waves in the reactor cavity at different times. Figure 7a depicts the cross-section of the finite element model for the cooling water and structures, such as the reactor cavity and basemat, in the xy plane, respectively, at the TNT charge center. As shown in Figure 7b, the incident shock waves directly strike the corner of the reactor cavity, and then shock–structure interaction results in the reflected shock waves, which raise the pressure in the vicinity of the explosive charge. Then, the reflected pressure waves in the reactor cavity spread out in a spherical shape from the corner and are reflected multiple times on interfaces between cooling water and side walls with oblique and rectangular configurations (Figure 7c,d). Once the reflected pressure waves reach the interface between cooling water and structures, most of the shock waves are reflected back into the cooling water; however, a small portion is transmitted as compressive waves to structures such as side walls, the bottom slab and the basemat. As shown in Figure 7e, the reflected pressure waves arrive at the left side wall in a rectangular configuration. As seen in Figure 7f, they then reflect back and reflect multiple times on the interface between the cooling water and the side walls. As illustrated in Figure 7f,g, these reflected pressure waves with decreased magnitude propagate toward the corner region during TNT detonation. At an analysis end time of 50.0 ms, as illustrated in Figure 7h, the distribution of the reflected pressures in the cooling water and structures becomes relatively more uniform at the ambient pressure.
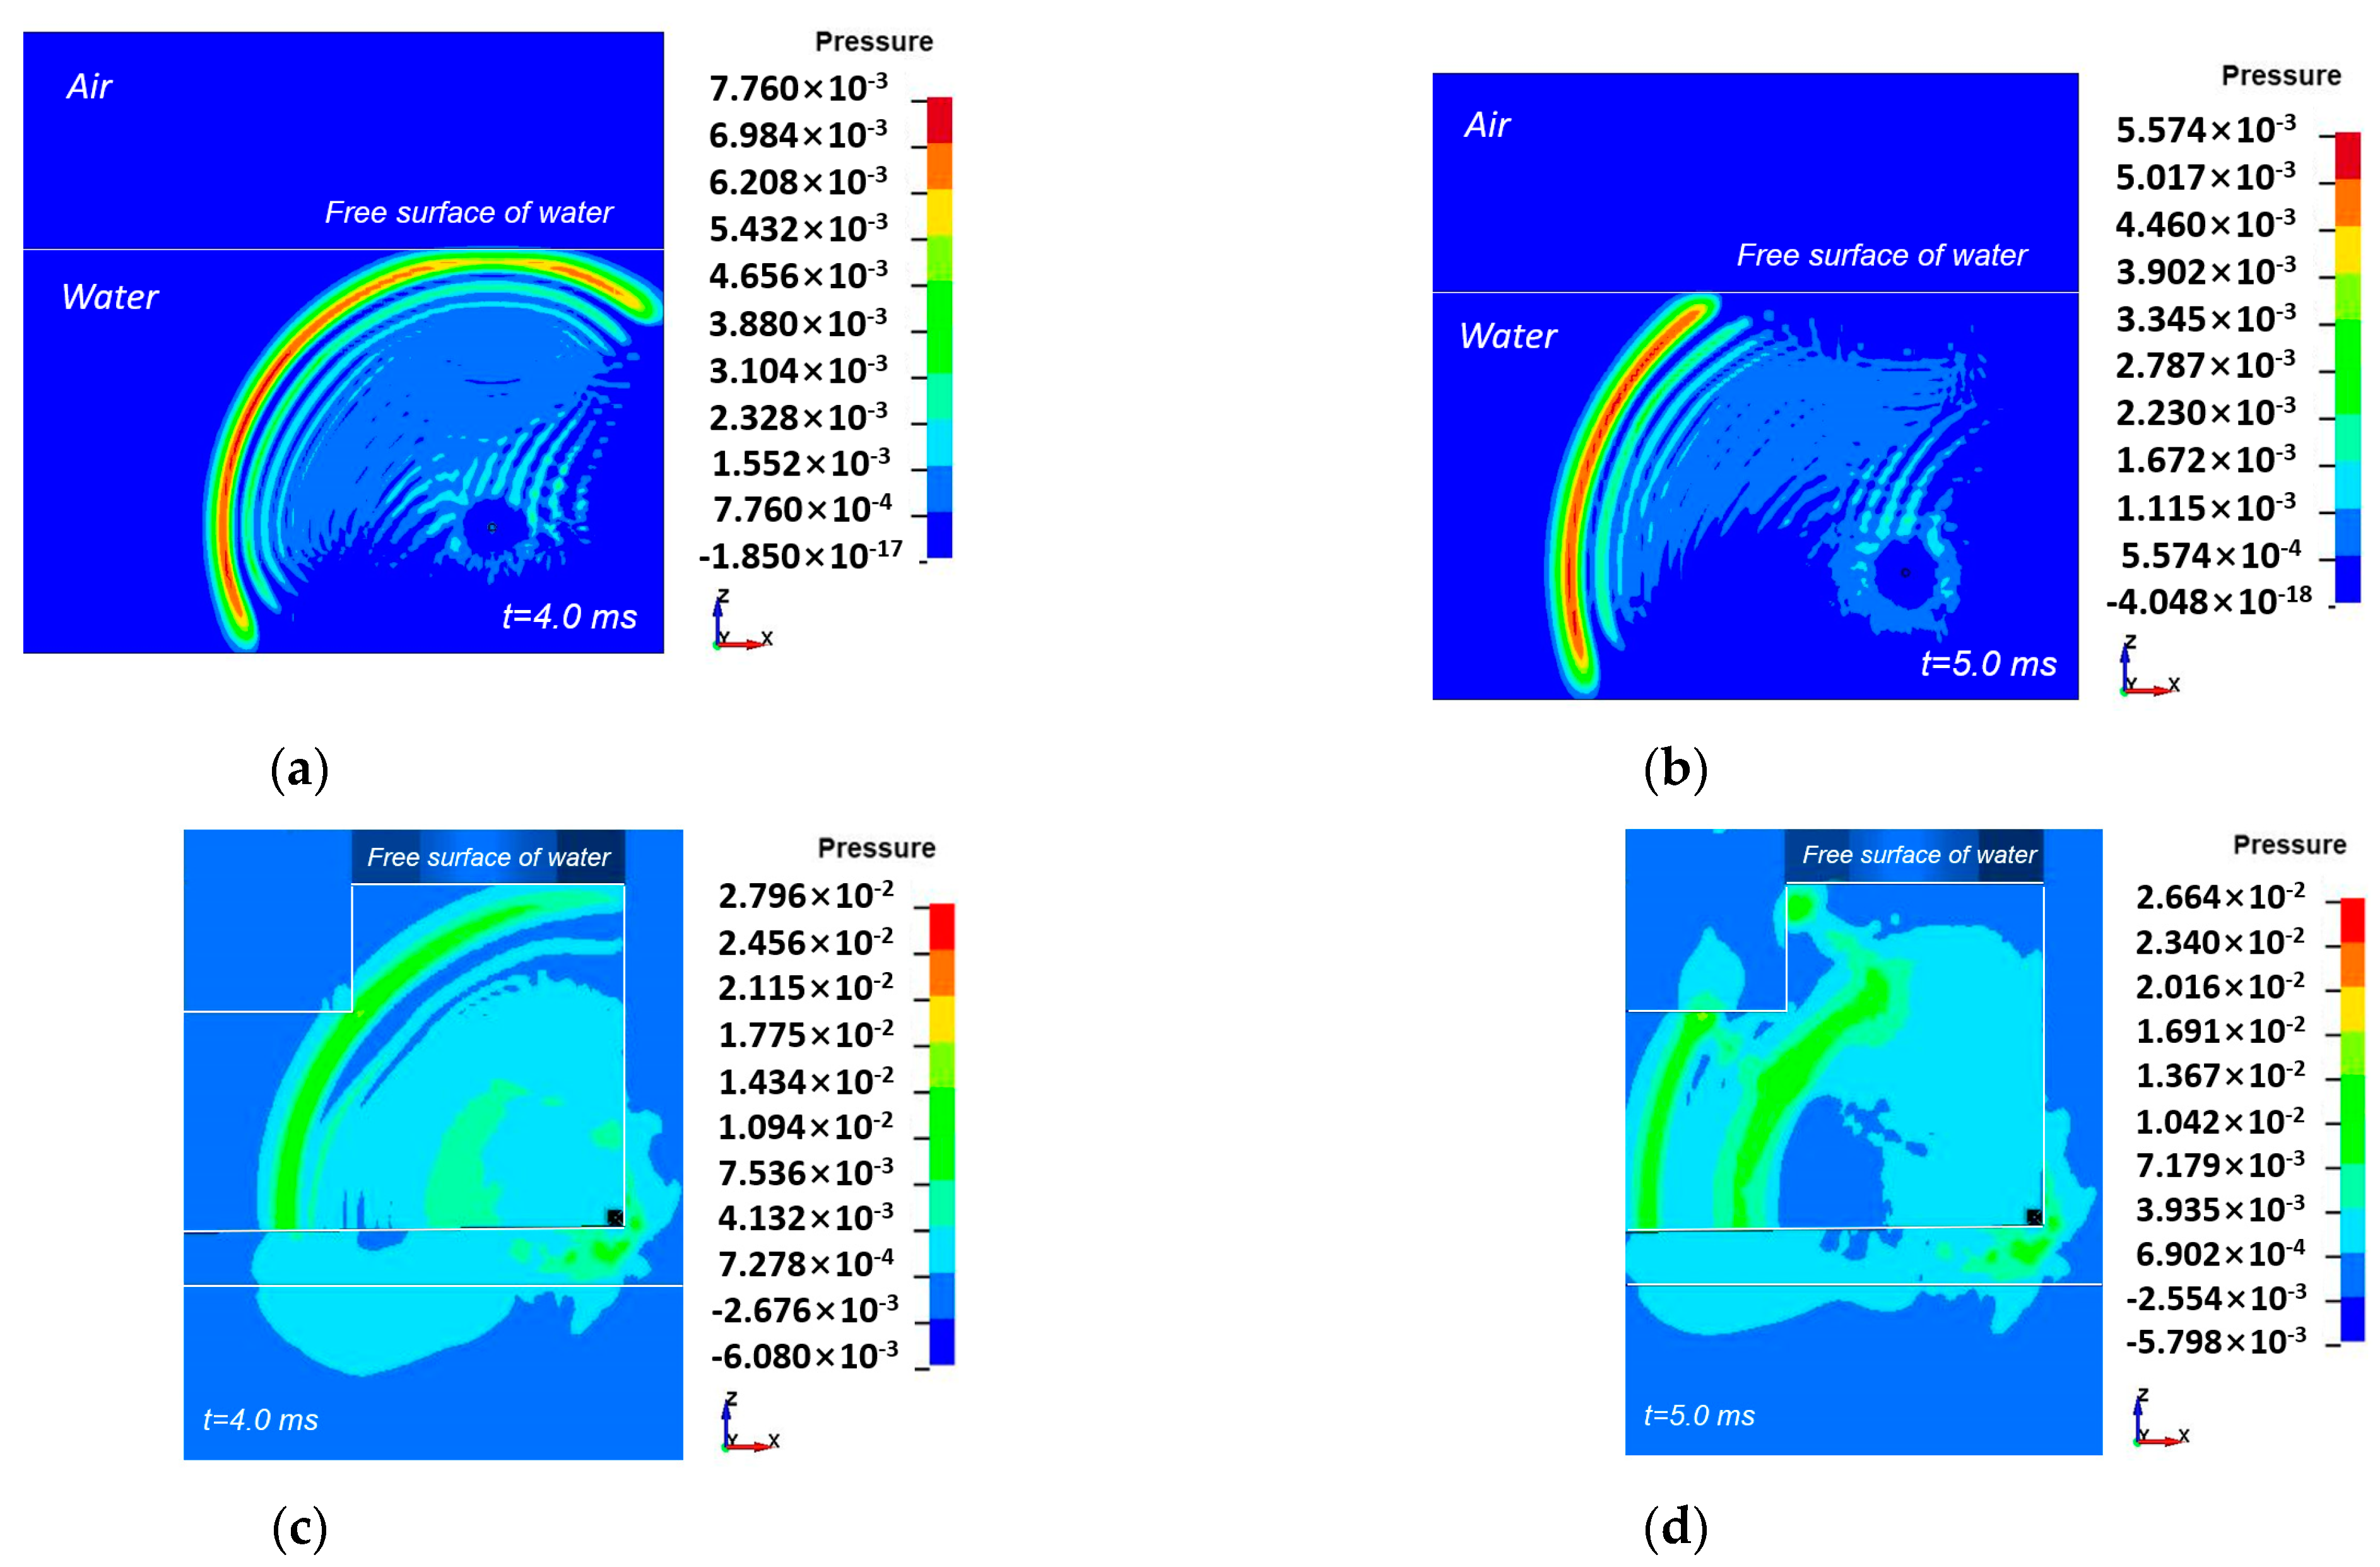
As shown in Figure 8a,c, the incident pressure waves in only cooling water and the reflected pressure waves in the reactor cavity strike the free surface at a duration of 4.0 ms from the TNT charge center to the free water surface along a distance of about 6.4 m, respectively. Then, the compression shock waves reflected off the free surface transform into tensile reflected shock waves due to the substantial difference in acoustic impedance and density between air and water. Therefore, as seen in Figure 8b,d, their pressure on the free water surface rapidly drops and reaches almost zero at 5.0 ms for both cases due to the cavitation surface cutoff effect, in which the rarefaction waves of the incident and reflected pressures propagate through the water–air interface in the opposite direction before their pressures decrease substantially to almost zero, as reported by Wang et al. [38,39].
In particular, the bottom surface of the reactor pressure vessel for the PWR containment building was positioned 0.6 m above the free water surface of the cooling water, with its supporting systems affixed to a mounting component of the reactor cavity. Based on the results, it is evident that the reflected pressure waves during the steam explosion cannot propagate to the reactor pressure vessel through the air above the free water surface. Therefore, the influence of pressure waves on the reactor pressure vessel can be negligible.

3.1.2. Attenuation and Amplification of the Pressure Waves

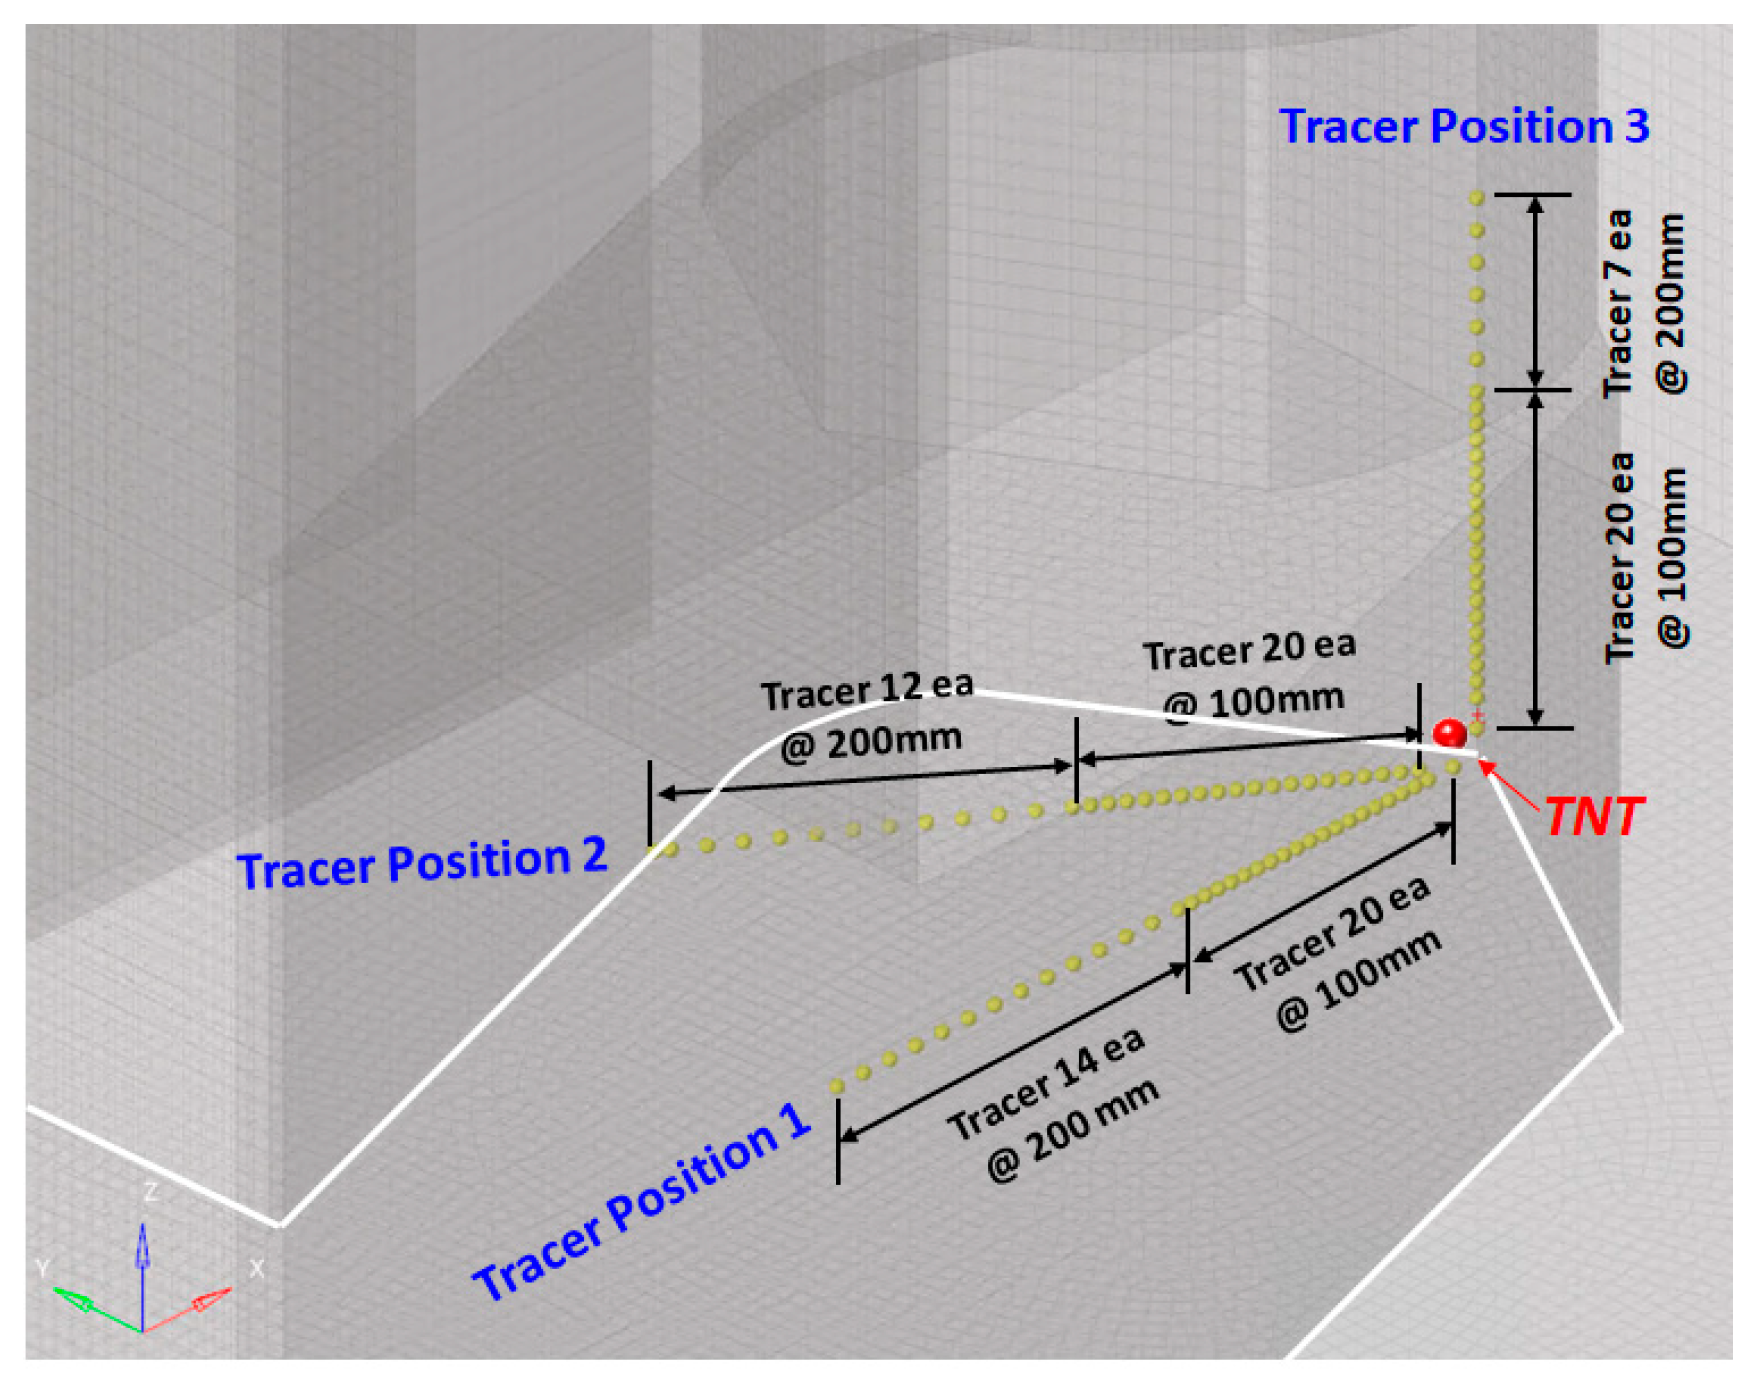
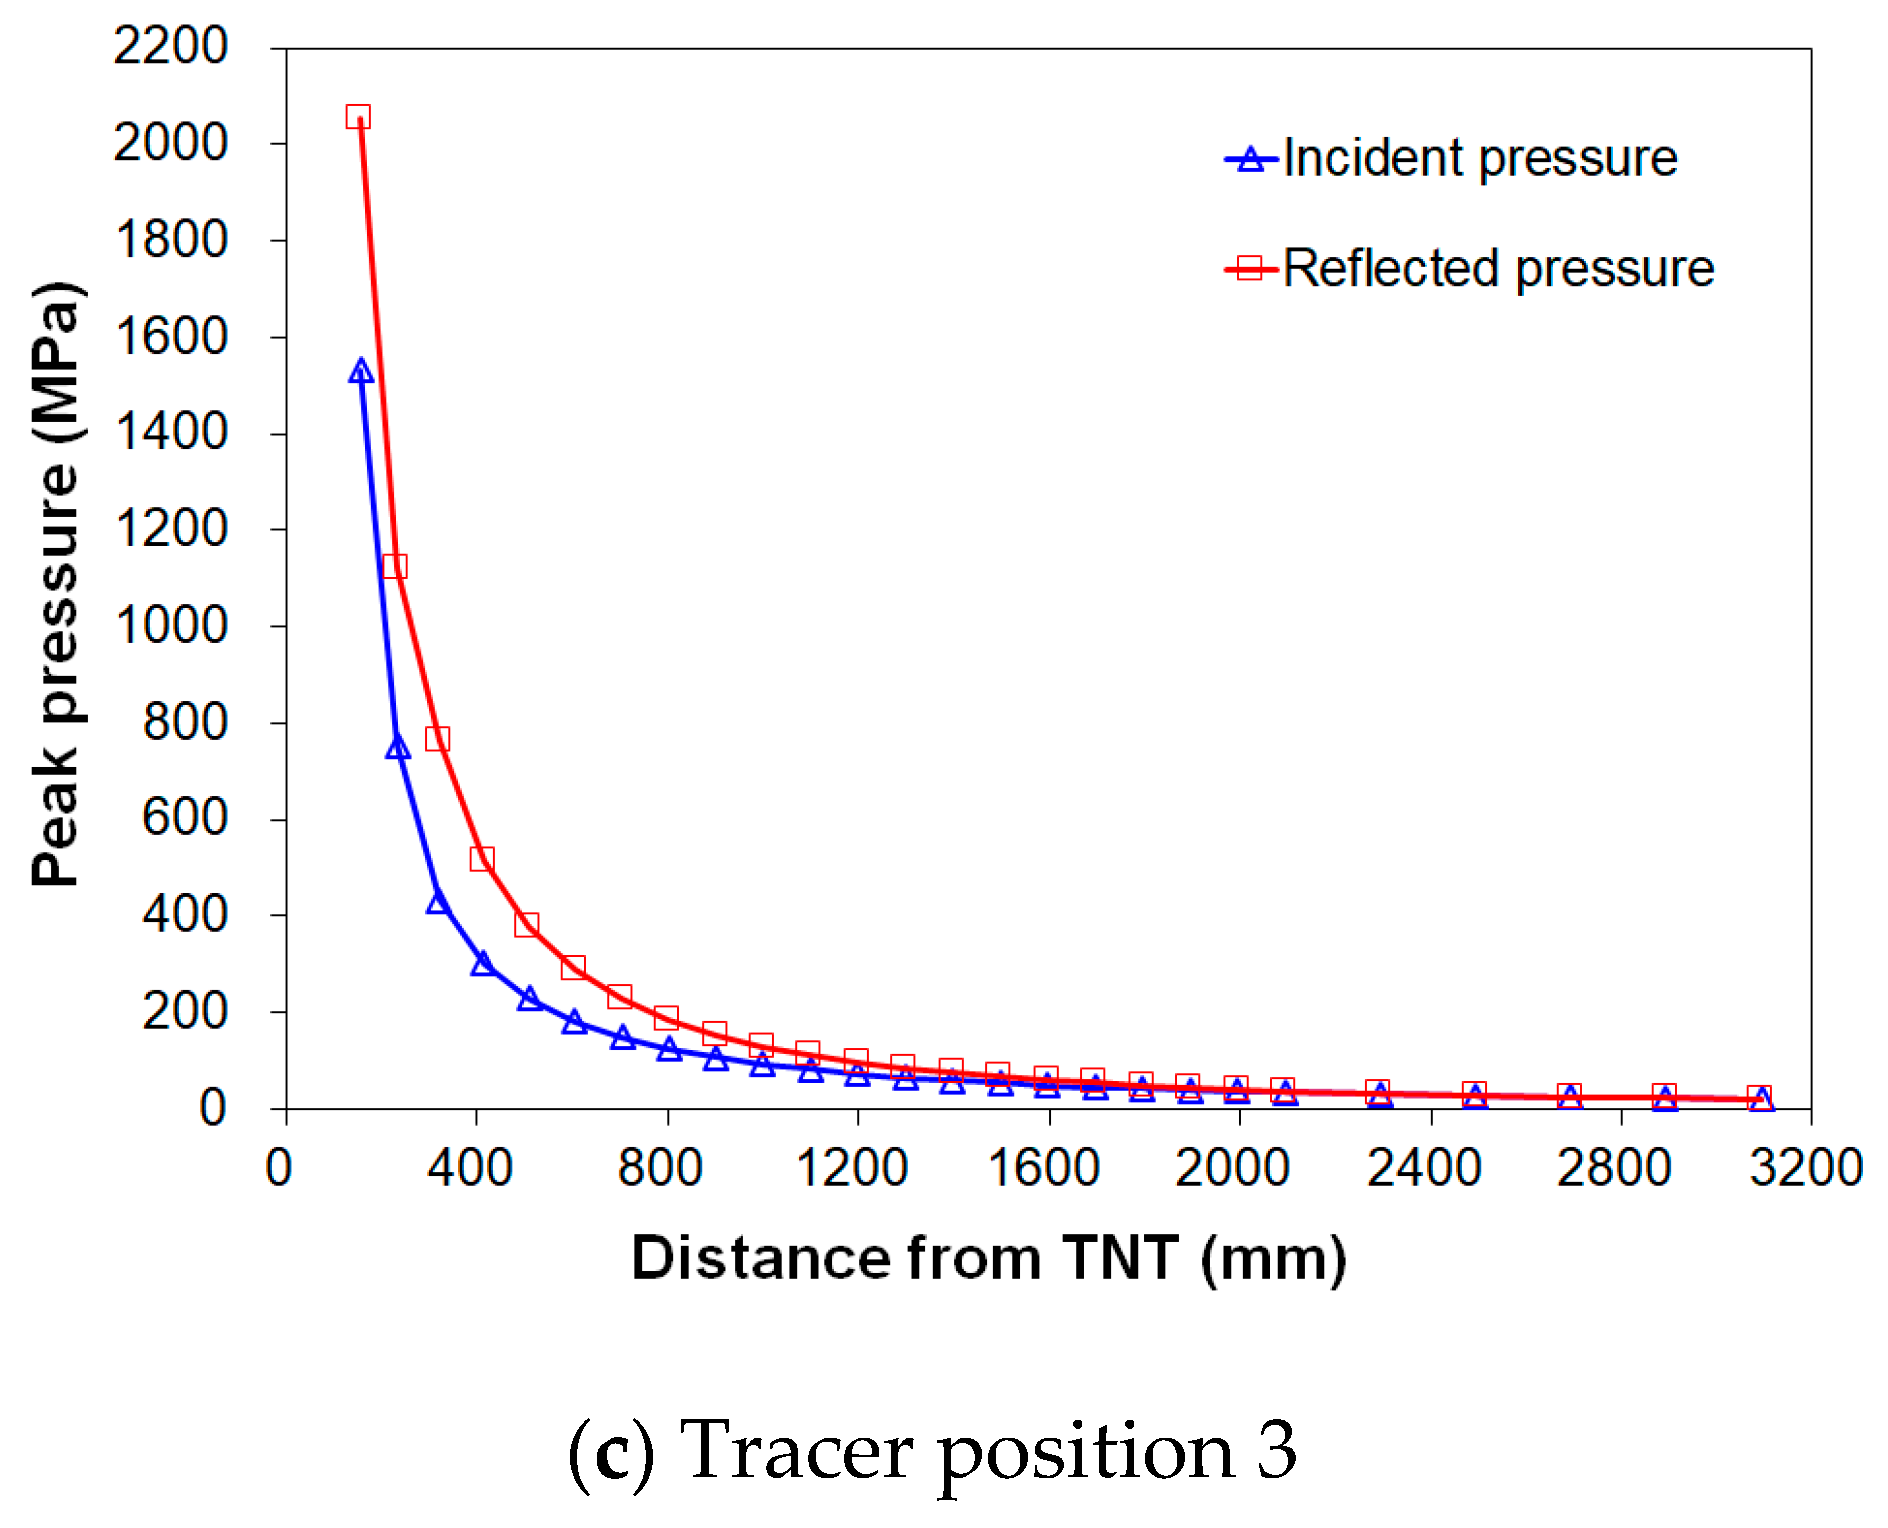
To investigate propagation characteristics such as attenuation and amplification of the pressure waves in the cooling water and the reactor cavity, a number of tracers are placed in the fluid model for the cooling water, as depicted in Figure 9. Tracers in the fluid model are used to record incidents and reflect shock wave pressure time histories. Figure 10 demonstrates that the peak pressures of the incident and reflected shock waves are rapidly attenuated with increasing distance from the TNT charge center for all tracer positions. In particular, the peak pressures of the incident and reflected shock waves are mitigated as a nonlinear function of the stand-off distance from the TNT charge center. As shown in Figure 10, the peak incident pressure is the same at all tracer locations as a 1532 MPa. At both tracer positions 1 and 2, the peak reflected pressure is 1893 MPa, while it is 2055 MPa at tracer position 3. Along the straight path of all tracer positions, the incident pressure attenuation ratios are approximately 95%, 98%, and 99% at stand-off distances of 1.1, 2.1, and 3.1 m, respectively. Similarly, the attenuation ratios of the reflected pressures for all positions of the tracer are approximately 94%, 97%, and 98% at stand-off distances of 1.1, 2.1, and 3.1 m, respectively.
The peak pressures of the incident and reflected shock waves at tracer positions 1, 2, and 3 are compared, as shown in Figure 10, and it is shown that the reflected pressures in the reactor cavity are higher than the incident pressure in water. Incident shock waves strike the surface of the structure and promptly transform into reflected shock waves due to the much different impedance and density of the cooling water compared to concrete structures. Then, original shock waves propagate through their interface, and the combination of the incident and reflected shock waves results in a greater increase than the incident shock waves, as stated by Wang et al. [38,39].
In this study, the reflection coefficient (Cr) is chosen to account for the pressure amplification of the reflected shock waves in comparison to the incident shock waves. The expression for the reflection coefficient, Cr is as follows:
C r = P r ( F S I ) P i ( A L E )
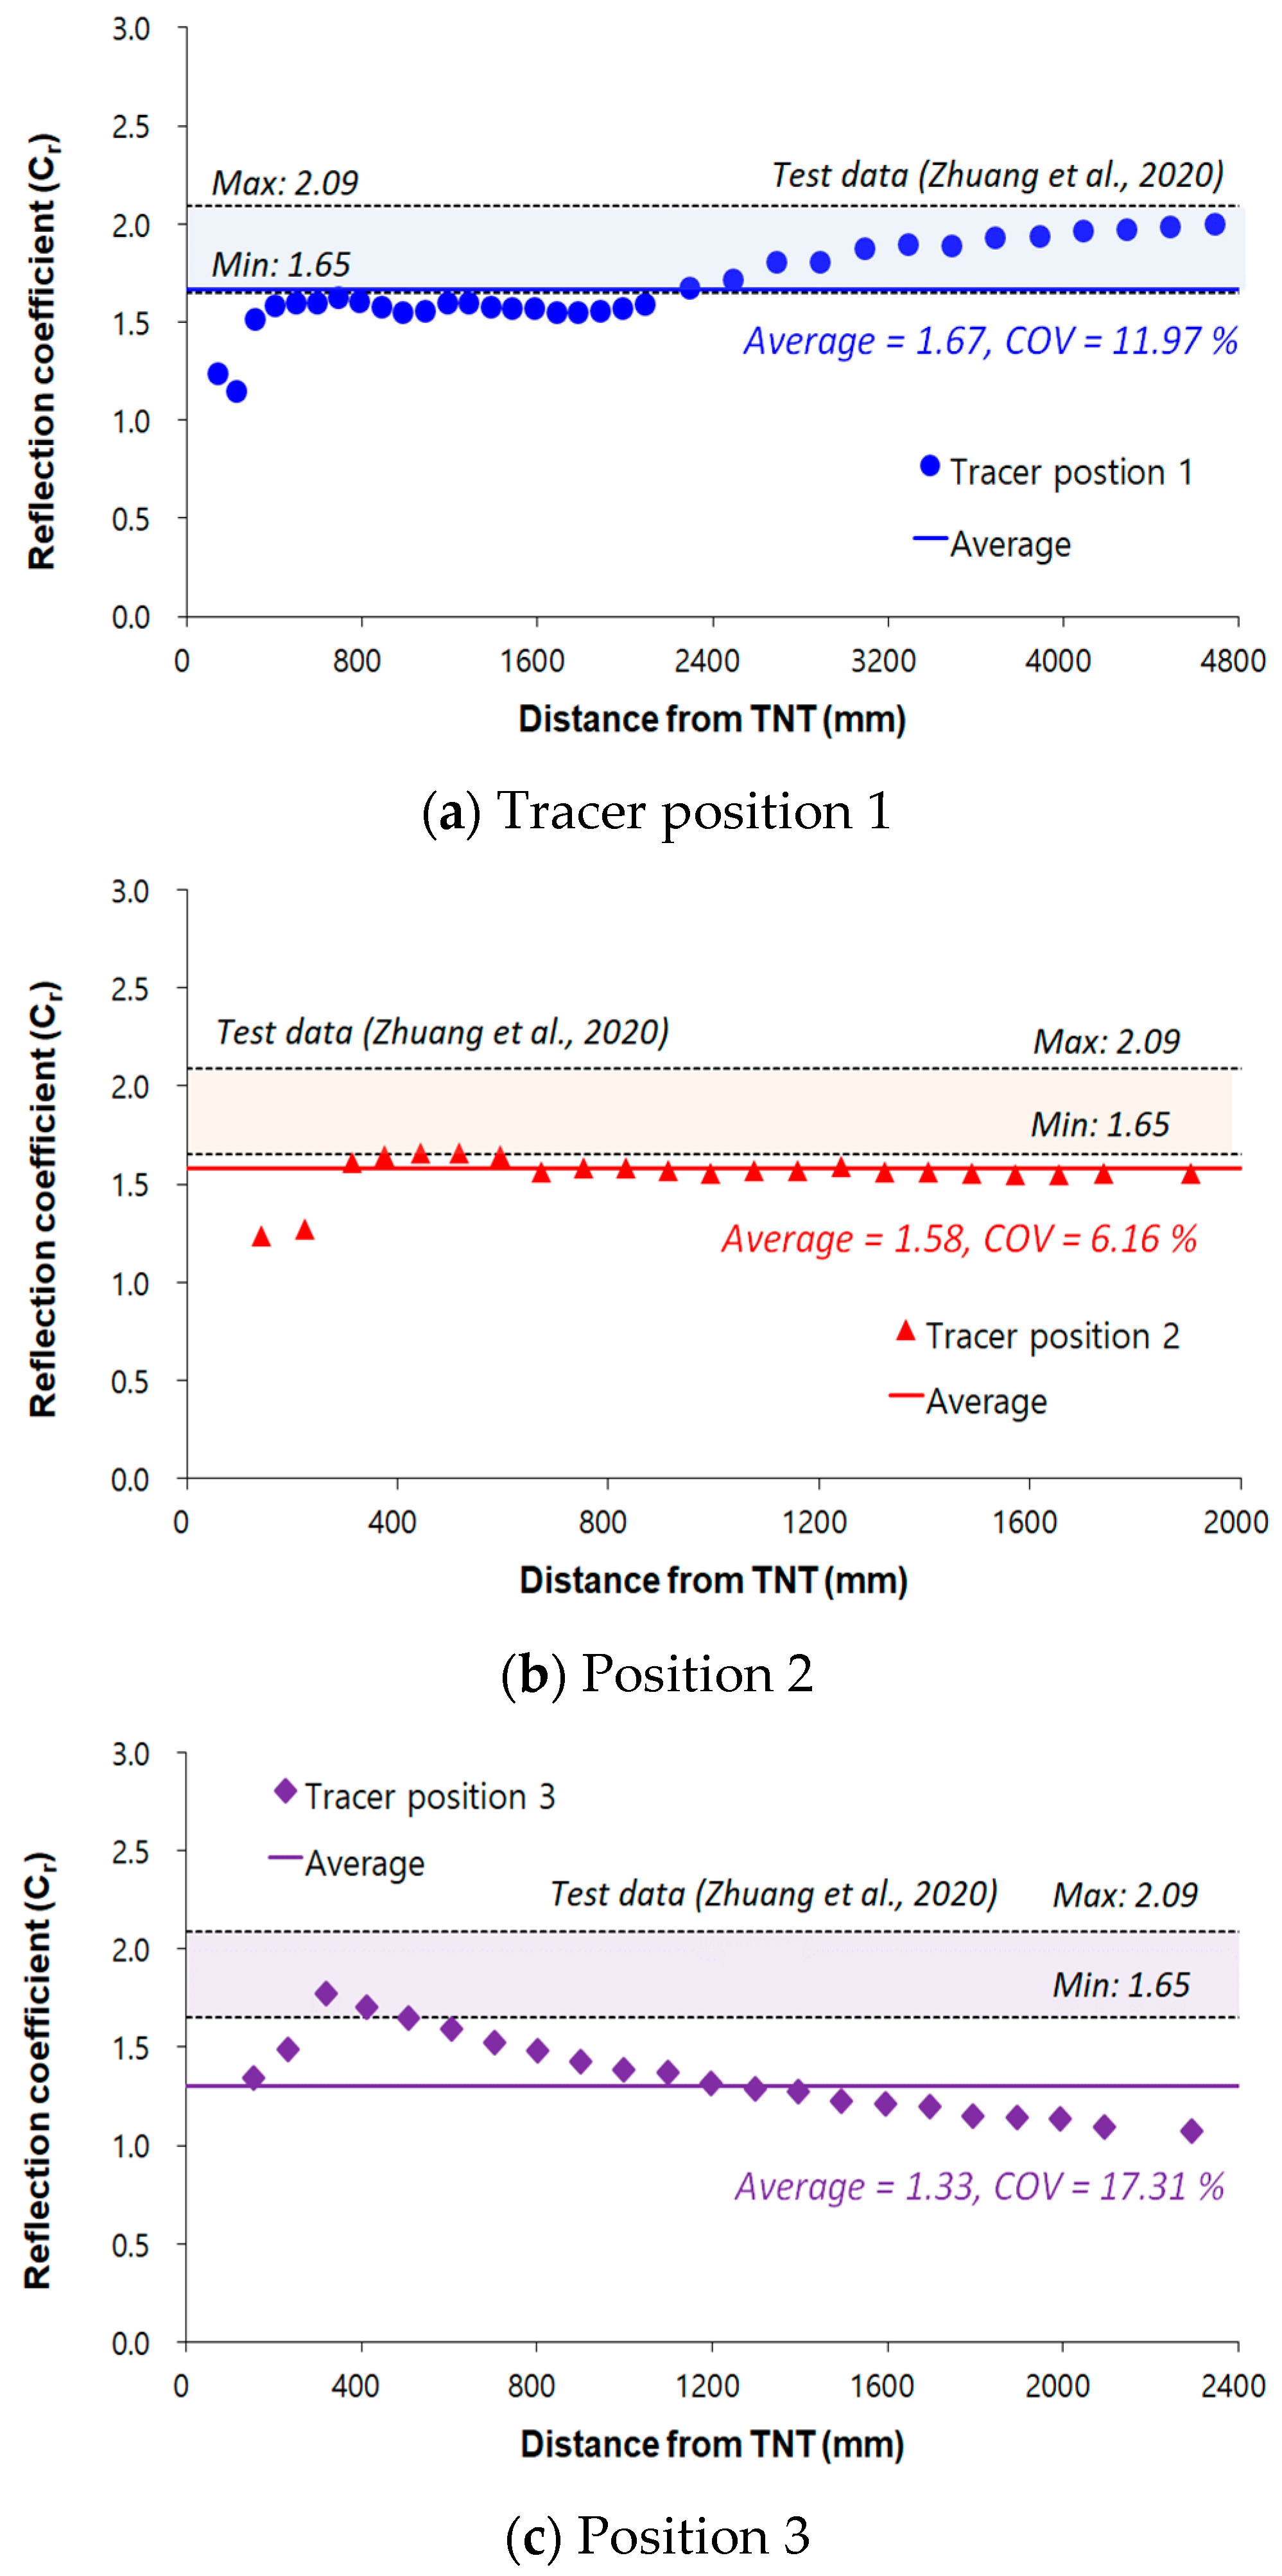
where Pr(FSI) is the peak pressure of the reflected shock waves derived from FSI analysis and Pi(ALE) is the peak pressure of the incident shock waves simulated from ALE analysis, respectively. Figure 11 represents the distribution of the reflection coefficient at tracer positions 1, 2, and 3. Table 3 summarizes the distributions of the reflection coefficient at each tracer position. As shown in Figure 11, the average reflection coefficient (Cr) for tracer positions 1, 2, and 3 is 1.67, 1.58, and 1.30, and its coefficient of variation (COV) is 11.97%, 6.16%, and 17.31%, respectively. The minimum values of the reflection coefficient (Cr) for tracer positions 1, 2, and 3 are 1.14, 1.24, and 0.95, while the maximum values are 1.99, 1.72, and 1.77, as listed in Table 3. As seen in Figure 11, the deviations among the reflection coefficients at three tracer positions range between 6% and 17%. As reported by Wood [40], this is due to local cavitation near the bottom slab’s surfaces during fluid–structure interactions. On the basis of the results, it can be concluded that the reflected pressure in the reactor cavity can be increased by 1.30 to 1.67 times the incident pressure. To evaluate the accuracy of the numerical results, the calculated reflection coefficients are compared to previous experimental data ranging from 1.65 to 2.09 from underwater explosion tests conducted by Zhuang et al. [41]. For tracer position 1 (Figure 11a), the average value of the reflection coefficient is comparable to the minimum value of 1.65 determined from test data by Zhuang et al. [41]. For tracer positions 2 and 3 (Figure 11b,c), the average values of the reflection coefficients are lower than the minimum value of 1.65. It has been discovered that numerical results can be compared to test data [41], so accuracy can be guaranteed.
In prior studies [4,6,7,11], the pressure-time profiles derived from computational fluid dynamics codes (e.g., CFX) or hydrodynamics codes (e.g., TEXAS-V) during the steam explosion were utilized as load conditions in the finite element analysis. According to the previous approach, explosion loads will be overestimated if pressure waves are inadequately attenuated along the stand-off distance from the charge center or underestimated if pressure waves are improperly amplified during the pressure–structure interaction. The propagation characteristics of the pressure waves, such as amplification and attenuation, need to be considered to establish realistic and reasonable load conditions for the finite element analysis.
Nonetheless, there may be some issues in this study that need to be resolved and validated in the future, such as (1) the applicability of the estimate method for an equivalent TNT mass and (2) the correlation between the different time-dependent pressure or impulse profiles of the shock waves derived from steam explosion and TNT detonation due to the different physical phenomena.

3.1.3. Effective Stress Wave Propagation

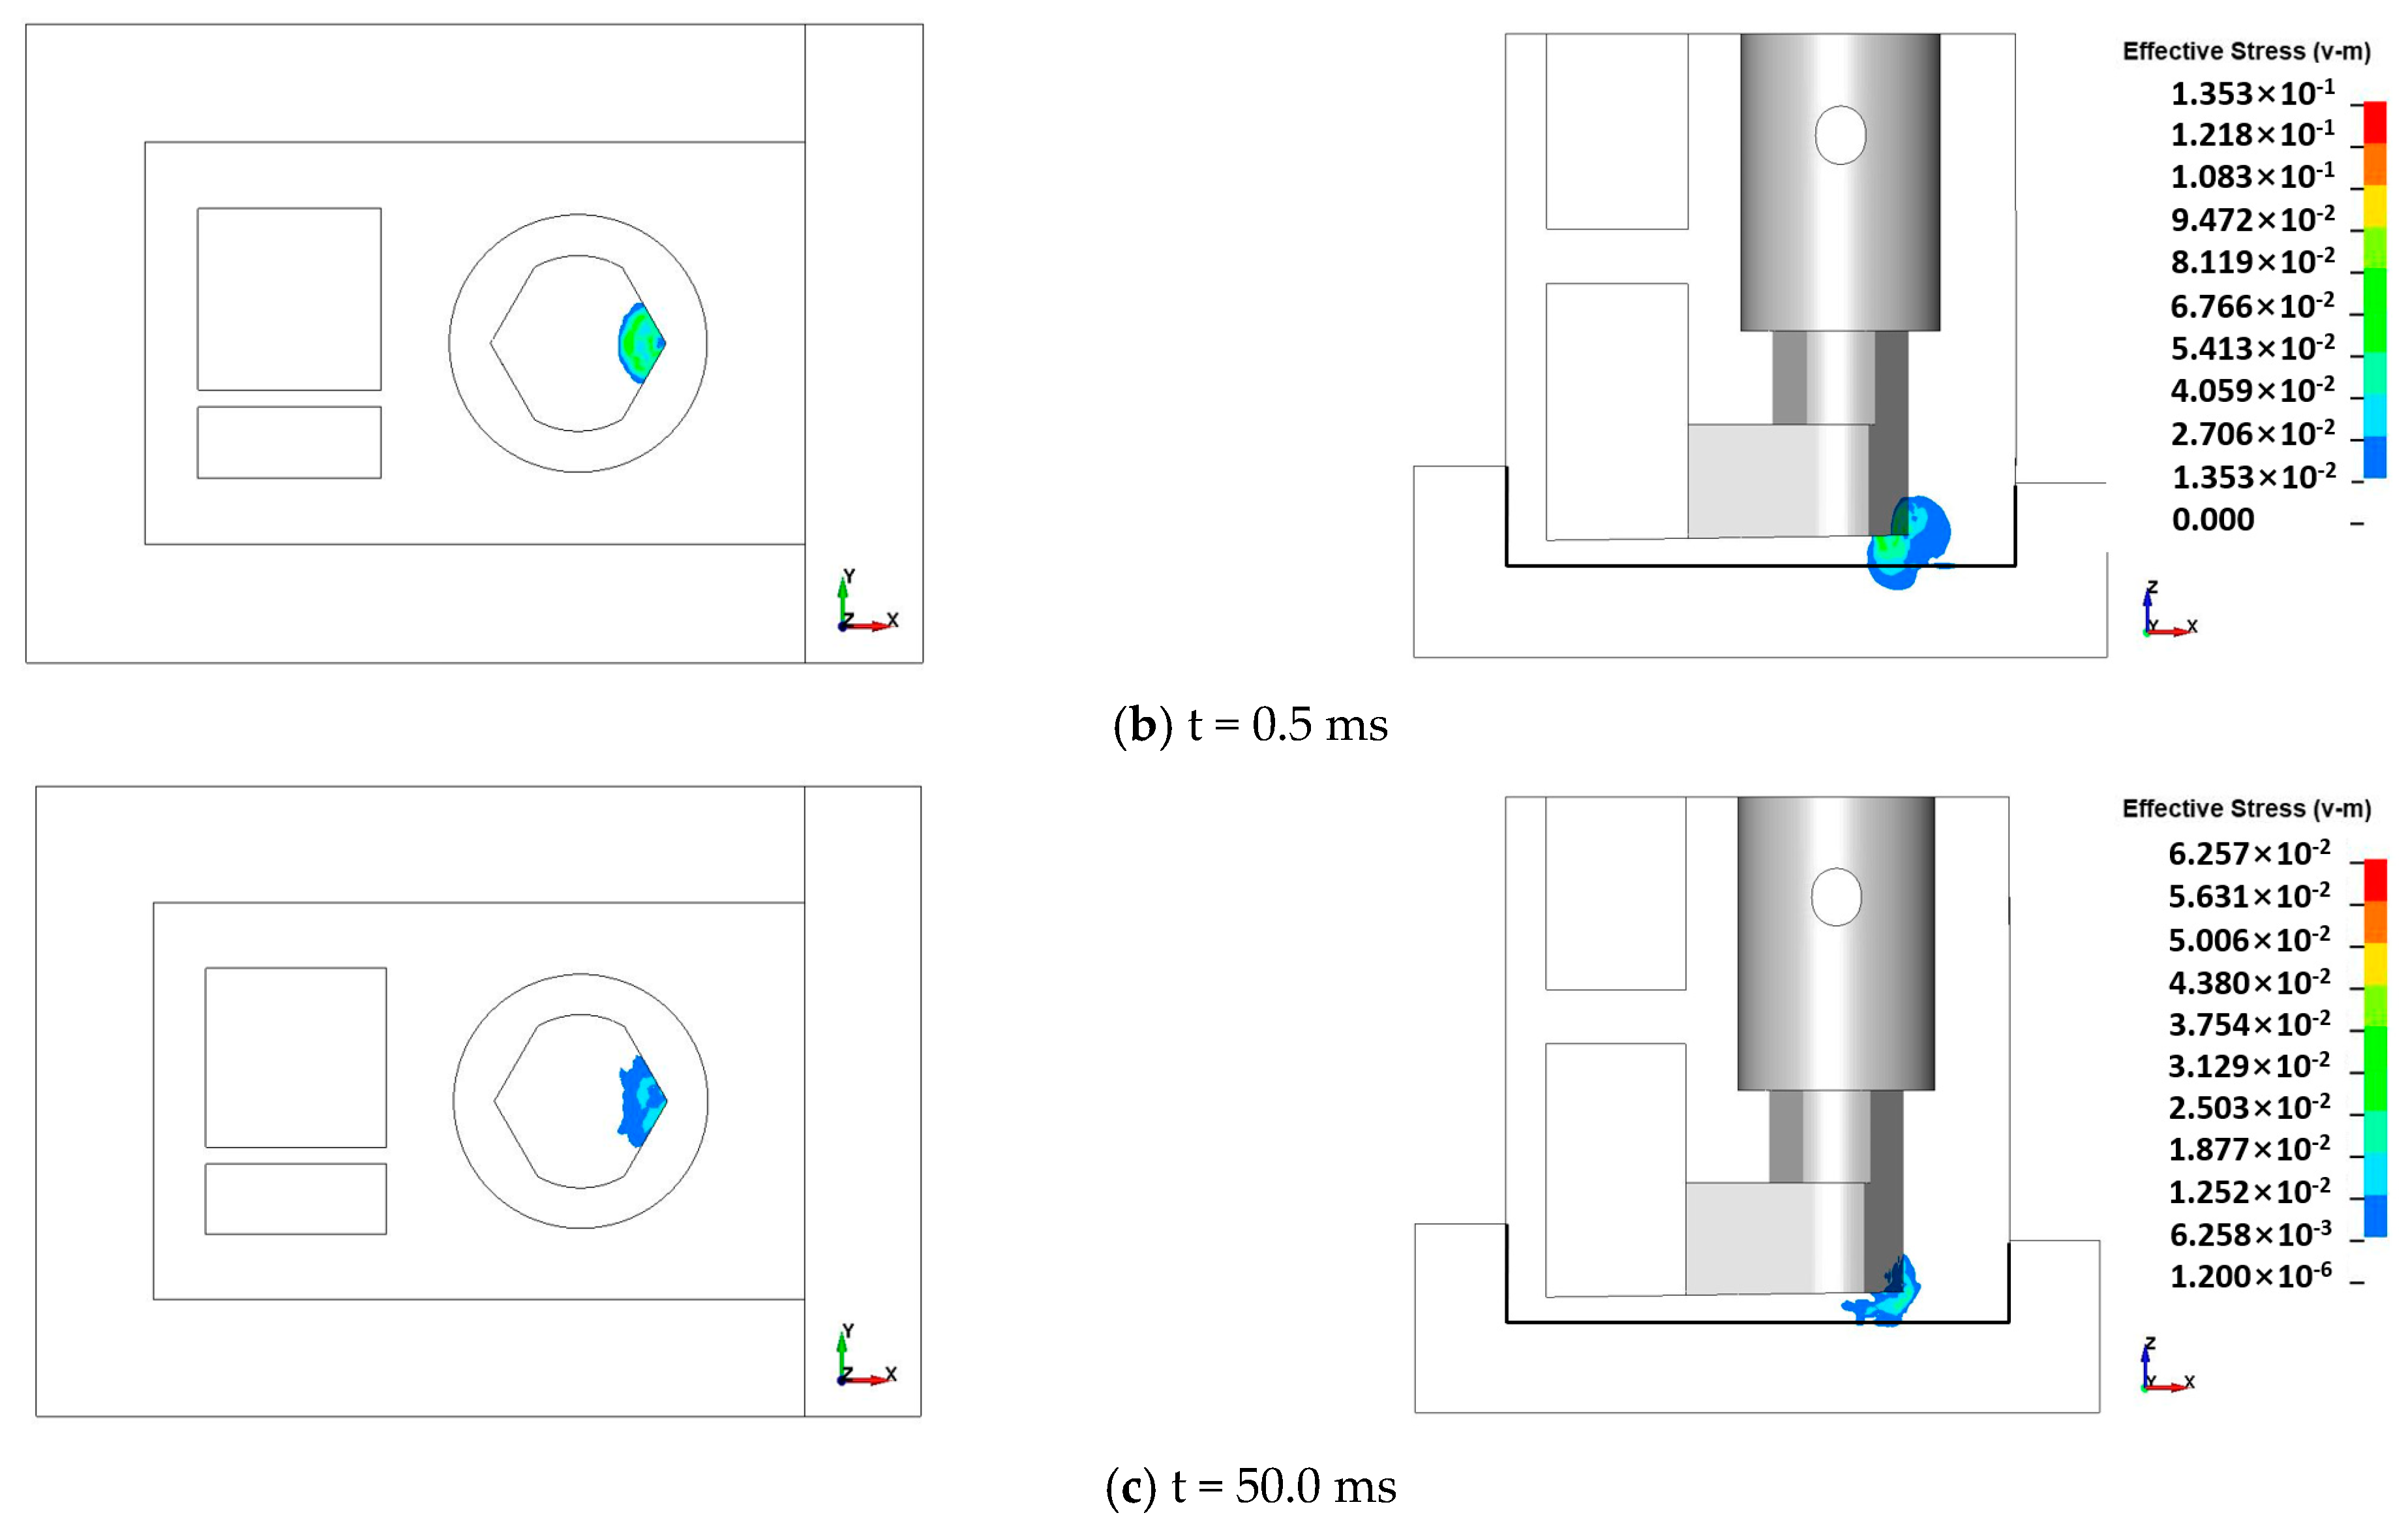
Figure 12 shows the propagation of effective stress waves induced by reflected pressure waves through the concrete of the reactor cavity, the liner plate, and the basemat. As depicted in Figure 12a and Figure 13a, the effective stress waves begin near the corner at 0.1 ms, where the maximum value of the concrete in the reactor cavity is 289 MPa. As shown in Figure 12b,c, effective stress waves propagate through the liner plate and the concrete in the basemat as compressive waves, corresponding to the propagation of the reflected pressure waves in Figure 7. As shown in Figure 13a, the maximum effective stresses of the liner plate and concrete in the basemat at 0.5 ms are 135.0 MPa and 38.1 MPa, respectively. As seen in Figure 12c and Figure 13b, the effective stress waves are relatively uniform near the corner region, where the magnitudes of the residual stresses at 50.0 ms are approximately 62.6, 43.31, and 8.7 MPa for the concrete in the reactor cavity, the liner plate, and the basemat, respectively. The propagation characteristics of the effective stress waves in the reactor cavity and basemat are comparable to the propagation patterns of the reflected pressure waves caused by the detonation of TNT, as illustrated in Figure 7. It is also evident that the internal stress waves induced by external pressure waves propagate through the materials, such as concrete, reinforcements, and liner plates, and their magnitude changes due to their attenuation, which corresponds to the IAEA report [12]. In conclusion, the effective stress waves induced by the reflected pressure waves propagate as compressive waves through the concrete and liner plate of the reactor cavity, as well as the concrete in the basemat, and their magnitude changes due to attenuation. It seems that the propagation pattern of the effective stress waves is constrained within the reactor cavity and basemat. Therefore, effective stress waves acting on components or structures adjacent to the reactor cavity and the basemat will be negligible.

3.2. Damage Assessments

In this study, a systematic structural analysis process is used to assess the potential damage to the materials and structural integrity of the reactor cavity. Damages to the materials are evaluated based on strain levels using concrete, liner plate, and reinforcement failure criteria. On the basis of the results of damage evaluation, the structural integrity of the reactor cavity is assessed.

3.2.1. Damage Assessment of the Concrete

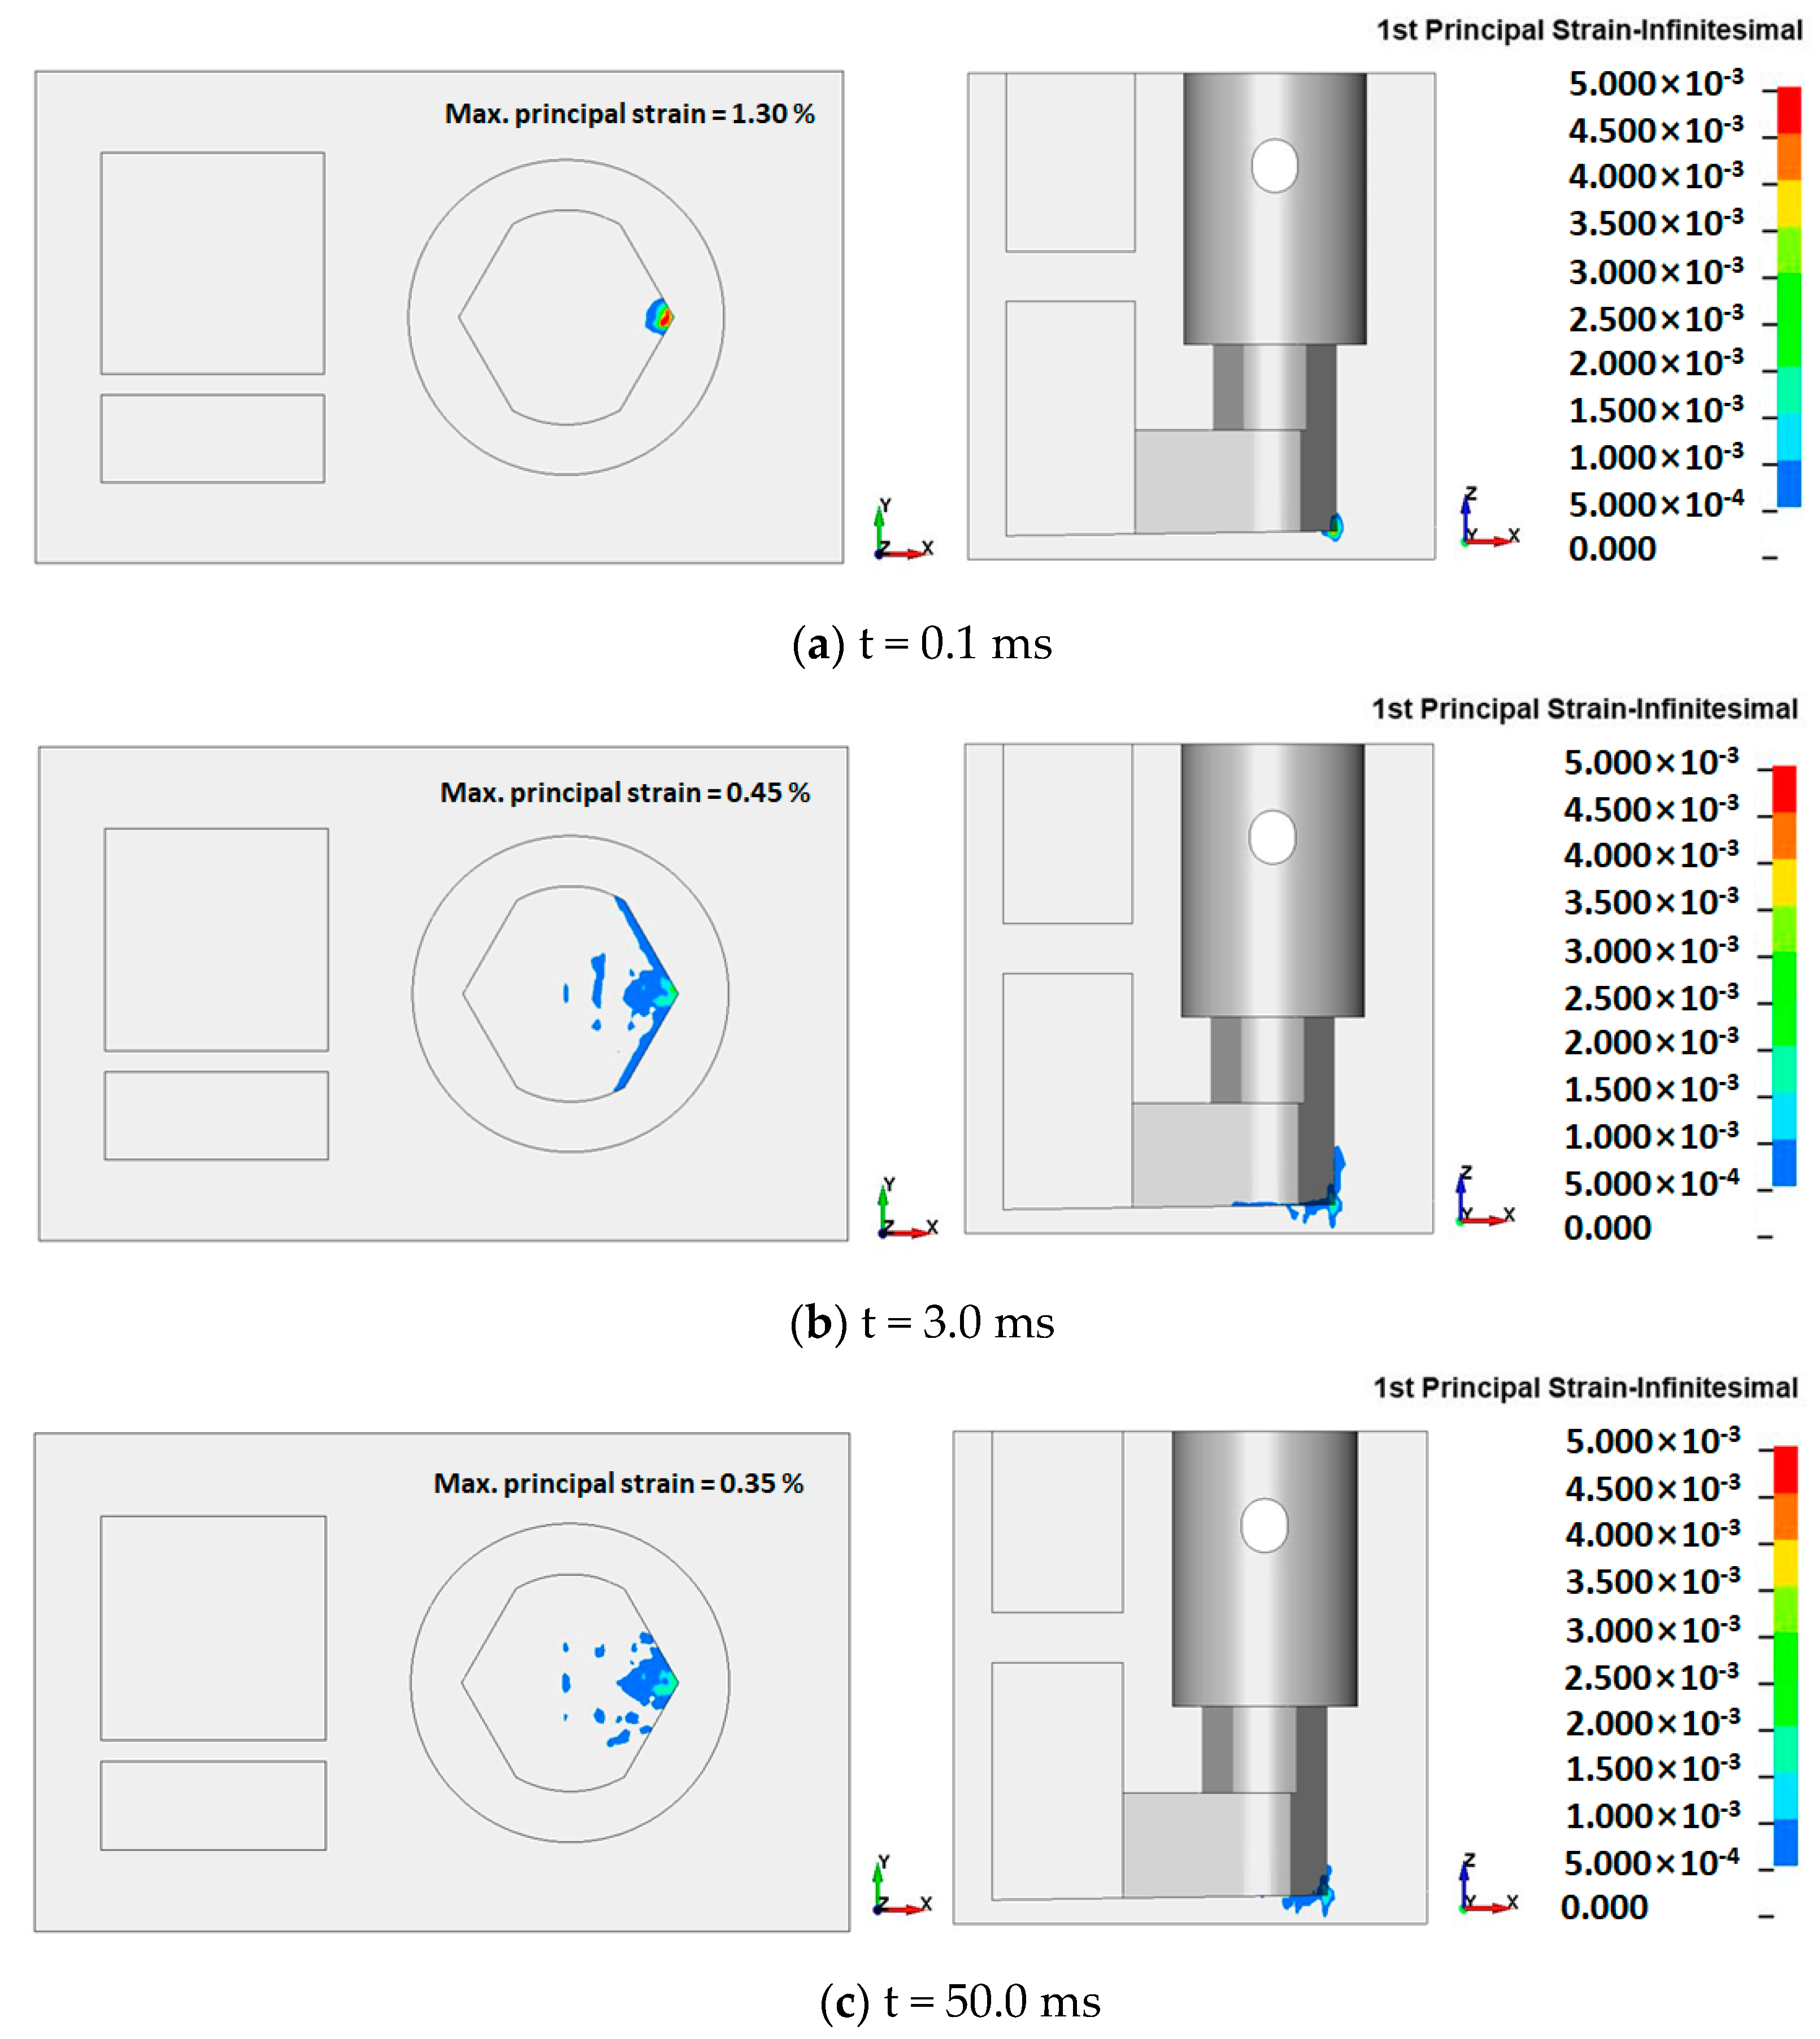
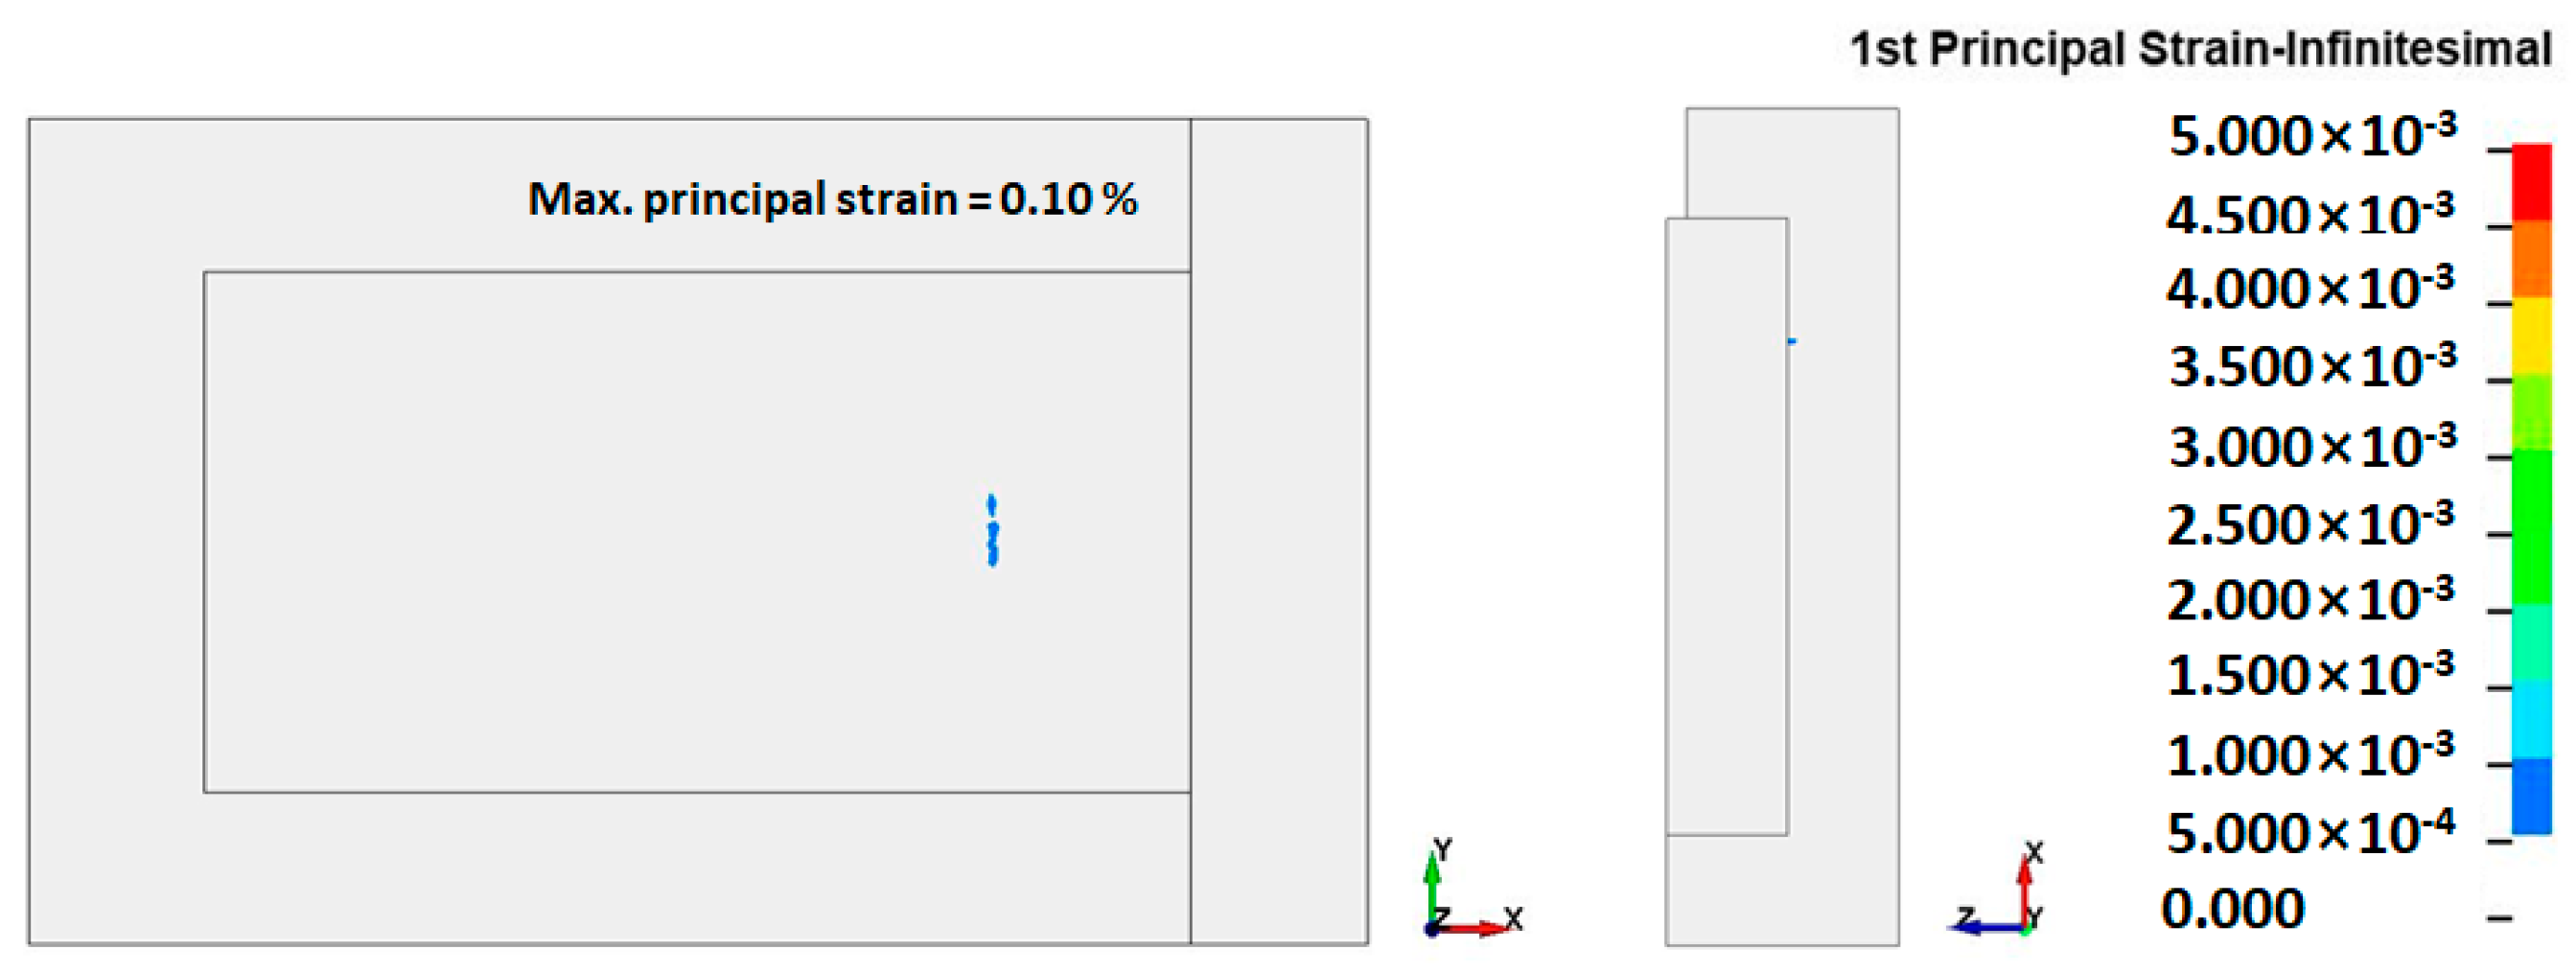
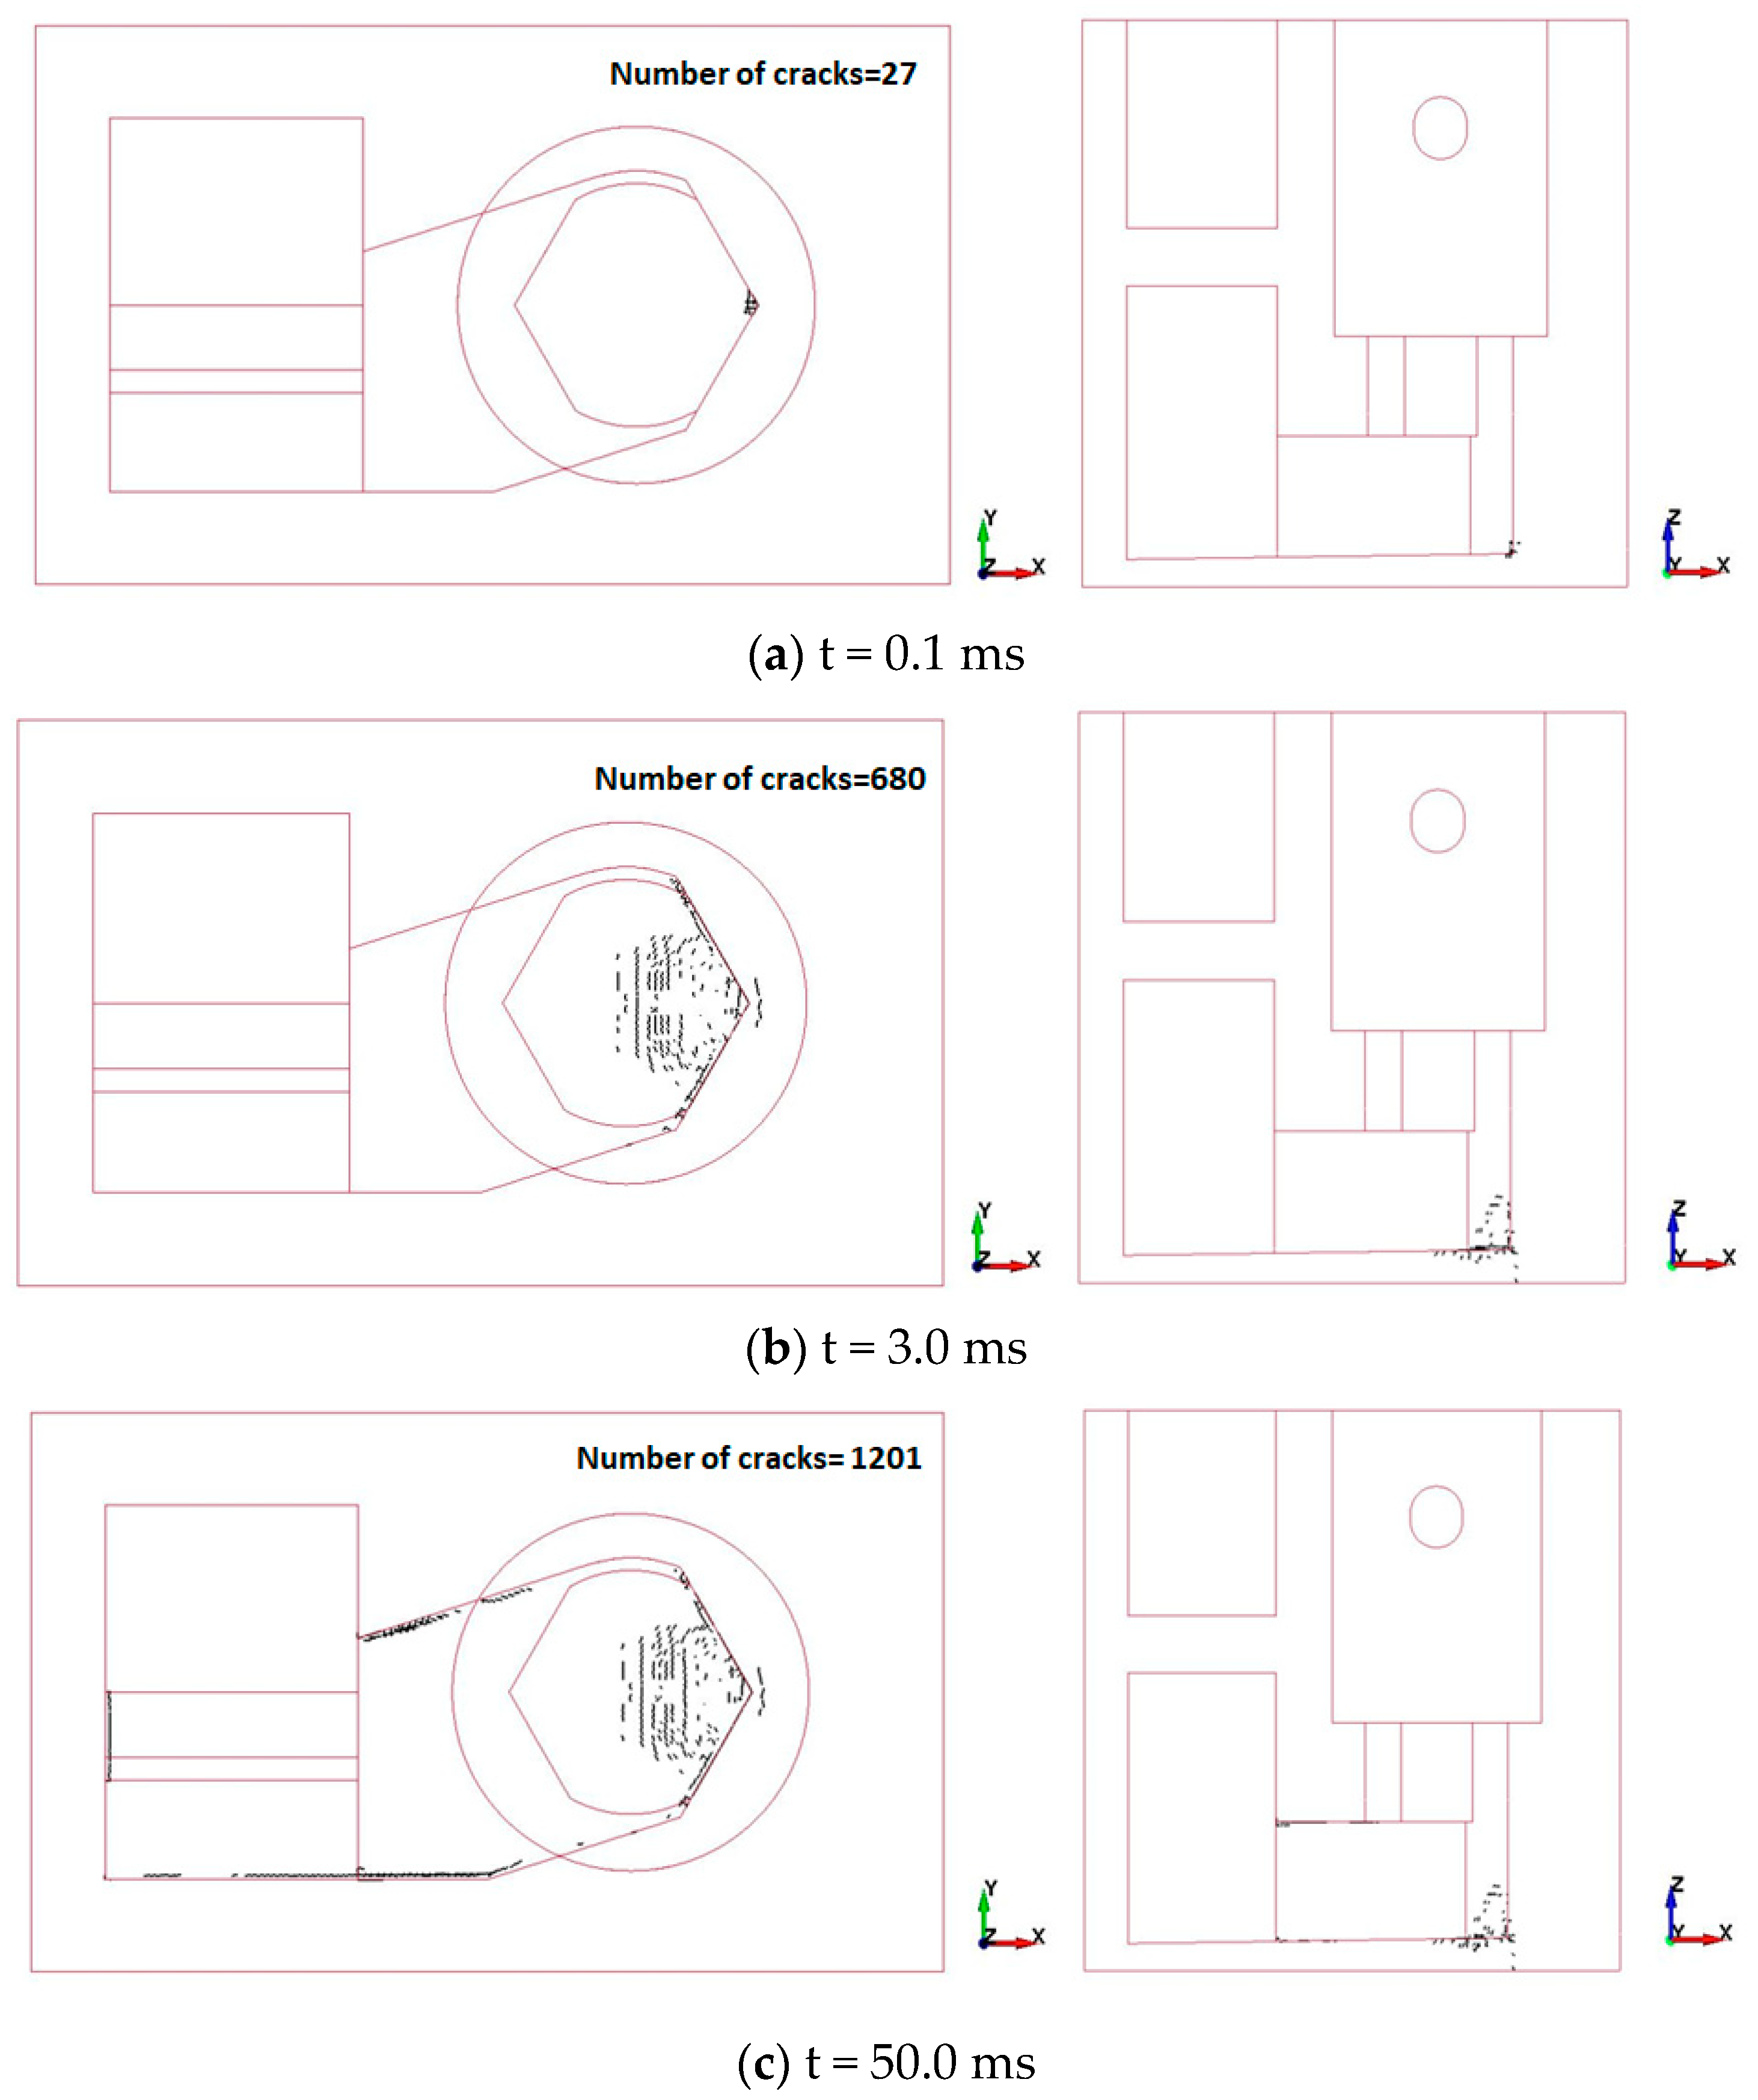
In accordance with the IAEA technical report [12], concrete is presumed to fail when the maximum principal strain in compression exceeds 0.5%. Figure 14 and Figure 15 depict the principal strain distributions of the concrete in the reactor cavity and basemat at different times, respectively. As shown in Figure 14a, the maximum principal strain of the concrete near a corner is predicted to be 1.30% when the effective stress waves in the vicinity of the TNT charge begin spreading at 0.1 ms. Localized concrete damage, referred to as a spall, is observed at a corner of the reactor cavity at this time step since the induced maximum principal strain exceeds the failure criteria of 0.5%. As seen in Figure 14b,c, the principal strains of the concrete are distributed on an upper zone of the bottom slab and oblique side walls at different times, with their maximum values being 0.45% and 0.35% at 3 ms and 50.0 ms, respectively. After 3.0 ms and until the end of the analysis at 50.0 ms, no spall of the concrete in the reactor cavity is observed. In conclusion, it is evident from the numerical results that localized concrete damage to the reactor cavity is anticipated at an early analysis time (less than 3.0 ms); however, the risk of damage to concrete resulting in the collapse of the reactor cavity is relatively low during the analysis time. In addition, as depicted in Figure 15, the concrete’s principal strain of the basemat begins in a localized upper region at 0.8 ms; however, its value decreases from 0.10% at 0.8 ms (Figure 15) to 0.03% at 50.0 ms. Aside from that, it is also clear that the risk of damage to the basemat is very low, as the maximum principal strain of the concrete (0.1%) is considerably less than the 0.5% failure criteria.
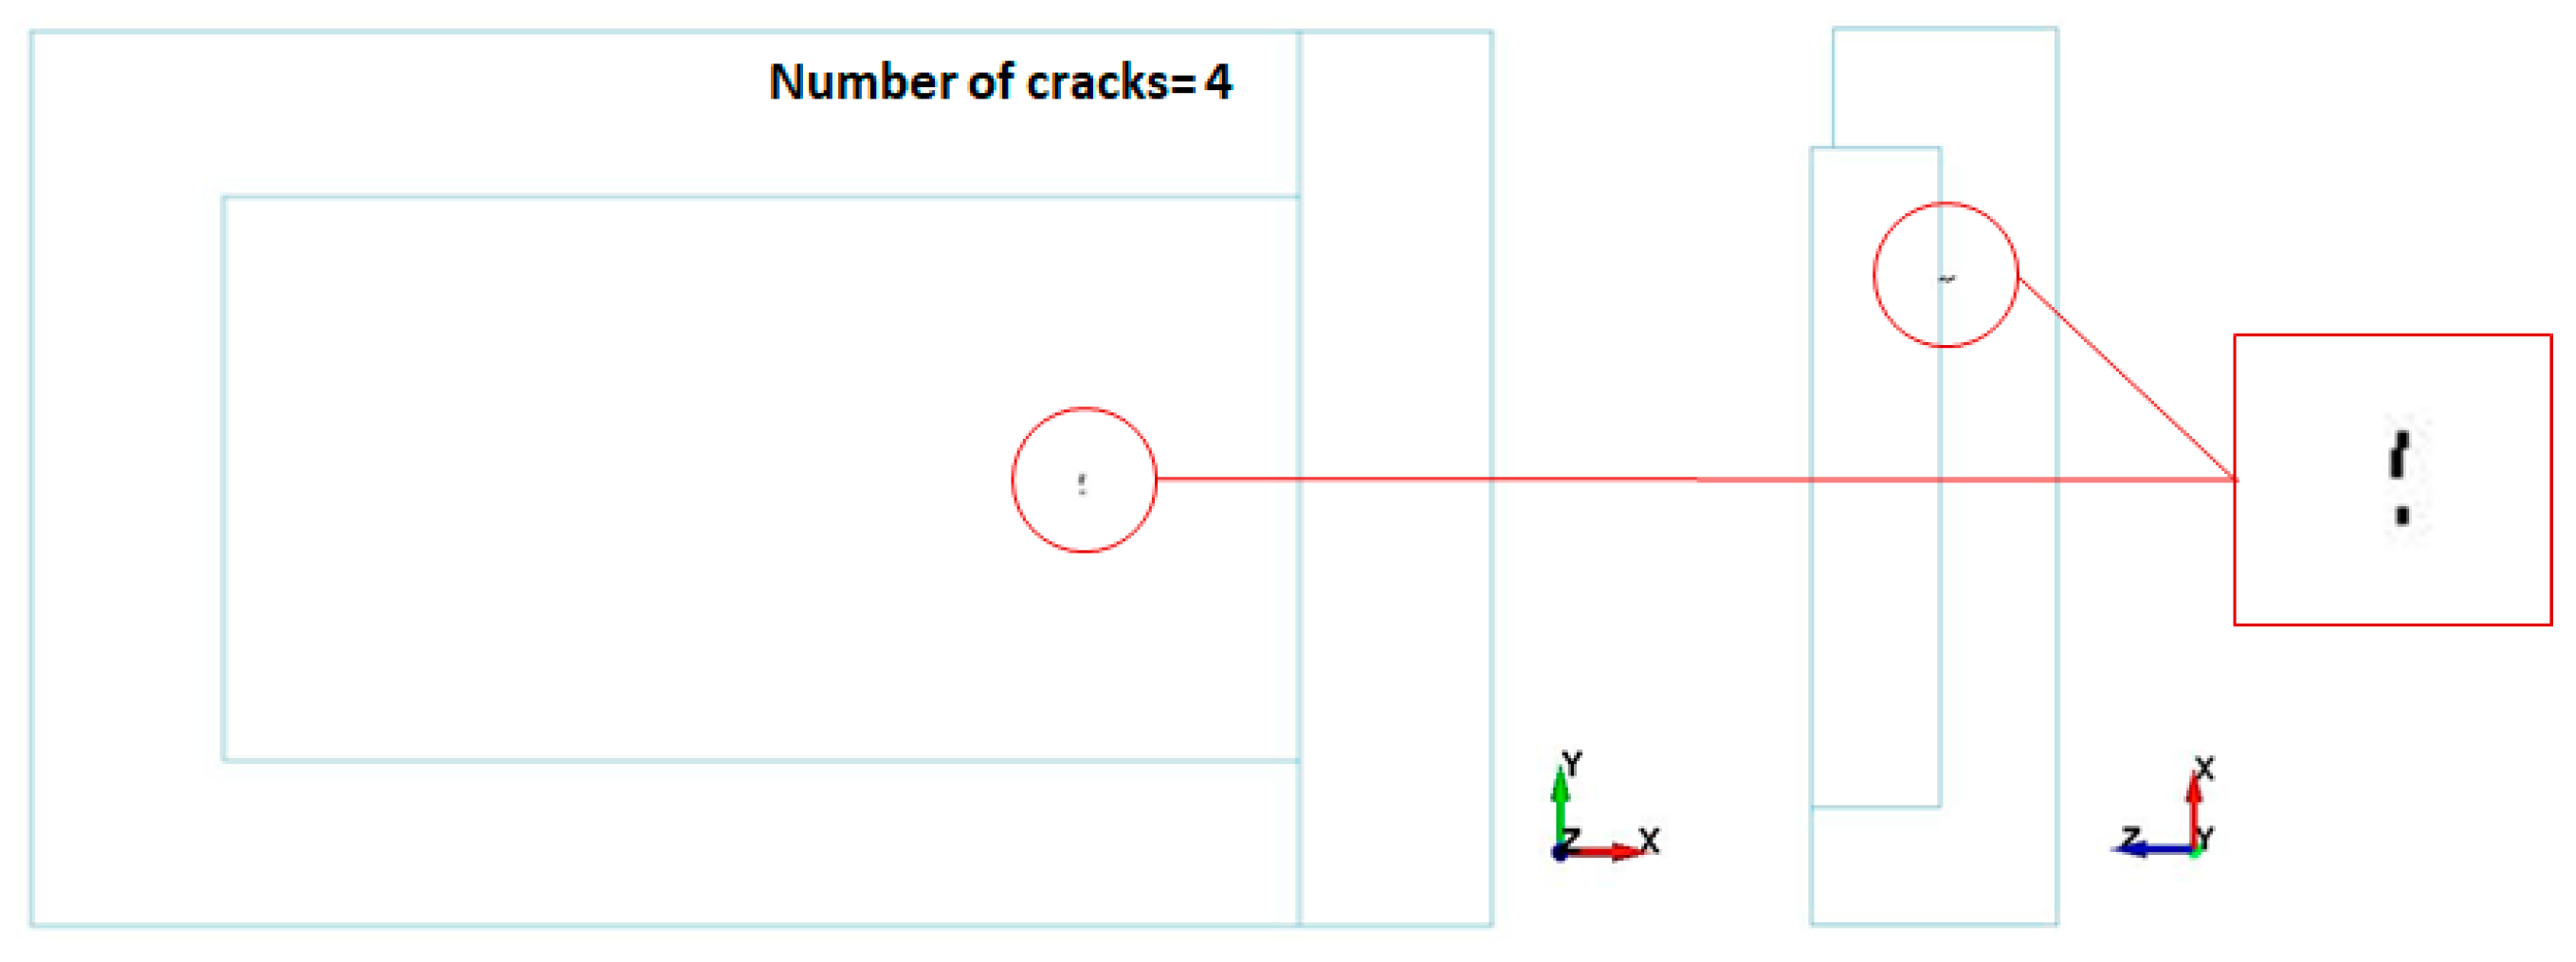
Moreover, concrete cracks, as measured by the number of cracking elements and their locations in the Winfrith concrete model, are utilized to assess the concrete damage in the reactor cavity and basemat. Figure 16 and Figure 17 illustrate the crack pattern and number observed in the reactor cavity and basemat at different times. As depicted in Figure 16a, the concrete cracks start near the corner region at the same time as the effective stress waves in the vicinity of the TNT charge initiate at 0.1 ms. As seen in Figure 16b,c, concrete cracks propagate and accumulate on an upper zone of the bottom slab and the interior surface of oblique or rectangular side walls along the path of effective stress wave propagation, which corresponds to the propagation result of the stress waves in Figure 12. After 50.0 ms, as seen in Figure 16c, concrete cracks are observed in the aforementioned regions along the path of the propagation of the stress waves. Based on the numerical results, it can be concluded that the concrete damage to the reactor cavity may be superficial, as the damaged region is relatively limited to the upper and lower surfaces of the structures. In addition, a few concrete cracks initiate in a localized upper region of the basemat at 0.8 ms but do not propagate until the end of the analysis at 50.0 ms, as shown in Figure 17. Thus, in the upper, localized zone of the basemat, superficial damage to the concrete in the basemat is observed. As depicted in Figure 18a, the number of concrete cracks increases and accumulates gradually, reaching a maximum of 1247 cracks at 13.0 ms and a residual number of 1201 cracks at 50.0 ms. However, as seen in Figure 18b, the number of concrete cracks is only four at 0.8 ms and remains constant until 50.0 ms.

3.2.2. Damage Assessment of the Liner Plate and Reinforcement

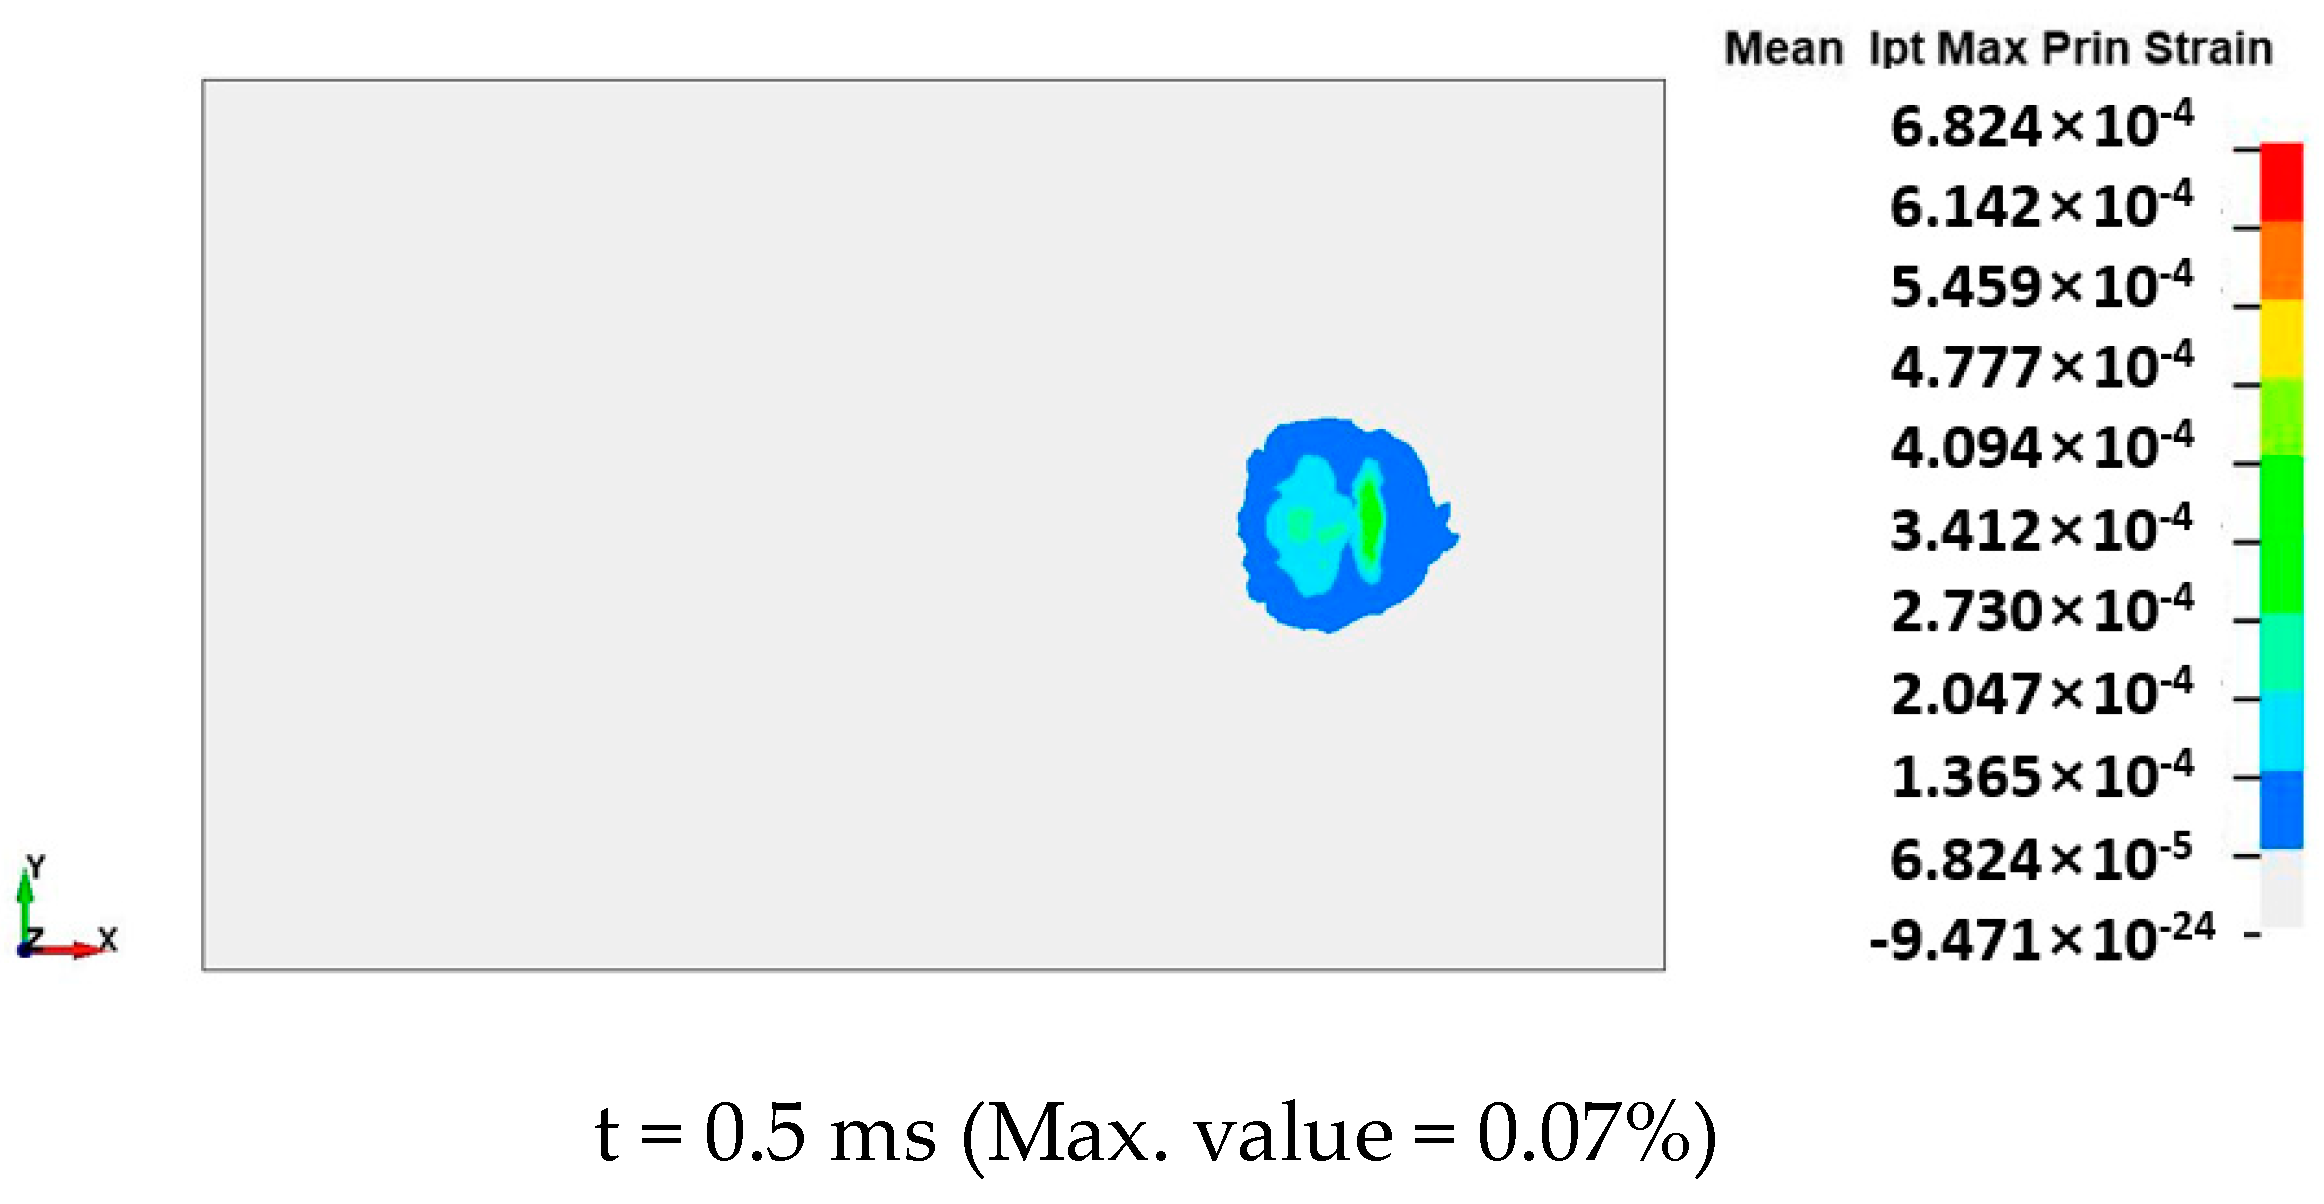
In accordance with NEI 07-13 [13], the liner plate and reinforcement are assumed to fail when the membrane principal strain in the tension of the liner plate exceeds 5% and the uniaxial tensile strain of the reinforcement exceeds 5%, respectively. As depicted in Figure 13, the liner plate retains its elasticity since the induced maximum effective stress of 135.0 MPa at 0.5 ms is less than the yield strength of 310 MPa in the liner plate. As shown in Figure 19, the maximum principal strain of the liner plate is 0.07% at 0.5 ms along the propagation path of the effective stress wave. Given that the maximum level of principal strain does not exceed the failure criteria, it can be inferred that the risk of damage to the liner plate is relatively low.
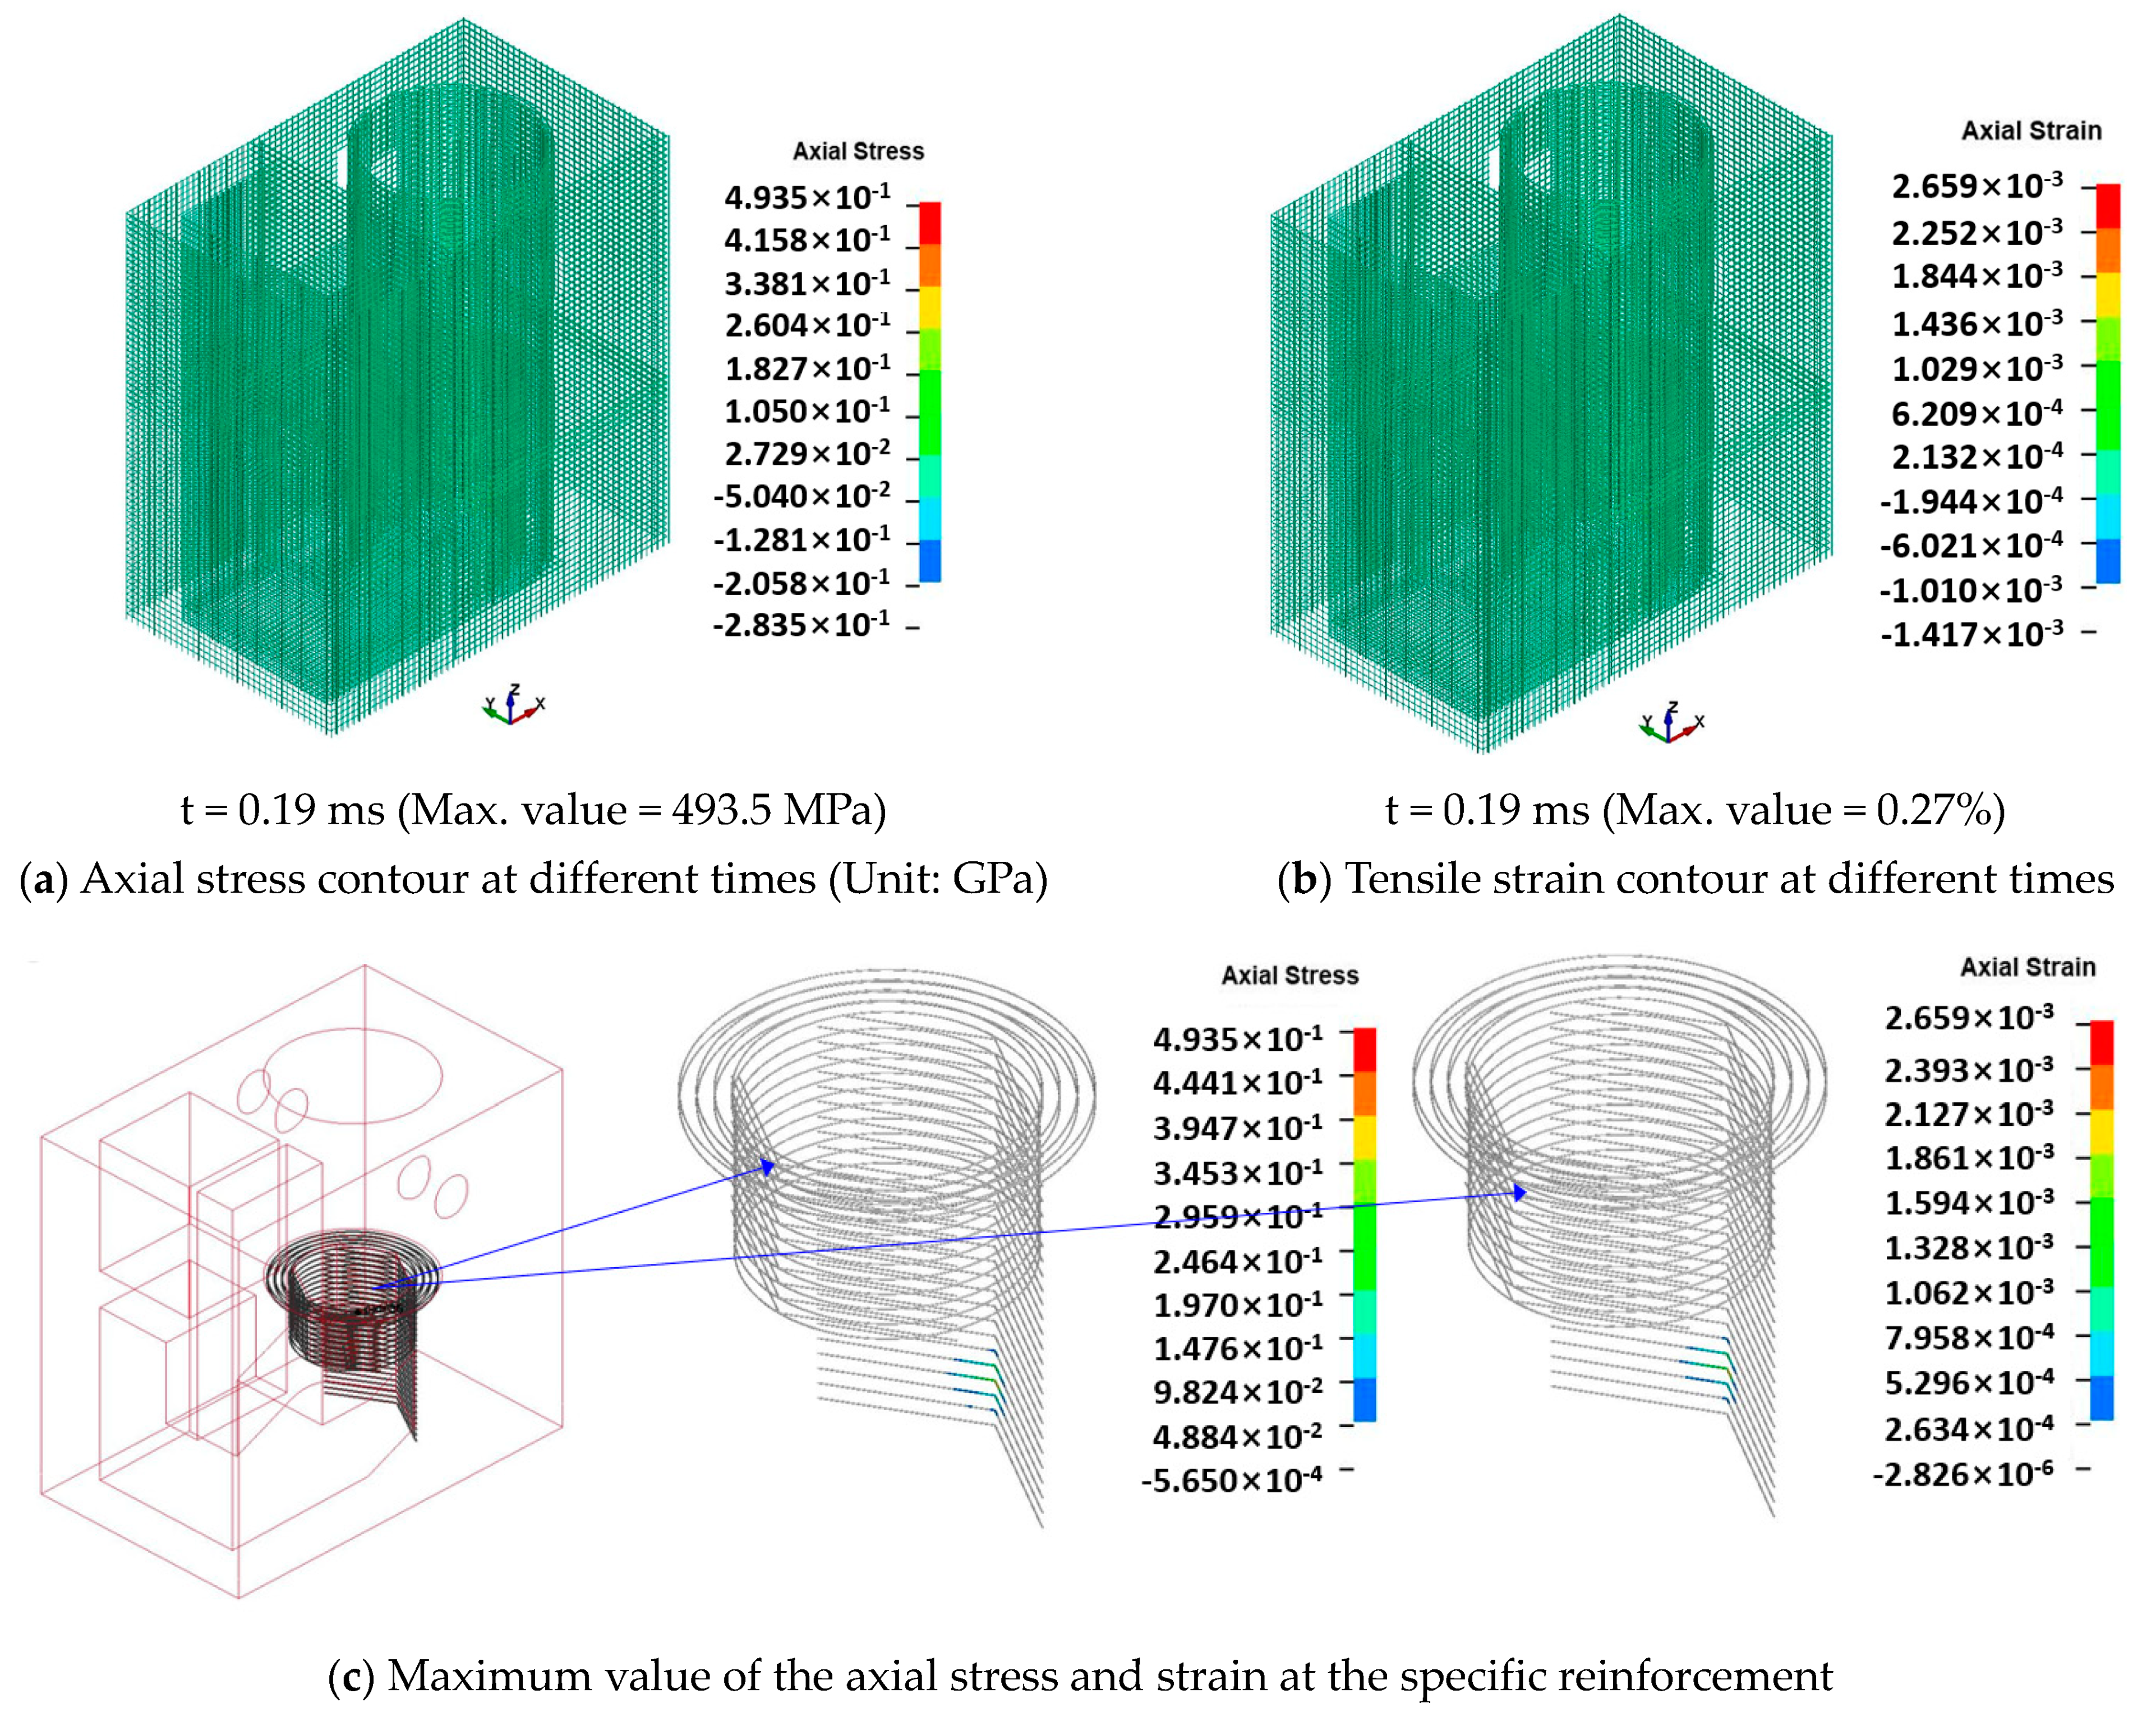
Figure 20 depicts the axial stress and strain distribution in tension (positive value) and compression (negative value) of the reinforcements inside the reactor cavity. As shown in Figure 20a,b, the maximum axial stress and tensile strain of the reinforcements at 0.19 ms are 493.5 MPa and 0.27%, respectively. Figure 20c shows the maximum values of the axial stress and tensile strain at specific horizontal reinforcements near a TNT charge detonation. Specific horizontal reinforcements near a TNT explosion exhibit minor plastic deformation since the induced maximum axial stress of 493.5 MPa at 0.19 ms exceeds the reinforcements’ yield strength of 469 MPa. Nevertheless, it is evident from the numerical results that the risk of reinforcement damage is very low, as the maximum tensile strain is much lower than the 5.0% tensile strain failure criteria.
Despite localized and superficial concrete damages in the reactor cavity and basemat, the TNT explosion from the steam explosion will not cause the collapse of the concrete in the reactor cavity. Moreover, the risk of damage to the liner plate and reinforcements may be very low due to the fact that the levels of the maximum principal and tensile strains are quite low relative to the failure criteria. Thus, the structural integrity of the reactor cavity may be maintained during the TNT explosions for steam explosion.
Further research will be needed to investigate the potential effects of (1) the various types of reactor cavities associated with diverse nuclear reactor systems and (2) the various boundary conditions, including modeling of the basemat component or the coupled system between soil layer and basemat to consider a soil–structure interaction, on the structural response and damage to the reactor cavity. In addition, the applicability of the ALE and FSI methods should be validated by comparing experimental tests on the dynamic response of reinforced concrete structures subjected to explosion loads.

4. Conclusions

The purpose of this study is to investigate pressure wave propagation and damage to the reactor cavity caused by the TNT detonation for the steam explosion. From the numerical results, the incident pressure waves strike the corner directly and pressure–structure interaction produces reflected pressure waves. As the reflected pressure waves propagate in a spherical shape and are reflected multiple times on the interfaces between the cooling water and inner walls, the reflected pressure can be amplified by approximately 1.33 to 1.67 times the incident pressure. Otherwise, the peak pressures of the incident and reflected shock waves are found to decrease rapidly with increasing distance from the charge center. In addition, the reflected pressure waves propagate along a distance of approximately 6.4 m from the TNT charge center to the free water surface; however, their pressures on the free water surface drop rapidly and reach almost zero.
The numerical results show that localized concrete damage to the reactor cavity is expected at an early analysis time (less than 3.0 ms), but the risk of damage to concrete resulting in the collapse of the reactor cavity is very low. Similarly, the risk of damage to concrete in the basemat is relatively low. Based on the distributions of the concrete cracks, superficial concrete damages in the reactor cavity and basemat are observed. In addition, the risk of damage to the liner plate and reinforcements can be inferred to be relatively low since the maximum levels of principal and tensile strains do not exceed the failure criteria. Based on damage evaluation results, the structural integrity of the reactor cavity will be maintained during the TNT detonation.

Author Contributions

Conceptualization, S.-K.H.; Methodology, S.-K.H.; Software, Y.-H.Y.; Formal analysis, S.-K.H. and Y.-H.Y.; Investigation, S.-K.H. and Y.-H.Y.; Resources, Y.-H.Y.; Data curation, Y.-H.Y.; Writing—original draft, S.-K.H.; Visualization, S.-K.H. and Y.-H.Y.; Project administration, S.-K.H.; Funding acquisition, S.-K.H. All authors have read and agreed to the published version of the manuscript.

Funding

This work was supported by the Nuclear Safety Research Program through the Korea Foundation of Nuclear Safety (KoFONS), using the financial resource granted by the Nuclear Safety and Security Commission (NSSC) of the Republic of Korea (No. 2106008).

Data Availability Statement

Not applicable.

Conflicts of Interest

The authors declare no conflict of interest.

References

  1. OECD/NEA. OECD Research Programme on Fuel-Coolant Interaction: SERENA Final Report; Organisation for Economic Co-operation and Development: Paris, France, 2007. [Google Scholar]
  2. Leskovar, M.; Uršič, M. Estimation of ex-vessel steam explosion pressure loads. Nucl. Eng. Des. 2009, 239, 2444–2458. [Google Scholar] [CrossRef]
  3. Kim, S.H.; Chang, Y.S.; Song, S.C.; Cho, Y.J. Structural assessment of fully flooded reactor cavity and penetration piping under steam explosion conditions. Int. J. Press. Vessels Pip. 2015, 131, 36–44. [Google Scholar] [CrossRef]
  4. Jung, J.H.; An, S.M.; Ha, K.S.; Kim, H.Y. Evaluation of heat-flux distribution at the inner and outer reactor cavity walls under the in-vessel retention through external reactor vessel. Nucl. Eng. Technol. 2015, 47, 66–73. [Google Scholar] [CrossRef]
  5. Kim, S.H.; Chang, Y.S.; Cho, Y.J.; Jhung, M.J. Modeling of reinforced concrete for reactor cavity analysis under energetic steam explosion condition. Nuc. Eng. Technol. 2016, 48, 218–227. [Google Scholar] [CrossRef]
  6. Cizelj, L.; Končar, B.; Leskovar, M. Vulnerability of a partially flooded PWR reactor cavity to a steam explosion. Nucl. Eng. Des. 2006, 236, 1617–1627. [Google Scholar] [CrossRef]
  7. Chunyu, Z.; Pengb, C.; Juanhuab, Z.; Jimingb, L.; Yulanc, L.; Shishunb, Z.; Biao, W. Evaluation of the structural integrity of the CPR1000 PWR containment under steam explosion accidents. Nucl. Eng. Des. 2014, 278, 632–643. [Google Scholar]
  8. Corradini, M.L.; Murphy, J.; Nilsuwankosit, S. User’s Manual for TEXAS-V One Dimensional Transient Fluid Model; University of Wisconsin: Madison, WI, USA, 2002. [Google Scholar]
  9. Turland, B.D.; Dobson, G.P. Molten Fuel Coolant Interactions: A State-of-the-Art Report; EUR 16874 EN; European Commission: Luxembourg, 1996. [Google Scholar]
  10. Taleyarkhan, R.P. Vapor explosion studies for nuclear and non-nuclear industries. Nucl. Eng. Des. 2005, 235, 1061–1077. [Google Scholar] [CrossRef]
  11. Park, S.H.; Bang, K.H.; Cho, J.R. Structural Integrity Evaluation of a Reactor Cavity during a Steam Explosion for External Reactor Vessel Cooling. Energies 2021, 14, 3605. [Google Scholar] [CrossRef]
  12. IAEA. Safety Aspects of Nuclear Power Plants in Human Induced External Events: Assessment of Structures; Safety Reports Series. No. 87; International Atomic Energy Agency: Vienna, Austria, 2018. [Google Scholar]
  13. NEI (Nuclear Energy Institute). Methodology for Performing. Aircraft Impact Assessments for New Plant Designs; NEI 07-13, Rev. 8; Nuclear Energy Institute: Washington, DC, USA, 2011. [Google Scholar]
  14. Broadhouse, B.J.; Neilson, A.J. Modeling reinforced concrete structures in DYNA3D. In Proceedings of the DYNA3D User Group Conference, London, UK, 24 September 1987. [Google Scholar]
  15. Broadhouse, B.J.; Attwood, G.J. Finite Element Analysis of the Impact Response of Reinforced Concrete Structures using DYNA3D. In Proceedings of the Structural Mechanics in Reactor Technology (SMiRT) 12, Stuttgart, Germany, 15–20 August 1993. [Google Scholar]
  16. Athanasiou, E.; Teixeira-Dias, F.; Coghe, F.; Desmaret, L. Response of reinforced concrete structural elements to near-field and contact explosions. Int. J. Saf. Secur. Eng. 2016, 6, 418–426. [Google Scholar] [CrossRef]
  17. Schwer, L. Modeling Rebar: The forgotten sister in reinforced concrete modeling. In Proceedings of the 13th-International-LSDyna-Conference, Wien, Austria, 8–10 June 2014. [Google Scholar]
  18. Kral, P.; Husek, M. Concrete in Uniaxial and Triaxial Compression—Experimental and Numerical Analysis in Interaction with Material Parameter Optimization (Conference paper). In Proceedings of the Juniorstav 2017, Brno, Czech Republic, 26 January 2017; pp. 1–6. [Google Scholar]
  19. Hokes, F.; Kral, P.; Krnavek, O.; Husek, M. Improved Sensitivity Analysis in the Inverse Identification of the Parameters of a Nonlinear Material Model. Procedia Eng. 2017, 172, 347–354. [Google Scholar] [CrossRef]
  20. Dubec, B.; Maňas, P.; Štoller, J.; Zezulová, E.; Dvořák, P.; Hejmal, Z. Numerical Identification of Material Model Parameters of UHPFRC Slab under Blast Loading. Appl. Sci. 2023, 13, 70. [Google Scholar] [CrossRef]
  21. Jayasinghe, L.B.; Thambiratnam, D.P.; Perera, N.; Jayasooriya, J.H.A.R. Blast response of reinforced concrete pile using fully coupled computer simulation techniques. Comput. Struct. 2014, 135, 40–49. [Google Scholar] [CrossRef]
  22. CEB. Bullettin D’information 213/214 CEB-FIP Model Code 1990; Thomas Telford: London, UK, 1993. [Google Scholar]
  23. LS-DYNA. Keyword User’s Manual: Volume II, Material Models; Livermore Software Technology Corporation (LSTC): Livermore, CA, USA, 2017. [Google Scholar]
  24. Yin, H.; Ouyang, Y. Experimental and Numerical Study on Steel Fiber Concrete under Blast Loading. Buildings 2022, 12, 2119. [Google Scholar] [CrossRef]
  25. Dobratz, B.M.; Crawford, P.C. Properties of Chemical Explosives and Explosive Simulants; Lawrence Livemore National Laboratory: Livermore, CA, USA, 1985; pp. 8–23. [Google Scholar]
  26. Trevino, T. Applications of Arbitrary Lagrangian Eulerian (ALE) Analysis Approach to Underwater and Air Explosive Problems. Master’s Thesis, Naval Postgraduate School, Monterey, CA, USA, 2000. [Google Scholar]
  27. Webster, K.G. Investigation of Close Proximity Underwater Explosion Effects on a Ship-Like Structure Using the Multi-Material Arbitrary Lagrangian Eulerian Finite Element Method. Master’s Thesis, Virginia Tech, Blacksburg, VA, USA, 2007. [Google Scholar]
  28. Benson, D.J. Computational methods in Lagrangian and Eulerian hydrocodes. Comput. Methods Appl. Mech. Eng. 1992, 99, 235–394. [Google Scholar] [CrossRef]
  29. Yang, G.; Wang, G.; Lu, W.; Zhao, X.; Yan, P.; Chen, M. Cross-section shape effects on anti-knock performance of RC columns subjected to air and underwater explosion. Ocean Eng. 2019, 181, 252–266. [Google Scholar] [CrossRef]
  30. Olovsson, L.; Souli, M. ALE and fluid-structure interaction capabilities in LS-DYNA. In Proceedings of the 7th International LS-DYNA Users Conferences, Dearborn, MI, USA, 19–21 May 2002. [Google Scholar]
  31. Cole, R.H. Underwater Explosions; Princeton University Press: Princeton, NI, USA, 1948. [Google Scholar]
  32. Kinney, G.F.; Graham, K.J. Explosive Shocks in the Air, 2nd ed.; Springer: Berlin/Heidelberg, Germany, 1985. [Google Scholar]
  33. Hwang, M.K.; Park, S.Y.; Park, I.K. Assessment of Steam Explosion Impact on KNGR Plant; KAERI/TR-1303/99; KAERI: Daejeon, Republic of Korea, 1999. [Google Scholar]
  34. OECD/NEA. OECD Research Programme on Fuel-Coolant Interaction Steam Explosion Resolution for Nuclear Applications—SERENA; OECD: Danvers, MA, USA, 2007. [Google Scholar]
  35. Bottin, M. Molten Corium Concrete Interaction: Investigation of convective heat transfer in a pool with gas sparging. In Proceedings of the 7th European Review Meeting on Severe Accident Research (ERMSAR-2015), Marseille, France, 24–26 March 2015. [Google Scholar]
  36. Park, H.S.; Chapman, R.; Corradini, M.L. Vapor Explosions in a One-Dimensional Large Scale Geometry with Simulant Melts; NUREG/CR-6623; University of Wisconsin: Madison, WI, USA, 1999. [Google Scholar]
  37. Rajendran, R.; Narasimhan, K. Deformation and Fracture Behavior of Plate Specimens Subjected to Underwater Explosion: A Review. Int. J. Impact Eng. 2006, 32, 1945–1963. [Google Scholar] [CrossRef]
  38. Wang, G.; Zhang, S.; Kong, Y.; Li, H. Comparative study of the dynamic response of concrete gravity dams subjected to underwater and air explosions. J. Perform. Constr. Facil. 2014, 29, 04014092. [Google Scholar] [CrossRef]
  39. Wang, X.; Zhang, S.; Wang, C.; Cui, W.; Cao, K.; Fang, X. Blast-induced damage and evaluation method of concrete gravity dam subjected to near-field underwater explosion. Eng. Struct. 2020, 209, 109996. [Google Scholar] [CrossRef]
  40. Wood, S.L. Cavitation Effects on a Ship-Like Box Structure Subjected to an Underwater Explosion, in Mechanical Engineering. Master’s Thesis, Naval Postgraduate School, Monterey, CA, USA, 1998. [Google Scholar]
  41. Zhuang, T.S.; Wang, M.Y.; Wu, J.; Yang, C.Y.; Zhang, T.; Gao, C. Experimental investigation on dynamic response and damage models of circular RC columns subjected to underwater explosions. Def. Technol. 2020, 16, 856–875. [Google Scholar] [CrossRef]
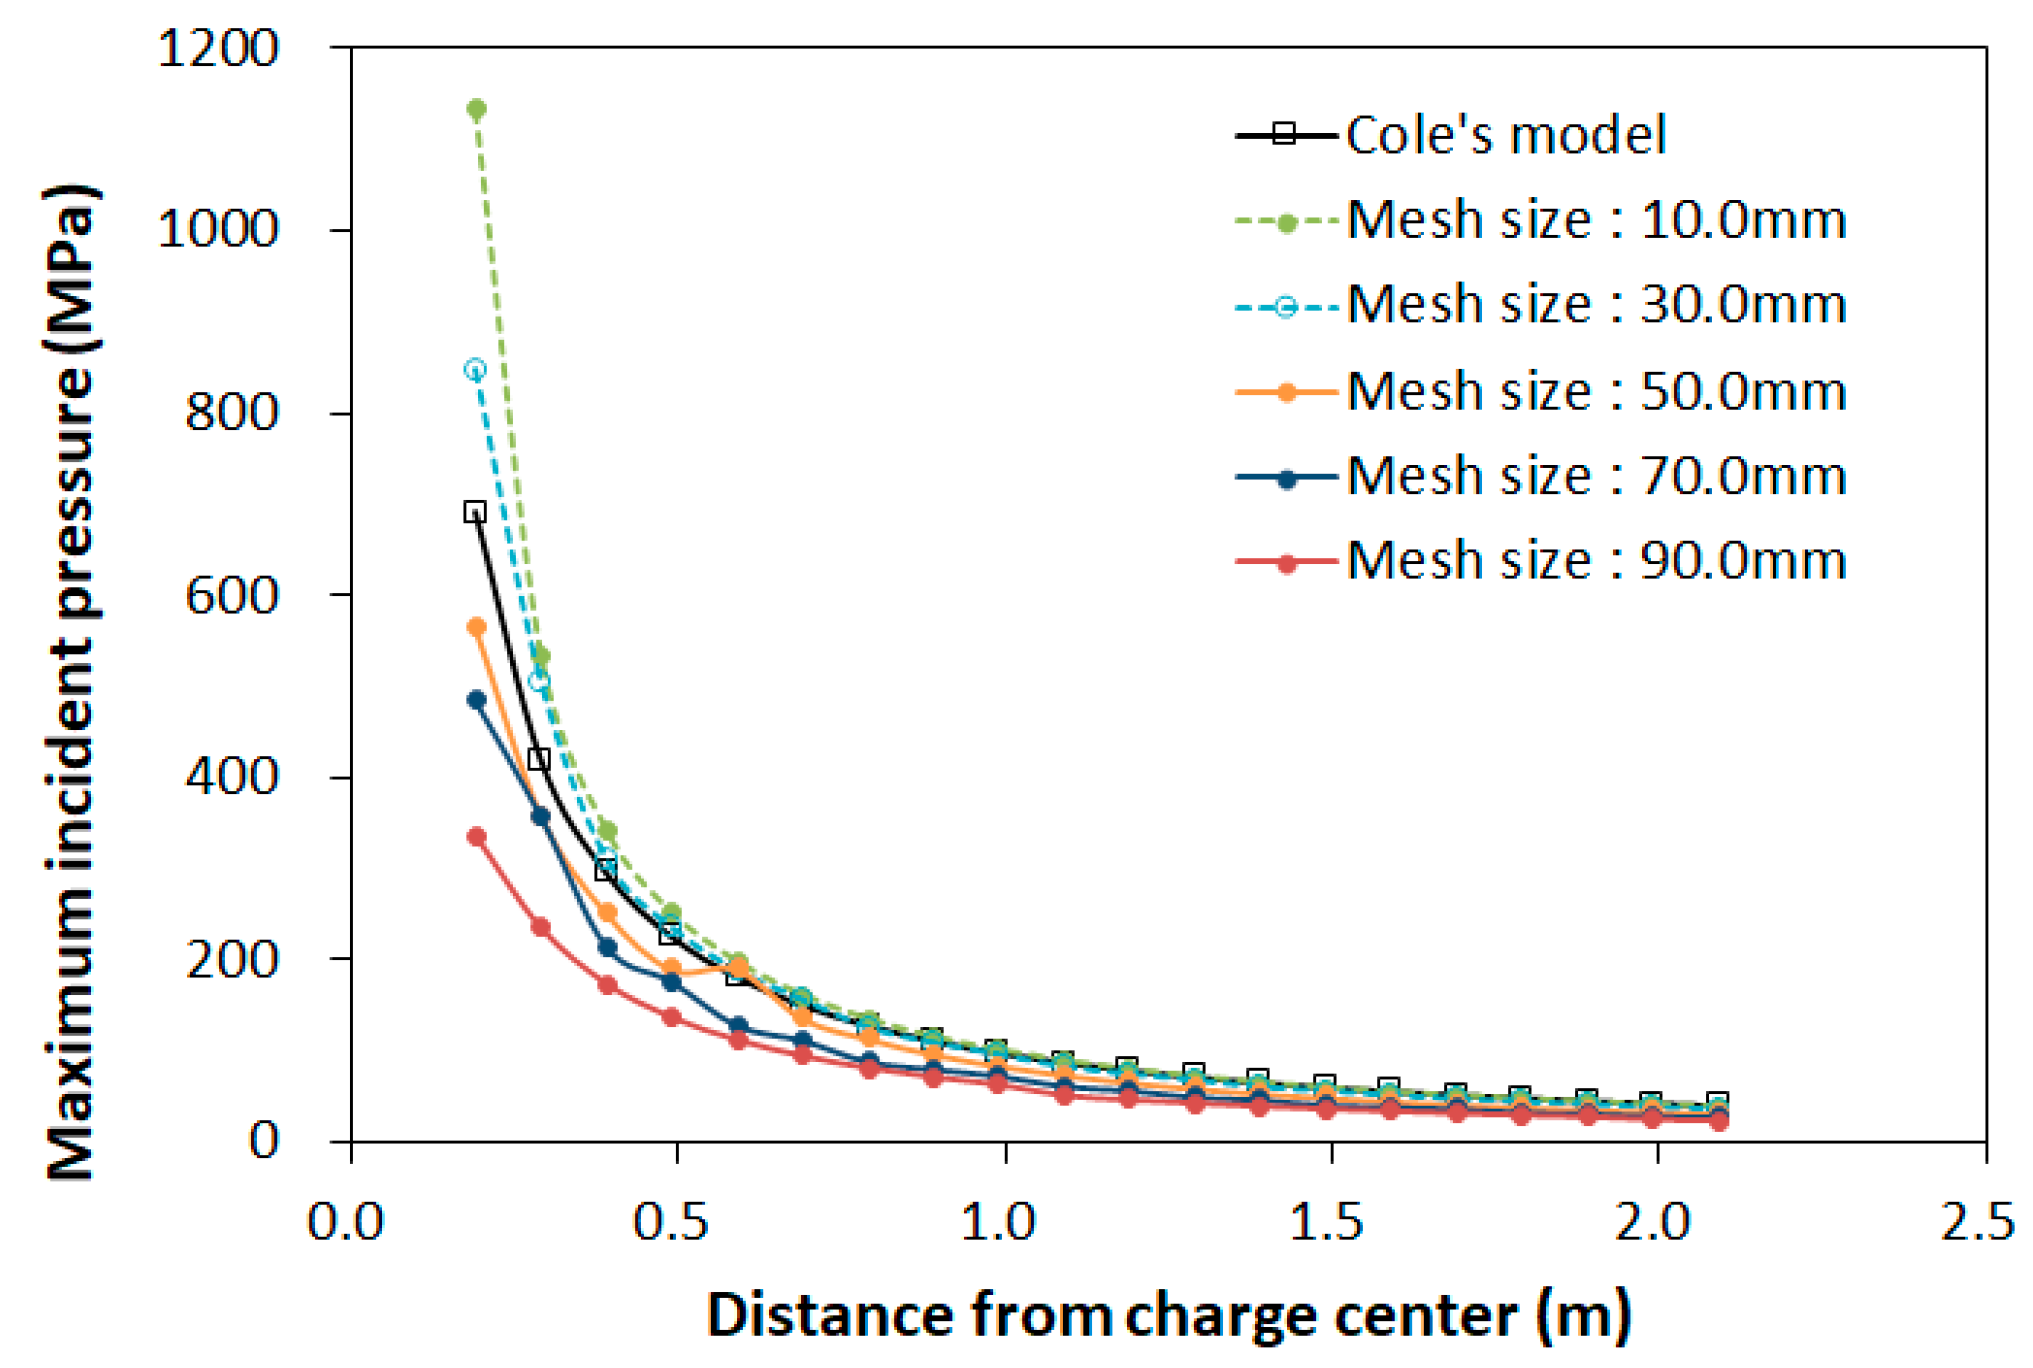
Figure 1. Comparison between 1D ALE analysis and empirical results of the incident pressure.
Buildings 13 02152 g001
Figure 2. Finite element modeling of the concrete (a), basemat (b), reinforcements (c), and liner plate (d) in the reactor cavity (Unit: mm).
Buildings 13 02152 g002
Figure 3. Boundary and symmetry conditions of the basemat.
Buildings 13 02152 g003
Figure 4. Scheme of the fluid models for ALE analysis (a) and the combined model for fluid–structure interaction (FSI) analysis (b).
Buildings 13 02152 g004
Figure 5. TNT detonation position for numerical analysis (Unit: mm).
Buildings 13 02152 g005
Figure 6. Propagation contour of the incident pressure waves in the cooling water at different times on the cross-section along the xz plane (Unit: GPa).
Buildings 13 02152 g006
Figure 7. Propagation contour of the reflected pressure waves in the reactor cavity and basemat at different times along the cross-section of the xy plane (Unit: GPa).
Buildings 13 02152 g007
Figure 8. Propagation contour of the incident (a,b) and reflected (c,d) pressure waves near the free water surface (Unit: GPa).
Buildings 13 02152 g008
Figure 9. Scheme of the tracer positions on the bottom slab and side wall of the reactor cavity.
Buildings 13 02152 g009
Figure 10. Distribution of the peak pressures of the incident and reflected shock waves at each tracer position.
Buildings 13 02152 g010aBuildings 13 02152 g010b
Figure 11. Distribution of the reflection coefficient by comparing them to test data reported by Zhuang et al. [41].
Buildings 13 02152 g011
Figure 12. Propagation of the effective stress waves in the reactor cavity, liner plate, and basemat at different times (Unit: GPa).
Buildings 13 02152 g012aBuildings 13 02152 g012b
Figure 13. Effective stress profile of the concrete in the reactor cavity, liner plate, and the concrete in the basemat.
Buildings 13 02152 g013
Figure 14. Principal strain contour in the concrete of the reactor cavity at different times.
Buildings 13 02152 g014
Figure 15. Principal strain contour in the concrete of the basemat at 0.8 ms.
Buildings 13 02152 g015
Figure 16. Concrete crack distribution of the reactor cavity at different times.
Buildings 13 02152 g016
Figure 17. Concrete crack distribution of the concrete in the basemat at 0.8 ms.
Buildings 13 02152 g017
Figure 18. Concrete crack profile in the reactor cavity (a) and basemat (b).
Buildings 13 02152 g018
Figure 19. Principal strain contour of the liner plate at 0.5 ms.
Buildings 13 02152 g019
Figure 20. Axial stress and strain contours of the reinforcements at 0.19 ms.
Buildings 13 02152 g020
Table 1. Material properties of the concrete in a reactor cavity and basemat.
PropertyReactor Cavity and Basemat
Density (kg/m3)2400
Poisson’s ratio0.18
Compressive strength ( f c ) (MPa)57.2
Initial tangent modulus (TM) (GPa)40
Uniaxial tensile strength (UTS) (MPa)4.86
Coefficient as a function of maximum aggregate diameter (GF0) (N/m)32
Fracture energy (GF) (GPa-mm)1.186 × 10⁻⁴
Table 2. Material properties of the reinforcement and liner plate.
PropertyReinforcementLiner Plate
Density (kg/m3)78407840
Modulus of Elasticity (GPa)200200
Poisson’s Ratio0.30.3
Yield Stress (MPa)469310
Ultimate Tensile Strength (MPa)510372
Tangent Modulus (MPa)864325
Table 3. Distribution of the reflection coefficient at each tracer position.
Tracer
Position
Reflection Coefficient (Cr)
Number of TracersMinimumAverageMaximumCoefficient of
Variation (%)
1341.141.671.9911.97
2321.241.581.726.16
3270.951.301.7717.31
Disclaimer/Publisher’s Note: The statements, opinions and data contained in all publications are solely those of the individual author(s) and contributor(s) and not of MDPI and/or the editor(s). MDPI and/or the editor(s) disclaim responsibility for any injury to people or property resulting from any ideas, methods, instructions or products referred to in the content.