Abstract
In today’s world, concrete structures are exposed to various influences, including explosive actions. With the increasing use of fiber-reinforced concrete (FRC), it is essential to investigate its response to blast effects. As there are few studies on this topic worldwide, this research is dedicated to the question of how blast effects affect the damage and properties of six different types of reinforced concrete (RC) slabs. These samples differ in concrete classes (C30/37 and C50/60) and in the type of fibers added (steel and polypropylene). Visual inspections and non-destructive measurements are carried out before and after blasting. The damaged area of the concrete surface is determined by visual inspection, while non-destructive measurements evaluate parameters such as the rebound value of the Schmidt hammer, the electrical resistivity of the concrete, the velocity of the ultrasonic wave, and the dynamic modulus of elasticity. Equal amounts of explosives are applied to five of the RC slabs to enable a comparative analysis of the resulting damage. Based on the comparison of the measured data from these five RC slabs, conclusions are drawn regarding the effects of the explosive impacts on conventionally reinforced concrete slabs compared to those with added fibers. In addition, one of the RC slabs with steel fibers is exposed to approximately three times the amount of explosives to assess the extent of increased damage and to evaluate the suitability of military standards in the calculation of explosive charges for blasting RC elements with fibers.
1. Introduction
Throughout history, concrete has proven to be an extremely effective building material. From its first use to the present day, concrete technology has continued to develop, so concrete as a building material has acquired increasingly improved properties. Several decades ago, the modern development of FRC began, the main advantage of which was increased ductility and improved performance during cracking [1]. Nowadays, a variety of fibers are used in concrete, and intensive research is being carried out to optimize concrete properties by incorporating fibers with different properties into the concrete mix [2,3,4,5,6,7,8,9,10,11].
Most modern infrastructures, such as bridges, power plants, and TV towers, are made of concrete and are exposed to various actions: earthquakes, climate change, aggressive environments, live load increases, wars, and terrorist threats [4,12,13,14,15,16,17,18,19,20,21,22,23,24,25,26,27]. Urban warfare has contributed to the increasing presence of explosive materials in populated areas. Therefore, there is a growing need to investigate the effects of explosive impacts on various construction materials, including FRC. Over the past two decades, numerous studies have investigated the impact of explosions on concrete with different compositions. However, the focus has mainly been on visual inspections and the assessment of external damage [28,29,30,31,32]. To carry out a more comprehensive analysis of the effects of explosives on concrete with fibers, a joint research project is carried out by the Croatian Armed Forces in cooperation with the University of Zagreb. The experimental tests are carried out at the Cerovac military training area as part of military university studies [33,34,35]. As part of the research, the influence of explosive effects on six different samples of RC slabs is investigated, four of which are made of concrete with fibers and two without fibers. The variability between the samples can be observed in the different concrete qualities and the types of fibers: none, polypropylene, and steel fibers.
Visual inspection determines the extent of the damaged concrete surface, and non-destructive measurement methods are used to examine the rebound value of the Schmidt hammer, the electrical resistivity of the concrete, the speed of ultrasonic wave propagation through the concrete, and the dynamic modulus of elasticity. Based on the analysis and comparison of the obtained results before and after explosive action, external and internal damage is identified on each RC slab sample, and the quality and uniformity of the installed concrete are assessed after explosive action. Approximately equal amounts of explosive are placed on five samples of RC slabs to compare the resulting damage. By comparing the analyzed measurement results on these five samples of RC slabs, conclusions are drawn regarding the effect of explosive action on conventionally reinforced concrete panels and panels with the addition of fibers. On one of the RC slabs with added steel fibers, approximately three times the amount of explosive is placed to determine the extent of increased damage and to assess the suitability of military standards for calculating explosive charges for the demolition of FRC elements.
2. Materials and Methods
The experiment is carried out on test specimens corresponding to segments of reinforced concrete bridge slabs. The description and placement of the test specimens, the calculation and placement of the explosives, and the selection and methodology of the non-destructive testing are described in this chapter.
2.1. RC Slab Specimens’ Description
Six RC slabs, 2.0 m long, 1.5 m wide, and 0.25 m thick, are used for the tests. Each slab is reinforced on both sides with conventional steel reinforcement with a characteristic yield strength of 500 MPa. The longitudinal reinforcement consists of Ø16/15 cm rebars, while the shear reinforcement is Ø10/15 cm (Figure 1).
Figure 1.
(a) Reinforcement drawing of RC slab specimens, (b) specimen with reinforcement before concreting, and (c) six specimens of RC slabs placed in the Cerovac military training area.
The thickness of the concrete specimens and the type and arrangement of the embedded reinforcement correspond to RC slabs commonly used for bridges. However, the length and width dimensions are modified to meet the transportation requirements of the Cerovac military training area.
Two concrete classes are provided for the test specimens: C30/37 as normal-strength concrete and C50/60 as higher-strength concrete. However, for some specimens with normal strength, slightly higher values of concrete strength according to European standards EN 206 and EN 12390-3 [36,37] are achieved after 28 days (Table 1 and Table 2). The experiments are carried out on test specimens without fibers, with steel fibers, and with polypropylene fibers. Steel fibers are 25 mm long and have tensile strength of 400 MPa, while polypropylene fibers are 54 mm long with tensile strength of 600–800 MPa (Figure 2). The type and quantity of fibers as well as the planned and achieved compressive strength class of the concrete strength for each test specimen are listed in Table 1. The RC slab specimens are cast at a certified concrete manufacturer, where laboratory tests are also conducted to determine the compressive strength of the concrete after 28 days for each of the six RC slabs (Table 2). Detailed data on the concrete mixture used for making the samples are presented in Table 3.

Table 1.
Description of the RC slab specimens.
Table 2.
Results of laboratory testing of concrete compressive strength after 28 days according to EN 12390-3.
Figure 2.
Fibers used in reinforced concrete slab specimens: (a) steel fibers and (b) polypropylene fibers.
Table 3.
Concrete mixtures for the RC slab specimens with lower (RCS1, RCS3, and RCS5) and higher (RCS2, RCS4, and RCS6) concrete classes.
The specimens of the RC slabs are transported to the Cerovac military training area and placed on wooden logs with a circular cross-section, with a diameter of 0.4 m and a height of 1.0 m. For stabilization, the logs are driven into the ground to a depth of 0.34 m (Figure 1c). The test specimens are lifted off the ground so that the blast results are not influenced by rebounding pressure waves and to obtain a model of the bridge slab.
Investigations with similar parameters were carried out in the Czech Republic in cooperation with the Czech army [29,30,31]. The similarities between these two investigations can be found in the specimen geometry, the concrete strength, and the type of fibers in concrete. The difference is in the placement of the explosive: in this study, the explosive was placed in contact with the RC slabs and non-destructive tests were carried out before and after the blasting effect.
2.2. Calculation of Quantity of Explosives
The amount of explosives required for the blasting demolition of RC slabs is determined on the basis of calculations derived from the blasting demolition methods used by the Armed Forces of the Republic of Croatia. In this approach, a linear explosive charge is placed on the test specimens to obtain a transverse cut across the RC slab width. Considering that all specimens within the cross-section area at the demolition site have a reinforcement ratio of less than 5% of concrete area, the following formula is used to calculate the minimum amount of explosives required [38]:
where P is the minimum mass of explosives needed to create an explosive charge, M is the material resistance factor, Z is the charge coverage factor, h is the calculation line of resistance, and l is the length of the element that should be collapsed by blast loading.
P = M ⋅ Z ⋅ h2 ⋅ l,
Factor M is obtained from the demolition tables and varies depending on the type of material and whether the element is loaded or not. In particular, for loaded reinforced concrete with up to 5% reinforcement area in the cross-section, the value of M is 8 kg/m2. It is worth noting that these demolition tables distinguish between “concrete” and “reinforced concrete with up to 5% reinforcement”, and, therefore, no specific standards are defined for concrete with fibers [38,39,40].
Factor Z is also taken from the demolition tables and depends on the position of the explosive charge relative to the demolition element, the type of charge covering used, and the cross-section of the element. In this study, an external and exposed explosive charge is used, resulting in the Z value of 6 [38,39,40].
Parameter h corresponds to the distance between the center of the placed explosive charge and the specific point on the element that should be targeted by the explosive effect. In this study, the aim is to cut the slabs through their depth so that the value of h corresponds to the slab thickness, which is 0.25 m [38,39,40].
Parameter l corresponds to the length of the positioned explosive charge [40]. For RCS1, RCS2, RCS4, RCS5, and RCS6, parameter l is about 0.75 m (half of a slab width), while, for specimen RCS3, the goal is to demolish the slab across its entire width, so the parameter l value is 1.50 m.
The calculated value, P, corresponds to the explosive trinitrotoluene (TNT), which is chosen as the universal standard for calculating the required explosion amount. If another explosive is used to achieve the same effect, it is necessary to calculate the equivalent mass of TNT, Pekv, based on the mass of the chosen explosive, Pod, according to the following formula [38]:
where ijTNT is the power index of the selected explosive in relation to TNT and is read from the power table of high and initial explosives relative to TNT [38].
Pekv = Pod ⋅ ijTNT
Trinitrotoluene (TNT) and plastic explosive pentrite (PENT) are used to detonate the samples. TNT is used in the form of explosive charges weighing 100 g, 200 g, and 500 g. PENT, on the other hand, is used in the form of explosive charges weighing 500 g, but only for the detonation of RCS3. In this particular scenario, a quantity of 2.5 kg of PENT is used, which corresponds to 4 kg of TNT explosives as the performance index of PENT is 1.6 compared to TNT.
About 3 kg of explosives are used to detonate specimens RCS1, RCS2, RCS4, RCS5, and RCS6 (Table 1). Conversely, about 9 kg of explosives are placed on the surface of RCS3 (Table 1). This is conducted to evaluate the applicability of military standards in the calculation of explosive charges for the demolition of elements composed of concrete with fibers. The aim of the study is to find out whether military standards are applicable for fiber-reinforced concrete elements.
The explosive charge is placed directly on the surface of the samples to achieve contact detonation. Loads activated during the contact detonation cause high compressive stress and shear stress, which are often very destructive to the structure. As shown in Figure 3, a strong pressure wave is initially generated in the vicinity of the explosive charge [28]. This wave exceeds the compressive strength of the concrete and causes its crushing. The pressure wave continues to propagate through the concrete structure and finally reaches the lower unloaded surface. From there, it is reflected as a tensile stress wave, which poses a greater risk to concrete structures due to the significantly lower tensile strength of concrete compared to its compressive strength.
Figure 3.
Scheme of contact detonation.
When the amplitude of the tensile stress wave exceeds the concrete’s tensile strength, the concrete structure starts to crush, expelling fragments as flying debris from its lower or unloaded side. This flying debris poses a serious threat to people and equipment in the vicinity of the structure [28,41].
2.3. Selected NDT
To evaluate the impact of explosive actions on FRC elements, a comprehensive set of non-destructive tests are performed on samples of RC slabs. These tests include the use of a Schmidt hammer to determine concrete strength and uniformity, measurement of the electrical resistivity of the concrete, and the velocity of the ultrasonic wave.
2.3.1. Schmidt Hammer
The Schmidt hammer is the most commonly employed non-destructive testing (NDT) method for assessing the uniformity of embedded concrete strength, identifying potential areas of lower-quality concrete, and determining its compressive strength, which correlates with hardness [14,42,43,44].
The Schmidt hammer device measures the impact speed, v0, immediately before the impact, and the rebound speed, vR, after the impact. Based on these measured values, it calculates the fundamental parameter—the rebound value, Q [42]:
where E0 represents the kinetic energy of the needle prior to impact, ER is the kinetic energy of the needle after impact, and m stands for the mass of the hammer.
Determining the compressive strength of concrete from the rebound value, Q, requires the prior determination of the correlation factor between the Q value and the laboratory-tested compressive strength of embedded concrete [43].
For the purposes of this paper, the rebound values of Q before and after the explosion are analyzed and compared in order to evaluate uniformity of concrete quality before and after explosion.
2.3.2. Electrical Resistivity of Concrete
The surface electrical resistivity of concrete serves as a crucial indicator for evaluating the concrete’s durability and assessing the potential corrosion of its reinforcement. This measurement offers insights into the current condition of both the material and the structure itself. It aids in detecting issues like damage, micro- and deep cracks, and even the moisture content within the concrete. Furthermore, it facilitates the estimation of the remaining useful lifespan of the structure [14,42].
The device used for measuring the surface electrical resistivity of concrete operates based on the Wenner probe model, utilizing an alpha configuration. This setup involves four electrodes that are directly inserted into the concrete, positioned at intervals of 0.05 m. The mechanism involves transmitting a low-intensity current, I, between the two outermost probes. Simultaneously, the voltage drop, ΔV, across the two inner probes is measured. These data are then employed to calculate the electrical resistivity of concrete, ρ, using the following formula [38,39]:
where a is distance between two probes (0.05 m).
The outcomes obtained from measuring the surface electrical resistivity of concrete are influenced by a multitude of factors, including but not limited to concrete composition, water content, and environmental conditions: temperature, relative humidity, etc. As a result, it becomes essential to first establish a qualitative assessment of the potential range of values before conducting the actual measurement [42]. In this study, electrical resistivity of concrete is measured before and after explosion as an indicator of internal damage and micro- and deep cracks in concrete.
2.3.3. Velocity of the Ultrasonic Wave
Ultrasonic testing yields valuable insights, such as evaluating the modulus of elasticity of concrete, detecting voids and cracks, including their depth, and assessing the quality and uniformity of the concrete [42,43]. The fundamental principle of ultrasonic testing involves transmitting ultrasonic waves through the concrete specimen and measuring the time taken for longitudinal waves to traverse from the transmitter probe to the receiver probe. This time interval enables the calculation of the velocity of the ultrasonic wave, v. Velocity of the ultrasonic wave is determined as the ratio of the concrete test specimen, l, to the pulse passage time, t, as defined by Formula (5) [42,43,44]:
The quality of the concrete within the structure is assessed by measuring the velocity of the ultrasonic wave as it travels through the concrete, following the criteria outlined in Table 4. Several factors influence the ultrasonic wave velocity, e.g., the environmental conditions, microcracks in the concrete, the w/c ratio, the age of the concrete, the presence of steel reinforcement, and the type and quantity of aggregates. As the six samples tested had the same environmental conditions and a very similar concrete mix, the differences in ultrasonic velocity may indicate microcracks in the concrete caused by an explosion.
Table 4.
Criteria for determining the quality of concrete by measuring the velocity of the ultrasonic wave based on recommendation from [43].
Based on the measured velocity of the ultrasonic wave, the dynamic modulus of elasticity of the concrete, Ed [MPa], is calculated according to [42,43,44]:
where ρc [kg/m3] is density of concrete and ν is Poisson’s ratio of concrete.
2.4. NDT Methodology
Before performing the selected test methods, the RC slab specimens are prepared by outlining the reinforcement grid, defining the measurement points for each method, and cleaning the test surface.
Since gel has to be applied for the ultrasonic test and the surface has to be moistened for the electrical resistivity test, the test is carried out in a specific order: first the Schmidt hammer test, then the ultrasonic test in one area, and concluding with electrical resistivity testing in an adjacent area to prevent gel residue from affecting the accuracy of results.
Half of the measuring points for the Schmidt hammer test are measuring points at which the ultrasonic wave was later measured and half of the points at which the electrical resistance of the concrete was later measured. Approximately 50% of the measuring points for testing the velocity of the ultrasonic wave had not previously been tested using another method. The same applies to half of the measuring points for testing the electrical resistance. In this way, it was already established before the explosion that the Schmidt hammer test did not affect the results of the ultrasonic wave velocity through the concrete or the electrical resistivity of the concrete.
After the explosion, the test surface of the RC slabs is cleaned again and new measurement points are established due to damage to parts of the slabs. The procedure and sequence for carrying out the non-destructive tests have not been changed.
The tests performed before and after the explosion did not take place on the same day, and the RC slabs were exposed to different meteorological conditions, which affected the test results. The tests on the RC slab specimens before the explosion were carried out on 5 June 2020. On that day, the average temperature in Karlovac was 17.8 °C, and it rained between 03:00 a.m and 07:00 a.m., which resulted in a higher moisture content in the reinforced concrete slab specimens. The tests after the explosion were conducted on 8 June 2020 at an average temperature of 19.2 °C. On this day, it rained intermittently and locally, resulting in lower moisture content in the RC slab specimen.
3. Results and Discussion
3.1. Visual Inspection
The damaged surface of the concrete, that is, the surface of the spalled and punctured concrete, is evaluated by visual inspection and measurement (Figure 4 and Figure 5; Table 5). These methods applied to the RC slab specimens demonstrate high accuracy and reliability for the following reasons: before the explosion, a reinforcing mesh was drawn on the top and bottom of the slab at 15 × 15 cm intervals, which facilitated the accuracy of the measurement of surface damage, while the size of the slab specimens and their placement at a height of 1 m above the ground enabled precise measurements from above and below.

Figure 4.
RC slab samples (RCS1-6) after explosive action: upper (left) and lower (right) surfaces.


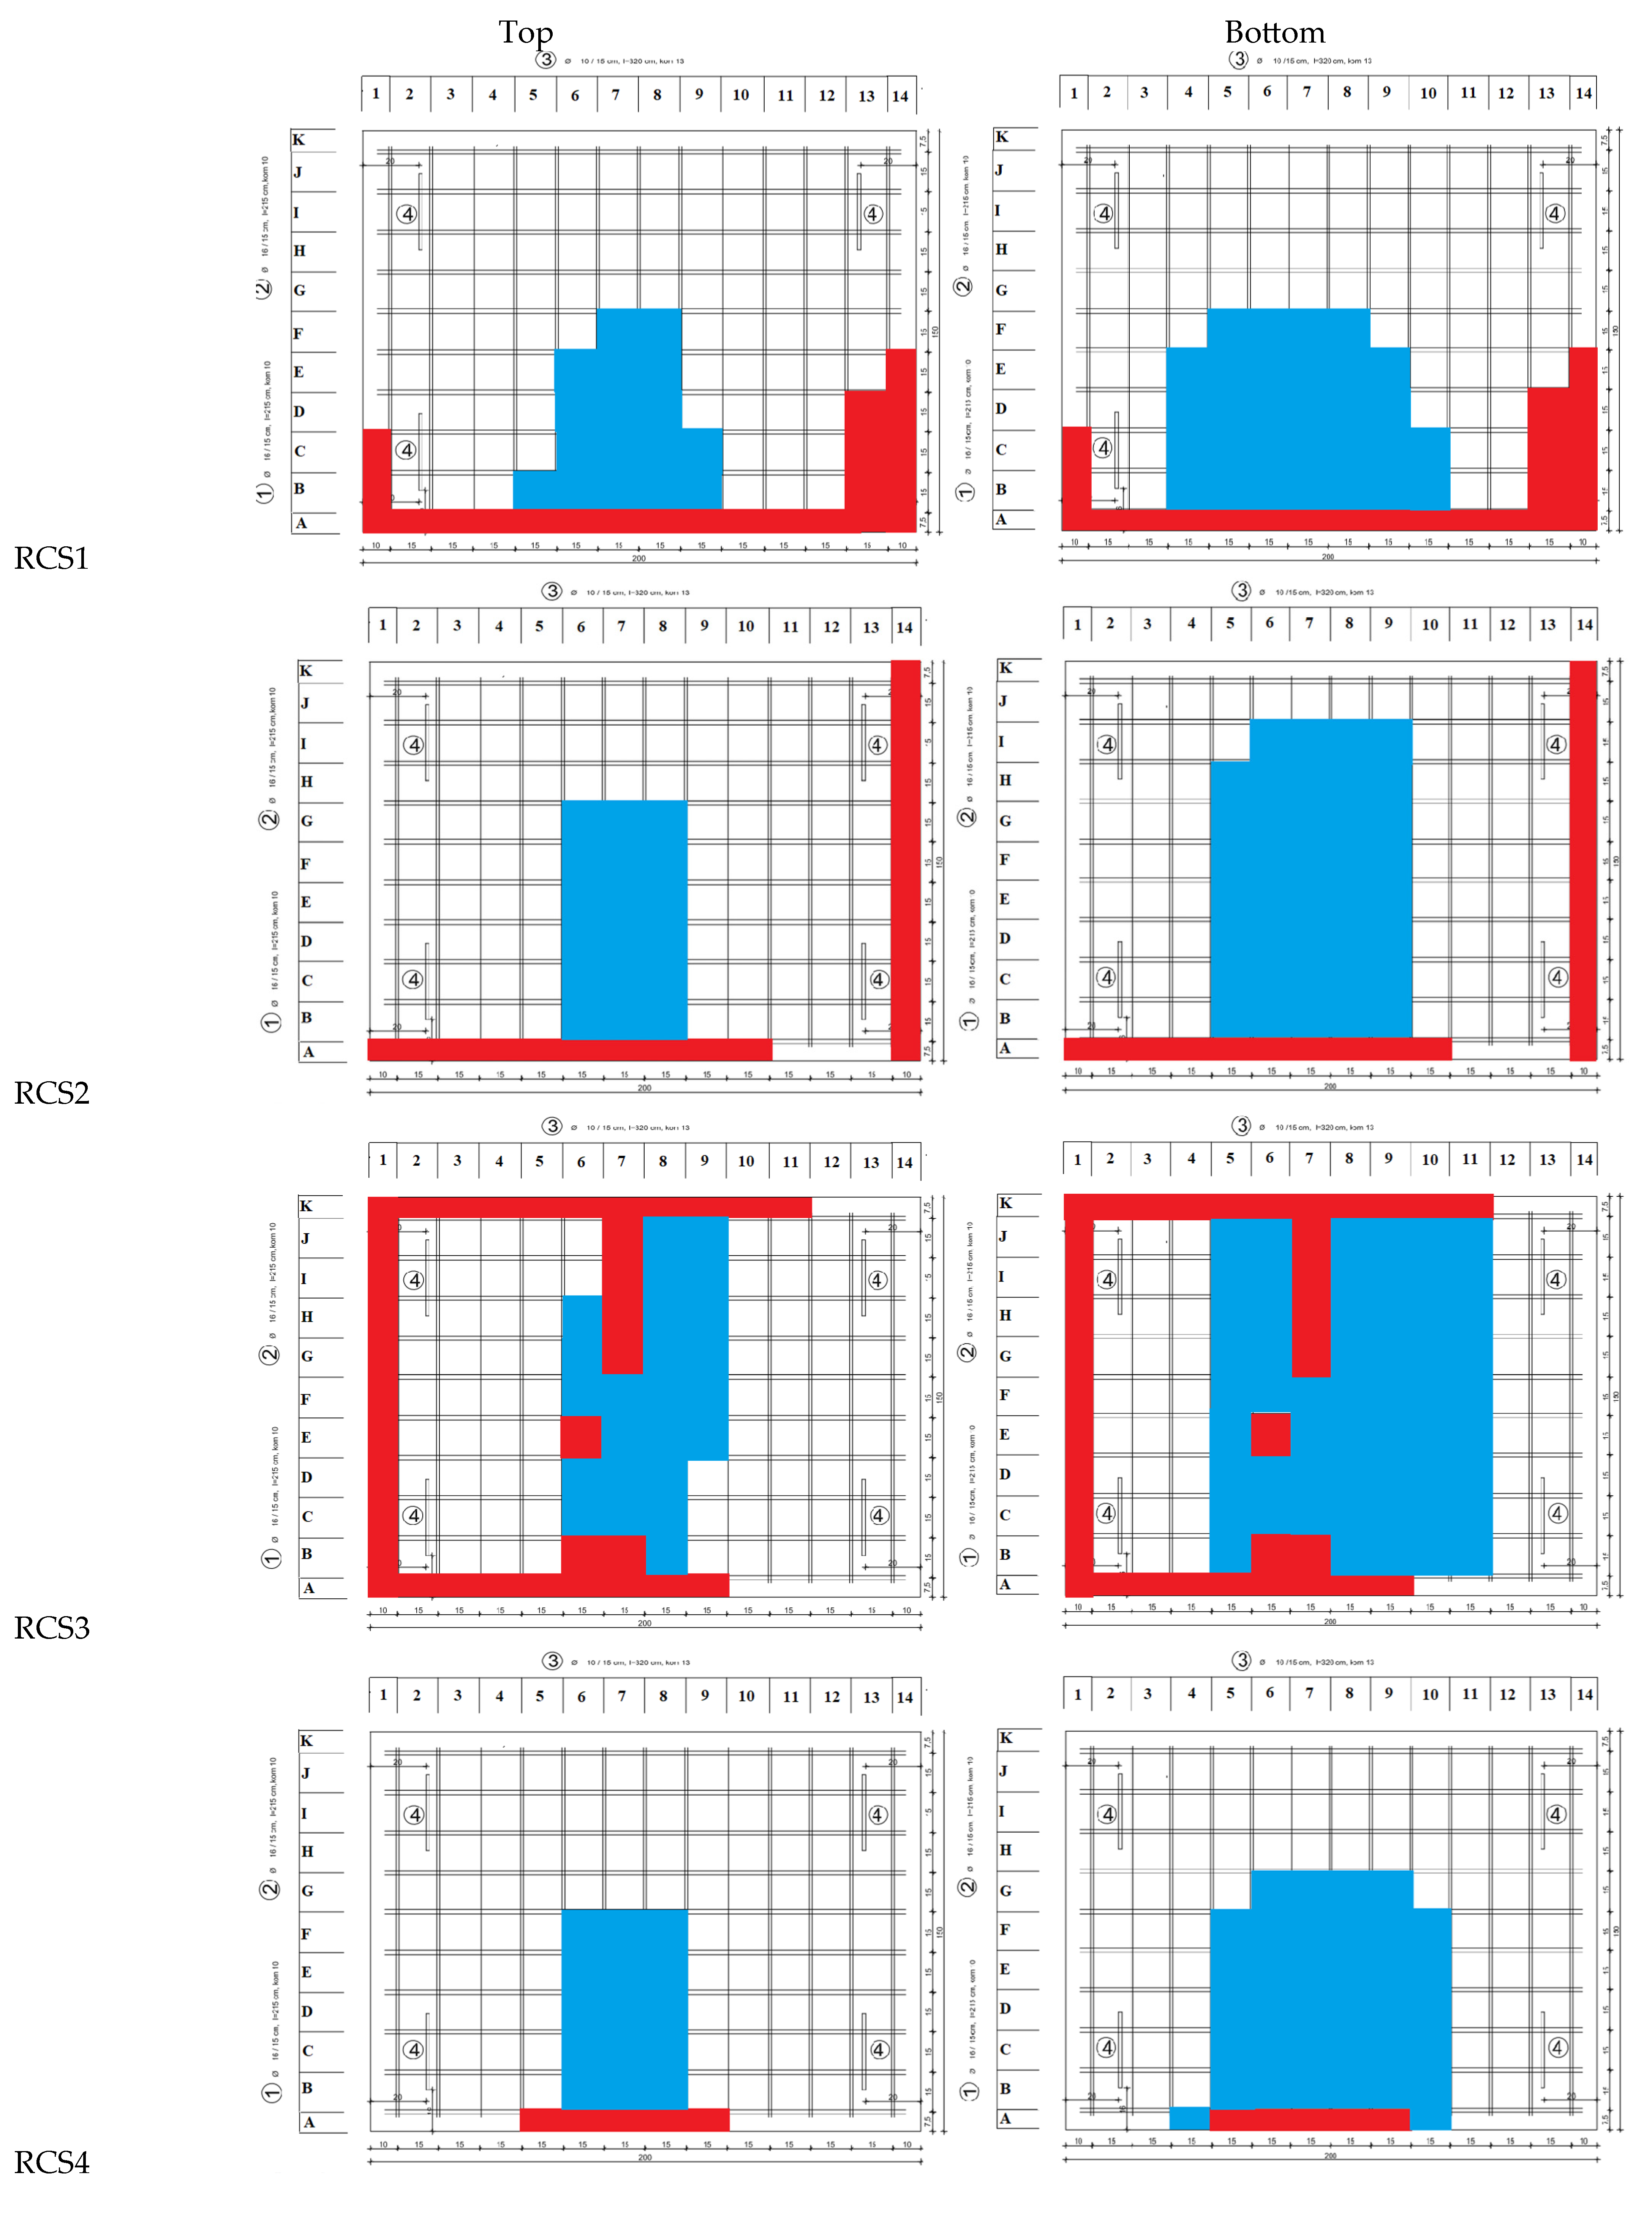
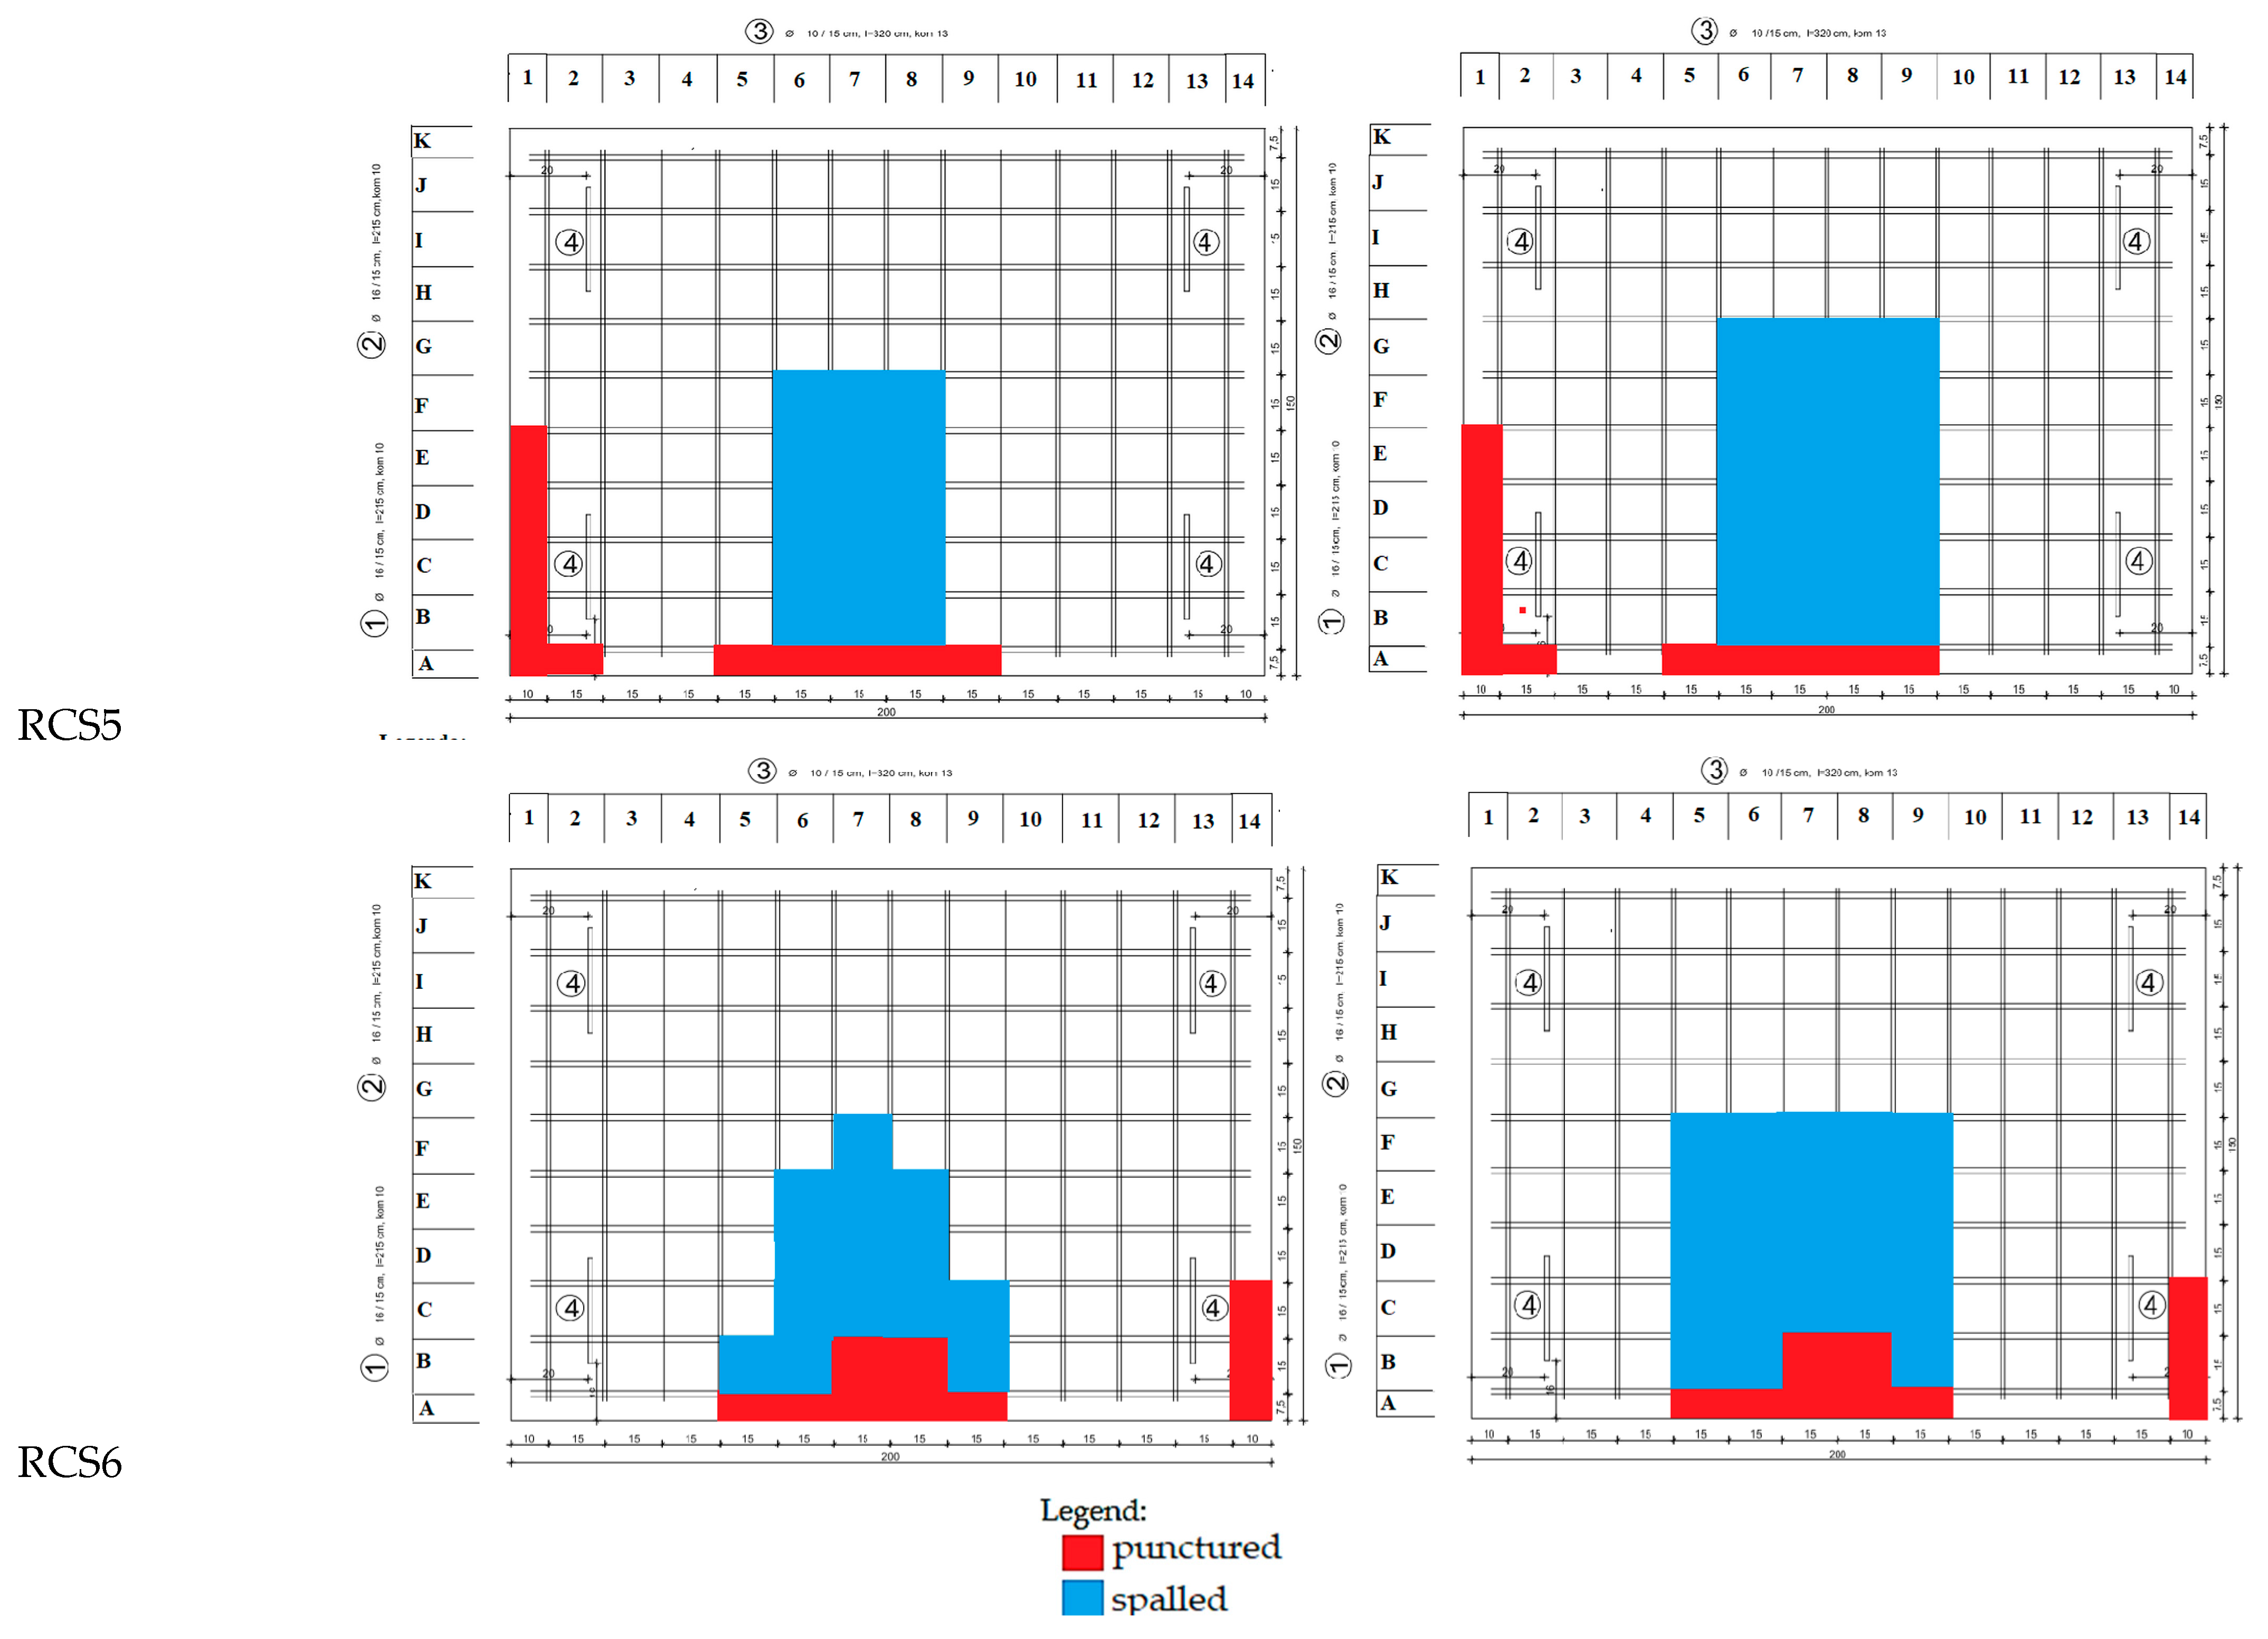
Figure 5.
Punctured and spalled surfaces on specimens of RC slabs on the upper (left) and lower (right) surfaces after explosive action.
Table 5.
Spalled and punctured surfaces of RC slabs due to explosive action.
A spalled surface implies the destruction of the concrete cover up to the reinforcement level or in some places even a few centimeters deeper than the reinforcement. A punctured surface is the destruction of concrete over the entire thickness of the RC slab, usually on the slab edges.
When analyzing the results of the RC slab samples, it is found that all the RC slab samples show major surface damage on the bottom side due to the explosion. This is a consequence of the lower tensile strength of the concrete compared to its compressive strength and the principle of the impact of contact detonation (Table 5; Figure 3, Figure 4 and Figure 5).
In the first part of the analysis, samples RCS1, RCS2, RCS4, RCS5, and RCS6 are considered because they contain a similar amount of explosive. The impacts of the compressive strength, presence, and type of fibers on the damage caused by the blasting effect are investigated. The analysis of the results of these samples shows that the highest surface damage occurs in samples RCS1 and RCS2, namely in slabs without fibers. It is obvious that the area of punctured concrete (8–10%) is significantly larger in these samples compared to the samples with fibers (2–4%). The surface area of the spalled concrete on the top side of all five samples is approximately the same. However, when comparing the surface area of the spalled concrete on the bottom side, it is noticeable that the results are similar for the samples without fibers and the samples with steel fibers (22–29% of spalled surface), and that they are larger compared to the samples with polypropylene fibers (18% of spalled surface). The FRC slabs (RCS4, RCS5, and RCS6) show significantly less surface damage. For the slab with steel fibers, the area of the punctured concrete is significantly smaller compared to the slabs with polypropylene fibers. However, the area of spalled concrete on the lower surface of the sample with steel fibers is significantly larger (Table 5; Figure 4 and Figure 5).
When considering the influence of the concrete class, i.e., the characteristic compressive strength, it is not possible to clearly determine how the compressive strength affects the resulting damage to the concrete. In other words, no significant differences are found in the spalled or punctured surface between the samples with different characteristic concrete compressive strengths (Table 5; Figure 4 and Figure 5).
After analyzing the results, it is found that the samples without fibers (RCS1 and RCS2) show the most severe concrete puncture on the side surfaces as a result of the explosive effect. The samples with polypropylene fibers (RCS5 and RCS6) have a lesser extent of concrete puncture on the side faces. Notably, in the case of the sample with steel fibers (RCS4), there is no puncture of the concrete at the edge of the slab (Figure 5).
Comparable test results were observed in previous studies [29,30,31], confirming that an increase in the proportion of polypropylene fibers leads to a reduction in the extent of damage. However, the results of the aforementioned tests showed that the addition of steel fibers did not lead to a reduction in damage [29,30,31]. This is in contrast to the results of this study, where specimens with steel fiber-reinforced concrete show less surface damage compared to specimens without fibers.
In the second part of the analysis, samples with steel fibers but with different amounts of explosives used, RCS3 and RCS4, are compared. As expected, the greatest destruction occurs in the sample with a larger amount of explosive (RCS3). A comparison between the damaged areas of RCS3 and RCS4 reveals that, for RCS3, the area of destruction is 167% larger on the top surface, while it is 110% larger on the bottom surface. For sample RCS3, the spalled area is 60% larger on both the top and bottom surfaces than for sample RCS4. The surface area of the punctured concrete in sample RCS3 is approximately 807% larger. It is crucial to emphasize that significant puncture of concrete occurs on the lateral sides (edge of slabs) of sample RCS3, while no such puncture is observed on the lateral sides in sample RCS4 (Table 5; Figure 4 and Figure 5).
In view of the fact that RCS3 uses about three times the amount of explosives compared to RCS4, the ratio of the damaged surfaces of the two plates is analyzed. It is found that the damaged surface on the upper side of RCS3 is about three times as large as that of RCS4 (r = ARCS3, damaged/ARCS4, damaged = 2.7) and the damaged surface on the bottom side is about twice as large (r = ARCS3, damaged/ARCS4, damaged = 2.1). In other words, the damaged top surface of sample RCS3 is about three times as large as the amount of explosive activated on it (Table 5; Figure 4 and Figure 5).
3.2. Schmidt Hammer Measurements
The rebound value, Q, is measured before and after the explosion on the top of each RC slab specimen. Q is measured before and after the explosion at the same predefined 52 measurement spots with ten impacts per spot for each RC slab specimen. At the place where the explosives are placed, six measurements are additionally carried out before the explosion to confirm the uniformity of quality. After the explosion, this part is damaged, so the tests could not be repeated at these spots. The results of testing the Q value before and after the explosion for each RC slab specimen are shown graphically in Figure 6. The mean Q value and the standard deviation of the Q value before and after the explosion are calculated for each RC slab specimen (Table 6). In addition, the ratio of the mean Q value after and before the explosion (rQ) and the ratio of the standard deviations of the Q value after and before the explosion (rϬQ) are calculated according to the following expression:
where Qa and Qb are the mean rebound values after and before the explosion and δQa and δQb are the standard deviation of the rebound values, Q, after and before the explosion, respectively. The idea is to use the rQ and rδQ ratios to identify possible changes in the uniformity of the concrete after the explosion (Table 6).
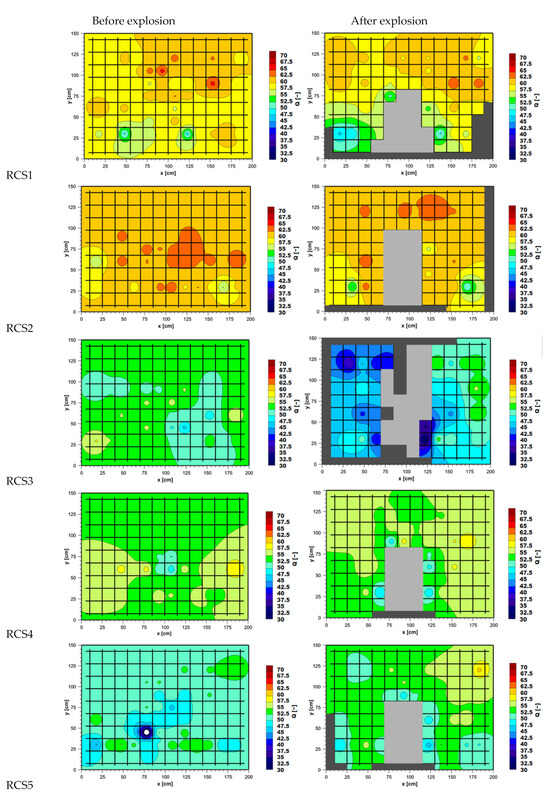

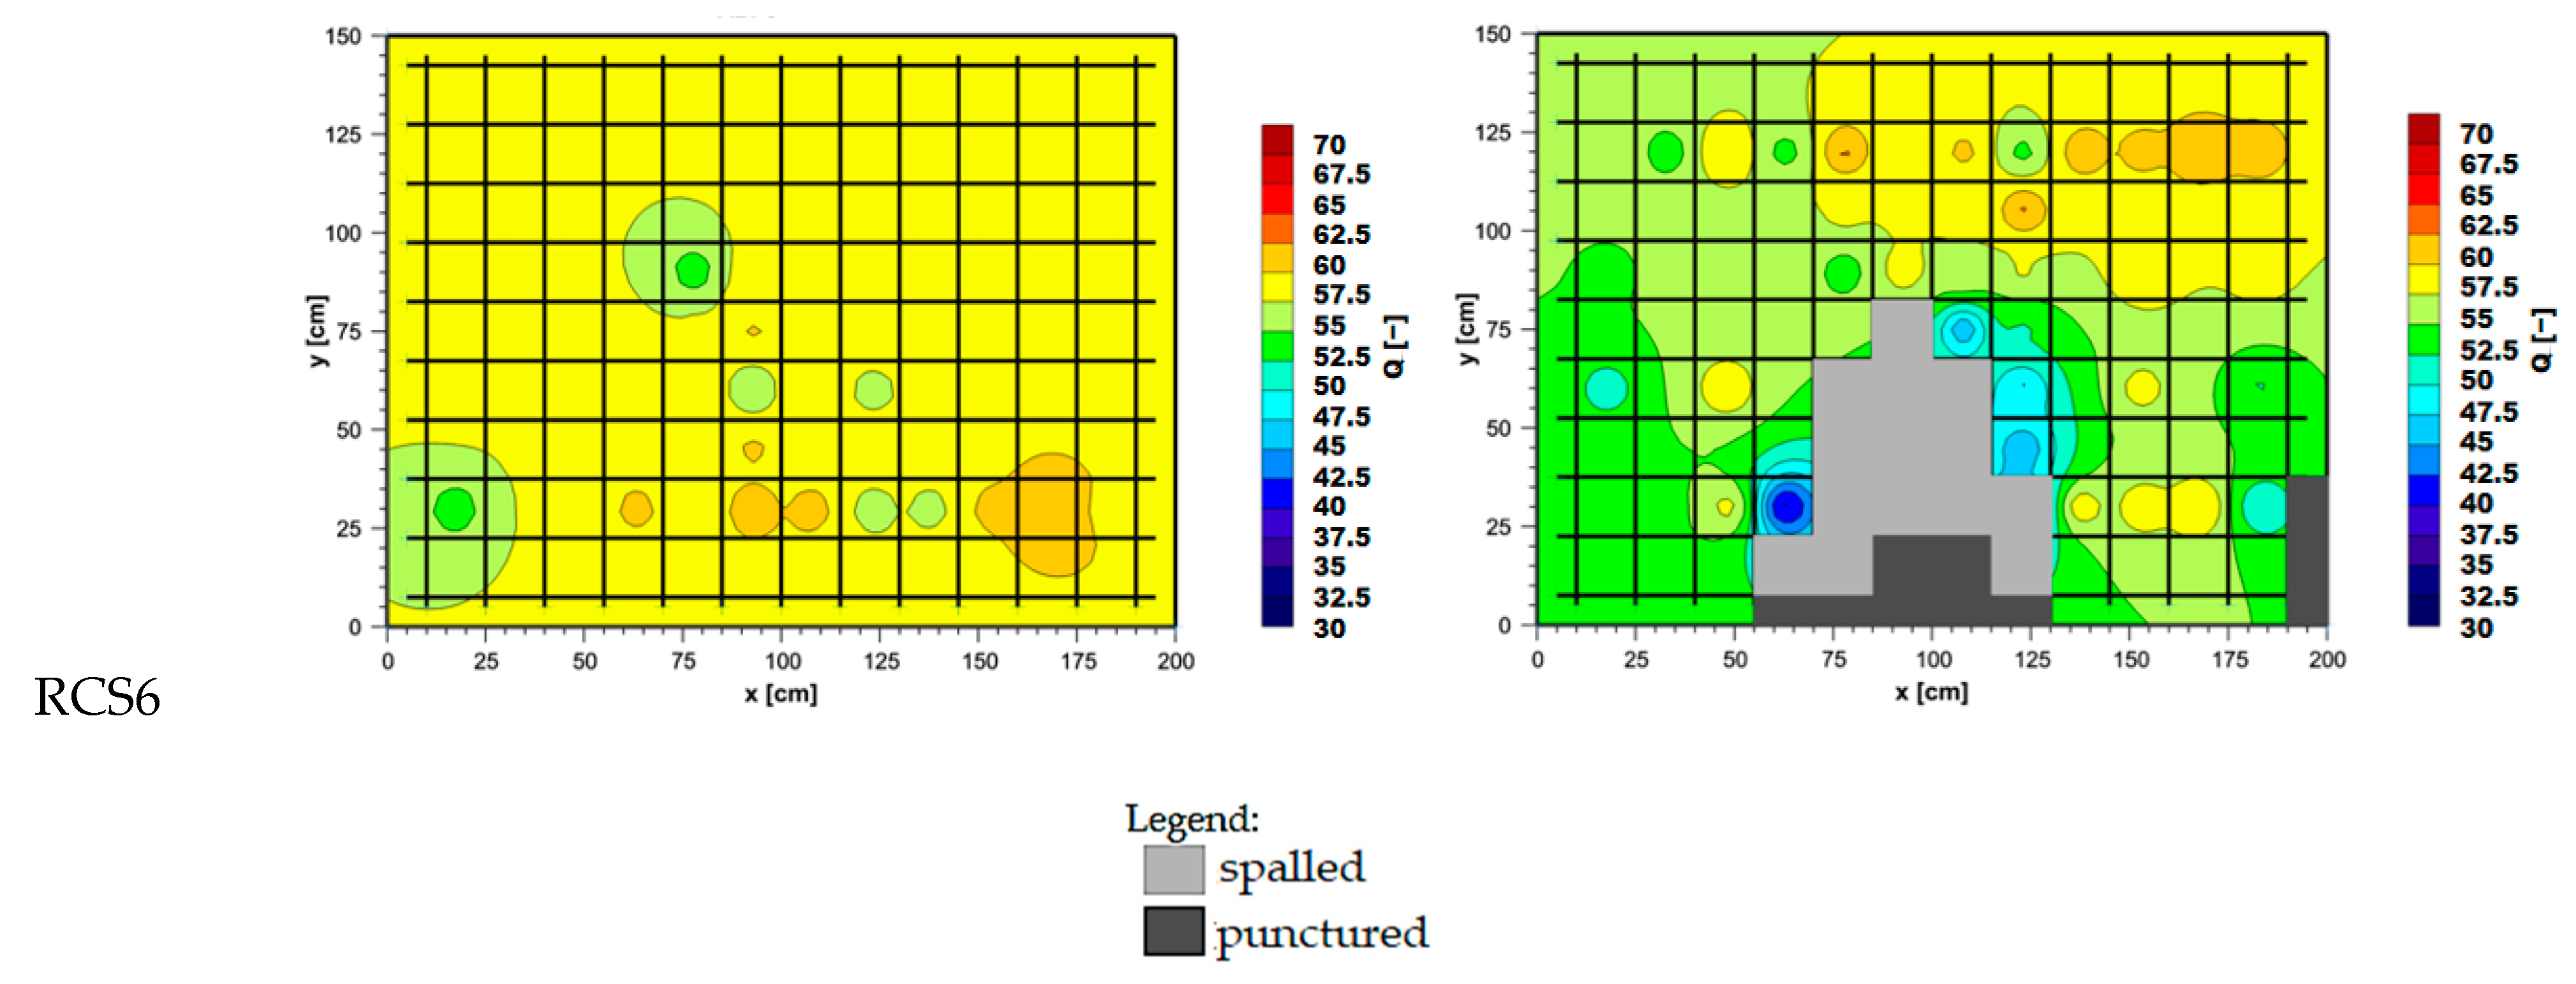
Figure 6.
The rebound values Q measured before (left) and after (right) the explosion on the top of each RC slab specimen.
Table 6.
Results of non-destructive testing before and after explosion.
By analyzing the RC slab specimens exposed to a conventional amount of explosives (RCS1, RCS2, RCS4, RCS5, and RCS6), it is clear that the most significant reduction in Q value due to explosives exposure is observed in specimen RCS6, with an rQ value of 0.95. Conversely, the strongest Q value increase occurs in RCS5, where the calculated rQ value reaches 1.05. The highest rϬQ value is measured for specimen RCS6 at 2.75. This means that the explosion effect on this specimen led to the greatest development of cracks and damage to the concrete, resulting in uneven strength and quality. In contrast, the lowest rϬQ value is 0.63 and is observed in the RCS5 specimen. This result indicates that, as a result of the explosive action on sample RCS5, there is a uniformization of the strength and quality of the concrete, which deviates from the expectations and the results of measurements on other samples. Therefore, it can be concluded that a gross error occurred. However, when looking at the values of Q before and after the explosion, there is not a significant difference in the values (Figure 6; Table 6).
When examining the area where the explosion affected the Q value, it is found that this zone is relatively uniform in size for all specimens. The sharpest drop in Q value is primarily concentrated along the entire abscissa axis (the longer side of a slab) and extends up to approximately 110 cm along the ordinate axis (the shorter side of the board). Beyond this point along the ordinate axis, the Q value remains mostly unchanged, apart from occasional local increases in the observed value (Figure 6).
For samples RCS3 and RCS4, the rQ ratios are 0.89 and 1.01, while the rϬQ ratios are 2.86 and 1.22, respectively. Through a comparison of the measurement outcomes between the RCS3 and RCS4 slabs, it is determined that the value of rQ in RCS4 is approximately 12% higher. The value of rϬQ in specimen RCS3 is about 134% higher than the value of rϬQ observed in specimen RCS4. The reason for this is greater local damage in RC slab specimen RCS3 due to the triple amount of explosives.
It is important to know that the Schmidt hammer device typically exhibits minor oscillations during Q value measurements. In addition, the needle may come into contact with the cement matrix, aggregates, or fibers near the surface during the test procedure, which may affect the Q value results. Therefore, it is important not to evaluate the results of the Schmidt hammer test in isolation but to compare them with the measurements of the electrical resistivity of the concrete and the velocity of the ultrasonic wave data.
3.3. Electrical Resistivity of Concrete
The electrical resistivity, ρ, is measured before and after the explosion on the top of each RC slab specimen. The electrical resistivity is measured at 48 predefined measurement spots with three tests per spot for each RC slab specimen. At the place where the explosive is placed, an additional four measurements are conducted before the explosion to confirm the uniformity of quality. As expected, this part was damaged after the explosion, so the tests could not be repeated at these four spots.
The results of measuring the electrical resistivity before and after the explosion for each RC slab specimen are shown graphically in Figure 7. The mean value and the standard deviation of the electrical resistivity, ρ, before and after the explosion are calculated for each RC slab specimen (Table 6). In addition, the ratio of the mean ρ value after and before the explosion (rρ) and the ratio of the standard deviations of the ρ value after and before the explosion (rϬρ) are calculated according to the following expression:
where ρa and ρb are the mean values of electrical resistivity after and before the explosion and δρa and δρb are the standard deviation of the electrical resistivity, ρ, after and before the explosion, respectively. The idea is to use the rρ and rδρ ratios to identify possible changes in the uniformity of the electrical resistivity of concrete after the explosion as a sign of internal damage (cracks) in concrete.
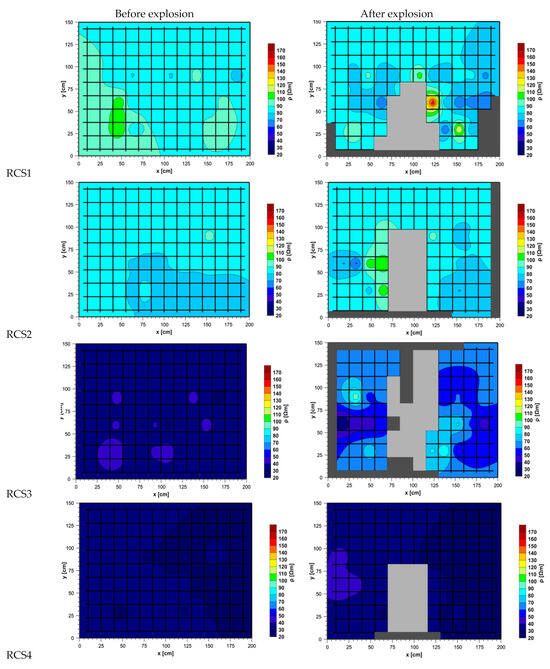
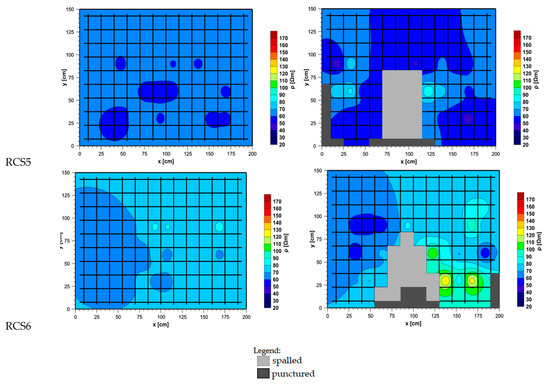
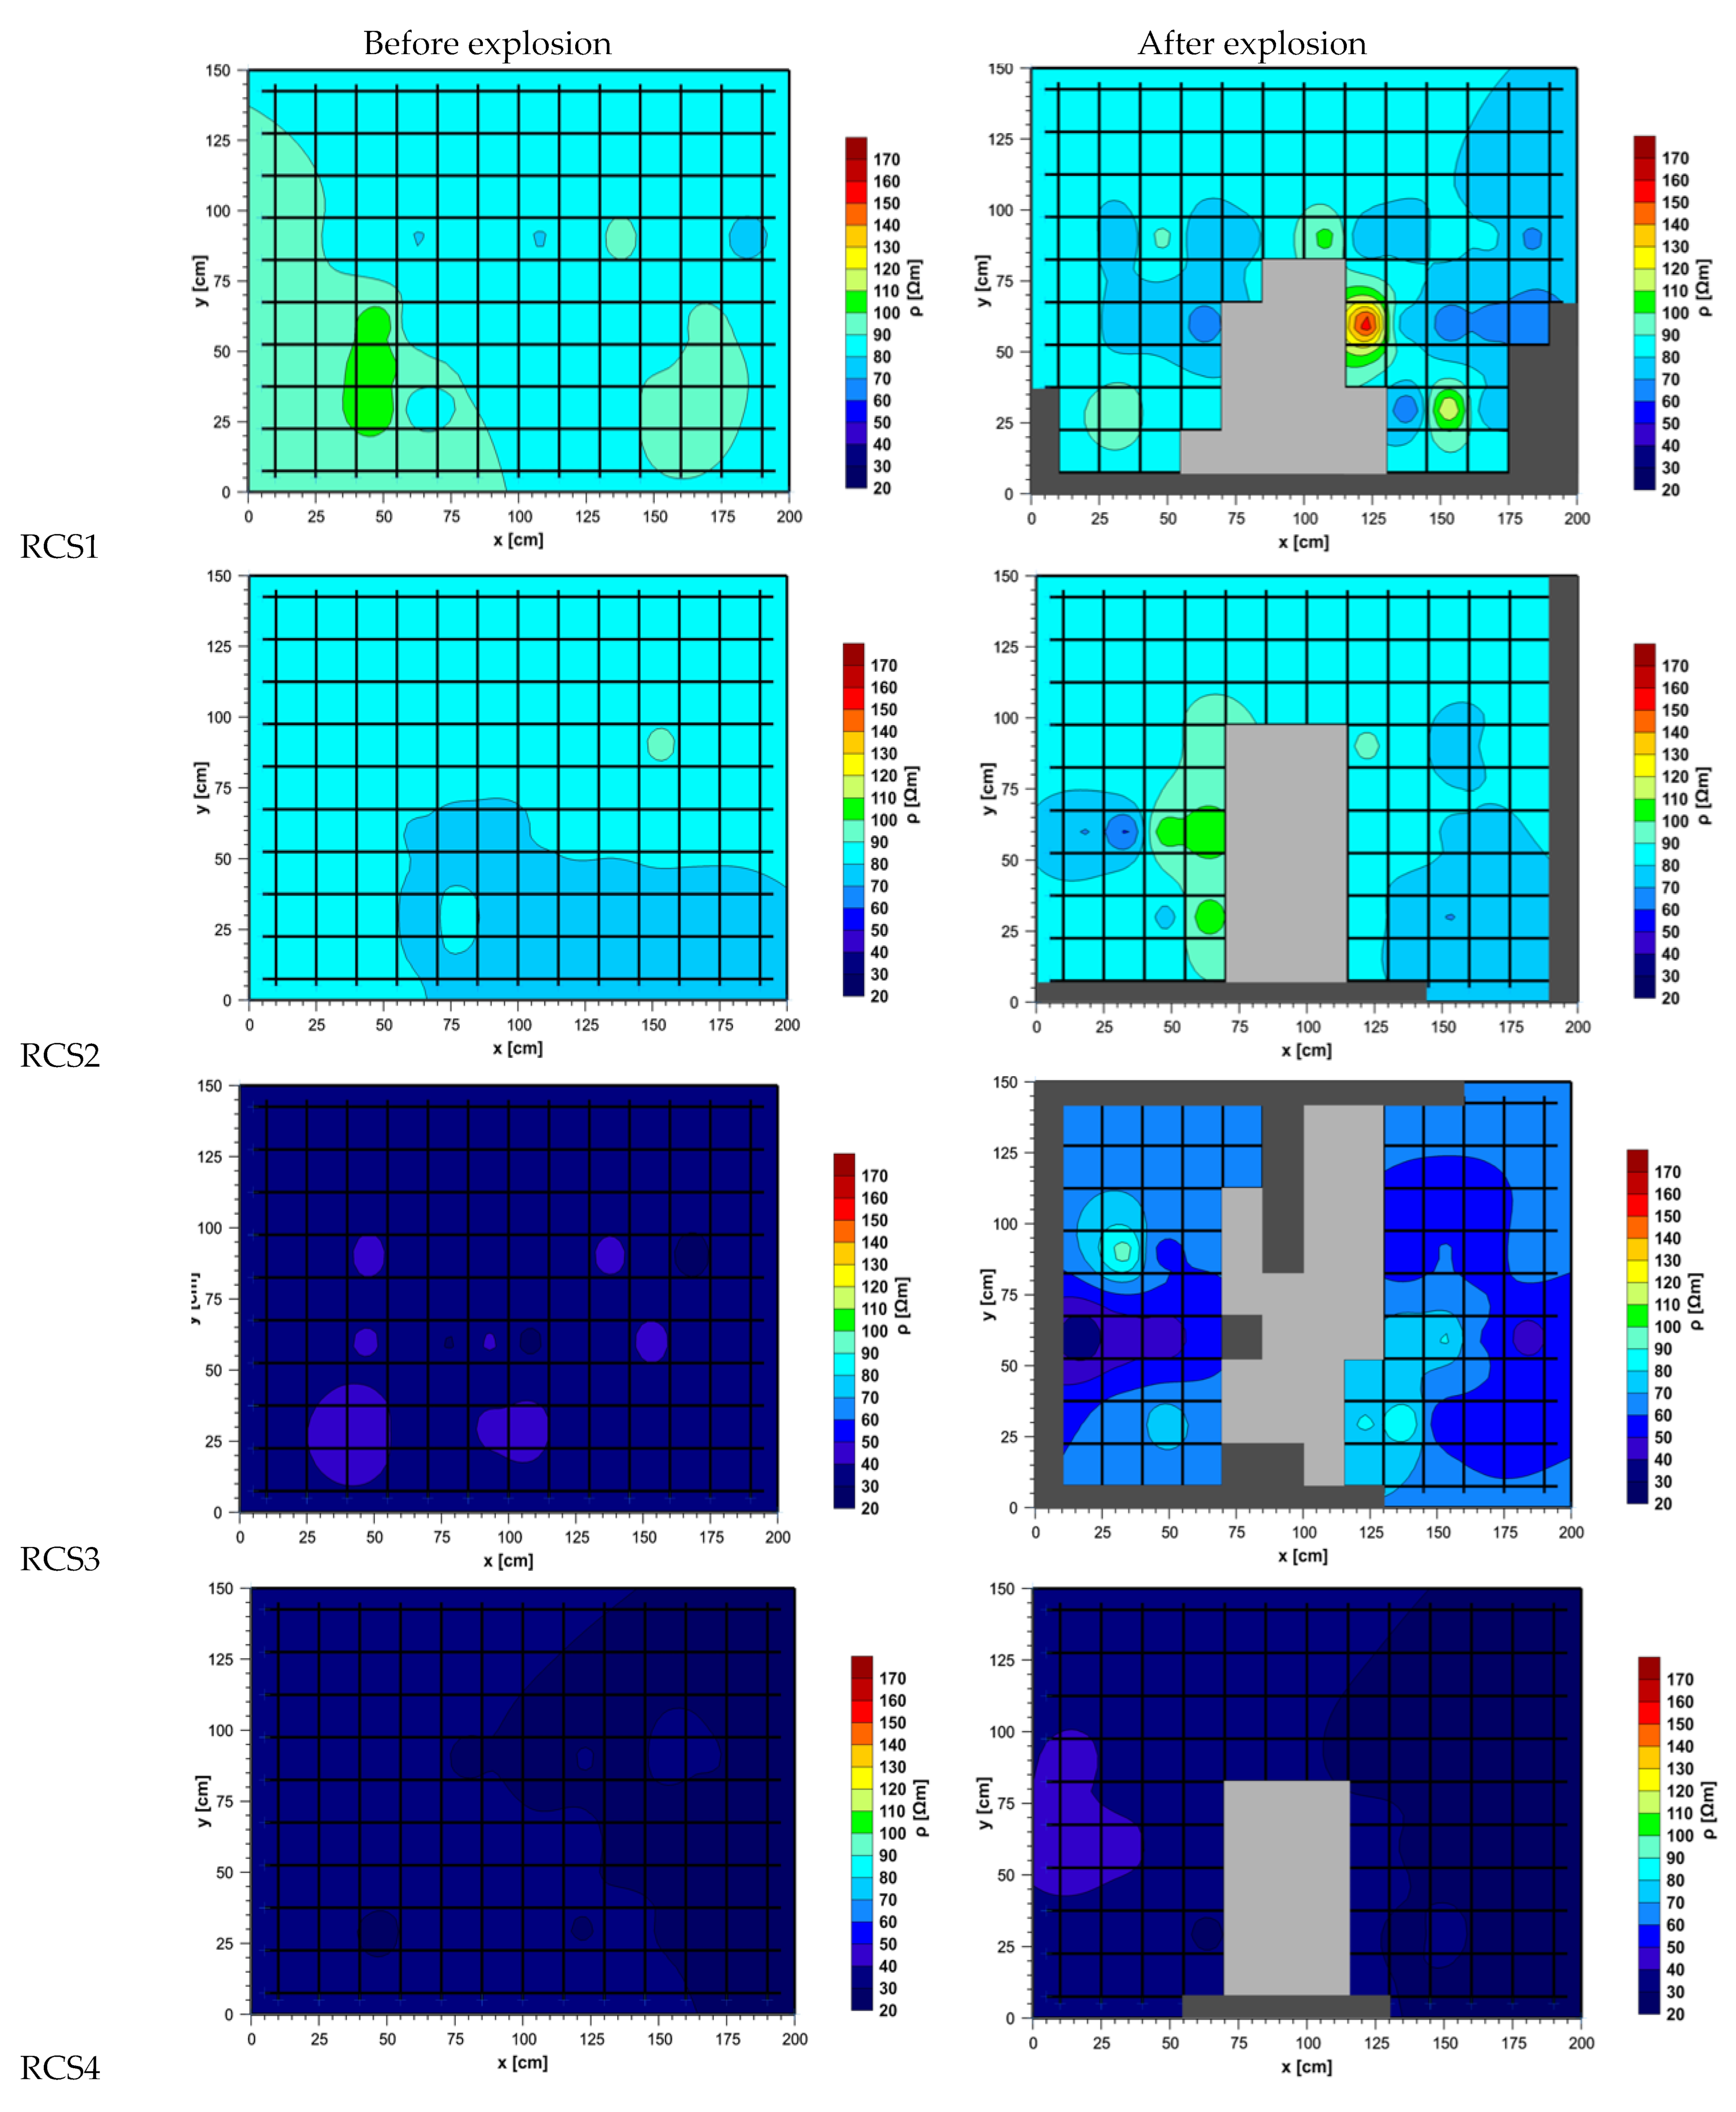
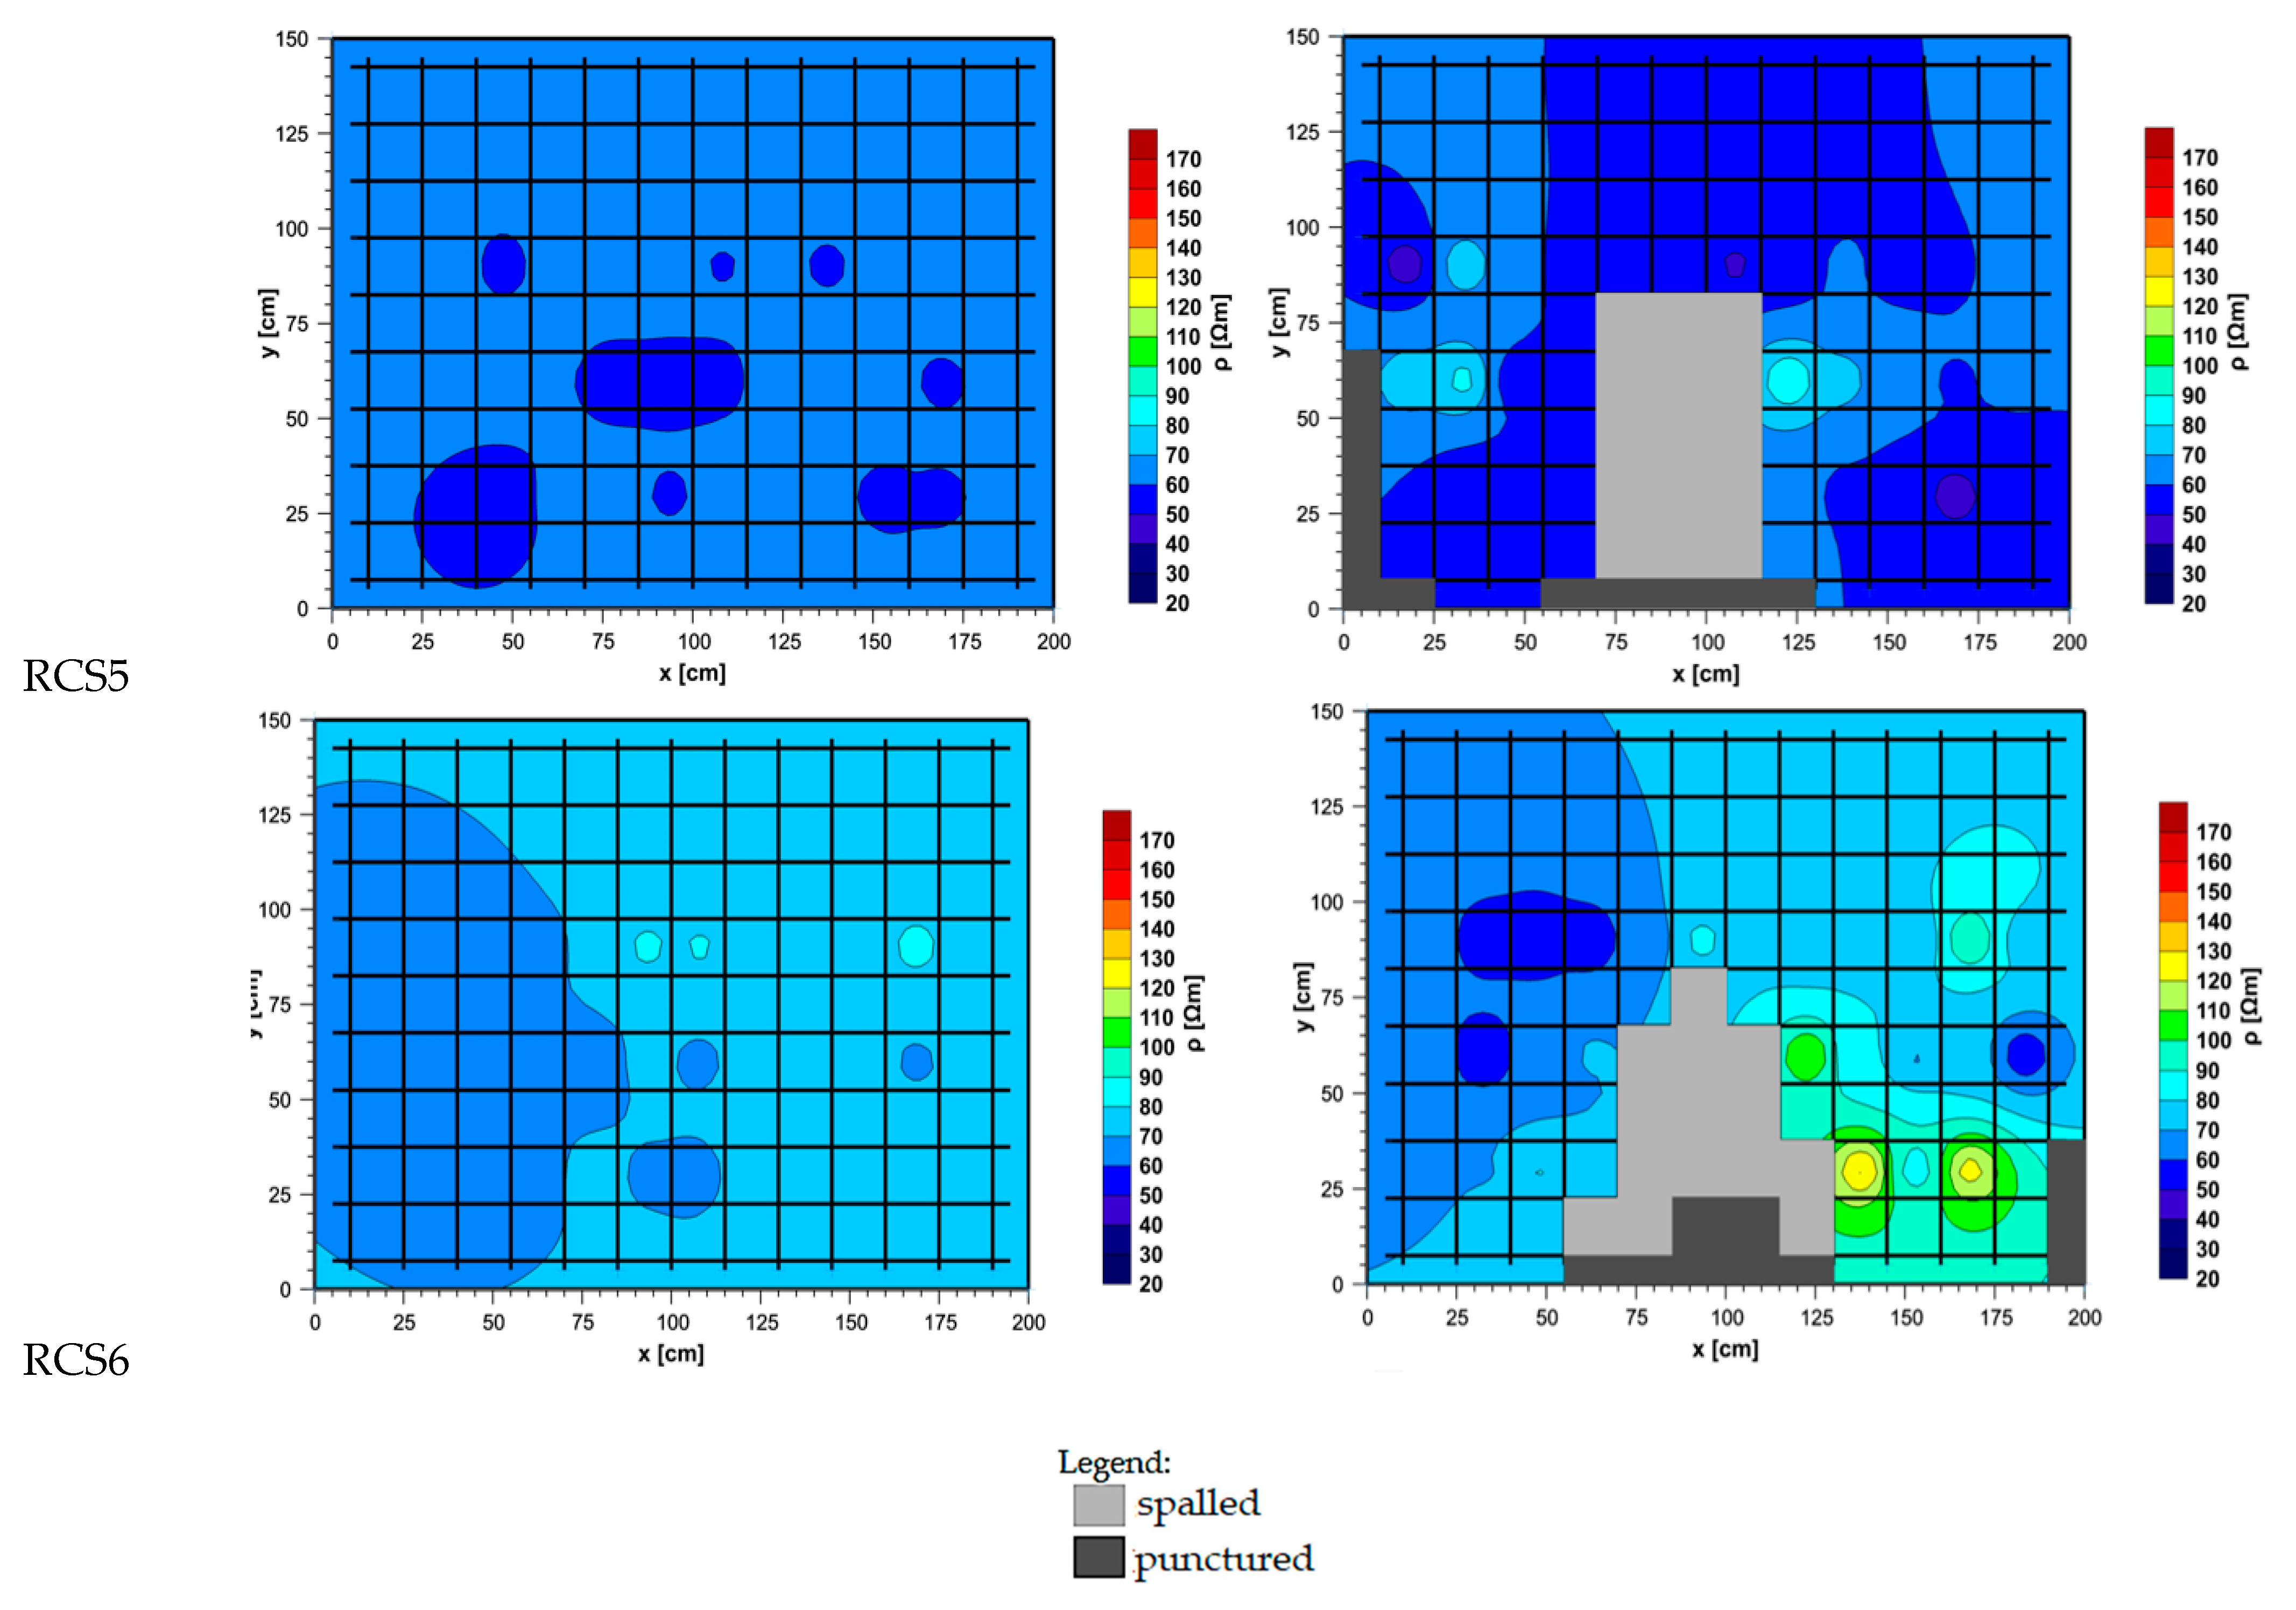
Figure 7.
Electrical resistivity of the reinforced concrete slabs before (left) and after (right) explosive action.
Measurements before the explosion showed that concrete slabs with polypropylene fibers (RCS5 and RCS6) have slightly lower electrical resistivity compared to concrete slabs without fibers (RCS1 and RCS2). However, concrete slabs with steel fibers (RCS3 and RCS4) show the lowest electrical resistivity, which is due to the high electrical conductivity of steel (Figure 7). Namely, it is known from the literature [45,46] that steel fibers as a metallic conductor lead to significant reductions in electrical resistivity of concrete in comparison to concrete without steel fibers. Measurements before the explosion also confirm this (Figure 7) since all the other parameters influencing electrical resistivity, e.g., relative humidity, are the same for all the specimens.
From the analyzed data, it can be deduced that, when using conventional amounts of explosives (RCS1, RCS2, RCS4, RCS5, and RCS6), the most significant reduction in the mean value of ρ occurs in specimen RCS1, with a recorded rρ value of 0.94. Conversely, the greatest increase in ρ is observed in specimen RCS6, where the rρ value reaches 1.05.
Test specimen RCS5 exhibits the highest rϬρ value of 4.48, signifying considerable internal damage and the formation of numerous cracks resulting from explosive action. Consequently, this leads to a reduction in the compactness of the concrete structure. In contrast, the lowest rϬρ value of 1.69 is recorded for RCS4 (Figure 7; Table 6).
Upon comparing the zones affected by explosive action on RC slab specimens, it is observed that the most extensive zone is identified in specimens RCS5 and RCS6. The zones of influence are slightly smaller in other specimens (RCS1, RCS2, and RCS4). Beyond approximately 120.00 cm along the ordinate axis, notable fluctuations in the ρ value are absent (Figure 7; Table 6).
For sample RCS3, the rρ ratio is 1.70, while the rϬρ ratio is 2.85. By analyzing and comparing the ρ values in specimens RCS3 and RCS4, it is determined that the rρ ratio in RCS3 is nearly 63% higher. The rϬρ value in test specimen RCS3 exceeds that of RCS4 by almost 69% (Figure 7; Table 6). An increase in the electrical resistivity of concrete in the sample with the highest mass of explosive (RCS3) may indicate that more energy as well as more heat were released during the explosion, which reduced the water content in the concrete and thus contributed to the increase in the electrical resistivity of the concrete after the explosion.
It is worth noting that it rained before the explosion, which led to an increase in the humidity of the specimens and a subsequent decrease in concrete resistivity. During the tests after the explosion, the moisture of the specimens was significantly lower, which led to an increase in the electrical resistivity of the concrete. For the above reasons, the results of the electrical resistivity test cannot be considered fully authoritative for assessing the internal damage caused by the explosion. Instead, they must be compared with the results of other NDT methods carried out.
3.4. Velocity of the Ultrasonic Wave
The velocity of the ultrasonic wave, v, is measured before and after the explosion through the RC slab thickness of 25 cm. The velocity of the ultrasonic wave is measured at 44 predefined measurement spots with three tests per spot for each RC slab specimen. At the place where the explosive is placed, an additional six measurements are conducted before the explosion to confirm the uniformity of quality. As expected, the upper or lower surfaces of this part were damaged after the explosion, so the tests could not be repeated at these six spots.
The results of measuring the velocity of the ultrasonic wave before and after the explosion for each RC slab specimen are shown graphically in Figure 8. Dynamic moduli of the elasticity of concrete before and after the explosion are calculated for each measurement based on Equation (6). Furthermore, the mean value and the standard deviation of the velocity of the ultrasonic wave, v, and dynamic modulus of elasticity, Ed, before and after the explosion are calculated for each RC slab specimen (Table 6). In addition, the ratio of the mean v and Ed values after and before the explosion (rv, rEd) and the ratio of the standard deviations of the v and Ed values after and before the explosion (rϬv, rϬEd) are calculated according to the following expression:
where va and vb are the mean values of velocity of the ultrasonic wave after and before the explosion, δva and δvb are the standard deviation of the velocity of the ultrasonic wave, v, after and before the explosion, Ed,a and Ed,a are the mean values of the dynamic modulus of elasticity of concrete after and before the explosion, and δEd,a and δEd,b are the standard deviation of the dynamic modulus of elasticity of concrete, Ed, after and before the explosion, respectively. The idea is to use rv, rδv, rEd, rδEd ratios to identify possible changes in the uniformity of the microstructure of concrete after the explosion as a sign of internal damage (cracks and voids) in concrete.

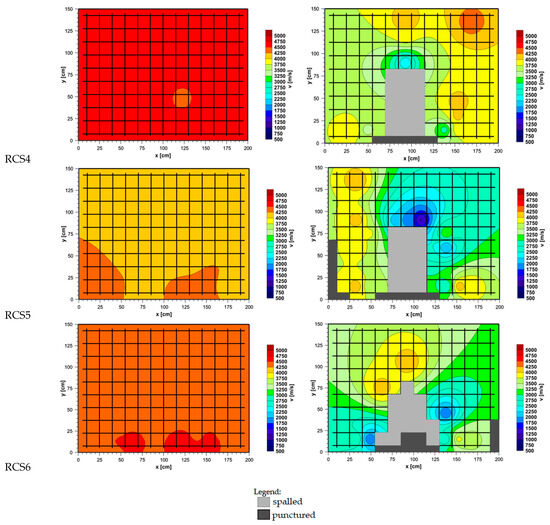
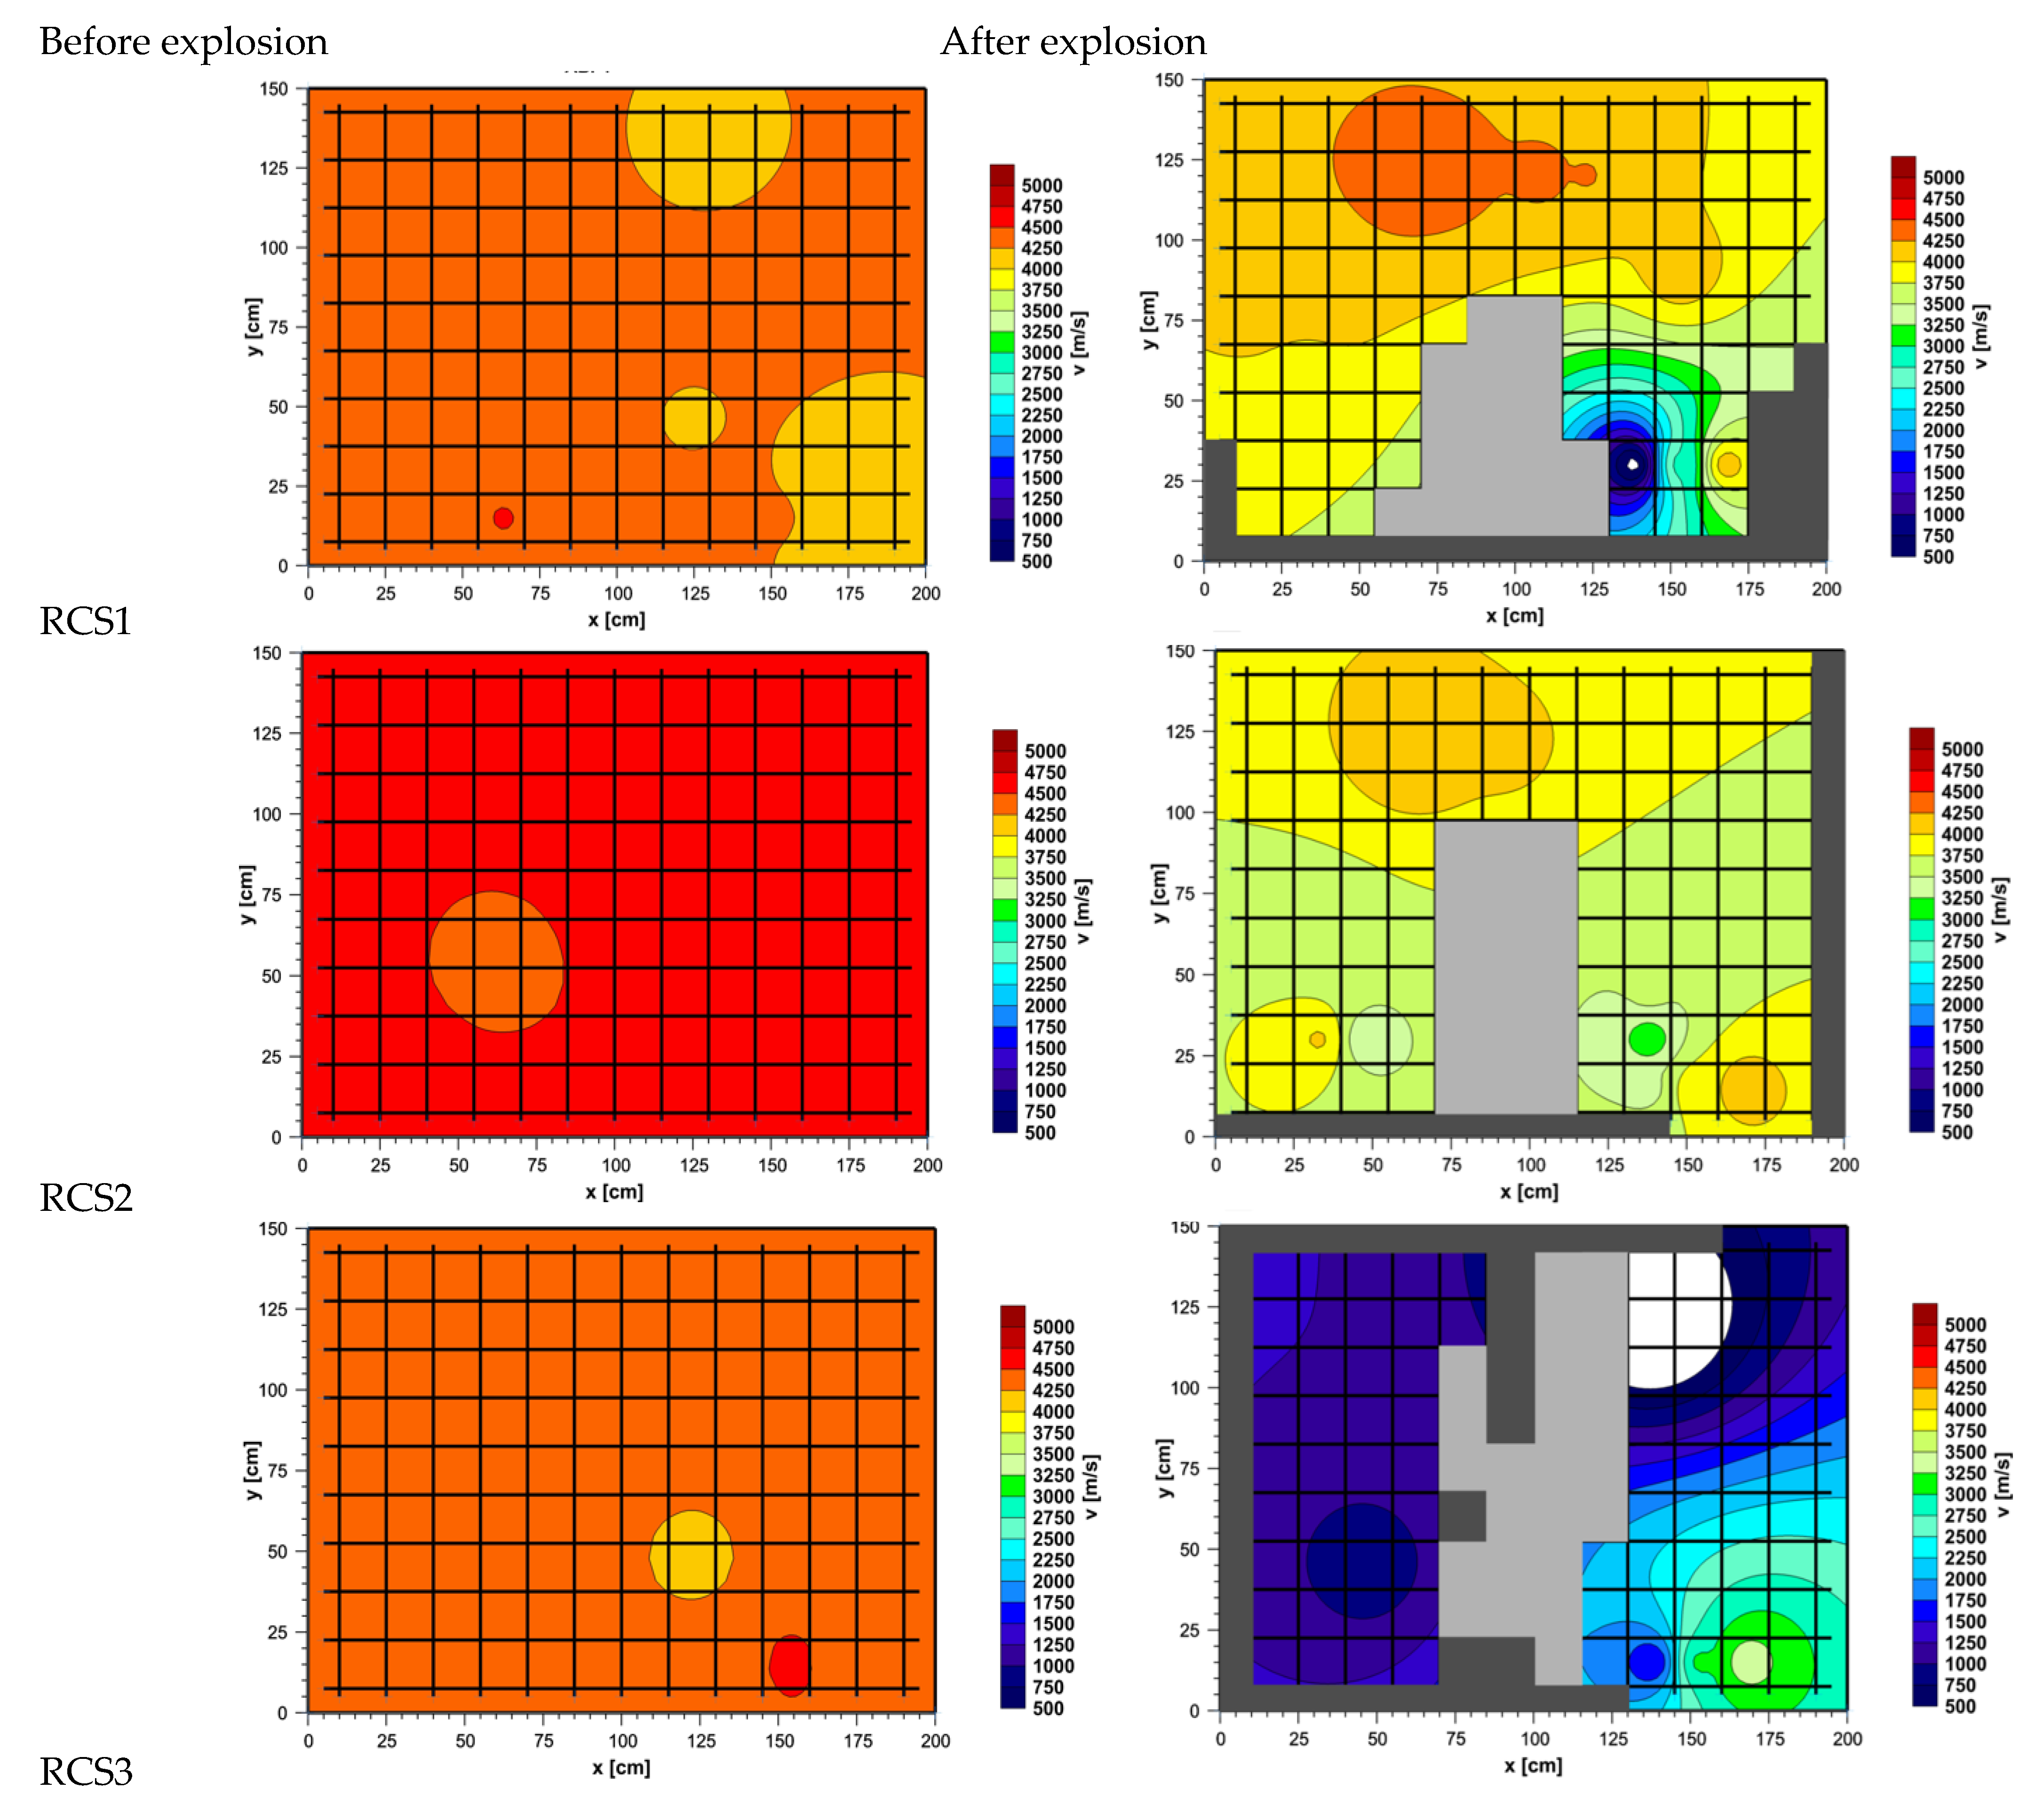
Figure 8.
Velocity of the ultrasonic wave through the concrete in specimens of reinforced concrete slabs before (left) and after (right) explosive action.
The measurements of the velocity, v, of the ultrasonic waves passing through the concrete slab before the explosion indicated uniform and satisfactory quality of the embedded concrete in all the RC slabs tested. In each measurement area, the pre-explosion v value is above 4000 m/s, while, after the explosion, the measured velocity decreases to 428 m/s for the specimens with a conventional amount of explosive, while the minimum velocity of 133 m/s is measured for specimen RCS3 with three times the amount of explosive (Figure 8; Table 6). The situation is similar to the dynamic modulus of elasticity Ed, which is calculated based on the velocity of the ultrasonic waves. Before the explosion, the dynamic modulus of elasticity of all the specimens ranged between 37 GPa and 47 GPa, while, after the explosion, the lowest values of the dynamic modulus of elasticity, Ed, are 0.41 GPa and 0.04 GPa for specimens with conventional and increased amounts of explosive, respectively.
When analyzing the data, it is found that the quality of the concrete deteriorated from good to poor quality for all the RC slab specimens (RCS1, RCS2, RCS4, RCS5, and RCS6) during the demolition of the elements with a conventional amount of explosive. The most significant reduction in the v value is observed in the RCS6 specimen, with a corresponding rv ratio of 0.70. In contrast, the smallest reduction in the v value is found in the RCS1 specimen, which has an rv ratio of 0.86 (Figure 8; Table 6). The highest rϬV ratio, 21.11, is found in RCS6. The lowest rϬV ratio of 7.48 is found in the RCS2 sample.
According to the criteria listed in Table 4, the most significant deterioration in concrete quality, which transitioned from good to poor, is observed in the RCS5 specimen. Approximately 1.16 m2 (39%) of the surface shows poor concrete quality. In contrast, the RCS2 specimen shows no areas where the concrete quality decreased from good to poor (Figure 8; Table 6).
The most extensive area of deterioration in concrete quality from good to medium is found in the RCS4 specimen. More specifically, approximately 2.11 m2 (70%) of the surface has a medium concrete quality after the explosive impact. In contrast, the smallest area showing a medium level of deterioration due to the impact of the explosives is found in the RCS1 sample. Here, the concrete of medium quality covers around 0.97 m2 (32%) after the explosion (Figure 8).
In addition, RCS1 has the widest zone in which the concrete quality remains good due to the influence of the explosion. After the explosion, approximately 1.14 m2 (38%) of the RCS1 specimen surface had good concrete quality. In contrast, the smallest zones with the least impact of the explosive are found in the RCS5 and RCS6 specimens. These specimens exhibit good concrete quality over approximately 0.10 m2 (3%) of the surface (Figure 8).
Since the Ed value depends on the v value, the lowest rEd ratio of 0.52 is observed in slab RCS6, which also coincided with the smallest rv value. In contrast, the highest rEd ratio of 0.81 is recorded for RCS1, which also reflects the highest rv value.
For sample RCS3, the rV ratio is 0.41, while the rϬV ratio is 11.08. By comparing the analyzed data from specimens RCS3 and RCS4, it is observed that the value of rv in RCS3 is 50% lower compared to RCS4. It is essential to highlight that, following the explosive event in RCS3, the quality of the concrete is deemed poor, and there are no instances of good concrete quality recorded at any measurement point (Figure 8). In contrast, in RCS4, the concrete quality is rated as medium. The value of rϬv in RCS4 exceeded that in RCS3 by 69%.
3.5. Comprehensive Analysis of the Results
Various methods are used to analyze damage after explosions. Visual inspection and measurement of damaged areas are sufficient to analyze visible damage: spalled and punctured surfaces where NDT cannot be used.
A punctured surface, i.e., a completely broken part of the RC slab specimen over the entire thickness, is the most severe form of visible damage. This complete breaking of the concrete occurs at the edge parts of the slab where there are no reinforcement bars to take over the large shear and tensile stresses created after the detonation. If we compare the specimens with a similar amount of explosive (all the specimens except RCS3), slabs with polypropylene fibers (RCS5 and RCS6) have approximately two times less punctured concrete area, while slabs with steel fibers (RCS4) have five times less punctured concrete compared to RC slabs without fibers. On the other hand, if we compare the punctured areas on slabs with steel fibers (RCS3 and RCS4), slab RCS3 (where three times the amount of explosive is applied) results in a nine times larger area of punctured concrete.
When analyzing the influence of the compressive strength of the concrete on the damage after the explosion, we can compare two pairs of samples: (1) samples without fibers—RCS1 with concrete class C40/50 and RCS2 with concrete class C50/60—and (2) samples with polypropylene fibers—RCS5 with concrete class C35/45 and RCS6 with concrete class C50/60. A pair of samples with steel fibers (RCS3-4) cannot be compared in terms of the effect on compressive strength as the same amount of explosives was not used. The percentage of punctured surface for samples without fibers is 10.25% for the lower concrete class (RCS1) and 8.63% for the higher concrete class (RCS2), while, for slabs with polypropylene fibers, the percentage of punctured surface is 4.25% for the lower concrete class (RCS5) and 4.63% for the higher concrete class (RCS6). Hence, according to the results of the presented two pairs of slab specimens, the concrete classes have no influence on the punctured parts of the RC slabs due to an explosion.
After the explosion, regardless of the fiber content and compressive strength, the tops of the slabs do not show a large difference in the spalled area of the concrete compared to the bottom of slabs and amount up to about 10–14%. Even for the slab with three times the amount of explosive (RCS3), the spalled surface is only 60% larger than for the same RC slab (RCS4) with a normal amount of explosive.
However, the spalled concrete areas on the bottom of the slabs are larger than those on the top, and greater differences are observed between the samples: for slabs without fibers (RCS1-2) and with steel fibers (RCS3-4), the lower spalled area is twice as large as the upper one, while, for slabs with polypropylene fibers (RCS5-6), the percentage of spalled area is 60% higher than the upper areas.
In conclusion, when all the visible damage (punctured and spalled areas of concrete) is taken into account for the same amount of explosives, the most damage is recorded in slabs without fibers, RCS1-2 (23% of upper and 33–38% of lower surface), and the least in slabs with fibers, RCS4-6 (13-15% of upper and 23–28% of lower surface). When comparing slabs with steel fibers (RCS3 and RCS4), three times the amount of explosive leads to a nine times larger punctured concrete area, while the increase in area on the top and bottom of the slabs is only 60%. Based on the analysis of the visible damage, concrete slabs with fibers have better resistance to blast effects, whereas concrete slabs with steel fibers are preferred due to the lower proportion of completely broken slab parts (punctured concrete) caused by the explosion. Better resistance to explosive action in concrete slabs with added fibers compared to elements without added fibers was also observed in other research [28,29,30,31,32,47,48,49,50,51] due to higher tensile and shear strength as well as higher fracture energy and better ductility. Please note that the explosion resistance of the RC slabs in this experimental study is a qualitative term that describes the RC slab resistance to destruction caused by explosives, e.g., how much the sample is damaged and how much properties such as the velocity of the ultrasonic waves through concrete are reduced.
In contrast to the external damage caused by an explosion, which is thoroughly analyzed and evaluated based on visual inspection, three methods are used for internal damage to the concrete microstructure, the presence of internal cracks, and voids: Schmidt hammer, an ultrasonic device, and a device for measuring the electrical resistivity of concrete. The best method for detecting internal damage is measuring the velocity of ultrasonic waves and determining the dynamic modulus of elasticity. Changes in the microstructure of the concrete, e.g., micro- and macrocracks, reduce the velocity of the ultrasonic waves through the thickness of the concrete slab. After the explosion, the velocity of the ultrasonic waves in samples without fibers and with steel fibers (RCS1, RCS2, and RCS4) decreased by an average of 17%, while, in samples with polypropylene fibers (RCS5 and RCS6), the velocity of the ultrasonic waves decreased by 27%. Similarly, the dynamic modulus of elasticity decreased by 29% in samples without fibers and with steel fibers (RCS1, RCS2, and RCS4) and by 47% in slabs with polypropylene fibers (RCS5 and RCS6). It is known that polypropylene fibers are less resistant to the high temperatures that occur when high energy is released as a result of an explosion. Therefore, significant damage occurs to the microstructure of concrete with polypropylene fibers [48,49,50,51]. As expected, RC slabs with higher compressive strength (RCS2 and RCS6) initially have a higher ultrasonic wave velocity and a higher dynamic modulus of elasticity compared to the corresponding lower-class specimens (RCS1 and RCS5), but this difference had no effect on the measured values after the explosion.
When analyzing a concrete slab with steel fibers with different amounts of applied explosives, differences in degradation after the explosion are detected: the sample with a standard amount of explosive demonstrated a 17% decrease in ultrasonic velocity and a 27% decrease in dynamic modulus of elasticity. In the sample with three times the amount of explosive, on the other hand, the values for ultrasonic velocity and dynamic modulus of elasticity fell by 29% and 47%, respectively, after the explosion.
4. Conclusions
In this study, the effect of explosive action using contact detonation on six different samples of RC slabs is analyzed. There are two RC slab samples without fibers, two with steel fibers, and two with polypropylene fibers, one of which has a lower and the other a higher compressive strength, i.e., concrete classes. The required amount of explosives is calculated according to the method for conventional reinforced concrete elements developed in the Croatian Armed Forces. Through visual inspection and non-destructive testing methods, e.g., with the Schmidt hammer, the ultrasonic device, and the device for measuring the electrical resistivity of the concrete before and after explosive action, both the external and internal damage are analyzed and the results are examined, compared, and presented. Finally, the following conclusions can be drawn:
- The method for calculating the required amount of explosives for the demolition of a conventionally reinforced concrete element can also be used for RC elements with fibers if the proportion of fibers in the concrete is low, as in this study. With a larger proportion of added fibers, the mass of the explosive must be increased if the same damage effect is to be achieved. It is recommended to further investigate the influence of the fiber content on the required amount of explosive to achieve the same demolition objectives as with a classical reinforced concrete element.
- Visual inspection and measurement of dimensions amount to a sufficient method for the evaluation of external damage to RC due to explosion.
- Three non-destructive testing methods, the Schmidt hammer, a device for measuring the electrical resistivity of concrete, and ultrasound, are used to assess internal damage (changes in the concrete microstructure, cracks, voids, etc.) in the RC concrete slabs before and after an explosion. Of the methods used, the use of ultrasound proved to be the best as changes in the microstructure of the concrete, e.g., micro- and macrocracks, reduce the velocity of the ultrasonic waves through the thickness of the concrete slabs.
- With the same amount of explosive, RC slabs with steel and polypropylene fibers have better resilience to contact detonation than RC slabs without fibers. The difference can be observed in the smaller areas of punctured concrete at the edge of the slab and spalled concrete on the unloaded side of the slab due to the higher tensile strength of concrete with added fibers.
- The analysis of the internal damage to the samples is based on the measurement of the velocity of the ultrasonic wave passing through the slab thickness before and after the explosion and the calculated value of the dynamic modulus of elasticity. For RC slabs with the same amount of explosive, the ultrasonic wave velocity is decreased by 17% for samples without fibers and with steel fibers and by 29% for samples with polypropylene fibers. The reduction in the dynamic modulus of elasticity after the explosion is even more pronounced: for RC slabs without fibers and steel fibers, the reduction is 27%, and, for RC slabs with polypropylene fibers, it is 47%. The much greater deterioration in RC slabs with polypropylene fibers is a consequence of the low resistance of polypropylene fibers to the high temperatures that develop in the RC slabs during an explosion.
- When analyzing samples with the same composition of concrete and the same amount of explosive but different compressive strengths of the concrete, no significant differences in their resistance to the effects of the explosives are found.
- In the analysis of slabs with steel fibers with different amounts of explosives, the greatest difference is found in the percentage of punctured concrete at the edges of the slabs, which is nine times higher in the RC slab with a triple amount of explosives than in the RC slab with a standard amount of explosives, while other damage indicators show similar values or deterioration by 50 to 100%.
- Since it has been found that concrete with steel fibers provides greater resistance to destruction by explosives, this should be considered in the design of civil and military structures to protect personnel, property, and strategically important facilities. This approach would increase the resilience of buildings to the effects of explosions, reduce the potential for disasters and casualties, and raise the protection and safety of personnel and material in these structures to a higher level.
Author Contributions
Conceptualization, M.K.M., A.I. and M.F.; methodology, M.K.M., A.I. and M.F.; validation, M.K.M. and A.I.; formal analysis, M.K.M. and A.I.; investigation, M.K.M., A.I., M.S., A.V. and M.F.; resources, M.K.M., A.I., M.S., A.V. and M.F.; data curation, M.K.M., A.I., M.S., A.V. and M.F.; writing—original draft preparation, A.I.; writing—review and editing, M.K.M.; visualization, M.K.M. and A.I.; supervision, M.K.M. and M.F.; project administration, M.K.M., A.I. and M.F.; funding acquisition, M.K.M. All authors have read and agreed to the published version of the manuscript.
Funding
This research was funded by the Fund for the Improvement of Study Implementation at the Croatian Military Academy of the University of Zagreb and short-term financial support funded by the University of Zagreb: 1-2022.
Data Availability Statement
The datasets generated for this study can be obtained from the corresponding author upon request with the approval of the Croatian Ministry of Defense.
Acknowledgments
The authors would like to thank the staff and students of the Croatian Military Academy of the University of Zagreb and the Cerovac military training area, who helped with the preparation and implementation of the experimental part of the research. The authors would like to thank “Beton Lučko” for concreting slab specimens and carrying out laboratory tests.
Conflicts of Interest
The authors declare no conflicts of interest.
References
- Smolčić, Ž.; Ožbolt, J. Meso scale model for fiber-reinforced-concrete: Microplane based approach. Comput. Concr. 2017, 19, 375–385. [Google Scholar] [CrossRef]
- Marcalikova, Z.; Racek, M.; Mateckova, P.; Cajka, R. Comparison of tensile strength fiber reinforced concrete with different types of fibers. Procedia Struct. Integr. 2020, 28, 950–956. [Google Scholar] [CrossRef]
- Kohoutková, A.; Broukalová, I. Optimization of Fibre Reinforced Concrete Structural Members. Procedia Eng. 2013, 65, 100–106. [Google Scholar] [CrossRef]
- Ztürk, B.; Yilmaz, C. Analytical investigation of effect of retrofit application using CFRP on seismic behavior of a monumental building at historical Cappadocia region of Turkey. In Proceedings of the 9th US National and 10th Canadian Conference on Earthquake Engineering, Toronto, ON, Canada, 25–29 July 2010; pp. 25–29. [Google Scholar]
- Mostafaei, H.; Bahmani, H.; Mostofinejad, D.; Wu, C. A novel development of HPC without cement: Mechanical properties and sustainability evaluation. J. Build. Eng. 2023, 76, 107262. [Google Scholar] [CrossRef]
- Li, Y.F.; Ramanathan, G.K.; Syu, J.Y.; Huang, C.H.; Tsai, Y.K. Mechanical behavior of different fiber lengths mix-proportions carbon fiber reinforced concrete subjected to static, impact, and blast loading. Int. J. Prot. Struct. 2024, 15, 43–64. [Google Scholar] [CrossRef]
- Li, Y.; Aoude, H. Effects of stainless steel reinforcement and fibers on the flexural behaviour of high-strength concrete beams subjected to static and blast loading. Eng. Struct. 2023, 291, 116398. [Google Scholar] [CrossRef]
- Zhao, H.; Zhao, X.; Fang, H.; Yang, L.; Sun, J.; Liu, S.; Liu, Z. Experimental investigation of steel fiber reinforced concrete slabs subjected to underwater contact explosions. Ocean Eng. 2023, 281, 114664. [Google Scholar] [CrossRef]
- Abedini, M.; Zhang, C. Dynamic performance of ultra-high performance fiber-reinforced concrete panel exposed to explosive loading. Int. J. Prot. Struct. 2023. [CrossRef]
- Zhao, X.; Sun, J.; Zhao, H.; Jia, Y.; Fang, H.; Wang, J.; Yao, Y.; Wei, D. Experimental and mesoscopic modeling numerical researches on steel fiber reinforced concrete slabs under contact explosion. Structures 2024, 61, 106114. [Google Scholar] [CrossRef]
- Tauma, W.K.; Balázs, L.G. Impact and blast resistance of slurry infiltrated fiber concrete (SIFCON): A comprehensive review. Concr. Struct. 2023, 24, 129–136. [Google Scholar] [CrossRef]
- Milić, P.; Kušter Marić, M. Climate change effect on durability of bridges and other infrastructure. Građevinar 2023, 75, 893–906. [Google Scholar] [CrossRef]
- Orcesi, A.; Diamantidis, D.; O’Connor, A.; Palmisano, F.; Sykora, M.; Boros, V.; Caspeele, R.; Chateauneuf, A.; Ivanković Mandić, A.; Lenner, R.; et al. Investigating Partial Factors for the Assessment of Existing Reinforced Concrete Bridges. Struct. Eng. Int. 2023, 34, 55–70. [Google Scholar] [CrossRef]
- Rassoulpour, S.; Shiravand, M.R.; Safi, M. Proposed seismic-resistant dual system for continuous-span concrete bridges using self-centering cores. Eng. Struct. 2023, 274, 115181. [Google Scholar] [CrossRef]
- Shirkhani, H.; Lounis, Z.; Zhang, J. Life-cycle design of concrete highway bridge decks under climate change. In Life-Cycle of Structures and Infrastructure Systems, 1st ed.; Biondini, F., Frangopol, D.M., Eds.; CRC Press: London, UK, 2023; pp. 1609–1616. [Google Scholar]
- Kušter Marić, M.; Ožbolt, J.; Balabanić, G.; Zhychkovska, O.; Gambarelli, S. Chloride Transport in Cracked Concrete Subjected to Wetting—Drying Cycles: Numerical Simulations and Measurements on Bridges Exposed to De-Icing Salts. Front. Built Environ. 2020, 6, 561897. [Google Scholar] [CrossRef]
- Figueiredo, E.; Santos, L.O.; Moldovan, I.; Kraniotis, D.; Melo, J.; Dias, L.; Coelho, G.B. A roadmap for an integrated assessment approach to the adaptation of concrete bridges to climate change. J. Bridge Eng. 2023, 28, 03123002. [Google Scholar] [CrossRef]
- Wujian, Y.; Xinxin, T.; Zhijian, W.; Ping, W.; Lin, K. Seismic response of concrete bridge of Lanzhou-Xinjiang high-speed railway under the near-fault strong earthquake. Structures 2023, 50, 1416–1428. [Google Scholar] [CrossRef]
- Borah, M.M.; Sil, A. Service-Life Estimation of a Reinforced Concrete Bridge Structure Exposed to Chloride-Contaminated Environments and Variable Traffic Loads. ASCE ASME J. Risk Uncertain. Eng. Part A Civ. Eng. 2023, 9, 04023028. [Google Scholar] [CrossRef]
- Stewart, M.G.; Thöns, S.; Beck, A.T. Assessment of risk reduction strategies for terrorist attacks on structures. Struct. Saf. 2023, 104, 102353. [Google Scholar] [CrossRef]
- Ahmad, J.; Zhou, Z. Waste marble based self compacting concrete reinforced with steel fiber exposed to aggressive environment. J. Build. Eng. 2024, 81, 108142. [Google Scholar] [CrossRef]
- Yang, J.; Chen, R.; Zhang, Z.; Zou, Y.; Zhou, J.; Xia, J. Experimental study on the ultimate bearing capacity of damaged RC arches strengthened with ultra-high performance concrete. Eng. Struct. 2023, 279, 115611. [Google Scholar] [CrossRef]
- Qiu, Z.; Prabhakaran, A.; Su, L.; Zheng, Y. Performance-based seismic resilience and sustainability assessment of coastal RC bridges in aggressive marine environments. Ocean Eng. 2023, 279, 114547. [Google Scholar] [CrossRef]
- Holland, B.; Alapati, P.; Kurtis, K.E.; Kahn, L. Effect of different concrete materials on the corrosion of the embedded reinforcing steel. In Corrosion of Steel in Concrete Structures, 2nd ed.; Poursaee, A., Ed.; Woodhead Publishing: Sawston, UK, 2023; pp. 199–218. [Google Scholar]
- Hu, J.; Deng, Y.; Jiao, W.; Yao, Y.; Chen, D. Dynamic response and damage assessment of a prestressed T-shaped simply supported girder bridge under contact explosion. Structures 2023, 48, 40–52. [Google Scholar] [CrossRef]
- Xiao, Y.; Zhu, W.; Li, M.; Jia, J.; Li, Z. Concrete spalling behavior and damage evaluation of concrete members with different cross-sectional properties under contact explosion. Int. J. Impact Eng. 2023, 181, 104753. [Google Scholar] [CrossRef]
- Kušter Marić, M.; Ožbolt, J.; Balabanić, G. Reinforced concrete bridge exposed to extreme maritime environmental conditions and mechanical damage: Measurements and numerical simulation. Eng. Struct. 2020, 205, 110078. [Google Scholar] [CrossRef]
- Zircher, T.; Keuser, M.; Burbach, A.; Lehmann, S. Protective components made of steel fiber reinforced concrete under contact detonation. Procedia Eng. 2017, 199, 2525–2530. [Google Scholar] [CrossRef]
- Kovar, M.; Foglar, M.; Hajek, R. The blast performance of real-scale reinforced concrete specimens with varying fiber types and content. WIT Trans. Built Environ. 2014, 141, 159–169. [Google Scholar] [CrossRef]
- Foglar, M.; Kovar, M. Conclusions from experimental testing of blast resistance of FRC and RC bridge decks. Int. J. Impact Eng. 2013, 59, 18–28. [Google Scholar] [CrossRef]
- Foglar, M.; Kovar, M. Spalling of concrete subjected to blast loading. In Proceedings of the 3rd International Workshop on Concrete Spalling Due to Fire Exposure, Paris, France, 25–27 September 2013; Volume 6, p. 07005. [Google Scholar] [CrossRef]
- Yang, D.; Zhang, B.; Liu, G. Experimental Study on Spall Resistance of Steel-Fiber Reinforced Concrete Slab Subjected to Explosion. Int. J. Concr. Struct. Mater. 2021, 15, 23. [Google Scholar] [CrossRef]
- Matković, A. Blast Loading on the Reinforced Concrete Bridge Deck. Bachelor’s Thesis, University of Zagreb, Zagreb, Croatia, September 2020. Available online: https://urn.nsk.hr/urn:nbn:hr:249:827337 (accessed on 11 January 2024). (In Croatian).
- Matković, A. Explosive Effect on Reinforced Concrete Slabs with Fibers. Master’s Thesis, University of Zagreb, Zagreb, Croatia, 2021. Available online: https://urn.nsk.hr/urn:nbn:hr:249:290250 (accessed on 11 January 2024). (In Croatian).
- Matković, A. Influence of Concrete Mixture and Quality on Damage of Reinforced Concrete Slabs Due to Blast Loading. Master’s Thesis, University of Zagreb, Zagreb, Croatia, July 2021. (In Croatian). [Google Scholar]
- HRN EN 206-1:2006; Concrete—Part 1: Specification, Performance, Production and Conformity (Includes Amendments A1:2004 and A2:2005) (EN 206-1:2000+A1:2004+A2:2005). CSI: Zagreb, Croatia, 2006.
- HRN EN 12390-3:2019; Testing Hardened Concrete—Part 3: Compressive Strength of Test Specimens. CSI: Zagreb, Croatia, 2019.
- Horvat, V. Demolition Tables. Croatian Military Academy “Dr. Franjo Tuđman”, February 2016. Available online: https://vojni.unizg.hr/ (accessed on 11 January 2024). (In Croatian).
- Horvat, V. Demolition of Elements and Materials. Lessons, Croatian Military Academy “Dr. Franjo Tuđman”, February 2016. Available online: https://vojni.unizg.hr/ (accessed on 11 January 2024). (In Croatian).
- Horvat, V. Theory of Demolition of Elements and Materials. Lectures on Military Practice, Croatian Military Academy “Dr. Franjo Tuđman”, March 2020. Available online: https://vojni.unizg.hr/ (accessed on 11 January 2024). (In Croatian).
- Li, J.; Wu, C.; Hao, H. Spallation of reinforced concrete slabs under contact explosion. In Proceedings of the Second Asian Conference on Defence Technology, Chiang Mai, Thailand, 21–23 January 2016. [Google Scholar] [CrossRef]
- Kušter Marić, M.; Vlašić, A.; Ivanković, A.M.; Bleiziffer, J.; Srbić, M.; Skokandić, D. Assessment of reinforcement corrosion and concrete damage on bridges using non-destructive testing. Građevinar 2019, 71, 843–862. [Google Scholar] [CrossRef]
- Pečur, I.B. Application of non-destructive testing in civil engineering. HDKBR INFO Magazin 2013, 3, 2–9. Available online: https://hrcak.srce.hr/148799 (accessed on 29 December 2023).
- Pečur, I.B.; Štirmer, N.; Galić, J. Testing polymer modified concrete by non-destructive methods. Građevinar 2009, 61, 655–662. Available online: https://hrcak.srce.hr/en/clanak/63636 (accessed on 29 December 2023).
- Cleven, S.; Raupach, M.; Matschei, T. Electrical Resistivity of Steel Fibre-Reinforced Concrete—Influencing Parameters. Materials 2021, 14, 3408. [Google Scholar] [CrossRef] [PubMed]
- Turk, K.; Cicek, N.; Katlav, M.; Donmez, I.; Turgut, P. Electrical conductivity and heating performance of hybrid steel fiber-reinforced SCC: The role of high-volume fiber and micro fiber length. J. Build. Eng. 2023, 76, 107392. [Google Scholar] [CrossRef]
- Li, J.; Wu, C.; Hao, H. Investigation of ultra-high performance concrete slab and normal strength concrete slab under contact explosion. Eng. Struct. 2015, 102, 395–408. [Google Scholar] [CrossRef]
- Foglar, M.; Hajek, R.; Fladr, J.; Pachman, J.; Stoller, J. Full-scale experimental testing of the blast resistance of HPFRC and UHPFRC bridge decks. Constr. Build. Mater. 2017, 145, 588–601. [Google Scholar] [CrossRef]
- Draganić, H.; Gazić, G.; Varevac, D. Experimental investigation of design and retrofit methods for blast load mitigation–A state-of-the-art review. Eng. Struct. 2019, 190, 189–209. [Google Scholar] [CrossRef]
- Silva, P.; Lu, B. Improving the blast resistance capacity of RC slabs with innovative composite materials. Compos. B. Eng. 2007, 38, 523–534. [Google Scholar] [CrossRef]
- Drdlová, M.; Buchar, J.; Krátký, J.; Řídký, R. Blast resistance characteristics of concrete with different types of fibre reinforcement. Struct. Concr. 2015, 16, 508–517. [Google Scholar] [CrossRef]


Disclaimer/Publisher’s Note: The statements, opinions and data contained in all publications are solely those of the individual author(s) and contributor(s) and not of MDPI and/or the editor(s). MDPI and/or the editor(s) disclaim responsibility for any injury to people or property resulting from any ideas, methods, instructions or products referred to in the content. |
© 2024 by the authors. Licensee MDPI, Basel, Switzerland. This article is an open access article distributed under the terms and conditions of the Creative Commons Attribution (CC BY) license (https://creativecommons.org/licenses/by/4.0/).