
Low-Field Nuclear Magnetic Resonance Investigation on Early Hydration Characterization of Cement Paste Mixed with Mineral Admixtures

Abstract
:1. Introduction
2. Testing Principle
3. Experiment
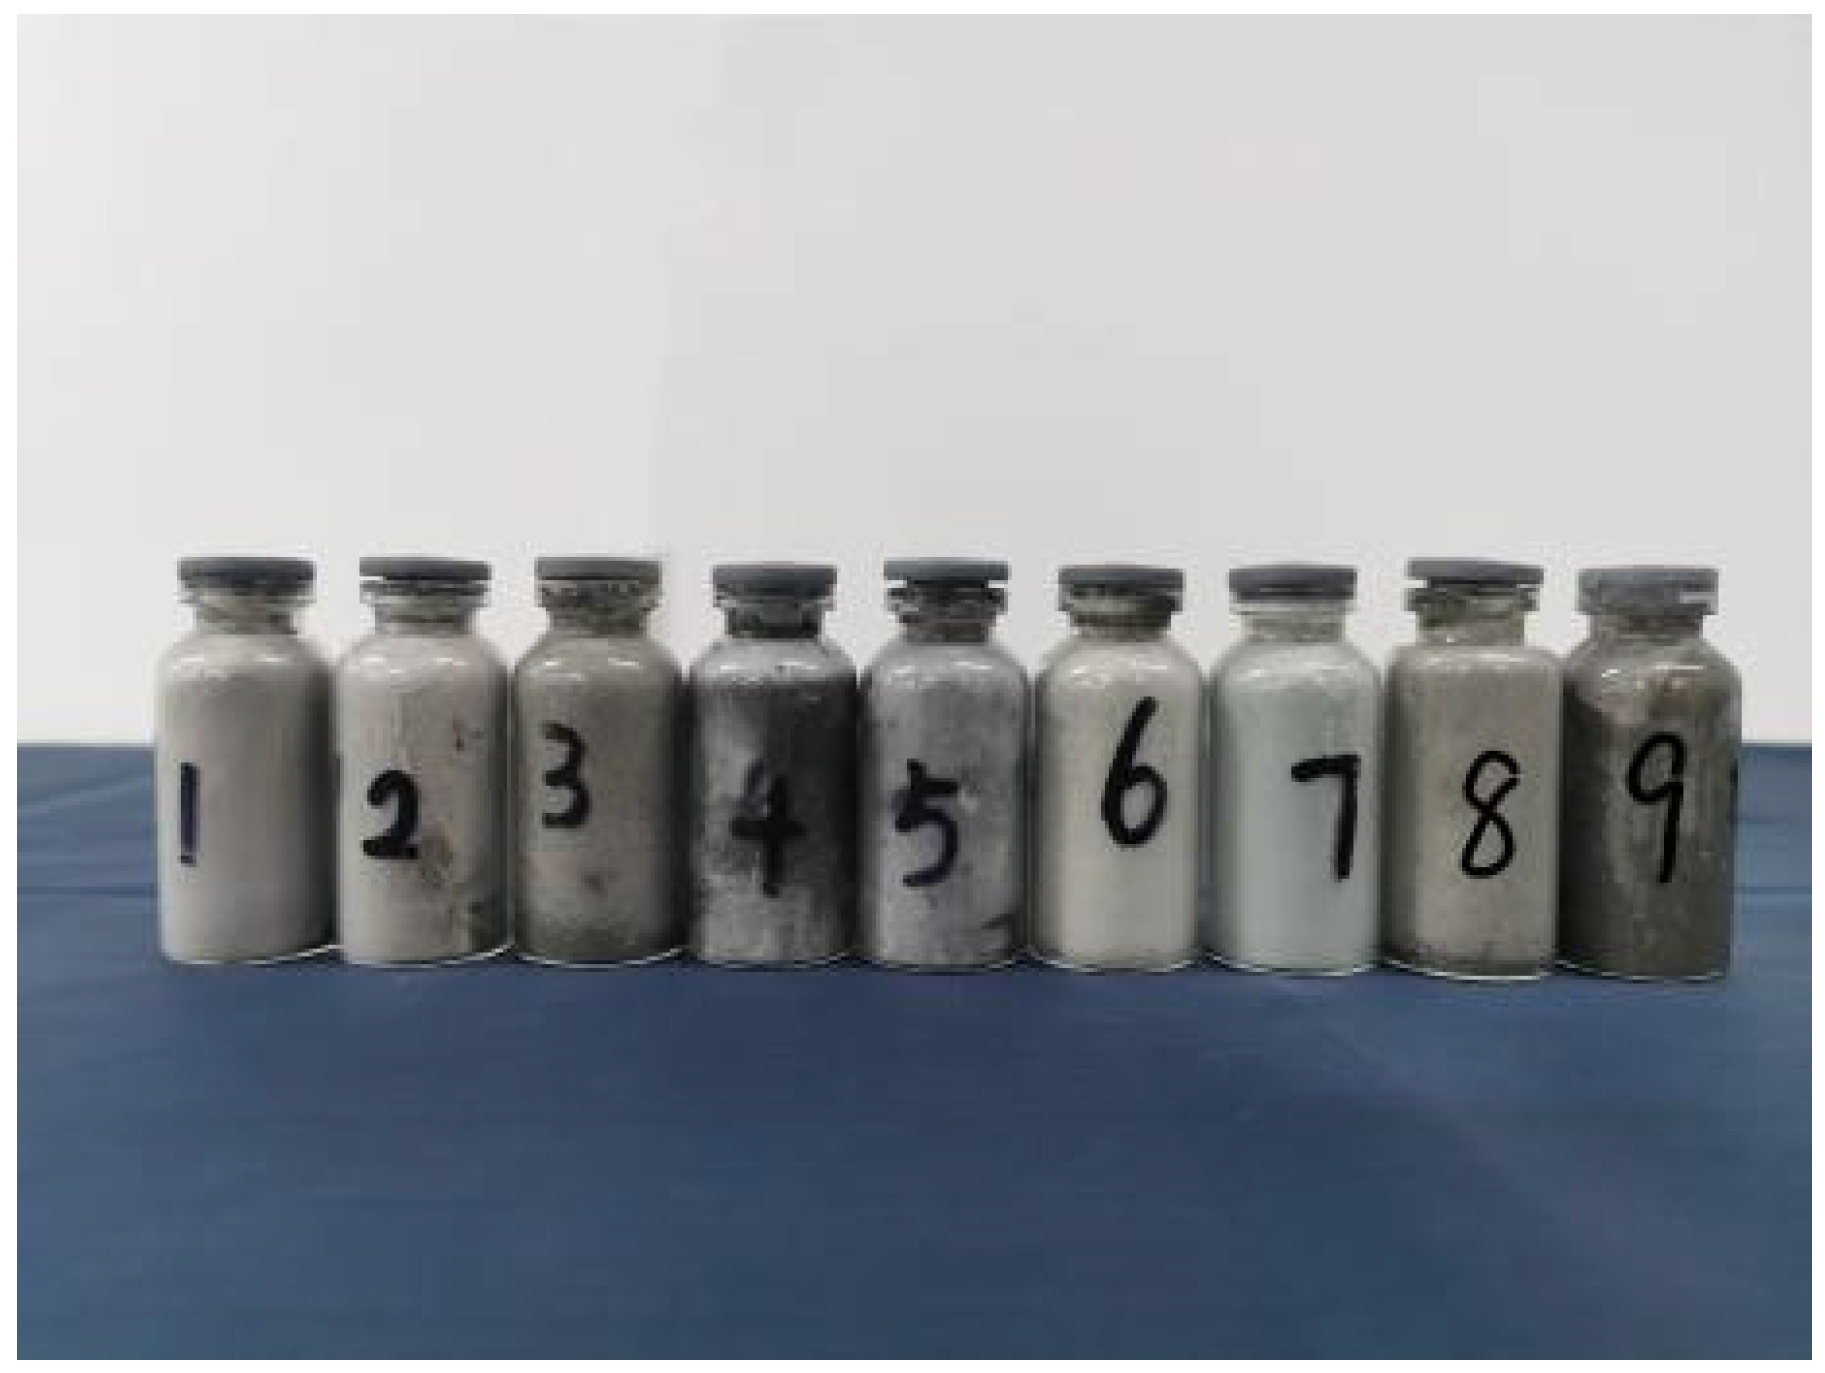
3.1. Materials
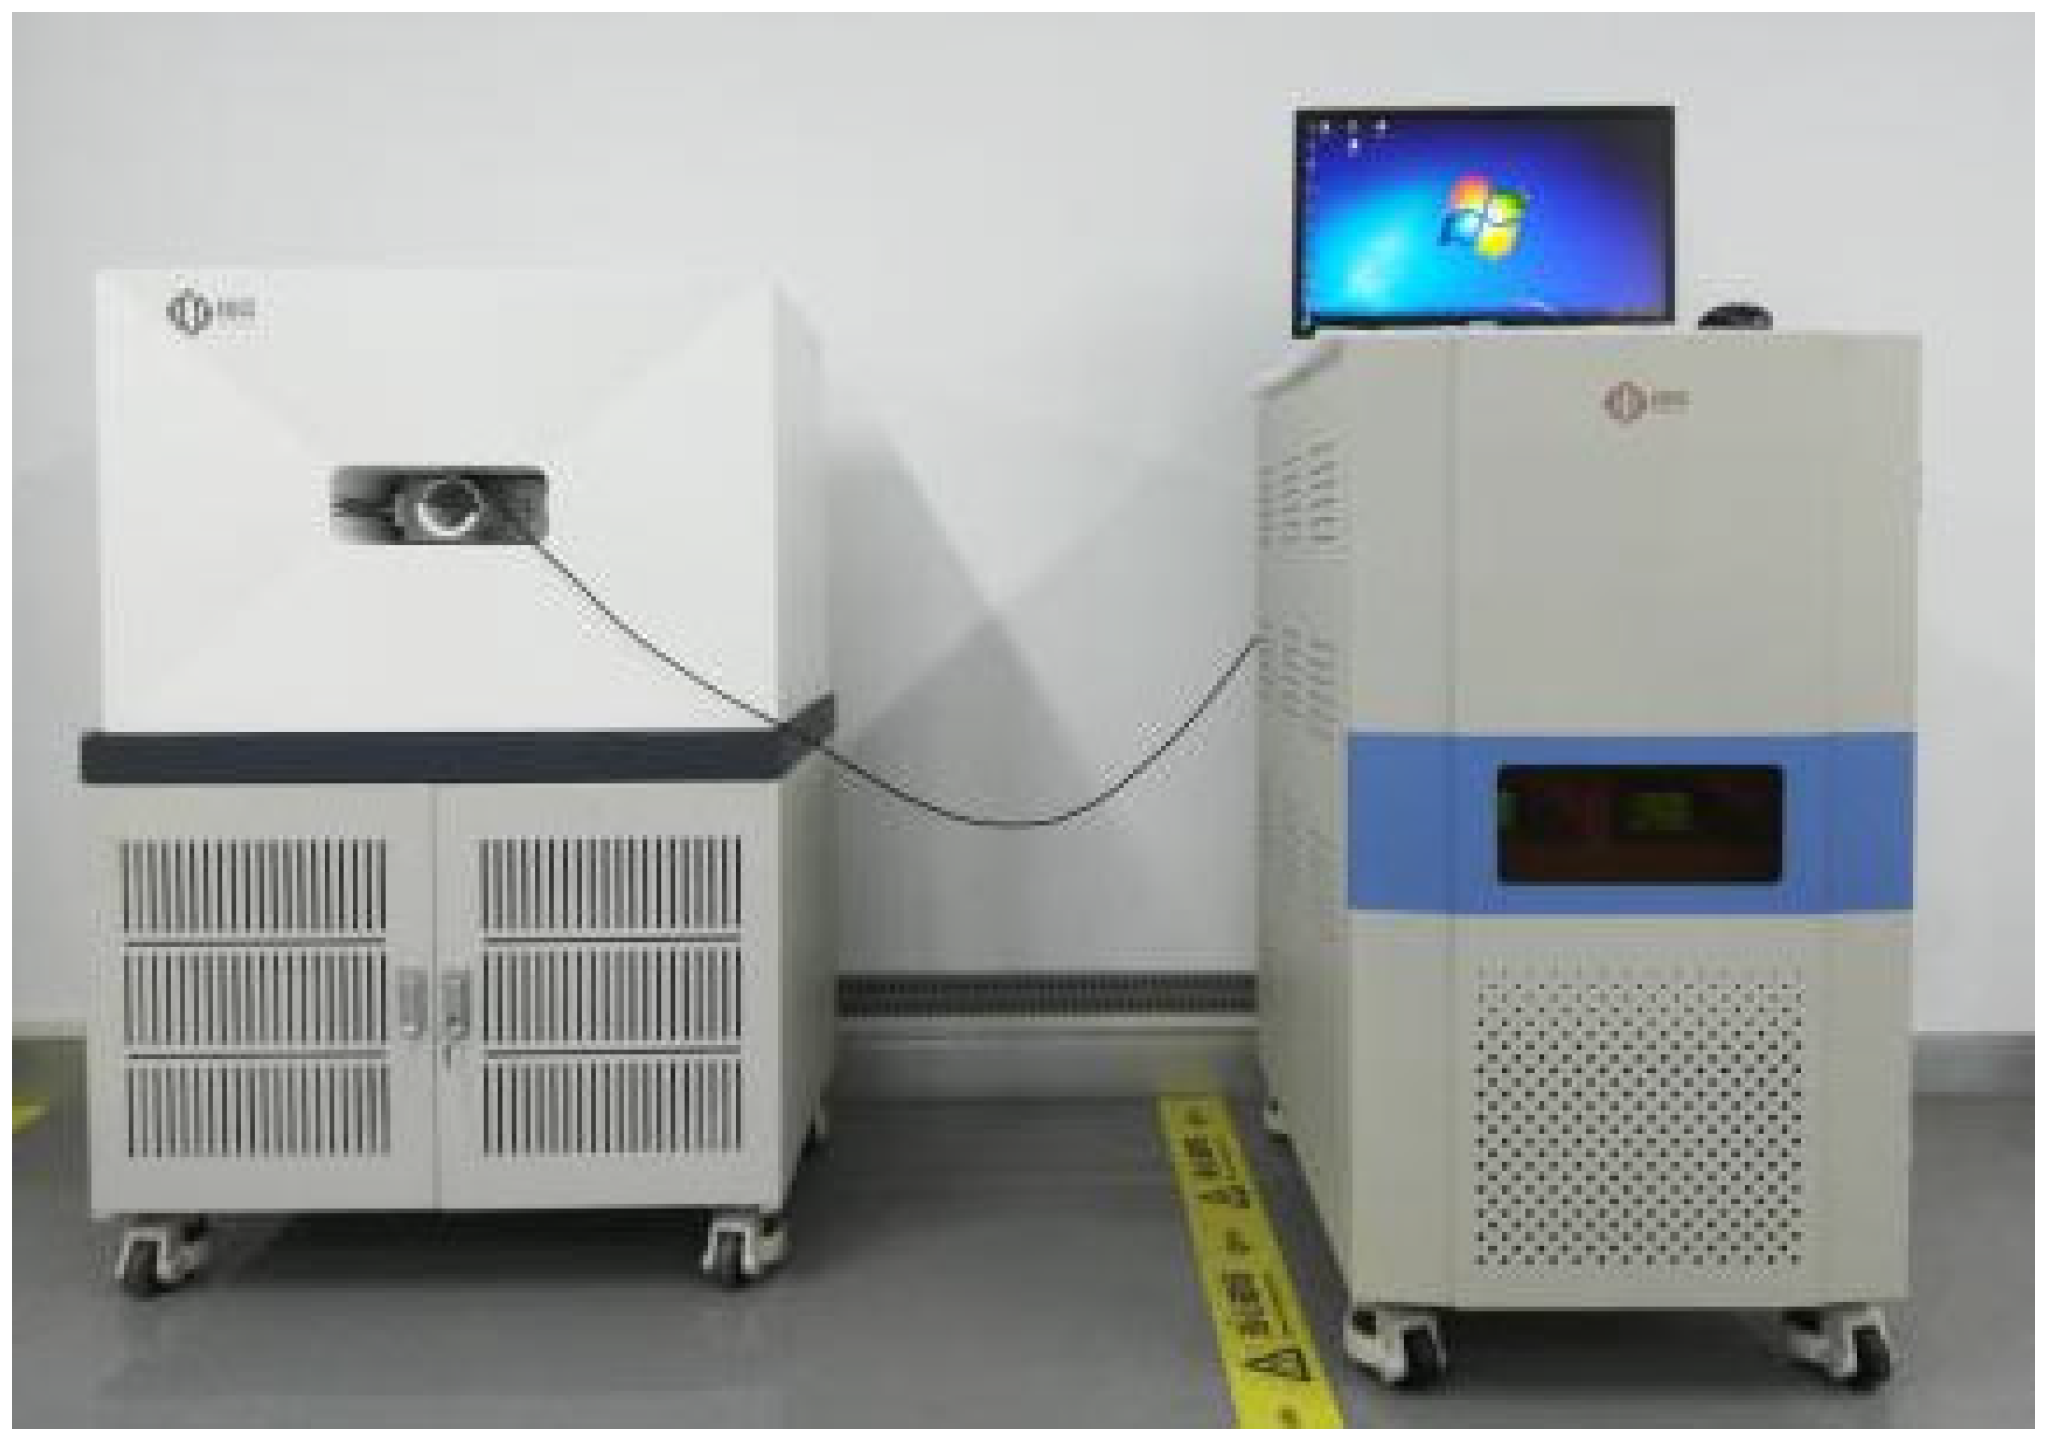
3.2. Measure Method
4. Result and Discussion
4.1. Distribution of Relaxation Time
4.2. Evolution of Evaporable Water
4.3. Distribution of Pore Structures
4.4. Evolution of Mechanical Property
5. Conclusions
- (1)
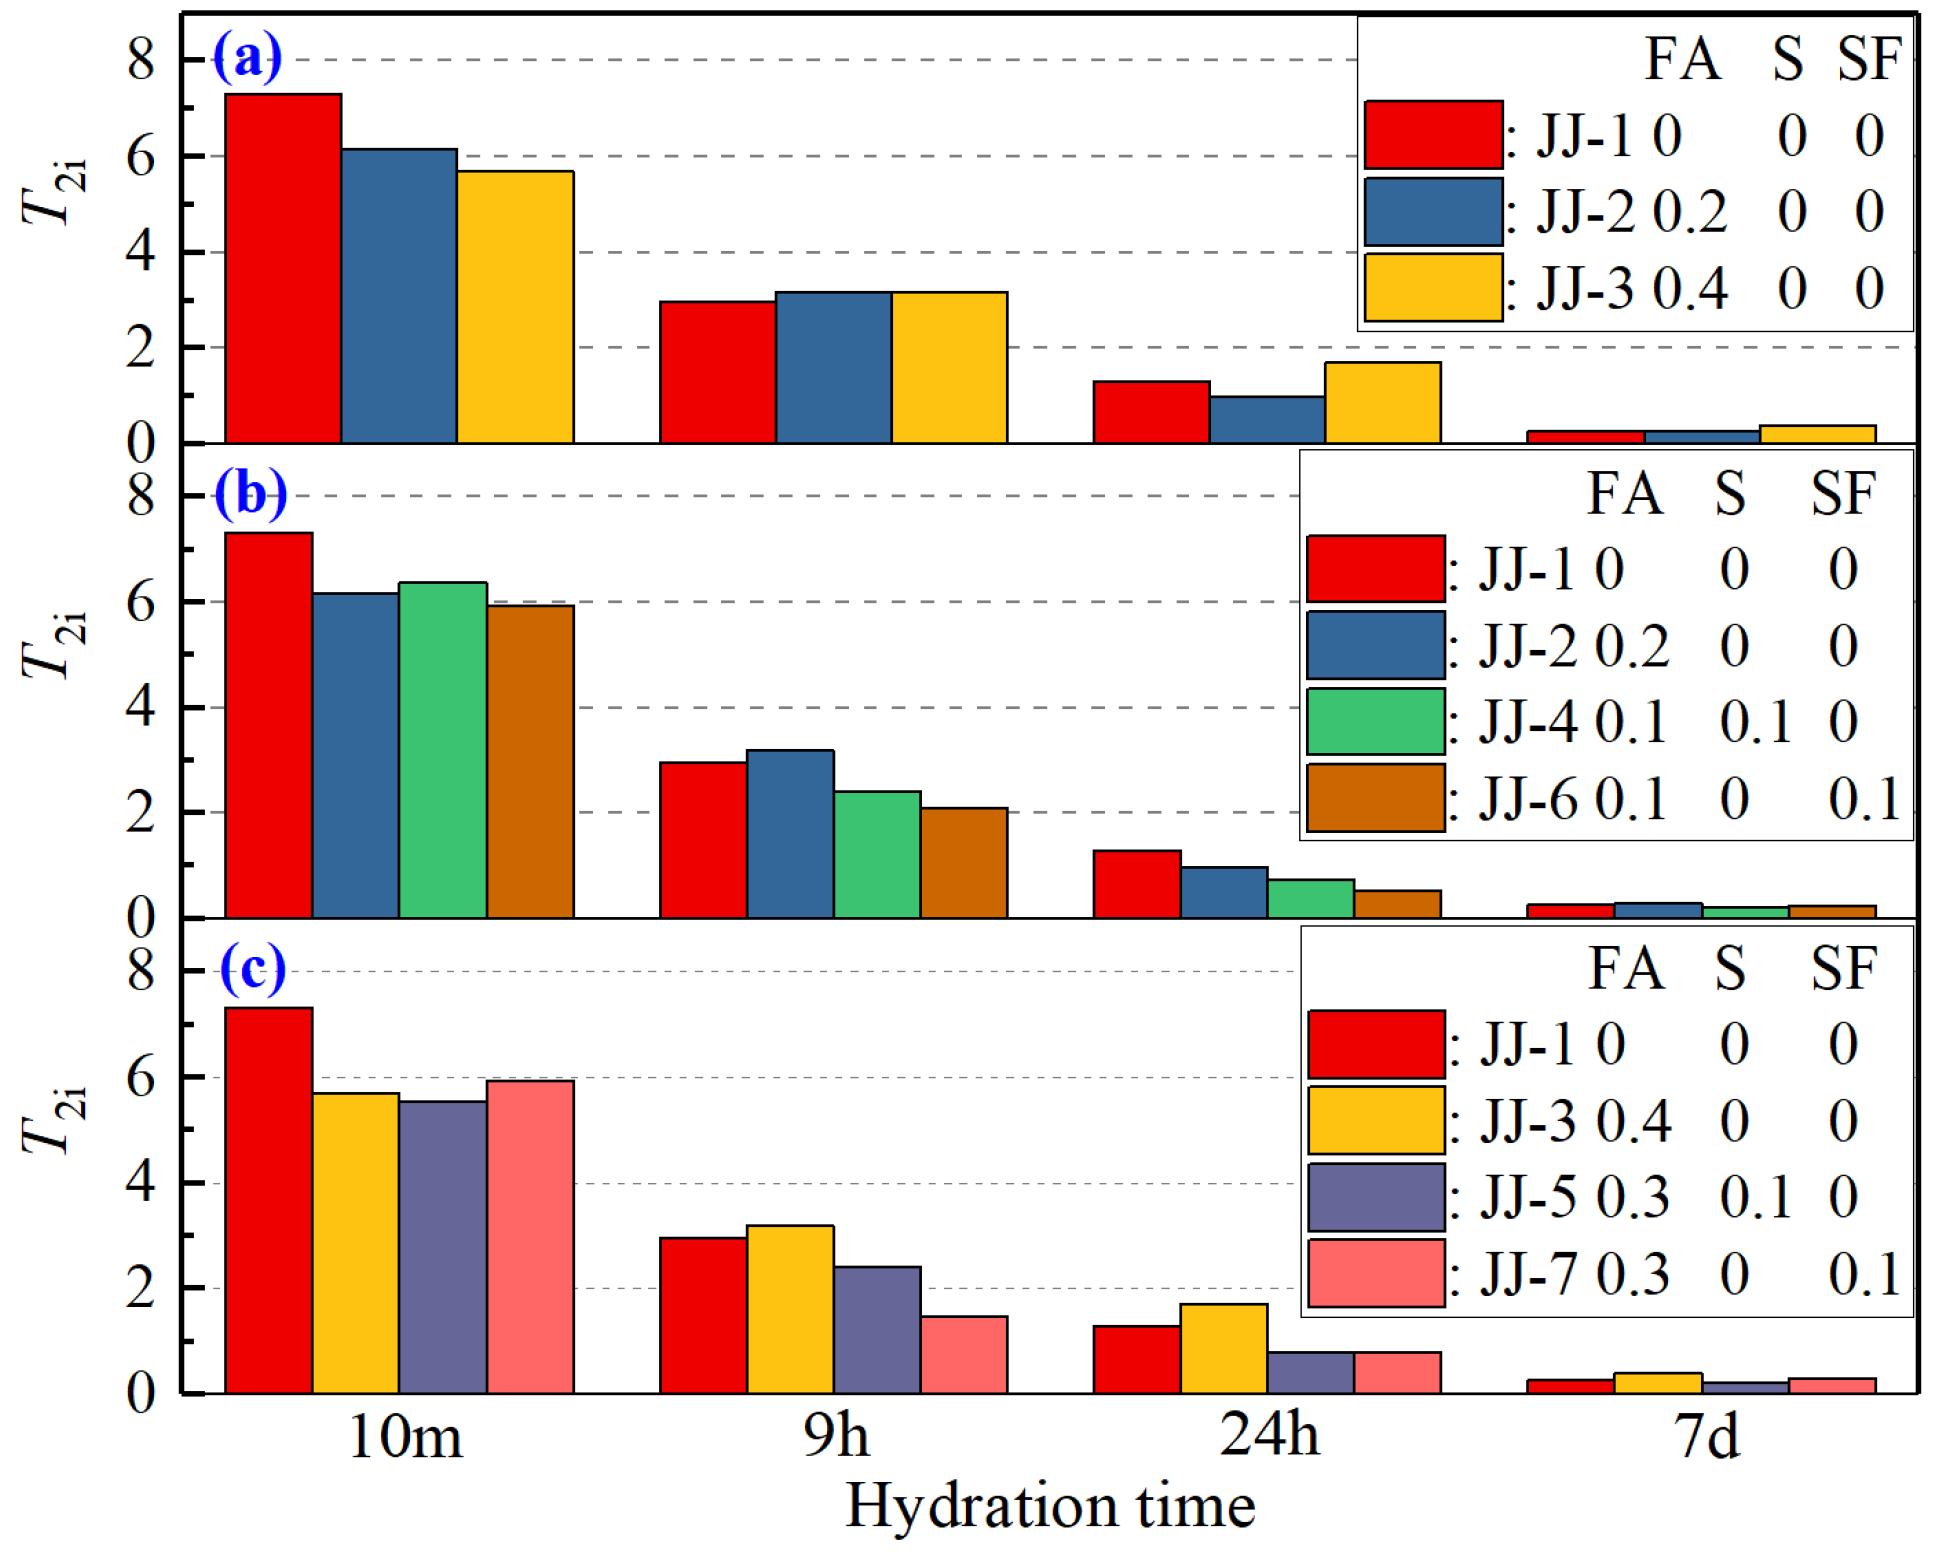
- At the beginning of hydration (10 min), T2 distribution presents double peaks (an obvious main peak and a weak peak), and the relaxation time of the main peak is about 1~10 ms. With the curing time, the distribution of the relaxation peak shows a trend of gradually changing to a single main peak. At the curing time of 24 h, the relaxation time of the single main peak is about 0.1~1 ms.
- (2)
- T2i (relaxation time of the main peak) reflects the motion characteristics of water molecules. At the early hydration stage (within 24 h), T2i has a rapid decrease and then gradually stabilizes. It is because the formation of hydration products refines larger pores, causing the evaporated water to be distributed in smaller pores with more motion constraints. However, the difference in T2i of different mix proportions is not significant, indicating that the type and content of MA have little effect.
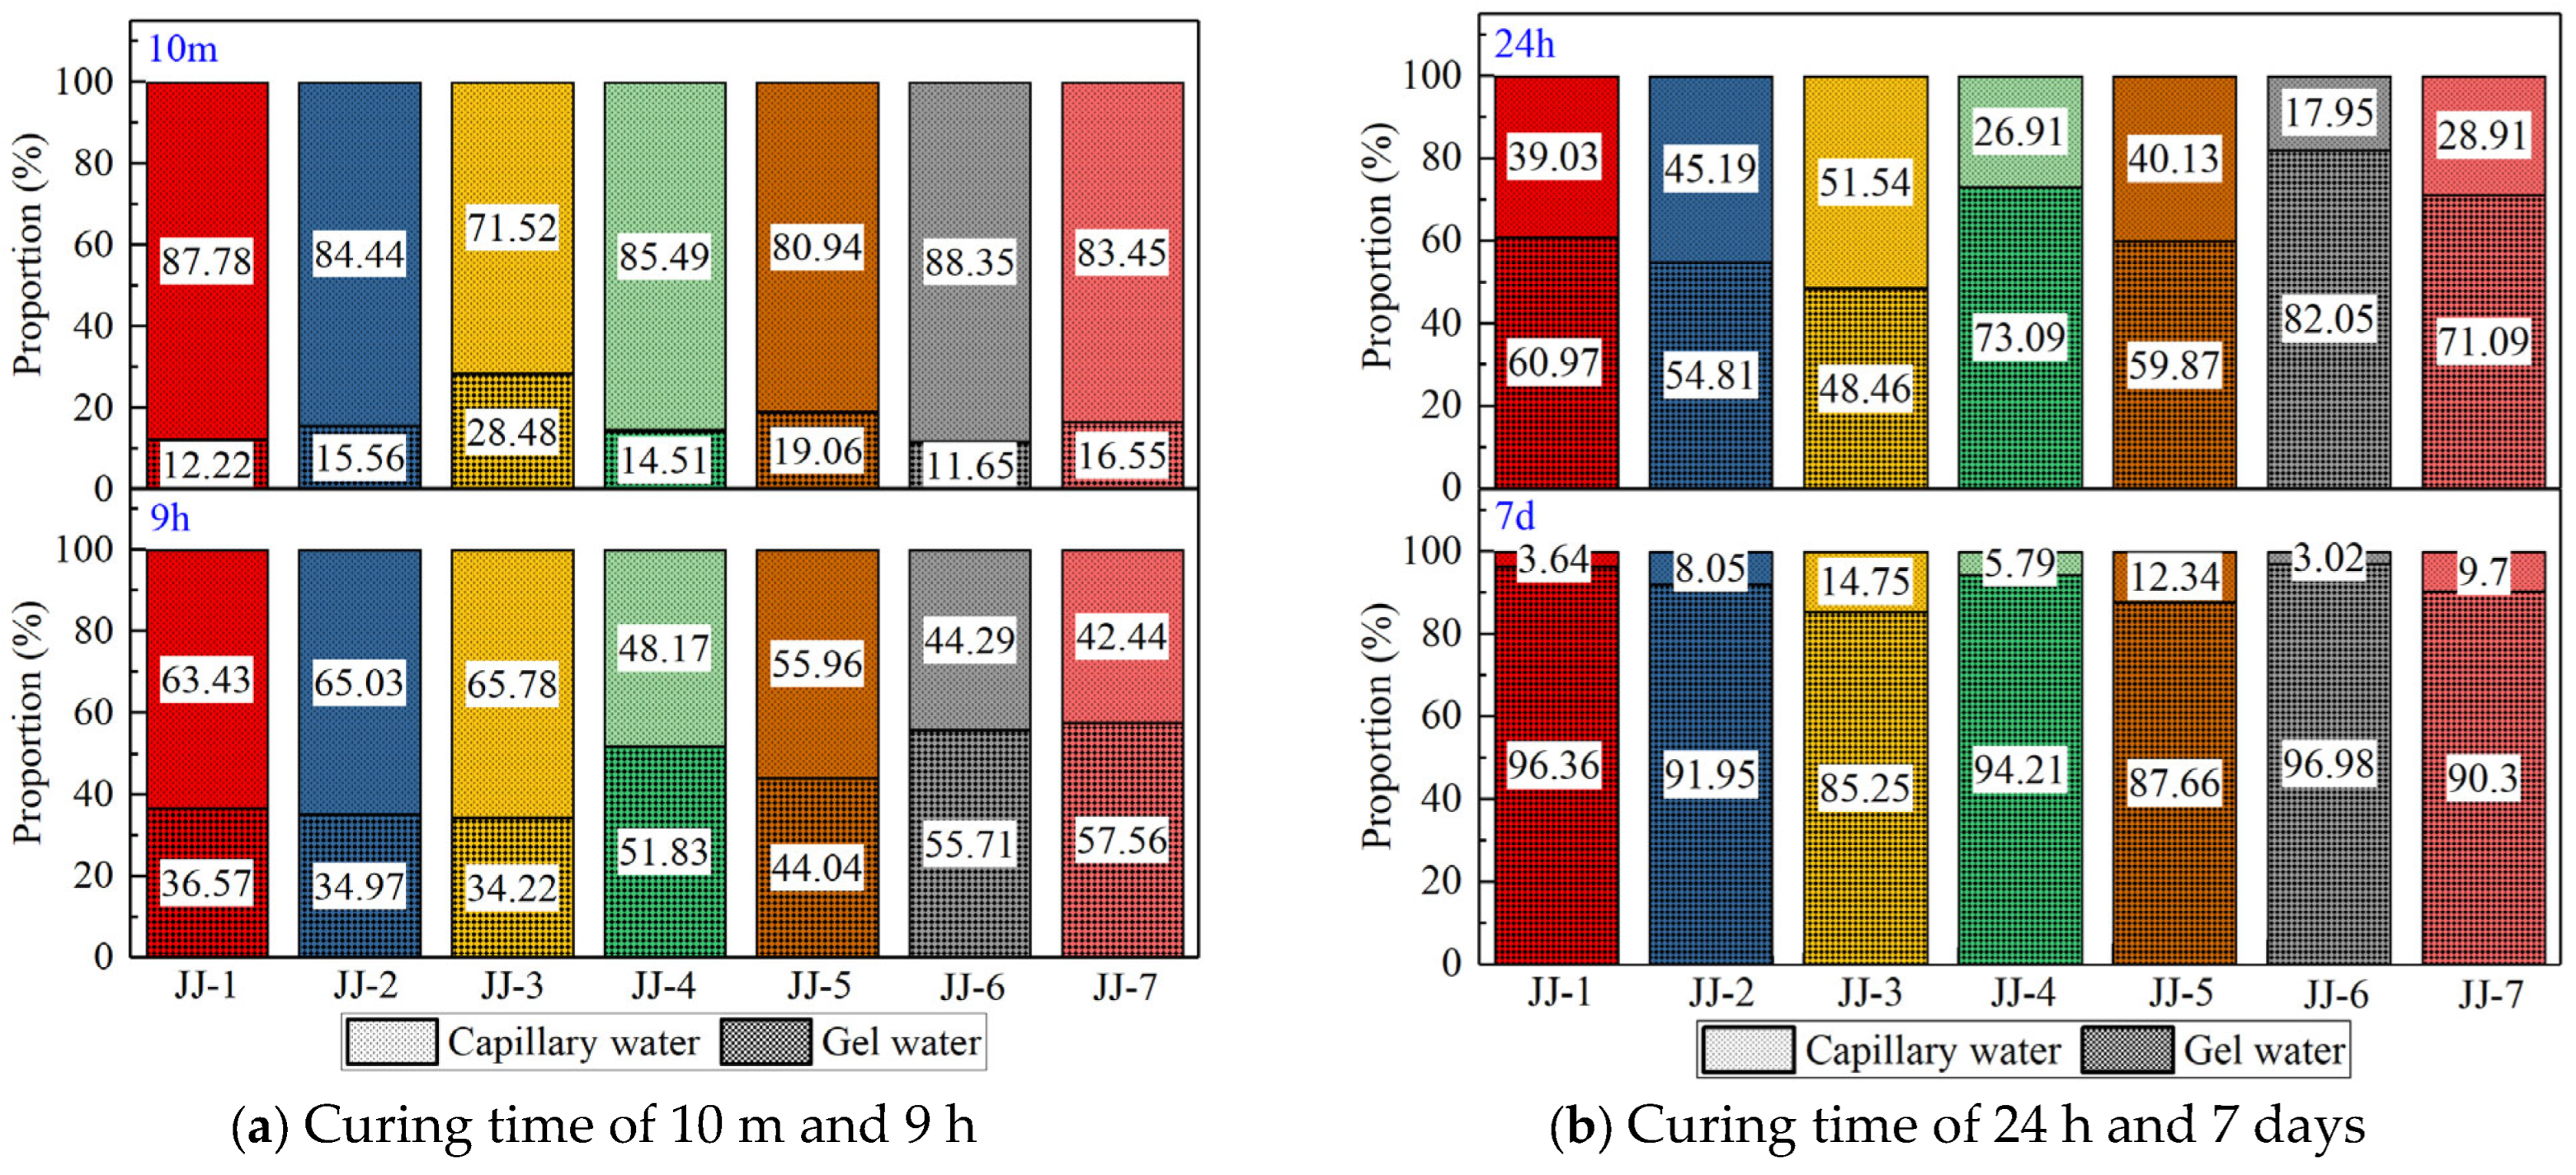
- (3)
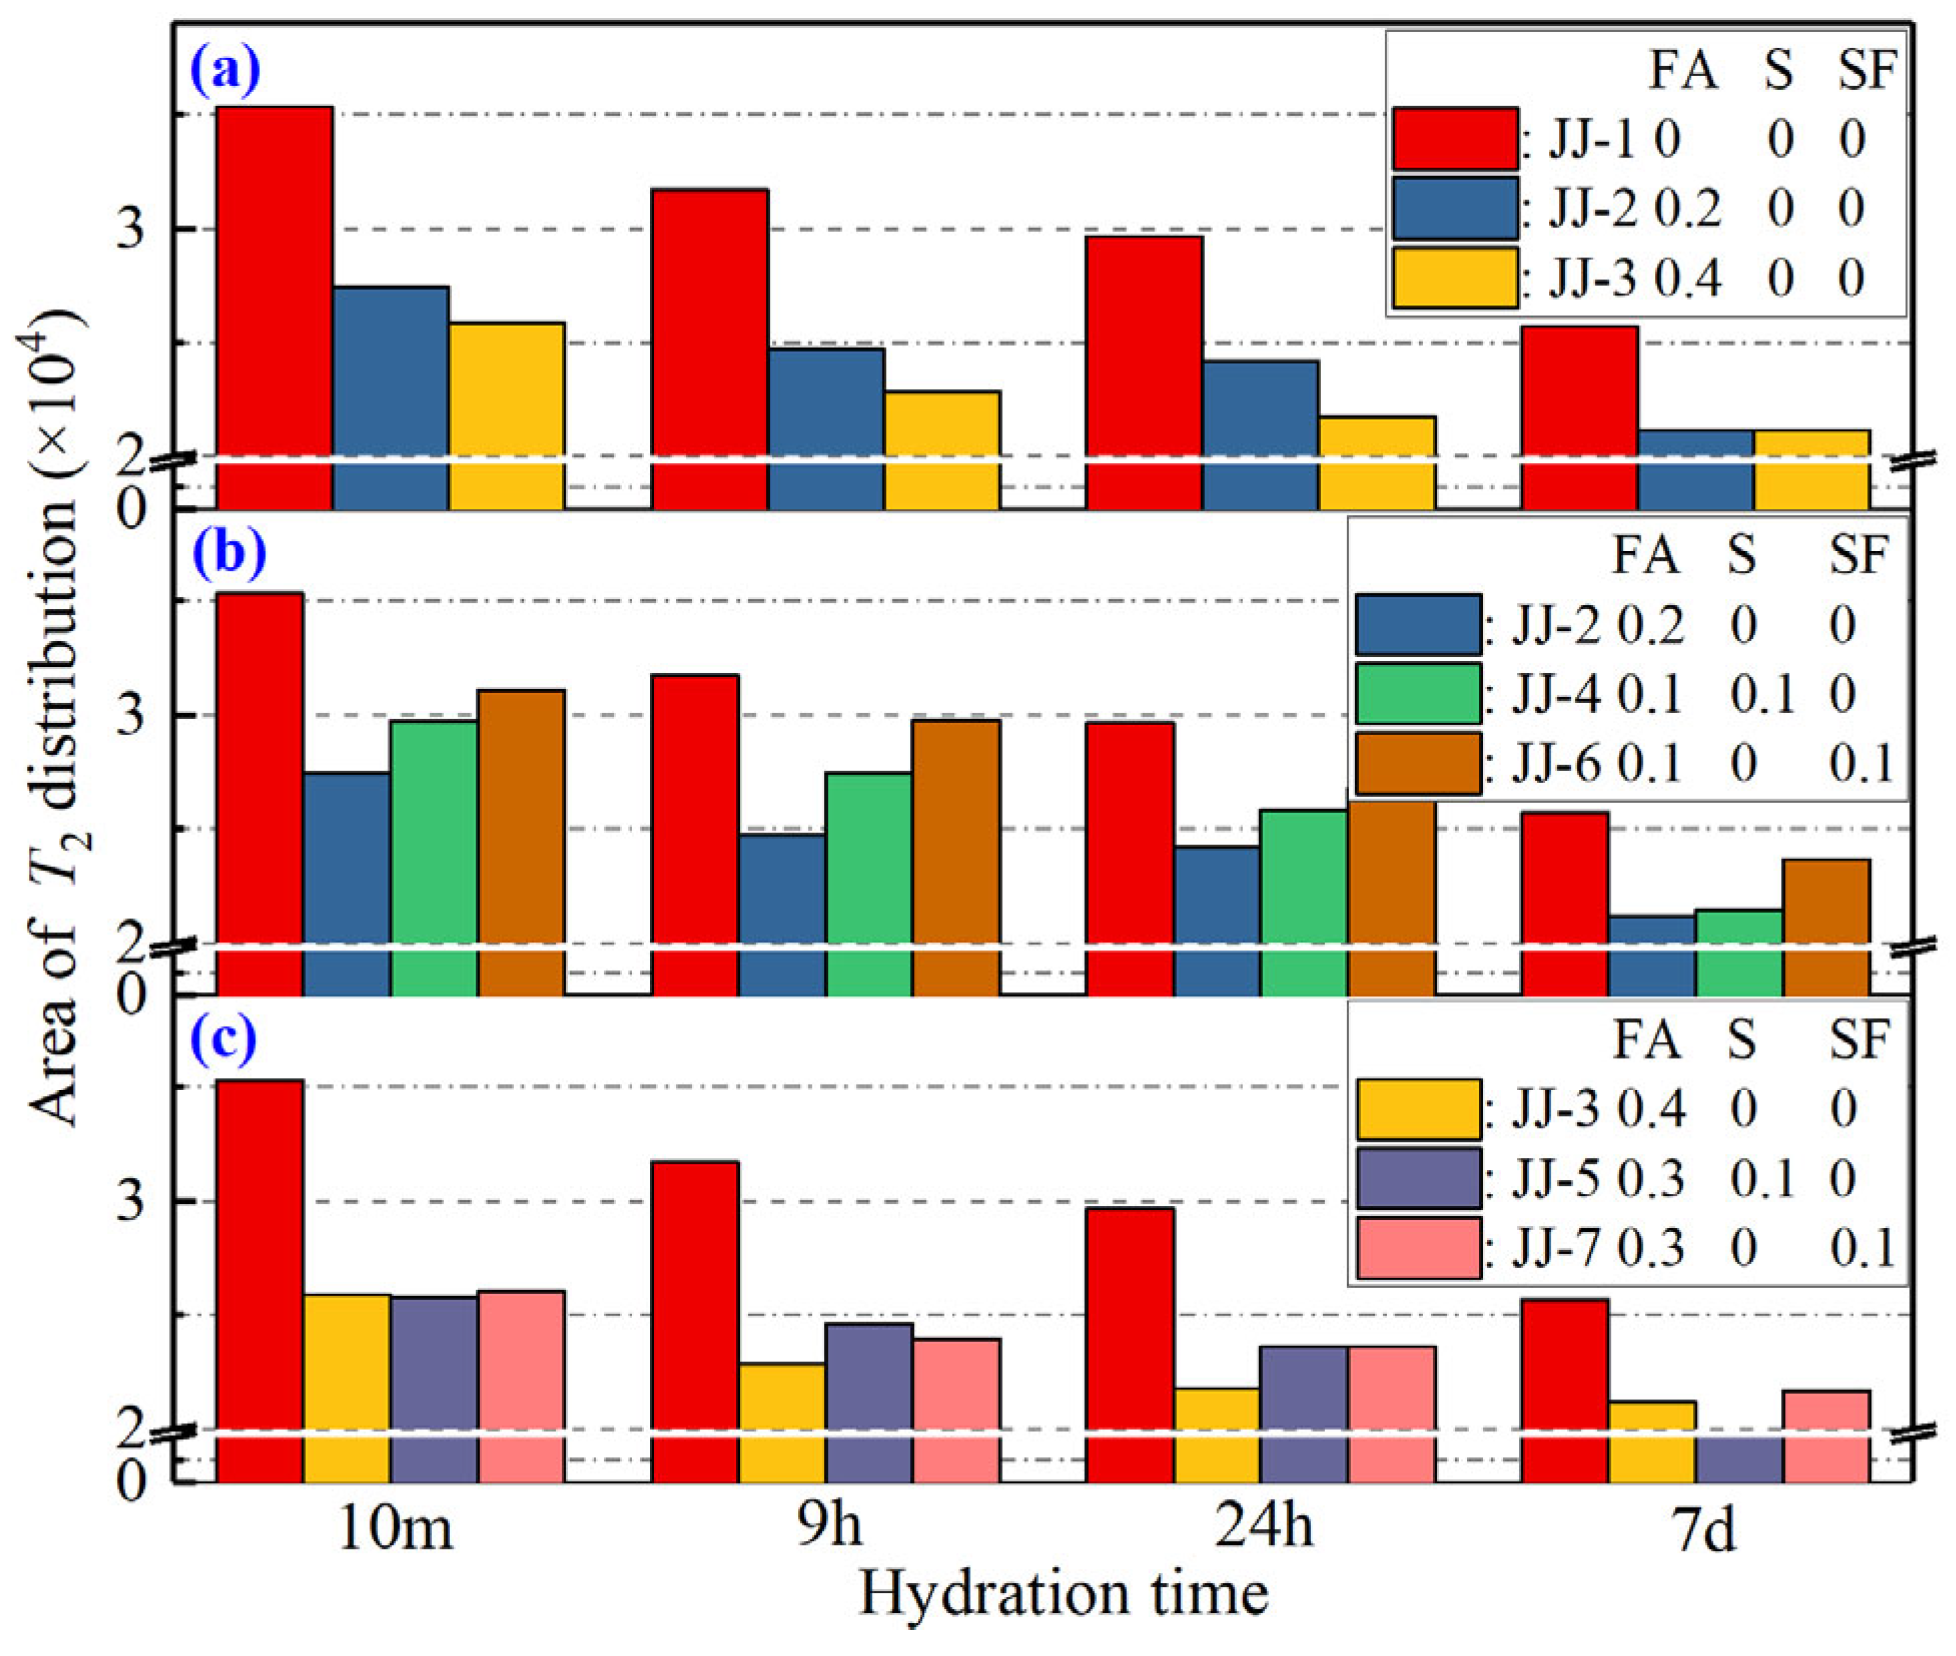
- The relaxation signal area reflects the content of unreacted evaporated water in samples, including the gel water and capillary water. So, the results of the relaxation signal area evolution show that the total content of water consumed by the hydration reaction decreases, and the proportion of gel water obviously increases, while that of capillary water gradually decreases. For MAs, the gel water content decreases with the increase in FA content, and the addition of S and SF also improves the gel water content, and the order of their influence is SF > S > FA.
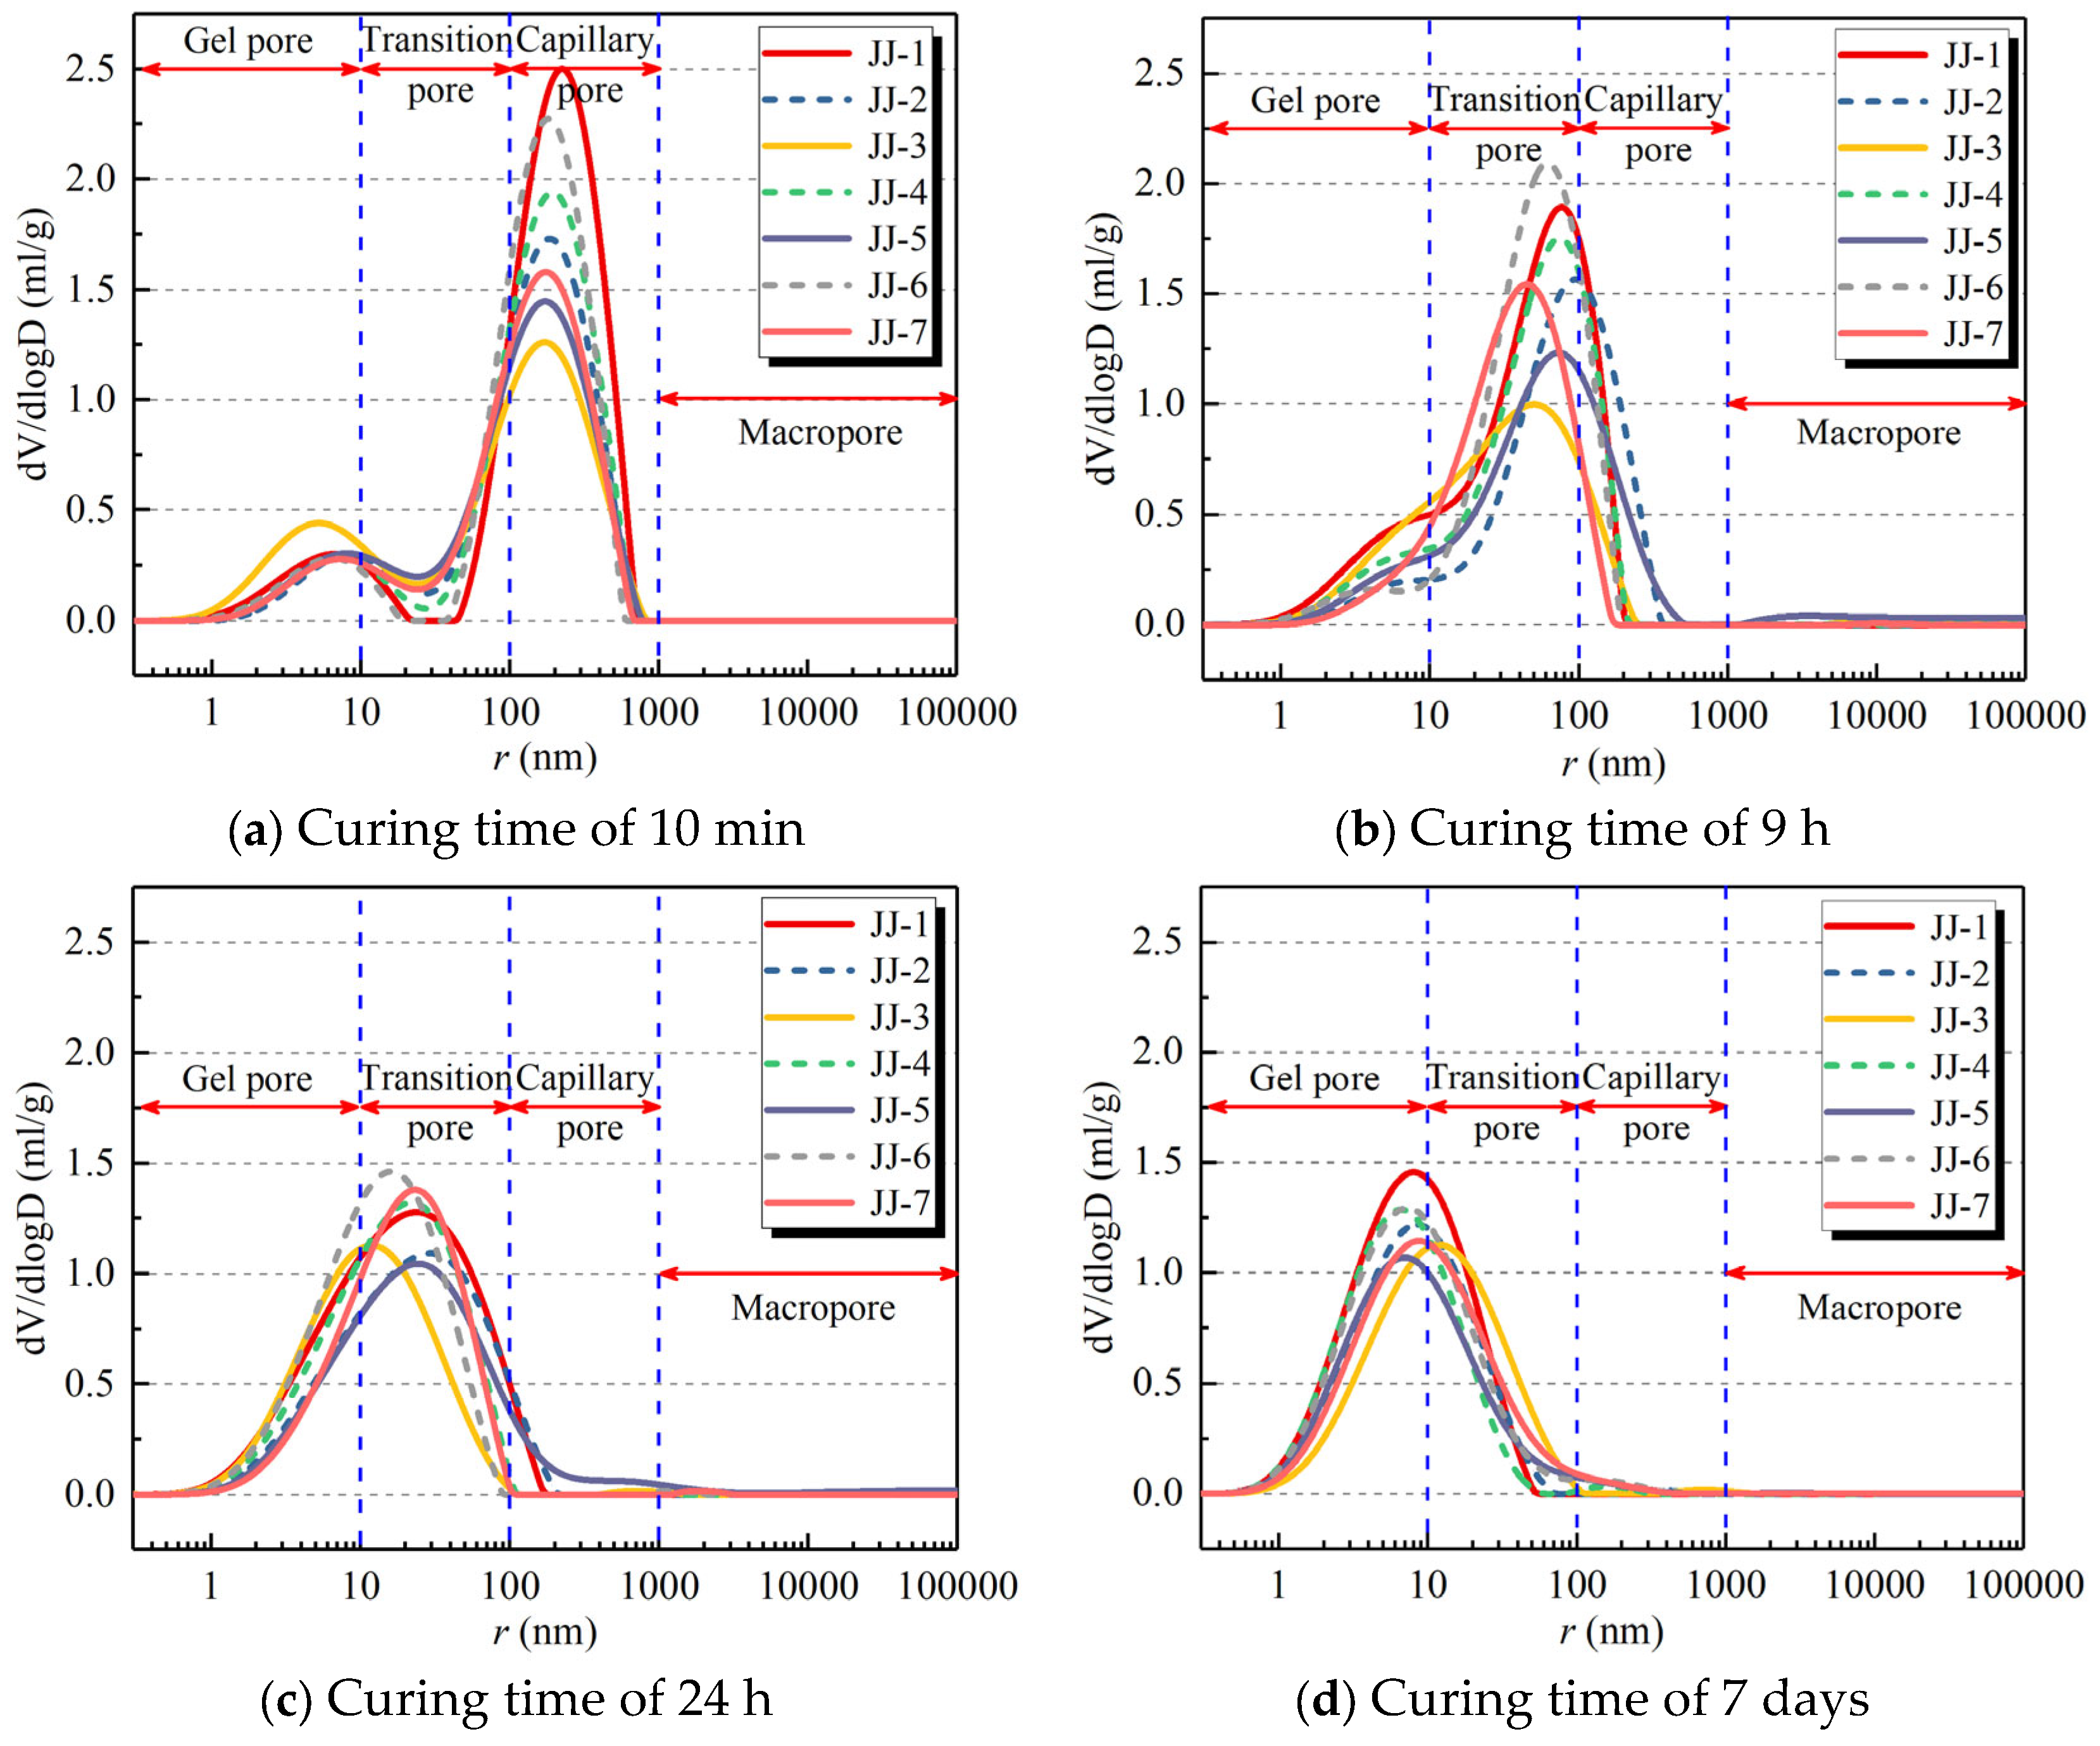
- (4)
- At a curing time of 10 mins, the main pores are capillary pores. With the curing time, the pore size also gradually decreases, leading to an increase in gel pores and transition pores. At 7 days, the main pores are gel pores. Meanwhile, the porosity also decreases with curing time, i.e., without MA, it decreases from 64.8% at 10 mins to 48% at 7 days. With the effect of MA, the porosity of the FA-C (cement) system decreases with the increase in FA content. The addition of S and SF in the FA-C system causes the porosity to increase, and the order of their porosity is SF-FA-C system > S-FA-C system > FA-C system.
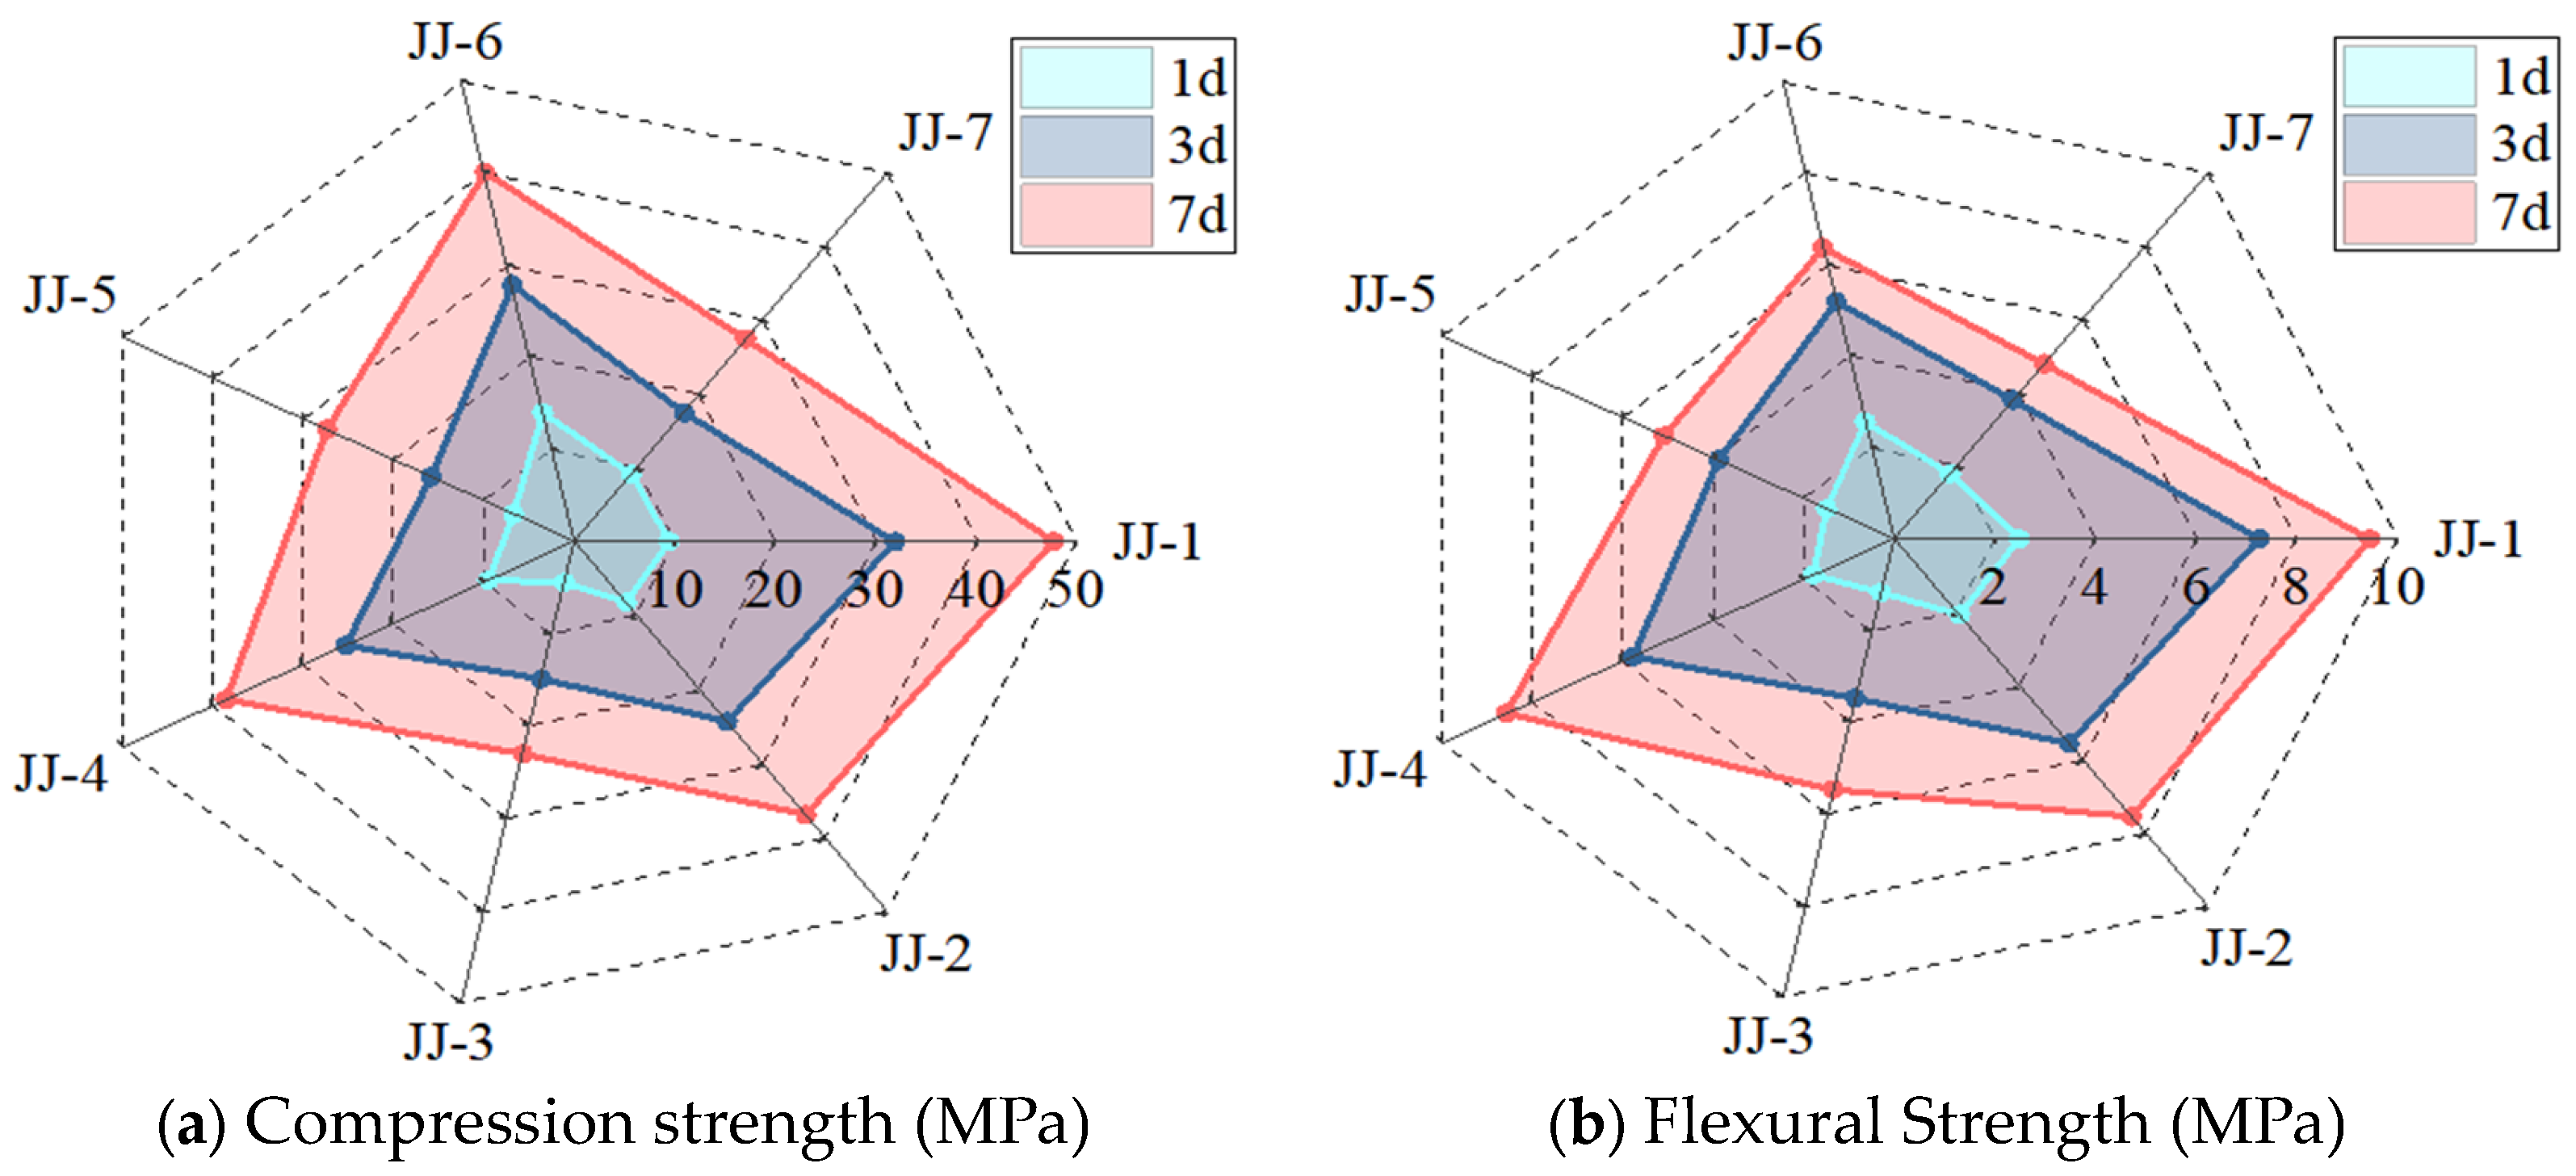
- (5)
- The ranking of the MA contribution to the early strength is SF > S > FA, but significantly lower than cement itself, i.e., the compression strength at the curing time of 7 days is 47.8 MPa for 0%MA, 40.1 MPa for 10%FA + 10%SF, 38.6 MPa for 10%FA + 10%S, and 37 MPa for 20%FA. It indicates that adding multiple types of MA is an effective method to improve early strength while ensuring other performance.
Author Contributions
Funding
Data Availability Statement
Acknowledgments
Conflicts of Interest
References
- Scrivener, K.L.; Juilland, P.; Monteiro, P.J. Advances in understanding hydration of Portland cement. Cem. Concr. Res. 2015, 78, 38–56. [Google Scholar] [CrossRef]
- Izadifar, M.; Natzeck, C.; Emmerich, K.; Weidler, P.G.; Gohari, S.; Burvill, C.; Thissen, P. Unexpected Chemical Activity of a Mineral Surface: The Role of Crystal Water in Tobermorite. J. Phys. Chem. 2022, 126, 12405–12412. [Google Scholar] [CrossRef]
- Izadifar, M.; Königer, F.; Gerdes, A.; Woll, C.; Thissen, P. Correlation between composition and mechanical properties of calcium-silicate-hydrates identified by infrared spectroscopy and density functional theory. J. Phys. Chem. 2019, 123, 10868–10873. [Google Scholar] [CrossRef]
- Scrivener, K.L.; Nonat, A. Hydration of cementitious materials, present and future. Cem. Concr. Res. 2011, 41, 651–665. [Google Scholar] [CrossRef]
- She, A.M.; Ma, K.; Wang, Z.P.; Yao, W. Characterization of hardened cement paste pore structure by low field NMR cryoporometry. J. Build. Mater. 2021, 24, 916–920. [Google Scholar]
- Sun, Y.; Wang, Z.H.; Park, D.J.; Kim, W.S.; Kim, H.S.; Yan, S.R.; Lee, H.S. Analysis of the isothermal hydration heat of cement paste containing mechanically activated fly ash. Thermochim. Acta 2022, 715, 179273. [Google Scholar] [CrossRef]
- Nedunuri, S.S.S.A.; Sertse, S.G.; Muhammad, S. Microstructural study of Portland cement partially replaced with fly ash, ground granulated blast furnace slag and silica fume as determined by pozzolanic activity. Constr. Build. Mater. 2020, 238, 117561. [Google Scholar] [CrossRef]
- Kooshafar, M.; Madani, H. An investigation on the influence of nano silica morphology on the characteristics of cement composites. J. Build. Eng. 2020, 30, 101293. [Google Scholar] [CrossRef]
- Zeng, Q.; Li, K. Reaction and microstructure of cement-fly-ash system. Mater. Struct. 2015, 48, 1703–1716. [Google Scholar] [CrossRef]
- Sun, Y.; Lee, H.S. Using ensemble model to predict isothermal hydration heat of fly ash cement paste considering fly ash content, water to binder ratio and curing temperature. Case Stud. Constr. Mater. 2023, 18, e01984. [Google Scholar] [CrossRef]
- Giergiczny, Z. Fly ash and slag. Cem. Concr. Res. 2019, 124, 105826. [Google Scholar] [CrossRef]
- Naik, T.R.; Singh, S.S.; Hossain, M.M. Permeability of concrete containing large amounts of fly ash. Cem. Concr. Res. 1994, 24, 913–922. [Google Scholar] [CrossRef]
- Cai, Y.M.; Hou, P.K.; Cheng, X.; Du, P.; Ye, Z.M. The effect of nanoSiO2 on the properties of fresh and hardened cement-based materials through its dispersion with silica fume. Constr. Build. Mater. 2017, 148, 770–780. [Google Scholar] [CrossRef]
- Nguyen, V.T.; Lee, S.Y.; Chung, S.Y.; Moon, J.H.; Kim, D.J. Use of multiphase voxels to simulate the effects of nano-silica on cement hydration. Case Stud. Constr. Mater. 2023, 18, e01909. [Google Scholar] [CrossRef]
- Qu, L.; Song, W.H.; Wang, Q.; Xu, S.S.; Hou, C. Effects of hydrophobic modified fly ash on resistance of chloride corrosion and water penetration of cement mortar in the early hydration stage. J. Build. Eng. 2023, 64, 105573. [Google Scholar] [CrossRef]
- Wang, H.; Wu, D.; Mei, Z. Effect of fly ash and limestone powder on inhibiting alkali aggregate reaction of concrete. Constr. Build. Mater. 2019, 210, 620–626. [Google Scholar] [CrossRef]
- He, P.P.; Drissi, S.; Hu, X.; Liu, J.H.; Shi, C.J. Investigation on the influential mechanism of FA and GGBS on the properties of CO2-cured cement paste. Cem. Concr. Compos. 2023, 142, 105186. [Google Scholar] [CrossRef]
- Liu, Z.; Takasu, K.; Koyamad, H.; Suyama, H. A study on engineering properties and environmental impact of sustainable concrete with fly ash or GGBS. Constr. Build. Mater. 2022, 316, 125776. [Google Scholar] [CrossRef]
- Das, P.; Chakraborty, S.; Dubey, B.; Barai, S.V.; Cheela, V.R.S.; Mistri, A. Performance assessment and life cycle analysis of concrete containing ferrochrome slag and fly ash as replacement materials—A circular approach. Constr. Build. Mater. 2022, 347, 128609. [Google Scholar] [CrossRef]
- Nguyen, V.M.; Phung, T.B.; Pham, D.T.; Ho, L.S. Mechanical properties and durability of concrete containing coal mine waste rock, F-class fly ash, and nano-silica for sustainable development. J. Eng. Res. 2023, in press. [Google Scholar] [CrossRef]
- Kumar, M.H.; Saikrishnamacharyulu, I.; Mohanta, N.R.; Ashutosh, A.; Mishra, P.; Smantaray, S. Mechanical behaviour of high strength concrete modified with triple blend of fly ash, silica fume and steel fibers. Mater. Today Proc. 2022, 65, 933–942. [Google Scholar] [CrossRef]
- Huseien, G.F.; Khamehchi, M.; Kubba, Z.; Benjeddou, O.; Mahmoodi, M.J. Freeze-thaw cycle and abrasion resistance of alkali-activated FA and POFA-based mortars: Role of high volume GBFS incorporation. Heliyon 2023, 9, e17672. [Google Scholar] [CrossRef] [PubMed]
- Hasan, M.F.; Hassan, M.A.; Lateef, K.H. Effect of MK and SF on the concrete mechanical properties. Mater. Today Proc. 2021, 42, 2914–2919. [Google Scholar] [CrossRef]
- Shamass, R.; Rispoli, O.; Limbachiya, V.; Kovacs, R. Mechanical and GWP assessment of concrete using Blast Furnace Slag, Silica Fume and recycled aggregate. Case Stud. Constr. Mater. 2023, 18, e02164. [Google Scholar] [CrossRef]
- Sahoo, S.; Parhi, P.K.; Panda, B.C. Durability properties of concrete with silica fume and rice husk ash. Clean. Eng. Technol. 2021, 2, 100067. [Google Scholar] [CrossRef]
- Amin, M.N.; Rehman, K.U.; Shahzada, K.; Khan, K.; Wahab, N.; Alabdullah, A.A. Mechanical and microstructure performance and global warming potential of blended concrete containing rice husk ash and silica fume. Constr. Build. Mater. 2022, 346, 128470. [Google Scholar] [CrossRef]
- Paithankar, D.; Sharma, A.; Thenmozhi, S.; Ramteke, P.; Dhanalakshmi, A.; Sivakumar, S. Influence of glass powder silica fume and scrapped ceramic waste on the mechanical properties of concrete. Mater. Today Proc. 2023, in press. [Google Scholar] [CrossRef]
- Amin, M.; Zeyad, A.M.; Tayeh, B.A.; Agwa, I.S. Effect of ferrosilicon and silica fume on mechanical, durability, and microstructure characteristics of ultra high-performance concrete. Constr. Build. Mater. 2022, 320, 126233. [Google Scholar] [CrossRef]
- Linderoth, O.; Wadsö, L.; Jansen, D. Long-term cement-hydration studies with isothermal calorimetry. Cem. Concr. Res. 2021, 141, 106344. [Google Scholar] [CrossRef]
- Han, F.; Zhang, Z.; Wang, D.; Yan, P. Hydration heat evolution and kinetics of blended cement containing steel slag at different temperatures. Thermochim. Acta 2015, 605, 43–51. [Google Scholar] [CrossRef]
- Garcia, E. Nonevaporable water from neat OPC and replacement materials in composite cement hydrated at different temperatures. Cem. Concr. Res. 2003, 33, 1883–1888. [Google Scholar] [CrossRef]
- Chu, D.C.; Kleib, J.; Amar, M.; Benzerzour, M.; Abriak, N. Determination of the degree of hydration of Portland cement using three different approaches: Scanning electron microscopy (SEM-BSE) and Thermogravimetric analysis (TGA). Case Stud. Constr. Mater. 2021, 15, e00754. [Google Scholar] [CrossRef]
- Scrivener, K.; Ouzia, A.; Juilland, P.; Mohamed, A.K. Advances in understanding cement hydration mechanisms. Cem. Concr. Res. 2019, 124, 105823. [Google Scholar] [CrossRef]
- Krstulović, R.; Dabić, P.A. Conceptual model of the cement hydration process. Cem. Concr. Res. 2000, 30, 693–698. [Google Scholar] [CrossRef]
- Pane, I.; Hansen, W. Investigation of blended cement hydration by isothermal calorimetry and thermal analysis. Cem. Concr. Res. 2005, 35, 1155–1164. [Google Scholar] [CrossRef]
- Zhao, K.Y.; Zhang, P.; Kong, X.M.; Li, H.X.; Zhao, H.T. Recent progress on Portland cement hydration kinetic models and experimental methods. J. Chin. Ceram. Soc. 2022, 50, 1728–1761. [Google Scholar]
- Li, Z.J.; Wei, X.S.; Li, W.L. Preliminary interpretation of hydration process of Portland cement using resistivity measurement. ACI Mater. J. 2003, 100, 253–257. [Google Scholar]
- Yim, H.J.; Bae, Y.H.; Jun, T.B. Hydration and microstructural characterization of early-age cement paste with ultrasonic wave velocity and electrical resistivity measurements. Constr. Build. Mater. 2021, 303, 124508. [Google Scholar] [CrossRef]
- Xu, D.Y.; Chen, H.C.; Hu, Y.; Sun, D.D.; Du, P.; Liu, P. Ultrasonic monitoring and property prediction of cement hydration with novel omnidirectional piezoelectric ultrasonic transducer. J. Build. Eng. 2023, 72, 106612. [Google Scholar] [CrossRef]
- Zhang, J.; Qin, L.; Li, Z.J. Hydration monitoring of cement-based materials with resistivity and ultrasonic methods. Mater. Struct. 2009, 42, 15–24. [Google Scholar] [CrossRef]
- Xu, W.B.; Li, Q.B.; Hu, Y. Water content variations in the process of concrete setting. J. Hydraul Eng. 2017, 36, 92–103. [Google Scholar]
- Li, C.J.; Sun, Z.P.; Li, Q.; Luo, Q. Application of low-field nuclear magnetic resonance in cement-based materials. Mater. Rev. 2016, 30, 133–138. [Google Scholar]
- Gajewicz, A.M.; Gartiner, E.; Kang, K.; Mcdonald, P.J.; Yermakou, V. A 1H NMR relaxometry investigation of gel–pore drying shrinkage in cement pastes. Cem. Concr. Res. 2016, 86, 12–19. [Google Scholar] [CrossRef]
- Cohen, M.H.; Mendelson, K.S. Nuclear magnetic relaxation and the internal geometry of sedimentary rocks. J. Appl. Phys. 1982, 53, 1127–1135. [Google Scholar] [CrossRef]
- Valori, A.; McDonald, P.J.; Scrivener, K.L. The morphology of C-S-H lessons from H-1 nuclear magnetic resonance relaxometry. Cem. Concr. Res. 2013, 49, 65–81. [Google Scholar] [CrossRef]
- Zhao, H.T.; Wu, X.; Huang, Y.Y.; Zhang, P.; Tian, Q.; Liu, J.P. Investigation of moisture transport in cement-based materials using low-field nuclear magnetic response imaging. Mag. Concr. Res. 2021, 73, 252–270. [Google Scholar] [CrossRef]
- Zhang, A.; Ge, Y. 1H Low Field NMR relaxation characteristics of hydration process of while cement modified with silica nanoparticles. J. Chin. Ceram. Soc. 2021, 49, 1662–1669. [Google Scholar]
- Liu, H.; Sun, Z.P.; Yang, J.B.; Ji, Y.L. A novel method for semi-quantitative analysis of hydration degree of cement by 1H low-field NMR. Cem. Concr. Res. 2021, 141, 106329. [Google Scholar] [CrossRef]
- Ji, Y.L.; Sun, Z.P.; Yang, X.; Li, C.J.; Tang, X.B. Assessment and mechanism study of bleeding process in cement paste by 1H low-field NMR. Constr. Build. Mater. 2015, 100, 255–261. [Google Scholar] [CrossRef]
- Zhao, H.T.; Jiang, K.D.; Di, Y.F.; Xu, W.; Li, W.; Tian, Q.; Liu, J.P. Effects of curing temperature and superabsorbent polymers on hydration of early-age cement paste containing a CaO-based expansive additive. Mater. Struct. 2019, 52, 108. [Google Scholar] [CrossRef]
- Zhao, H.T.; Ding, J.; Huang, Y.Y.; Tang, Y.M.; Xu, W.; Huang, D.H. Experimental analysis on the relationship between pore structure and capillary water absorption characteristics of cement-based materials. Struct. Concr. 2019, 20, 1750–1762. [Google Scholar] [CrossRef]
- Brownstein, K.R.; Tarr, C.E. Importance of classical diffusion in NMR studies of water in biological cells. Phys. Rev. A 1979, 19, 2446–2453. [Google Scholar] [CrossRef]
- Song, Y.Q. Magnetic resonance of porous media (MRPM): A perspective. J. Magn. Reson. 2013, 229, 12–24. [Google Scholar] [CrossRef] [PubMed]
- Muller, A.C.A.; Scrivener, K.L.; Gajewicz, A.M.; McDonald, P.J. Densification of C-S-H measured by 1H NMR relaxometry. J. Phys. Chem. C 2013, 117, 403–412. [Google Scholar] [CrossRef]
- Fu, J.X.; Wang, K.; Wang, J. Internal pore evolution and early hydration characterization of fly ash cement backfill. J. Build. Eng. 2023, 72, 106716. [Google Scholar] [CrossRef]
- Juenger, M.C.G.; Jennings, H.M. Examining the relationship between the microstructure of calcium silicate hydrate and drying shrinkage of cement pastes. Cem. Concr. Res. 2002, 32, 289–296. [Google Scholar] [CrossRef]
- Poli, T.; Toniolo, L.; Valentini, M.; Bizzaro, G.; Melzi, R.; Tedoldi, F.; Cannazza, G. A portable NMR device for the evaluation of water presence in building materials. J. Cult. Herit. 2007, 8, 134–140. [Google Scholar] [CrossRef]
- Bertram, H.C.; Jandersen, H.; Karlsson, A.H. Comparative study of low-field NMR relaxation measurements and two traditional methods in the determination of water holding capacity of pork. Meat Sci. 2001, 57, 125–132. [Google Scholar] [CrossRef]
- Liu, L.; He, Z.; Cai, X.; Fu, S.J. Application of low-field NMR to the pore structure of concrete. Appl. Magn. Reson. 2021, 52, 15–31. [Google Scholar] [CrossRef]
- Wang, Y.; Burris, L.; Hooton, R.D.; Shearer, C.R.; Suraneni, P. Effects of unconventional fly ashes on cementitious paste properties. Cem. Concr. Compos. 2022, 125, 104291. [Google Scholar] [CrossRef]
- Pipikaki, P.; Katsioti, M. Study of the hydration process of quaternary blended cements and durability of the produced mortars and concretes. Constr. Build. Mater. 2009, 23, 2246–2250. [Google Scholar] [CrossRef]
- Wen, X.D.; Yin, G.J.; Xia, L.; Zhou, M.; Feng, L.; Wu, J.Y. Spatiotemporal evolution of water and pore structure in cement-based materials containing SRA by LF NMR. Mater. Today Commun. 2023, 35, 106076. [Google Scholar]
- Xu, Z.H.; Guo, Z.H.; Zhao, Y.S. Hydration of blended cement with high-volume slag and nano-silica. J. Build. Eng. 2023, 64, 105657. [Google Scholar] [CrossRef]
- Whittaker, M.; Zajac, M.; Haha, M.B.; Bullerjahn, F.; Black, L. The role of the alumina content of slag, plus the presence of additional sulfate on the hydration and microstructure of Portland cement-slag blends. Cem. Concr. Res. 2014, 66, 91–101. [Google Scholar] [CrossRef]
- Li, W.Y.; Yin, J.H.; Wang, J.; Yang, H.J.; Kong, X.M. Principles and applications of low-field nuclear magnetic resonance in cementitious materials. J. Chin. Ceram. Soc. 2022, 50, 2992–3008. [Google Scholar]
- Scrivener, K.; Snellings, R.; Lothenbach, B. A Practical Guide to Microstructural Analysis of Cementitious Materials; Science Press: Beijing, China, 2021. [Google Scholar]
- Gorce, J.P.; Milstone, N.B. Probing the microstructure and water in composite cement blends. Cem. Concr. Res. 2007, 37, 310–318. [Google Scholar] [CrossRef]
- Faure, P.; Care, S.; Magat, J.; Chaussadent, T. Drying effect on cement paste porosity at early age observed by NMR methods. Constr. Build. Mater. 2012, 29, 496–503. [Google Scholar] [CrossRef]
- Wu, F.F.; Shi, K.B.; Dong, S.K.; Chen, S.S.; Ci, J.; Wang, X.; Zhang, K. Influence of admixture and water-cement ratio on hydration products and mechanical properties of cement-based materials. Trans. Chin. Soc. Agric. Eng. 2016, 32, 119–126. [Google Scholar]
- Golewski, G.L. The role of pozzolanic activity of siliceous fly ash in the formation of the structure of sustainable cementitious composites. Sustain. Chem. 2022, 3, 520–534. [Google Scholar] [CrossRef]


| SiO2 | Al2O3 | Fe2O3 | CaO | MgO | SO2 | Na2O | f-CaO | Cl- | Loss |
|---|---|---|---|---|---|---|---|---|---|
| 20 | 4/40 | 3.27 | 63.34 | 2.90 | 2.42 | 0.59 | 0.87 | 0.02 | 1.54 |
| Physical property | Fineness (45 mm Square Hole Sieve) (%) | Water Demand Ratio (%) | Strength Activity Index (%) | Water Content (%) | Density (g/cm3) |
| 20 | 98 | 86 | 0.52 | 2.25 | |
| Chemical composition | SO3 (%) | f-CaO (%) | SiO2 (%) | Al2O3 (%) | Fe2O3 (%) |
| 2.16 | 0.26 | 50.26 | 31.14 | 4.16 |
| Physical property | Specific Surface Area (m2/kg) | Flow Ratio (%) | 7 Days Activity Index (%) | Water Content (%) | Density (g/cm3) | |
| 429 | 98 | 84.2 | 0.45 | 3.1 | ||
| Chemical composition | SO3 (%) | MgO (%) | CaO (%) | SiO2 (%) | Al2O3 (%) | Fe2O3 (%) |
| 1.64 | 6.01 | 34 | 34.5 | 17.7 | 1.03 | |
| Number | W/C | Cementitious Material | |||
|---|---|---|---|---|---|
| Cement (C) | Fly ash (FA) | Slag (S) | Silica Fume (SF) | ||
| JJ-1 | 0.4 | 1 | 0 | 0 | 0 |
| JJ-2 | 0.4 | 0.8 | 0.2 | 0 | 0 |
| JJ-3 | 0.4 | 0.6 | 0.4 | 0 | 0 |
| JJ-4 | 0.4 | 0.8 | 0.1 | 0.1 | 0 |
| JJ-5 | 0.4 | 0.6 | 0.3 | 0.1 | 0 |
| JJ-6 | 0.4 | 0.8 | 0.1 | 0 | 0.1 |
| JJ-7 | 0.4 | 0.6 | 0.3 | 0 | 0.1 |
Disclaimer/Publisher’s Note: The statements, opinions and data contained in all publications are solely those of the individual author(s) and contributor(s) and not of MDPI and/or the editor(s). MDPI and/or the editor(s) disclaim responsibility for any injury to people or property resulting from any ideas, methods, instructions or products referred to in the content. |
© 2023 by the authors. Licensee MDPI, Basel, Switzerland. This article is an open access article distributed under the terms and conditions of the Creative Commons Attribution (CC BY) license (https://creativecommons.org/licenses/by/4.0/).
Share and Cite
Tang, Y.-J.; Shan, Z.-Q.; Yin, G.-J.; Miao, L.; Wang, S.-S.; Zhang, Z.-Y. Low-Field Nuclear Magnetic Resonance Investigation on Early Hydration Characterization of Cement Paste Mixed with Mineral Admixtures. Buildings 2023, 13, 2318. https://doi.org/10.3390/buildings13092318
Tang Y-J, Shan Z-Q, Yin G-J, Miao L, Wang S-S, Zhang Z-Y. Low-Field Nuclear Magnetic Resonance Investigation on Early Hydration Characterization of Cement Paste Mixed with Mineral Admixtures. Buildings. 2023; 13(9):2318. https://doi.org/10.3390/buildings13092318
Chicago/Turabian StyleTang, Yu-Juan, Zi-Qi Shan, Guang-Ji Yin, Ling Miao, Sai-Sai Wang, and Zhen-Ya Zhang. 2023. "Low-Field Nuclear Magnetic Resonance Investigation on Early Hydration Characterization of Cement Paste Mixed with Mineral Admixtures" Buildings 13, no. 9: 2318. https://doi.org/10.3390/buildings13092318