Article

Experimental and Analytical Investigations on Shear Performance of Ambient-Cured Reinforced Geopolymer Concrete Beams

by
Muhammad Abdullah
1,2,
Asad Ullah Qazi
1,
Qasim S. Khan
1,
Syed Minhaj Saleem Kazmi
3,* and
Muhammad Junaid Munir
3,*
1
Department of Civil Engineering, University of Engineering and Technology, Lahore 54890, Punjab, Pakistan
2
Department of Civil and Environmental Engineering, Nagoya University, Nagoya 464-8601, Japan
3
Guangdong Provincial Key Laboratory of Durability for Marine Civil Engineering, Shenzhen University, Shenzhen 518060, China
*
Authors to whom correspondence should be addressed.
Buildings 2024, 14(1), 204; https://doi.org/10.3390/buildings14010204
Submission received: 5 December 2023 / Revised: 2 January 2024 / Accepted: 10 January 2024 / Published: 12 January 2024
(This article belongs to the Section Building Materials, and Repair & Renovation)

Abstract

:
Geopolymer concrete (GPC) has emerged as a sustainable alternative to ordinary Portland cement concrete (OPCC) as GPC significantly reduces embodied carbon dioxide emissions. This study compared the shear behavior of reinforced OPCC beams and GPC beams of the same cross-section and compressive strength. The study tested nine beams under three-point bending to evaluate the effects of concrete type and shear span on the shear strength. The results showed that OPCC and GPC beams exhibited relatively similar reduction rates in the shear strength with increasing a / d ratios, while the failure mode shifted from shear in OPCC beams to shear-flexure in GPC beams. The maximum deflection of GPC beams significantly increased with increasing a / d ratios. Moreover, empirical shear strength equations, intended for OPCC beams in various design codes, underestimated the shear strength of GPC beams by about 11.0-26.9% at the a / d ratio of 4.3 but significantly underestimated the shear strengths of GPC beams by 77% at lower a / d ratios of 1.6 and 2.9. Therefore, modifications are proposed to the existing design OPCC shear strength equations to significantly improve the prediction accuracy for the shear strength of GPC beams.

1. Introduction

In the last two decades, worldwide annual cement production increased from 0.9 to 4.2 billion tons. Cement is one of the main constituents of ordinary Portland cement concrete (OPCC). The cement industry accounts for approximately 5–7% of global greenhouse gas emissions [1,2,3,4,5,6]. The energy-intensive process of OPCC production is one of the main causes of the rising levels of carbon dioxide (CO2) and greenhouse gases released into the environment [7]. This signifies the need to reduce cement use in the construction industry, ultimately cement-free concrete, i.e., geopolymer concrete [8,9,10,11].
In the last decade, numerous studies investigated either partial or complete replacement of Portland cement with various aluminosilicate materials, such as fly ash, rice husk ash, metakaolin, etc., to produce geopolymer concrete (GPC) [12,13,14,15]. These materials are industrial waste obtained from construction, minerals, energy, and steel industries. GPC is considered an environmentally friendly concrete, which eliminates the use of cement in concrete and subsequently reduces CO2 emissions by 22–72% [16,17,18,19]. Geopolymers are formed by the chemical reaction between aluminosilicate materials and alkaline activator solutions during the geopolymerization phenomenon. In this reaction, 3D polymeric ring structures of aluminosilicate (Si-O-Al-O) are formed, which condenses to give strength to the geopolymers [12].
Fly ash is one of the widely used precursors in developing GPC and is abundantly available in many parts of the world. Previous studies investigated the mechanical properties and durability of fly ash-based GPC. These studies noted that both ambient-cured and oven-cured GPC exhibit mechanical properties different from OPCC [19,20,21,22,23,24]. Diaz-Loya et al. [19] noted that the modulus of elasticity (MOE) of GPC specimens oven-cured at 60 °C for 72 h was 16.2% lower than that of their OPCC counterpart. Farhan et al. [20] reported that the MOE of GPC cured at 80 °C for 24 h was about 12.5% lower than that of OPCC for similar compressive strength. Nath and Sarker [21] noted that the MOE of ambient-cured GPC was about 25–30% lower than that of the corresponding OPCC. Ghafoor et al. [22] investigated the effect of varying concentrations of alkaline activators (8 M to 16 M) on the mechanical properties of ambient-cured GPC. The study found that the compressive and flexural strengths of GPC increased by about 106% and 59% with increasing concentrations of alkaline activators, respectively. Aliabdo et al. [23] noted that GPC oven-cured at 50 °C for 48 h prepared with 16 M solutions of NaOH exhibited 42.1% higher compressive strength and 47.3% higher tensile strength than GPC prepared with 12 M solutions of NaOH. Verma et al. [24] found that the peak flexural load of ambient-cured GPC increased by 60% with an increase in the molarity of NaOH from 8 M to 16 M.
In the available literature, a number of research studies reported that the peak flexural load of heat-cured fly ash-based GPC beams was 6.8–33% higher than the corresponding OPCC beams [25,26]. Moreover, ambient-cured GPC beams exhibited 8.7–53% higher peak flexural loads than OPCC beams [27,28].
For the shear performance, previous studies reported the influence of the shear span to effective depth ( a / d ) ratio on the shear capacity of OPCC beams [29,30,31]. These studies reported that the shear strength of OPCC beams is reduced up to 59% with increasing a / d ratio from 1.0 to 4.1. Similarly, the studies reported that GFRP shear-reinforced GPC beams exhibited 51.8% reduced shear strength with increasing a / d ratio from 1.0 to 4.7. Moreover, the behavior of beams changed from tie-arch action to beam action with increasing a / d ratios [32,33]. Furthermore, Nagajothi et al. [34] reported that BFRP-reinforced GPC beams exhibited insignificant change in shear strength with increasing a / d ratio from 3.6 to 4.3.
Previous studies also investigated the effect of shear span to effective depth ratios on the shear strength of GPC beams under different curing conditions. Shibayama and Nishiyama [35] reported that the shear strength of GPC beams under steam curing exhibited 40.4% reduced shear strength with increasing a / d ratio from 1.0 to 2.0. Other studies showed that the shear strength of oven-cured GPC beams reduced by 50–55% as the a / d ratio was increased from 1.5 to 4.0 [15,36]. Moreover, limited studies investigated the influence of a / d ratio on the shear strength of ambient-cured GPC beams and reported a 30% decrease in shear strength with increasing a / d ratios from 2.0 to 6.0 [12,37,38,39]. Therefore, in this study, the shear performance of ambient-cured reinforced GPC beams is investigated by considering the effect of a / d ratios of 1.6, 2.9, and 4.3, and a comparison is made with the corresponding OPCC beams.
Furthermore, the existing design procedures in ACI 318-19 [40], ACI 318-14 [41], fib Model Code-10 [42], and JSCE-SSCS-07 [43] are intended for OPCC beams, while the applicability of these existing design guides for GPC is questionable since contradicting suggestions were found in the literature [39,44,45]. There has been no design code yet to predict the shear strength of GPC beams. Therefore, this study evaluates the prediction accuracy of the available empirical relationships intended for OPCC beams to estimate the shear strength of GPC beams and propose new equations to predict the shear strength of GPC beams with greater accuracy.

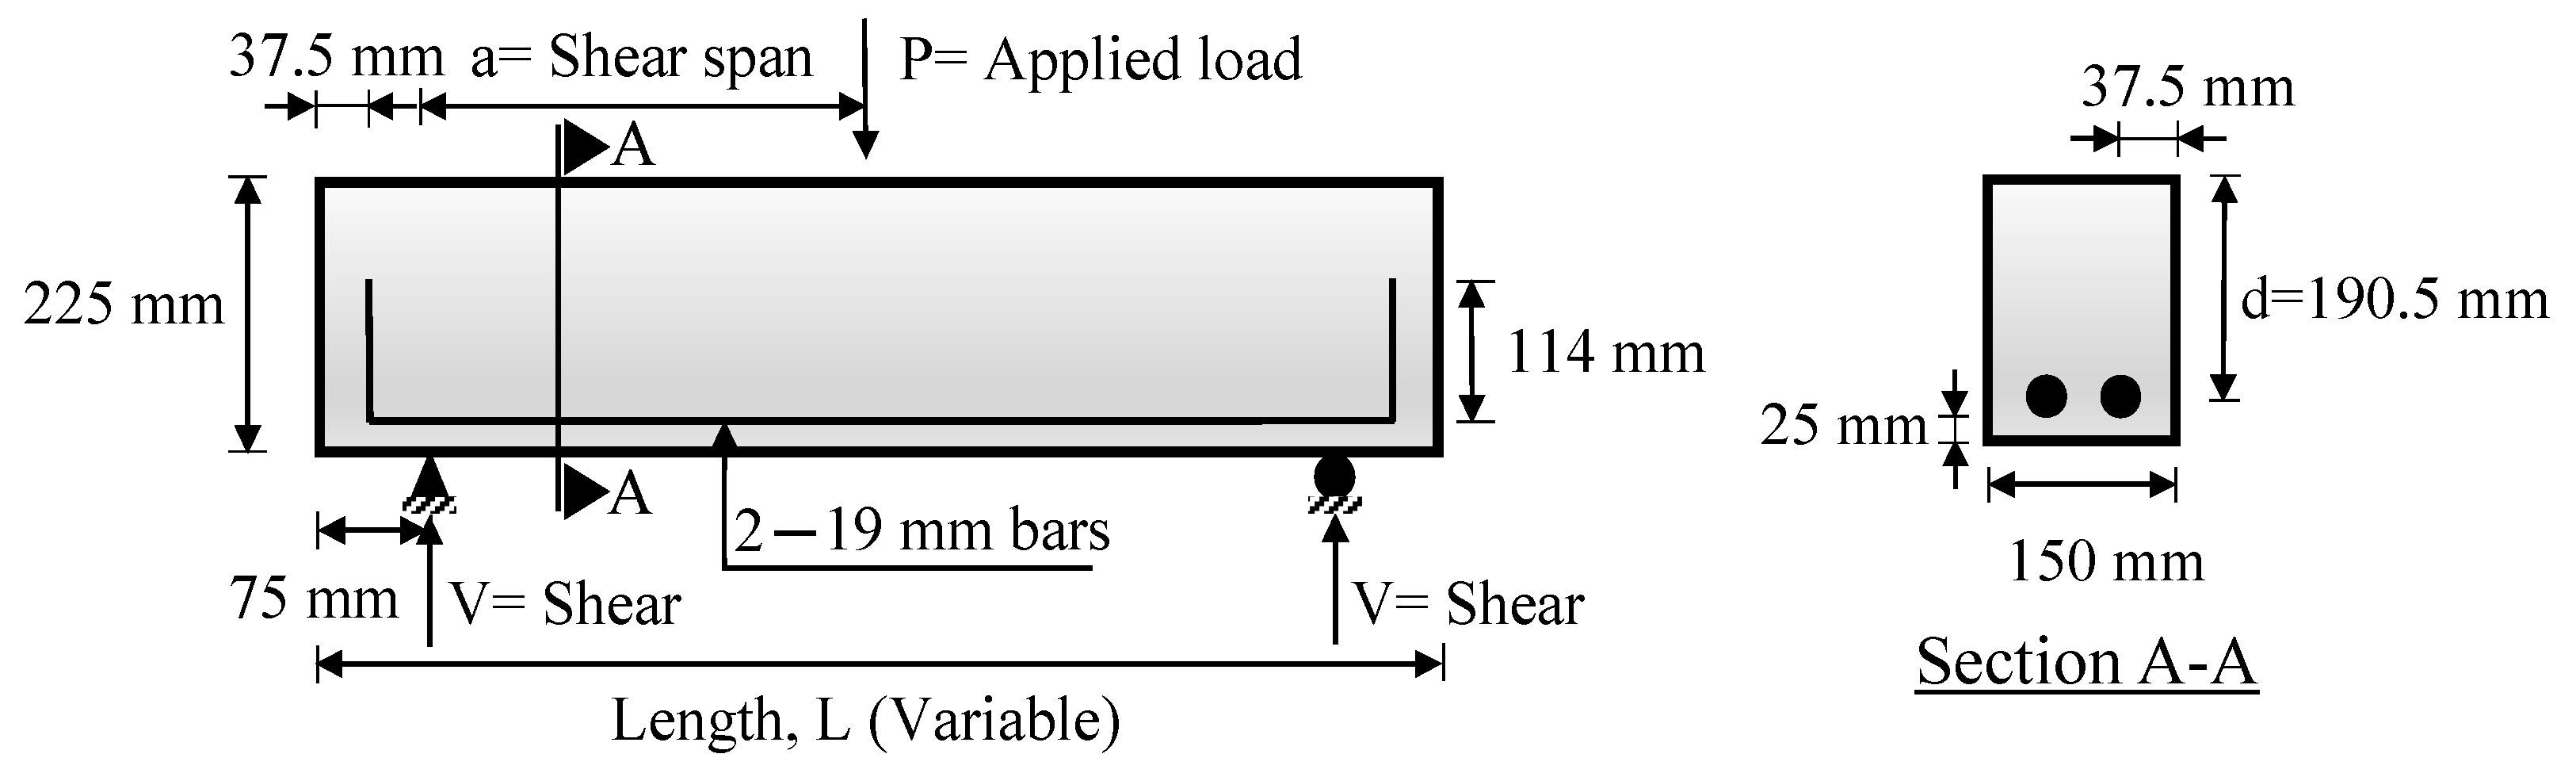
2. Experimental Program

2.1. Materials

2.1.1. Fly Ash

Fly ash (FA) obtained from Sahiwal Coal Power Plant in Punjab, Pakistan, was used as a binder in GPC. The chemical compositions of FA samples were investigated in the Wet Analysis Lab, UET Lahore, Pakistan, per ASTM C618-12a [46], and the results are presented in Table 1. Fly ash (FA) was classified as Class F as per ASTM C618-12a [46]. The sum of SiO2, Al2O3, and Fe2O3 was larger than 70%, the amount of CaO was less than 18%, the amount of SO3 was smaller than 5%, and the loss on ignition was smaller than 6%. The FA contained a significant percentage of CaO (14.12%); hence, GPC without the addition of slag was prepared, as in Ghafoor et al. [22].

2.1.2. Aggregates

Coarse aggregates (Sargodha crush) and locally available river sand (Lawrencepur sand) were used in concrete mixes. The maximum size of coarse aggregates was 10 mm in accordance with ASTM C136-19 [47]. The loose bulk density of coarse aggregates was 1637 kg/m3, as per ASTM C29-17 [48]. The fineness modulus of river sand was 1.63, as per ASTM C33-18 [49]. To ensure consistency, similar grading of coarse aggregates and fine aggregates was used in all batching of OPC and GPC. Moreover, the moisture content of sand was determined in all batching to adjust the amount of water, and hence, the total amount of liquid should remain the same in all mixes.

2.1.3. Alkaline Activator Solution

Alkaline activator solution comprised sodium silicate (Na2SiO3) solution and 16 M sodium hydroxide (NaOH) solution with the Na2SiO3/NaOH ratio of 2.5:1. The Na2SiO3 solution was obtained from a local vendor comprising 54% liquids and 46% solids. The NaOH was obtained in pellet form with 98% purity. To prepare the 16 M NaOH solution, 640 g of NaOH pellets were dissolved in 1000 mL of distilled water. The alkaline activator solution was prepared about 24 h before casting, as the preparation of the alkaline activator solution is an exothermic process. It is noted that 16 M NaOH solution was used to attain the target cylinder strength of GPC in GPC beams despite workability issues during casting [24,50,51,52,53,54].

2.1.4. Steel Reinforcement

Two 19-mm deformed Grade 420 steel bars were used as flexural reinforcement in all the beams. The Grade 420 steel samples were tested in the Strength of Materials Laboratory, UET Lahore, Pakistan, in accordance with ASTM A615/A615M-20 [55]. The modulus of elasticity, yield strength, and ultimate tensile strength of these deformed bars were 206 GPa, 417.5 MPa, and 530 MPa, respectively.

2.2. Test Matrix

In this experimental program, three OPCC beam (OPCCB) specimens and six GPC beam (GPCB) specimens of the same cross-section (150 mm × 225 mm) with different lengths (762 mm, 1268 mm, and 1774 mm) were cast and tested. The beams were longitudinally reinforced with two 19-mm deformed bars on the tension side without any shear reinforcement; a bottom concrete cover of 25 mm and a side effective concrete cover of 37.5 mm was provided. The distance between the support and beam ends was kept at 75 mm, as shown in Figure 1. The shear span ( a ) is the distance between the support and the loading point, and the effective depth ( d ) is the vertical distance from extreme compression fiber to the centroid of longitudinal tension reinforcement.
The specimens were divided into three groups (Groups I, II, and III) based on the shear span ( a ) to effective depth ( d ) ratio. In each group, one OPCCB and two identical GPCB were cast and tested. Group-I comprised 762 mm long beams with the a / d ratio of 1.6, Group-II comprised 1268 mm long beams with the a / d ratio of 2.9, and Group-III comprised 1774 mm long beams with the a / d ratio of 4.3. The test matrix is presented in Table 2.
Based on ACI-ASCE [56], Group-I beams ( a / d   = 1.6) are classified as short beams, and Group-II beams ( a / d   = 2.9) and Group-III beams ( a / d   = 4.3) are classified as ordinary shallow beams. Usually, beams with a / d between 1.0 to 2.5 develop inclined cracks, and after redistribution of internal forces, they can carry an additional load by the arch action. The final failure of such beams is caused by bond failure, a splitting failure, or a dowel failure along with the yielding of tension reinforcement or crushing of concrete on the compression side along with diagonal shear cracks known as shear compression failure [57]. However, it is important to note that the beams studied in this study are without shear stirrups.
The beams were designated based on the concrete type (OPCC and GPC) and a / d ratio (1.6, 2.9, and 4.3). For instance, Specimen OPCCB-2.9 represents the OPCC beam (OPCCB) with the a / d ratio of 2.9. Specimen GPCB-1.6-1 represents the GPC beam (GPCB) with the a / d ratio of 1.6 and is the first of the two identical GPC beams tested in the group.

2.3. Preparation of the Test Specimens
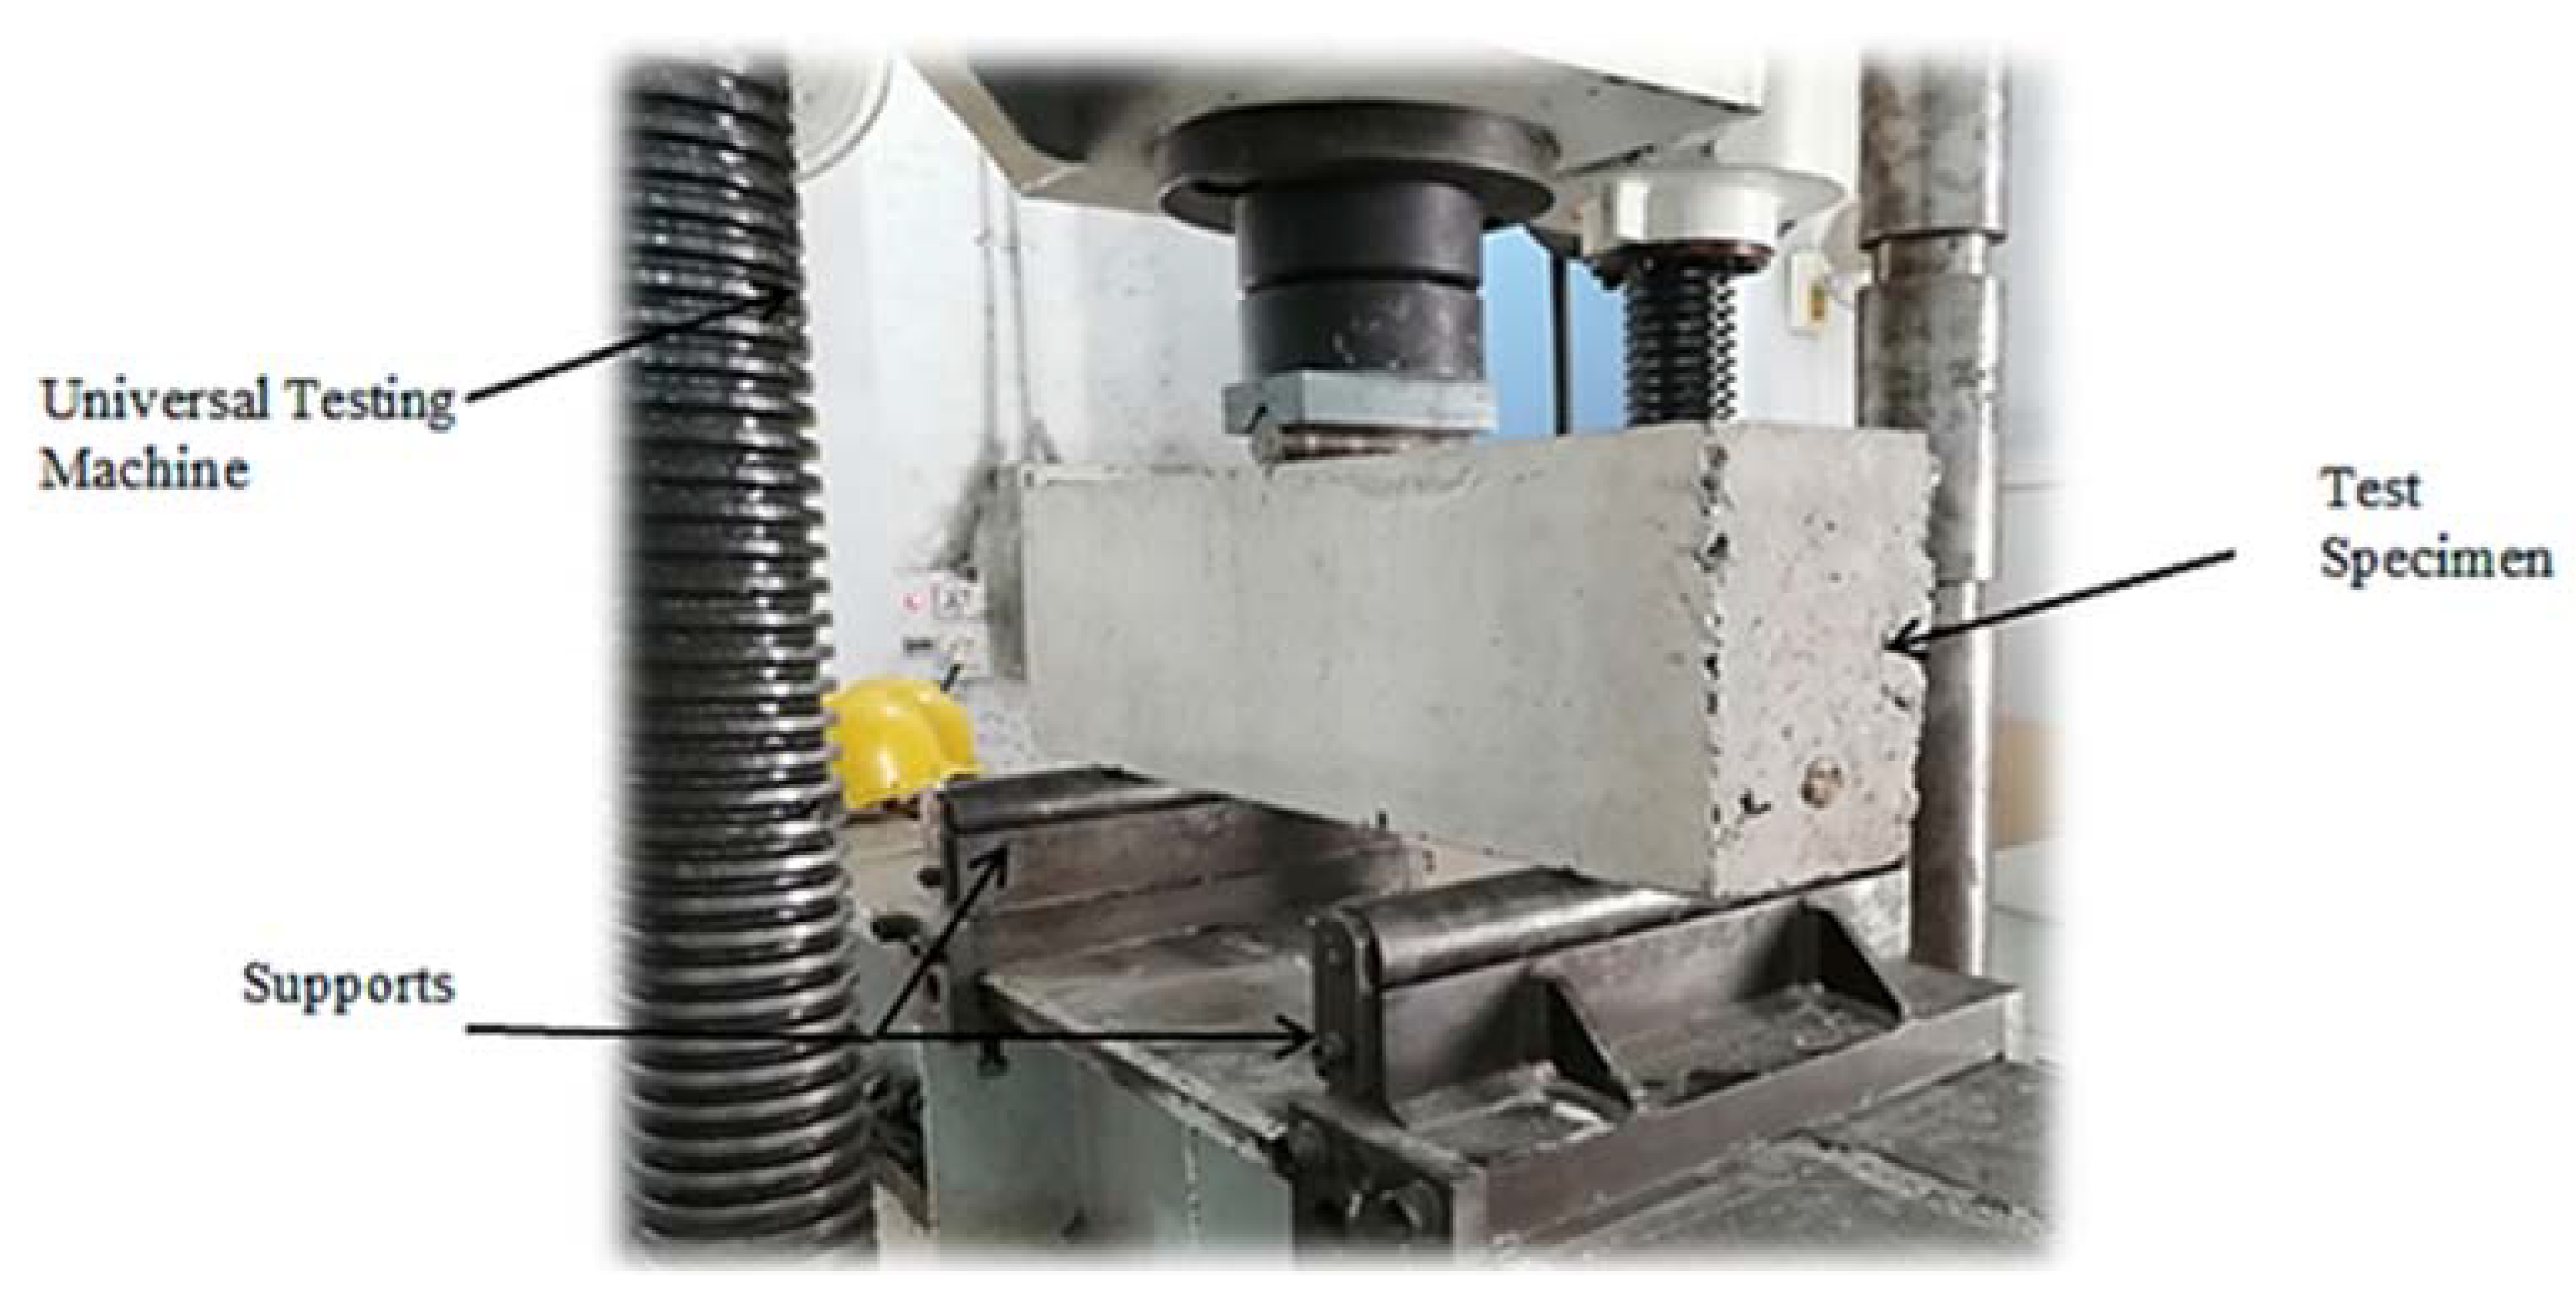
A total of three control OPCCB and six GPCB specimens were cast in the Plain and Reinforced Concrete (PRC) Laboratory, UET Lahore, Pakistan. The mix details of the OPCC and GPC are presented in Table 3. The target compressive strength, f c , was 21 MPa. The water-to-cement (w/c) ratio in OPCC beams was kept at 0.45, and the alkaline activator to fly ash ratio in GPC was kept at 0.40, considering the moisture content of aggregates. In past studies, the AA/FA ranged between 0.25–0.63 [5,9,13,15,20,21,22,23,24,27,50,51,52,53,54].
To cast the beams, steel formworks with internal dimensions of 150 mm × 225 mm × 762 mm, 150 mm × 225 mm × 1268 mm, and 150 mm × 225 mm × 1774 mm were prepared. Two 19 mm deformed steel bars were placed on the tension side (bottom) in the formwork over steel spacers to provide the required side effective concrete cover of 37.5 mm and bottom concrete cover of 25 mm. The ends of the bars were bent at 90° for an anchorage ( 6 d b = 114   m m ) of longitudinal steel bars. Moreover, no shear reinforcement was provided in the beams to investigate the pure contribution of the plain concrete in resisting shear stresses. The flexural reinforcement ratio ( ρ ) of all beams was 1.98%, which is smaller than the balanced flexural reinforcement ratio ( ρ b = 2.25–2.64%) and greater than the maximum flexural reinforcement ratio ( ρ m a x = 1.53–1.66%). The beam cross-sections were kept in a transition domain ( ρ m a x < ρ < ρ b ), so that the upward propagation of the neutral axis could be delayed, and the shear capacity was reached before the yielding of the flexural reinforcing steel. Accordingly, it reduced the ductility of the beams, but ultimately, the shear behavior governed the failure mechanism rather than flexure. A similar design approach was also used by Wu et al. [36], Kawamura et al. [58], and Abdullah et al. [59] to investigate the shear failure in beams. Wu et al. [36] provided ρ = 2.72%, which was larger than ρ m a x = 2.14% and smaller than ρ b = 3.38%, whereas Kawamura et al. [58] and Abdullah et al. [59] used ρ = 1.89%, which was larger than ρ m a x = 1.14% and ρ b = 1.65%.

2.4. Test Setup

The OPCCB and GPCB were tested after 28 days under three-point bending by using a 1000 kN Shimadzu Universal Testing Machine from Shimadzu Corporation, Kyoto, Japan in accordance with ASTM C78/C78M-18 [60]. The cylinders were tested at 28 days in a 3000 kN Denison Compression Testing Machine in accordance with ASTM C39/C39M-20 [61]. The test setup for the beams is shown in Figure 2. The beams were tested under displacement-controlled loads at the rate of 0.5 mm/min.

3. Test Results and Discussion

The beams were tested under three-point bending to determine the shear strength of the OPCCB and GPCB. The concrete cylinder strength at 28 days ( f c ), initial diagonal cracking load ( P i ), peak applied load ( P u ) and experimental shear strength ( V c ) of the tested OPCCB and GPCB are summarized in Table 4. The experimental shear strength of the tested beams was taken equal to half of the peak applied load. The failure mechanism, load-deflection response, bending stiffness, and the effect of increasing a / d ratio on the shear strength of the OPCCB and the fly ash-based GPCB are discussed herein.

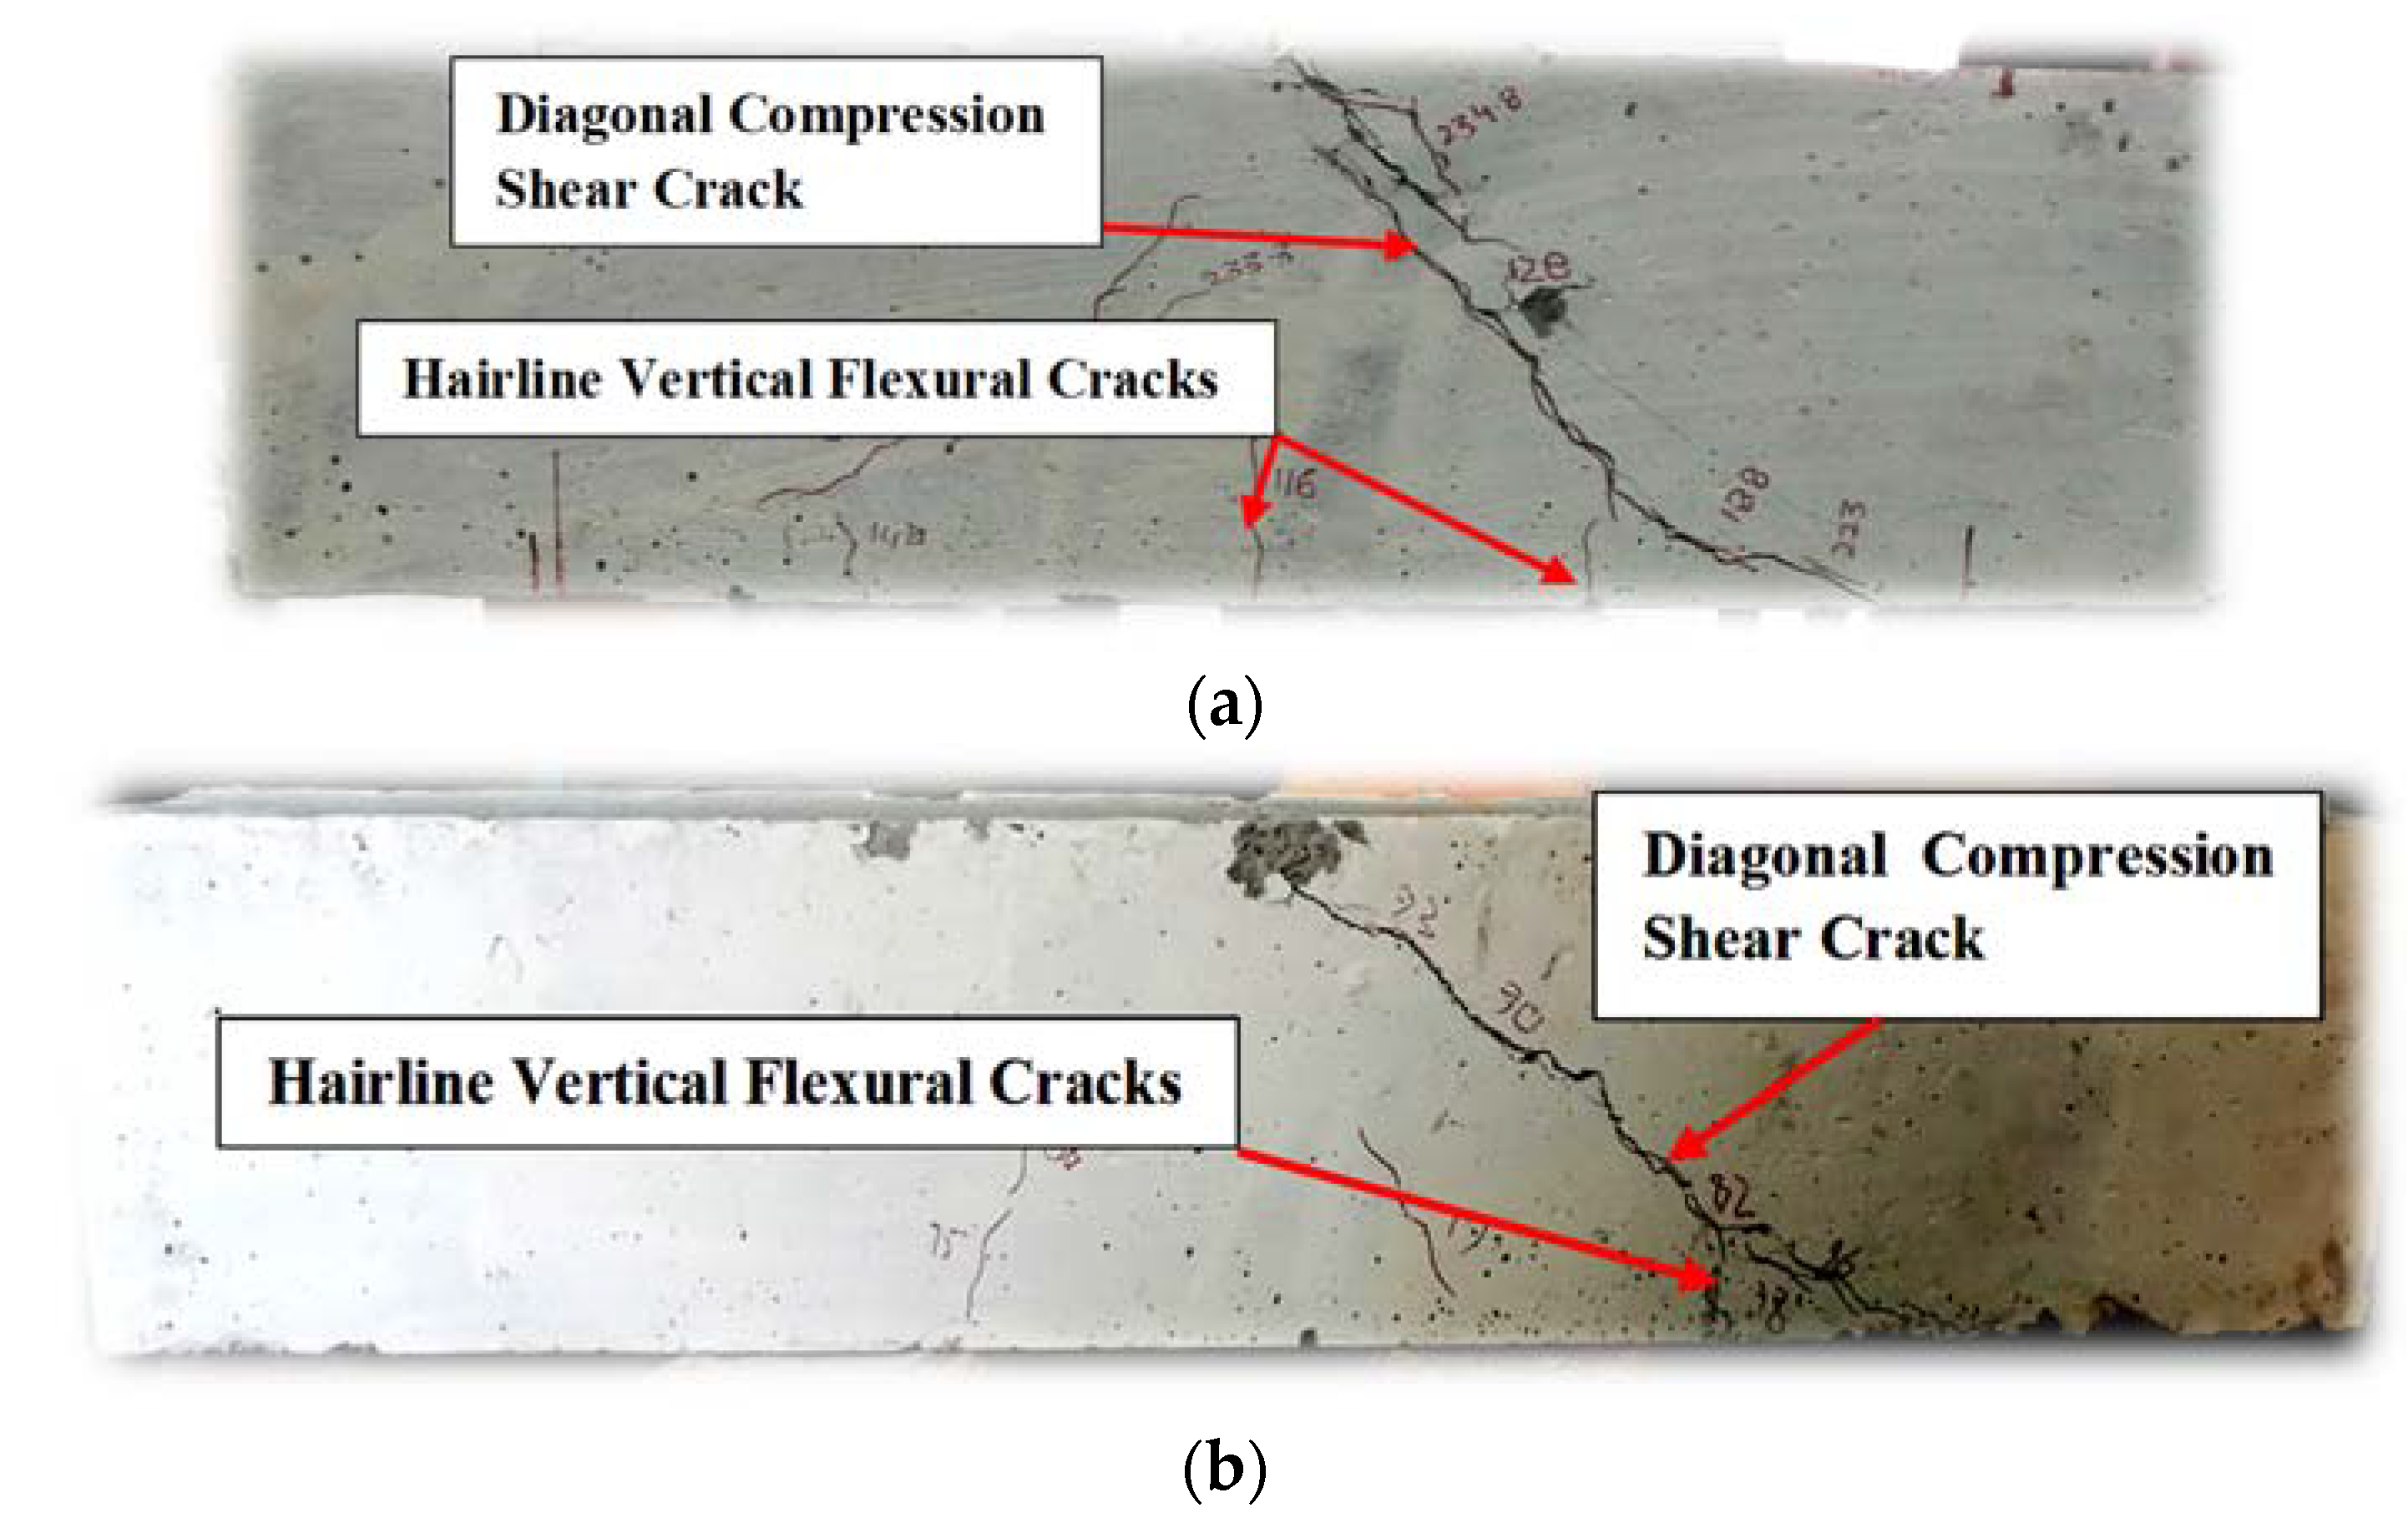
3.1. Failure Mechanism of Beams

The tested OPCCB and GPCB failed in shear as expected. For OPCCB, shear cracks appeared near the support zones, which were followed by hairline vertical flexural cracks. For Specimen OPCCB-1.6, the increase in the applied load resulted in the propagation of flexural and diagonal compression shear cracks towards the loading point, and the final failure due to wide and deep diagonal compression shear cracks was observed (Figure 3a). A similar crack propagation was observed in Specimens OPCCB-2.9 and OPCCB-4.3. However, their final failure was due to flexural and diagonal compression shear cracks along with the crushing of concrete under the loading point on the compression face of the beam, resulting in shear compression failure (Figure 3b,c).
The crack initiation and failure patterns of the GPCB were slightly different from those observed in OPCCB. The initial shear cracks appeared near the support zones, which led to the formation of minor cracks within the middle one-third portion of the beam. Increasing the applied load resulted in the propagation of flexural and shear cracks, which resulted in the shear failure of the beams (Figure 3d–f). It was observed that the number of flexural cracks of both OPCC and GPC beams increased with increasing a / d ratio (Figure 3). In general, all the beams failed by two primary shear cracks, while some minor flexural cracks were also observed. The width of the primary shear cracks in OPCCB was greater than that of GPCB. The angle of the diagonal compression shear cracks in OPCCB was steeper than the shear cracks that appeared in GPCB. Moreover, this angle of diagonal shear cracks was reduced with the increasing a / d ratio, and it reflects the reduction of the shear capacity of these beams with increasing a / d ratio. In this study, OPCCB failed in a shear, which was similar to the failure reported in previous studies [29,30,31,58,59], whereas the tendency of shear flexural failure increased in GPCB with increasing a / d ratios. Further studies are required to investigate the change in failure mode towards shear-flexural failure in GPCB with increasing a / d ratios compared to traditional OPCC beams considering wide range of parameters.
It is summarized that, in GPCB, the crushing of concrete in the compression zone along with the diagonal cracks, indicated the shear compression failure. Moreover, obvious signs of crushing of concrete in the compression zone, along with the diagonal cracks, were also visible in OPCCB-2.9 and OPCCB-4.3. Due to the provision of hooks of tensile reinforcements in the beams, neither bond/anchorage failure nor straightening of the hook accompanied with spalling of cover on the tail was observed for hooks with an extension length ( l e x t ) of 6 d b used in this study. Moreover, the shear capacity was reached before any other failure mechanisms in all the beams. In the available existing studies, Fayed et al. [62], Wu et al. [36], and Pham et al. [63] used 6 d b ( l e x t = 75   m m ), 5 d b ( l e x t = 110   m m ), and 9 d b ( l e x t = 150   m m ) for 12 mm, 22 mm, and 16 mm tensile reinforcements, respectively. Moreover, by keeping the cross sections in the transition domain ( ρ m a x   < ρ < ρ b ), as shown in Table 5, the upward propagation of the neutral axis was delayed, and the shear capacity was reached before the yielding of the flexural reinforcement.
It is noted that the experimental peak applied load was smaller than the analytically computed peak load due to the transition design ( ρ m a x   < ρ < ρ b ) of these beams, which reduced the ductility, but ultimately, the beams failed in shear and not in flexure. The analytical peak load is computed using the following Equation (1)
P 2 × S h e a r   s p a n = A s f y ( d a 2 )
where A s is the area of longitudinal steel (mm2), f y is the yield strength (MPa), d is the effective depth (mm), and a is the depth of Whitney’s Equivalent rectangular stress block (mm).

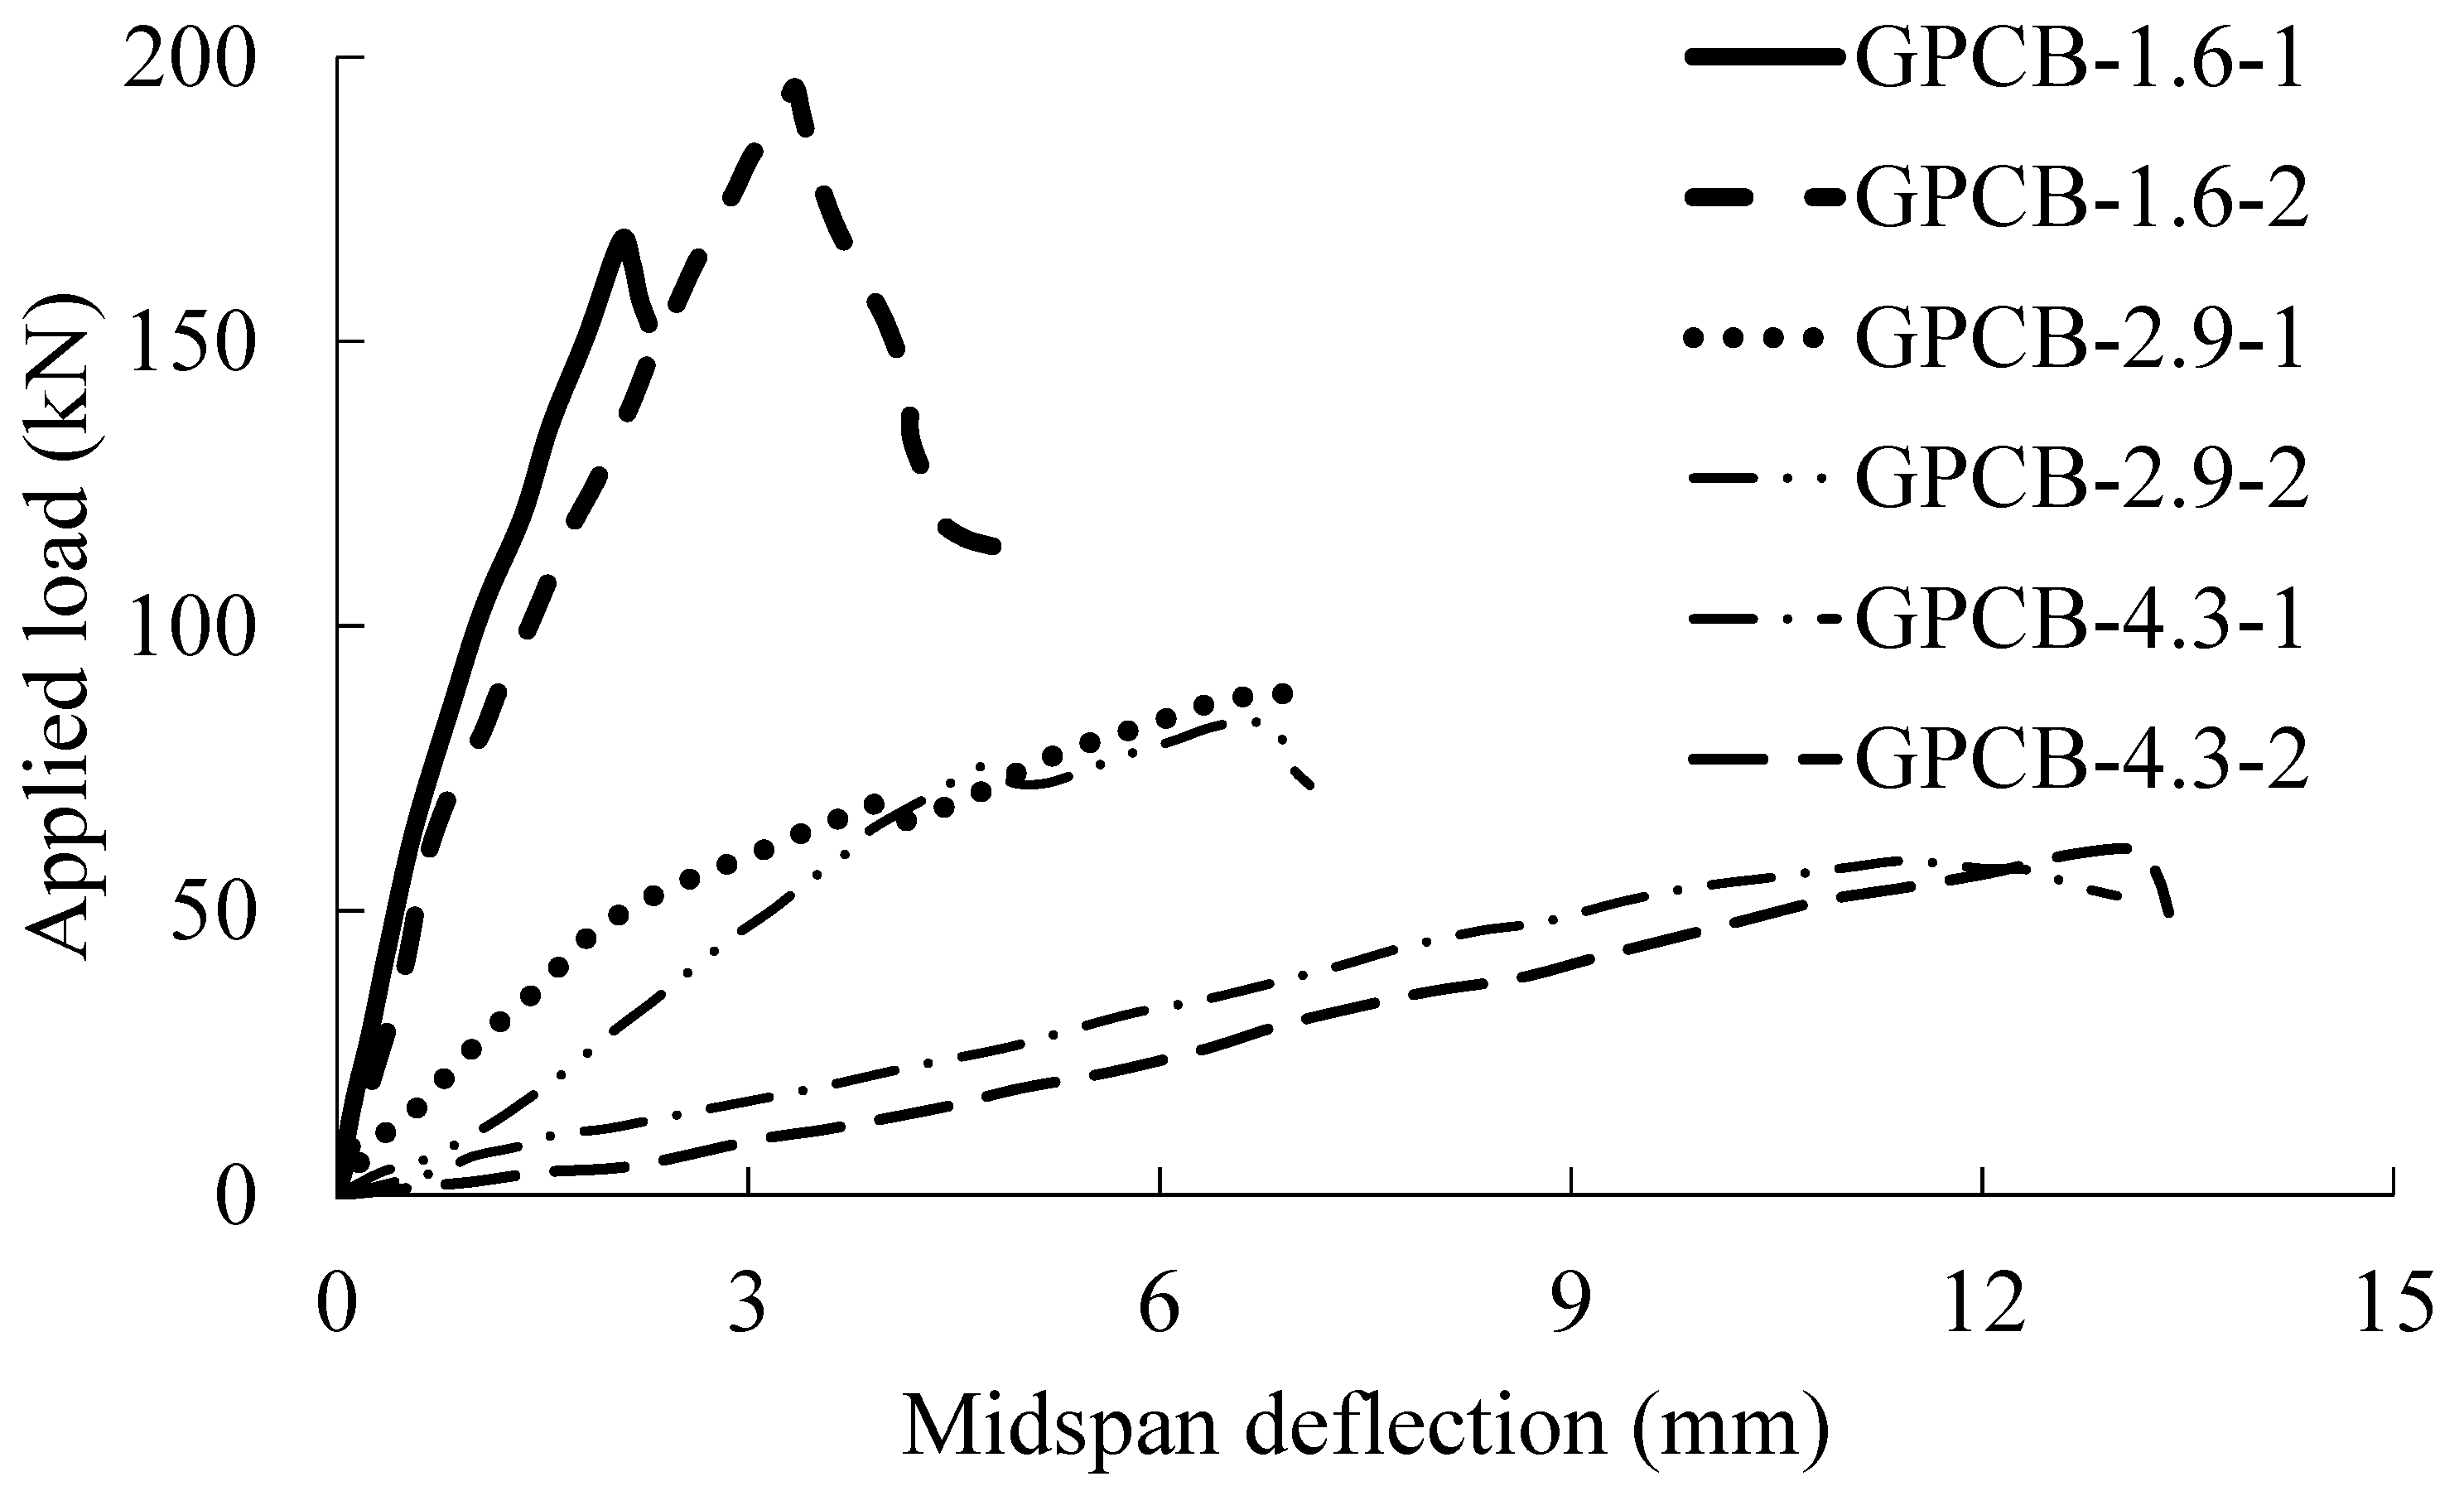
3.2. Load-Deflection Response

The applied load–midspan deflection curves of the tested OPCCB and GPCB are presented in Figure 4 and Figure 5, respectively. For the OPCCB, increasing a / d ratio resulted in significantly decreasing peak applied loads with marginally increasing corresponding midspan deflections. The peak applied load of Specimen OPCCB-1.6 was 2.5 and 3.3 times higher than that of Specimen OPCCB-2.9 and Specimen OPCCB-4.3, respectively. The midspan deflection corresponding to the peak applied load of Specimen OPCCB-1.6 was 13.7% and 18.5% smaller than that of Specimen OPCCB-2.9 and Specimen OPCCB-4.3, respectively. The tie-arch action was dominant in Specimen OPCCB-1.6, whereas the beam action was more prominent in Specimen OPCCB-2.9 and Specimen OPCCB-4.3, in which more flexural cracks were observed (Figure 3c). A change in the load-deflection response of OPCCB-1.6 was observed near 20 kN, but no cracking sound was heard during the test.
In the tie-arch action, the diagonal compression cracks initiate near the supports and join the loading point on the compression side, thus resisting the horizontal shear flow from the longitudinal tension steel to the compression zone. The reinforcement acts as tension ties, and this behavior usually takes place in beams with a very short shear span ( a / d   ≤ 1.0). In beams with short shear spans (1.0 < a / d   < 2.5), both beam action and arch action resist the load, whereas beam action dominates in ordinary shallow beams with a / d > 2.5 [57,64]. In this study, all the OPCCB failed in an almost shear-dominant manner; therefore, the maximum displacement was small (≤5.5 mm) and similar between these three beams (Figure 4).
For the GPCB, increasing a / d ratios resulted in significantly decreasing peak applied loads and greatly increasing corresponding midspan deflections, which were different from the OPCC beams. The average peak applied load of GPCB-1.6 (GPCB-1.6-1 and GPCB-1.6-2) specimens was 2.1 and 3.0 times higher than GPCB-2.9 (GPCB-2.9-1 and GPCB-2.9-2) specimens and GPCB-4.3 (GPCB-4.3-1 and GPCB-4.3.2) specimens, respectively. The GPCB-1.6 specimens exhibited an average of 1.9 and 3.6 times smaller midspan deflection (corresponding to the peak applied load) than the GPCB-2.9 and GPCB-4.3 specimens, respectively. For a similar beam design and concrete strength, OPCCB failed under a shear-dominant mode, while the corresponding GPCB failed under a mixed mode of shear and flexure. Accordingly, the maximum displacement of GPCB with a / d ratio greater than 2.9 was substantially greater than that of the corresponding OPCC beam.
The GPCB-1.6 specimens exhibited an average of 42.1% smaller midspan deflection at peak load than that of OPCCB-1.6 specimens. On the other hand, the GPCB-2.9 specimens exhibited an average of 33.6% larger midspan deflection at peak load than that of Specimen OPCCB-2.9. This phenomenon was attributed to the shifting of failure mode from the shear failure of OPCCB-2.9 to the shear-flexure failure of GPCB-2.9. Particularly, the GPCB-4.3 specimens exhibited an average 135.1% larger midspan deflection at peak load than that of Specimen OPCCB-4.3. In general, the midspan deflections in OPCCB and GPCB specimens increased with an increase in a / d ratio. It is understandable since longer beams have a lower flexural stiffness and the flexural behavior is dominant. Accordingly, longer beams associated with flexural behavior are more ductile, and thus, they fail at much larger deflection.
A comparison of the peak rotation of Group-I, Group-II, and Group-III beams is presented in Figure 6, which is computed by dividing the peak midspan deflection with the shear span. The average peak rotation of GPCB-1.6 was 36.6% smaller than that of Specimen OPCCB-1.6. The GPCB-2.9 specimens exhibited 34.1% larger average peak rotation than Specimen OPCCB-2.9. Similarly, GPCB-4.3 specimens exhibited 104.8% larger average peak rotation than Specimen OPCCB-4.3. It is noted that with increasing a / d ratio from 1.6 to 4.3, the average peak rotation in GPC beams was marginally increased, whereas the average peak rotation in OPCC beams was significantly reduced. This observation proved that GPC beams exhibited more ductile behavior than OPCC beams, particularly at a high a / d ratio, which justifies the lower modulus of elasticity (MOE) and initial stiffness of GPC beams than OPCC beams. Nath and Sarker [21] observed that the MOE of ambient-cured GPC was about 25–30% smaller than that of the corresponding OPCC, as given in Equations (2) and (3).
M O E O P C C = 4700   f c
M O E G P C = 3510   f c
where M O E O P C C is the modulus of elasticity of OPCC (MPa), M O E G P C is the modulus of elasticity of GPC (MPa) and f c is the 28-day concrete cylinder strength (MPa).
The average initial stiffness of GPCB-1.6, GPCB-2.9, and GPCB 4.3 was 29.6%, 14.6%, and 66.1% smaller, respectively, than OPCCB-1.6, OPCCB-2.9, and OPCCB 4.3. Mamdoh et al. [65] and Du et al. [66] illustrated that the initial stiffness of GPC specimens was 3.9–39.4% smaller than that of corresponding OPCC specimens.
A comparison of peak loads of Group-I, Group-II, and Group-III beams is presented in Figure 7. The average peak load of GPCB-1.6, GPCB-2.9, and GPCB-4.3 specimens was 22.8%, 7.5%, and 17.4% smaller, respectively, than that of Specimen OPCCB-1.6, Specimen OPCCB-2.9 and Specimen OPCCB-4.3. The lower peak load of GPCB specimens was attributed to the ambient curing of GPCB specimens. During ambient curing, the geopolymerization reaction between the alkali activator and fly ash is slower compared to the hydration process in OPCC. In OPCC, the hydration process significantly slows down after 28 days [67], whereas in GPC, the geopolymerization process continues to increase after 28 days of casting during ambient curing [68]. As a result, GPCB exhibited marginally lower capacity than OPCCB as these beams were tested at about 28 days.

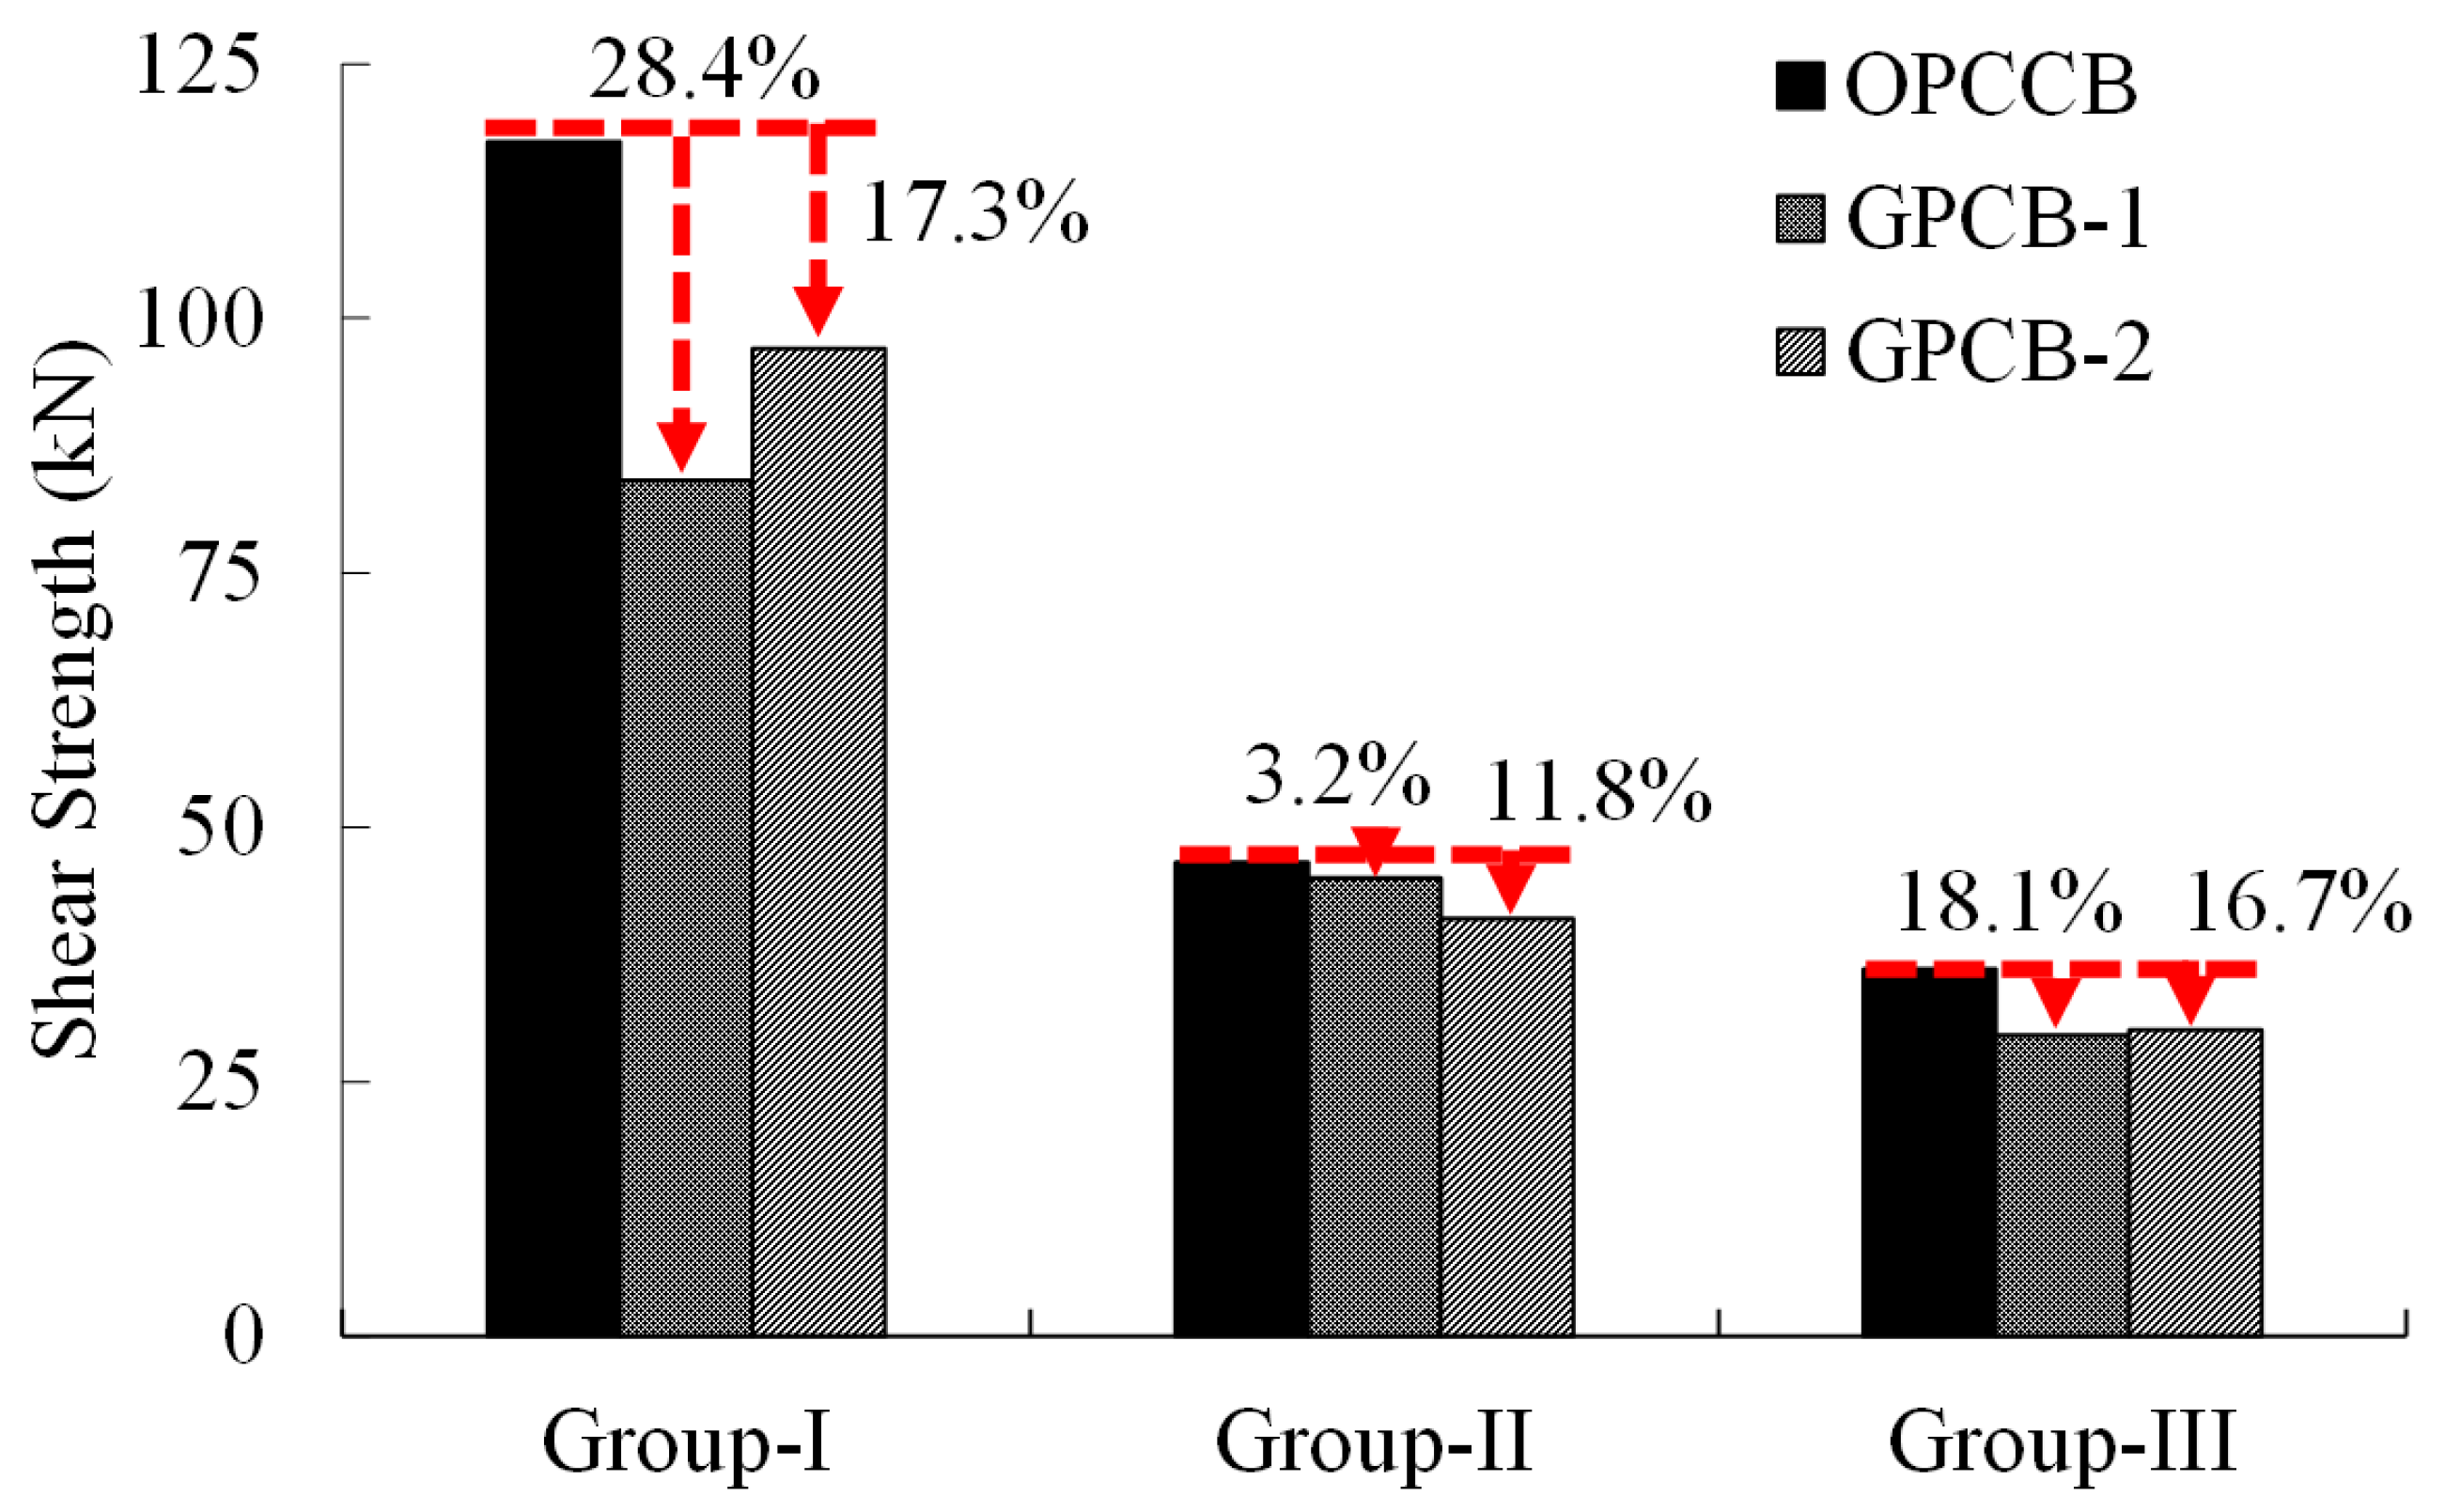
3.3. Shear Strength of the Tested Beams

The shear strength ( V c ) of the tested beams is summarized in Table 4. It is noted that the shear strengths of OPCCB and GPCB decreased with increasing a / d ratios. Specimen OPCCB-4.3 exhibited 22.6% and 69.3% lower shear strengths, respectively, than Specimen OPCCB-2.9 and Specimen OPCCB-1.6. Moreover, the GPCB-4.3 specimens (average of Specimens GPCB-4.3-1 and GPCB-4.3-2) exhibited 30.8% and 67.1% lower shear strengths, respectively, than GPCB-2.9 specimens (average of Specimens GPCB-2.9-1 and GPCB-2.9-2) and GPCB-1.6 specimens (average of Specimens GPCB-1.6-1 and GPCB-1.6-2). It is noted that the reduction rate of the shear strength of the OPCCB specimens was relatively similar to GPCB specimens with increasing a / d ratios from 1.6 to 4.3. The decreased shear strength of OPCCB with increasing a / d ratio was attributed to the shear compression failure in OPCCB, whereas the shear-flexure failure was observed in GPCB at all a / d ratios, as shown in Figure 3.
Similar findings were also reported by Slowik [29], Ismail et al. [31], Wu et al. [36], Visintin et al. [37], and Tauqir et al. [12] that increasing a / d ratios decreased the shear strength of beams. Moreover, the pure diagonal shear compression failure was observed in OPCCB, while the failure pattern in GPCB changed from shear to shear-flexure with increasing a / d atio from 1.5 to 4.0 [29,31,36,37,69]. This variation in failure mode led to a decrease in the shear strength of GPCB with increasing a / d atios. In this study, this tendency of change in the failure mode was also only observed in GPCB but not in OPCCB. Therefore, adopting design guides intended for OPCCB may not give reasonable predictions of GPCB.
The GPCB-1.6, GPCB-2.9, and GPCB-4.3 specimens showed an average of 22.9%, 7.5%, and 17.4% smaller shear strengths, respectively, than Specimen OPCCB-1.6, Specimen OPCCB-2.9 and Specimen OPCCB-4.3 (Figure 8). The ambient-cured GPCB exhibited consistently smaller shear strength than that of OPCCB for a similar a / d ratio, as reported in the previous studies [17,33].

4. Analytical Design Formulae

For plain concrete beams, the shear force is resisted by concrete alone, while the shear strength is resisted by concrete, shear reinforcements, and longitudinal reinforcements in reinforced concrete beams. In ACI 318-63 [70], the nominal shear strength ( V n ) of steel-reinforced concrete beams was the sum of shear strength provided by concrete ( V c ) and shear strength provided by shear reinforcement ( V s ) in MPa, as given in Equations (4)–(6).
V n = V c + V s
V c =   0.504   f c + 176 ρ w V · d V · a   b d × 9.81
V s = A v f y t d   s
where ρ w is tensile reinforcement ratio; V is the shear load (N); b is the width (mm); d is the effective depth (mm);   A v is the area of the shear reinforcement (mm2); f y t is the yield strength of shear reinforcement (MPa); and s is the spacing of stirrups (mm). Equation (5) is used for the computation of the shear strength of steel-reinforced concrete beams, incorporating the reciprocal of the a / d ratio, and has remained unchanged until ACI 318-14 [41].

4.1. ACI 318-14 [41]

In ACI 318-14 [41], V c of steel-reinforced concrete beams is computed using Equation (7).
V c = 0.16 λ f c + 17 ρ w   d a   b d
where λ is the strength modification factor, which is 1 for normal-weight concrete;   V u is the factored shear load (N); and a is the shear span (mm). Equation (7) comprised two parts: the first part (0.16 λ f c ) is the measure of concrete tensile strength, whereas the second part d / a reflects the influence of the reciprocal of a / d ratio.
It is noted that Equation (5) (ACI 318-63 [70]) and Equation (7) (ACI 318-14 [41]) consider the influence of f c and a / d . However, the multiplication factors of f c and a / d in ACI 318-14 [41] are smaller than those in ACI 318-63 [70]. Furthermore, ACI 318-14 [41] only provides shear strength equations for slender and very slender beams.

4.2. ACI 318-19 [40]

In ACI 318-19 [40], the equation for estimating V c of steel-reinforced concrete beams has been revised, and the influence of a / d ratio has not been explicitly considered. The shear strength of steel-reinforced concrete beams, V c , is calculated using Equation (8) for beams with a / d 2.0.
V c = 0.66 λ λ s ( ρ w ) 1 3 f c + N u 6 A g b d  
λ s = 2 1 + 0.004 d 1
where λ s is the size modification factor computed using Equation (8), N u s the factored axial load (N), and A g is the cross-sectional area of the beam (mm2).
For beams with a / d < 2.0, the shear strength of steel-reinforced beams is calculated using Equation (10) below.
V n 0.42 λ s λ t a n θ f c b w d  
θ = t a n 1 ( d 0.15 h a )
where h is the total depth of the beam (mm), and θ is the angle between the tension tie and the center of the strut.
The computation of the shear strength in these two versions of ACI is very different. In ACI 318-14 [41], the influence of f c in Equation (7) is much greater than that of ρ w and a / d . In ACI 318-19 [40], Equation (8) does not explicitly consider the influence of a / d ratio. This later approach, supported by Kuchma et al. [71], highlighted that the shear strength of the beam did not significantly increase with an increase in the member depth.

4.3. JSCE Standard Specifications for Concrete Structures-2007 [43]

In JSCE Guidelines for Concrete Structures-2007 (JSCE 2007 [43]), the V c of steel-reinforced concrete beams is calculated using Equation (12).
V c = β d · β n · β p · β a · f d d · b w   · d   /   γ b  
f d d = 0.19 f c d
β d = 1000 / d 4
β n = 1 + 2 M o / M u d   for   ( N d 0 )
β n = 1 + 4 M o / M u d   for   ( N d < 0 )
β p = 1 + 100 ρ w 2
β a = 5 1 + ( a / d ) 2
where β d considers the influence of the effective depth ( d ) on the shear strength of concrete ( V c );   β n considers the influence of the axial force ( N d ) on V c ; β p considers the influence of the flexural reinforcement ratio ( ρ w ) on V c ; β a considers the influence of the a / d ratio on V c ; f c d is the design compressive strength of concrete at 28 days; M o and M u d are the factored moments; and γ b is the member factor and is equal to 1.3. JSCE 2007 [41] considers the influence of the a / d ratio in the computation of the shear strength of reinforced concrete members and depicts that V c is inversely proportional to the square of the a / d ratio.

4.4. Fib Model Code [42]

Fib model Code 2010 [42] computes the V c of steel-reinforced concrete flexural members without incorporating a / d ratio, as given in Equation (19).
V c = k v   f c γ c   z · b w  
k v = 180 1000 + 1.25 z
where γ c is the partial safety factor for concrete and is taken as 1; z is the internal lever arm (mm); and k v is a factor, which controls the capacity of interlocked aggregate in the inclined plane.

5. Analytical Results and Discussion

A comparison of experimental and analytical shear strengths computed using ACI 318-14 [41], ACI 318-19 [40], JSCE 2007 [43], and fib 2010 [42] of OPCCB and GPCB is presented in Figure 9 and Figure 10, respectively. A large difference in the experimental and analytical shear strengths computed using ACI 318-14 [41], ACI 318-19 [40], JSCE 2007 [43], and fib 2010 [42] for OPCCB and GPCB specimens for a / d ratio of 1.6 was observed. Moreover, the difference in the experimental and analytical shear strengths decreased with an increase in a / d ratio from 1.6 to 4.3. Ma et al. [72] also reported a large difference in the experimental and analytical shear strengths of OPCCB specimens estimated using ACI 318-19 [40] and JSCE 2007 [43] at lower a / d ratios and the difference between experimental and analytical shear strengths were decreased with an increase in a / d ratio from 2.5 to 7.5.

5.1. Ordinary Portland Cement Concrete Beams

The ratios of analytically computed shear strengths to experimental shear strengths of OPCCB are summarized in Table 6. ACI 318-19 [40], JSCE 2007 [43], and fib 2010 [42] significantly underestimated the shear strength of OPCCB-1.6 by 74.2%, 49.2%, and 81.6%, respectively. The prediction accuracy slightly improves for longer beams, in which ACI 318-14 [41], ACI 318-19 [40], JSCE 2007 [43], and fib 2010 [42] also greatly underestimated the shear strength of OPCCB-2.9 by 45.1%, 42.1%, 52.5%, and 53.2%, respectively. The prediction becomes closer to the experimental results for longer beams, i.e., the predicted shear strength of OPCCB- 4.3 by ACI 318-14 [41], ACI 318-19 [40], JSCE 2007 [43], and fib 2010 [42] was lower than the experimental results by 29.2%, 25.0%, 69.7%, and 39.6%, respectively.
In general, the predictions from the ACI 318-14 [41], ACI 318-19 [40], JSCE 2007 [43], and fib 2010 [42] significantly underestimated the shear strengths of the OPCCB specimens. Particularly, the analytical shear strengths computed using JSCE 2007 [43] exhibited the best match with the experimental shear strengths of the OPCCB specimen at a / d ratio of 1.6. Moreover, at higher a / d ratios of 2.9 and 4.3, ACI 318-19 [40] exhibited the best match with the experimental shear strengths of the tested beams. This is because the shear strength equation used in ACI-318-19 [40] considers the size effect and influence of the flexural reinforcement ratio. Jayasinghe et al. [73] and Aguilar et al. [74] also reported that ACI-318-19 [40] predicts the shear strength of OPCCB specimens with high accuracy for a / d ratios of 2.4–8.1. Hu and Wu [30] reported that ACI 318-14 [41] underestimated the shear strength of OPCCB with increasing a / d ratios of 1.9, 2.5, and 3.1 by 25%, 29%, and 19%, respectively. In brief, the estimations from these guides deviate significantly from the experimental results, particularly for short OPCC beams, while the predictions are closer to the testing results with slender OPCC beams.

5.2. Geopolymer Concrete Beams

The ratios of computed shear strengths to experimental shear strengths of GPCB specimens are presented in Table 6. As expected, ACI 318-14 [41] also significantly underestimated the shear strengths of GPCB for a / d ratios of 1.6, 2.9, and 4.3. For example, the computed shear strengths of Specimen GPCB-2.9 and Specimen GPCB-4.3 were 40.0% and 15.1% smaller, respectively, than the corresponding experimental results. Similarly, ACI 318-19 [40] and fib 2010 [42] also greatly underestimated the shear strengths of GPCB specimens with the a / d ratios of 1.6, 2.9, and 4.3, as given in Table 6. It was observed that for GPCB, the prediction accuracy improved for longer beams; e.g., the prediction error was about 40% for GPCB-2.9, while the prediction error was reduced to approximately 20% for GPCB-4.3.
On the other hand, the prediction accuracy of JSCE 2007 [43] was better for short beams ( a / d of 1.6), but it became worse for longer beams ( a / d of 4.3). For instance, the prediction error of JSCE 2007 [43] was about 41% for GPCB-1.6, while it became 63% for GPCB-4.3.
In general, the analytical shear strengths computed using JSCE 2007 [43] exhibited the best match with the experimental shear strength of the GPCB specimen at a / d ratio of 1.6. Moreover, at larger a / d ratios of 2.9 and 4.3, ACI 318-19 [40] exhibited the best match of analytical shear strengths. Nikabakht et al. [75] noted that the shear strength equation in the ACI-318-19 [40] exhibited the best match with the experimental shear strength, while ACI-318-19 [40] underestimated the shear strength of GPC beams by 18% for a / d ratio of 1.53. Tauqir et al. [12] reported that the ACI 318-19 [40] underestimated the shear strengths of GPC beams by 32% and 31%, respectively, for a / d ratios of 4.5 and 5.0.

5.3. Comparison of Experimental and Analytical Shear Strengths of OPCC and GPC Beams in the Existing Available Research

To further verify the prediction accuracy of the mentioned design guides, the predictions are compared to the experimental results of previous studies by other researchers, as shown in Table 7. ACI 318-14 [41], ACI 318-19 [40], JSCE 2007 [43], and fib 2010 [42] significantly underestimated the shear strengths of tested beams for a / d ratio of 2.0, 2.5, 3.0, 3.5, 4.5, and 6.0. The analytical to experimental shear strength ratios for a / d ratio of 2.0, 2.5, 3.0, 3.5, 4.5, and 6.0 varied between 0.21–0.46, 0.25–0.68, 0.29–0.88, 0.29–0.94, and 0.08–0.45, respectively. The analytical results by ACI 318-14 [41] and ACI 318-19 [40] were found to be closer to experimental values at a / d ratio greater than 2.0. Moreover, the JSCE 2007 [43] exhibited the best results at a / d ratio smaller than 2.0 for GPC beams studied in the available research [15].
Based on the available test data, it was found that the available shear strength equations for OPCC underestimated the shear strength of GPC. Therefore, in this research study, equations are proposed to predict the shear strength of GPC beams with greater accuracy based on the limited available test data are developed.

5.4. Modified Equation for Shear Strength of Geopolymer Concrete Beams at Various a / d

The above analyses have shown that the contemporary predictive equations in those design guides and codes exhibit a large variation. Therefore, this study improves these equations for predicting the shear strength of GPC beams at various a / d ratios with greater accuracy by adding the revised coefficients in the existing ACI 318-19 [40] equation.
The equations in ACI 318-19 [40] and ACI 318-14 [41] predict the shear strengths of GPC beams at a / d ratios greater than 2.0. Due to the non-availability of an equation to predict the shear strength of GPC beams, some modifications were carried out in the available shear equation intended for OPCC beams in ACI 318-19 [40]. Then the proposed equation for GPC beams was also verified with the test data obtained from this study and other studies reported by other researchers [12,15,37,38,69,76]. For beams with a / d ratio 2.0, Equation (21) is proposed to compute the shear strength of geopolymer concrete beams.
V c = 1.75 λ λ s ( ρ w ) 1 3 f c b d
For beams with a / d ratio > 2, the coefficient of 1.75 in Equation (21) is replaced with 1.22 as the increase in a / d ratio. The failure mechanism changes from the tie-arch action to beam action and results in the reduction of the experimental peak applied loads and shear strength. The proposed equation to predict the shear strength for GPC beams with a / d ratio > 2.0 is given in Equation (22).
V c = 1.22 λ λ s ( ρ w ) 1 3 f c b d
To verify the proposed equations, the predictions of Equations (21) and (22) for GPC beams tested and reported in the literature are shown in Figure 11. Figure 11a indicates that the shear strength equation in ACI 318-19 predicts the shear strength of GPC beams with a standard deviation of 0.48, whereas the proposed Equations (21) and (22) in Figure 11b,c predict the shear strength of GPC beams with reduced standard deviations of 0.25 and 0.32, respectively. This indicates the reliability of these two equations for the shear strength of GPC beams with a / d ratio 2 and a / d ratio > 2.
Future studies are recommended to improve the applicability of the proposed coefficients in shear strength equations for ambient-cured GPC beams with a / d ratio 2 and a / d ratio > 2 considering compressive strength of concrete, molarity of NaOH solution, silica to alumina content, alkaline activator to fly ash ratio to further improve the proposed equations.

6. Conclusions

In this study, three ordinary Portland cement concrete beams (OPCCB) and six geopolymer concrete beams (GPCB) were tested under three-point bending. The test results highlighted the shear performance of GPCB specimens and the dependence of their shear strength on the shear span to the effective depth ( a / d ) ratio. The experimental shear strengths of GPCB specimens were compared with predictions from design guides. From the experimental and analytical results, the following conclusions are drawn:
  • The applied loads and shear strengths of OPCCB and GPCB specimens decreased with an increase in a / d ratio due to the change in the failure mechanism from the tie-arch action to the beam action. The reduction rate of the shear strength of OPCCB specimens was similar to GPCB specimens with increasing a / d ratios. Moreover, the OPCC beams exhibited higher shear strength than ambient-cured GPC beams for a similar a / d ratio.
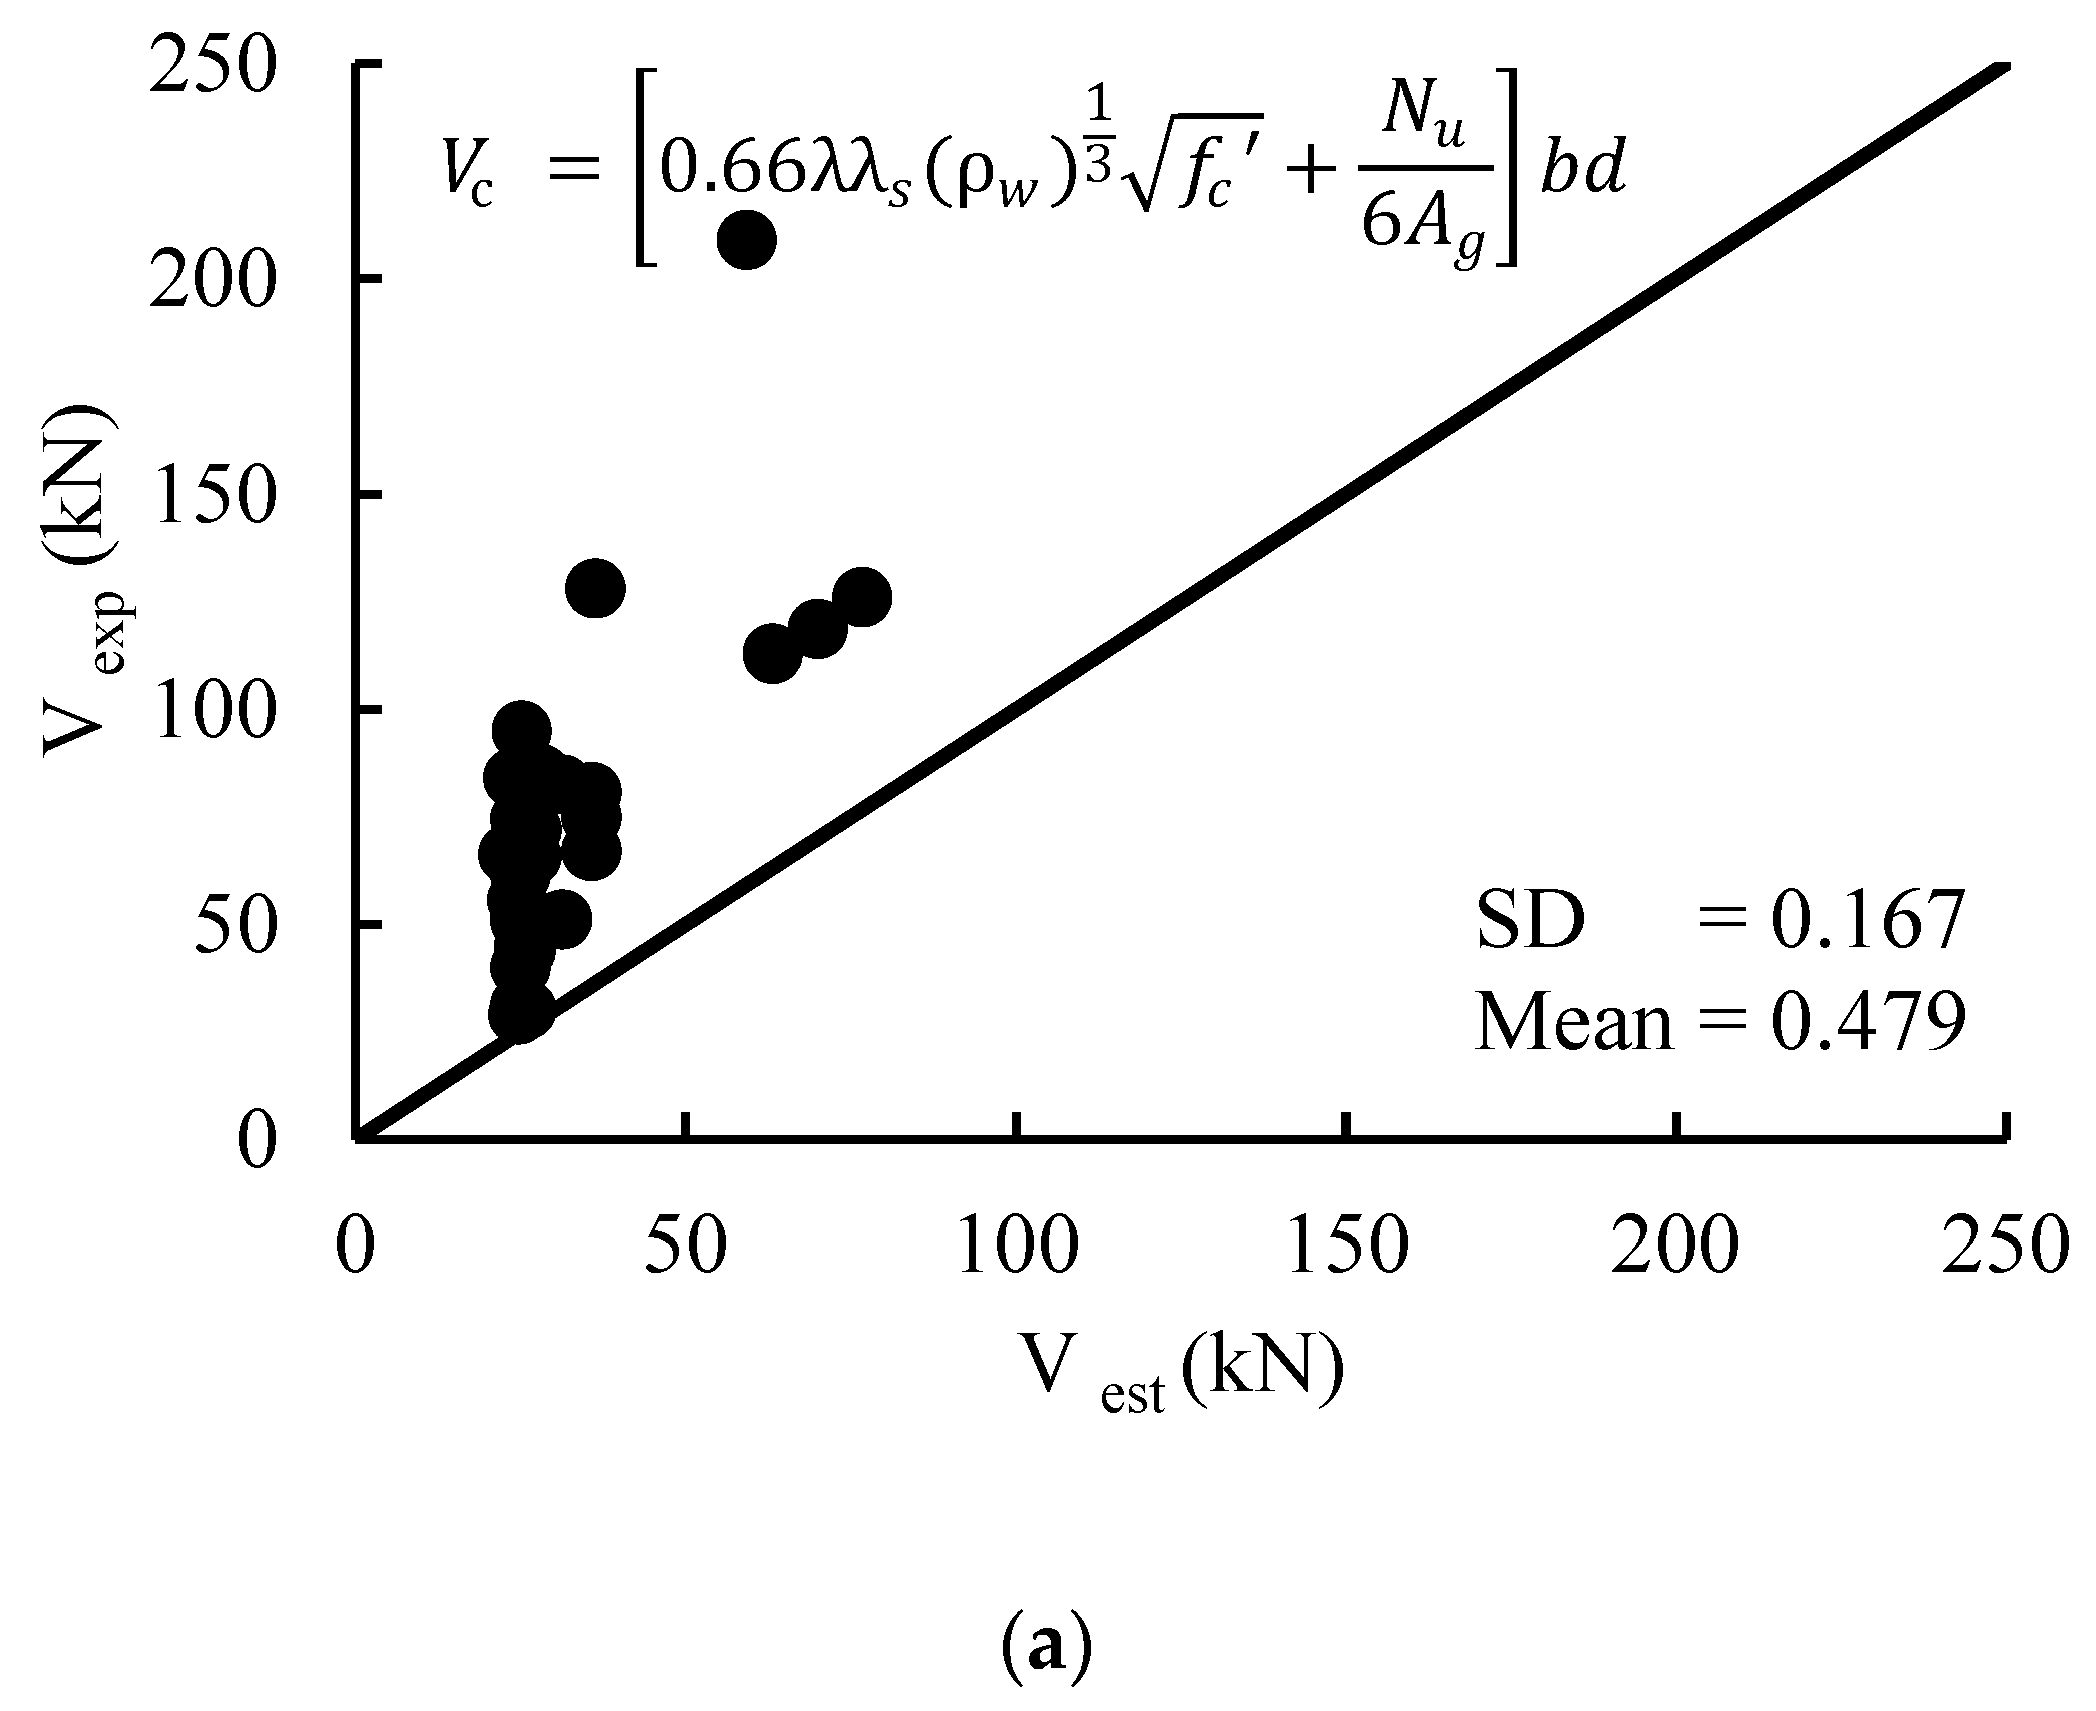
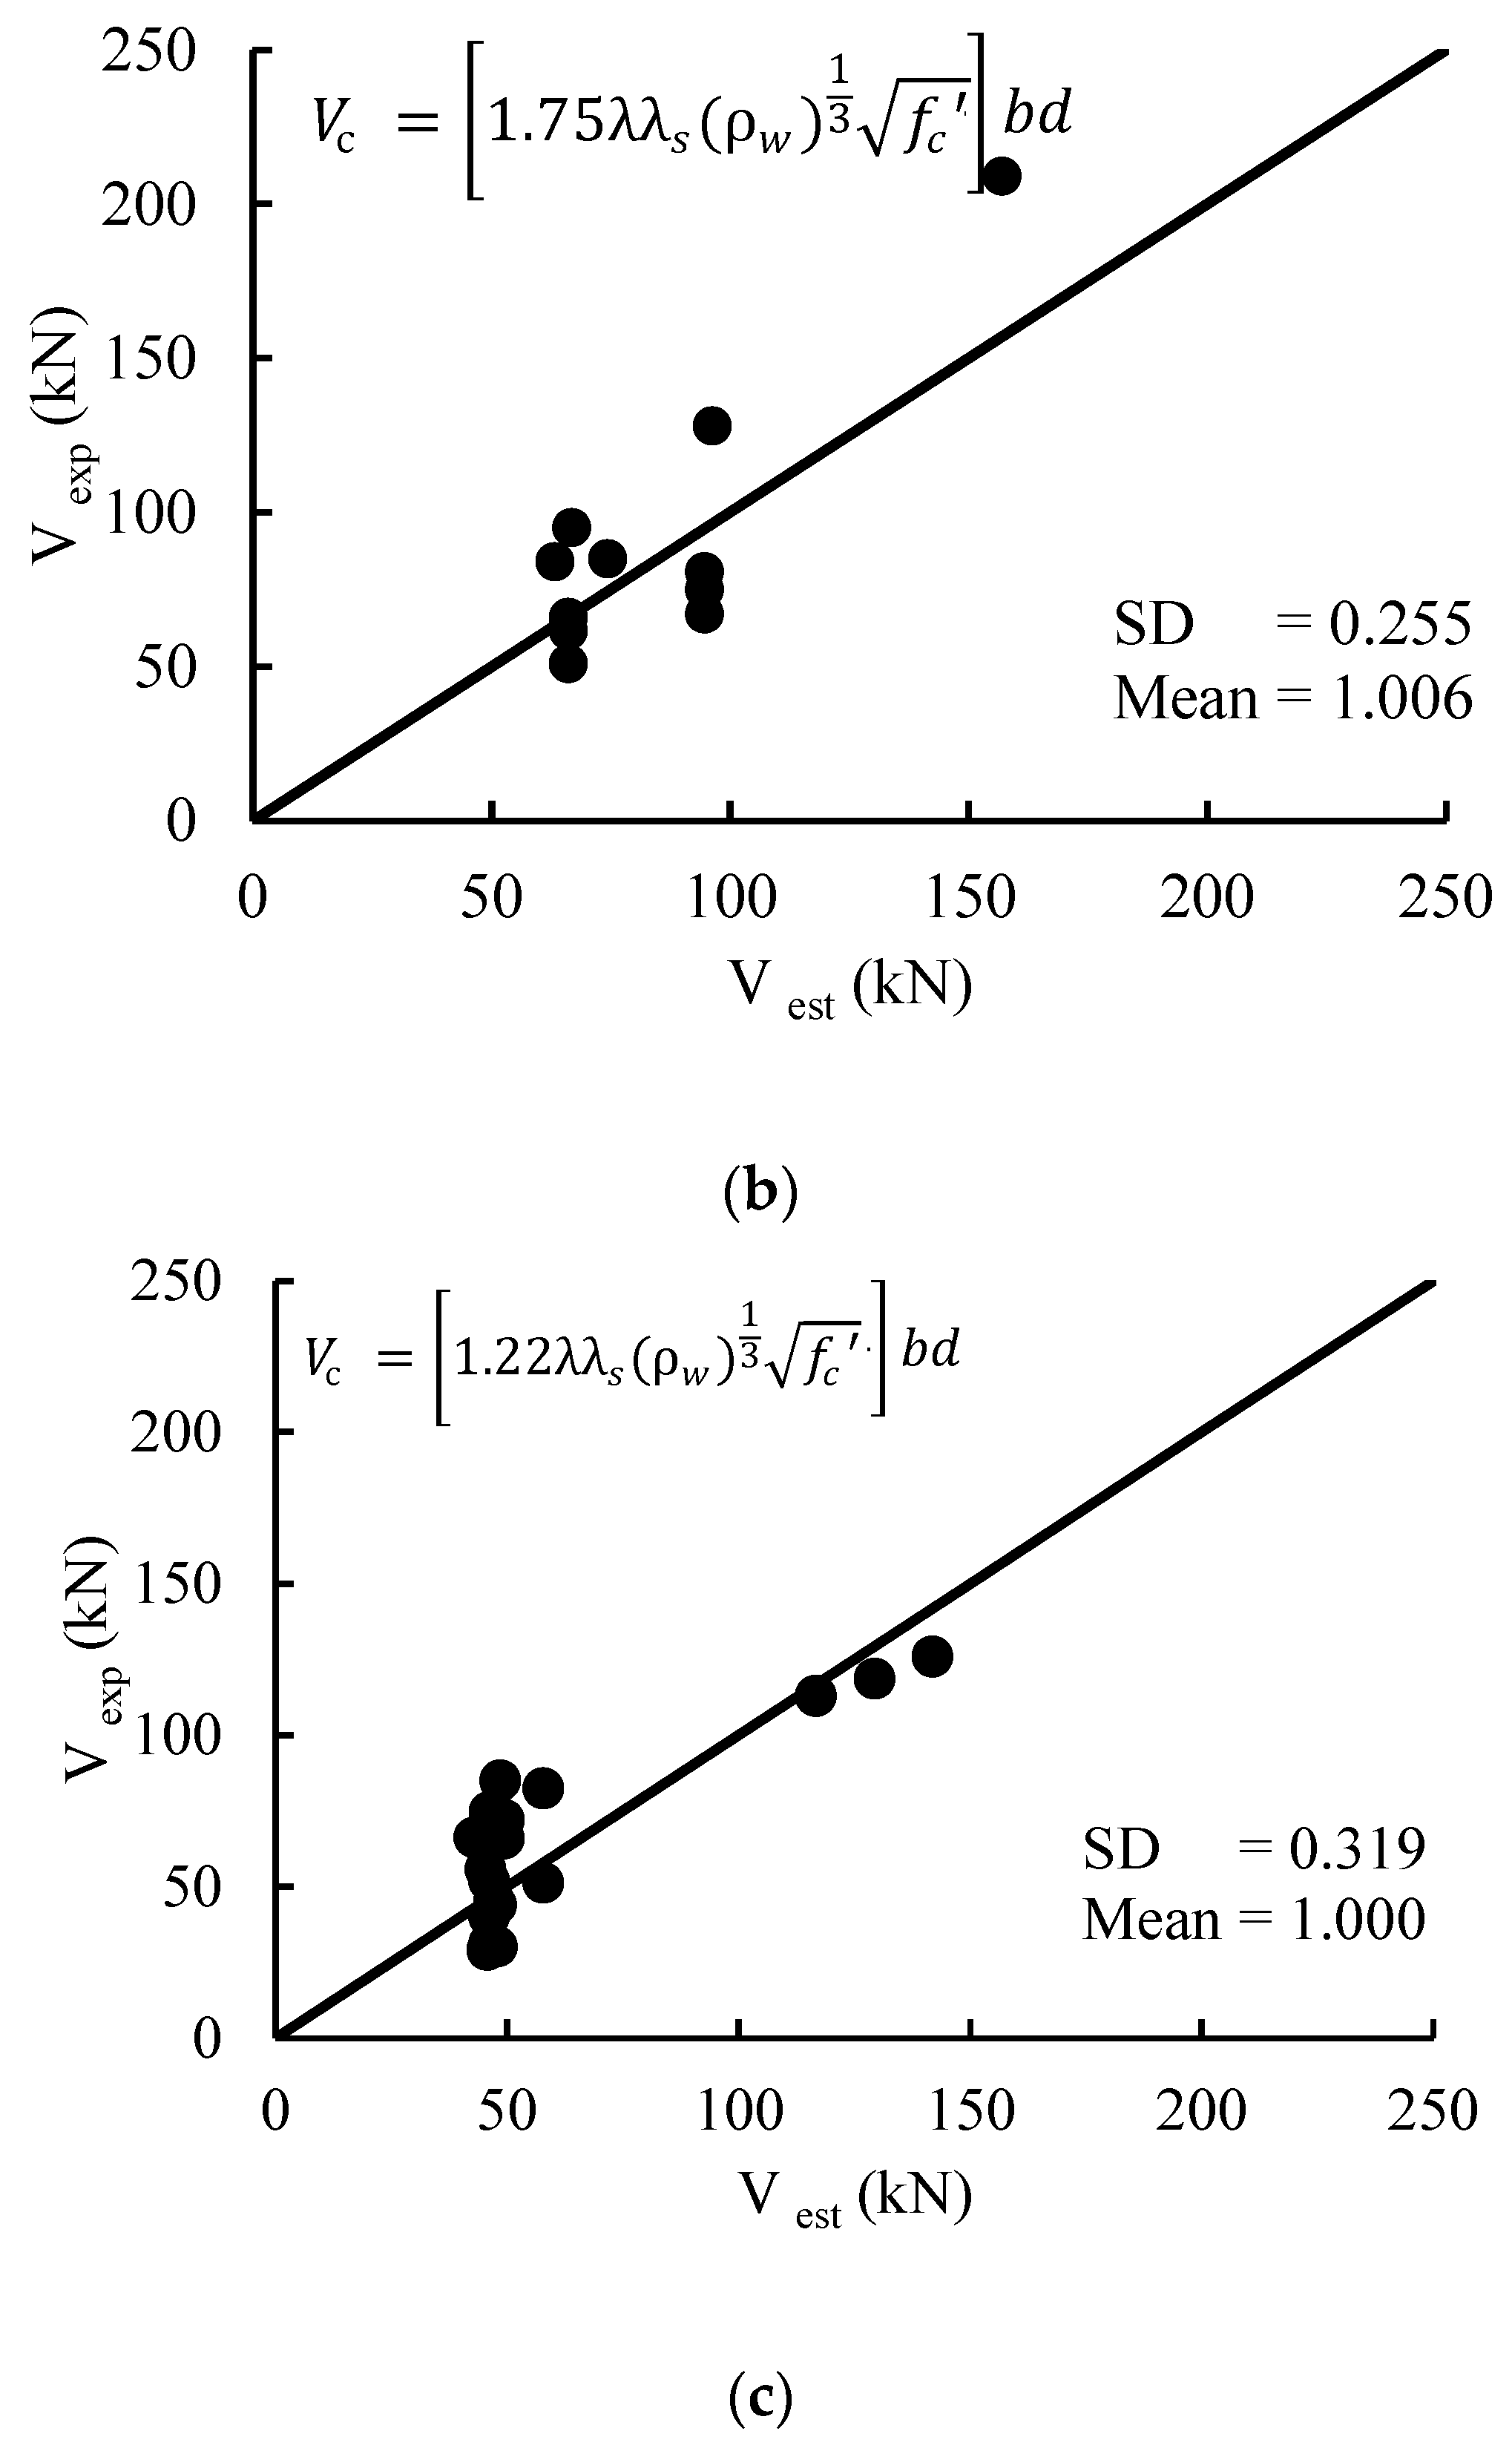
  • All the considered design guides significantly underestimated the shear strengths of GPC beams by 11–77%. However, the prediction accuracy increases at higher a / d ratios. It was noted that for higher a / d ratio, i.e., GPC beam specimen with a / d = 4.3, the prediction accuracy varies between 11.0–26.9% considering ACI 318-14 [41], ACI-318-19 [40], and fib 2010 [42].
  • ACI 318-19 [40] prediction yielded the closest match to the experimental shear strengths of GPCB and OPCCB specimens at higher a / d ratio of 2.9 and 4.3, whereas JSCE 2007 [43] prediction matched better at a lower a / d ratio of 1.6.
  • The modified equations proved better prediction accuracy. It is recommended to use Equation (21) for GPC beams with a / d ratios ≤ 2.0 and Equation (22) for those with a / d ratios > 2.0.

Author Contributions

Conceptualization, A.U.Q., Q.S.K. and M.A.; Investigation, M.A., A.U.Q. and Q.S.K.; Validation, M.J.M. and S.M.S.K.; Visualization, M.J.M. and S.M.S.K.; Writing—original draft preparation, A.U.Q., Q.S.K. and M.A.; Writing—review & editing, M.J.M. and S.M.S.K. All authors have read and agreed to the published version of the manuscript.

Funding

This research received no external funding.

Data Availability Statement

Data is contained within the article.

Acknowledgments

The authors would like to thank Civil Engineering Department UET Lahore for providing the research and testing facilities to conduct this study and Muhammad Abdullah (1st author) especially acknowledged the UET management to conduct this study along with his job duties.

Conflicts of Interest

The authors declare no conflicts of interest.

References

  1. McLellan, B.C.; Williams, R.P.; Lay, J.; van Riessen, A.; Corder, G.D. Costs and carbon emissions for geopolymer pastes in comparison to ordinary portland cement. J. Clean. Prod. 2011, 19, 1080–1090. [Google Scholar] [CrossRef]
  2. Hadi, M.N.S.; Farhan, N.A.; Sheikh, M.N. Design of geopolymer concrete with GGBFS at ambient curing condition using Taguchi method. Constr. Build. Mater. 2017, 140, 424–431. [Google Scholar] [CrossRef]
  3. Hason, M.M.; Al-Sulttani, A.O.; Abbood, I.S.; Hanoon, A.N. Emissions Investigating of Carbon Dioxide Generated by the Iraqi Cement Industry. IOP Conf. Ser. Mater. Sci. Eng. 2020, 928, 022041. [Google Scholar] [CrossRef]
  4. Farhan, N.A.; Sheikh, M.N.; Hadi, M.N.S. Axial load-bending moment (PM) Interactions of Geopolymer Concrete Column Reinforced with and without Steel Fiber. ACI Struct. J. 2020, 117, 133–144. [Google Scholar] [CrossRef]
  5. Sajjad, U.; Sheikh, M.N.; Hadi, M.N.S. Experimental study of the effect of graphene on properties of ambient-cured slag and fly ash-based geopolymer paste and mortar. Constr. Build. Mater. 2021, 313, 125403. [Google Scholar] [CrossRef]
  6. Qazi, A.U.; Khan, Q.S.; Ahmad, H.A.; Pham, T.M. Axial Behavior of FRP Confined Concrete Using Locally Available Low-Cost Wraps. Sustainability 2022, 14, 9989. [Google Scholar] [CrossRef]
  7. Kaya, M.; Koksal, F.; Gencel, O.; Munir, M.J.; Kazmi, S.M.S. Influence of Micro Fe2O3 and MgO on the Physical and Mechanical Properties of the Zeolite and Kaolin based Geopolymer Mortar. J. Build. Eng. 2022, 52, 104443. [Google Scholar] [CrossRef]
  8. Hardjito, D.E.; Wallah, S.M.J.; Sumajouw, D.; Rangan, B.V. On the Development of Fly Ash-Based Geopolymer Concrete. ACI Mater. J. 2004, 101, 467–472. [Google Scholar] [CrossRef]
  9. Subramanian, S.; Davis, R.; Thomas, B.S. Full-scale static behaviour of prestressed geopolymer concrete sleepers reinforced with steel fibres. Constr. Build. Mater. 2024, 412, 134693. [Google Scholar] [CrossRef]
  10. Farhan, N.A.; Sheikh, M.N.; Hadi, M.N.S. Engineering Properties of Ambient Cured Alkali-Activated Fly Ash–Slag Concrete Reinforced with Different Types of Steel Fiber. J. Mater. Civ. Eng. 2018, 30, 29–40. [Google Scholar] [CrossRef]
  11. Ahmad, J.; Ali, S.; Yu, T.; Sheikh, M.N.; Hadi, M.N.S. Analytical investigation on the load-moment interaction behavior of the FRP reinforced geopolymer concrete filled FRP tube circular columns. J. Build. Eng. 2021, 42, 102818. [Google Scholar] [CrossRef]
  12. Tauqir, M.; Qazi, A.U.; Khan, Q.S.; Munir, M.J.; Kazmi, S.M.S. Shear Behavior of Geopolymer Concrete Slender Beams. Buildings 2023, 13, 1191. [Google Scholar] [CrossRef]
  13. Farhan, N.A.; Sheikh, M.N.; Hadi, M.N.S. Behaviour of Ambient Cured Steel Fibre Reinforced Geopolymer Concrete Columns Under Axial and Flexural Loads. Structures 2018, 15, 184–195. [Google Scholar] [CrossRef]
  14. Pradhan, S.S.; Mishra, U.; Biswal, S.K.; Pramanik, S.; Jangra, P.; Aslani, F. Effects of rice husk ash on strength and durability performance of slag-based alkali-activated concrete. Struct. Concr. 2023. [Google Scholar] [CrossRef]
  15. Yacob, N.S.; ElGawady, M.A.; Sneed, L.H.; Said, A. Shear strength of fly ash-based geopolymer reinforced concrete beams. Eng. Struct. 2019, 196, 109298. [Google Scholar] [CrossRef]
  16. Amran, M.; Debbarma, S.; Ozbakkaloglu, T. Fly ash-based eco-friendly geopolymer concrete: A critical review of the long-term durability properties. Constr. Build. Mater. 2021, 270, 121857. [Google Scholar] [CrossRef]
  17. Farhan, N.A.; Sheikh, M.N.; Hadi, M.N.S. Effect of Steel Fiber on Engineering Properties of Geopolymer Concrete. ACI Mater. J. 2020, 117, 29–40. [Google Scholar] [CrossRef]
  18. Meesala, C.R.; Verma, N.K.; Kumar, S. Critical review on fly-ash based geopolymer concrete. Struct. Concr. 2020, 21, 1013–1028. [Google Scholar] [CrossRef]
  19. Diaz-Loya, E.I.; Allouche, E.N.; Vaidya, S. Mechanical properties of fly-ash-based geopolymer concrete. ACI Mater. J. 2011, 108, 300–306. [Google Scholar]
  20. Farhan, N.A.; Sheikh, M.N.; Hadi, M.N.S. Investigation of engineering properties of normal and high strength fly ash based geopolymer and alkali-activated slag concrete compared to ordinary Portland cement concrete. Constr. Build. Mater. 2019, 196, 26–42. [Google Scholar] [CrossRef]
  21. Nath, P.; Sarker, P.K. Flexural strength and elastic modulus of ambient-cured blended low-calcium fly ash geopolymer concrete. Constr. Build. Mater. 2017, 130, 22–31. [Google Scholar] [CrossRef]
  22. Ghafoor, M.T.; Khan, Q.S.; Qazi, A.U.; Sheikh, M.N.; Hadi, M.N.S. Influence of alkaline activators on the mechanical properties of fly ash based geopolymer concrete cured at ambient temperature. Constr. Build. Mater. 2021, 273, 121752. [Google Scholar] [CrossRef]
  23. Aliabdo, A.A.; Abd Elmoaty, A.E.M.; Salem, H.A. Effect of water addition, plasticizer and alkaline solution constitution on fly ash based geopolymer concrete performance. Constr. Build. Mater. 2016, 121, 694–703. [Google Scholar] [CrossRef]
  24. Verma, M.; Dev, N. Sodium hydroxide effect on the mechanical properties of flyash-slag based geopolymer concrete. Struct. Concr. 2021, 22, E368–E379. [Google Scholar] [CrossRef]
  25. Adak, D.; Sarkar, M.; Mandal, S. Structural performance of nano-silica modified fly-ash based geopolymer concrete. Constr. Build. Mater. 2017, 135, 430–439. [Google Scholar] [CrossRef]
  26. Yost, J.R.; Radlińska, A.; Ernst, S.; Salera, M.; Martignetti, N.J. Structural behavior of alkali activated fly ash concrete. Part 2: Structural testing and experimental findings. Mater. Struct. 2013, 46, 449–462. [Google Scholar] [CrossRef]
  27. Tran, T.T.; Pham, T.M.; Hao, H. Experimental and analytical investigation on flexural behaviour of ambient cured geopolymer concrete beams reinforced with steel fibers. Eng. Struct. 2019, 200, 109707. [Google Scholar] [CrossRef]
  28. Kathirvel, P.; Kaliyaperumal, S.R.M. Influence of recycled concrete aggregates on the flexural properties of reinforced alkali activated slag concrete. Constr. Build. Mater. 2016, 102, 51–58. [Google Scholar] [CrossRef]
  29. Słowik, M. Shear Failure Mechanism in Concrete Beams. Proc. Mater. Sci. 2014, 3, 1977–1982. [Google Scholar] [CrossRef]
  30. Hu, B.; Wu, Y.F. Effect of shear span-to-depth ratio on shear strength components of RC beams. Eng. Struct. 2018, 168, 770–783. [Google Scholar] [CrossRef]
  31. Ismail, K.S.; Guadagnini, M.; Pilakoutas, K. Shear Behavior of Reinforced Concrete Deep Beams. ACI Struct. J. 2016, 114, 87–99. [Google Scholar] [CrossRef]
  32. Maranan, G.B.; Manalo, A.C.; Benmokrane, B.; Karunasena, W.; Mendis, P. Shear Behavior of Geopolymer Concrete Beams Reinforced with GFRP Bars. ACI Struct. J. 2017, 114, 337–348. [Google Scholar] [CrossRef]
  33. Maranan, G.B.; Manalo, A.C.; Benmokrane, B.; Karunasena, W.; Mendis, P.; Nguyen, T.Q. Flexural behavior of geopolymer-concrete beams longitudinally reinforced with GFRP and steel hybrid reinforcements. Eng. Struct. 2019, 182, 141–152. [Google Scholar] [CrossRef]
  34. Nagajothi, S.; Elavenil, S. Shear Prediction of geopolymer concrete beams using Basalt/Glass FRP bars. J. Adv. Concr. Technol. 2021, 19, 216–225. [Google Scholar] [CrossRef]
  35. Shibayama, A.; Nishiyama, M. Shear strength of reinforced fly-ash-based geopolymer concrete beams with and without shear reinforcement. Structures 2023, 50, 603–614. [Google Scholar] [CrossRef]
  36. Wu, C.; Hwang, H.J.; Shi, C.; Li, N.; Du, Y. Shear tests on reinforced slag-based geopolymer concrete beams with transverse reinforcement. Eng. Struct. 2020, 219, 110966. [Google Scholar] [CrossRef]
  37. Visintin, P.; Mohamed Ali, M.S.; Albitar, M.; Lucas, W. Shear behaviour of geopolymer concrete beams without stirrups. Constr. Build. Mater. 2017, 148, 10–21. [Google Scholar] [CrossRef]
  38. Hassan, A.; Arif, M.; Shariq, M. Structural performance of ambient-cured reinforced geopolymer concrete beams with steel fibres. Struct. Concr. 2021, 22, 457–475. [Google Scholar] [CrossRef]
  39. Tran, T.T.; Pham, T.M.; Hao, H. Effect of hybrid fibers on shear behaviour of geopolymer concrete beams reinforced by basalt fiber reinforced polymer (BFRP) bars without stirrups. Compos. Struct. 2020, 243, 112236. [Google Scholar] [CrossRef]
  40. ACI 318-19; Building Code Requirements for Structural Concrete ACI 318-19 and Commentary 318R-19. American Concrete Institute ACI Committee: Farmington Hills, MI, USA, 2019.
  41. ACI 318-14; Building Code Requirements for Structural Concrete and Commentary. American Concrete Institute: Farmington Hills, MI, USA, 2014.
  42. International Federation for Structural Concrete (FIB). Model. Code 2010; FIB: Lausanne, Switzerland, 2012; Volume 2. [Google Scholar]
  43. Japan Society of Civil Engineers. Standard Specifications for concrete structures-2007 Design. JSCE Guidel. Concr. 2010, 15, 156–159. [Google Scholar]
  44. Albidah, A.S. Shear behviour of metakaolin-fly ash based geopolymer concrete deep beams. Eng. Struct. 2023, 275, 115271. [Google Scholar] [CrossRef]
  45. Prachasaree, W.; Limkatanyu, S.; Hawa, A.; Samakrattakit, A. Development of Equivalent Stress Block Parameters for Fly-Ash-Based Geopolymer Concrete. Arab. J. Sci. Eng. 2014, 39, 8549–8558. [Google Scholar] [CrossRef]
  46. ASTM C618-12a; Standard Specifications for Coal Fly Ash and Raw or Calcined Natural Pozzolan for Use in Concrete. American Society of Testing and Materials: West Consshohocken, PA, USA, 2012.
  47. ASTM C136/C136M-19; Standard Test Method for Sieve Analysis of Fine and Coarse Aggregates. American Society of Testing and Materials: West Conshohocken, PA, USA, 2019.
  48. ASTM C29/C29M-17; Standard Test Method for Bulk Density (“Unit Weight”) and Voids in Aggregate. American Society of Testing and Materials: West Conshohocken, PS, USA, 2017.
  49. ASTM C33/C33M-18; Standard Specifications for Concrete Aggregates. American Society of Testing and Materials: West Conshohocken, PA, USA, 2018.
  50. Özkılıç, Y.O.; Çelik, A.İ.; Tunç, U.; Karalar, M.; Deifalla, A.; Alomayri, T.; Althoey, F. The use of crushed recycled glass for alkali activated fly ash based geopolymer concrete and prediction of its capacity. J. Mater. Res. Technol. 2023, 24, 8267–8281. [Google Scholar] [CrossRef]
  51. Çelik, A.İ.; Tunç, U.; Bahrami, A.; Karalar, M.; Mydin, M.A.O.; Alomayri, T.; Özkılıç, Y.O. Use of waste glass powder toward more sustainable geopolymer concrete. J. Mater. Res. Technol. 2023, 24, 8533–8546. [Google Scholar] [CrossRef]
  52. Çelik, A.L.I.; Özkılıç, Y. Geopolymer concrete with high strength, workability and setting time using recycled steel wires and basalt powder. Steel Compos. Struct. 2023, 46, 689–707. [Google Scholar] [CrossRef]
  53. Çelik, A.İ.; Özkılıç, Y.O.; Bahrami, A.; Hakeem, I.Y. Mechanical performance of geopolymer concrete with micro silica fume and waste steel lathe scraps. Case Stud. Constr. Mater. 2023, 19, e02548. [Google Scholar] [CrossRef]
  54. Çelik, A.İ.; Özkılıç, Y.O.; Bahrami, A.; Hakeem, I.Y. Effects of glass fiber on recycled fly ash and basalt powder based geopolymer concrete. Case Stud. Constr. Mater. 2023, 19, e02659. [Google Scholar] [CrossRef]
  55. ASTM A615/A615M-20; Standard Specification for Deformed and Plain Carbon Steel Bars for Concrete Reinforcement. American Society of Testing and Materials: West Conshohocken, PA, USA, 2020.
  56. ACI 445R-99; Recent Approaches to Shear Design of Structural Concrete. ACI-ASCE Committee 445; American Concrete Institute: Farmington Hills, MI, USA, 1999.
  57. Wight, J.K.; MacGregor, J.G. Reinforced Concrete Mechanics and Design; Pearson Education: London, UK, 2011. [Google Scholar]
  58. Kawamura, K.; Takemura, M.; Nakamura, H.; Miura, T. Experimental Study on the Effect of Different Shear Reinforcement Shapes on Shear Failure Behavior and Internal Crack Pattern of RC Beams. J. Adv. Concr. Technol. 2021, 19, 82–94. [Google Scholar] [CrossRef]
  59. Abdullah, M.; Nakamura, H.; Kawamura, K.; Takemura, M.; Miura, T. Experimental study on the effect of different shear reinforcement shapes and arrangement on 3D crack propagation and shear failure mechanism in RC beams. Structures 2023, 58, 105453. [Google Scholar] [CrossRef]
  60. ASTM C78/C78M-18; Standard Test Method for Flexural Strength of Concrete (Using Simple Beam with Third-Point Loading). American Society of Testing and Materials: West Conshohocken, PA, USA, 2018.
  61. ASTM C39/C39M-20; Standard Test Method for Compressive Strength of Cylindrical Concrete Specimens. American Society of Testing and Materials: West Conshohocken, PA, USA, 2020.
  62. Fayed, S.; Madenci, E.; Özkılıç, Y.O. Flexural Behavior of RC Beams with an Abrupt Change in Depth: Experimental Work. Buildings 2022, 12, 2176. [Google Scholar] [CrossRef]
  63. Pham, D.Q.; Nguyen, T.N.; Le, S.T.; Pham, T.T.; Ngo, T.D. The structural behaviours of steel reinforced geopolymer concrete beams: An experimental and numerical investigation. Structures 2021, 33, 567–580. [Google Scholar] [CrossRef]
  64. Gunawan, D.; Okubo, K.; Nakamura, T.; Niwa, J. Shear Capacity of RC Beams Based on Beam and Arch Actions. J. Adv. Concr. Technol. 2020, 18, 241–255. [Google Scholar] [CrossRef]
  65. Mamdouh, H.; Ali, A.; Osman, M.; Deifalla, A.; Ayash, N. Effects of Size and Flexural Reinforcement Ratio on Ambient-Cured Geopolymer Slag Concrete Beams under Four-Point Bending. Buildings 2020, 12, 1554. [Google Scholar] [CrossRef]
  66. Du, Y.; Wang, J.; Shi, C.; Hwang, H.-J.; Li, N. Flexural behavior of alkali-activated slag-based concrete beams. Eng. Struct. 2021, 229, 111644. [Google Scholar] [CrossRef]
  67. Yeung, J.S.K.; Yam, M.C.H.; Wong, Y.L. 1-Year development trend of concrete compressive strength using Calcium Sulfoaluminate cement blended with OPC, PFA and GGBS. Constr. Build. Mater. 2019, 198, 527–536. [Google Scholar] [CrossRef]
  68. Hassan, A.; Arif, M.; Shariq, M. Effect of curing condition on the mechanical properties of fly ash-based geopolymer concrete. SN Appl. Sci. 2019, 1, 1694. [Google Scholar] [CrossRef]
  69. Sinik, M.; Arsalan, G. Effect of shear span to effective depth ratio on the shear strength of RC beams. Int. J. Adv. Sci. Eng. Technol. 2018, 6, 64–66. [Google Scholar]
  70. ACI 318-63 (1963); Building Code Requirements for Structural Concrete and Commentary. American Concrete Institute: Farmington Hills, MI, USA, 1963.
  71. Kuchma, D.A.; Wei, S.; Sanders, D.H.; Belarbi, A.; Novak, L.C. Development of One-Way Shear Design Provisions of ACI 318-19 for Reinforced Concrete. ACI Struct. J. 2019, 116, 285–296. [Google Scholar] [CrossRef]
  72. Ma, C.; Guo, Z.; Wang, W.; Qin, Y. Shear Strength Models for Reinforced Concrete Slender Beams: Comparative Analysis and Parametric Evaluation. Buildings 2022, 13, 37. [Google Scholar] [CrossRef]
  73. Jayasinghe, T.; Gunawardena, T.; Mendis, P. Assessment of shear strength of reinforced concrete beams without shear reinforcement: A comparative study between codes of practice and artificial neural network. Case Stud. Const. Mater. 2022, 16, e01102. [Google Scholar] [CrossRef]
  74. Aguilar, V.; Barnes, R.W.; Nowak, A.S. Comparative Assessment of Shear Strength Equations for Reinforced Concrete. Pract. Period. Struct. Des. Constr. 2022, 27, 04021082. [Google Scholar] [CrossRef]
  75. Nikbakht, E.; Wong Weng Lok, J.; Teo, W. Structural behaviour of novel composite beams consisting of geopolymer concrete and high-performance concrete. Structures 2021, 32, 106–115. [Google Scholar] [CrossRef]
  76. Lee, K.M.; Choi, S.; Choo, J.F.; Choi, Y.C.; Yoo, S.W. Flexural and Shear Behaviors of Reinforced Alkali-Activated Slag Concrete Beams. Adv. Mater. Sci. Eng. 2017, 2017, 5294290. [Google Scholar] [CrossRef]
Figure 1. Schematic diagram of the three-point bending test setup.
Buildings 14 00204 g001
Figure 2. Test setup for beams under three-point bending.
Buildings 14 00204 g002
Figure 3. Failure patterns of OPCC and GPC beams. (a) Specimen OPCCB-1.6; (b) Specimen OPCCB-2.9; (c) Specimen OPCCB-4.3; (d) Specimen GPCB-1.6; (e) Specimen GPCB-2.9; (f) Specimen GPCB-4.3.
Buildings 14 00204 g003aBuildings 14 00204 g003b
Figure 4. Applied load–midspan deflection curves of OPCC beams with varied a / d ratios.
Buildings 14 00204 g004
Figure 5. Applied load–midspan deflection curves of GPC beams with varying a / d ratios.
Buildings 14 00204 g005
Figure 6. Peak rotation of Groups I, II, and III beams.
Buildings 14 00204 g006
Figure 7. Peak loads of Group-I ( a / d = 1.6), Group-II ( a / d = 2.9), and Group-III ( a / d = 4.3) beams.
Buildings 14 00204 g007
Figure 8. Shear strengths of Group-I ( a / d = 1.6), Group-II ( a / d = 2.9). and Group-III ( a / d = 4.3) beams.
Buildings 14 00204 g008
Figure 9. Comparison of experimental and analytical shear strengths of OPCC beams [40,41,42,43].
Buildings 14 00204 g009
Figure 10. Comparison of experimental and analytical shear strengths of GPC beams [40,41,42,43].
Buildings 14 00204 g010
Figure 11. Prediction of shear strength based on ACI 318-19 [40] and proposed Equations. (a) Based on the shear strength equation in ACI 318-19 [40]; (b) Based on Proposed Equation (21) for a / d 2.0; (c) Based on Proposed Equation (22) for a / d > 2.0.
Buildings 14 00204 g011aBuildings 14 00204 g011b
Table 1. Chemical composition of fly ash.
SiO2 (%)Al2O3 (%)Fe2O3 (%)CaO (%)SO3 (%)MgO (%)LOI a (%)
59.9614.026.2914.122.840.410.445
a Loss on ignition.
Table 2. Test matrix.
Specimen IDGroupWidth b,
(mm)
Depth h,
(mm)
Effective Depth d,
(mm)
Length
(mm)
Shear Span a,
(mm)
a/d Ratio
OPCCB-1.6I150225190.57623061.6
GPCB-1.6-1
GPCB-1.6-2
OPCCB-2.9II150225190.512685592.9
GPCB-2.9-1
GPCB-2.9-2
OPCCB-4.3III150225190.517748124.3
GPCB-4.3-1
GPCB-4.3-2
Table 3. Mix proportions for 1m3 of OPCC and GPC.
Type of ConcreteCoarse Aggregate
(kg)
Fine Aggregate
(kg)
Fly Ash
(kg)
Cement
(kg)
Alkali Solution
(kg)
Na2SiO3 Solution
(kg)
Water
(L)
OPCC1215570-375--169
GPC1294345554-59.1147.819.4
Table 4. Test results.
Specimen ID28-Days
Concrete
Cylinder Strength f c ,
(MPa)
Shear Span to Effective Depth Ratio
a / d
Initial Diagonal Cracking Load P i ,
(kN)
Peak Applied Load P u ,
(kN)
Experimental Shear Strength V c ,
(kN)
OPCCB-1.624.71.6131.3234.8117.4
GPCB-1.6-122.0108.0168.084.0
GPCB-1.6-224.599.5194.097.0
OPCCB-2.925.22.969.093.046.5
GPCB-2.9-125.669.090.045.0
GPCB-2.9-225.161.082.041.0
OPCCB-4.325.34.321.572.036.0
GPCB-4.3-123.639.559.029.5
GPCB-4.3-225.929.460.130.0
Table 5. Capacity analysis of beams.
Specimen ID28-Days Concrete Cylinder Strength ρ
(%)
ρ b
(%)
ρ m a x
(%)
Analytical Peak Load
(kN)
Experimental Peak Applied Load
(kN)
Experimental Shear Strength
(kN)
OPCCB-1.624.71.982.521.60131.3234.8117.4
GPCB-1.6-122.01.982.241.43108.0168.084.0
GPCB-1.6-224.51.982.501.5999.5194.097.0
OPCCB-2.925.21.982.571.6469.093.046.5
GPCB-2.9-125.61.982.611.6669.090.045.0
GPCB-2.9-225.11.982.561.6361.082.041.0
OPCCB-4.325.31.982.581.6421.572.036.0
GPCB-4.3-123.61.982.411.5339.559.029.5
GPCB-4.3-225.91.982.641.6829.460.130.0
Table 6. Estimated shear strength as per ACI 318-14 [41], ACI 318-19 [40], JSCE 2007 [43], and fib 2010 [42].
Specimen IDExperimental Shear Strength
(kN)
Computed/Experimental Results
ACI 318-14 [41]ACI 318-19 [40]JSCE 2007 [43]Fib 2010 [42]
OPCCB-1.6117.4-0.2580.5080.184
GPCB-1.6-184.0-0.3410.6690.238
GPCB-1.6-297.0-0.3110.6090.220
OPCCB-2.946.50.5490.5790.4750.468
GPCB-2.9-145.00.5750.5980.4910.483
GPCB-2.9-241.00.6250.6540.5350.528
OPCCB-4.336.00.7080.7500.3030.604
GPCB-4.3-129.50.8340.8730.3600.706
GPCB-4.3-230.00.8640.9080.3730.731
Table 7. Comparison of analytical and experimental shear strengths of previous studies.
Research StudyConcrete
Type
Curing f c
(MPa)
a/dExperimental Shear Strength
(kN)
Computed/Experimental Results
ACI 318-14
[41]
ACI 318-19
[40]
JSCE 2007
[41]
fib 2010
[42]
Yacob et al. [15]GPCHeat37.22.0209.00.270.260.360.21
GPC2.0128.00.370.360.500.30
Visintin et al. [37]GPCAmbient21.02.079.00.370.320.460.30
Sinik and Arsalan [69]OPCAmbient24.82.584.90.300.280.280.25
Visintin et al. [37]GPCAmbient24.02.572.00.430.380.370.35
GPCAmbient33.02.582.40.440.390.380.36
GPCAmbient21.02.551.80.680.660.580.52
Visintin et al. [37]GPCAmbient24.03.065.80.470.410.290.38
GPCAmbient21.03.040.00.880.680.540.67
Lee et al. [76]GPCNA *55.33.0112.90.560.570.390.45
GPCNA *55.33.0118.60.530.600.410.43
OPCNA *55.33.0125.90.500.620.420.41
Sinik and Arsalan [69]OPCAmbient24.93.574.50.340.320.180.29
Visintin et al. [37]GPCAmbient21.03.531.10.940.820.440.76
GPCAmbient33.03.551.20.720.620.330.58
Tauqir et al. [12]GPCAmbient25.04.535.90.660.680.240.55
OPCAmbient22.04.538.00.590.610.210.49
Sinik and Arsalan [69]OPCAmbient21.44.566.20.360.330.120.30
Tauqir et al. [12]GPCAmbient31.05.039.50.660.690.200.56
OPCAmbient21.45.028.70.770.800.230.65
Sinik and Arsalan [69]OPCAmbient23.86.055.60.450.420.080.38
* Not available.
Disclaimer/Publisher’s Note: The statements, opinions and data contained in all publications are solely those of the individual author(s) and contributor(s) and not of MDPI and/or the editor(s). MDPI and/or the editor(s) disclaim responsibility for any injury to people or property resulting from any ideas, methods, instructions or products referred to in the content.

